3. Results and Discussion
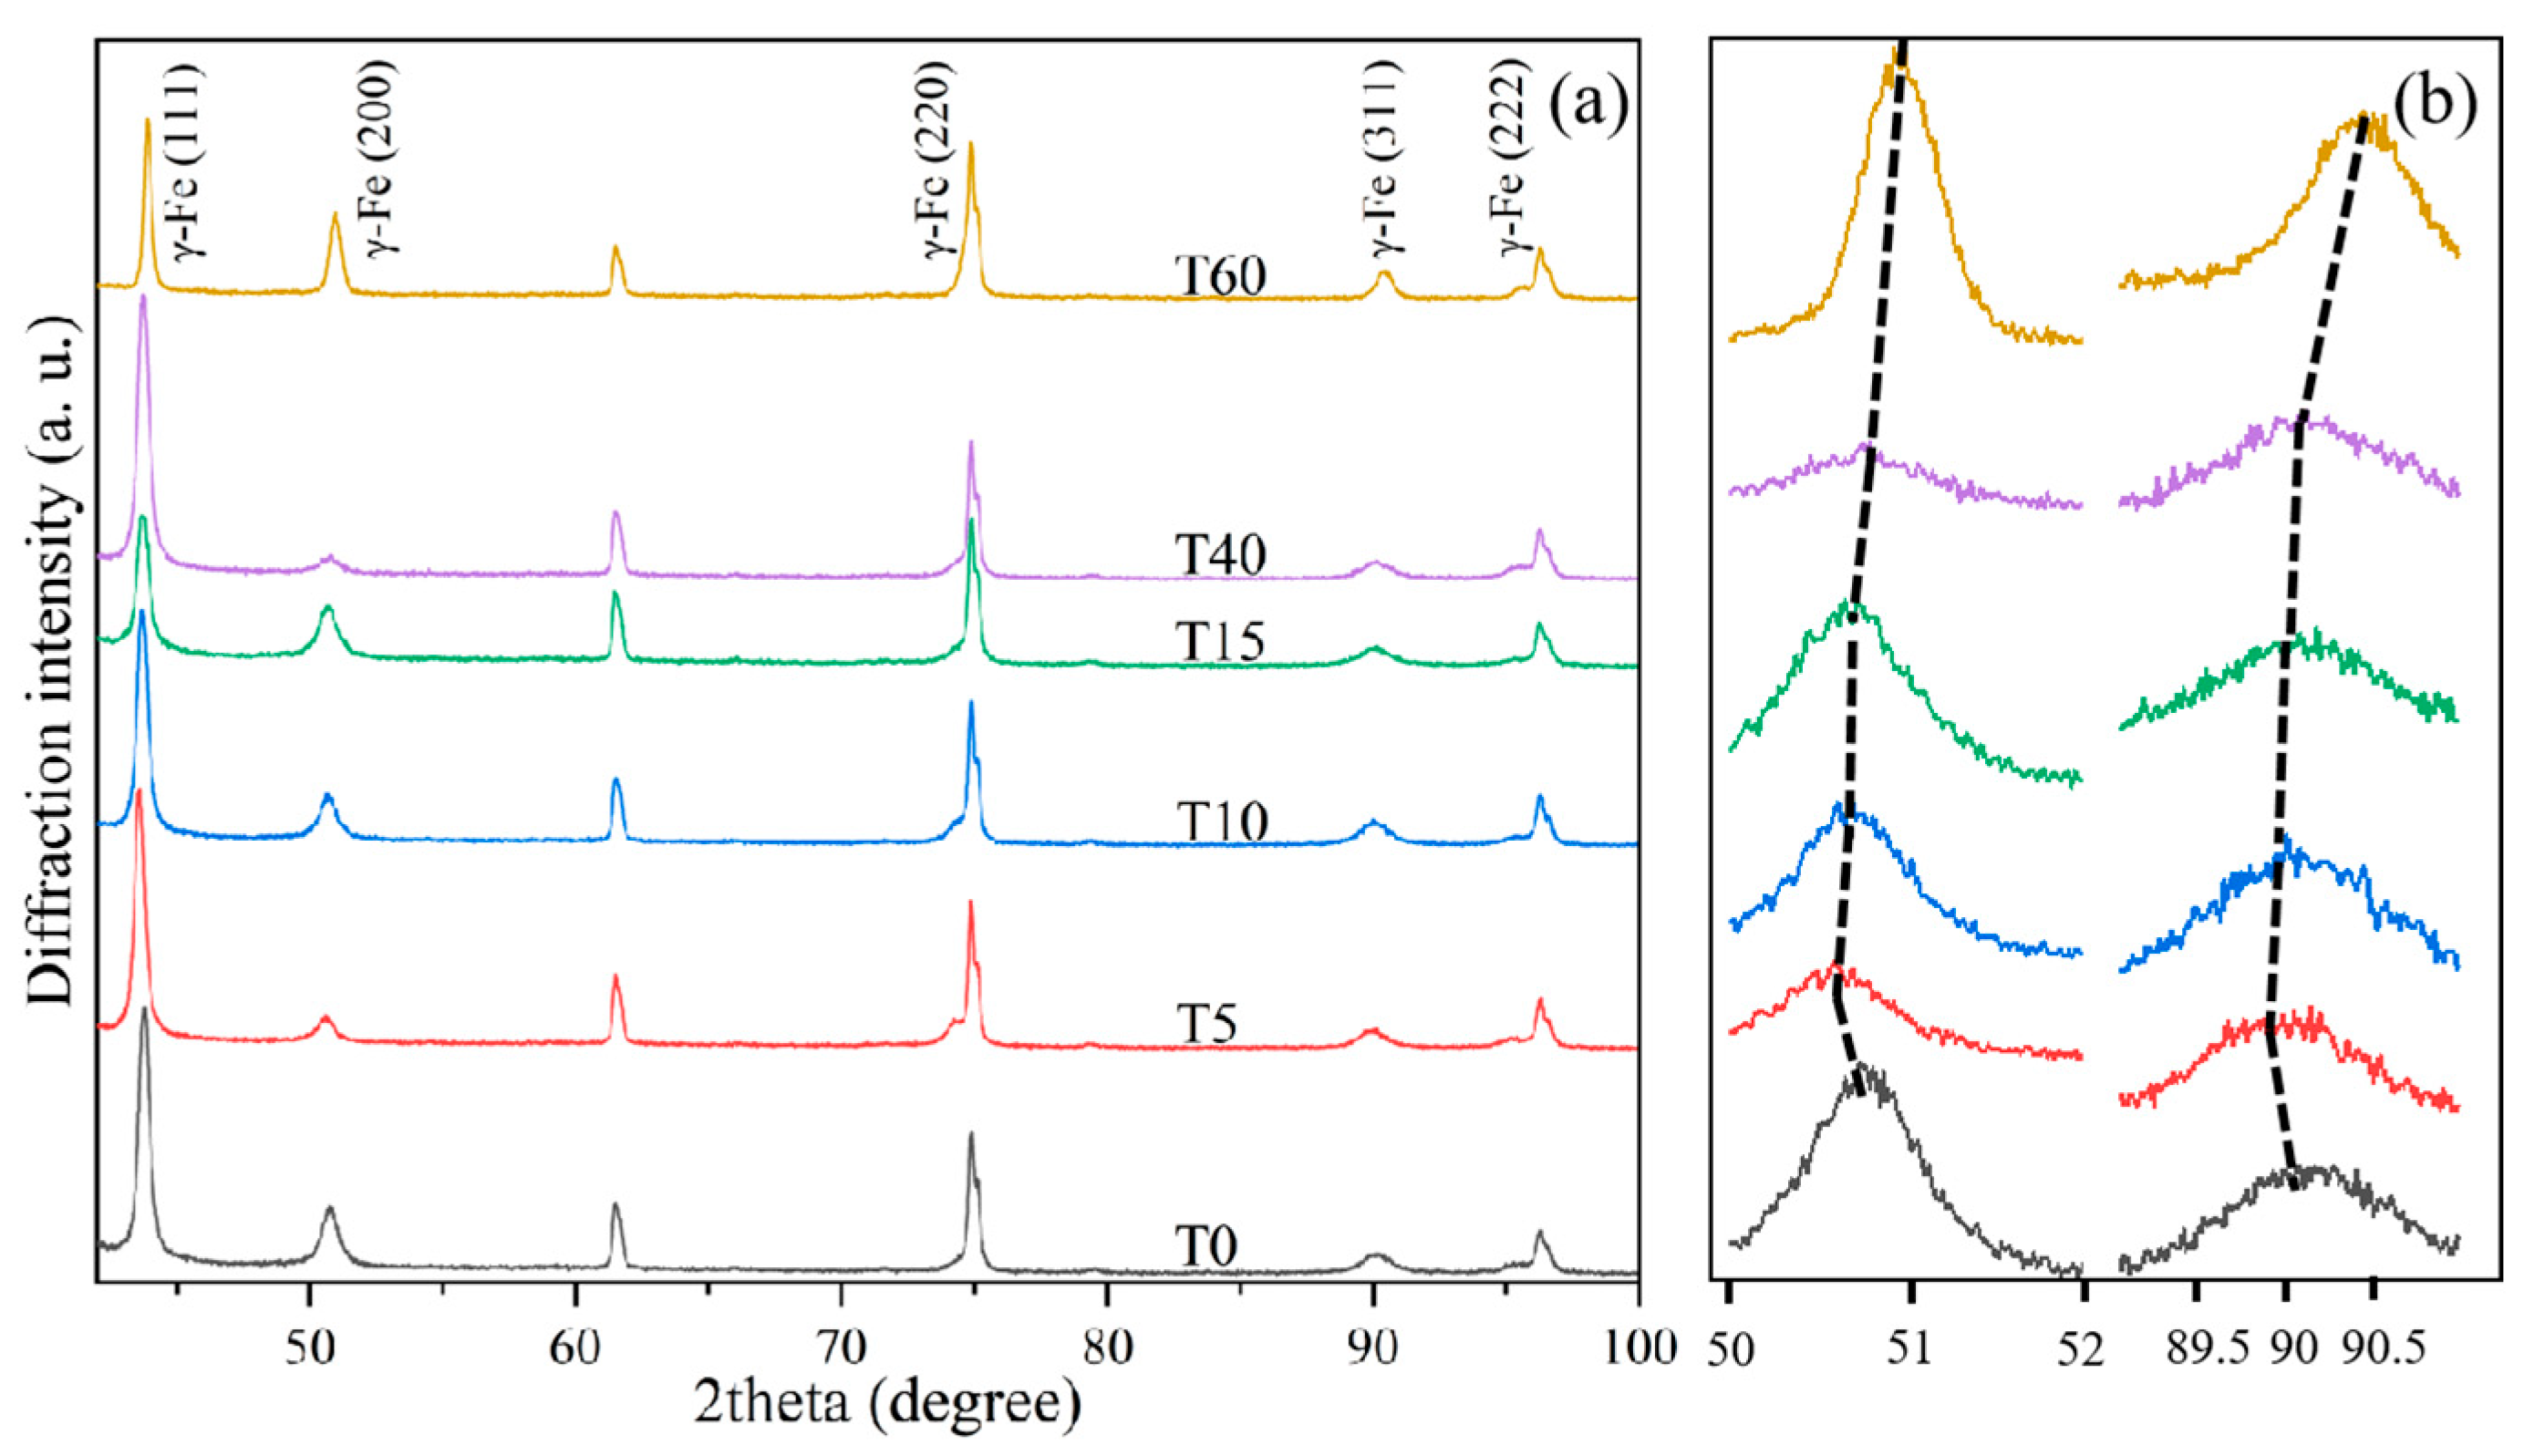
Figure 1 shows the XRD patterns of the heat-treated (T0) and shot-blasted samples. Six distinct diffraction peaks were observed at 2θ values of 43.7°, 50.8°, 61.5°, 74.9°, 90.2°, and 96.3°. Apart from a systematic shift, the positions of these peaks remained largely unchanged across the different samples. By comparing these patterns with the standard diffraction data (JCPDS No. 31-0619), five of the peaks were indexed to different crystal planes of austenite, as labeled in
Figure 1a. However, the phase corresponding to the diffraction peak at 61.5° could not be identified. It is speculated that this phenomenon may be attributed to intermetallic compounds formed by elemental segregation during the ingot smelting process. As shown in
Figure 1b, with increasing shot blasting time, all diffraction peaks of the shot-blasted samples shift significantly toward higher angles. This shift indicates a continuous increase in plastic deformation and the associated development of residual compressive stress [
4,
24]. Meanwhile, no new diffraction peaks were observed in the patterns of the shot-blasted samples compared to the heat-treated sample (T0), suggesting that no martensite, carbides, or other new phases formed during the process.
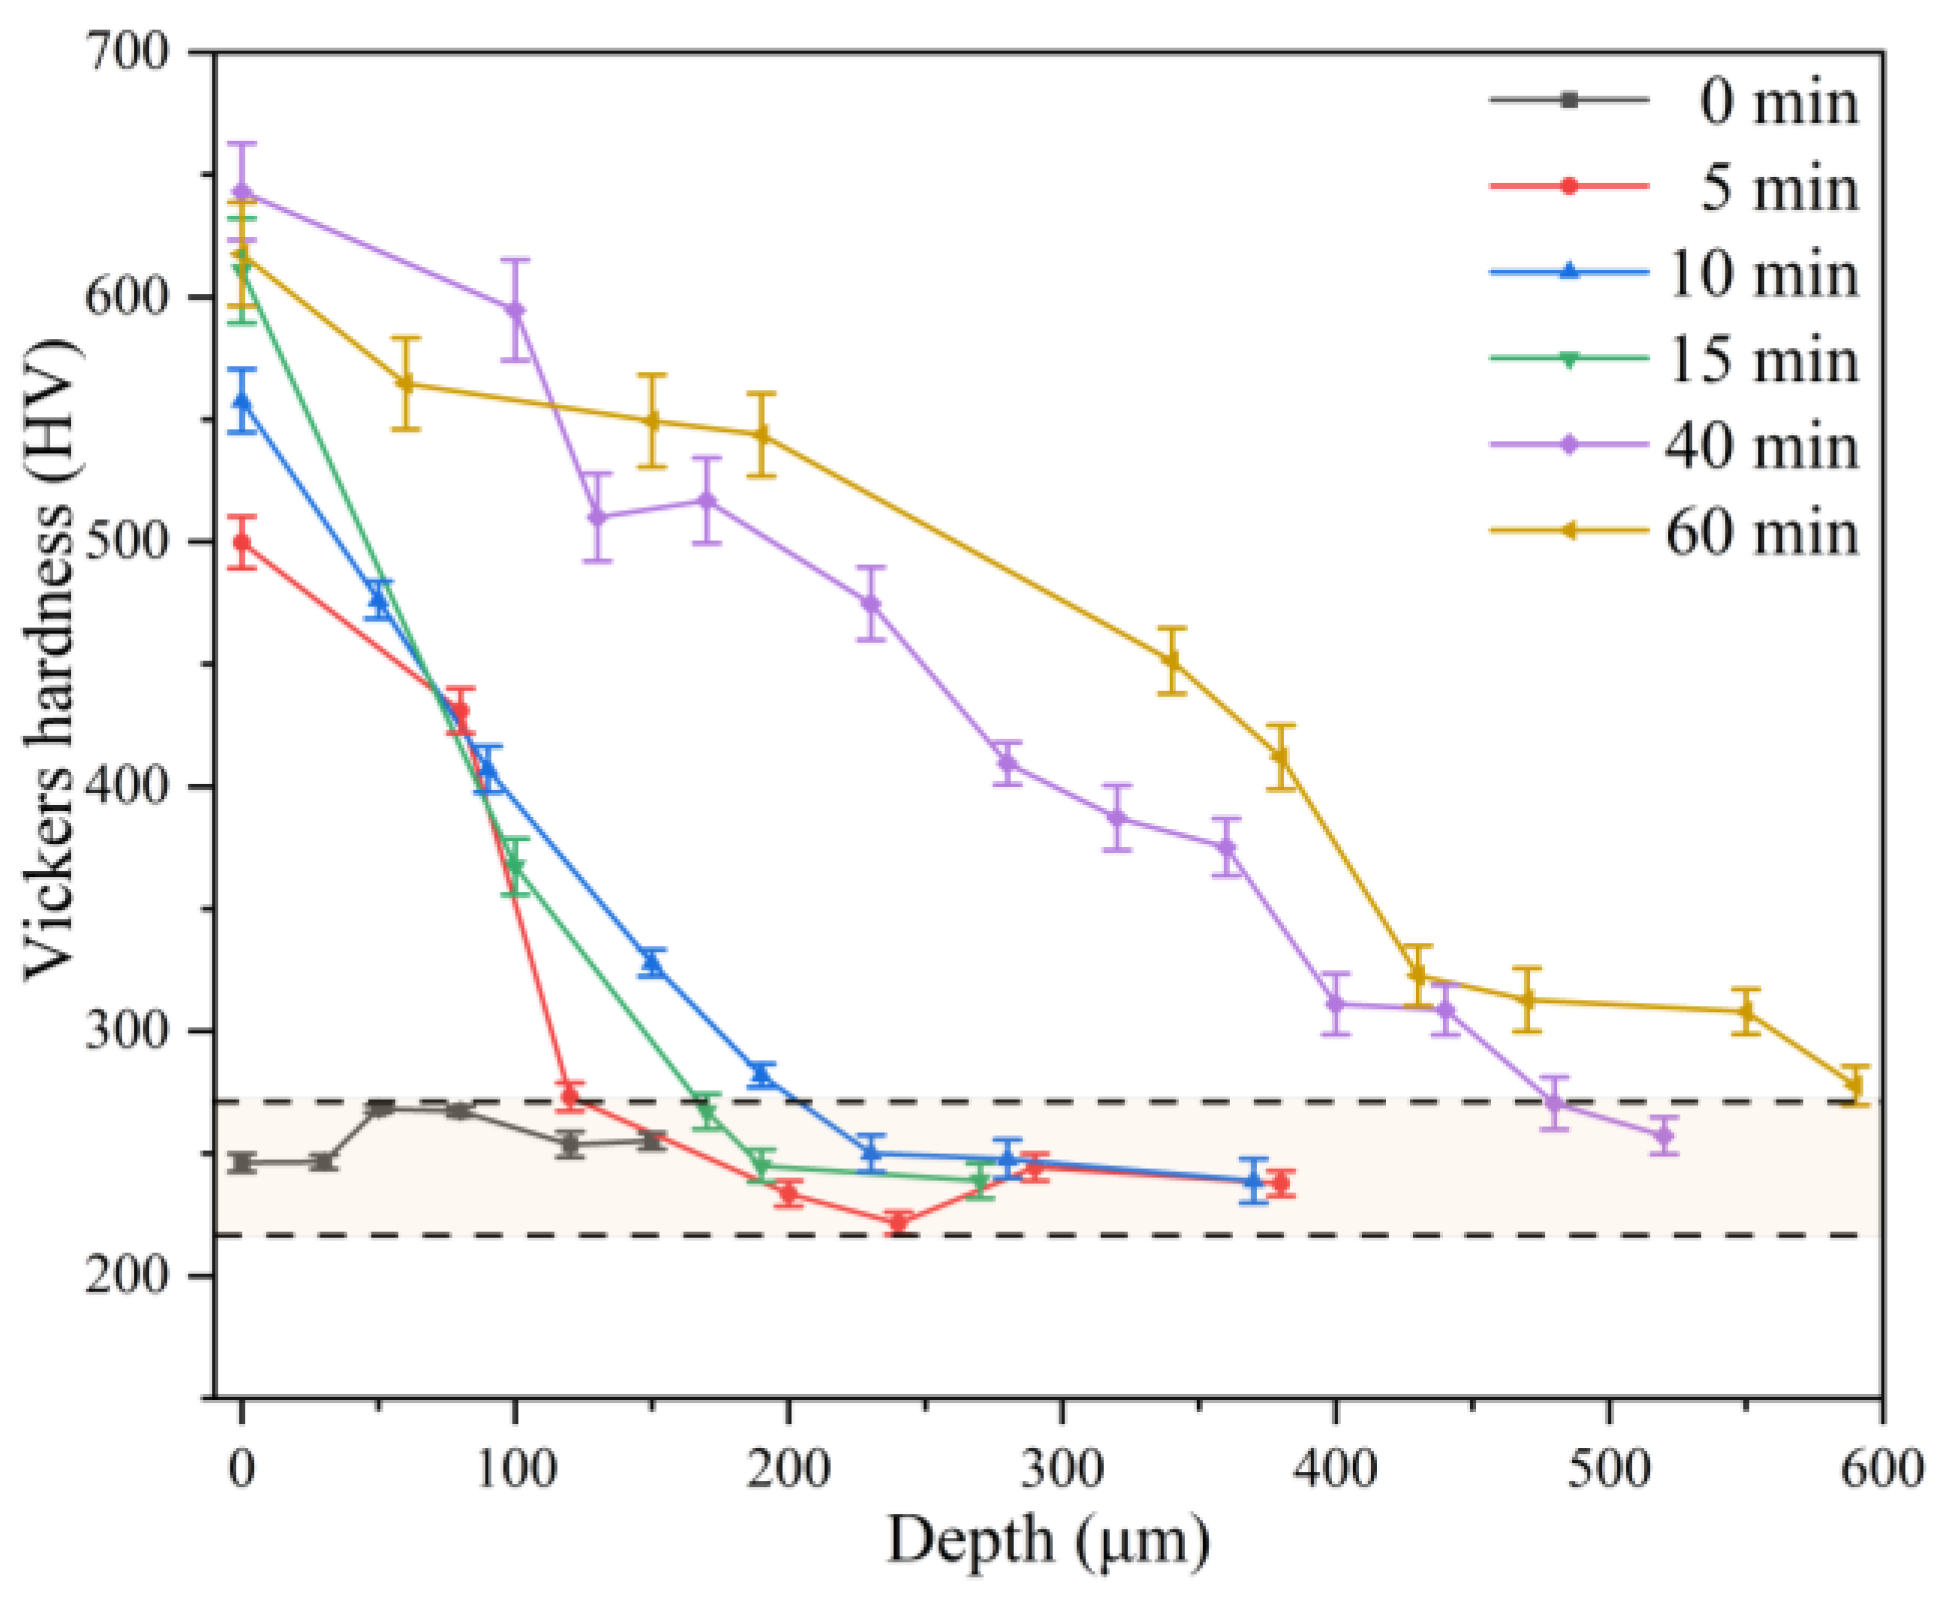
Figure 2 presents the variation in hardness with depth for the prepared samples under different shot blasting durations. The heat-treated sample (T0) exhibited a uniform near-surface hardness, ranging from 221 HV to 267 HV. Shot blasting significantly increased the surface hardness, which rose from 500 HV to 643 HV as the processing time increased from 5 to 40 min. This maximum value of 643 HV approaches the highest hardness achievable in high-manganese steel through surface impact hardening, as reported in the literature [
4]. However, extending the shot blasting time to 60 min resulted in a slight decrease in surface hardness. For all shot-blasted samples, the hardness gradually decreased with increasing distance from the surface, eventually converging to the level of the heat-treated sample. The hardened layer thickness, defined as the depth where the hardness matches that of the heat-treated sample, was measured to be 120, 200, 170, 480, and 600 μm for the 5, 10, 15, 40, and 60 min samples, respectively. Notably, the hardness gradient became progressively milder with longer shot blasting times. In summary, the results confirm that shot blasting successfully introduced a work-hardened layer on the high-manganese steel surface, with the layer depth increasing with processing time. The formation of this hardened layer is crucial for enhancing the materials’ wear resistance.
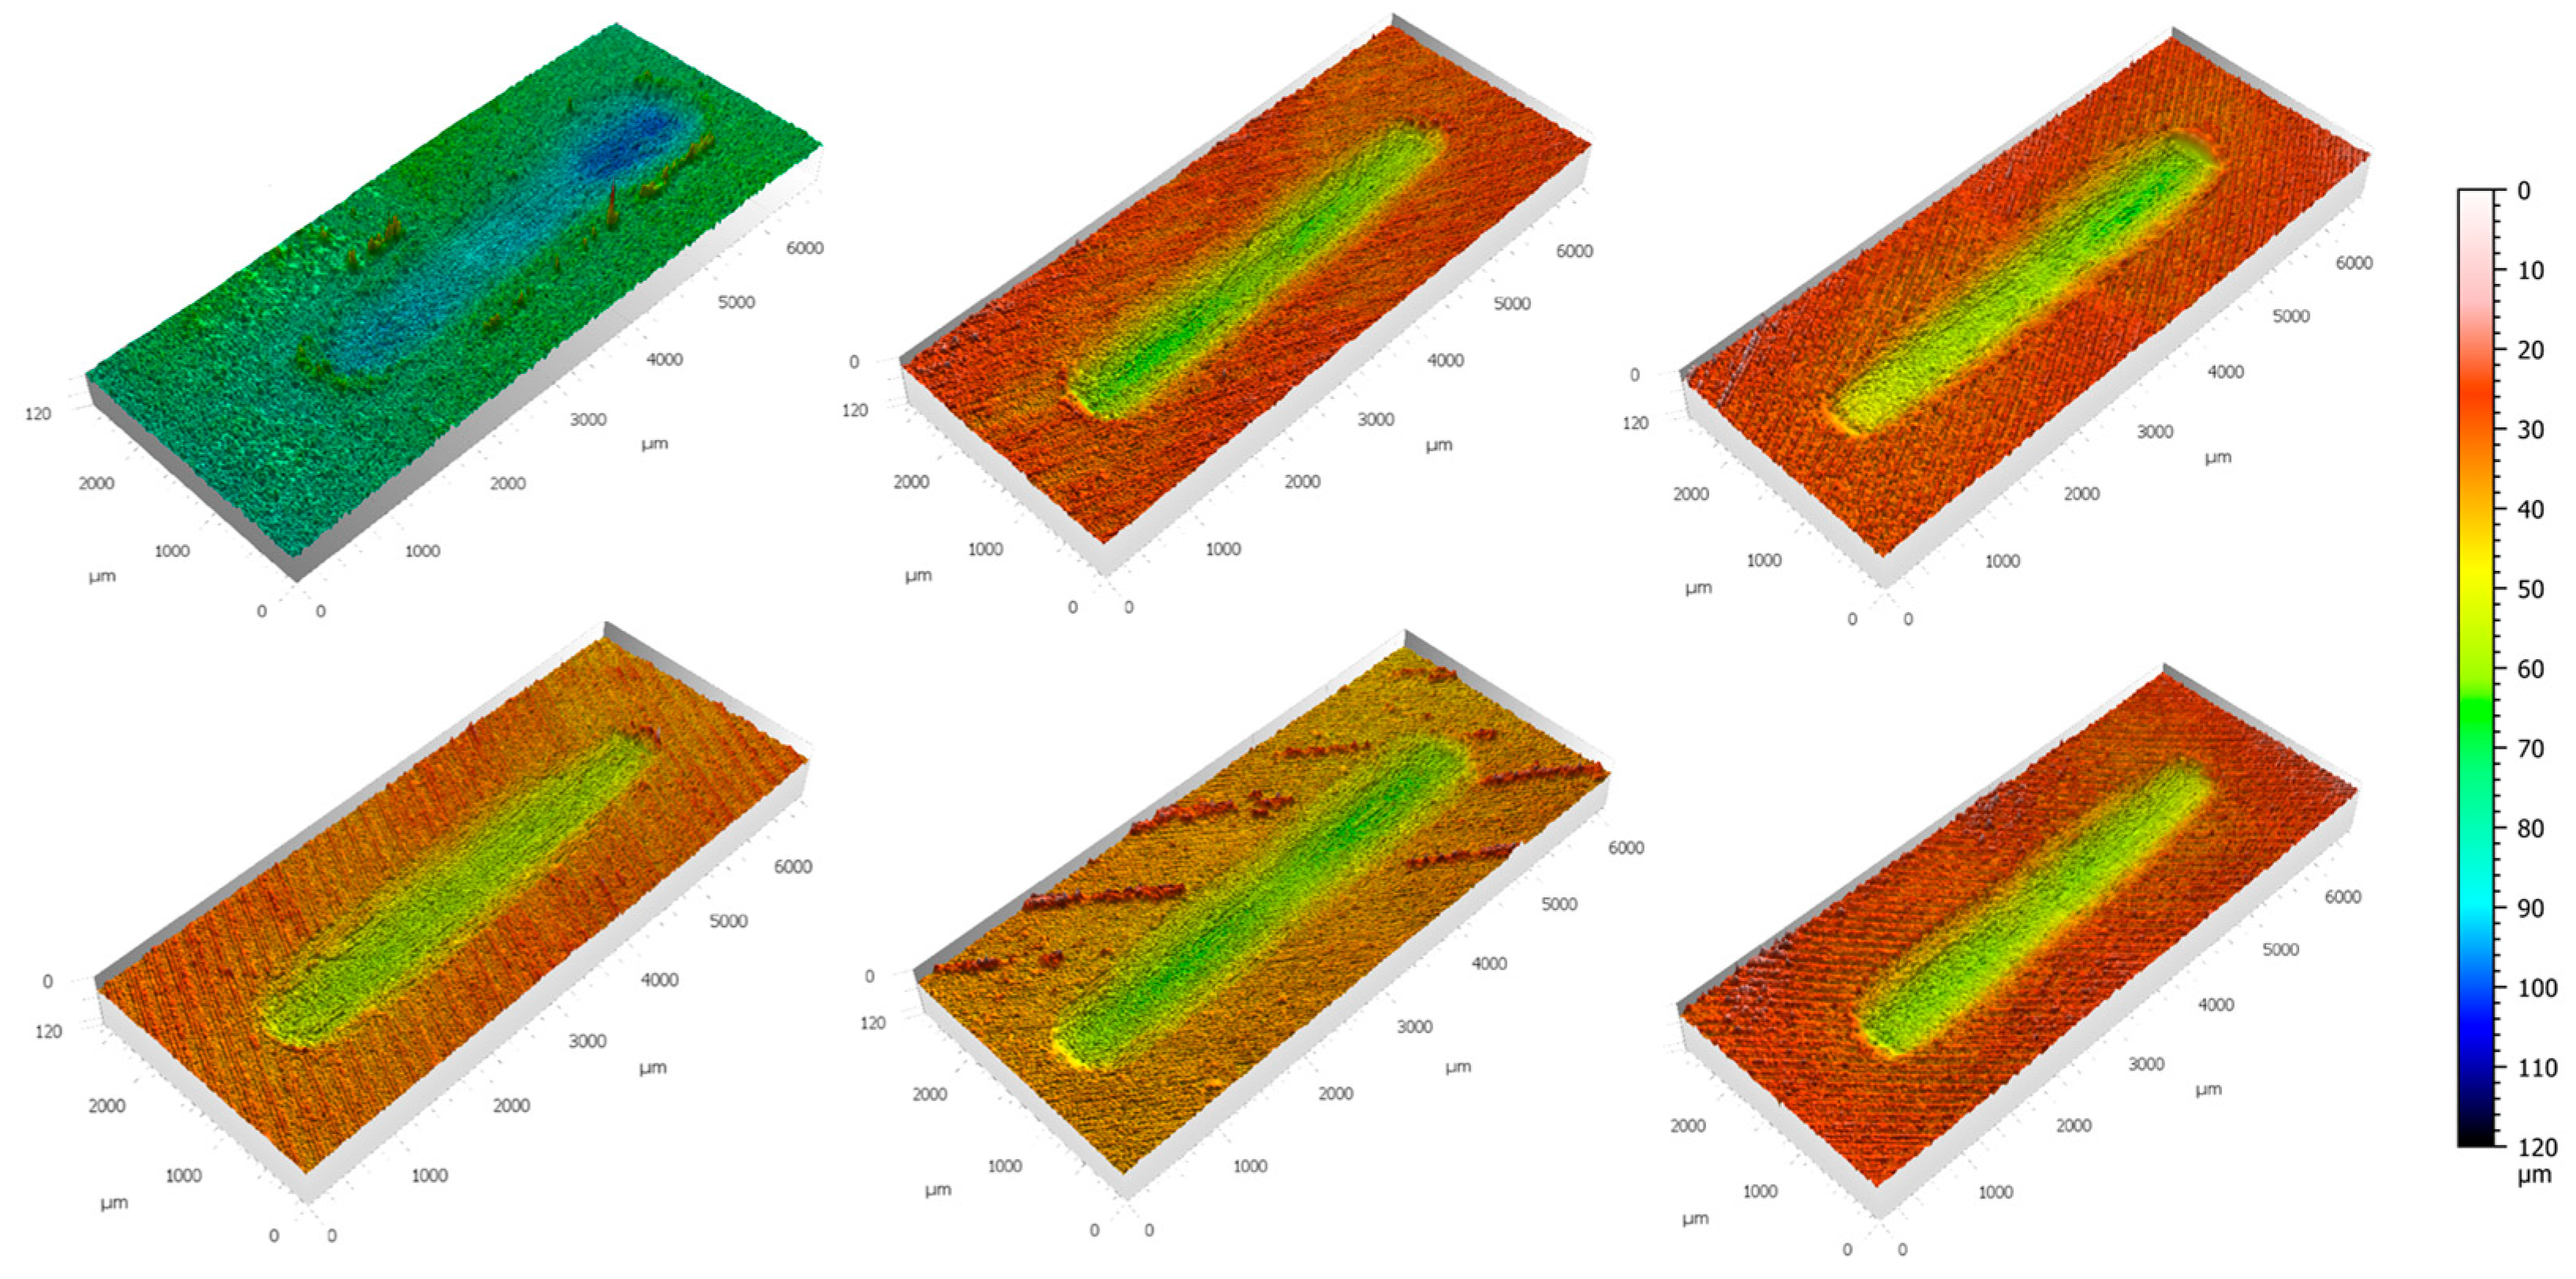
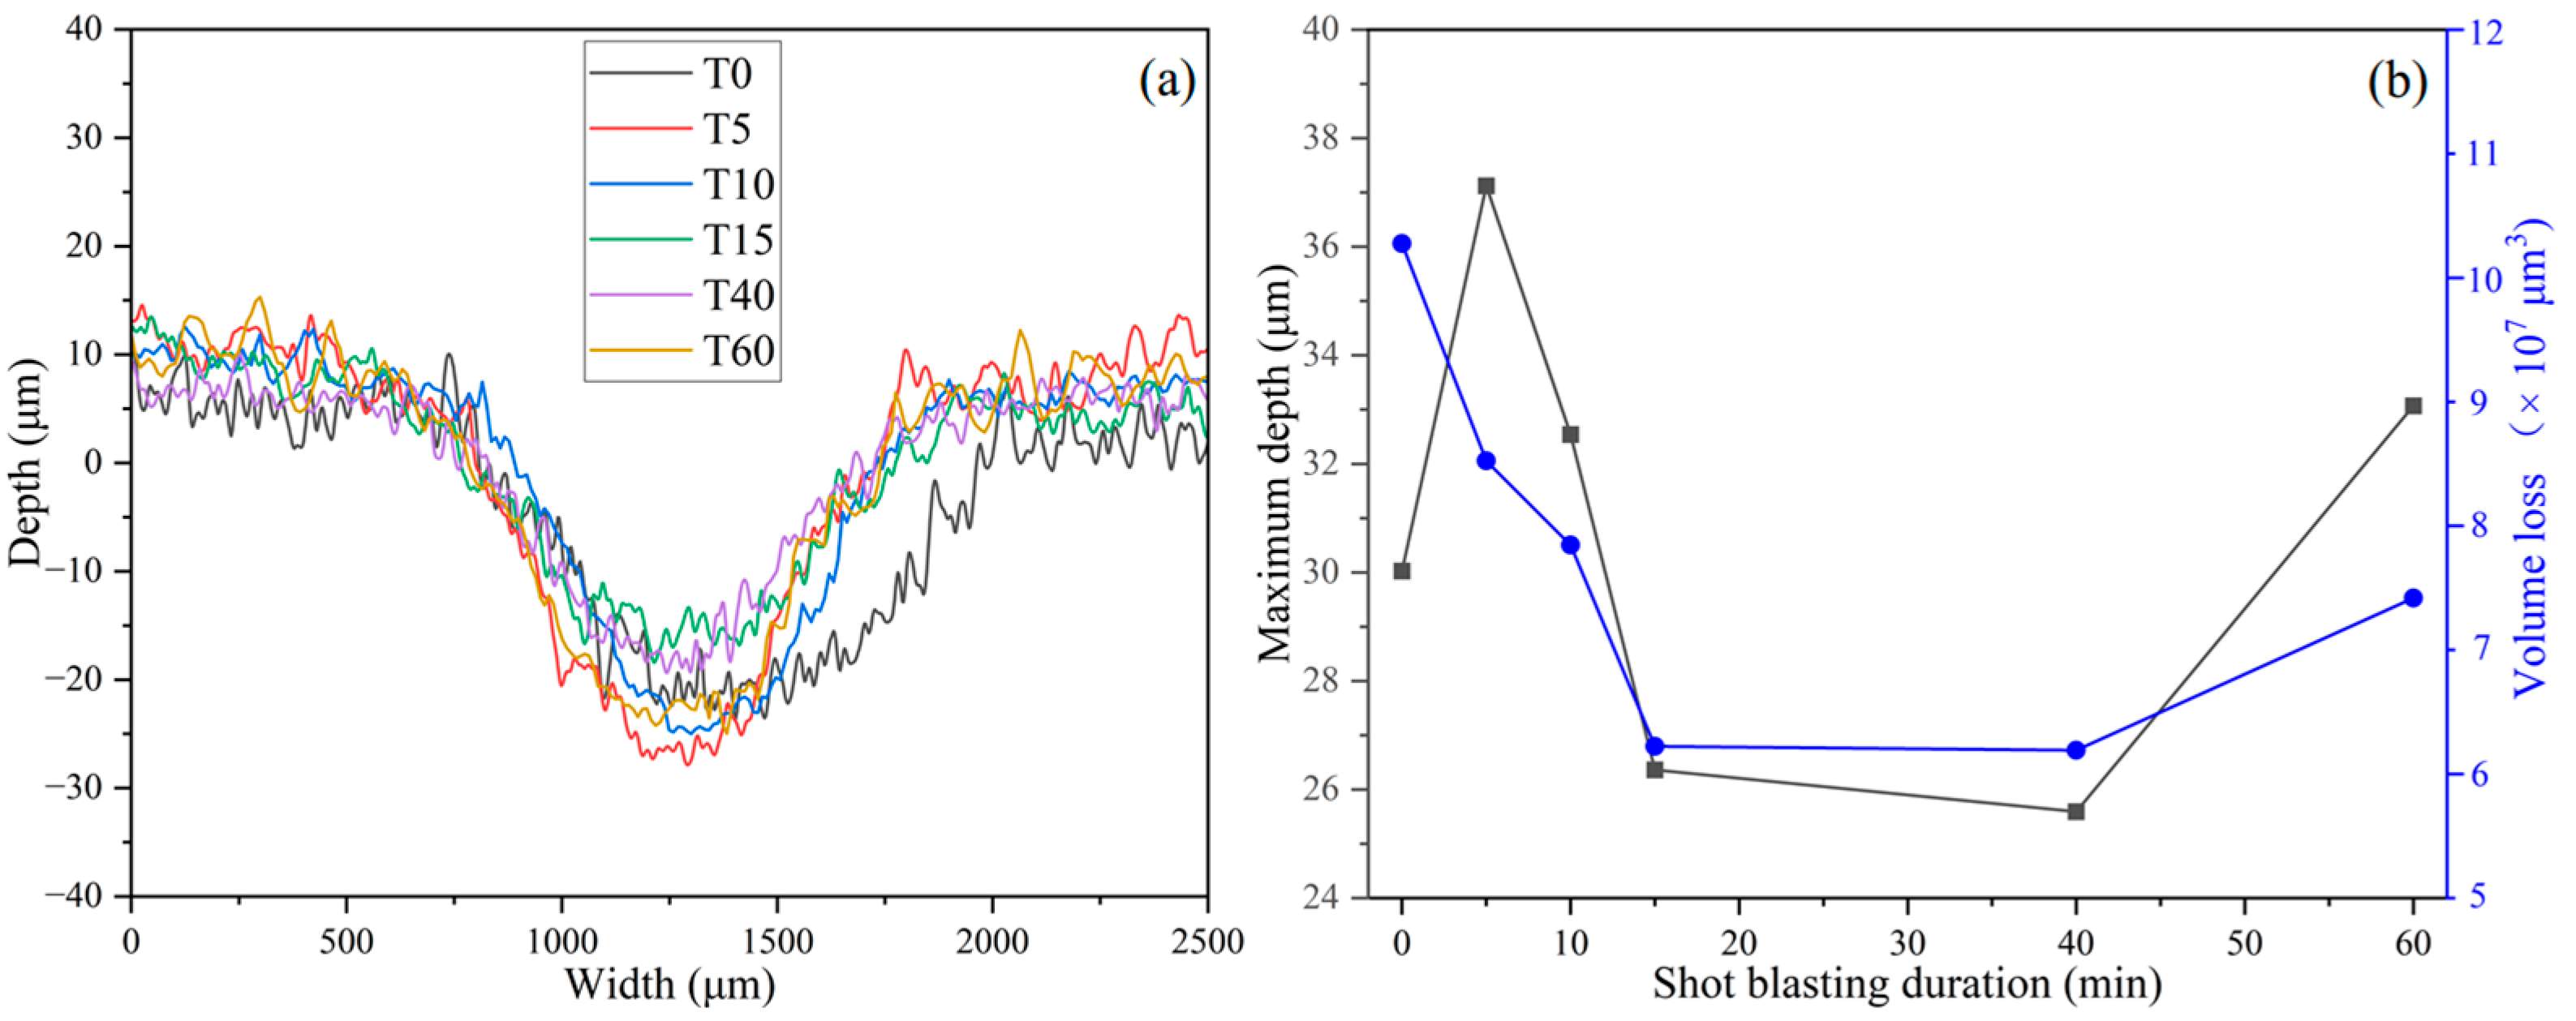
Figure 3 presents the 3D overall morphology of the wear scars on all tested specimens. It can be clearly seen that the wear scar width of the heat-treated sample (T0) is significantly larger than that of the shot-blasted samples. This is because after shot blasting, the surface hardness of the samples increases rapidly, which makes plastic deformation of the material surface difficult and prevents the counterpart ball from easily indenting the material surface. However, quantitative parameters such as wear depth cannot be directly obtained from these raw morphological images. For a quantitative comparison, the 3D morphology data were leveled using the unworn region of each sample as a reference plane. A comparative analysis of the processed wear scars is provided in
Figure 4.
Figure 4a illustrates the wear profiles of the tested samples. It can be observed that the heat-treated sample (T0) does not exhibit the greatest wear depth, but the width of its wear scar is significantly larger than that of the shot-blasted samples. This result is consistent with that in
Figure 3. For the shot-blasted samples, the maximum depth decreased gradually with the extension of shot blasting time, reached the minimum value when the shot blasting time was 40 min, and then increased instead. The quantitative relationship between wear parameters and shot blasting duration is plotted in
Figure 4b. The maximum wear scar depth and volume loss (i.e., mass loss) show an almost identical trend, except for the maximum wear scar depth of the heat-treated sample. Although the heat-treated sample does not have the maximum depth, it has the largest volume loss, which is due to its wider wear scar width. However, after shot blasting, the surface hardness of the material increases significantly, and the volume loss decreases gradually with the extension of shot blasting time. When the shot blasting time was 40 min, the volume loss reached the minimum and then increased instead. Therefore, the sample exhibits the optimal wear resistance when the shot blasting time is 40 min.
Figure 5 presents the evolution of the coefficient of friction (COF) for the test samples, which can be divided into three distinct stages. In the first stage, immediately after the test initiation, the COF of all samples increased rapidly with the number of cycles. In the second stage, the COF of the heat-treated sample (T0) increased rapidly to above 0.8 and fluctuated between 0.8 and 0.9. On the other hand, the COFs of the shot-blasted samples increased gradually, with all values remaining between 0.5 and 0.65. In the third stage, the COF of the T0 sample stabilized with slight fluctuations around 0.85. In contrast, the COF curves of the shot-blasted samples began to diverge: the T40 sample’s COF decreased and stabilized around 0.61, while the COFs of the other shot-blasted samples increased and exhibited larger fluctuations within the range of 0.65–0.75. Notably, after entering the stable stage, the COF of the heat-treated samples was significantly higher than that of the shot-blasted samples. This indicates that shot blasting has a significant impact on the surface state of the samples. This influence is attributed to the higher surface hardness of the shot-blasted samples, which suppresses excessive plastic deformation at the contact interface, and their lower surface roughness, which reduces frictional resistance.
Figure 6 presents the SEM images of the wear scars after friction testing. The worn surface of sample T0 (
Figure 6a) is covered with light-colored irregular particles or patches. These features are likely wear products, such as debris from material detachment and transfer, or oxides formed by frictional heating. This morphology suggests that local adhesion and subsequent separation occurred during sliding. The presence of slight abrasive wear is also evident. Therefore, the primary wear mechanism for T0 is inferred to be adhesive wear, accompanied by minor abrasive and fatigue wear. In contrast, samples T5, T10, T15, and T60 exhibit regular rectangular (or nearly rectangular) wear marks. Their worn surfaces were relatively smooth, with only fine scratches and a small amount of wear debris, indicating that abrasive wear is the dominant mechanism with minimal adhesion. This shift from adhesive to abrasive wear as the dominant mechanism demonstrates how shot blasting modifies the wear behavior of high-manganese steel. The enhanced surface hardness from shot blasting makes plastic deformation of surface asperities more difficult, leading to a pronounced “plowing effect” during abrasion. This effect, combined with strong interatomic adhesion, accounts for the COF values observed in
Figure 5. Sample T40 shows a different morphology, with a significant amount of secondary debris distributed across the worn surface. This debris likely consists of hard particles that detached under high friction-induced temperature. Consequently, the wear mechanism for sample T40 is a composite of adhesive and abrasive wear. Notably, achieving such low wear loss and a low COF represents a highly desirable wear-resistant state for high-manganese steel in practical applications.
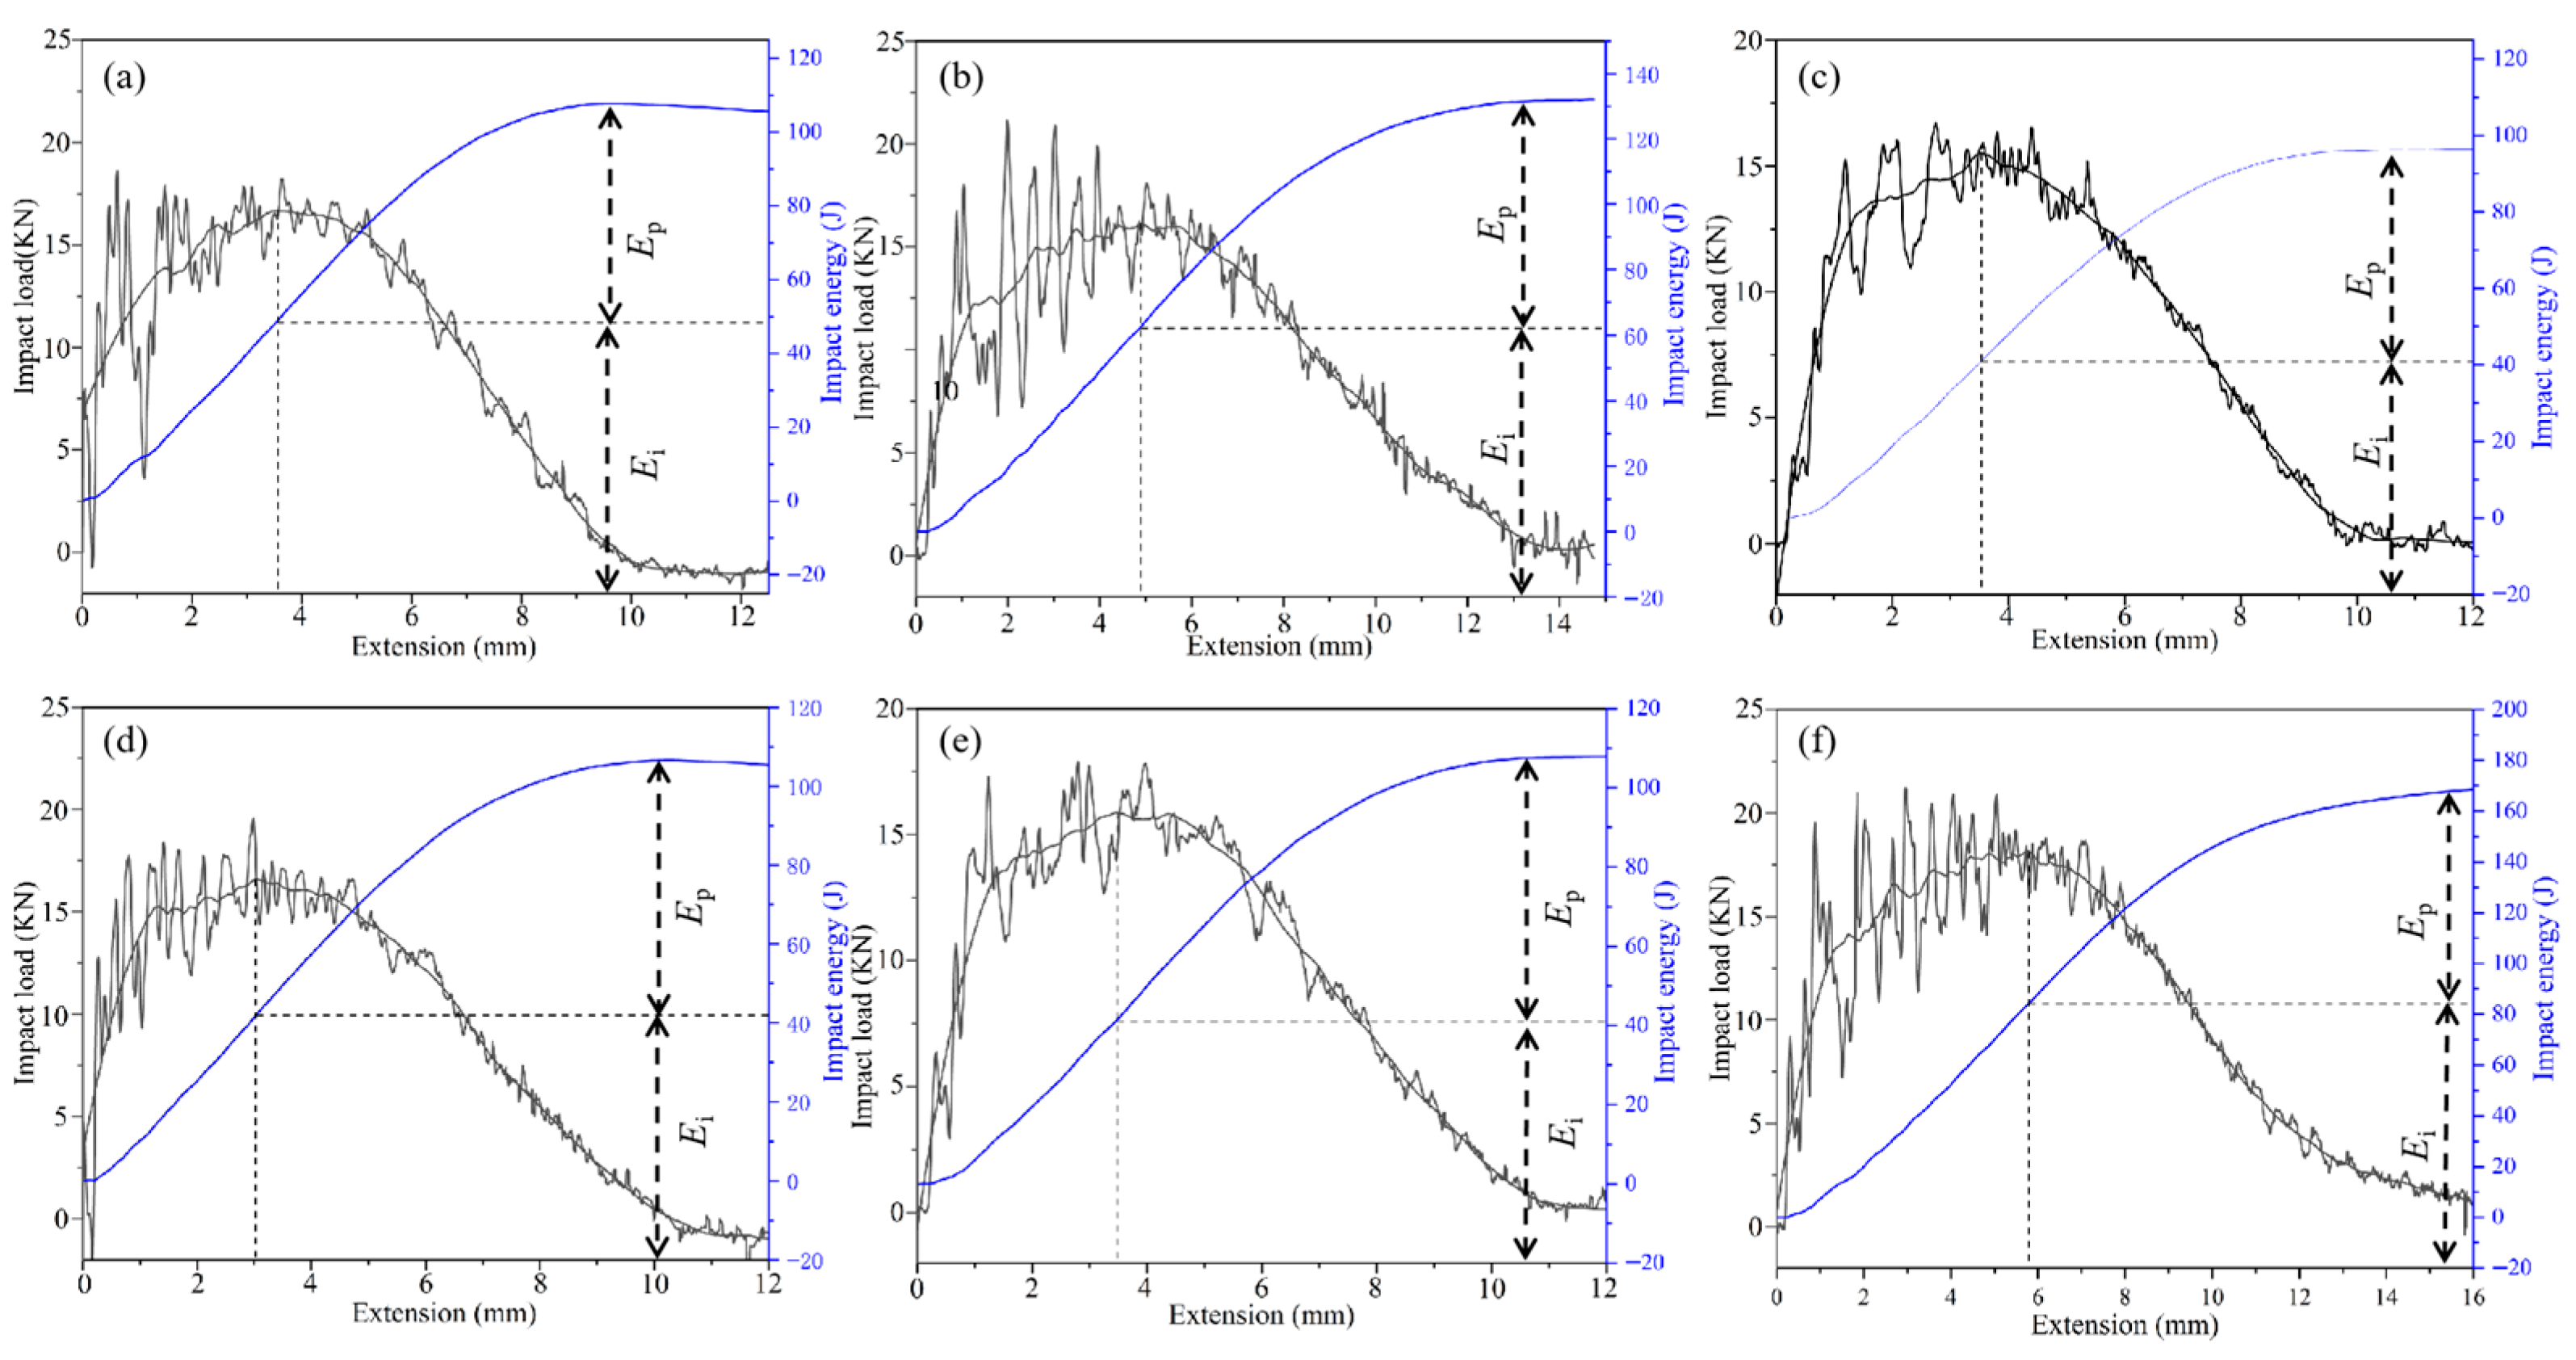
Figure 7 presents the instrumented impact force–displacement curves for all tested samples. For sample T0, the impact load increases rapidly in the initial elastic stage (displacement < 2 mm), while the energy growth rate remains slow―this slow energy accumulation indicates low elastic energy storage capacity of the sample. In the middle deformation stage (displacement: 2–6 mm), a prolonged load plateau is observed. This phenomenon is attributed to the multiplication and mutual interaction of dislocations within the austenite grains, which induces significant work hardening; the work-hardening effect counteracts the softening caused by plastic deformation, thereby maintaining the load at a relatively stable level. This stage exhibits the maximum slope of the energy-displacement curve, signifying rapid energy absorption. The high-manganese steel converts impact energy into energy dissipated through dislocation motion and grain deformation. In the final failure stage (displacement > 6 mm), the impact load drops steeply due to rapid macroscopic crack propagation. The high toughness leads to a tortuous crack path (a mix of transgranular and intergranular propagation). Once the accumulated damage reaches a critical threshold, the load-bearing capacity decreases sharply. Although the energy growth rate slows down in this stage, the total absorbed energy continues to increase with displacement―this trend reflects the “tortuous path energy consumption” mechanism during crack propagation, thereby demonstrating the excellent fracture toughness of the material. The crack initiation energy (Ei) and crack propagation energy (Ep) of Sample T0 were calculated to be 49 J and 59 J, respectively.
The impact curve of sample T5 exhibits larger load fluctuation and more pronounced high-frequency oscillations in the elastic stage. This behavior is likely attributable to the residual compressive stress and surface micro-damage induced by shot blasting, which lead to complex internal stress redistribution and local stress concentrations upon loading. In the plastic deformation stage, the load plateau is shorter and displays larger oscillations, resulting from the non-uniform surface hardening caused by shot blasting. This heterogeneity induces regional variations in deformation and hardening rates, thereby compromising the stability of the overall load-bearing capacity. From an energy perspective, both the crack initiation energy (Ei) and propagation energy (Ep) of sample T5 increase significantly to 62 J and 68 J, respectively, compared to the T0 reference sample. This indicates that a 5 min shot blasting enhances the material’s energy absorption capacity, impeding rapid crack propagation. This toughening effect is likely due to the synergistic influence of surface residual compressive stress and work hardening. However, as the shot blasting duration was extended to 10, 15, and 40 min, both Ei and Ep decreased, falling below the values of sample T0. With a further increase to 60 min, Ei and Ep recovered to 84 J and 85 J, respectively. This non-monotonic trend in crack initiation and propagation energy is attributed to the competing effects of residual compressive stress, work hardening, and surface damage. Moderate shot blasting (e.g., 5 min) introduces beneficial residual stress and hardening, whereas prolonged processing (10–40 min) can introduce microcracks and induce stress relaxation, thereby degrading crack resistance. With an even longer duration, the deepening of the compressive stress layer may again become the dominant factor, leading to a recovery in toughness.
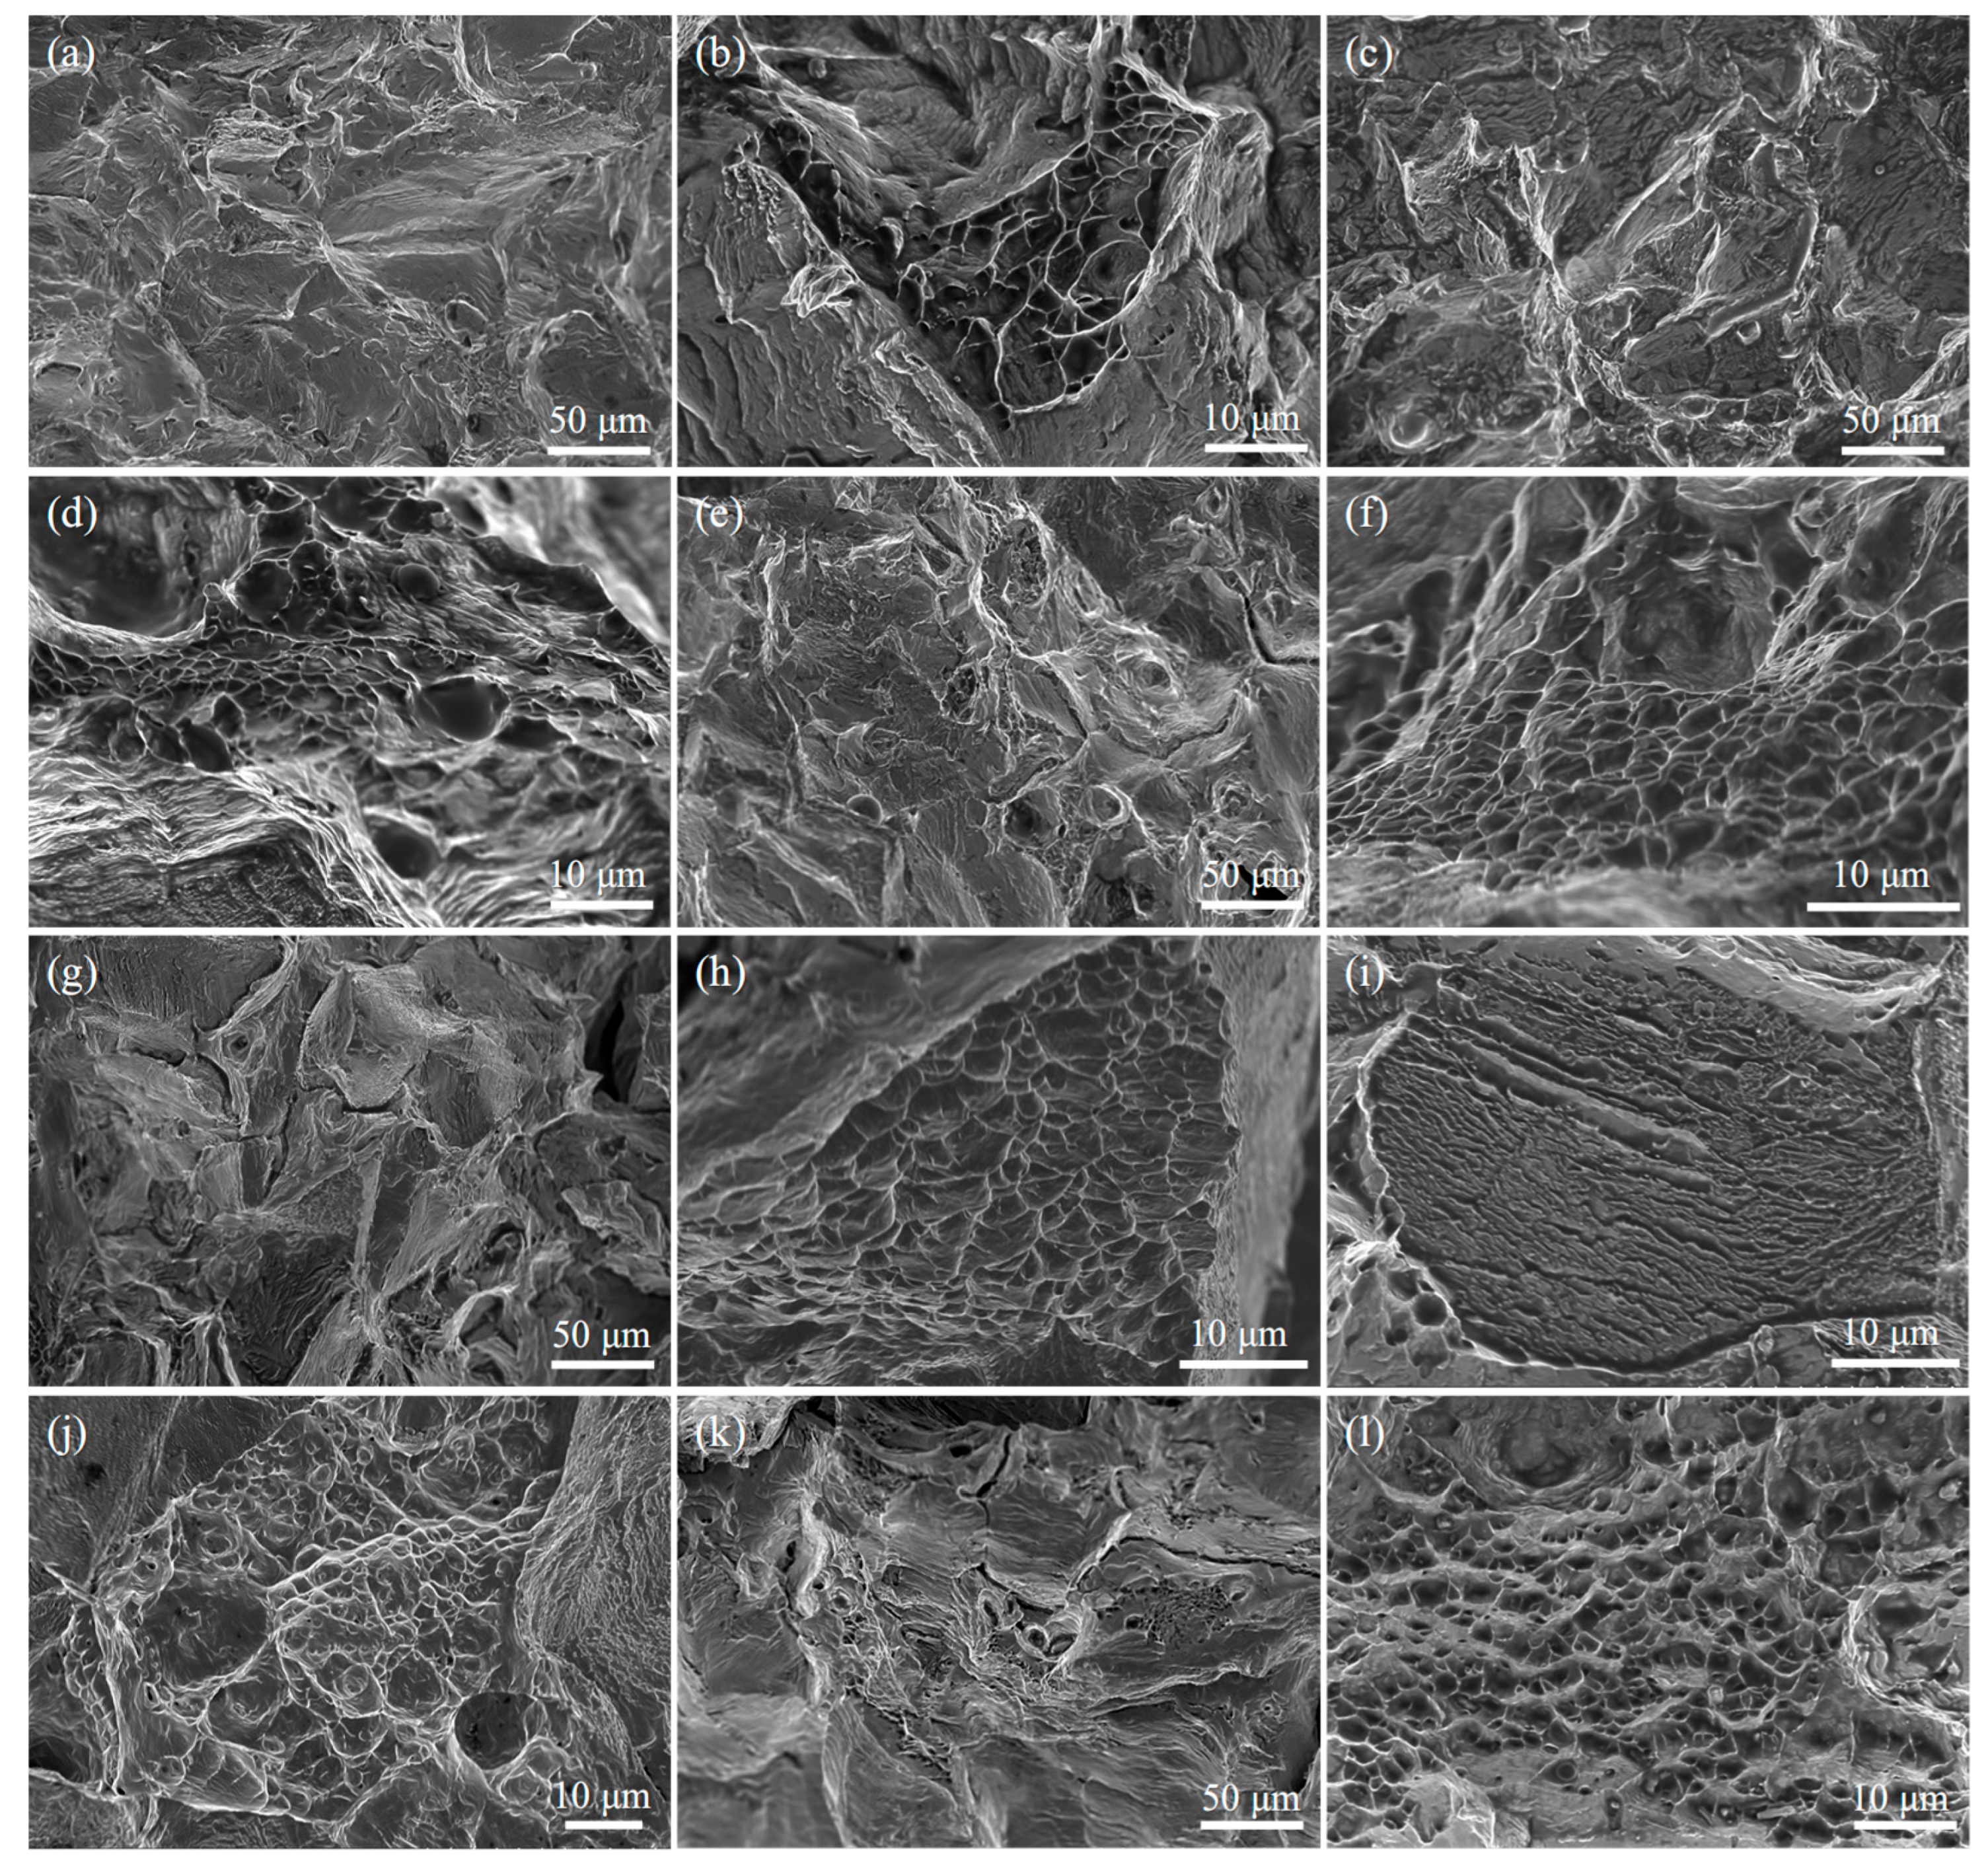
Figure 8 presents SEM images of the impact fracture surfaces. As shown in
Figure 8a,b, the fracture surface of the T0 sample is characterized by numerous tear ridges and river patterns. Clusters of equiaxed dimples, with thin, continuous walls, are densely distributed in localized areas, indicating typical ductile fracture in these micro-regions. No obvious inclusions are observed within the dimples. Overall, the fracture mechanism is characterized as a mixed mode of ductile and quasi-cleavage fracture.
Figure 8c,d display the fracture surface of sample T5, where surface indentations from shot blasting are visible. Although the shot-blasted plastic deformation layer increases the apparent roughness of the fracture surface, the fundamental fracture mechanism remains largely unaltered, as evidenced by the persistence of tear ridges and microvoid coalescence. Specifically, the localized dimple clusters retain a well-defined morphology comparable in size and distribution to those in T0 (
Figure 8d), with only subtle shot blasting imprints inside them. This confirms that the microvoid-coalescence-dominated ductile fracture mechanism was not substantially changed. The inherent toughness of the austenitic matrix, imparted by the water-toughening treatment, therefore remains the dominant governing fracture behavior despite the surface modification.
As the shot blasting time increased, the associated deformation features on the fracture surface became progressively more pronounced. After 15 min of processing (
Figure 8g), localized regions exhibited a tendency for microcracking, attributable to mechanical overloading from the shot blasting. This was accompanied by a distinct distortion of dimple clusters, characterized by the thinned walls and the partial collapse of dimples into irregular, fragmented shapes. When the shot blasting duration was extended to 60 min (T60 sample), the fracture surface was predominantly characterized by distinct brittle fracture features. It exhibited numerous irregular tear ridges and minor crack propagation paths, alongside localized traces of ductile tearing (
Figure 8k). Although some dimple-like structures persisted, they were highly heterogeneous in both size and shape. Widespread collapse and distortion of dimples were observed, with some regions being nearly devoid of these characteristic ductile features (
Figure 8l).
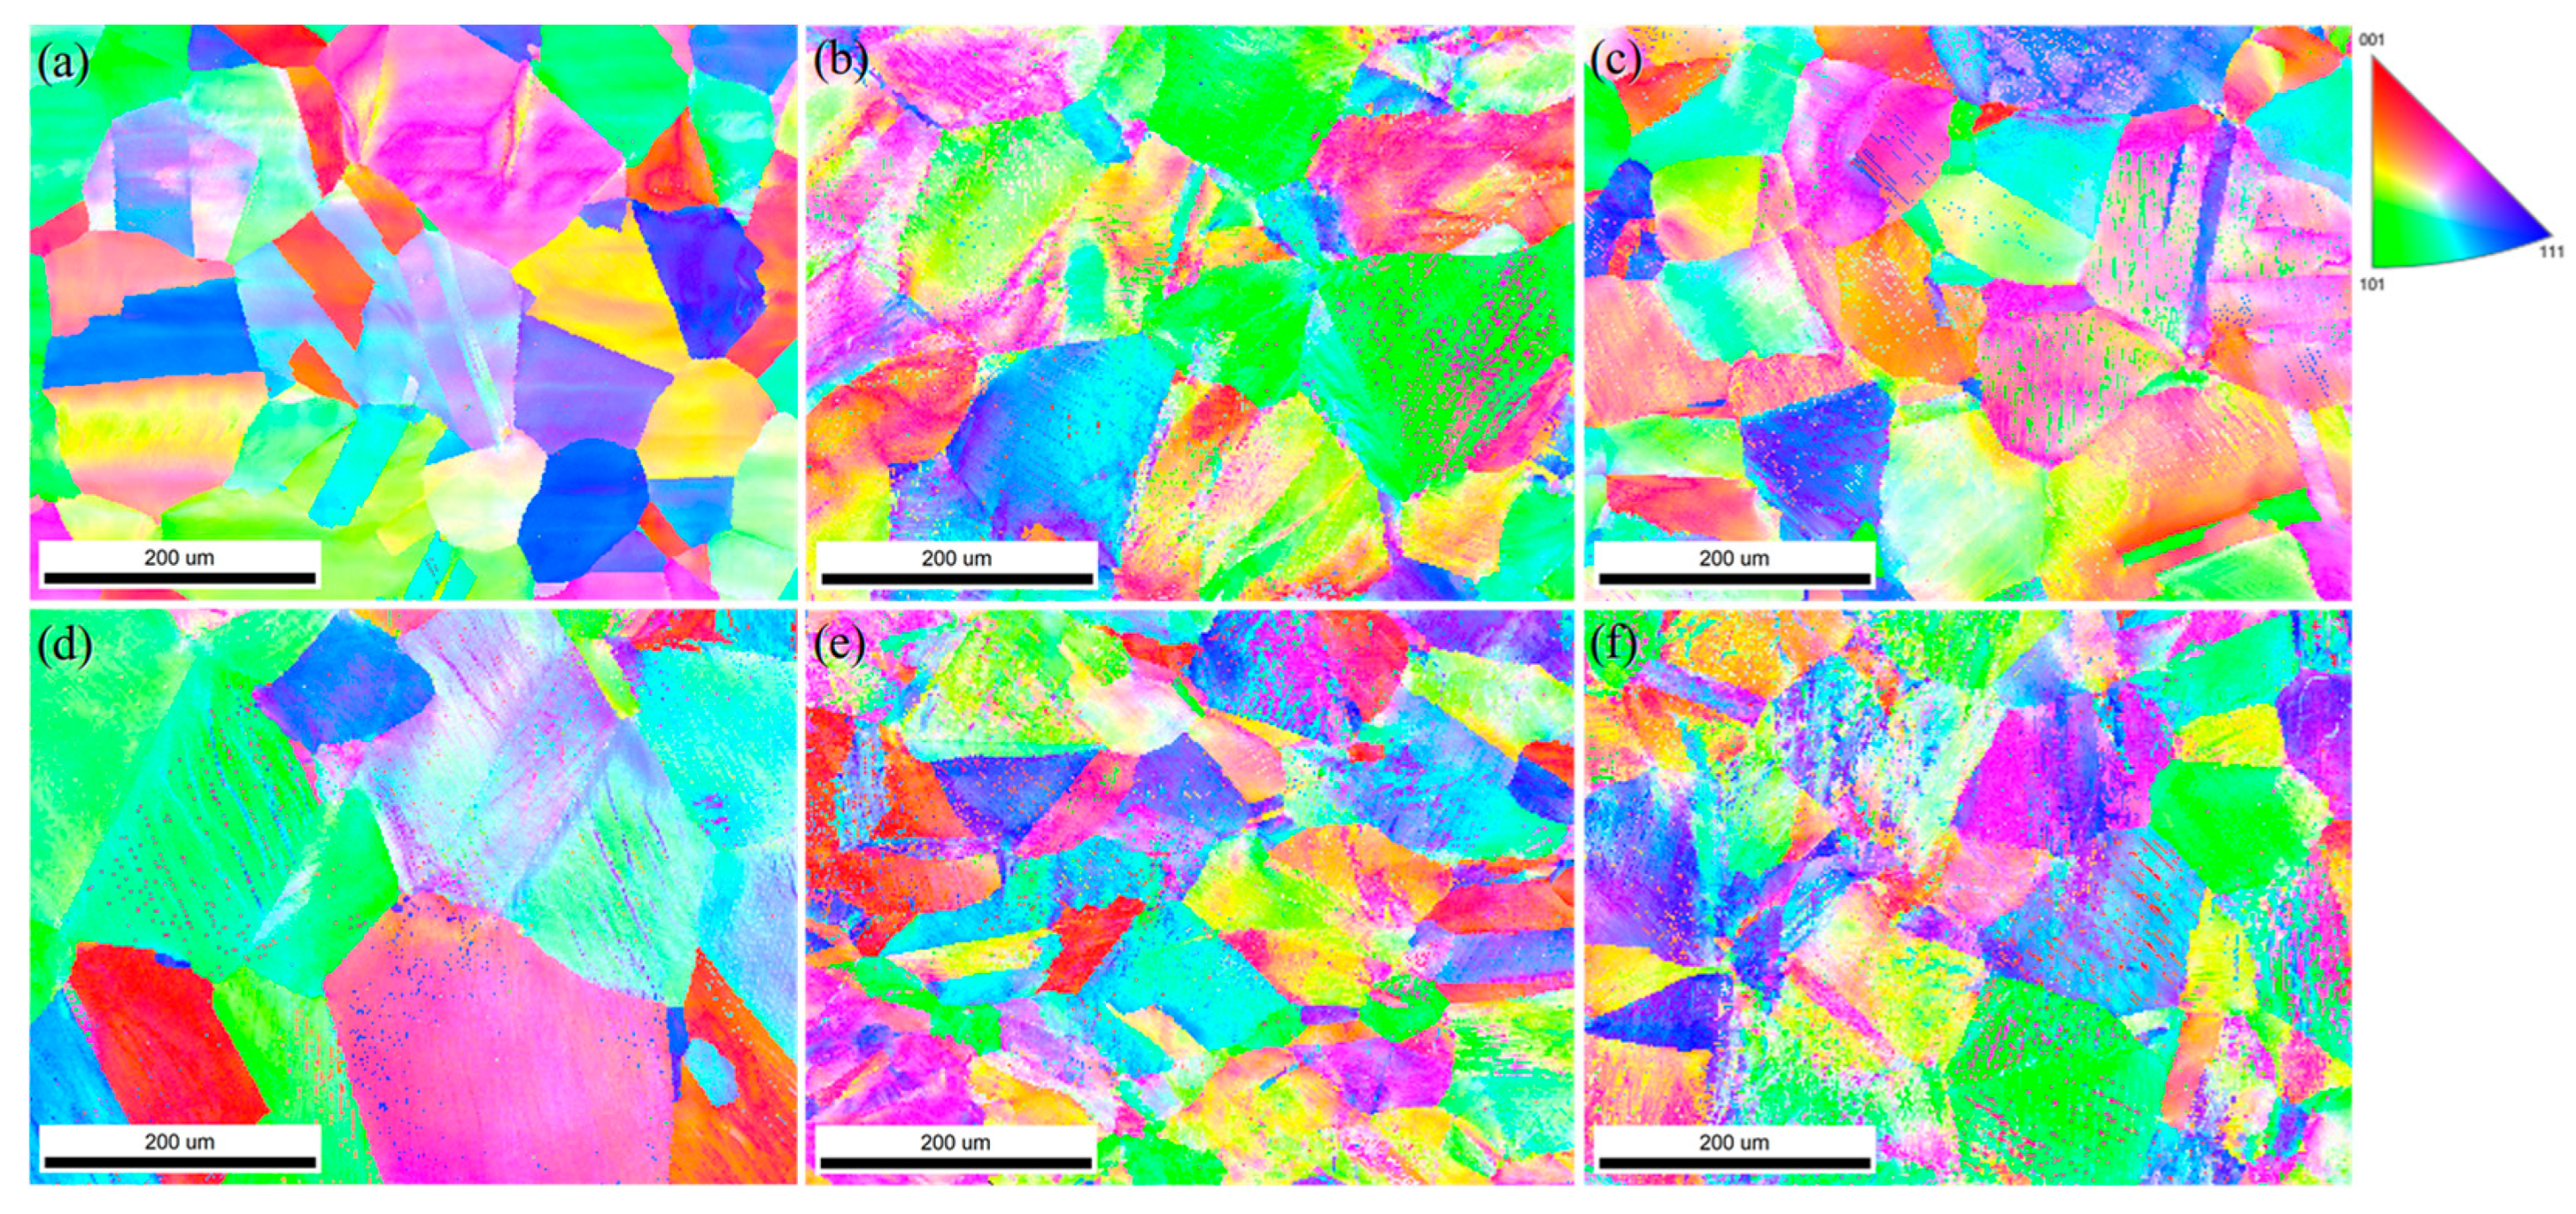
Figure 9 presents the EBSD inverse pole figure (IPF) maps of the tested samples. The T0 sample exhibits no significant deformation bands (
Figure 9a). After 5 to 15 min of shot blasting (
Figure 9b–d), deformation bands formed within the grains. With prolonged processing time, these bands became increasingly dense, signifying the accumulation of plastic deformation from the impacts, which progressively subdivided the original grains. When the shot blasting duration was extended to 40 min (
Figure 9e), the density of deformation bands reached a maximum, subsequently triggering grain fragmentation. The random crystallographic orientations of these newly formed grains are reflected in the more dispersed and chaotic color distribution in the IPF map. After 60 min of shot blasting (
Figure 9f), the color distribution showed no significant further change, suggesting that the process of grain fragmentation had stabilized and the density of deformation bands had saturated. The measured average grain size variation with shot blasting duration is consistent with these microstructural observations. The grain size generally decreased from 90.5 μm (0 min) to 62 μm (40 min) and finally to 57 μm (60 min). The anomalous value of 146 μm at the 15 min mark is attributed to a local sampling bias during measurement, indirectly indicating the inhomogeneous distribution of plastic deformation induced by shot blasting. Excluding this outlier, the overall data confirms that shot blasting effectively refines the γ-Fe grains.
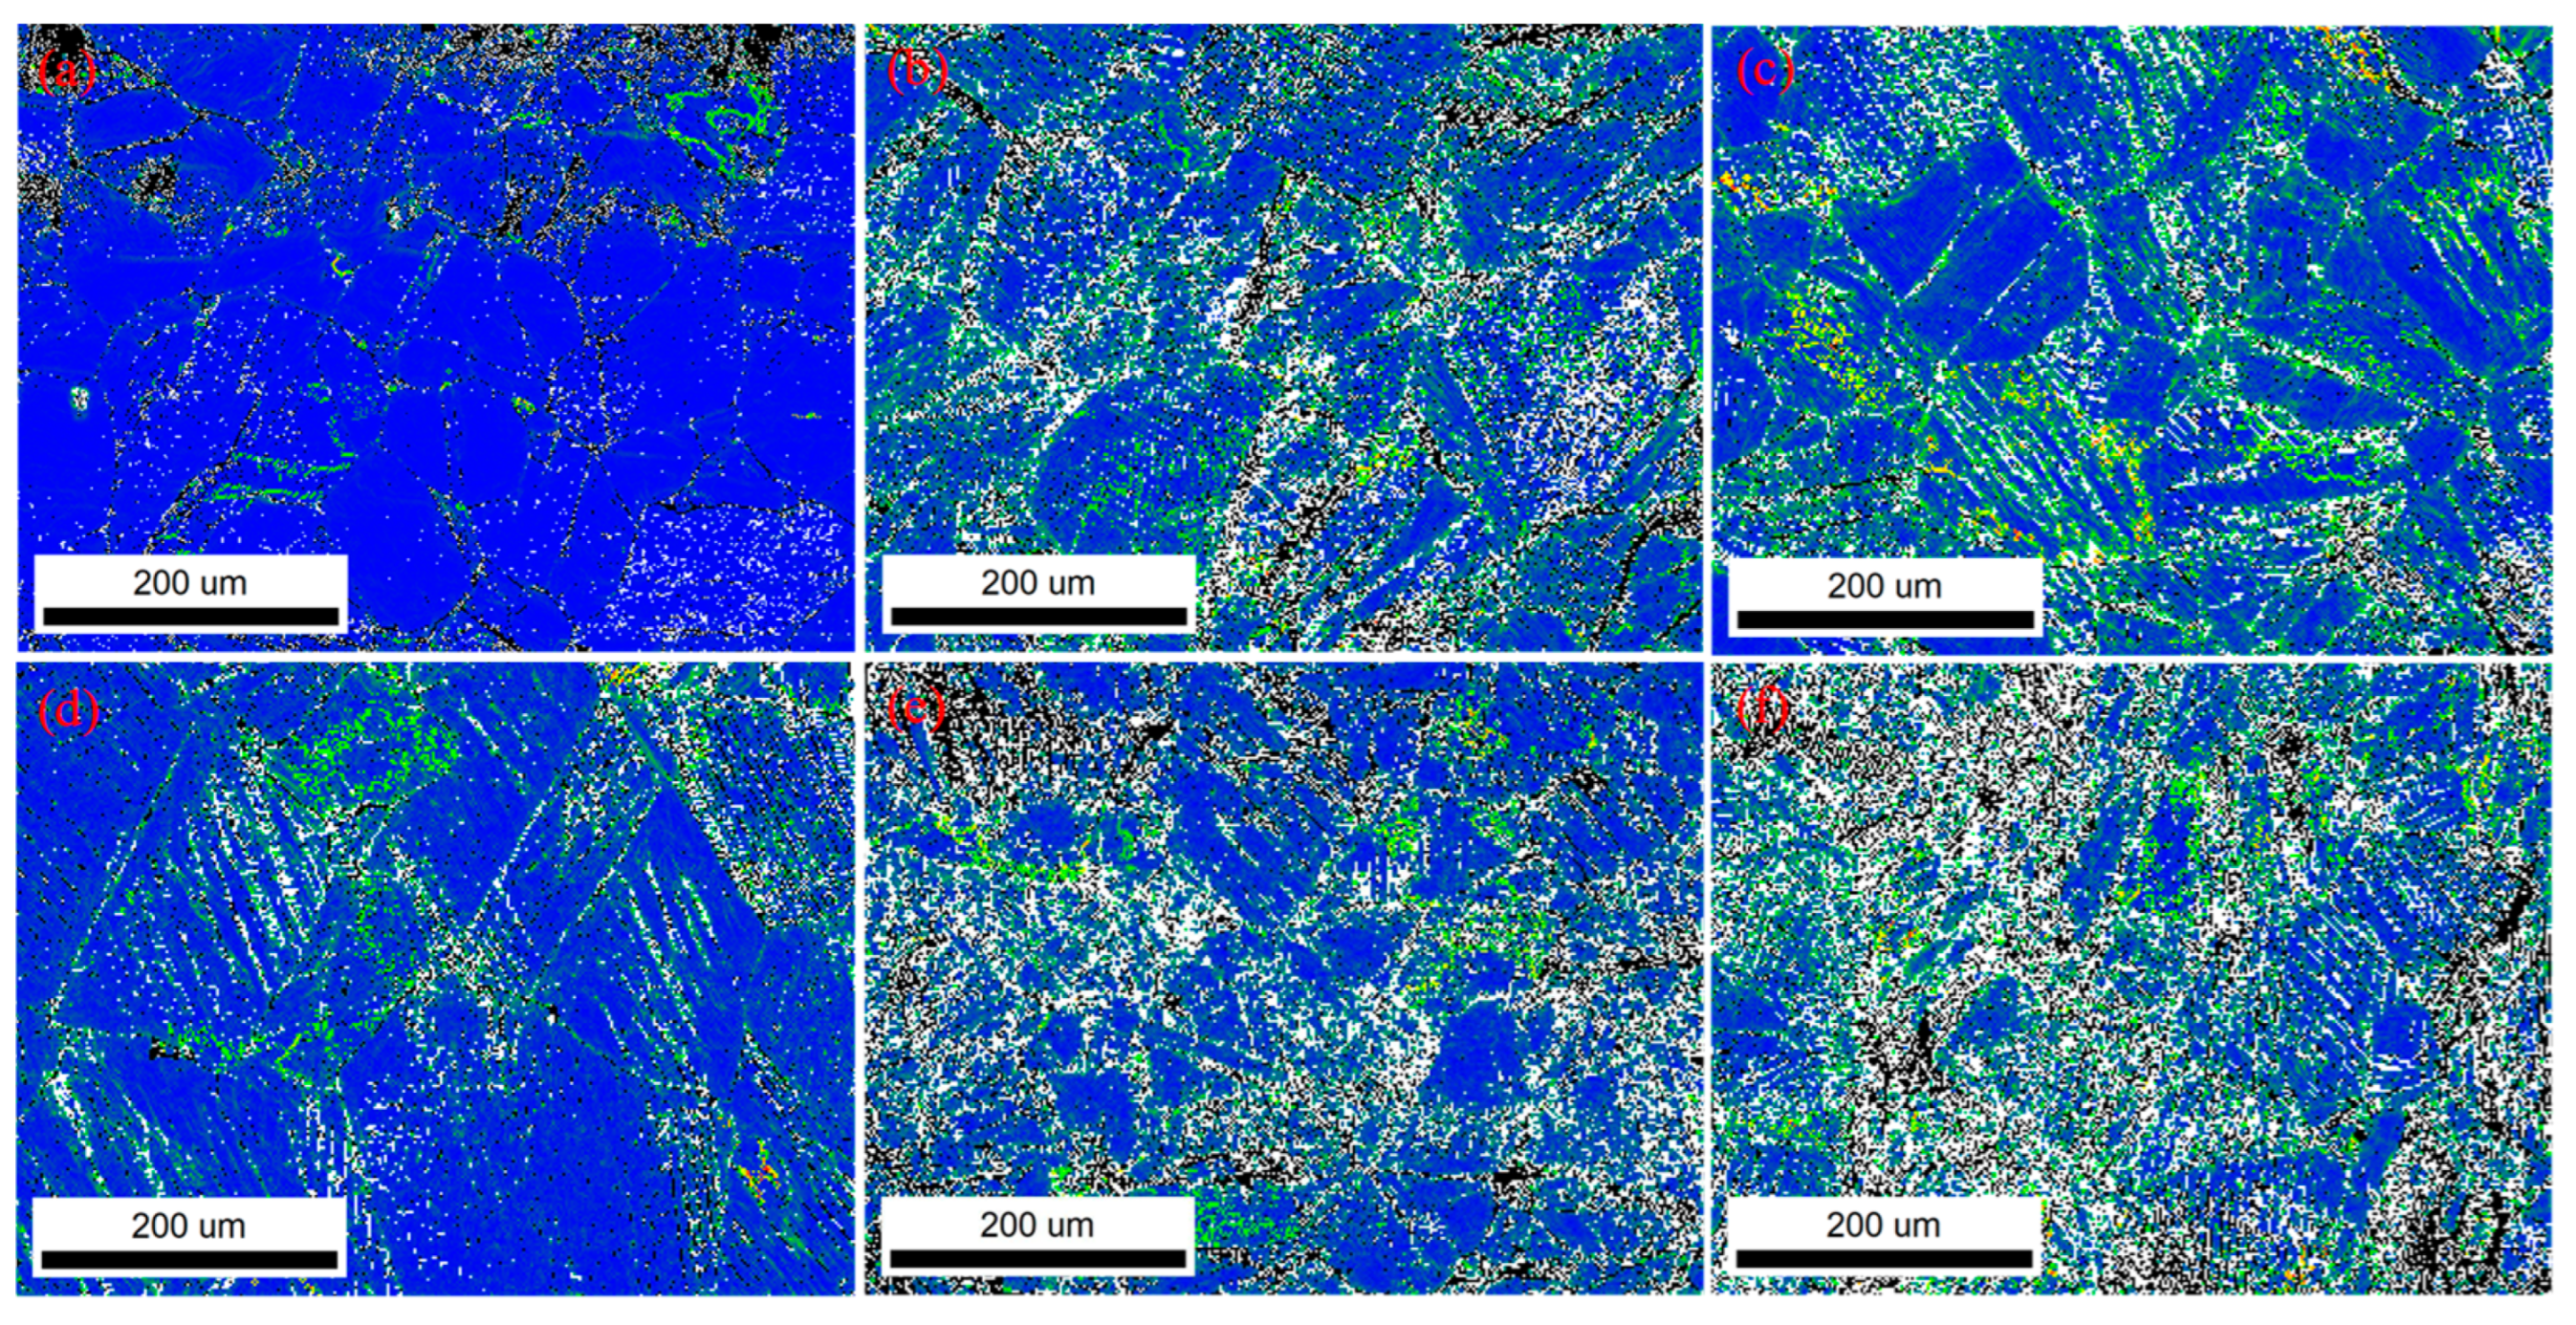
Figure 10 presents low-angle grain boundary (LAGB) maps of the samples subjected to different shot blasting durations, with boundaries of misorientation angles below 15° delineated by red lines. A substantial fraction of LAGBs is evident in all conditions. Quantitative data summarized in
Table 2 reveal a significant increase in the LAGB proportion following shot blasting. Specifically, the proportion rose from 57.4% in the heat-treated sample to over 70% in all shot-blasted samples, confirming that the process introduced a high density of LAGBs. Notably, a value of 84.2% was attained after just 5 min of processing. These findings demonstrate that shot blasting generates a large number of dislocations. During plastic deformation, these dislocations become tangled, and their movement is impeded by obstacles such as grain boundaries and twin boundaries, leading to the formation of dislocation pile-ups. The subsequent accumulation and reorganization of these dislocations then lead to the formation of the observed low-angle grain boundaries.
Figure 11 displays the evolution of the geometrically necessary dislocation (GND) density of with shot blasting duration. Quantitative analysis (
Table 3) confirms a significant increase in GND density across all processed samples compared to the heat-treated condition. The GND density followed a non-monotonic trend, initially increasing, then decreasing, and finally increasing again with prolonged processing time. A maximum GND density of 4.44 × 10
15 m
−2 was attained after 60 min of shot blasting.
Compared to shot peening, shot blasting employs a lower projectile velocity but a higher flow rate, ensuring uniform surface coverage and superior processing efficiency. The intense, repeated impact of stainless steel shots flattens surface asperities, thereby rapidly reducing surface roughness (
Figure 3). Concurrently, these impacts generate numerous dimples, which introduce residual compressive stress (
Figure 1) and induce severe plastic deformation. The plastic deformation promotes extensive dislocation generation and multiplication, leading to a rapid rise in dislocation density (
Figure 11;
Table 3). These resulting dislocations interact to form complex configurations (e.g., dislocation walls and cells), and their movement is hindered by microstructural barriers, resulting in pile-ups and the subsequent formation of subgrain boundaries (
Figure 10;
Table 2). The microstructural evolution is accompanied by substantial work hardening in the surface layer (
Figure 2), which directly enhances surface hardness. With prolonged shot blasting, grain refinement progresses (
Figure 9) and the work-hardened layer thickens. However, excessive processing introduces detrimental effects such as microcracks and surface delamination, indicative of incipient surface damage. Consequently, the wear resistance of high-manganese steel first increases and then decreases with extended processing time, while the impact toughness displays a more complex, non-monotonic trend. These mechanical property variations are attributed to the competition between beneficial factors (dislocation strengthening, grain refinement, and residual compressive stress) and detrimental factors (surface roughening and microcracking) induced by the mechanical impacts.
