Article

Microstructure and Mechanical Property Regulation of As-Cast AlCoCrFeNi2.1Six (x = 0, 0.1, 0.2, 0.3) High-Entropy Alloys

1
School of Materials Science, Shanghai Dianji University, Shanghai 200240, China
2
School of Materials and Chemistry, University of Shanghai for Science and Technology, Shanghai 200093, China
*
Author to whom correspondence should be addressed.
Metals 2025, 15(10), 1146; https://doi.org/10.3390/met15101146
Submission received: 17 September 2025 / Revised: 10 October 2025 / Accepted: 10 October 2025 / Published: 16 October 2025
(This article belongs to the Section Entropic Alloys and Meta-Metals)

Abstract

Eutectic high-entropy alloys (EHEAs) combine the casting advantages of eutectic alloys with the comprehensive properties of high-entropy alloys, making them a research hotspot in the field of metallic materials. Among them, the AlCoCrFeNi2.1 EHEA has attracted significant attention due to its excellent strength–toughness balance characteristics. In this study, alloy samples of AlCoCrFeNi2.1Six (x = 0, 0.1, 0.2, 0.3) were prepared to investigate the regulatory effects of trace Si on its phase composition, microstructure, and mechanical properties. The results show that the base alloy AlCoCrFeNi2.1 is composed of an FCC and BCC phase composition. With the increase in the Si content to x = 0.3, the CrSi2 phase gradually precipitates in the alloy, and its microscopic morphology transforms from the regular lamellar to the dendrite and network structure. The introduction of Si significantly enhances the room-temperature microhardness, wear resistance, and yield strength of the alloy through the mechanisms of solid solution strengthening and second phase strengthening. However, an excessive addition leads to a decrease in ductility and toughness. This study reveals the role of Si in phase control and the strengthening and toughening mechanism of eutectic high-entropy alloys, providing experimental evidence and a theoretical reference for the design of high-performance silicon-modified high-entropy alloys.

1. Introduction

With the advancement of technology, efforts have been continuously made to improve material performance. Traditional alloys are typically based on one or two principal elements, resulting in limited space for performance tuning. In contrast, high-entropy alloys (high-entropy alloys, HEAs) disrupt this design paradigm by consisting of five or more elements in equimolar or near-equimolar ratios (each element accounting for 5–35% of the atomic fraction) [1], providing a novel path for performance optimization. Early studies proposed four core mechanisms—high-entropy effect (thermodynamic), lattice distortion effect (structural), sluggish diffusion effect (kinetic), and the “cocktail” effect (performance) [2]—which have driven HEAs to exhibit a series of outstanding properties [3,4]. However, with further research, it has been recognized that the significance of these effects strongly depends on the specific alloy system. For example, in the well-known CoCrFeMnNi alloy, the constituent atomic radii are similar, and the lattice distortion effect is not significant; its performance is more closely related to deformation mechanisms induced by low stacking fault energy, such as the TWIP/TRIP effect, rather than a single mechanism among the Four Core Effects [5]. In 2014, Professor Lu Yiping proposed eutectic high-entropy alloys (eutectic high-entropy alloys, EHEAs), whose performance advantages originate from a unique dual-phase microstructure. During compositional control, second phase precipitation may also be induced. The as-cast eutectic high-entropy alloy AlCoCrFeNi2.1, featuring a self-assembled face-centered cubic (FCC)/body-centered cubic ordered phase (B2) dual-phase lamellar structure, achieves a synergy of high strength and high toughness, making it an ideal model system for exploring the strength–toughness balance mechanism [6,7]. To overcome the limitations of single-phase structures or classic effect theories, the research focus has shifted from “verifying Four Core Effects” to “designing dual-phase/multi-phase structures for specific systems”. Based on this, the present study selects the AlCoCrFeNi2.1 EHEA as the object and investigates the mechanisms in the dual-phase system by tuning its phase composition, microstructure, and performance.
The current performance tuning policies for the AlCoCrFeNi2.1 EHEA are mainly categorized into two types: one involves post-processing methods such as heat treatment and additive manufacturing to optimize the microstructure [8,9,10,11], but these methods require high precision in processing parameters, incur higher costs, and have limited general applicability; the other involves the direct control of phase composition and structural morphology through composition design (by tuning the proportion of principal elements or introducing alloying elements) [12,13], offering more fundamental economic efficiency and controllability. Based on this, the present study selects composition design as the core approach to further explore the performance potential of the alloy. Beyond the traditional solid solution strengthening via metallic elements, the ingestion of non-metallic elements (such as Si, C, and B) provides a unique direction for HEAs’ performance regulation [14,15,16,17]. Among them, silicon is considered a highly promising dopant due to its small atomic radius (~0.117 nm), low density (2.33 g/cm3), and low cost. It has been demonstrated in conventional alloys to refine the microstructure and boost both strength and wear resistance. Existing studies have preliminarily revealed the mechanism of silicon in HEAs: R. Babilas et al. [18] fabricated AlCoCrFeNiSi-based HEAs with varying Cr-Si potency (e.g., AlCoCrFeNiSi and AlCoFeNiSi0.5) and discovered that the synergistic addition of Cr and Si could induce phase transformation and form new stable phases; Y.Pan et al. [19] systematically explored the correlation between structural traits and the overall performance of chromium–silicon binary silicides, which possess significant application potential in the realms of semiconductors, thermoelectrics, and high-temperature systems, providing key affordance for material design. Gu et al. [20] observed in Al0.3CoCrFeNiSixalloys that Si not only drives phase transformation but also enables the suppression of dendrite core (DR) and interdendritic (ID) area element segregation, promoting compositional homogenization. Lin et al. [19] found that in the synthesized WMoNbCrTiSix (x = 0, 0.1, 0.25, 0.5) high-entropy alloys, the increase in Si content drives the evolution of the alloy’s microstructure. Due to the extremely low mixing enthalpy between Si and metallic elements, stable metal silicides are readily formed. These compound phases can both hinder the dislocation slip and refine grains during solidification or heat treatment procedures, thereby synergistically enhancing the hardness, strength, and wear resistance of the alloy. In addition, the ingestion of Si can improve the high-temperature oxidation resistance of HEAs [21], further expanding their application scenes in extreme environments. It is noteworthy that Si has demonstrated a critical role in regulating solidification behavior and optimizing casting performance in general binary eutectic alloys [22,23]. These binary eutectic alloys containing non-metallic elements have been widely applied in the manufacturing of complex thin-walled aerospace structural components due to their excellent casting fluidity, low density, and standout comprehensive properties. This provides both a theoretical reference and practical foundation for the application of Si in EHEAs. In view of this, the present study takes the AlCoCrFeNi2.1 EHEA as the object and systematically investigates the regulation mechanisms of Si doping on its phase structure, microstructure, and comprehensive properties, aiming to provide an experimental basis for the performance optimization and engineering application of eutectic high-entropy alloys.
In this study, the low-silicon AlCoCrFeNi2.1Six (x = 0, 0.1, 0.2, 0.3) eutectic high-entropy alloy was prepared, and the effect of the Si content on the microstructure and mechanical properties of the high-entropy alloy was investigated. Based on this, the study systematically explored the influence of the addition of Si (x = 0, 0.1, 0.2, 0.3) on the AlCoCrFeNi2.1 eutectic high-entropy alloy. Techniques such as scanning electron microscopy (SEM), X-ray diffraction (XRD), and energy-dispersive spectroscopy (EDS) were employed to characterize in detail the microstructure morphology, phase composition, phase distribution, and elemental distribution of the alloys with different Si contents. Meanwhile, through hardness testing, friction and wear experiments, and tensile property testing, the study systematically evaluated the influence of the addition of Si on the macroscopic mechanical properties (hardness, tensile strength, and ductility) and tribological performance (wear resistance) of the alloy. This study aims to elucidate the mechanism of action of the Si element in the AlCoCrFeNi2.1 EHEA, providing a theoretical basis and experimental foundation for optimizing the comprehensive properties of this eutectic high-entropy alloy through a microalloying strategy.

2. Materials and Methods

Raw materials with a purity greater than 99.9% Al, Co, Cr, Ni, Fe, and Si were used to prepare the AICoCrFeNi2.1Six (x = 0, 0.1, 0.2, 0.3) series of high-entropy alloys. The materials were weighed according to the molar ratio, where x represents the molar ratio of the Si element.
The eutectic high-entropy alloy was melted using a vacuum melting furnace, with an alloy ingot mass of 100 g. The actual compositions of the alloys are shown in Table 1. Prior to melting in the vacuum arc furnace, the crucible, electrode rod, and inner chamber surfaces were wiped with a lint-free cloth soaked in alcohol. The metals were placed in the copper crucible in the order of increasing melting point to minimize the evaporation of low-boiling-point materials while ensuring the complete melting of high-melting-point metals, thereby achieving a compositionally uniform high-entropy alloy. The arc was aligned with the high-purity Ti block in the crucible for trial melting. Alloy melting began when the surface of the titanium block appeared bright and showed no color change. After each melting cycle, the ingot was flipped and the process repeated 5–6 times to ensure the uniformity of the chemical composition in the cast ingot.
The obtained 10 × 10 × 2 mm sample was progressively polished with sandpaper until the fine scratches on its surface were parallel and consistent. The phase structure of the alloy was analyzed using a BRUKER D8 X-ray diffractometer (Bruker, Ettlingen, Germany). A Cu target was selected, with a tube current of 40 mA and anode target voltage of 40 kV. The scanning angle range 2θ was set from 20° to 90°. The scanning rate was 5°/min, with measured data imported into Jade6 software for phase composition analysis and lattice parameter calculation. The specimen was ground and polished using metallographic sandpaper, followed by etching with aqua regia. Final polishing was performed using a 1.5 μm diamond suspension. The specimen was then etched with a mixed solution of nitric acid and hydrochloric acid at a volume ratio of 1:3 for 50 s. Micro-area composition analysis of the alloy was conducted using an S-3400N tungsten filament scanning electron microscope (Hitachi, Tokyo, Japan) and an energy dispersive spectrometer (Hitachi, Tokyo, Japan), with an accelerating voltage of 20 kV. After polishing, the microhardness was measured using an HXD-1000 digital microhardness tester (from Shanghai Optical Instrument Factory, Shanghai, China). The test load was 100 gf with a dwell time of 10 s. Ten points were tested in different regions of each specimen. The maximum and minimum values were excluded, and the average value of the remaining eight points was taken as the hardness value. Room-temperature tensile property testing was conducted using MTS Tensile Testing Equipment (MTS, Shenzhen, China) under a load of 3 kN and a tensile rate of 0.3 mm/min. The dimensions of the tensile test specimen were as shown in Figure 1. Room-temperature friction and wear testing was performed using the TBT-M5000 multifunctional material wear test platform under a load of 15 N for a duration of 1 h. A ZrO2 ceramic ball with a diameter of 10 mm was selected as the counterpart. The test was conducted with a wear radius of 4 mm, a frequency of 2 Hz, and was configured in a rotational mode with a high-frequency reciprocating motion. Sample dimensions were 10 mm × 10 mm × 6 mm. Prior to testing, the sample surfaces were ground and polished to remove surface oxides, followed by cleaning with alcohol. Each group of samples was tested three times, and the average value was taken as the measurement result.

3. Results

3.1. The Effect of Si Content on the Phase Structure and Microstructure of High-Entropy Alloys

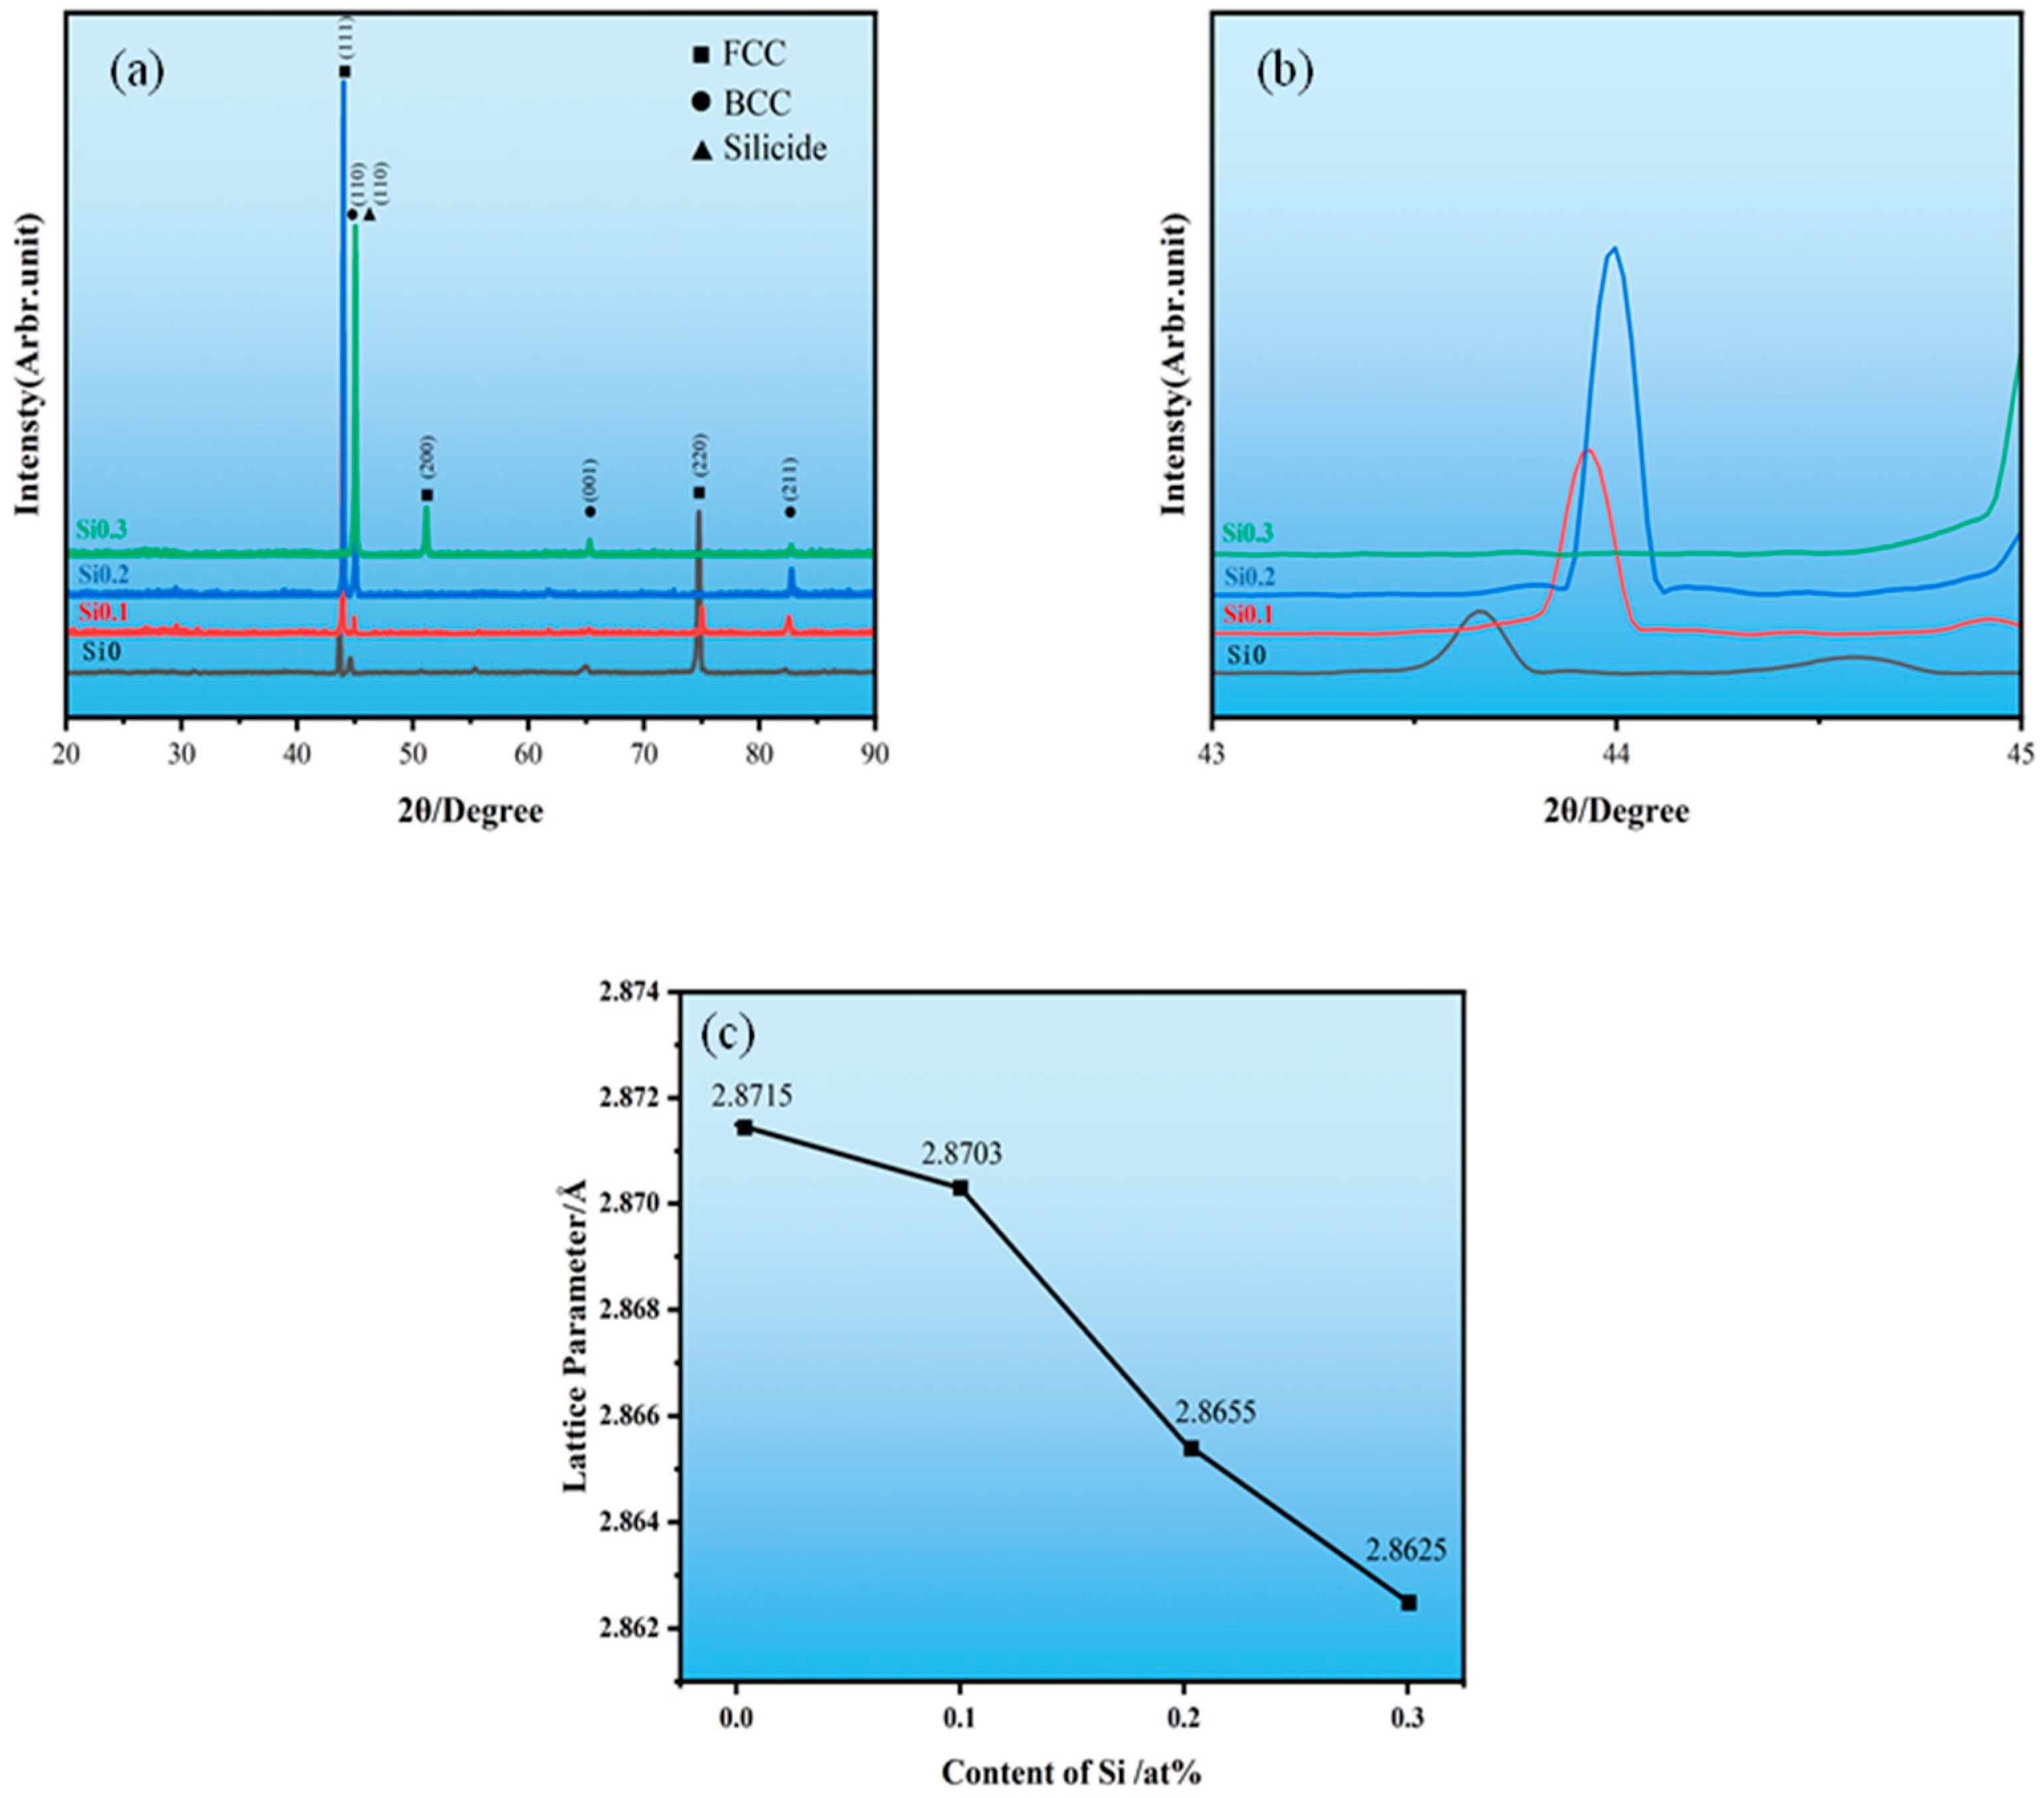
Figure 2 shows the X-ray diffraction (XRD) patterns of as-cast AlCoCrFeNi2.1Six (x = 0, 0.1, 0.2, 0.3) eutectic high-entropy alloys, along with a magnified view of the (111) diffraction peak in the range of 43–44°. As shown in Figure 2a, when the silicon content x = 0, the alloy exhibits a dual-phase structure of FCC + BCC. When x = 0.1 and 0.2, no new diffraction peaks are observed. All four types of alloys have a dual phase structure of FCC + BCC. It can be seen that in the low-Si content range (0–0.2), Si atoms are primarily dissolved in the matrix phase of the alloy. In the trace Si range (x ≤ 0.2), Si slightly alters the relative proportion of the FCC phase and the BCC phase, resulting in a gradual increase in the intensity of the diffraction peaks. As the Si content increased and reached 0.3, a new diffraction peak was discovered, which superseded the original peak at 45°. Based on PDF cards and reference literature, it was validated as the CrSi2 phase [20,21]. CrSi2 is an intermetallic compound that forms in AlCoCrFeNi2.1Six alloys when the Si content supersedes the solid solubility limit (x ≥ 0.3). Its formation is driven by the strong chemical affinity between Cr and Si. This phase typically precipitates at FCC/B2 phase boundaries or grain boundaries, exhibiting granular or short rod-like morphologies. Figure 2b presents a local magnification at 45° of the (111) crystal plane diffraction peak shown. It can be observed that the diffraction peak of the (111) plane gradually intensifies with increasing silicon content. Furthermore, as shown in Figure 2c, the lattice parameter decreases progressively, resulting in a rightward shift of the diffraction peak position. This phenomenon is attributed to the dominant substitutional solid solution effect of silicon and the lattice contraction induced by solid solution, which is consistent with Bragg’s law [22]. With the increase in the silicon content, silicon primarily exists in the alloy in the form of silicide, leading to a reduction in the lattice constant and a shift in the diffraction peak toward higher angles.
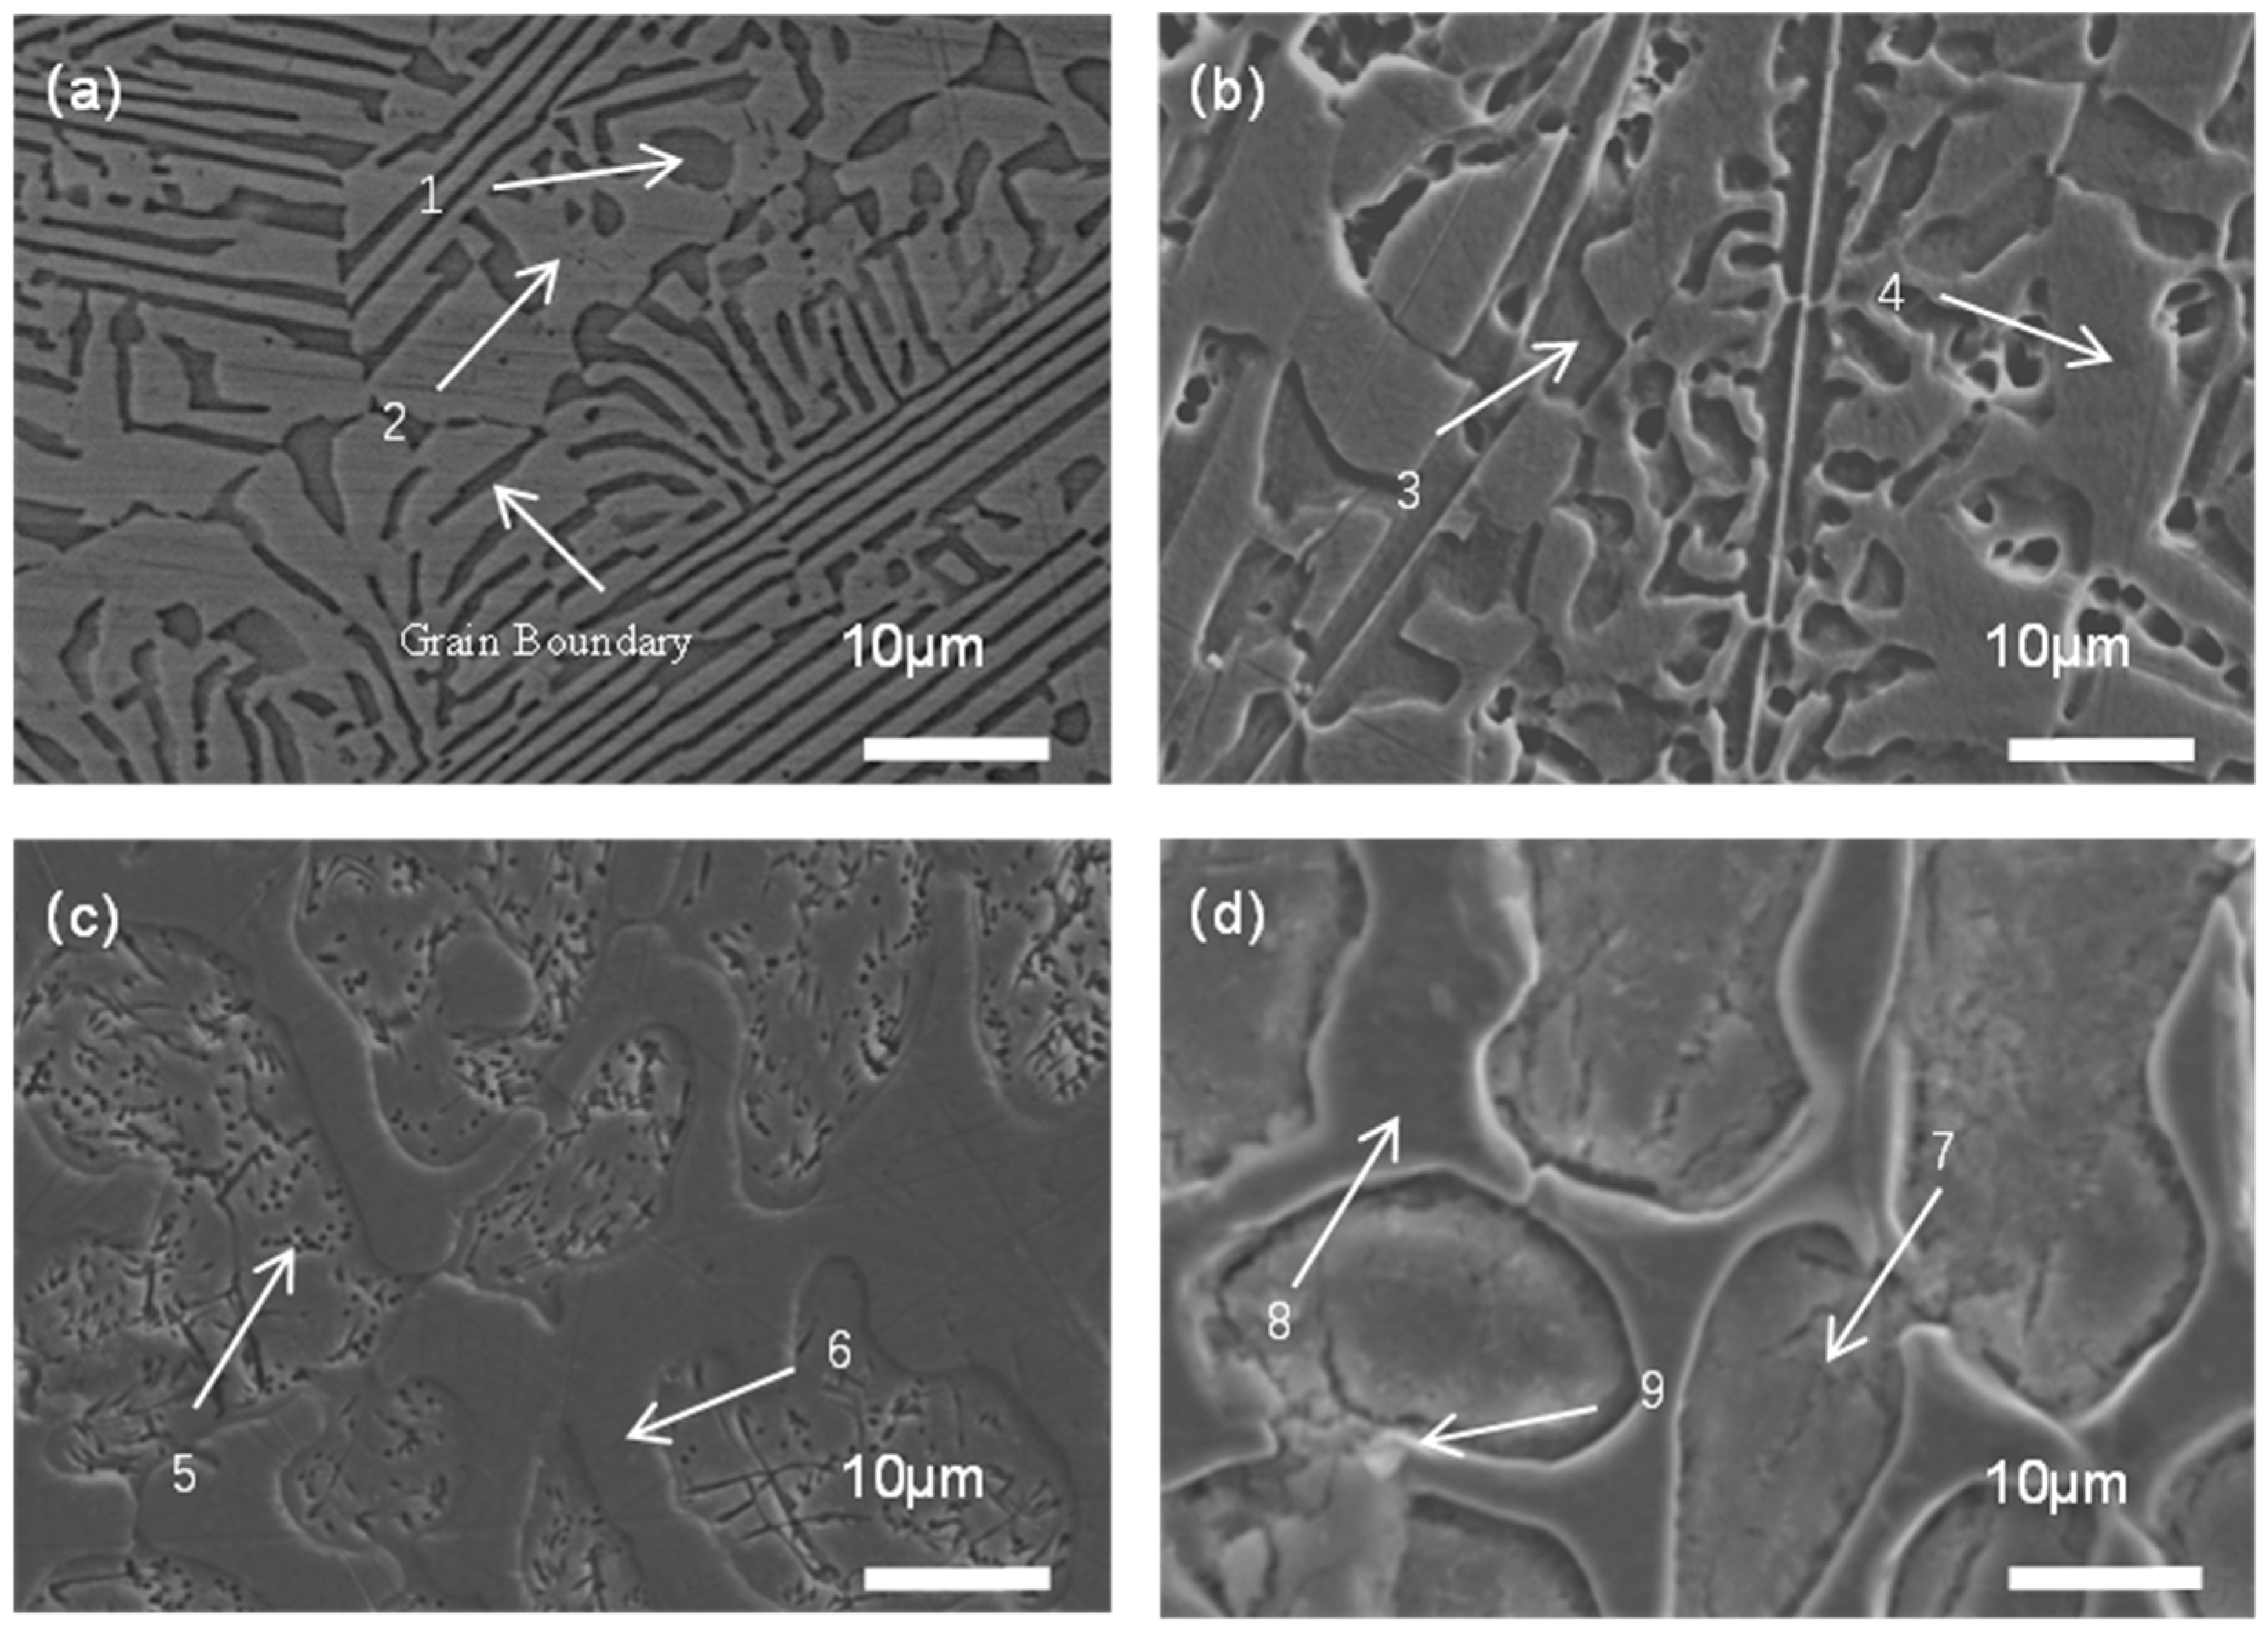
Figure 3 shows the cross-sectional SEM images of the Si0, Si0.1, Si0.2, and Si0.3 alloys, respectively. The Si0 alloy exhibits a typical lamellar eutectic microstructure composed of the FCC phase and BCC phase composition. In the sample with a Si content of x = 0, distinct grain boundaries can be observed, as indicated by the arrows. Fine grain boundaries are visible within the Si0 alloy, as indicated by the arrows. The Si0 image displays evident eutectic structure characteristics, presenting elongated strip-like and interlaced lamellar structures with relatively regular alignment. With increasing Si content, the FCC phase first coarsens and then gradually dissolves into the BCC phase. Meanwhile, the microstructure morphology transforms from lamellar to dendritic and eventually to network. Upon the addition of Si, the BCC phase is significantly coarsened, and the microstructure transitions from a lamellar to a dendritic morphology. This phenomenon can be clearly observed in the Si0.1 alloy, where the eutectic structure comprises lamellar and dendritic crystals. With a further increase in the Si content, the lamellar morphology disappears in the Si0.2 alloy, and a distinct network morphology appears. As the Si content continues to increase, the Si0.3 alloy exhibits a scattered distribution of the network structure. In the absence of the addition of silicon, the alloy surface structure is relatively uniform, lacking significant phase separation or notable microstructural changes. This condition is typically characterized by fine grains or a homogeneous solid solution. As the silicon content increases, the microstructure of the alloy begins to change, particularly with the appearance of some strip-like or sheet-like structures. Silicon may react with other elements in the alloy to form Si-rich phases. The formation of such phases increases the heterogeneity of the alloy, resulting in these strip-like or sheet-like morphologies. At Si = 0.1, the lamellar eutectic structure still exists; however, compared to Si = 0, the interfaces between lamellae become slightly rough and uneven, and some fine substructures appear. This may be due to the interference and refinement effect caused by the addition of silicon on the growth of the eutectic structure. In addition, a distinct dendritic structure can be observed in the image at Si = 0.1, which is formed during the solidification process. The formation of dendrites results from the faster solidification rate in certain regions of the alloy during cooling, leading to the development of a tree-like crystal structure. At a high silicon content (Si = 0.3), the alloy exhibits a more pronounced dendritic or network morphology. The microstructure presents a more complex form, with the lamellar eutectic structure almost completely disappearing, replaced by numerous pores, granular features, and irregular dendritic structures. This indicates that a higher silicon content exerts a significant destructive and reconstructive effect on the microstructure of the alloy, which may lead to notable changes in the alloy’s properties. This may be due to the promotion of brittle phase or secondary phase precipitation via silicon in the alloy, with the amount of these phases increasing as the silicon content rises. Such morphology changes are typically accompanied by compositional gradients and inhomogeneous phase distribution within the alloy.
To further elucidate the phase composition of alloys with different Si contents, micro-area composition analysis was performed using EDS. Table 2 shows the elemental composition of the high-entropy alloys based on EDS analysis, with the numbers indicating the proportion of each element. Combined with the analysis results of XRD, it is known that Region 1 corresponds to the BCC phase and Region 2 corresponds to the FCC phase. As the silicon content increases to x = 0.3, the enrichment of Cr and Si elements appears in the alloy.
Based on the data in Table 2 and Region 9 in Figure 3, it can be seen that the new phase is rich in Cr and Si. Ultimately, the overall high-entropy alloy exhibits a continuous reticular formation.
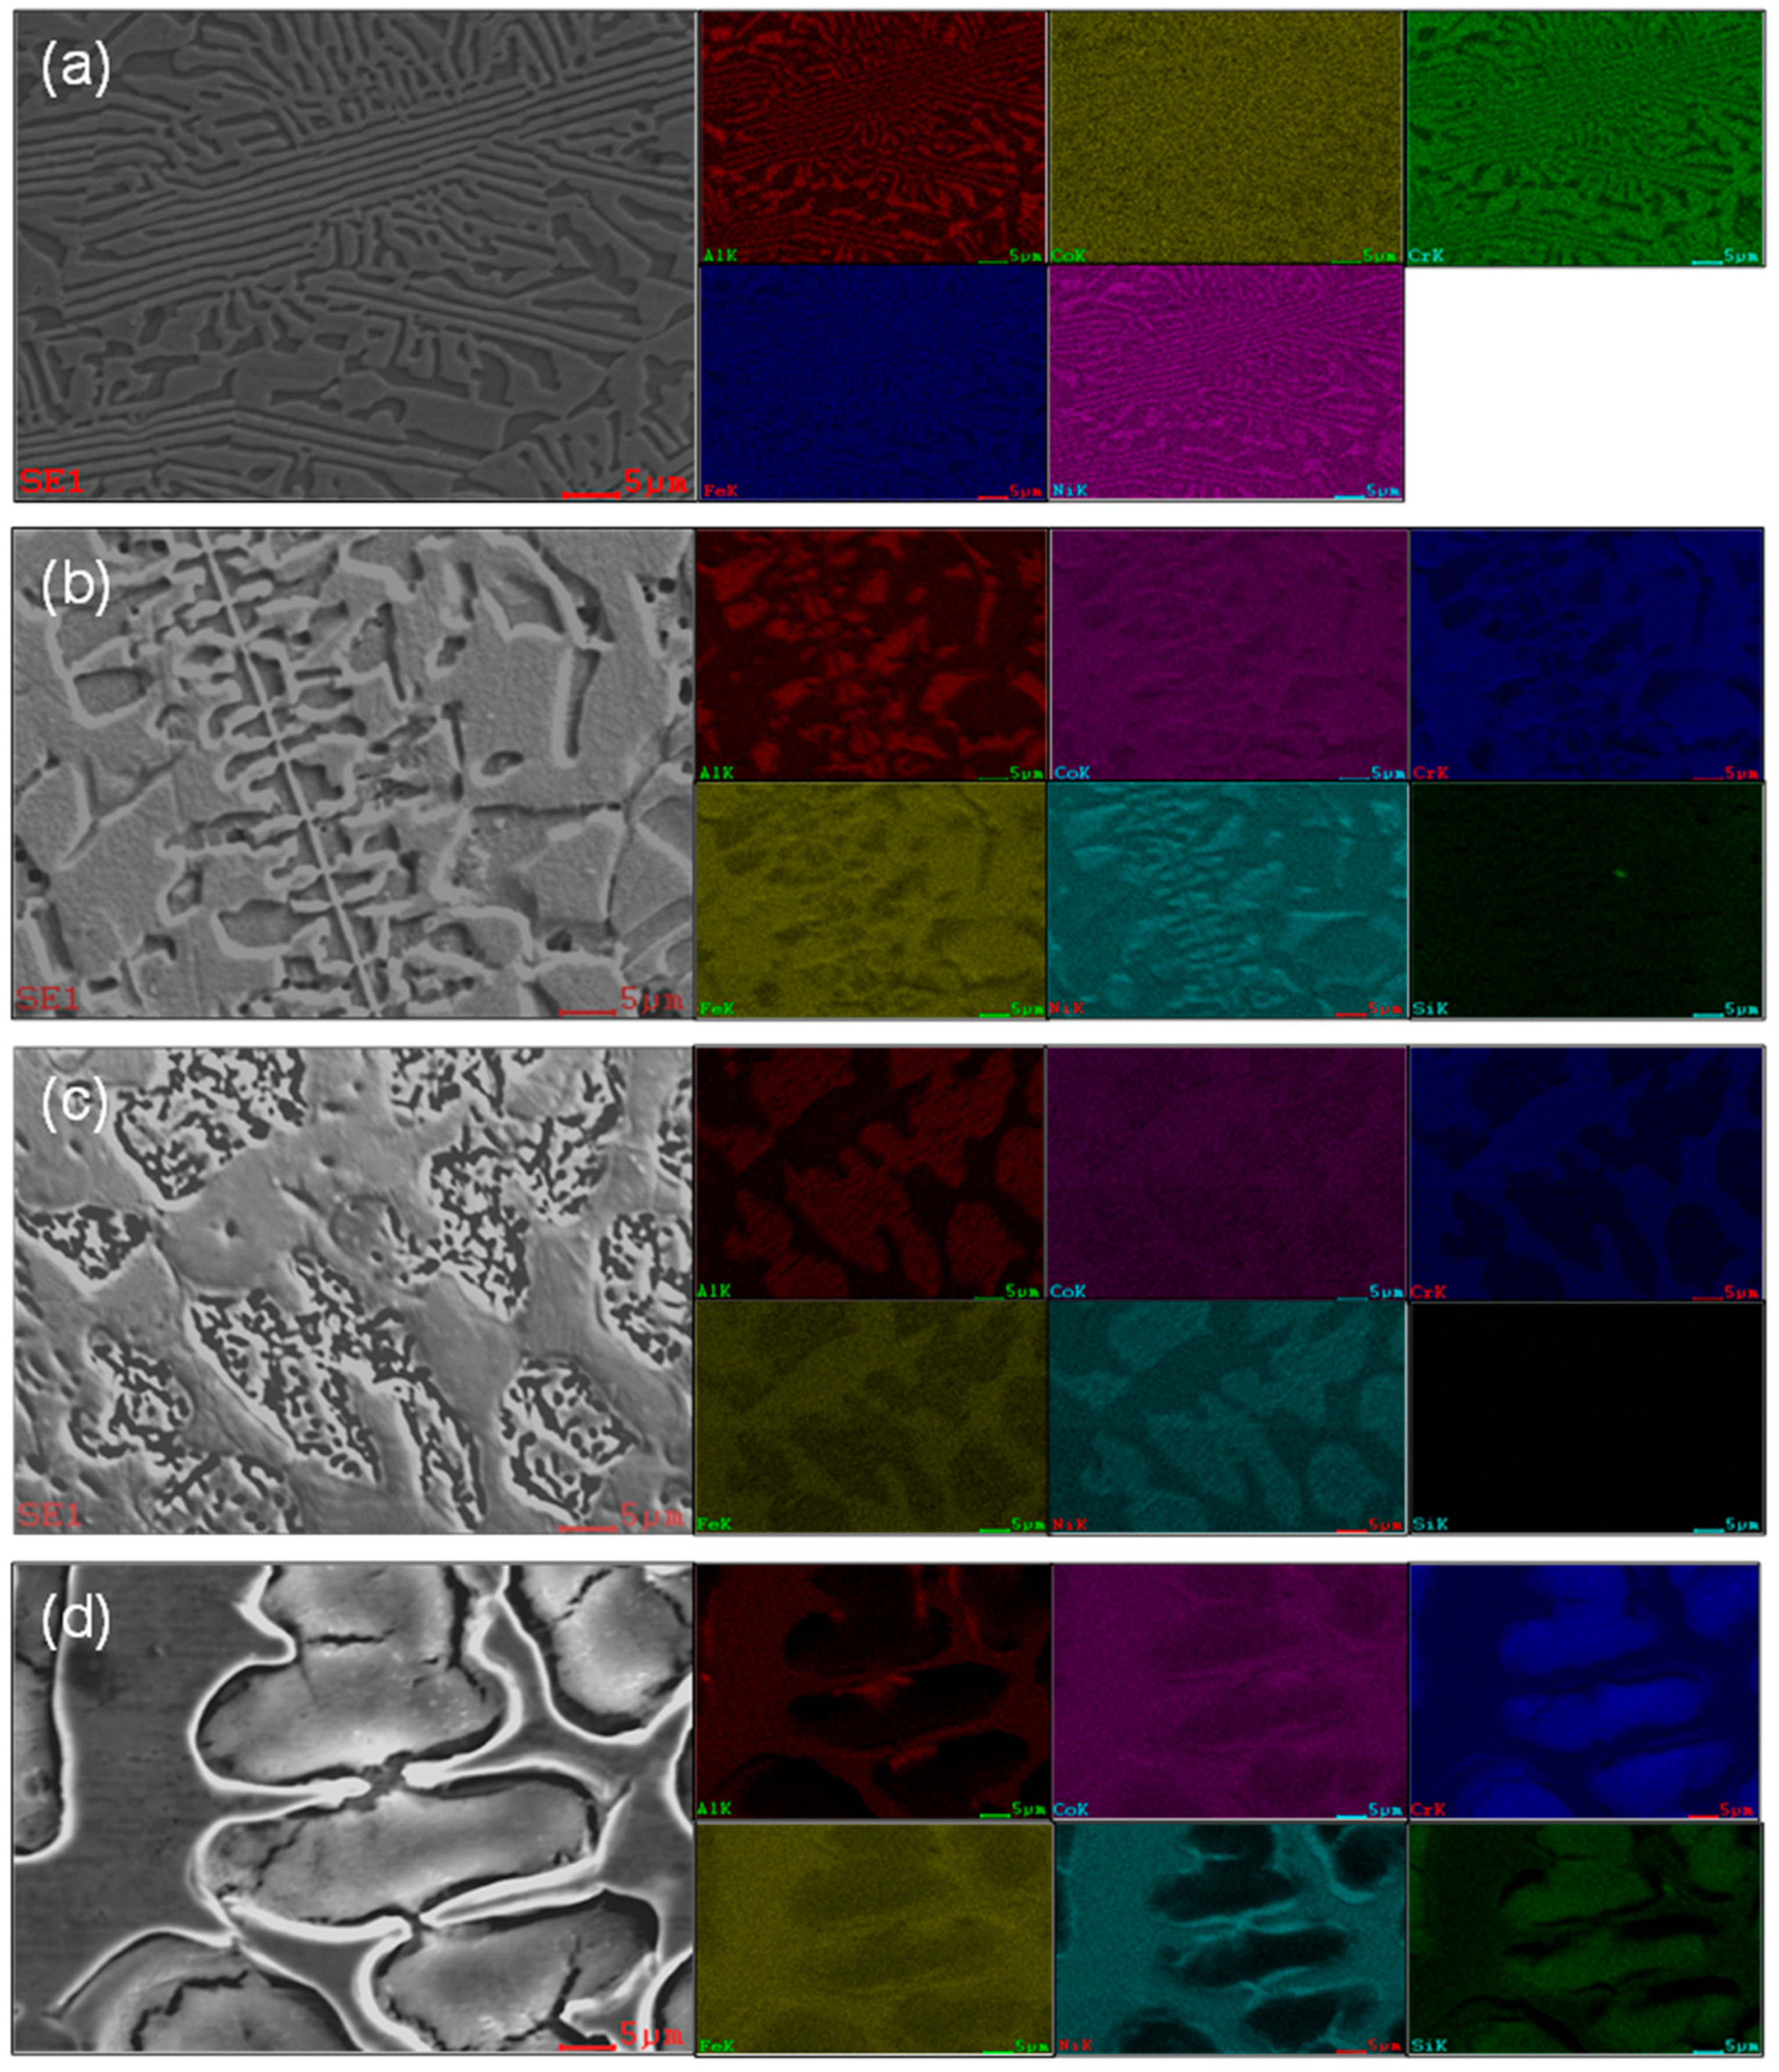
EDS composition analysis was conducted on eutectic high-entropy alloy samples from Si0 to Si0.3, and the results are shown in Figure 4. It can be observed that in the Si0 alloy, the light-colored region of the FCC phase is enriched in Cr, Fe, and Co elements, while Ni and Al elements are depleted; the dark-colored region of the BCC phase shows the opposite trend. Despite the different solidification conditions, the compositions of each phase are similar to those of the AlCrFeCoNi2.1 eutectic high-entropy alloy. In the Si0.1 and Si0.2 alloys, due to the low sensitivity of EDS to light elements, the Si content is not shown. The elemental distribution results of the two phases in the Si0.1 and Si0.2 alloys are similar to those in the Si0 alloy. In image d, it can be seen that in the Si0.3 sample, Al, Co, Fe, and Ni are enriched in the same region, while Cr and Si co-segregate in another region. This phenomenon reveals the phase separation mechanism reconstruction induced by the addition of silicon, the fundamental reason being that Si breaks the original phase equilibrium and drives the regrouping of elements. With the increase in Si content, the Cr content in the FCC phase decreases. The atomic radius of Si (1.17 Å) is smaller than that of Al (1.43 Å), but its electronegativity is higher (Si: 1.80, Al: 1.43), which strongly occupies the lattice sites of Al in the BCC phase, expelling part of the Al atoms, which then diffuse into the FCC phase [23,24,25]. As the Si content increases and approaches the solid solubility limit, a small amount of silicon dissolves into the FCC phase, while most of the silicon dissolves into the BCC phase, increasing the volume fraction of BCC. The addition of Si disrupts the Ni–Al ordered bonds, causing Al atoms to migrate and Ni atoms to loosen and enter the FCC phase. The BCC phase becomes locally disordered, leading to the migration of Cr atoms into it [26,27]. The atomic radii of the alloying elements and the mixing enthalpies of the atomic pairs are shown in Table 3.
Clearly, Cr and Si have a large negative mixing enthalpy, which promotes their tendency to form segregated phases and the formation of Si-rich silicides.

3.2. Influence of Si Content on the Characteristics of High-Entropy Alloys

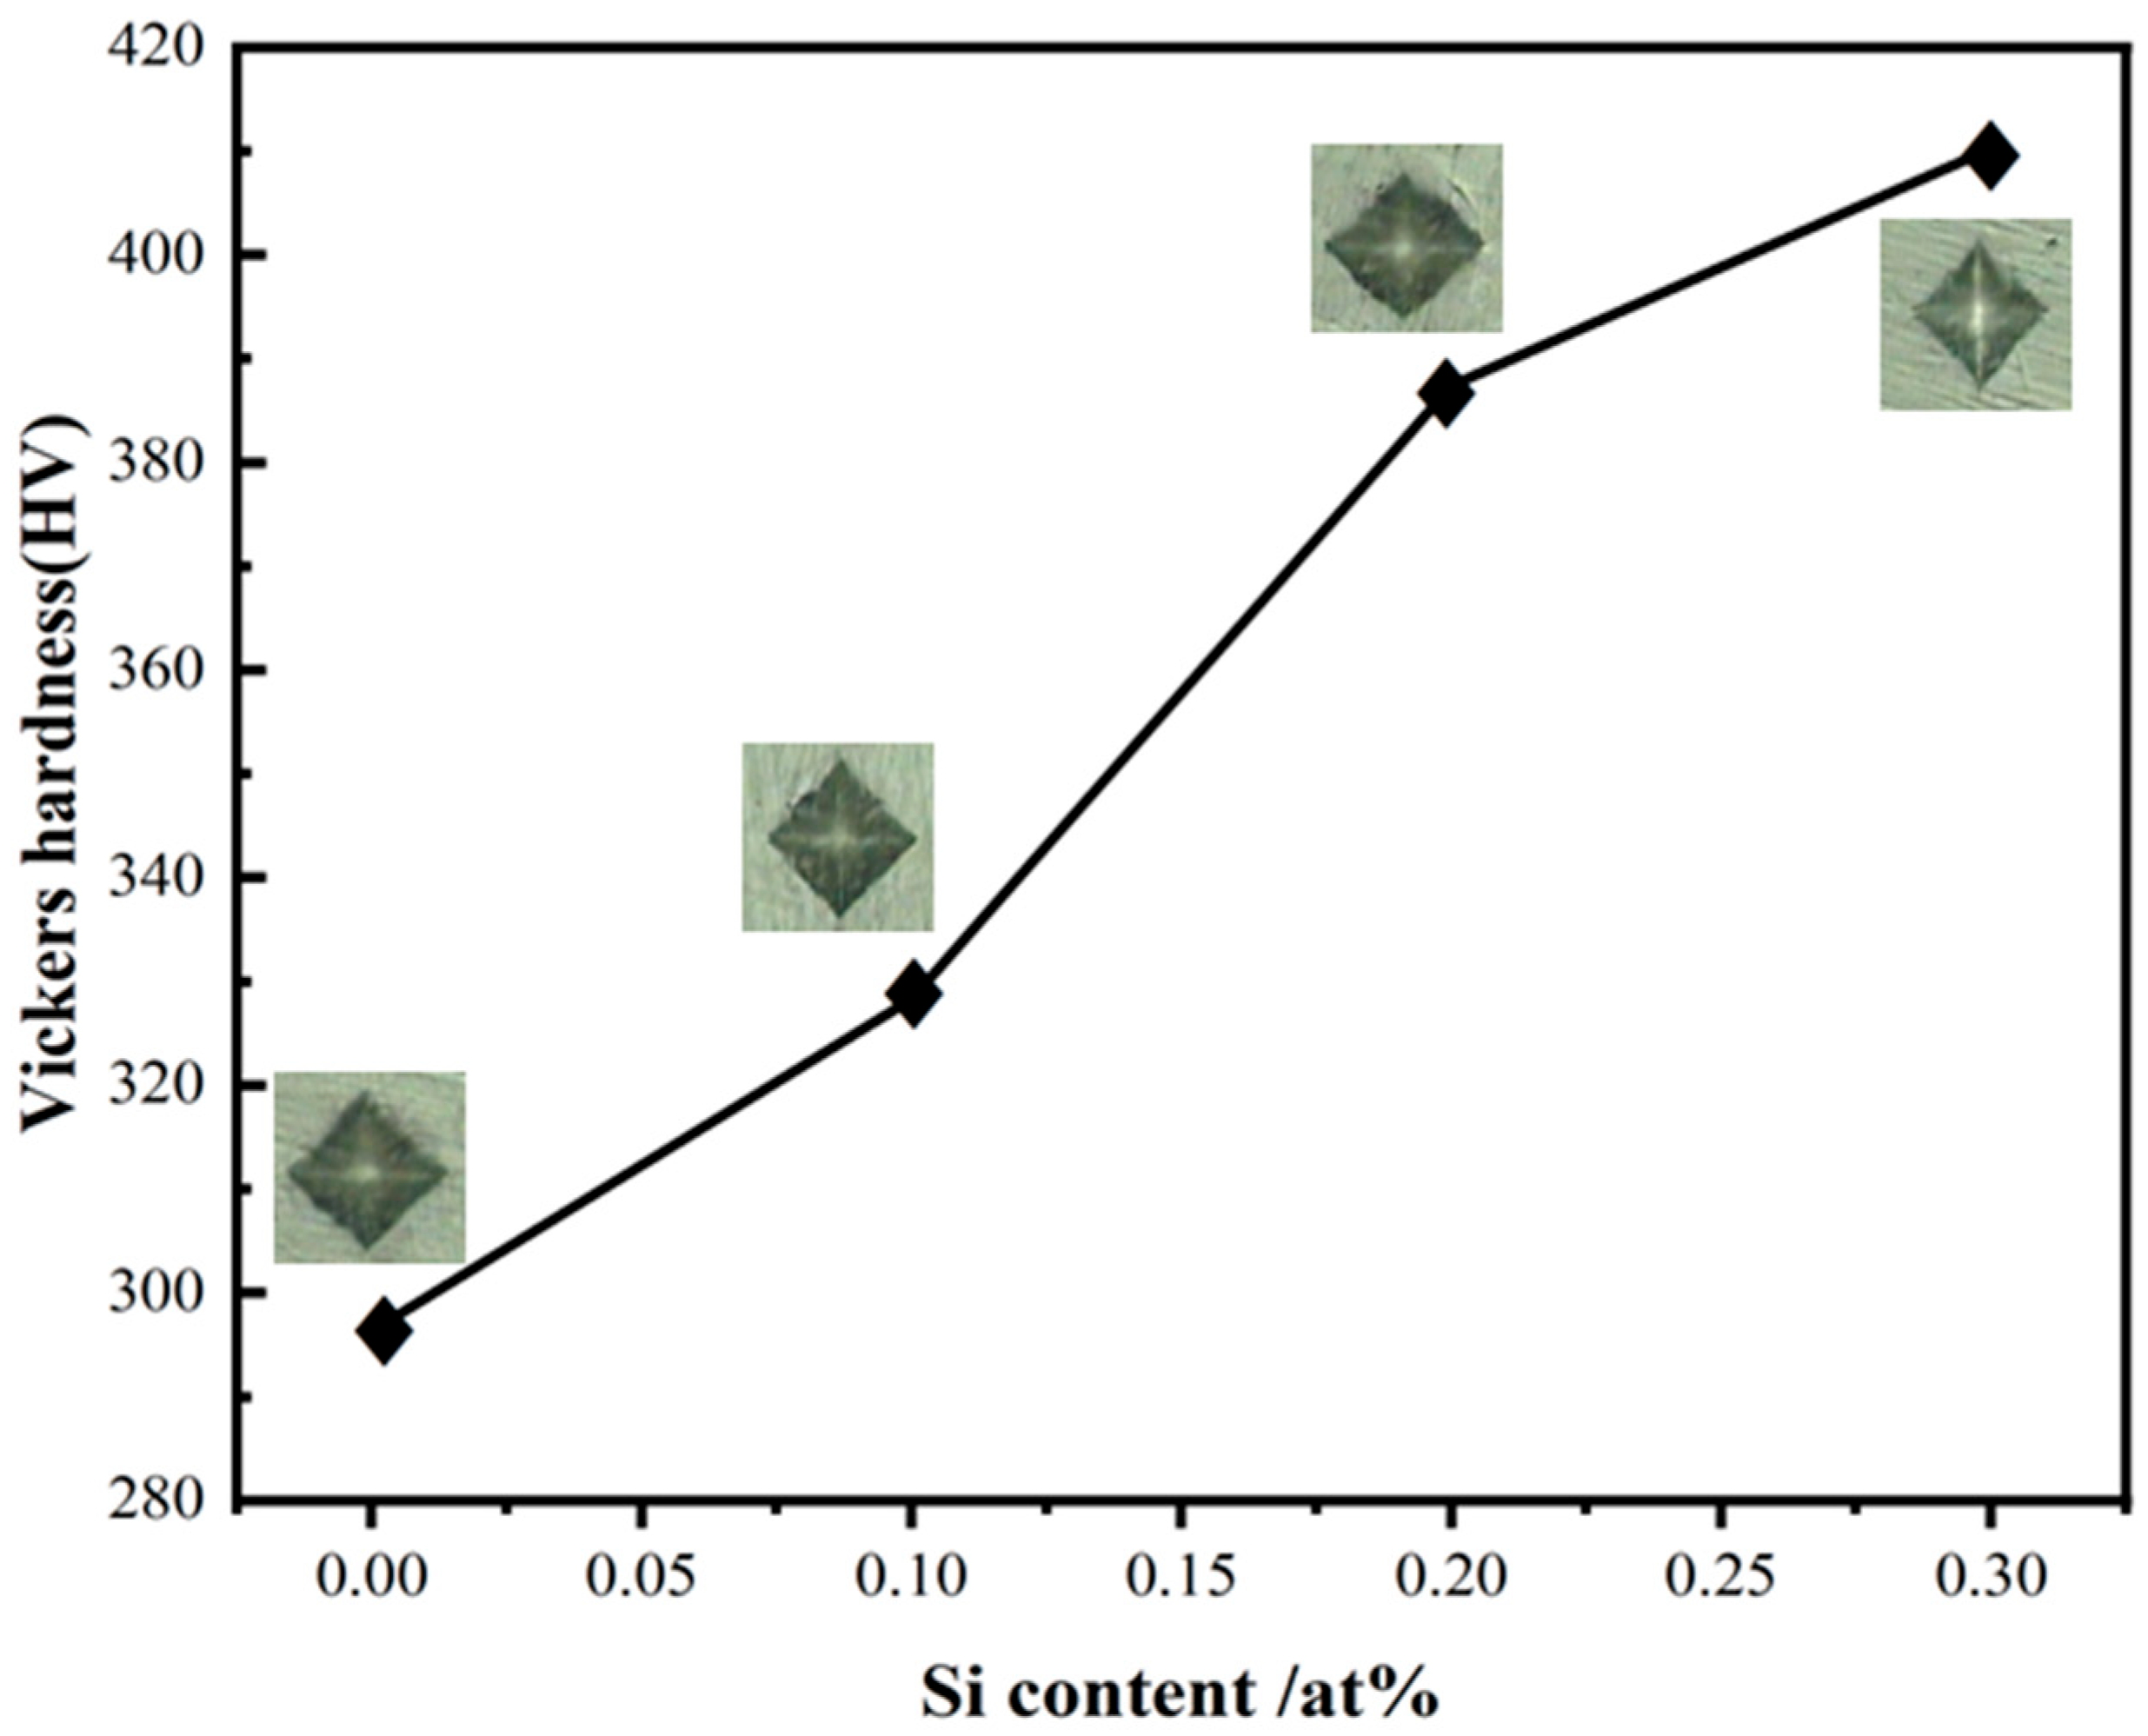
Figure 5 shows the average hardness and corresponding indentation morphology of as-cast AlCoCrFeNi2.1Six high-entropy alloys. The final results are summarized in Table 4. It can be observed from the figure that the hardness of the alloy increases continuously with the increase in Si content, reaching a maximum value of 410.2 HV when the Si content is 0.3. From the Vickers indentation images at different Si contents, it is evident that at lower Si contents (e.g., 0 or 0.1%), the indentations are larger with blurred morphology contours, indicating a softer material. As the Si content increases, the indentations become smaller and the edges sharper, indicating increased hardness. At 0.2% and 0.3%, the indentations are significantly smaller, suggesting the material is hardest at these compositions.
In general, the increase in alloy hardness is mainly attributed to three factors: The solid solution strengthening effect of Si: Si atoms enter the alloy lattice to form a solid solution, causing lattice distortion, increasing resistance to dislocation motion, and enhancing high hardness [28]. The formation of a second phase: Si induces the formation of hard phases (such as silicides and intermetallic compounds, etc.), which contribute to strengthening [29]. In this study, CrSi2 precipitates were observed. These second phases are distributed at grain boundaries or within grains, hindering the dislocation slip and improving the overall strength. The refinement of grains due to increased Si content: the alloy’s microstructure becomes denser, and the resistance to deformation in the micro-indentation region is enhanced [30]. The increase in hardness results from the synergistic effect of multiple strengthening mechanisms.
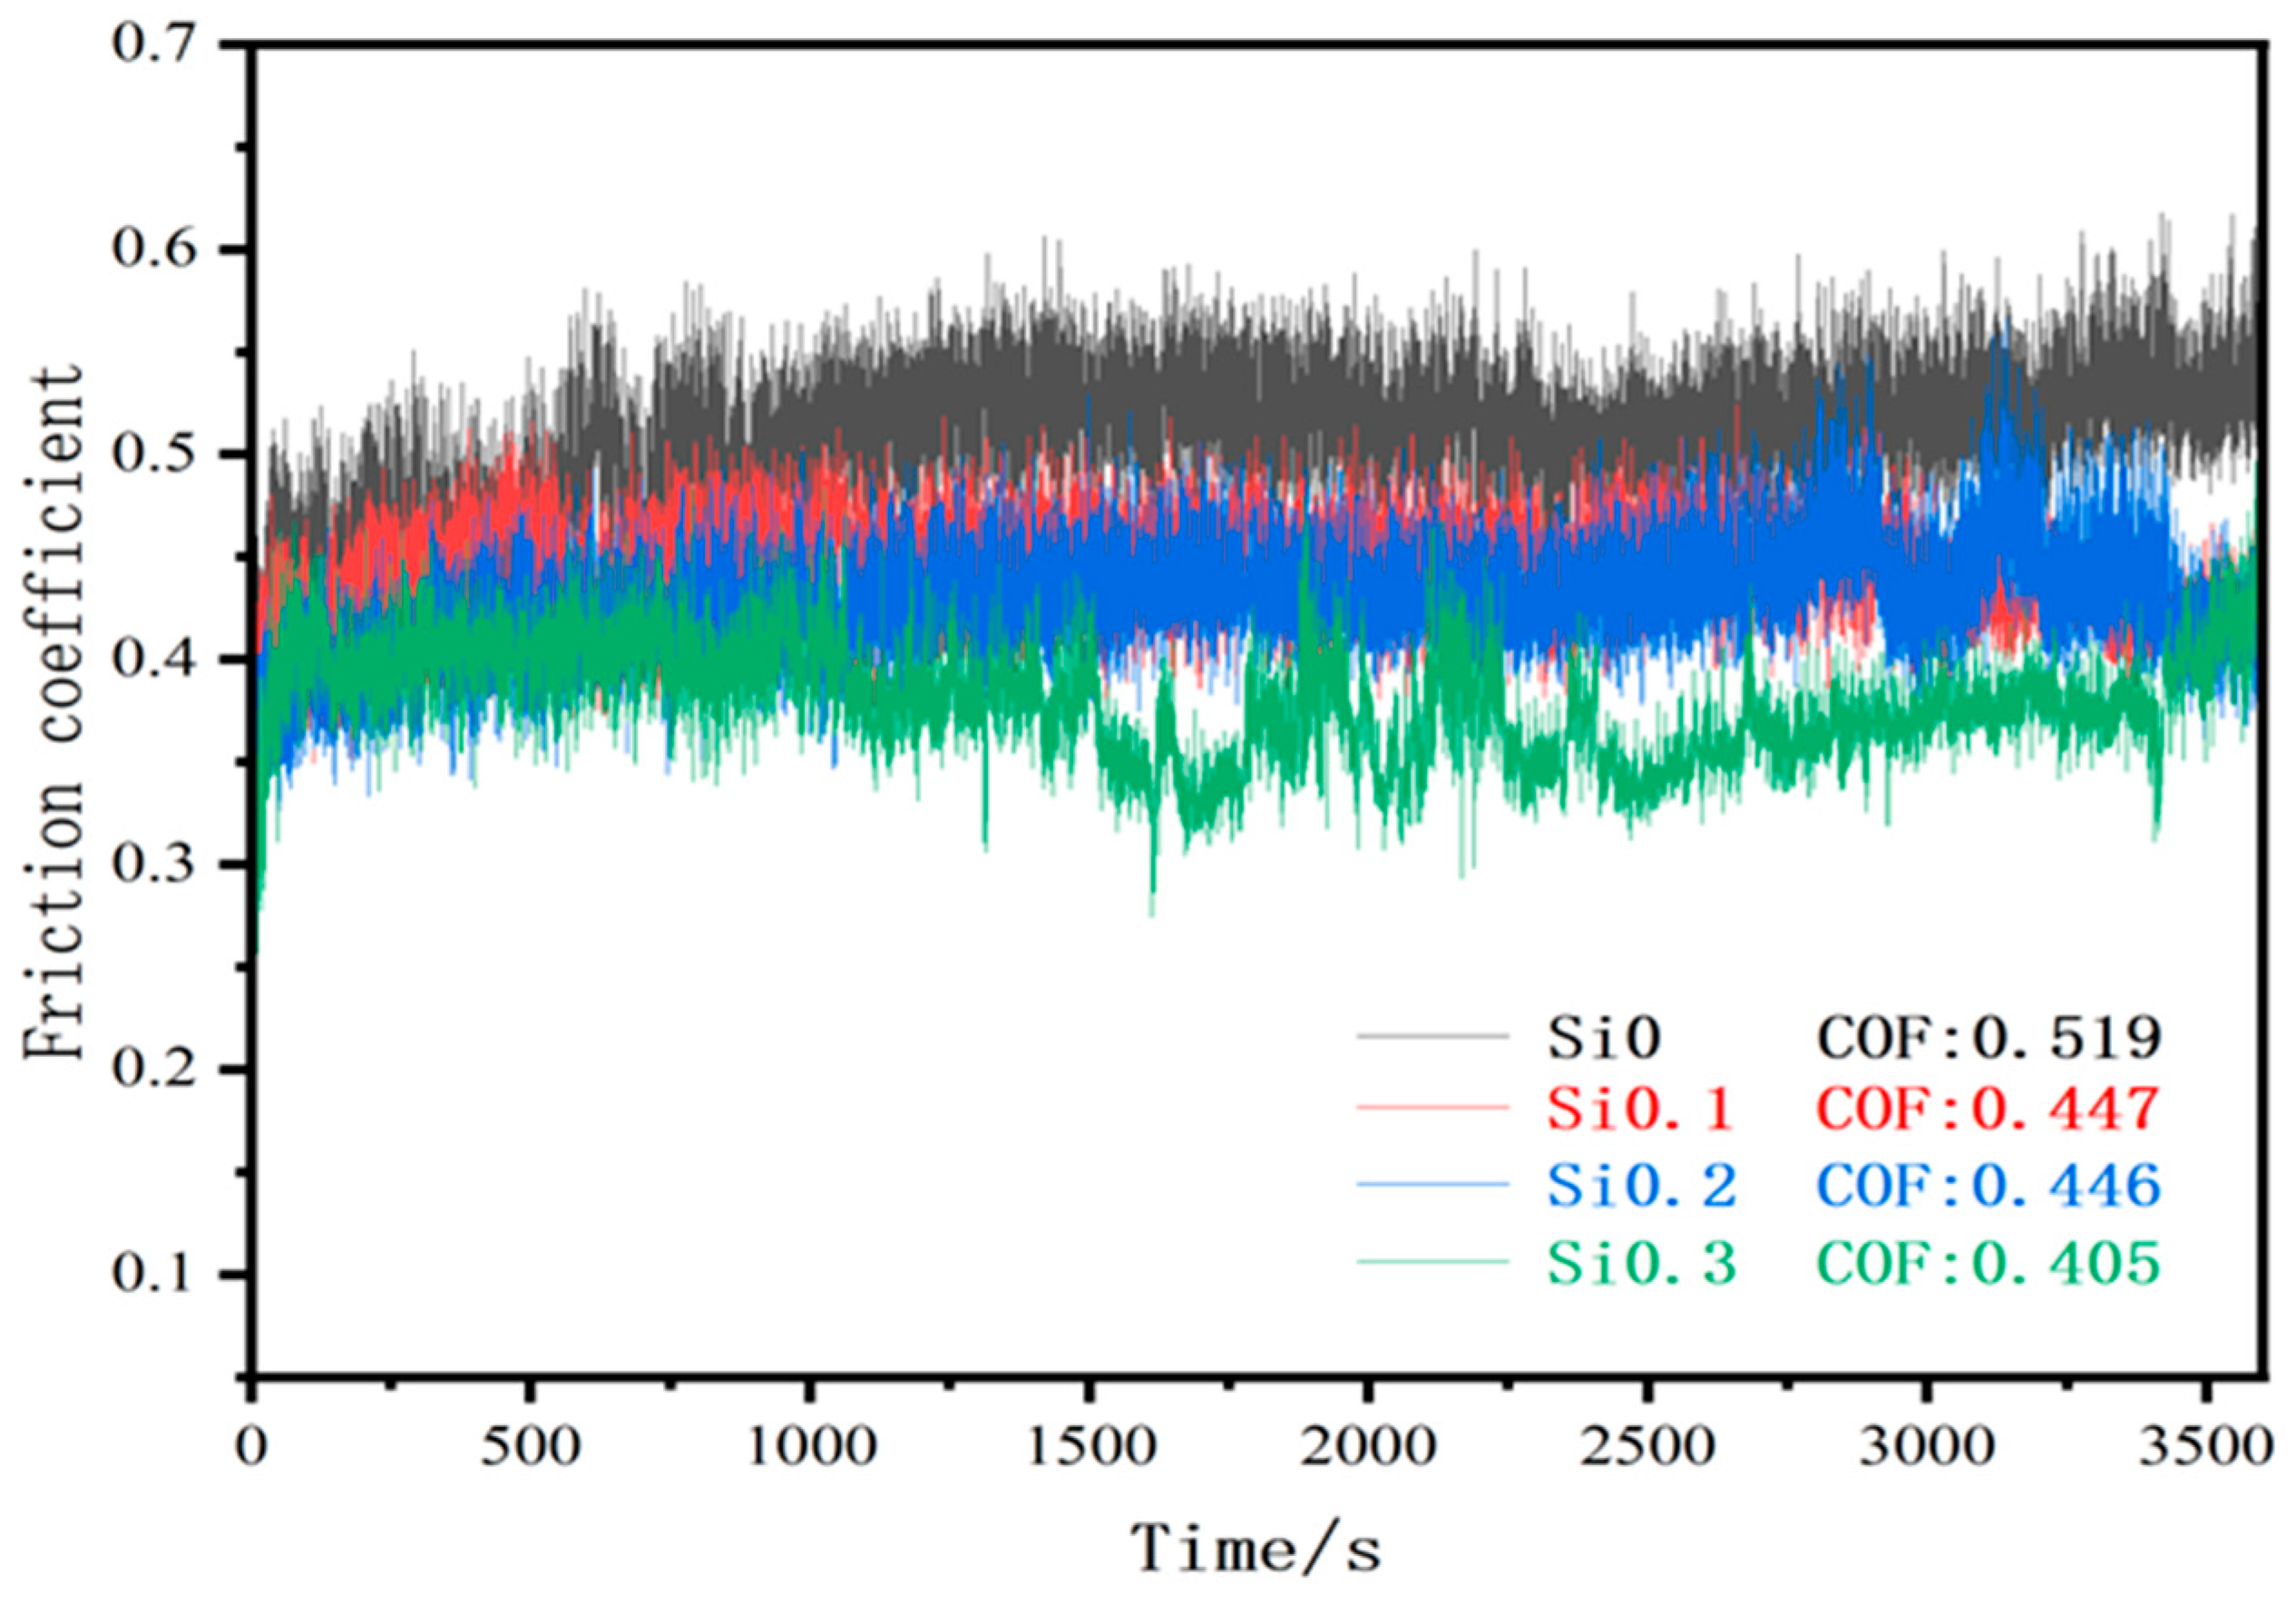
Figure 6 shows the variation curves of the coefficient of friction over time for the substrate and AlCoCrFeNi2.1Six (x = 0, 0.1, 0.2, 0.3) high-entropy alloys. As shown in the figure, during the initial wear stage, i.e., the running-in period [31], the coefficient of friction exhibits a large magnitude of fluctuation and a gradual increase, indicating a wear-in phase. This is attributed to the adhesion of wear debris particles generated in the early stages of friction and wear to the metal surface, which hinders smooth contact between the ceramic ball and the metal surface, resulting in an increased coefficient of friction. When the debris particles accumulate to a certain extent, a lubricating oxide film is formed on the surface of the high-entropy alloy due to compression and oxidation, leading to a stabilization of the friction process. The high-entropy alloys with added Si exhibit superior wear resistance compared to the base alloy. As the Si content increases, the wear rate and friction coefficient of the alloy decrease, resulting in enhanced wear resistance. The formula for calculating the wear rate of the alloy is as follows:
η = ΔV/FS
where η represents the wear rate, ΔV is the volume change (mm3), F denotes the applied normal load (N), and S is the total sliding distance (m).
WV = WW/ρ; ε = 1/WV
where WV is the volume wear (mm3), Ww is the mass loss (g), ρ is the alloy density (g/cm3), and ε represents the wear resistance (mm−3).
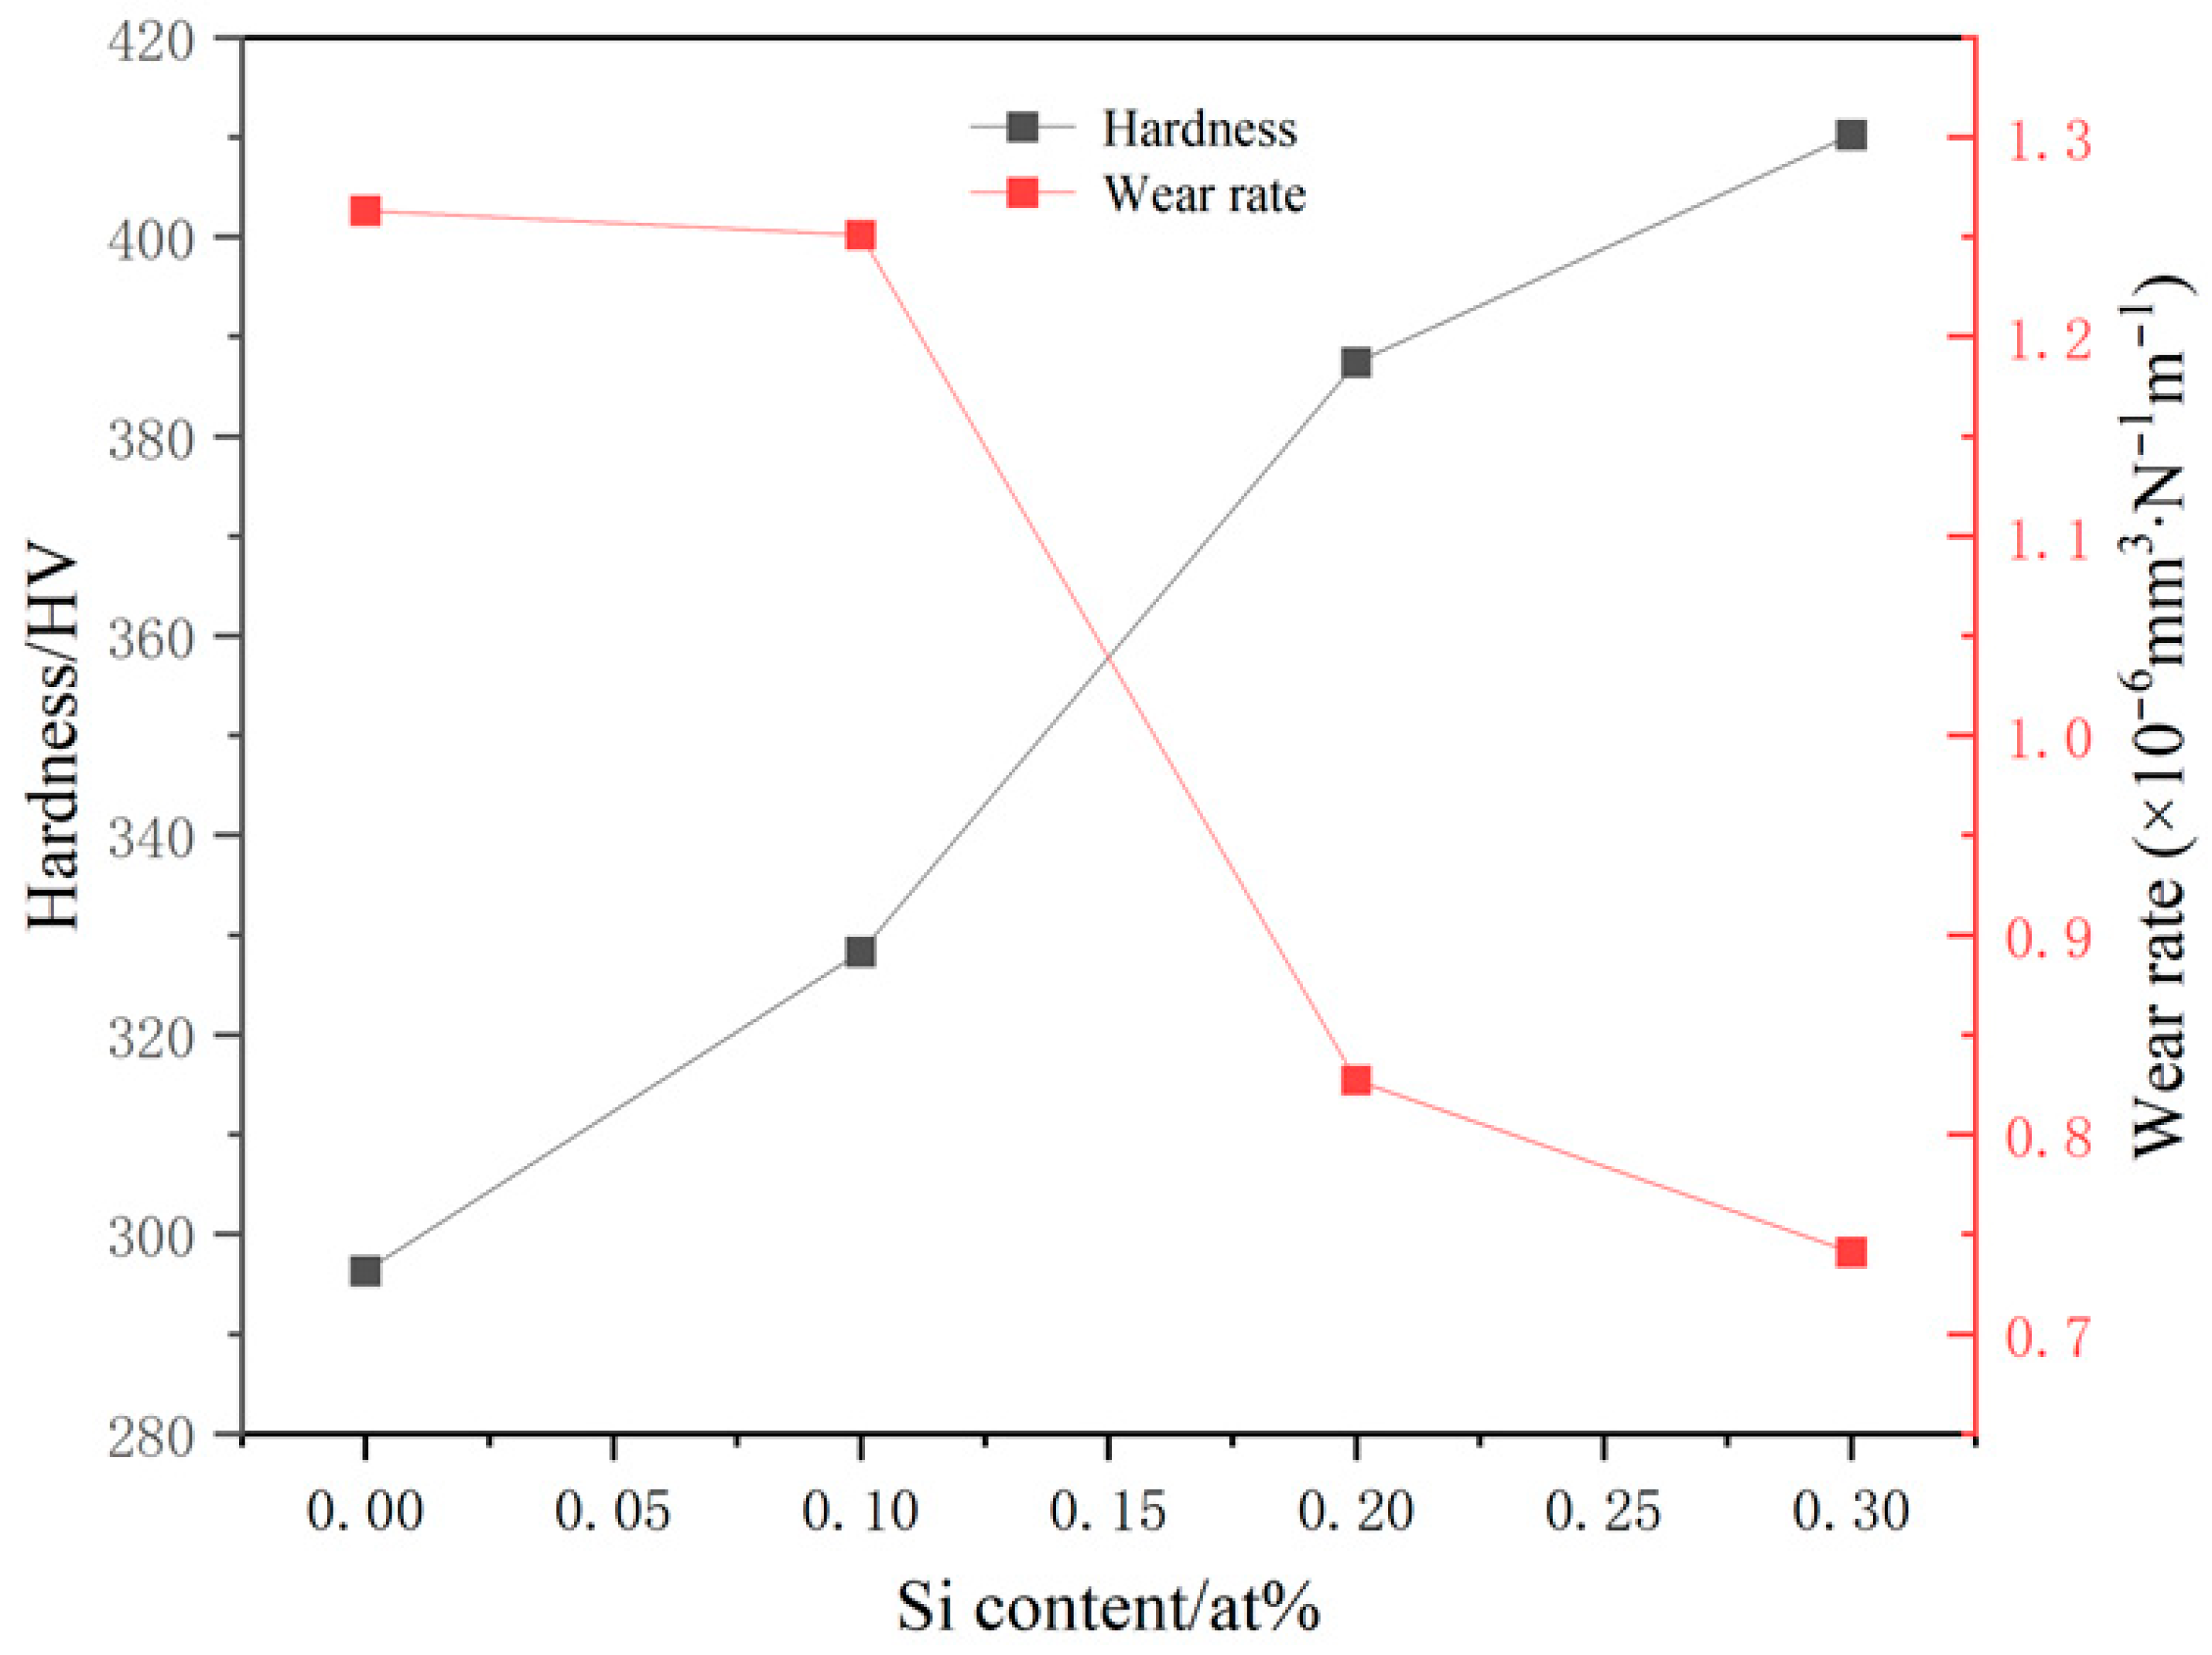
According to Figure 7, the wear volume of AlCoCrFeNi2.1Six is inversely proportional to its hardness, which is consistent with Archard’s classical theory [32]. The addition of Si induces lattice distortion in the alloy system, promoting the phase transformation from the FCC phase to the BCC phase. The incorporation of Si leads to the formation of the metallic compound, thereby increasing the alloy’s hardness. Lattice distortion can contribute to the improvement in alloy hardness to some extent by increasing the resistance to dislocation motion, and may thereby indirectly enhance its wear resistance.
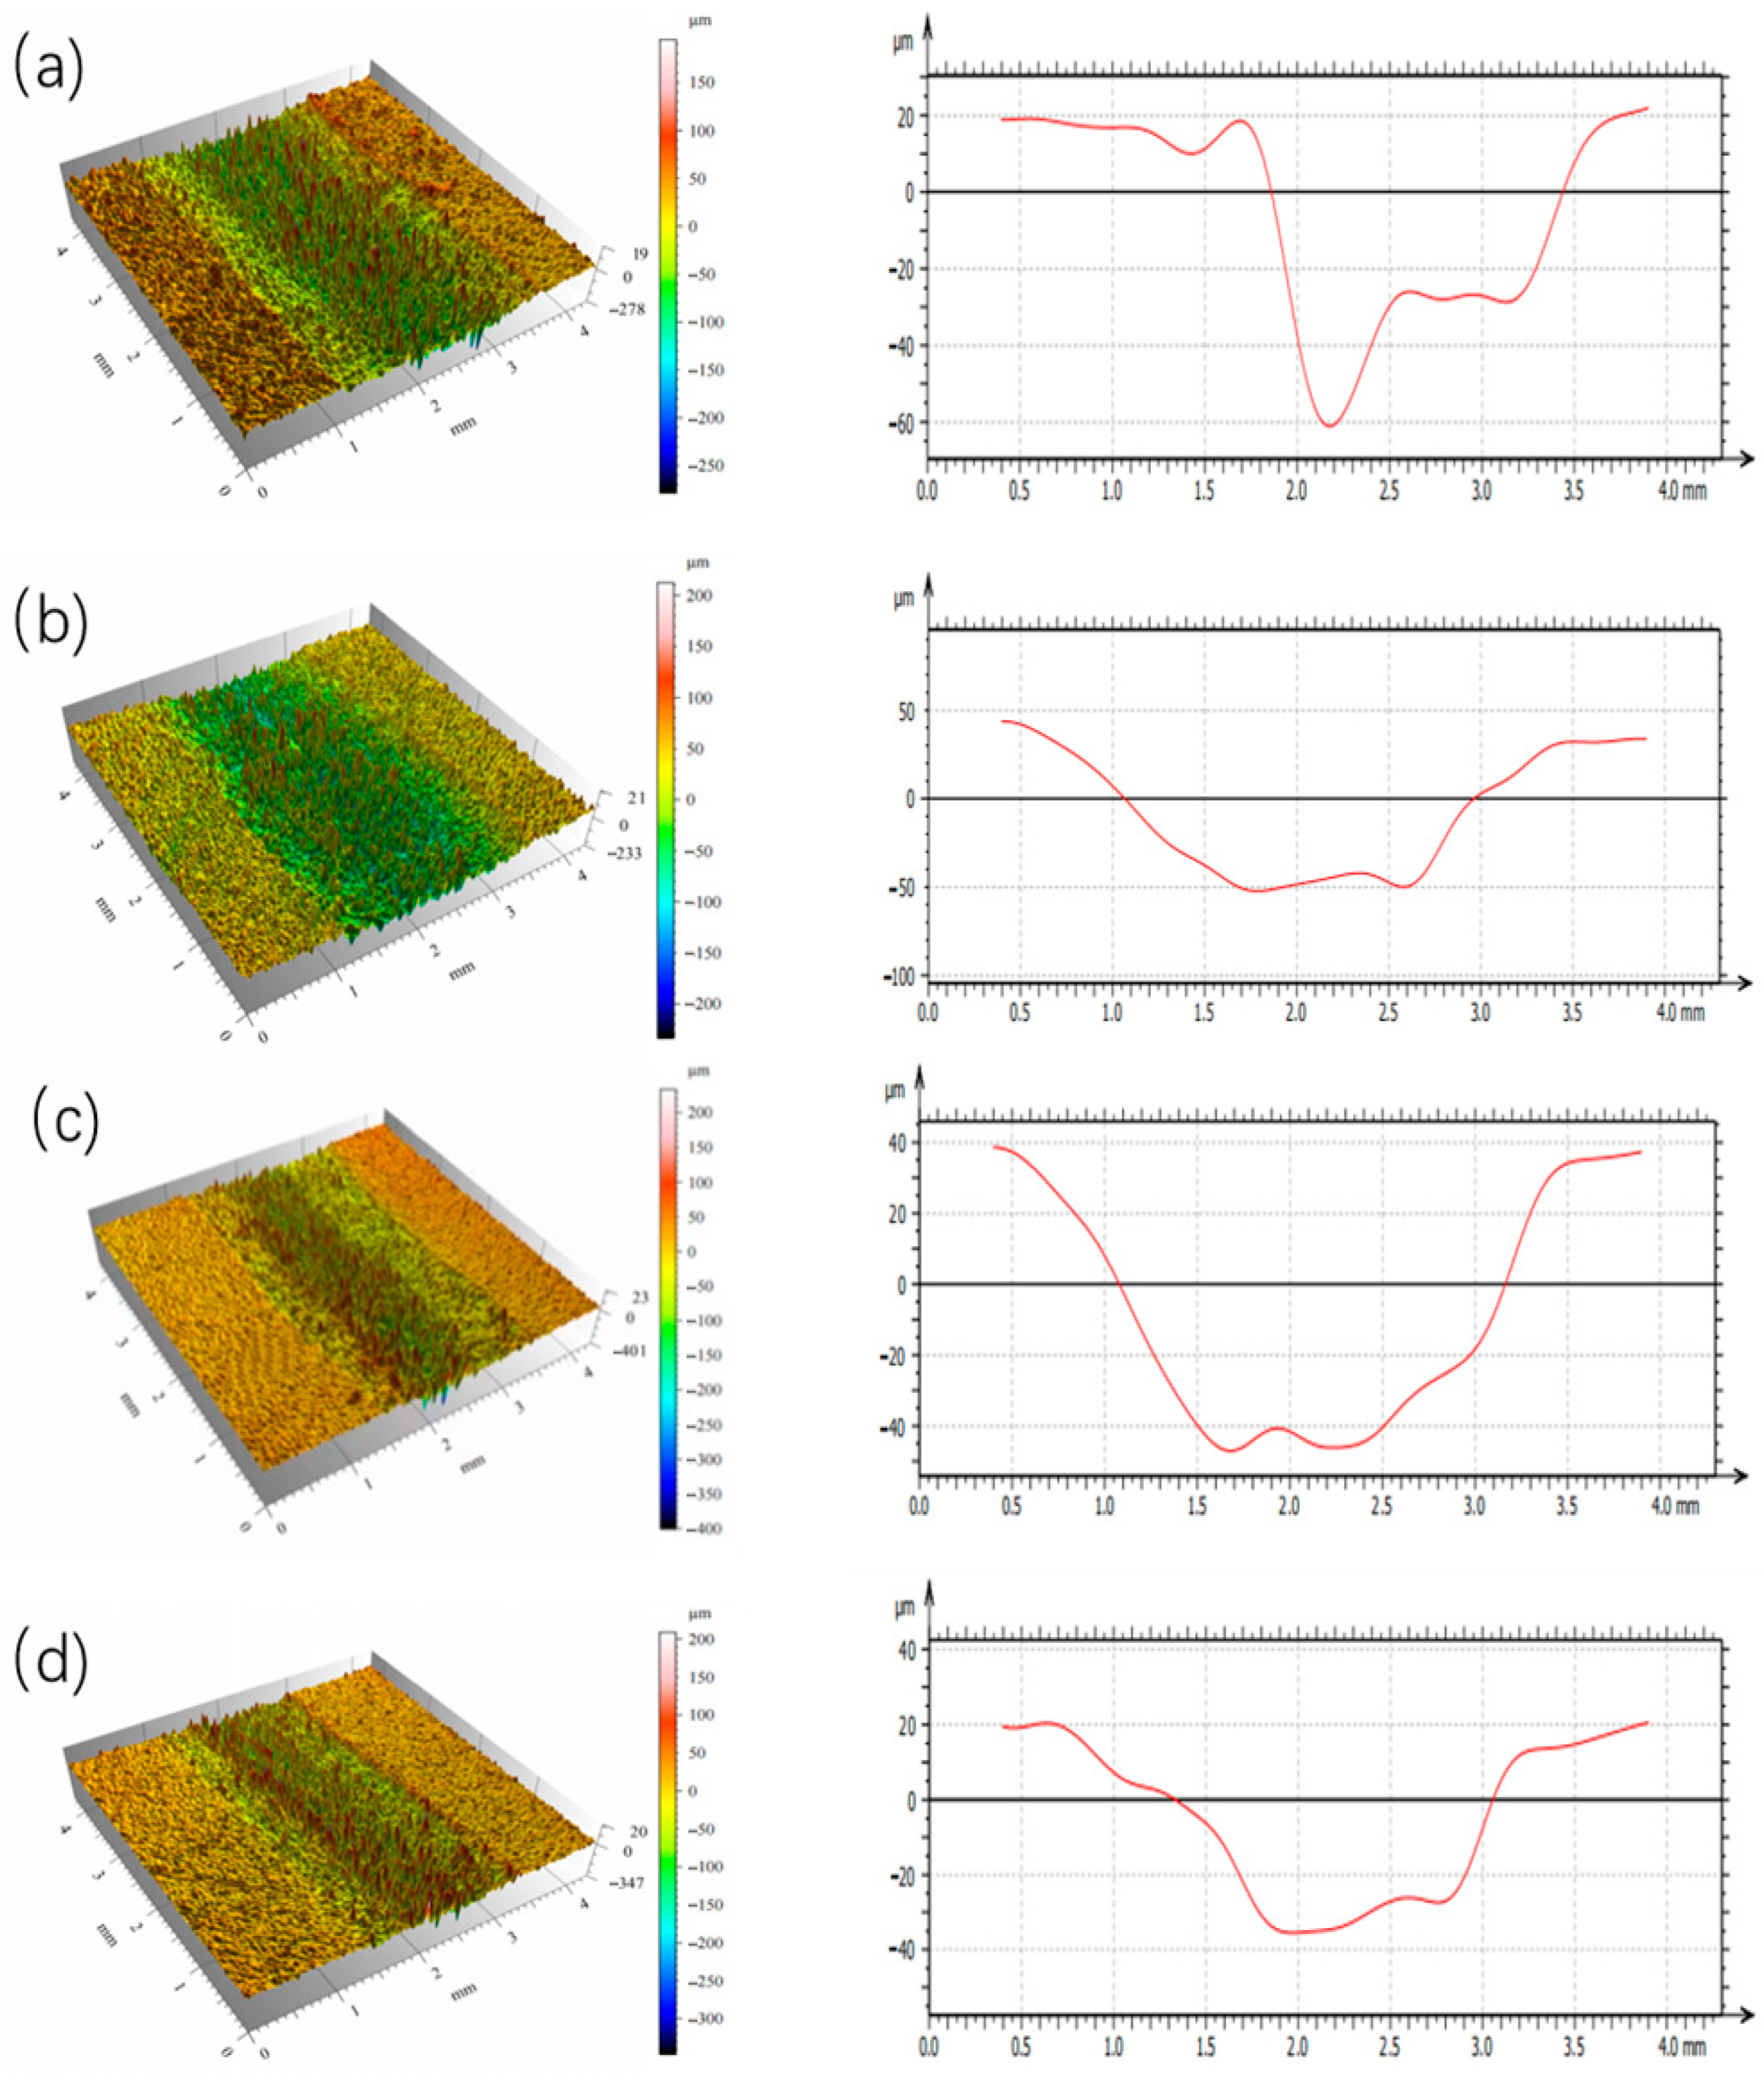
Figure 8 shows the three-dimensional wear profiles and cross-sectional profiles of AlCoCrFeNi2.1Six (x = 0, 0.1, 0.2, 0.3) high-entropy alloys. It can be seen from the three-dimensional wear profiles of the matrix that the wear scars are relatively wide, with the greatest depth and the largest wear area. With the addition of the Si element, the width and depth of the wear scars decrease, and the wear area is reduced, indicating that the Si element can improve the wear resistance of the high-entropy alloys.
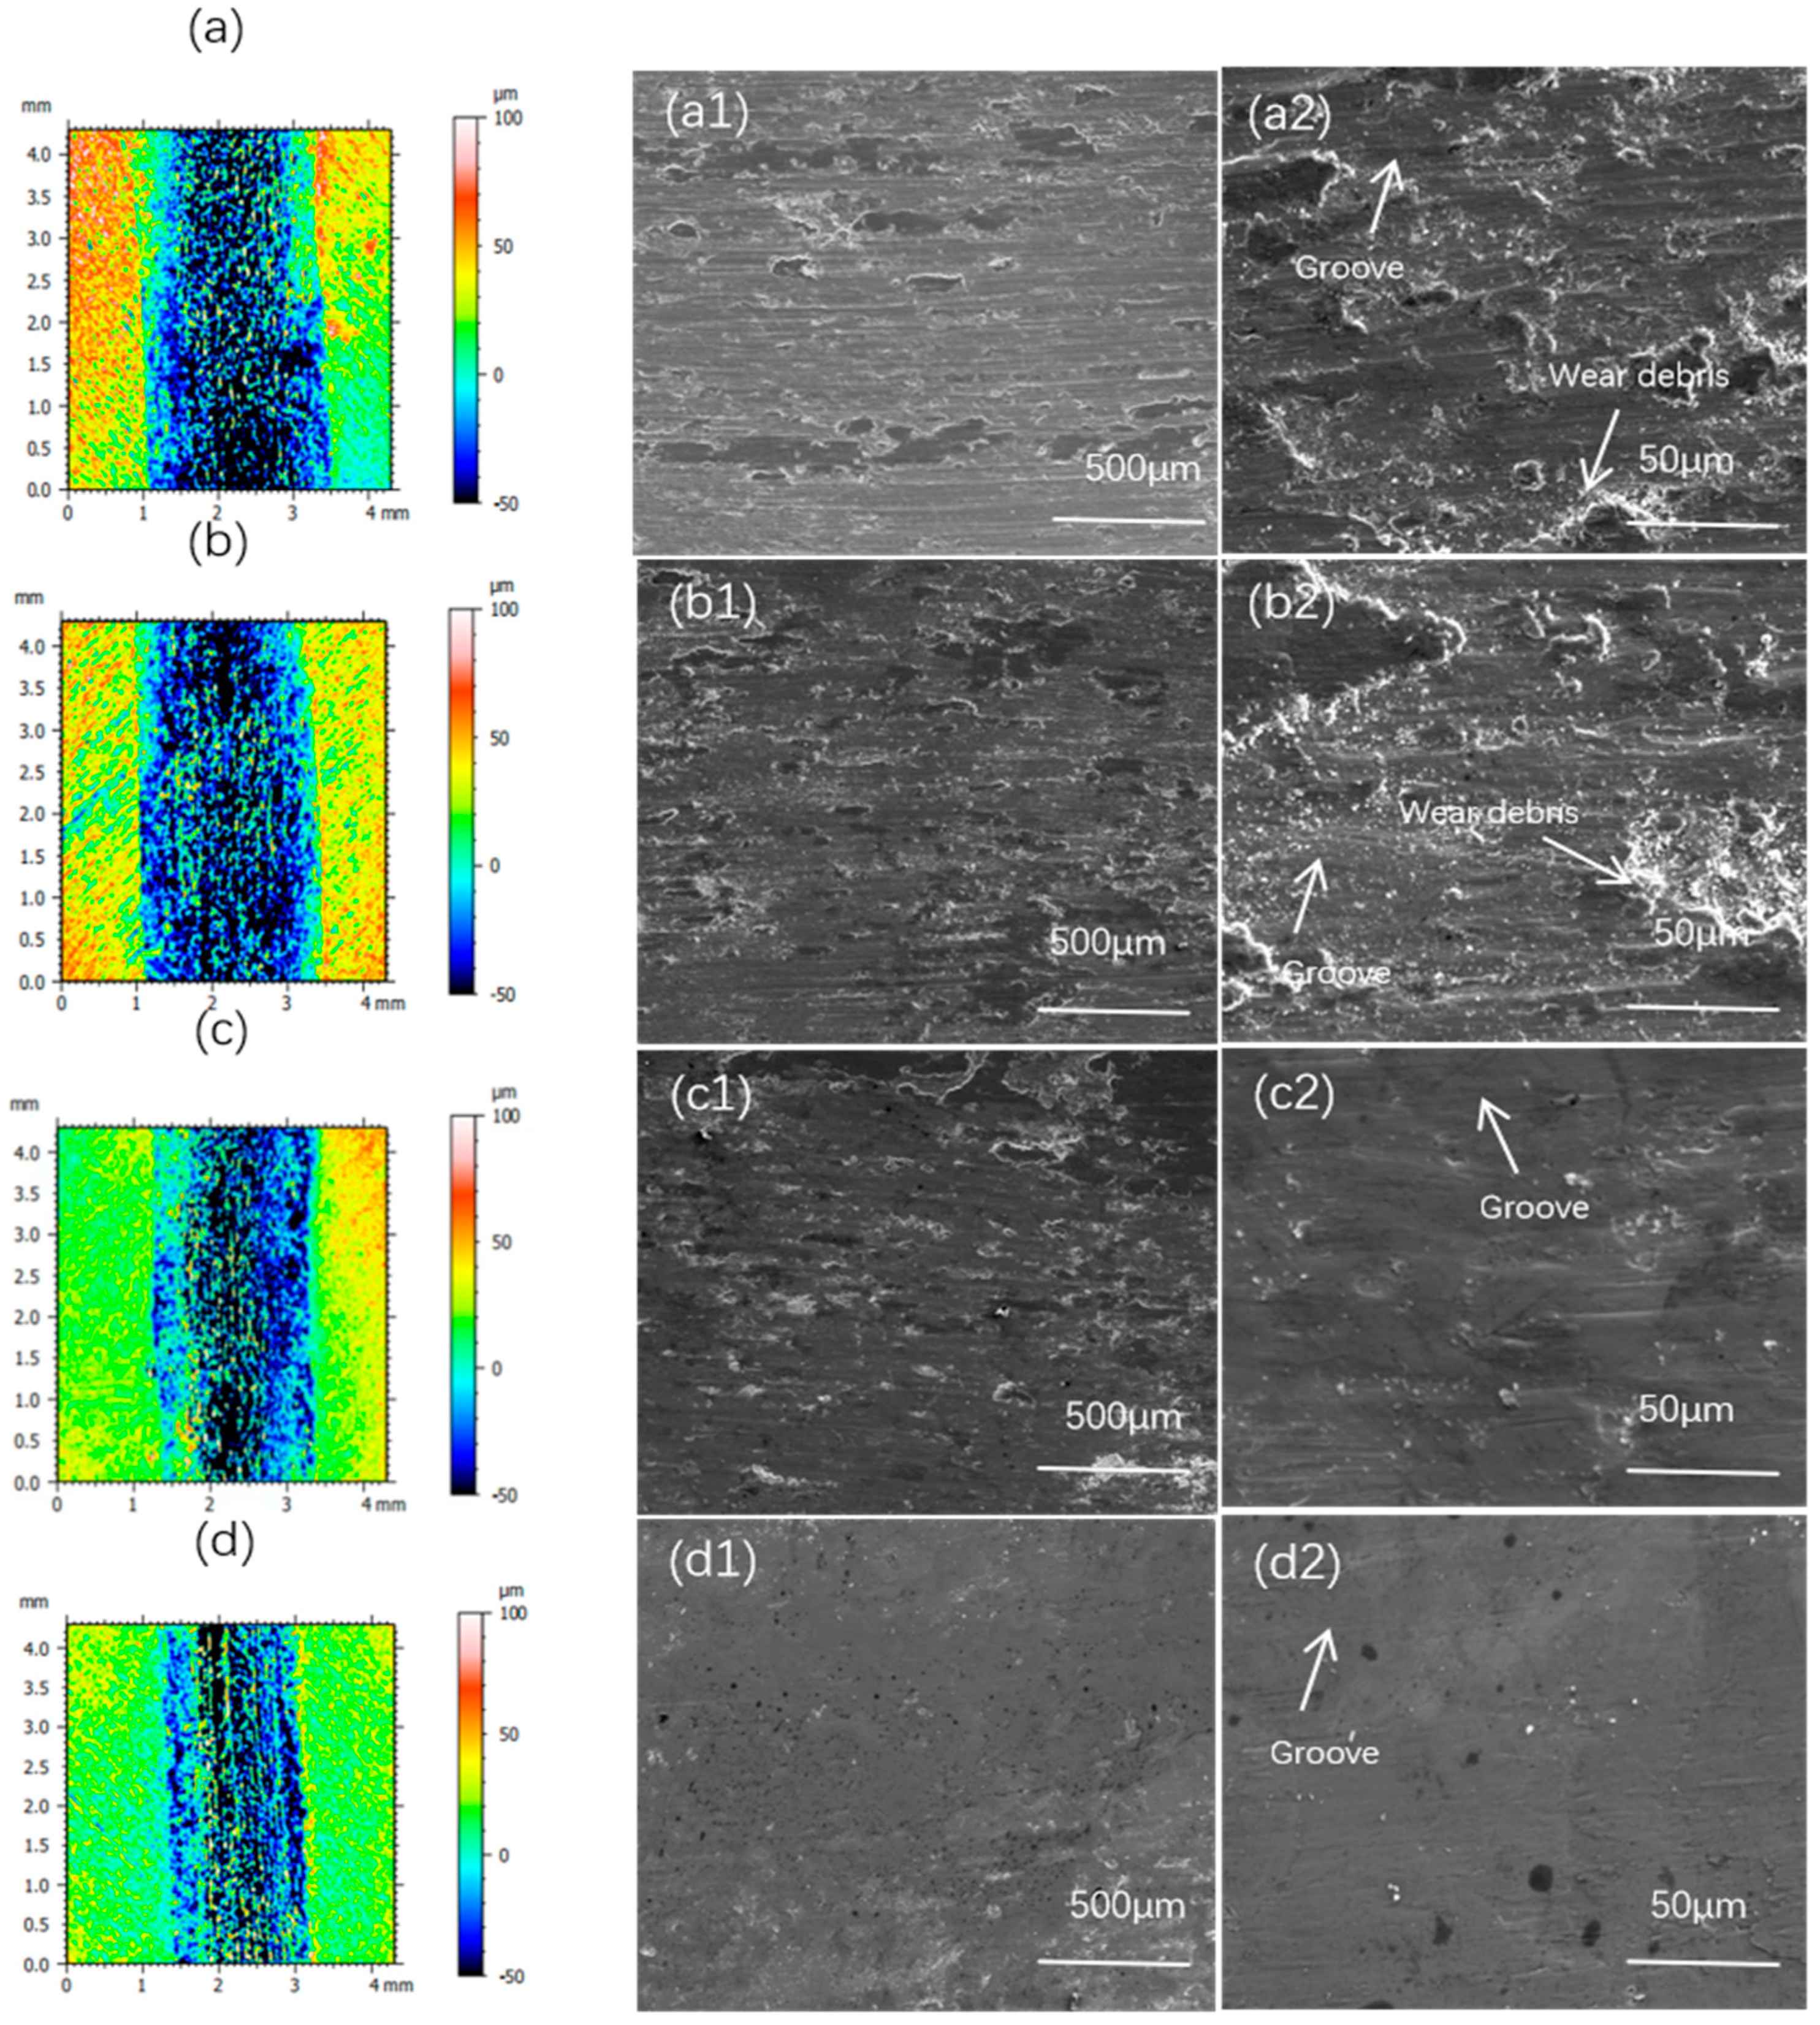
Figure 9 shows the confocal surface wear scars and SEM morphology of as-cast AlCoCrFeNi2.1Six high-entropy alloys at room temperature under friction and wear conditions. From the confocal wear scar surface images, it can be observed that the wear scar width and depth at x = 0.3 are significantly smaller than those of the first three alloys. From Figure 9a,b, it can be seen that the wear morphology of the matrix is more severe, with a large number of grooves on the surface, and that the grooves are relatively deep. Delamination is clearly observed in the images.
From Figure 9c,d, it can be seen that when the Si content is 0.2–0.3, the grooves on the worn surface are relatively deep and wide, with localized spalling, accompanied by a small number of cracks, a large amount of wear debris, and some pits. Alloys with Si contents of 0, 0.1, and 0.2 exhibit varying degrees of fine grooves and plowing marks on the surface. The dominant wear mechanism is abrasive wear. As observed from the images, a small number of cracks and partial delamination are present on the surface of the a, b, and c samples. Therefore, while abrasive wear is the primary wear mechanism, adhesive wear is also involved. When the Si content is 0.3, the alloy surface appears relatively smooth with a few protrusions, indicating the presence of adhesive wear [33,34,35,36].
Combining the data provided in Table 5, EDS analysis was performed on the delaminated regions G, H, and J in Figure 10 for high-entropy alloys with different silicon contents. It was found that with the increase in the Si content, the enrichment of the Fe element in the alloy surface increased, the content of the oxygen element was the highest, and both showed an increasing trend. The distribution of other elements such as Co, Cr, and Ni was relatively uniform. This indicates that in the wear process, in addition to the aforementioned wear mechanisms, all three alloys with different Si contents experienced oxidative wear. The reason is that during contact between the specimen and the counterpart surface, as the wear time increases, the heat generated by friction leads to the oxidation of the coating surface. The higher content of the O element indicates a thicker oxide layer. A thicker oxide layer provides protection and lubrication for the coating and also prevents direct contact between the coating surface and the counterpart surface, which can reduce the amount of material frayed between the counterpart and the coating surface [37,38], thereby improving the alloy’s wear resistance.
Furthermore, we have established a clear connection between the evolution of wear mechanisms and the increase in hardness as well as the presence of brittle silicide phases. The transition in wear mechanisms is closely related to the enhancement of alloy hardness and the formation of brittle silicide phases. As the silicon content increases, the significant improvement in alloy microhardness first enhances its resistance to micro-plowing and plastic deformation, manifesting as a reduction in the dominance of abrasive wear, with the wear tracks showing shallower and finer grooves. However, this increase in hardness primarily stems from the precipitation of numerous fine and hard silicide phases (such as CrSi2). Although these silicide phases are hard, they are inherently brittle. During the friction process, these brittle phases may undergo transgranular or intergranular fracture under shear stress, generating micron- or nanoscale hard debris. Unlike externally introduced abrasive particles, this in situ debris shares the same chemical composition as the friction pair surface, with high surface energy and matching atomic structure, resulting in high affinity with the matrix surface. They are more likely to adhere to the matrix surface through interatomic forces and, during relative sliding, cause material transfer between contact points via a “welding–tearing” cycle, thereby making adhesive wear the primary mechanism of material loss. In summary, the addition of silicon indirectly promotes the transition of the wear mechanism from direct abrasive wear to adhesive wear by increasing hardness and introducing brittle silicide phases.
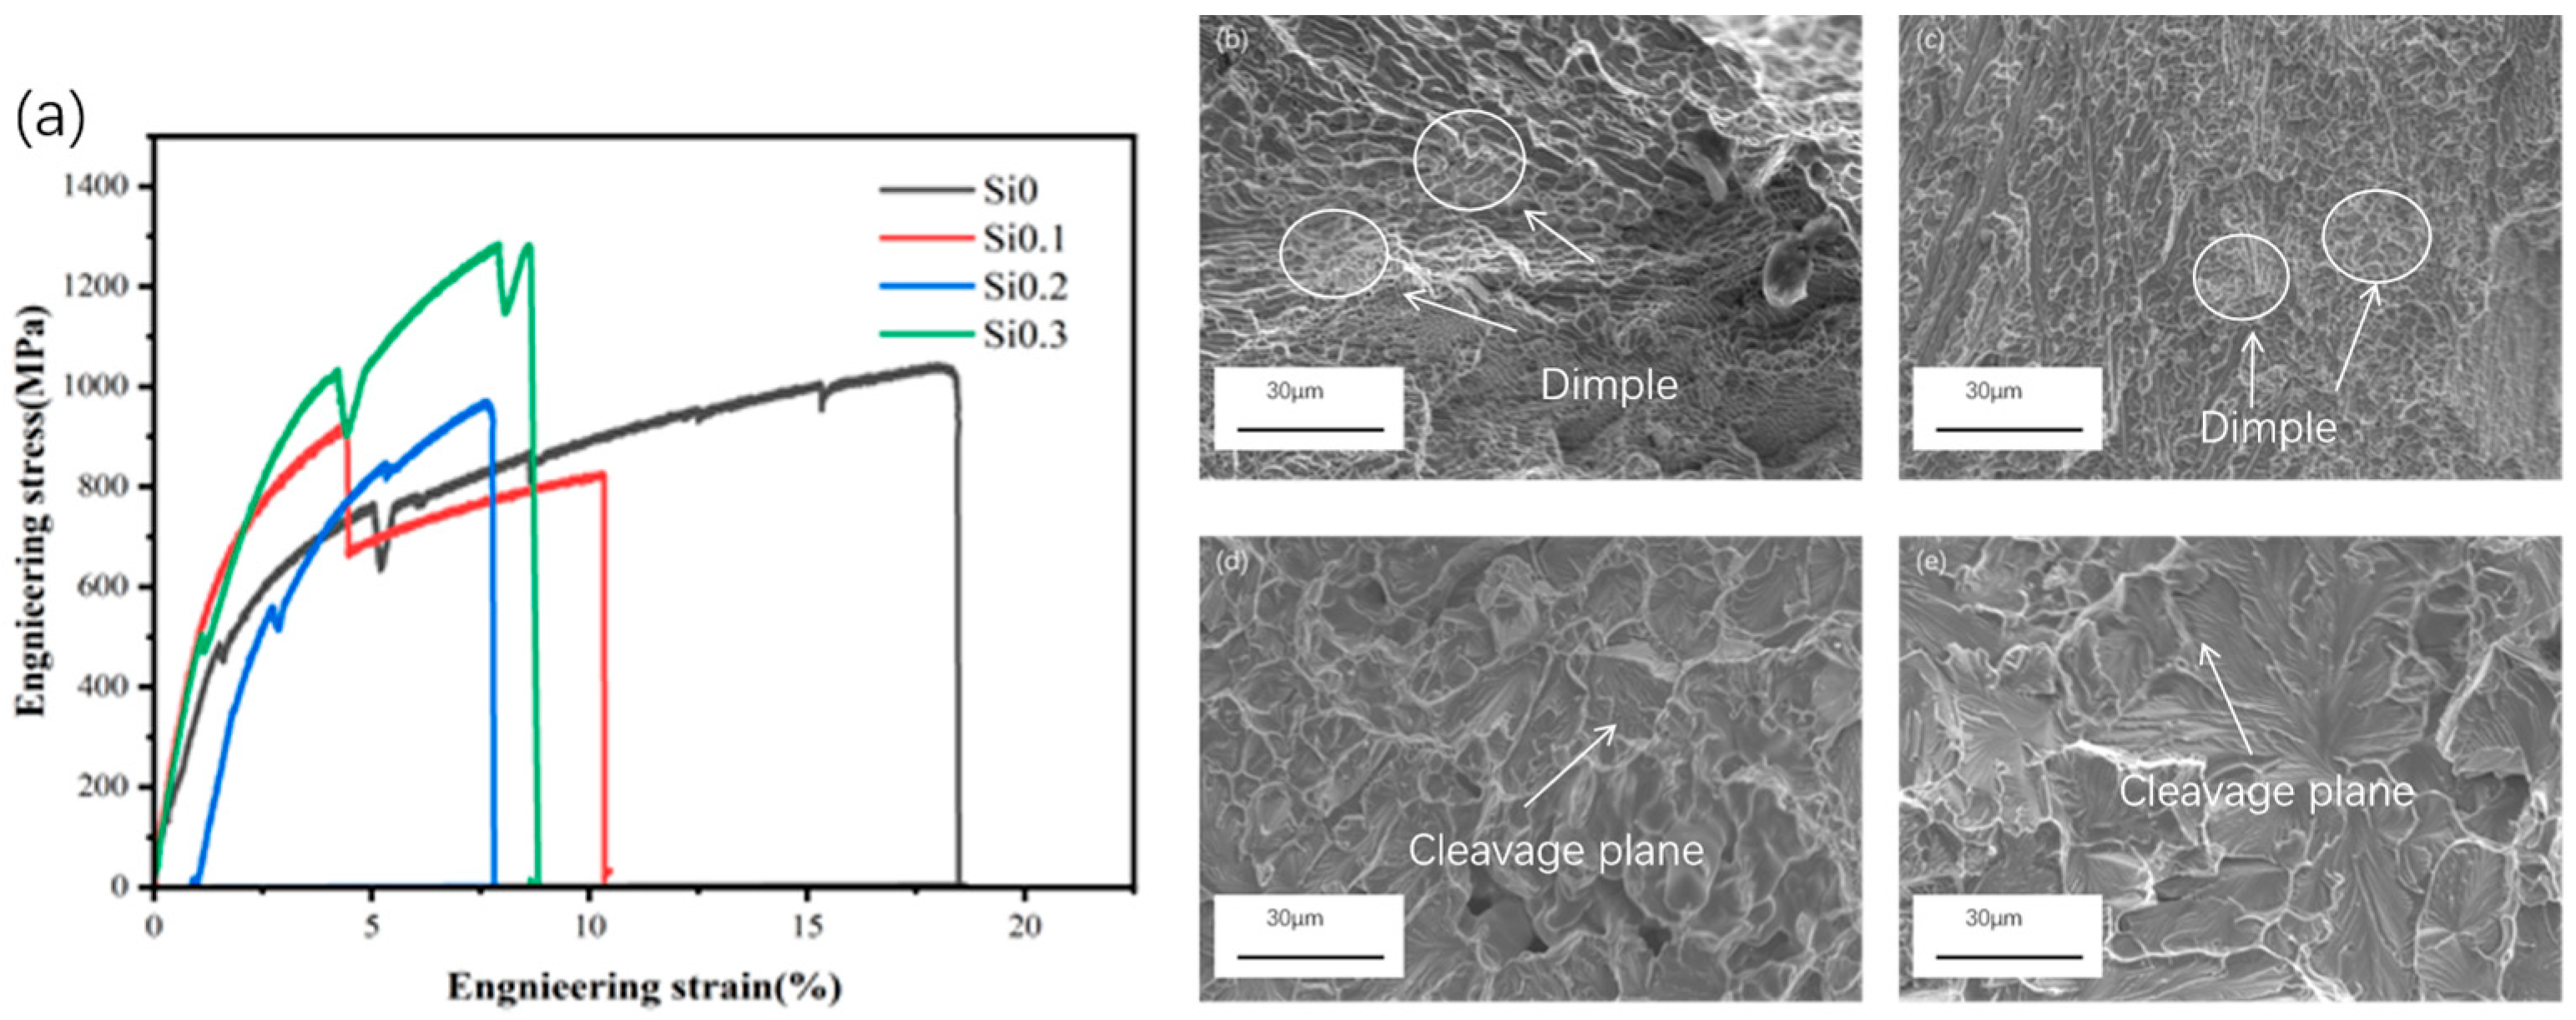
The tensile properties of each Si-containing steel sample were measured. Figure 11a shows the typical tensile curves of all samples, and the results are summarized in Table 6. According to the data in the table, the yield strength of the Si0 alloy is 516.8 MPa, the tensile strength is 1043 MPa, and the fracture elongation is 18.5%. As the Si content increases, the yield strength of the alloy gradually increases, showing a linear growth trend, while the fracture elongation decreases. When X ≤ 0.1, the tensile strength decreases, whereas in the range of 0.1 ≤ X ≤ 0.3, the tensile strength recovers. The main reason for this is the initial formation of the brittle phase, where Si atoms segregate at the eutectic phase boundary (the FCC/BCC interface), forming nanoscale brittle silicides, which hinder dislocation motion, thereby increasing the yield strength. Additionally, because some Si atoms are located at the grain boundaries, they delay necking motion, resulting in a slow recovery of tensile strength. In the phase from Si0.2 to Si0.3, the tensile strength exhibits a significant increase, primarily due to excess Si (0.3at%) triggering continuous network silicides that carry load and suppress crack propagation, resulting in elevated tensile strength and a continuous rise in yield strength. The increased silicon atoms effectively boost dislocation slip resistance through the solid solution strengthening effect.
Moreover, it was observed that distinct steps appeared on the stress–strain curves. The stress–strain curve of the Si0 sample is relatively smooth, indicating a certain plastic deformation capability. In the Si0.1 sample, distinct steps appear in the curve, representing localized instability after a certain degree of plastic deformation, leading to stress drops. For the Si0.3 sample, two clear steps are observed in the curve, at approximately 5% strain and 8–9% strain, respectively. This indicates that the material undergoes complex microstructural changes at these strain levels. The increased silicon content likely contributes to more intricate plastic deformation behavior in the material. The Si0.1 sample, with its low silicon content, facilitates easier slip along grain boundaries and dislocations. When subjected to stress, dislocation motion and crack propagation occur at an early stage. The Si0.2 sample, with a moderate silicon content, achieves a better balance between plasticity and strength, resulting in more uniform deformation and a relatively smooth stress–strain curve. In the Si0.3 sample, the higher silicon content leads to increased brittleness or phase transformation in the crystal structure, causing significant plastic instability and crack propagation at certain strain levels.
Several instances of noise were observed in the stress–strain curves. The noise observed in the tensile testing curves may primarily originate from the following aspects: (1) micro-slip between the testing machine grips and the specimen; (2) acoustic emission activity generated during plastic deformation of the multi-phase microstructure in the high-entropy alloy, such as coordinated deformation or interfacial cracking between different phases (e.g., FCC and B2 phases), which is captured by the highly sensitive load cell; or (3) minor interference from external factors such as environmental vibrations. Nevertheless, the amplitude of these noise signals is significantly smaller than the macroscopic flow stress of the material, and therefore does not compromise the accuracy of extracting key mechanical parameters from the stress–strain curves or the reliability of the conclusions.
The images in Figure 11b show the SEM morphology of alloy tensile fracture surfaces. It can be observed that the tensile fracture surface of Si0 exhibits groove-like patterns and dimples. This alloy consists of a FCC and BCC phase composition. The mixed morphology reflects the fracture behavior of the dual-phase structure: the FCC phase undergoes plastic deformation to form dimples, while the BCC phase fractures in a cleavage mode, resulting in groove-like patterns. The ductile deformation capability of the FCC phase leads to microvoid coalescence and dimple formation, whereas the cleavage fracture of the BCC phase produces river-like patterns. Stress concentration at the interface between the two phases causes changes in the crack propagation path. Furthermore, based on the matrix, the micro-morphology of Si0 is dominated by parabolic shear dimples, indicating that the fracture mode of Si0 is primarily shear fracture. Two types of dimples are observed in the SEM morphology of Si0.1: equiaxed dimples and shear dimples. Short grooves are distributed in the brittle region, primarily due to the effect of solid solution strengthening from Si, and a small number of cleavage facets are formed in the brittle phase. In Si0.2, the grooves have completely disappeared, and the alloy microstructure exhibits a pattern characterized by numerous flat cleavage planes and river patterns, indicating a predominantly brittle fracture mode [39,40]. Additionally, some small pits can be observed on the cleavage facets, which are mainly shallow dimples formed by the localized plasticity of the residual FCC phase.
In comparison, the dimple density in the Si0.3 sample is relatively low. This microstructural difference corresponds to their respective mechanical properties; the lower dimple density in the Si0.3 sample limits its plastic deformation capacity during tensile loading, resulting in a lower fracture elongation [41]. Moreover, more large-sized flat cleavage planes and river patterns are found in Si0.3, indicating that the fracture mechanism is dominated by complete cleavage fracture.
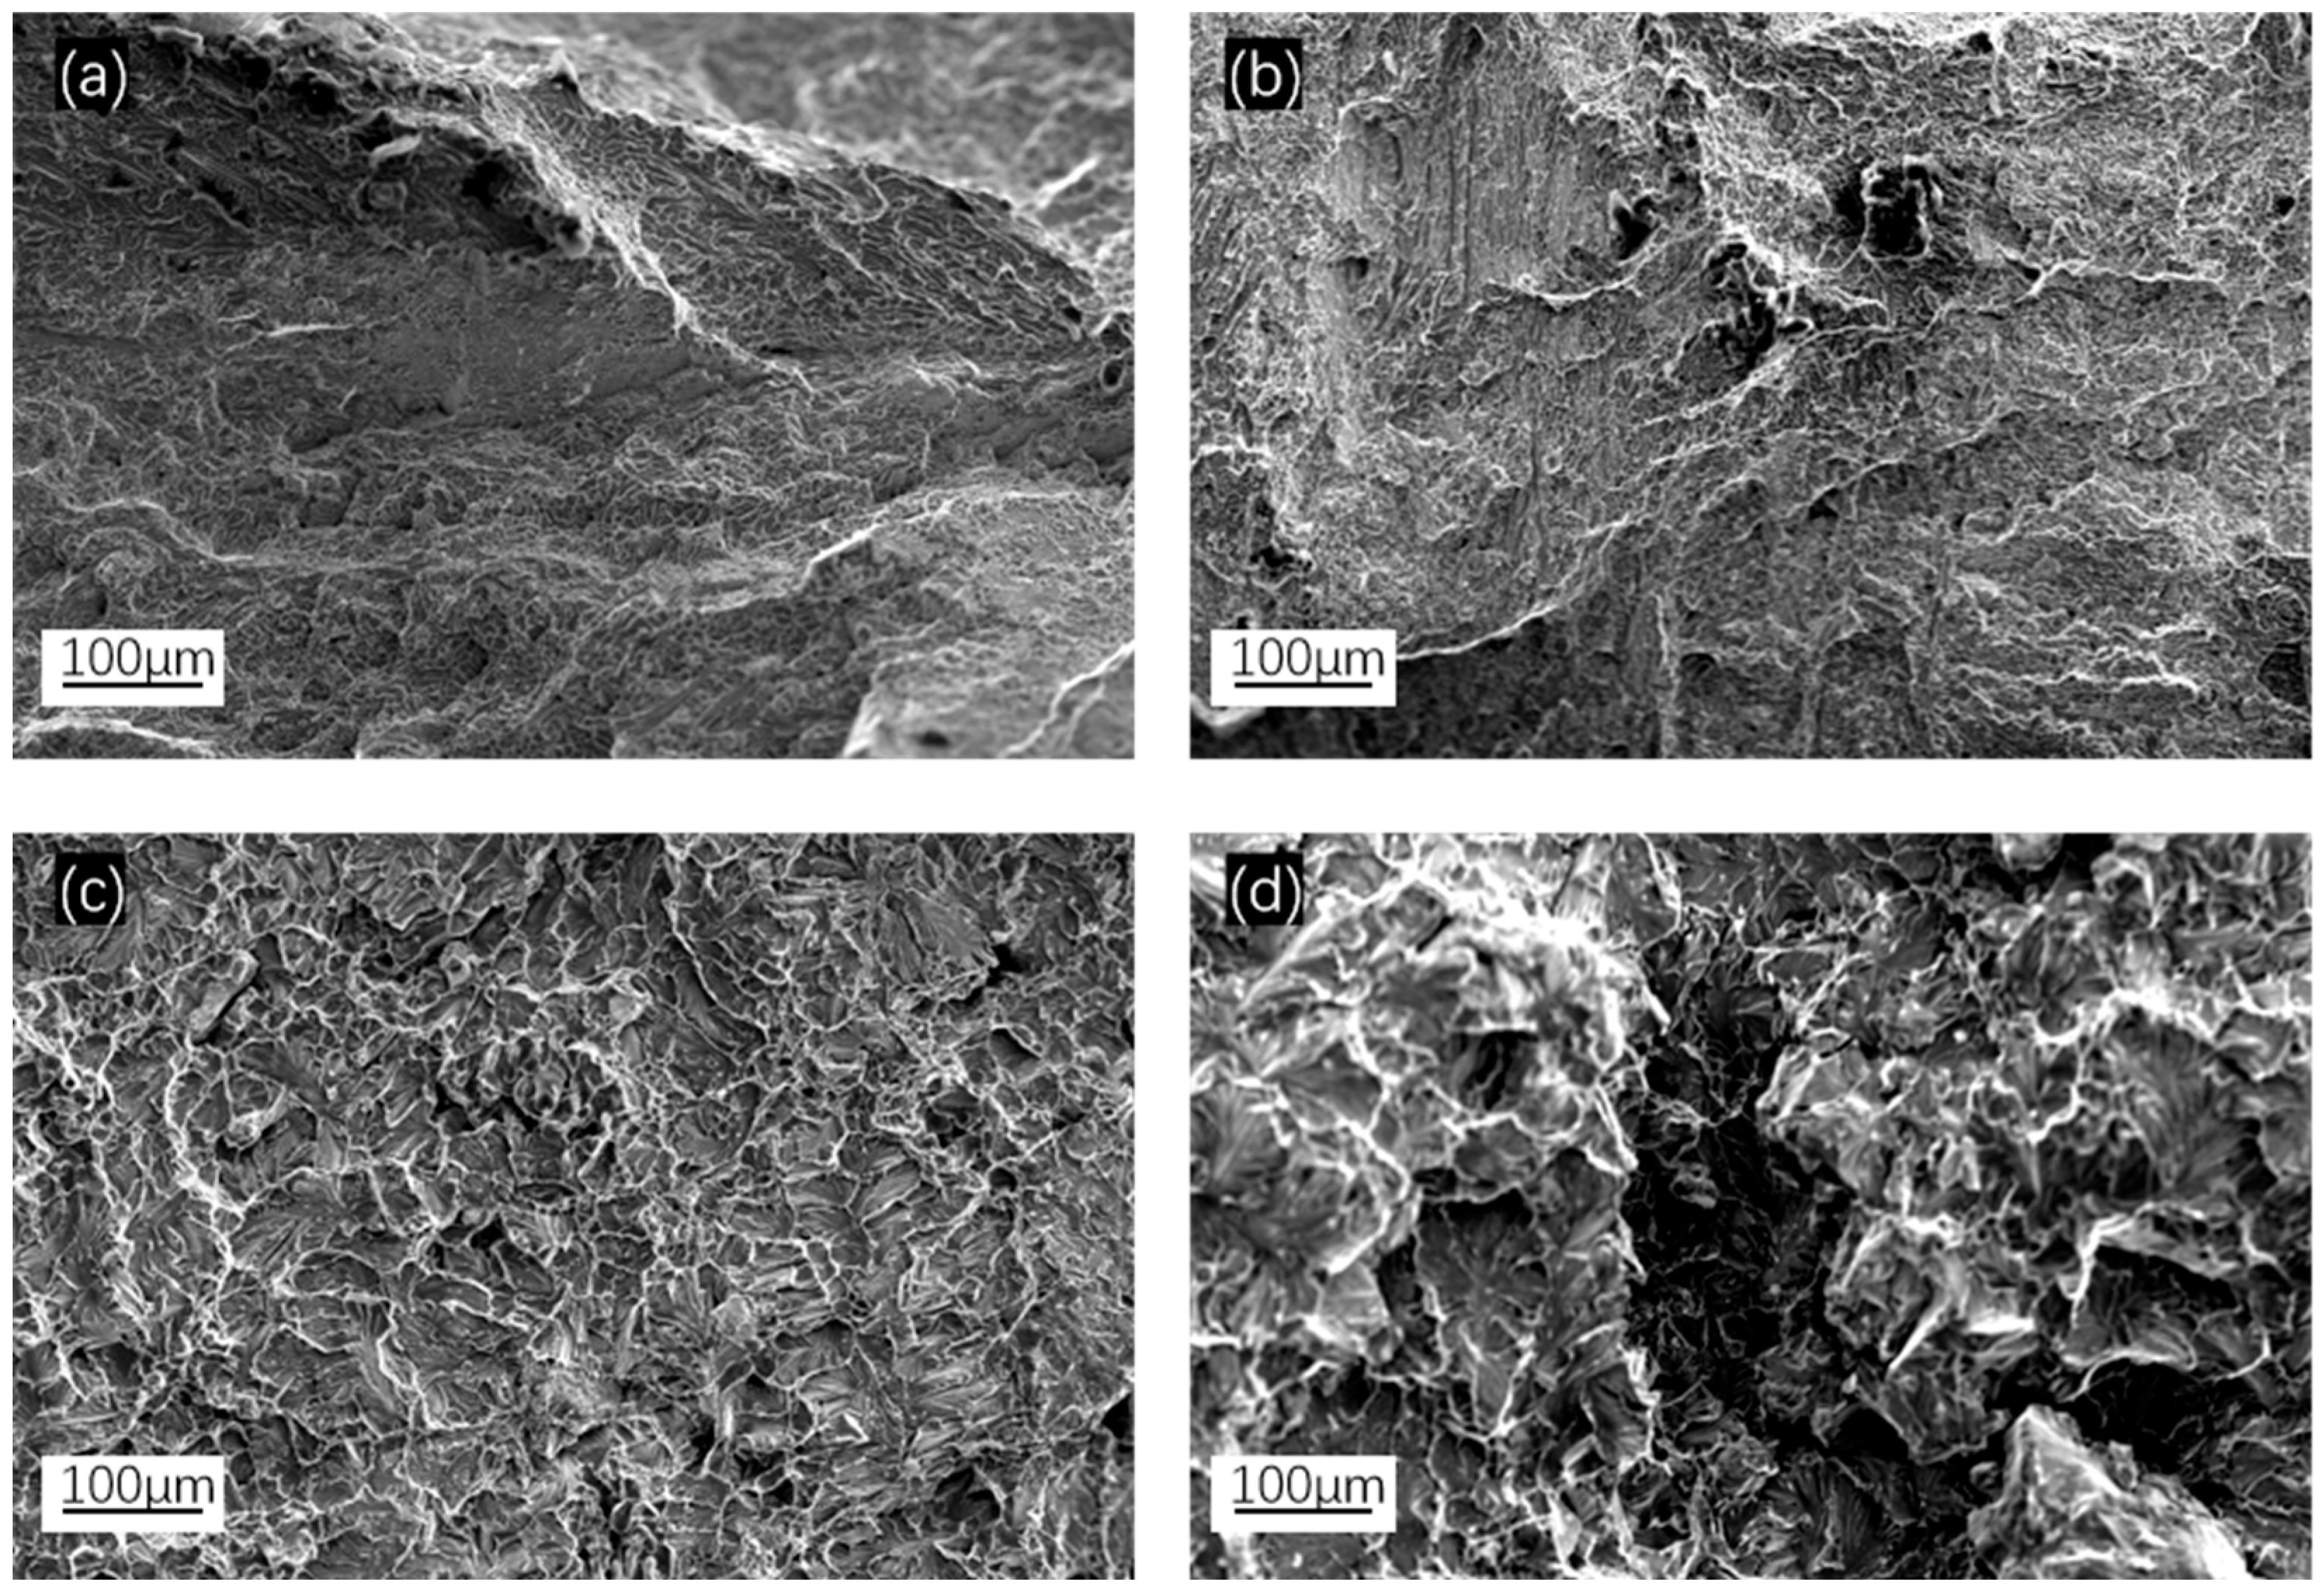
The images in Figure 12 show the SEM morphology of alloys’ tensile fracture surfaces. Based on their distinct contrast and morphology, combined with EDS analysis results from this study, these features are likely Si-rich particles or phases [42]. These particles are most prominent in the Si0.2 and Si0.3 alloys, while in the Si0.1 alloy, they appear considerably finer and less distinct.

4. Conclusions

This study systematically elucidates how silicon Si, as a key micro-alloying element, achieves the synergistic optimization of mechanical properties in the classic AlCoCrFeNi2.1 eutectic high-entropy alloy by regulating its phase composition and microstructure.
1. All alloys maintained a dual-phase FCC + BCC structure. As the Si content increased, the volume fraction of the BCC phase progressively rose, while the microstructure evolved from a regular lamellar morphology (x = 0) to dendritic (x = 0.1, 0.2), and finally formed a network structure (x = 0.3);
2. When x ≥ 0.3, a CrSi2 silicide phase precipitated in the alloy. EDS analysis revealed the co-segregation of Al, Co, Fe, and Ni in the matrix region, while Cr and Si co-segregated in the precipitated phase region. This confirms that Si disrupts the original phase equilibrium, driving elemental redistribution and reconstructing the phase separation mechanism;
3. The microhardness increased with rising Si content, reaching 410.2 HV at x = 0.3—a 40% improvement compared to the 296.3 HV of the base alloy (x = 0). The friction coefficient decreased from 0.519 to 0.405. This performance enhancement stems from the synergistic effect of solid solution strengthening via Si and second phase strengthening via CrSi2;
4. The yield strength continuously increased with the Si content, rising from 516.8 MPa (x = 0) to 686.6 MPa (x = 0.3). In contrast, the ultimate tensile strength and fracture elongation first decreased and then slightly increased. At x = 0.2 and 0.3, although the yield strength significantly improved (>550 MPa), the fracture elongation dropped drastically from 18.5% (x = 0) to 8.79% (x = 0.3), indicating an almost complete loss of plasticity. The fracture mechanism shifted from predominantly shear fracture (x = 0) to mixed fracture, then to quasi-cleavage, and finally to fully cleavage-dominated fracture at x = 0.3. The AlCrFeCoNi2.1Si0.3 alloy demonstrated relatively excellent comprehensive mechanical properties, although excessive Si may induce brittle phases.

Author Contributions

Conceptualization, R.L. and S.L.; methodology, R.L. and S.L.; software, S.L.; validation, R.L., J.Z., and J.T.; formal analysis, R.L. and S.L.; investigation, R.L. and S.L.; resources, S.L. and J.Z.; data curation, J.Z. and J.T.; writing—original draft preparation, S.L.; writing—review and editing, R.L.; visualization, R.L. and S.L.; supervision, R.L.; project administration, R.L.; funding acquisition, R.L. All authors have read and agreed to the published version of the manuscript.

Funding

This research was funded by the National Natural Science Foundation of China (NSFC) Joint Fund Priority Program (U23A20607), and the Shanghai Engineering Research Center of Hot Manufacturing (18DZ2253400).

Data Availability Statement

The original contributions presented in this study are included in the article. Further inquiries can be directed to the corresponding author.

Conflicts of Interest

The authors declare no conflicts of interest.

References

  1. Yeh, J.W.; Chen, S.K.; Lin, S.J.; Gan, J.Y.; Chin, T.S.; Shun, T.T.; Tsau, C.H.; Chang, S.Y. Nanostructured High-Entropy Alloys with Multiple Principal Elements: Novel Alloy Design Concepts and Outcomes. Adv. Eng. Mater. 2004, 6, 299–303. [Google Scholar] [CrossRef]
  2. Cantor, B.; Chang, I.T.H.; Knight, P.; Vincent, A.J.B. Microstructural development in equiatomic multicomponent alloys. Mater. Sci. Eng. 2004, 375–377, 213. [Google Scholar] [CrossRef]
  3. Fu, Y.; Li, J.; Luo, H.; Du, C.; Li, X. Recent advances on environmental corrosion behavior and mechanism of high-entropy alloys. J. Mater. Sci. Technol. 2021, 80, 217–233. [Google Scholar] [CrossRef]
  4. Li, W.; Liaw, P.K.; Gao, Y. Fracture resistance of high entropy alloys: A review. Intermetallics 2018, 99, 69–83. [Google Scholar] [CrossRef]
  5. Abid, T.; Akram, M.A.; Yaqub, T.B.; Karim, M.R.A.; Fernandes, F.; Zafar, M.F.; Yaqoob, K. Design and development of porous CoCrFeNiMn high entropy alloy (Cantor alloy) with outstanding electrochemical properties. J. Alloys Compd. 2024, 970, 172633. [Google Scholar] [CrossRef]
  6. Lu, Y.; Dong, Y.; Guo, S.; Jiang, L.; Kang, H.J.; Wang, T.M.; Wen, B.; Wang, Z.J.; Jie, J.C.; Cao, Z.Q.; et al. A promising new class of high-temperature alloys: Eutectic high-entropy alloys. Sci. Rep. 2014, 4, 6200. [Google Scholar] [CrossRef] [PubMed]
  7. Wan, S.; Ma, P.; Yang, H.; Zhang, N.; Fang, Y.; Jia, Y.; Prashanth, K.G. Research Progress on Composition Design of Multicomponent Eutectic High Entropy Alloys. Trans. Indian Inst. Met. 2024, 77, 1455–1465. [Google Scholar] [CrossRef]
  8. Peng, P.; Feng, X.; Li, S.; Wei, B.; Zhang, M.; Xu, Y.; Zhang, X.; Ma, Z.; Wang, J. Effect of heat treatment on microstructure and mechanical properties of as-cast AlCoCrFeNi2.1 eutectic high entropy alloy. J. Alloys Compd. 2023, 939, 168843. [Google Scholar]
  9. Liang, N.N.; Xu, R.R.; Wu, G.Z.; Gao, X.Z.; Zhao, Y.H. High thermal stability of nanocrystalline FeNi2CoMo0.2V0.5 high-entropy alloy by twin boundary and sluggish diffusion. Mater. Sci. Eng. A 2022, 848, 143399. [Google Scholar] [CrossRef]
  10. Wan, D.; Guan, S.; Wang, D.; Lu, X.; Ma, J. Hydrogen embrittlement of additively manufactured AlCoCrFeNi2.1 eutectic high-entropy alloy. Corros. Sci. 2022, 195, 110007. [Google Scholar] [CrossRef]
  11. Cao, L.; Lin, X.; Zhang, Z.; Bai, M.; Wu, X. Effect of hot deformation and heat treatment on the microstructure and properties of spray-formed Al-Zn-Mg-Cu alloys. Metals 2024, 14, 451. [Google Scholar] [CrossRef]
  12. Peng, Z.; Guo, Q.; Sun, J.; Li, K.; Luan, H.; Gong, P. Effect of Mo Addition on Tribological Properties of Al19Fe20−xCo20−xNi41Mo2x Eutectic High-Entropy Alloys. Rare Met. Mater. Eng. 2024, 53, 17–22. [Google Scholar]
  13. Dong, Y.; Lu, Y. Effects of tungsten addition on the microstructure and mechanical properties of near-eutectic AlCoCrFeNi2 high-entropy alloy. J. Mater. Eng. Perform. 2018, 27, 109–115. [Google Scholar] [CrossRef]
  14. Yang, H.; Liu, X.; Li, A.; Li, R.; Xu, S.; Zhang, M.; Yu, P.; Yu, S.; Jiang, M.; Huo, C.; et al. Effect of silicon addition on the corrosion resistance of Al0.2CoCrFe1.5Ni high-entropy alloy in saline solution. J. Alloys Compd. 2023, 964, 171226. [Google Scholar] [CrossRef]
  15. Chen, Q.S.; Lu, Y.P.; Dong, Y.; Wang, T.M.; Li, T.J. Effect of minor B addition on microstructure and properties of AlCoCrFeNi multi-compenent alloy. Rare Met. Mater. Eng. 2017, 46, 651–656. [Google Scholar] [CrossRef]
  16. Feng, J.J.; Gao, S.; Han, K.; Miao, Y.D.; Qi, J.Q.; Wei, F.X.; Ren, Y.J.; Zhan, Z.Z.; Sui, Y.W.; Sun, Z.; et al. Effects of minor B addition on microstructure and properties of Al19Co20Fe20Ni41 eutectic high-entropy alloy. Trans. Nonferrous Met. Soc. China 2021, 31, 1049–1058. [Google Scholar] [CrossRef]
  17. Xu, Z.Q.; Ma, Z.L.; Tan, Y.; Wang, M.; Zhao, Y.; Cheng, X.W. Effects of Si additions on microstructures and mechanical properties of VNbTiTaSix refractory high-entropy alloys. J. Alloys Compd. 2022, 900, 163517. [Google Scholar] [CrossRef]
  18. Babilas, R.; Łoński, W.; Boryło, P.; Kądziołka-Gaweł, M.; Gębara, P.; Radoń, A. The influence of cooling rate, chromium and silicon addition on the structure and properties of AlCoCrFeNiSi high entropy alloys. J. Magn. Magn. Mater. 2020, 502, 166492. [Google Scholar] [CrossRef]
  19. Pan, Y.; Pu, D.L.; Yu, E.D. Structural, electronic, mechanical and thermodynamic properties of Cr–Si binary silicides from first-principles investigations. Vacuum 2021, 185, 110024. [Google Scholar] [CrossRef]
  20. Gu, X.; Zhuang, Y.; Jia, P. Evolution of the microstructure and mechanical properties of as-cast Al0.3CoCrFeNi high entropy alloys by adding Si content. Mater. Sci. Eng. A 2022, 840, 142983. [Google Scholar] [CrossRef]
  21. Gorr, B.; Mueller, F.; Christ, H.J.; Mueller, T.; Chen, H.; Kauffmann, A.; Heilmaier, M. High temperature oxidation behavior of an equimolar refractory metal-based alloy 20Nb–20Mo–20Cr–20Ti–20Al with and without Si addition. J. Alloys Compd. 2016, 688, 468–477. [Google Scholar]
  22. Chang, H.; Zhang, T.W.; Ma, S.G.; Zhao, D.; Xiong, R.L.; Wang, T.; Li, Z.Q.; Wang, Z.H. Novel Si-added CrCoNi medium entropy alloys achieving the breakthrough of strength-ductility trade-off. Mater. Des. 2021, 197, 109202. [Google Scholar] [CrossRef]
  23. Ma, S.G.; Zhang, Y. Effect of Nb addition on the microstructure and properties of AlCoCrFeNi high-entropy alloy. Mater. Sci. Eng. A 2012, 532, 480–486. [Google Scholar]
  24. Yakaboylu, G.A.; Sabolsky, K.; Sabolsky, E.M. Phase stability, microstructure and high-temperature properties of NbSi2-and TaSi2-oxide conducting ceramic composites. J. Mater. Sci. 2018, 53, 9958–9977. [Google Scholar]
  25. Kuznetsova, T.; Lapitskaya, V.; Solovjov, J.; Chizhik, S.; Pilipenko, V.; Aizikovich, S. Properties of CrSi2 layers obtained by rapid heat treatment of Cr film on silicon. Nanomaterials 2021, 11, 1734. [Google Scholar] [CrossRef]
  26. Huang, L.; Wang, X.; Jia, F.; Zhao, X.; Huang, B.; Ma, J.; Wang, C. Effect of Si element on phase transformation and mechanical properties for FeCoCrNiSix high entropy alloys. Mater. Lett. 2021, 282, 128809. [Google Scholar] [CrossRef]
  27. Mehrotra, R.C. Synthesis and properties of alkoxy-and acyloxysilanes. Pure Appl. Chem. 1966, 13, 111–132. [Google Scholar] [CrossRef]
  28. Yang, X.; Chen, S.Y.; Cotton, J.D.; Zhang, Y. Phase stability of low-density, multiprincipal component alloys containing aluminum, magnesium, and lithium. JOM 2014, 66, 2009–2020. [Google Scholar] [CrossRef]
  29. Zheng, S.; Zhou, F.; Kuang, S.; Liu, W.; Liu, Q. Microstructure and mechanical properties of multi-phase reinforced MoFeCrTiWNb2.5 (Al2O3)x high-entropy alloy laser cladding coatings. J. Therm. Spray Technol. 2022, 31, 1662–1672. [Google Scholar] [CrossRef]
  30. Wei, D.; Gong, W.; Tsuru, T.; Lobzenko, I.; Li, X.; Harjo, S.; Kawasaki, T.; Do, H.-S.; Bae, J.W.; Wagner, C.; et al. Si-addition contributes to overcoming the strength-ductility trade-off in high-entropy alloys. Int. J. Plast. 2022, 159, 103443. [Google Scholar]
  31. Shuai, L.; Zou, X.; Rao, Y.; Lu, X.; Yan, H. Synergistic effects of La and Y on the microstructure and mechanical properties of cast Al-Si-Cu alloys. Materials 2022, 15, 7283. [Google Scholar] [PubMed]
  32. Kalhapure, M.G.; Dighe, P.M. Impact of silicon content on mechanical properties of aluminum alloys. Int. J. Sci. Res. 2015, 4, 38–40. [Google Scholar]
  33. Su, Y.; Tian, S.; Yu, H.; Yu, L. Effect of pre-compressive treatment on creep behavior of a <0 1 1>-oriented single-crystal Ni-based superalloy. Scr. Mater. 2014, 93, 24–27. [Google Scholar]
  34. Yue, T.; Huang, K. Laser cladding of Cu0.5NiAlCoCrFeSi high entropy alloy on AZ91D magnesium substrates for improving wear and corrosion resistance. World J. Eng. 2012, 9, 119–124. [Google Scholar]
  35. Liu, Y.; Liskiewicz, T.W.; Beake, B.D. Dynamic changes of mechanical properties induced by friction in the Archard wear model. Wear 2019, 428, 366–375. [Google Scholar] [CrossRef]
  36. Khan, A.A.; Kaiser, M.S. Wear properties analysis on Al-based automotive alloy with varied levels of Si in dry, 3.5% NaCl and seawater corrosive environments. Arch. Metall. Mater. 2024, 69, 881–890. [Google Scholar]
  37. Saber, D.; Abdel-Karim, R.; Kandel, A.A.; El-Aziz, K.A. Corrosive wear of alumina particles reinforced Al–Si alloy composites. Phys. Met. Metallogr. 2020, 121, 188–194. [Google Scholar]
  38. Kang, N.; Coddet, P.; Chen, C.; Wang, Y.; Liao, H.; Coddet, C. Microstructure and wear behavior of in-situ hypereutectic Al–high Si alloys produced by selective laser melting. Mater. Des. 2016, 99, 120–126. [Google Scholar] [CrossRef]
  39. Udoye, N.E.; Fayomi, O.S.I.; Inegbenebor, A.O. Assessment of wear resistance of aluminium alloy in manufacturing industry—A review. Procedia Manuf. 2019, 35, 1383–1386. [Google Scholar]
  40. Xu, D.; Wang, M.; Li, T.; Wei, X.; Lu, Y. A critical review of the mechanical properties of CoCrNi-based medium-entropy alloys. Microstructures 2022, 2, 2022001. [Google Scholar]
  41. Hsu, S.M.; Munro, R.; Shen, M.C. Wear in boundary lubrication. Proc. Inst. Mech. Eng. Part J J. Eng. Tribol. 2002, 216, 427–441. [Google Scholar] [CrossRef]
  42. Otto, F.; Dlouhý, A.; Somsen, C.; Bei, H.; Eggeler, G.; George, E.P. The influences of temperature and microstructure on the tensile properties of a CoCrFeMnNi high-entropy alloy. Acta Mater. 2013, 61, 5743–5755. [Google Scholar]
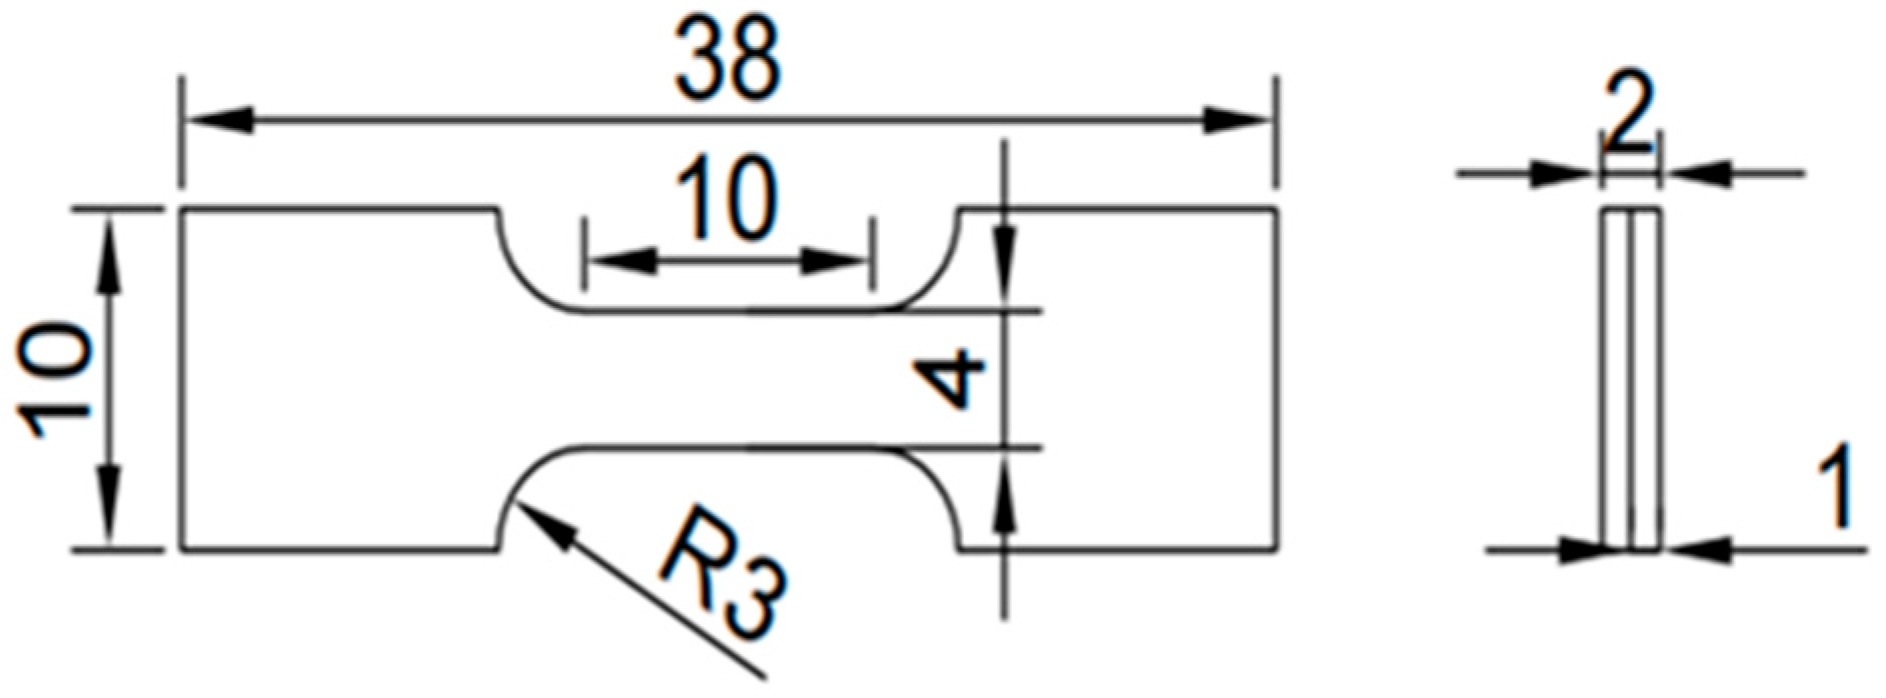
Figure 1. Cross-section of the sample.
Metals 15 01146 g001
Figure 2. XRD pattern of the as-cast AlCoCrFeNi2.1Six (x = 0, 0.1, 0.2 and 0.3) high-entropy alloys: (a) XRD pattern; (b) (111) plane pattern; and (c) line diagram of lattice parameters.
Metals 15 01146 g002
Figure 3. SEM images of as-cast AlCoCrFeNi2.1Six alloys: (a) x = 0; (b) x = 0.1; (c) x = 0.2; and (d) x = 0.3.
Metals 15 01146 g003
Figure 4. EDS mapping of as-cast AlCoCrFeNi2.1Six alloys: (a) x = 0; (b) x = 0.1; (c) x = 0.2; and (d) x = 0.3.
Metals 15 01146 g004
Figure 5. The relationship diagram of the hardness and lattice parameter of as-cast AlCoCrFeNi2.1Six HEAs with the change in Si content.
Metals 15 01146 g005
Figure 6. Frictional traces at various additive concentrations.
Metals 15 01146 g006
Figure 7. Relationship between wear amount and hardness of AlCoCrFeNi2.1Six (x = 0, 0.1, 0.2, 0.3) high-entropy alloy coating.
Metals 15 01146 g007
Figure 8. Matrix and AlCoCrFeNi2.1Six (x = 0, 0.1, 0.2, 0.3) high-entropy alloy wear 3D and cross-sectional profiles (a) matrix; (b) x = 0.1; (c) x = 0.2; and (d) x = 0.3.
Metals 15 01146 g008
Figure 9. CLSM and SEM morphology of the worn surface of AlCoCrFeNi2.1Six (x = 0, 0.1, 0.2, 0.3) high-entropy alloys under room-temperature tribological testing. (a,a1,a2) x = 0; (b,b1,b2) x = 0.1; (c,c1,c2) x = 0.2; and (d,d1,d2) x = 0.3.
Metals 15 01146 g009
Figure 10. Wear morphology of AlCoCrFeNi2.1Six (x = 0.1, 0.2, 0.3) high-entropy alloy (a) x = 0.1; (b) x = 0.2; and (c) x = 0.3.
Metals 15 01146 g010
Figure 11. (a) Typical engineering stress–strain curves of each Si-containing sample. The fracture surfaces of (b) Si0, (c) Si0.1, (d) Si0.2, and (e) Si0.3.
Metals 15 01146 g011
Figure 12. Fracture surfaces of the as-cast alloys. (a) Si0; (b) Si0.1; (c) Si0.2; and (d) Si0.3.
Metals 15 01146 g012
Table 1. Actual composition of as-cast AlCoCrFeNi2.1Six alloy (at.%).
xAlCoCrFeNiSi
08.5118.5916.4017.6138.88
0.18.4318.4216.2517.4638.530.87
0.28.3618.2716.1217.3138.201.74
0.38.2918.1115.9717.1637.892.58
Table 2. Chemical composition distribution of cast AlCoCrFeNi2.1Six high-entropy alloys (at.%).
No.ElementsPhase Structure
AlCoCrFeNiSi
X = 01 (BCC)30.1112.988.3712.1936.35FCC + BCC
2 (FCC)10.8716.1921.3418.8632.74
X = 0.13 (BCC)25.8713.427.5312.0339.571.58FCC + BCC
4 (FCC)13.3116.9718.8218.6430.651.61
X = 0.25 (BCC)17.9215.5913.4212.7037.392.98FCC + BCC
6 (FCC)12.1218.6719.5517.3629.263.04
7 (BCC)11.9312.3728.5110.1532.254.79FCC + BCC + CrSi2
X = 0.38 (FCC)16.4614.7115.9913.2936.233.32
9 (CrSi2)10.7014.6523.9116.6114.4919.64
Table 3. Atomic radii and enthalpy of mixing between different elements (kJ·mol−1).
ElementsSiNiAlFeCrCo
Atomic Radius/pm115124143126128125
SiSi−22.9−5.4−17.7−20.4−21.2
Ni Ni−22−1.6−6.7−0.2
Al Al−11−10−19
Fe Fe−0.5−1.6
Cr Cr−4.5
Co Co
Table 4. Variations in micro-Vickers hardness across different positions of as-cast AlCoCrFeNi2.1Six high-entropy alloys.
xHardness (HV)Average
Value
Relative Error
(%)
12345678910
0276.7291.7295.6295.6293.6312.1314.3299.6284.0299.6296.312.68
0.1325.4327.8325.4323.2332.4320.9327.8342.1330.1327.8328.36.46
0.2413.3368.2330.1379.5403.7420.0382.4385.3403.7388.3387.423.1
0.3385.3437.3426.8373.8371.0368.2440.9455.7423.4420.0410.221.3
Table 5. EDS analysis of wear morphology of AlCoCrFeNi2.1Six (x = 0.1, 0.2, 0.3) high-entropy alloys/at.%.
XRegionsAlCoCrFeNiSiO
0.1G14.5812.8512.8812.7027.861.6217.52
0.2H11.8712.8413.8812.7425.913.8718.89
0.3J13.7113.0110.9710.7222.235.4323.93
Table 6. Summary of the tensile results.
AlloysYiels Strength (Mpa)Uitimate Tensile Strength (Mpa)Elongation (%)
Si0516.8104318.50
Si0.1544.691610.34
Si0.2585.69727.80
Si0.3686.612848.79
Disclaimer/Publisher’s Note: The statements, opinions and data contained in all publications are solely those of the individual author(s) and contributor(s) and not of MDPI and/or the editor(s). MDPI and/or the editor(s) disclaim responsibility for any injury to people or property resulting from any ideas, methods, instructions or products referred to in the content.