Article

Fatigue Strength Study of WAAM-Fabricated Shafts with Stacked Steel Ring Substrates Using Advanced Modeling

Faculty of Mechanical Engineering, HCMC University of Technology and Education, Ho Chi Minh City 71307, Vietnam
*
Author to whom correspondence should be addressed.
Metals 2025, 15(10), 1110; https://doi.org/10.3390/met15101110
Submission received: 3 September 2025 / Revised: 1 October 2025 / Accepted: 2 October 2025 / Published: 6 October 2025

Abstract

This study investigates the fatigue performance of 3D-printed metal shafts fabricated via Wire Arc Additive Manufacturing (WAAM) with stacked steel ring substrates under rotating bending (ISO 1143:2021). A Taguchi L25 orthogonal array was used to analyze five process parameters: ring diameter, current intensity, torch speed, ring thickness, and contact tip to workpiece distance (CTWD). Analysis of Variance (ANOVA) identified ring diameter as the dominant factor, significantly enhancing fatigue life at 14.0 mm by reducing stress concentrations. Current intensity (125 A) and torch speed (550 mm/min) further improve weld quality and microstructure, while ring thickness (1.0 mm) and CTWD (1.5 mm) have minor effects. A linear regression model (R2 = 0.9603) accurately predicts fatigue life, with optimal settings yielding 299,730 cycles. The stacked-ring configuration enables intricate structures like cooling channels, ideal for aerospace and automotive applications. The 3.5% unexplained variance suggests parameter interactions, warranting further investigation into shielding gas effects and multiaxial loading to broaden material and loading applicability.

1. Introduction

Metal additive manufacturing (AM) has revolutionized the production of complex metallic components, offering unmatched flexibility in design and fabrication [1,2,3]. Among AM techniques, Wire Arc Additive Manufacturing (WAAM) stands out for its cost-effectiveness and efficiency in producing large-scale parts. WAAM uses an electric arc as a heat source and a metal wire as the feedstock, depositing material layer by layer to create components in a near-net shape [4,5]. Unlike powder-based processes such as selective laser melting (SLM) or electron beam melting (EBM), which require expensive equipment and controlled environments, WAAM leverages established welding technologies such as gas metal arc welding (GMAW) or gas tungsten arc welding (GTAW) [6,7,8]. This approach achieves deposition efficiencies that exceed 90%, minimizes material waste, shortens production lead times, and enables intricate geometries that are challenging with traditional subtractive methods like machining or casting [1,2,9]. These advantages make WAAM valuable for industries such as aerospace (e.g., turbine blades, structural frames), automotive (e.g., customized chassis components), and energy (e.g., turbine housings, pressure vessels), where lightweight, high-performance components are essential [10,11,12]. The ability to fabricate custom parts with reduced environmental impact aligns with global sustainability goals, positioning WAAM as a transformative technology in modern manufacturing [9,13].
The mechanical integrity of WAAM-fabricated components, particularly under dynamic loading, remains a key challenge [4,6]. Fatigue strength, the ability to withstand repeated cyclic stresses without failure, is critical for components such as rotating shafts or aircraft landing gear subjected to vibrations or fluctuating loads [6,14,15]. In WAAM parts, fatigue behavior is influenced by microstructural heterogeneities from rapid solidification and thermal cycling, residual stresses from uneven heating and cooling, anisotropy due to directional deposition, and defects such as porosity, inclusions, or lack of fusion at interlayer boundaries [16,17,18]. Studies show that optimized WAAM components can achieve fatigue lives comparable to wrought materials, but parameter variations often lead to performance variability, with cracks that begin in surface irregularities or internal voids [14,15,19]. For example, research on WAAM titanium alloys indicates that heat input affects grain size and phase distribution, affecting crack propagation rates [17,20]. In steel-based WAAM, martensite or bainitic microstructure can enhance strength but can introduce brittleness, reducing fatigue endurance limits [12,21,22]. Recent reviews and studies on the mechanical properties of additively manufactured metallic materials highlight the critical role of advanced statistical methods, such as Response Surface Methodology (RSM), in optimizing these properties and mitigating inherent challenges, including defect formation and material variability [2,23,24]. RSM, as a sophisticated experimental design technique, goes beyond simple linear models by incorporating quadratic and interaction terms in its regression equations, allowing researchers to map out response surfaces that visualize how multiple process parameters interact to influence outcomes. For instance, in the context of laser powder bed fusion (LPBF) for Ti-6Al-4V—a widely used alloy in aerospace due to its high strength-to-weight ratio—RSM has been employed to model the interplay between laser power (typically 100-300 W) and scanning speed (500–1500 mm/s). This approach has yielded optimized settings that achieve tensile strengths exceeding 1100 MPa while reducing porosity to below 1%, thereby indirectly enhancing fatigue life through finer microstructures and fewer crack initiation sites [24]. Such refinements are crucial, as porosity and residual stresses can reduce fatigue endurance by up to 30% in AM parts compared to wrought counterparts. Extending this to other materials, Bhardwaj et al. (2024) applied RSM to stainless steel in AM processes, demonstrating how quadratic models capture non-linear effects on hardness and ductility, with ANOVA validating the significance of interactions like layer thickness and hatch spacing [25]. Comprehensive reviews further highlight RSM’s advantages over methods like Taguchi, which primarily focus on main effects; RSM excels in identifying synergistic or antagonistic interactions, such as those between heat input and cooling rates that affect grain refinement and thus fatigue crack propagation [26,27]. In steel and aluminum AM, for example, RSM has enabled predictions of endurance limits with R2 values above 0.95, addressing anisotropy by optimizing build orientations and reducing defects like lack-of-fusion voids. These insights are particularly relevant to WAAM studies, where similar challenges arise but with unique variables like arc stability and wire feed rates; while RSM has been predominantly applied to powder-based AM, its integration with ANOVA in WAAM contexts could enhance process control for novel substrates, bridging gaps in understanding complex interactions and paving the way for more robust fatigue predictions [23,28].
A pivotal factor in WAAM based on GMAW is the shielding gas, which protects the molten weld pool from atmospheric contaminants such as oxygen and nitrogen [23,29,30]. Inadequate shielding leads to oxidation or nitridation, forming brittle inclusions that act as stress concentrators and fatigue crack initiation sites. Common shielding gases include pure argon (Ar), which provides excellent arc stability and minimal spatter but limited penetration, and mixtures such as Ar with carbon dioxide (CO2, 5–25%) or oxygen (O2, 1–5%). Ar-CO2 blends improve penetration and bead wetting by increasing arc energy and pool fluidity, but risk a higher oxide content if unbalanced. Ar-O2 mixtures improve arc stability and reduce spatter in spray transfer modes, though excessive oxygen can increase surface oxidation [11,29,31]. The gas composition affects the dynamics of the weld pool (for example, Marangoni convection and droplet transfer) and the microstructure, influencing the hardness, ductility, and fatigue resistance [30,32,33]. For example, a higher CO2 content can coarsen ferrite grains and reduce toughness, while optimized Ar-O2 mixtures can refine microstructures and improve fatigue life by minimizing defect density [22,29]. In WAAM’s multilayer deposition, these effects compound across interfaces, potentially amplifying or mitigating interlayer weaknesses. This study focuses on an Ar-CO2 mixture (8–10 L/min), with potential for future comparisons to pure Ar or Ar-O2 to further optimize fatigue performance.
Optimizing WAAM process parameters is essential for consistent weld quality and compliance with fatigue requirements [4,6,34]. Key variables include welding current (110–130 A), controlling heat input and deposition rate; voltage and wire feed speed, affecting arc length and metal transfer; torch speed (400–600 mm/min), influencing bead shape and cooling rates; contact tip to workpiece distance, modulating arc stability and spatter; and geometric factors like substrate dimensions [4,23,31]. Variations in these parameters can cause defects, such as undercuts, incomplete fusion, or excessive residual stresses, affecting fatigue life [16,19]. High currents increase penetration, but may cause distortion, while low speeds improve fusion but risk overheating and grain coarsening [18]. The layer-by-layer process results in anisotropic properties, with strength often higher along the build direction but vulnerable transversely due to interlayer boundaries [17,32]. These characteristics are critical for fatigue under rotating bending, simulating real-world applications such as electric motor shafts or drivetrains [14,15].
Current research on WAAM focuses primarily on uniform substrates, with limited exploration of novel configurations and their impact on fatigue under specific loading modes. The synergistic effects of the shielding gas composition, welding parameters, and substrate geometry on fatigue remain underexplored [4,6]. Most studies address standard substrates, leaving gaps in understanding defect formation, residual stress distribution, and crack propagation in advanced setups [5,16]. These gaps hinder WAAM’s adoption in high-reliability applications where fatigue failure could be catastrophic [5,12].
This study evaluates the fatigue strength of 3D-printed metal shafts fabricated via modified WAAM with stacked steel rings, focusing on an Ar-CO2 shielding gas mixture, welding parameters (current, torch speed, contact tip to workpiece distance), and CT3 substrate ring configurations (thickness, diameter). Using a Taguchi L25 orthogonal array for efficient experimentation, fatigue testing under rotating bending according to ISO standard [35], and statistical analysis using ANOVA and regression modeling to quantify parameter significance and interactions, the research optimizes conditions for maximal fatigue life. By correlating process inputs with weld quality, interlayer bonding, microstructure, and fatigue outcomes, this work provides insight into robust design practices. The findings aim to advance WAAM technology, bridging the gap between laboratory prototypes and industrial-grade components with enhanced durability and complex internal features [5,13].

2. Materials and Methods

2.1. Experimental Setup

The experiments were designed to evaluate the fatigue bending strength of cylindrical components fabricated using Wire Arc Additive Manufacturing (WAAM) with Metal Inert Gas (MIG) welding, WAAM3D, Glasgow, UK. These experiments were conducted at the Faculty of Mechanical Engineering, Ho Chi Minh City University of Technology and Education (HCMUTE), Ho Chi Minh City, Vietnam, using a WAAM system integrated with a 4-axis CNC machine, WAAM3D, Glasgow, UK to ensure precise control over the deposition process.

2.1.1. Equipment and Materials

The WAAM system comprised a MIG welding machine, a 4-axis CNC machine (Figure 1a), a shielding gas supply, and a fatigue testing apparatus. The MIG welding machine, configured with a DC power source (positive polarity), generated an arc between the welding wire and the workpiece. The wire used was GEMINI GM-70S MIG welding wire, GEMINI, Ho Chi Minh City, Vietnam a copper-coated low-carbon steel wire compatible with CT3 steel, ensuring material compatibility. A mixture of argon and CO2 with a flow rate of 8–10 L/min served as the shielding gas to protect the weld pool from oxidation [29,31,36]. The TEA-4axis CNC machine, TEA Machinery, Taichung, Taiwan enabled automated deposition by precisely controlling the movement of the welding torch.
For fatigue testing, a TESCA single-point bending fatigue machine, TESCA, Taichung, Taiwan (Figure 1b) was used, capable of applying a maximum load of 100 kg at a rotational speed of 2900 rpm. Equipped with a digital display, the machine monitored load and cycle counts, ensuring accurate data collection under the specified stress amplitude.

2.1.2. Process Parameters

The GMAW process parameters were precisely controlled to achieve high-quality welds on the stacked steel ring substrates, as outlined in Table 1. These parameters were systematically varied according to a Taguchi experimental design (Table 2) to investigate their influence on the fatigue performance of the fabricated shafts.
The selection of process parameters and their levels was guided by theoretical considerations, particularly the heat input formula widely used in WAAM optimization to balance deposition rate, thermal distortion, and microstructural integrity [37,38,39].
Q = V · I · 60 S ,
where:
  • Q: heat input, in J/mm;
  • V: arc voltage, in volts (V);
  • I: welding current, in amperes (A);
  • S: torch travel speed, in mm/min.
This formula correlates energy input with weld quality and fatigue life, as demonstrated in studies on WAAM steel alloys, where optimized heat input (e.g., 10–15 J/mm) reduced grain coarsening and residual stresses [17,22,40]. Assuming a typical voltage of 17–20 V for GMAW-based WAAM with low-carbon steel [31,36], the selected ranges yield heat inputs of approximately 8–20 J/mm, ensuring adequate fusion without excessive overheating.
The key parameters included are as follows:
  • Welding Current (110–130 A): Controlled to manage penetration and heat input, with levels targeting 12–15 J/mm for optimal bead shape. The 125 A setting provides balanced deposition without distortion, consistent with WAAM steel optimizations that minimize porosity [4,11,41].
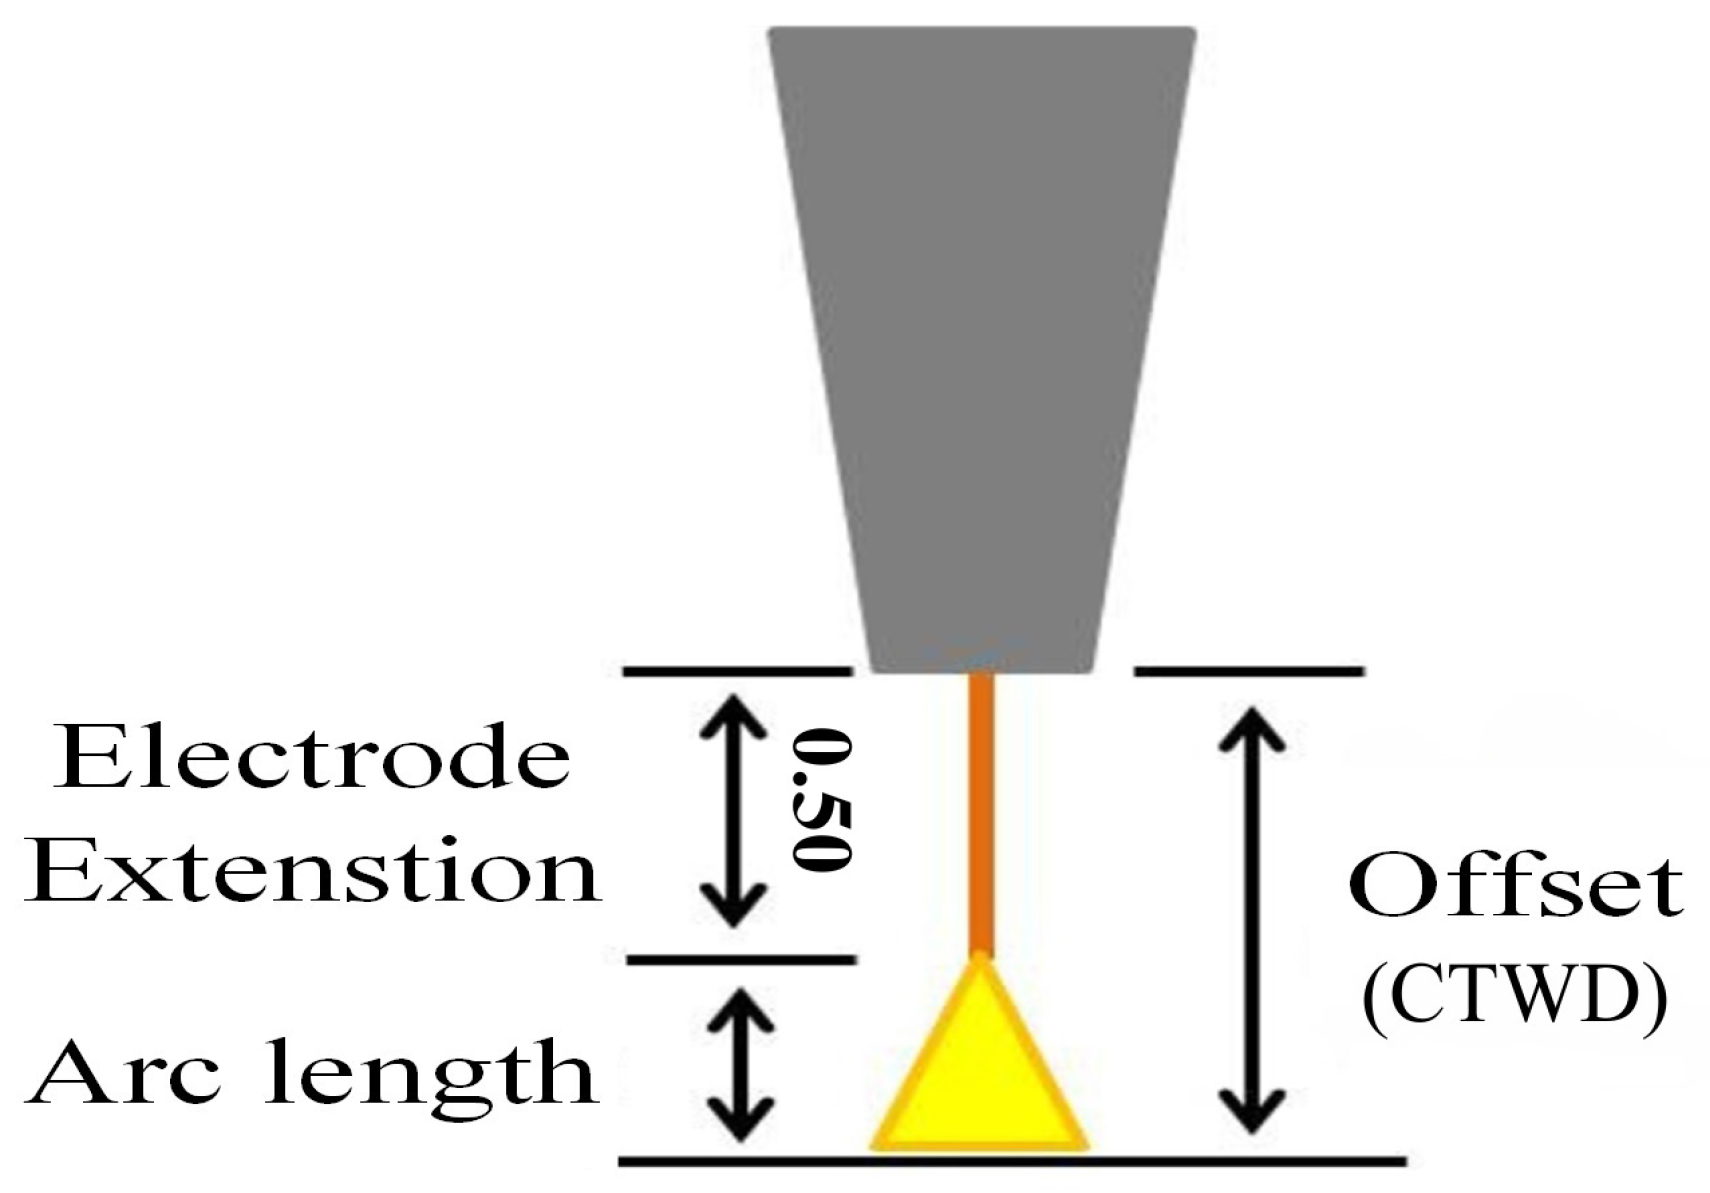
  • Contact Tip to Workpiece Distance (CTWD, 1.5–3 mm): Adjusted to stabilize arc length and minimize spatter, as shown in Figure 2. A shorter CTWD enhances energy transfer efficiency, reducing heat loss and ensuring consistent weld pool dynamics, as supported by WAAM studies [4,11,41].
  • Torch Speed (400–600 mm/min): Varied inversely with heat input to modulate cooling rates and bead width. A speed of approximately 550 mm/min yields moderate heat input (10–14 J/mm at 22 V), promoting fine microstructures and reduced anisotropy, as validated in multilayer WAAM trials [17,37].
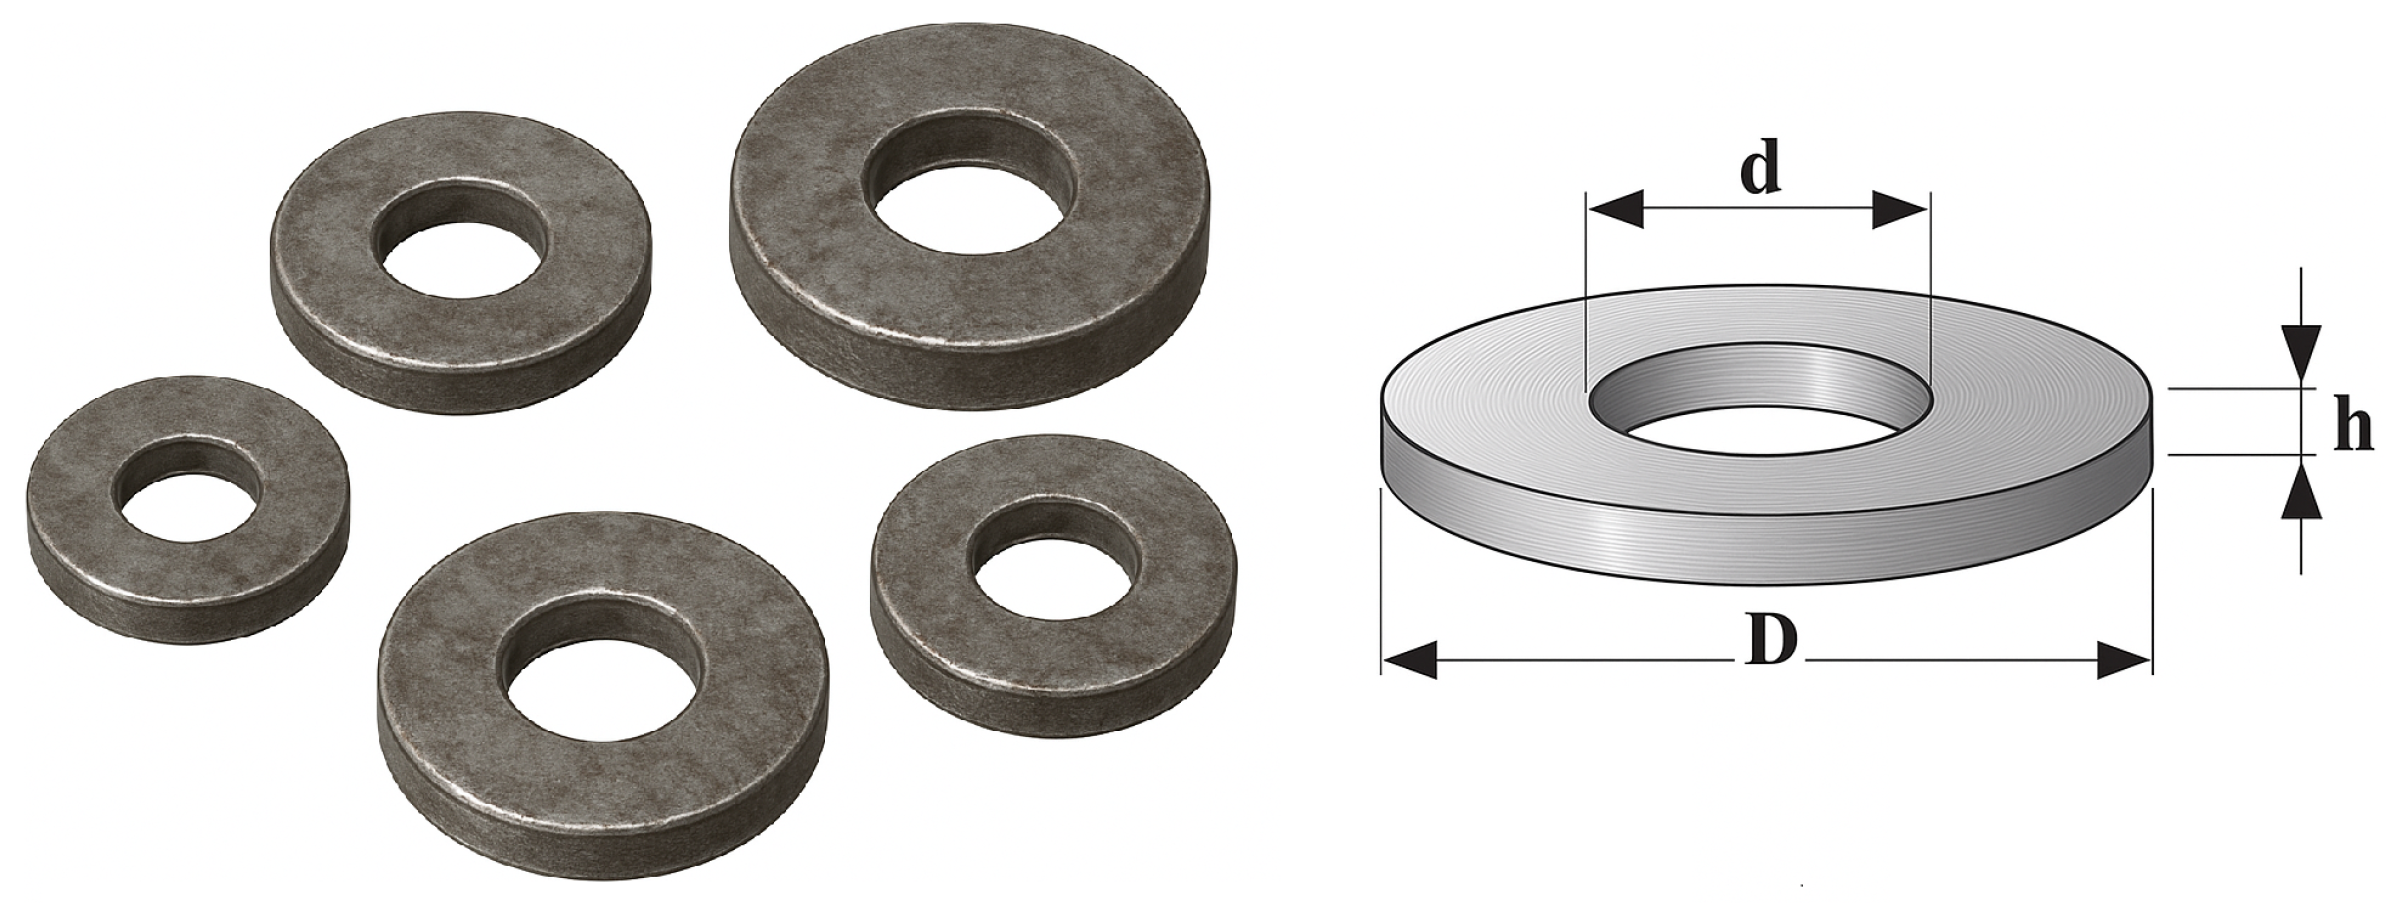
  • Steel Ring Diameter and Thickness: The outer diameter (D) of the steel rings ranged from 14 mm to 16 mm with a consistent inner diameter (d) of 10 mm, and the ring thickness (h) ranged from 1 mm to 5 mm, as shown in Figure 3. A ring diameter of 14.0 mm was selected based on preliminary simulations showing reduced fatigue crack initiation compared to larger diameters, aligning with heat input considerations for uniform cooling in stacked configurations [5,8,22]. The ring thickness supports heat accumulation between layers, minimizing distortion under calculated heat input values.

2.1.3. Fatigue Testing Setup

The fatigue testing setup included a fixture to secure the specimen, with the load applied via a counterweight system. The machine applied a load of 87 kg, equivalent to a nominal stress amplitude of approximately 106 MPa under rotating bending, calculated using the bending stress formula σ = M · c I , where the bending moment M = F · L = 87 kg · 9.81 m / s 2 · 0.06 m = 51.262 Nm , the distance from the neutral axis c = 8.5 mm = 0.0085 m (radius of the sample of 17 mm in diameter), and the moment of inertia I = π r 4 4 = π ( 0.0085 ) 4 4 1.638 × 10 9 m 4 . Thus, σ = 512.622 · 0.0085 1.638 × 10 9 106 MPa .
The number of cycles to failure was recorded via the machine’s digital interface, ensuring precise measurement of fatigue life. This setup guaranteed repeatability and accuracy in evaluating fatigue bending strength, with the Taguchi method facilitating systematic analysis of parameter effects.

2.2. Specimen Design and Fabrication

The cylindrical specimens for fatigue bending tests were designed and fabricated to assess the influence of WAAM process parameters and path strategies on fatigue performance. The specimens adhered to ISO 1143:2021 standards [35] for single-point bending fatigue tests, ensuring consistent geometry and surface quality. Fabrication utilized a WAAM system with MIG welding, followed by precision machining to achieve the required dimensions.

2.2.1. Specimen Design

The fatigue test specimens were designed to ensure consistent geometry for reliable and reproducible fatigue testing results, as illustrated in Figure 4. Tailored for evaluating the fatigue strength of 3D-printed metal shafts using a modified WAAM process with stacked steel rings as substrates, each specimen comprised steel rings arranged to meet the required length.

2.2.2. Specimen Fabrication Process

Fabrication began with configuring the Jasic MIG welding machine (model MIG-270), JASIC, Shenzhen, China to a voltage of 20 V, a current intensity of 110–130 A, and a shielding gas flow rate of 8–10 L/min using an argon and CO2 mixture, ensuring optimal weld quality and compatibility with the steel ring substrates [29,31,36].
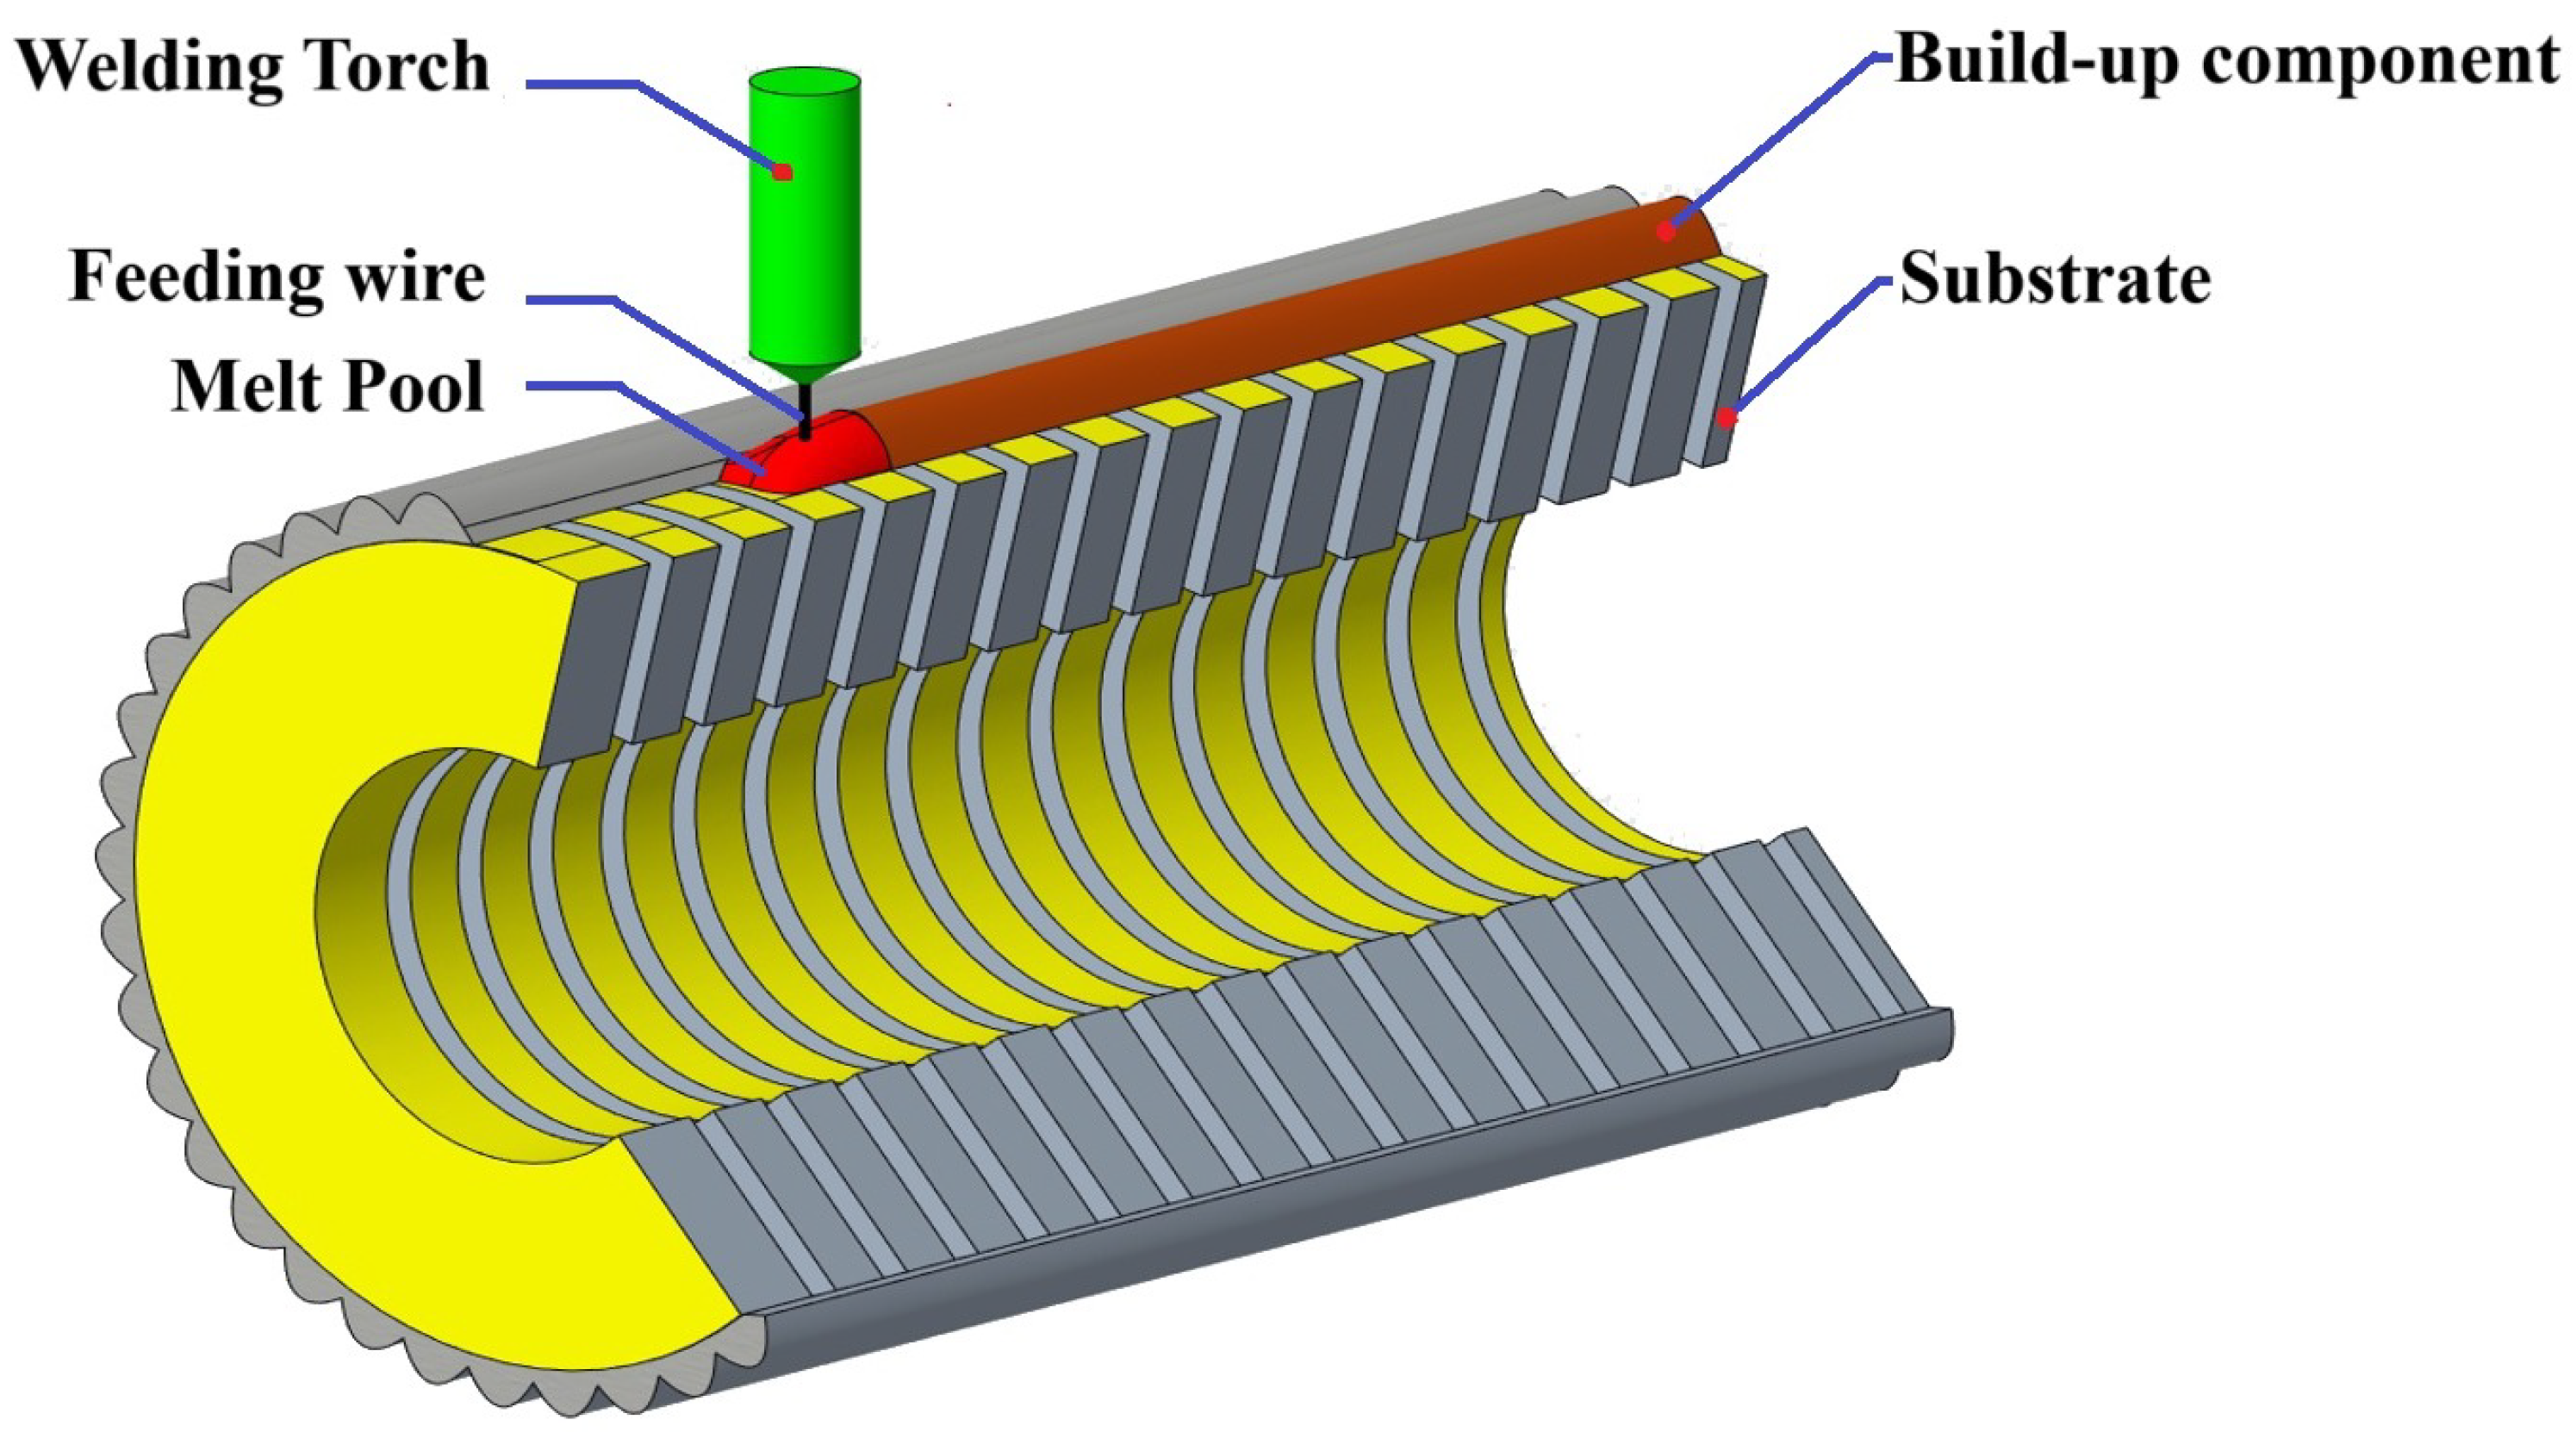
The substrate stacked-ring method was employed to fabricate the shafts, as shown in Figure 5. This technique enables the creation of complex internal profiles, such as hollow features or cooling channels, by securing the rings through MIG welding in a layer-by-layer process. The rings, made of low-carbon steel compatible with the GM-70S welding wire, were stacked to form the standard specimen.
The fabrication process involved arranging steel rings, with thicknesses ranging from 1 mm to 5 mm and outer diameters from 14 mm to 16 mm (with a consistent inner diameter of 10 mm), according to Table 2. The substrate consisted of four rings (diameter 18 mm, thickness 5 mm) at both ends of the specimen, followed by two rings (diameter 17 mm, thickness 5 mm) on either side. The central section included rings with diameters of 14–16 mm and thicknesses of 1–5 mm, arranged to meet the specimen’s design specifications.
Welding was performed using a 4-axis CNC-controlled system to ensure precision and repeatability. The process started by establishing the welding origin to align the torch accurately with the stacked rings. CNC commands guided the MIG welding gun to maintain a torch speed of 400–600 mm/min and a CTWD of 1–3 mm. A four-point welding strategy, as shown in Figure 6, ensured concentricity: an initial weld line was applied, followed by a 180-degree rotation for a second weld line, and then 90-degree rotations for the third and fourth weld lines, securing all rings. Multiple weld layers were then overlaid to build the shaft structure, with each layer controlled to minimize defects and achieve uniform weld bead geometry.

2.2.3. Post-Processing

Post-processing involved machining the specimens on a lathe to achieve a uniform, smooth surface, as shown in Figure 7a. This step removed surface irregularities, weld imperfections, and excess material from multilayered weld deposits, ensuring an even surface that minimized stress concentrations during fatigue testing. Lathe machining was carefully controlled to maintain the concentricity of the stacked steel rings, preserving the structural integrity of the shaft while achieving the external dimensions specified in the fatigue sample design (Figure 7b).
These post-processing steps were critical to eliminating surface defects, such as machining marks or residual weld spatter, which could act as stress concentrators and initiate cracks prematurely during fatigue testing. By achieving a polished, standardized surface finish, the specimens were prepared to accurately reflect the influence of WAAM process parameters and steel ring configurations on fatigue performance, ensuring reliable and reproducible test results.

2.3. Testing Procedure

The fatigue testing procedure followed a standardized protocol to ensure consistency across the 125 specimens fabricated according to the Taguchi L25 orthogonal array, as shown in Figure 8. Each specimen was securely clamped in the fatigue testing machine’s fixture, with the sample section aligned to experience maximum bending stress. The number of cycles to failure, selected based on preliminary tests to induce failure within 10 5 10 6 cycles, was automatically recorded by the machine’s digital counter. For each specimen, fatigue life (cycles to failure), process parameters, and substrate ring design from the Taguchi array were logged. This procedure was repeated for five samples per experimental case to ensure statistical reliability, conducted in a controlled environment at 25 ± 2 °C to minimize thermal effects.

2.4. Data Analysis and Method

To evaluate the influence of process parameters and steel ring configurations on the fatigue strength of 3D-printed metal shafts fabricated using the modified WAAM process, a comprehensive set of analytical tools was employed. The primary objective was to quantify the effects of key variables—ring diameter, ring thickness, torch speed, current intensity, and CTWD—on fatigue life and determine optimal conditions for maximizing durability. PyCharm sofware (version 2025.2) was used to develop a linear regression model, critical for predicting fatigue life by capturing relationships between input parameters and fatigue performance. Statistical software facilitated Analysis of Variance (ANOVA) and signal-to-noise (S/N) ratio analysis to assess the statistical significance of each factor’s impact on fatigue life, providing clear insights into their individual contributions.
The Taguchi L25 orthogonal array was utilized to systematically evaluate the five process parameters, each at five levels, requiring 25 experimental runs for a comprehensive assessment of parameter combinations. To enhance reliability, five specimens were fabricated and tested for each run, resulting in 125 specimens, with the average fatigue life recorded for analysis. ANOVA quantified the contribution of each parameter to fatigue life variability, while the S/N ratio (larger-the-better) identified optimal parameter settings to maximize durability. This integrated approach, combining the Taguchi L25 design, ANOVA, and S/N ratio analysis, enabled a robust evaluation of the relationships between WAAM process parameters, steel ring configurations, and fatigue behavior, supporting the development of reliable, high-performance 3D-printed components.

3. Results

This section presents the fatigue performance results of 3D-printed metal shafts fabricated via Wire Arc Additive Manufacturing (WAAM) with stacked steel ring substrates, tested under rotating bending. Using a Taguchi L25 orthogonal array, the effects of five process parameters were evaluated: ring diameter, current intensity, torch speed, ring thickness, and contact tip to workpiece distance (CTWD). The results, analyzed through Analysis of Variance (ANOVA), signal-to-noise (S/N) ratio, and linear regression, reveal key trends and optimal settings [1,42].

3.1. Fatigue Life Data

The fatigue life results from the 25 experimental runs, conducted according to the Taguchi L25 orthogonal array, are presented in Table 3. This table lists the parameter combinations for each run—welding current (110–130 A), CTWD (1.5–3.0 mm), torch speed (400–600 mm/min), ring thickness (1–5 mm), and ring diameter (14–16 mm)—along with the corresponding cycles to failure measured during rotating bending fatigue tests. Table 3 provides a comprehensive record of fatigue performance, capturing variability across different process conditions and serving as the basis for subsequent statistical analyses.
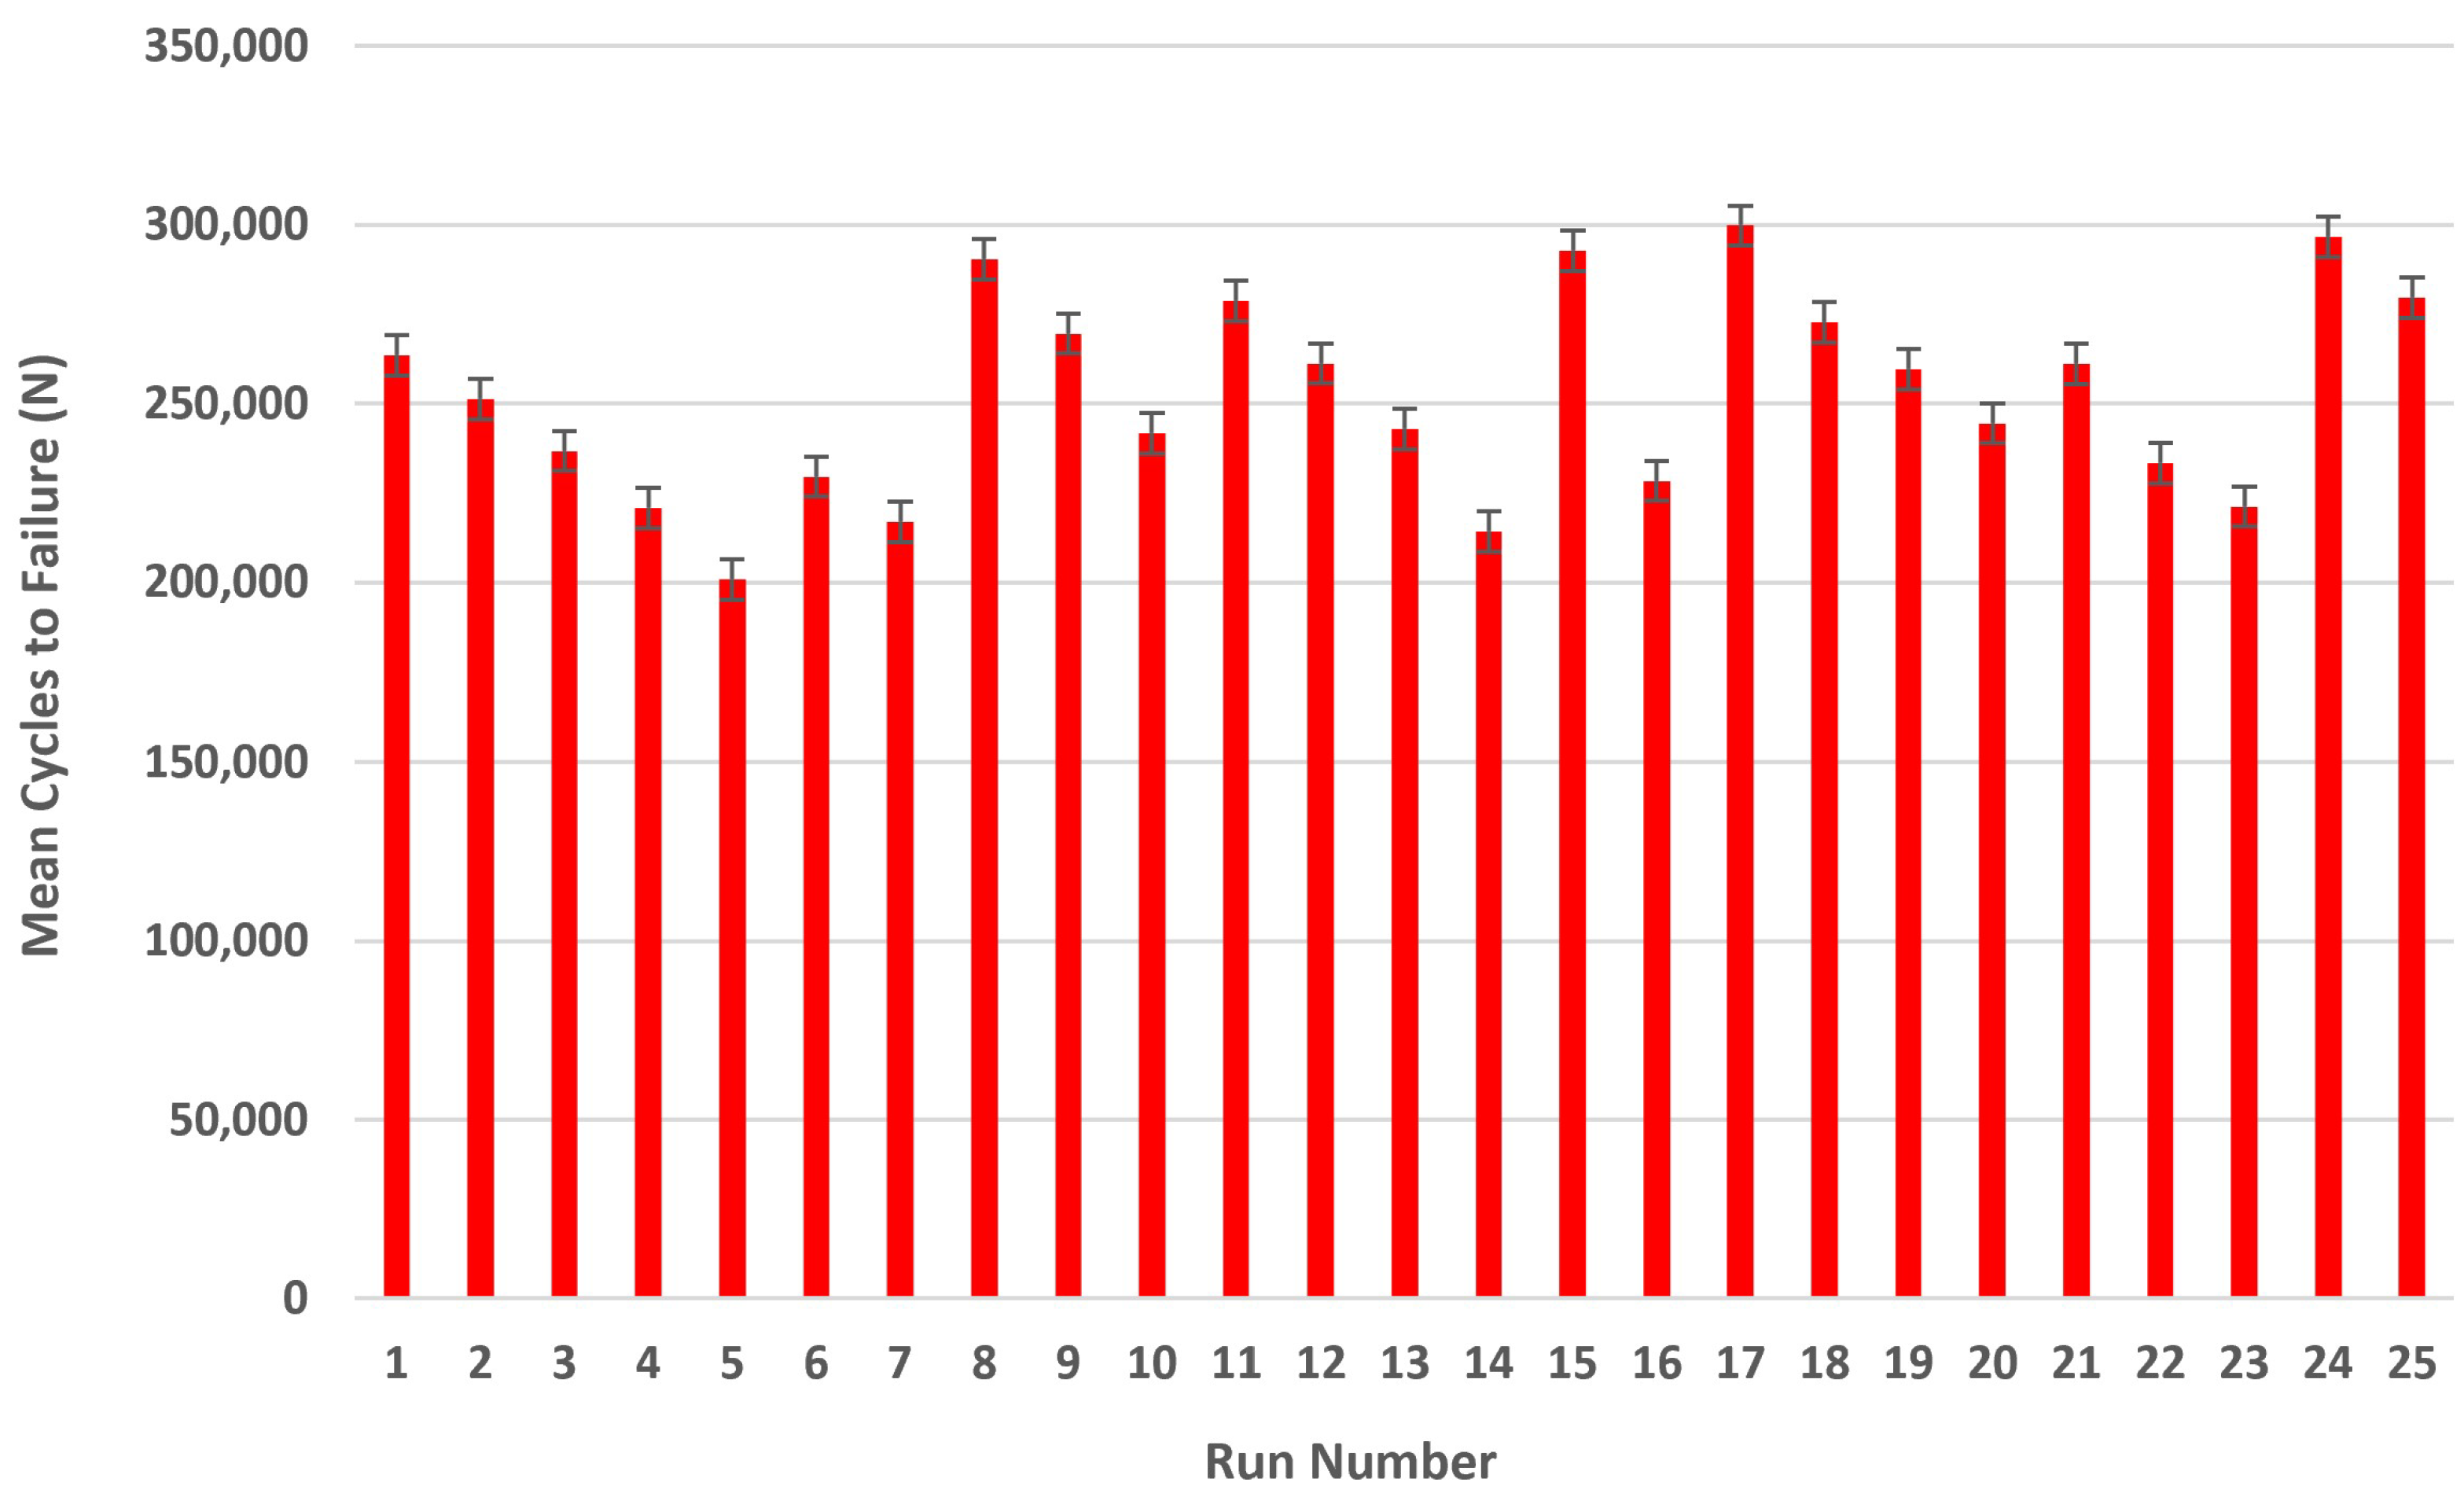
Figure 9 illustrates the fatigue life (cycles to failure) for each of the 25 experimental runs detailed in Table 3. The x-axis represents the run number (1 to 25), corresponding to specific parameter combinations, while the y-axis shows fatigue life, ranging from 200,682 to 299,730 cycles.

3.2. ANOVA Analysis and Parameter Influence

Analysis of Variance (ANOVA) was conducted to assess the statistical significance of each process parameter’s effect on fatigue life. A Type II ANOVA approach was employed to account for the independent contributions of each parameter, minimizing the impact of interactions. This analysis quantifies the relative influence of each parameter, guiding process optimization [42,43]. Table 4 presents the ANOVA results, including the sum of squares, degrees of freedom, F-value, p-value, and contribution percentage for each parameter and residual, highlighting their impact on fatigue life variability.
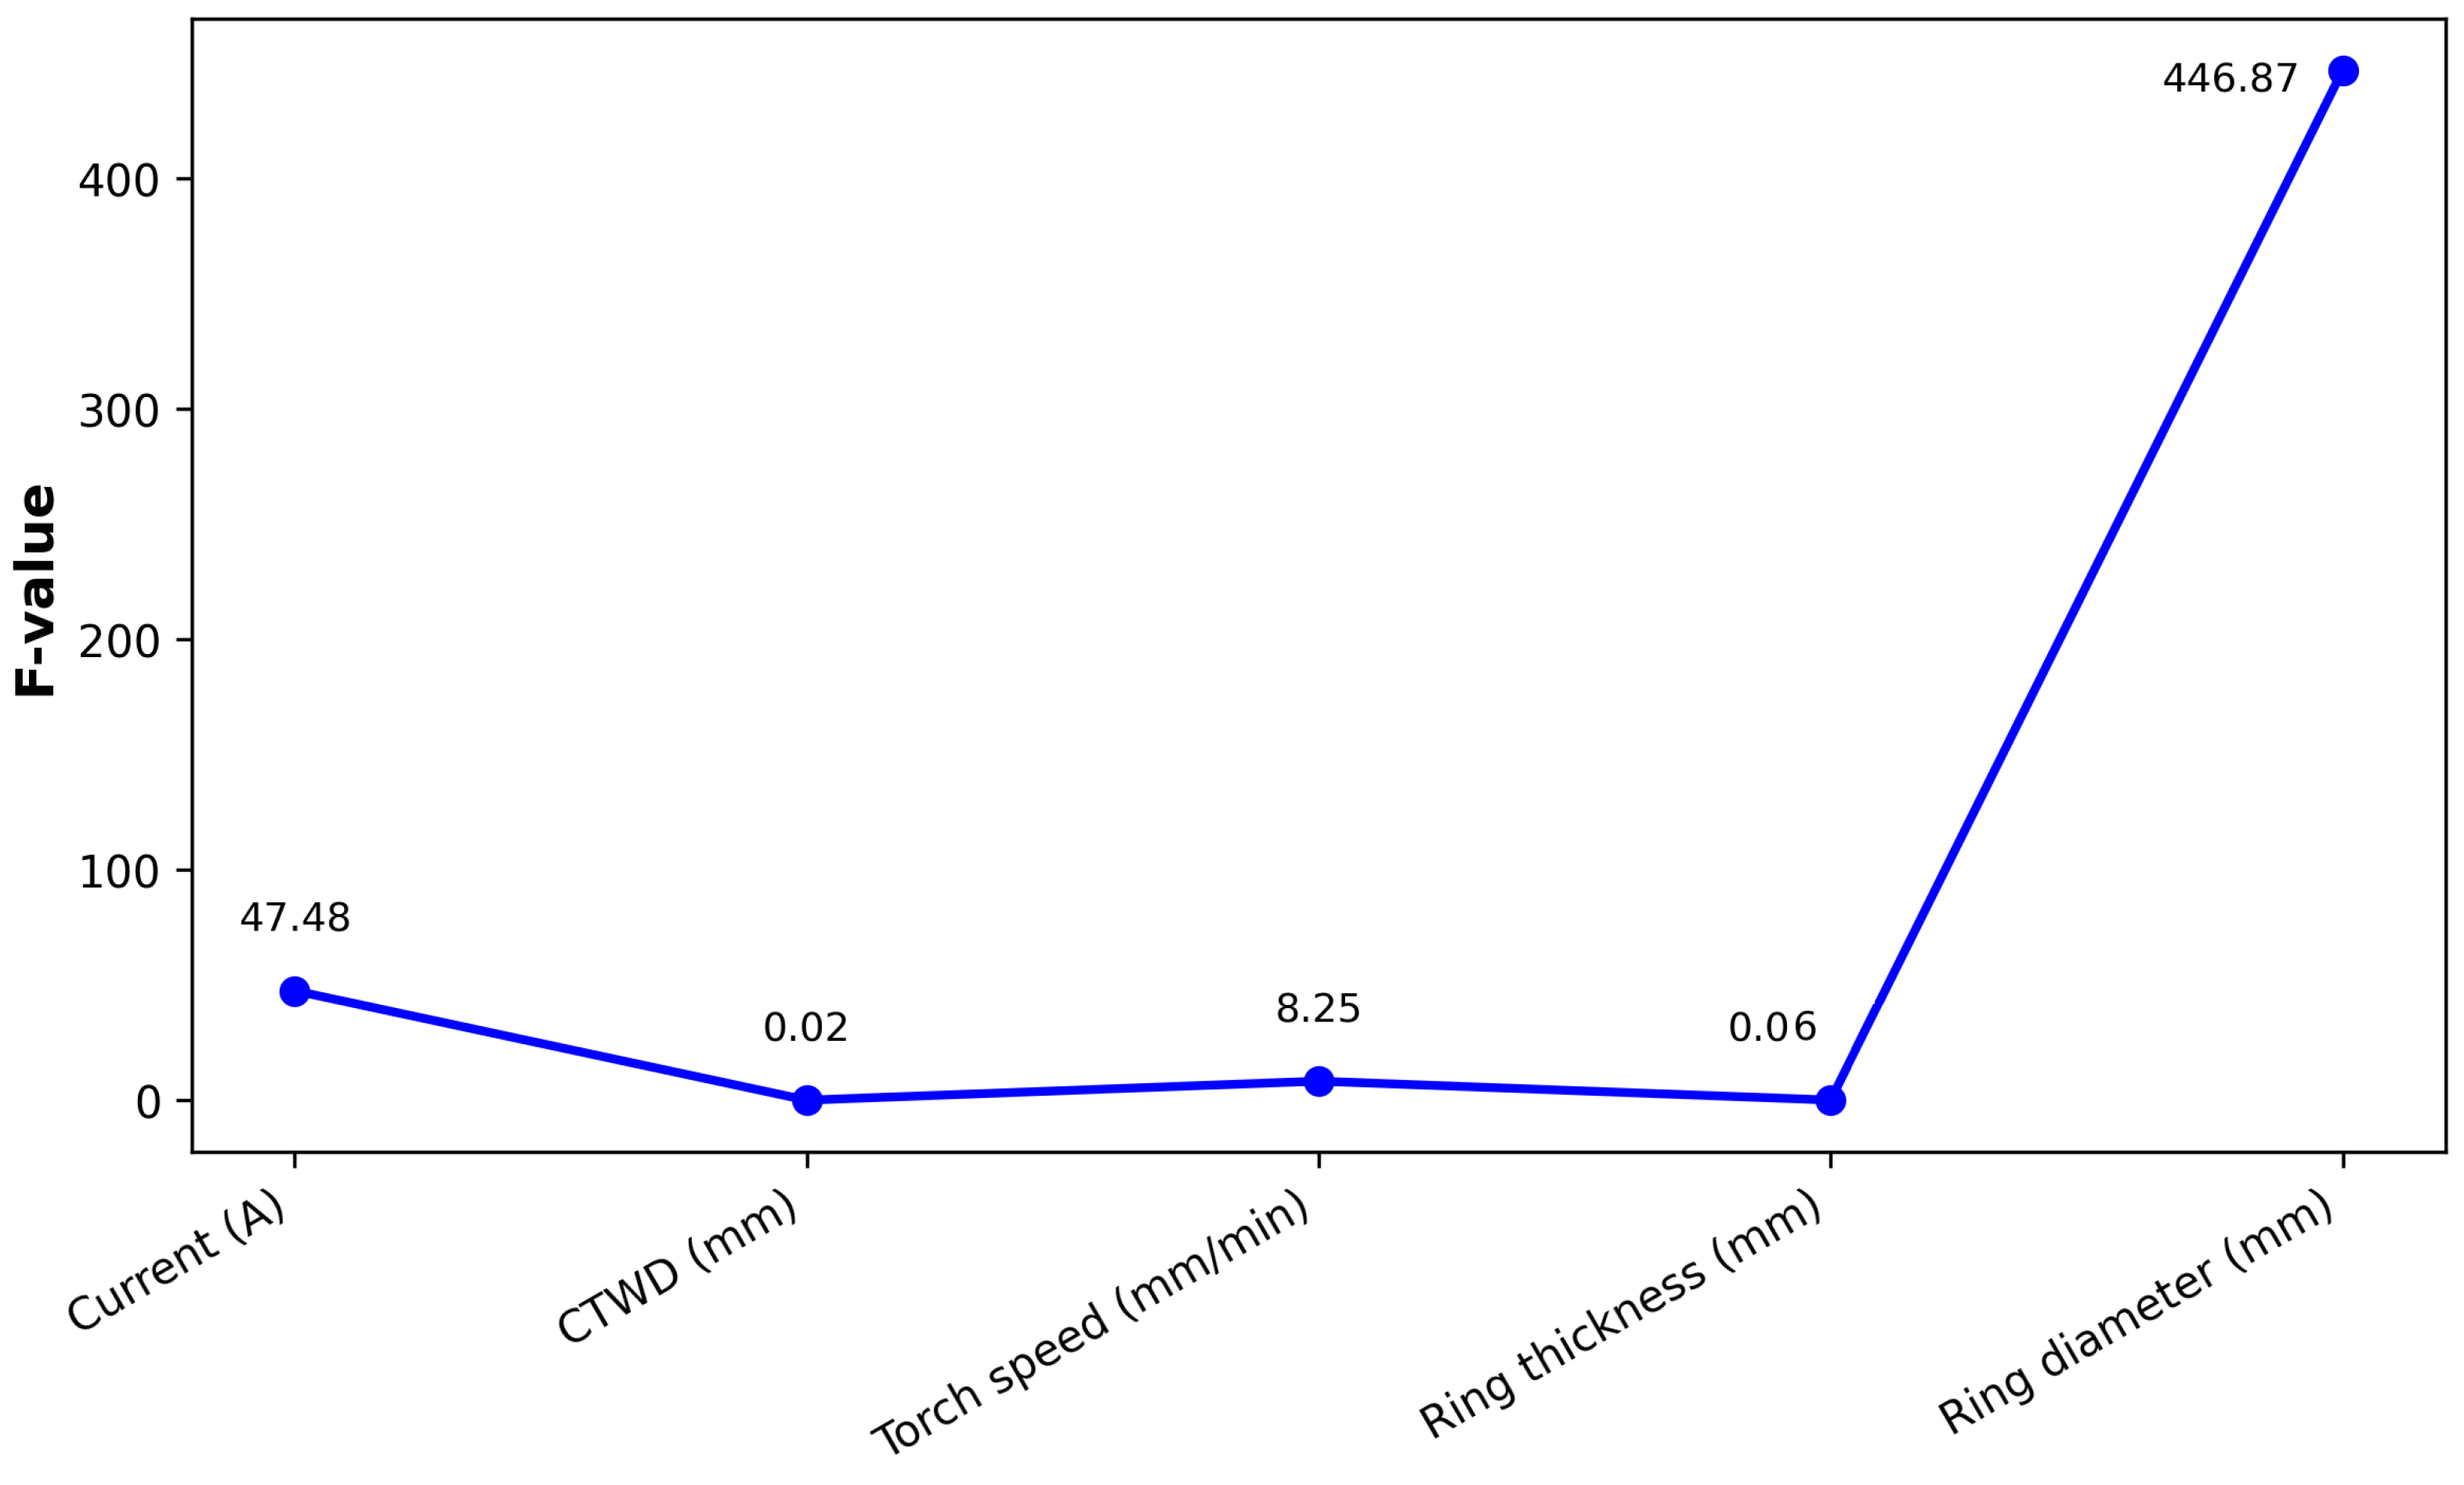
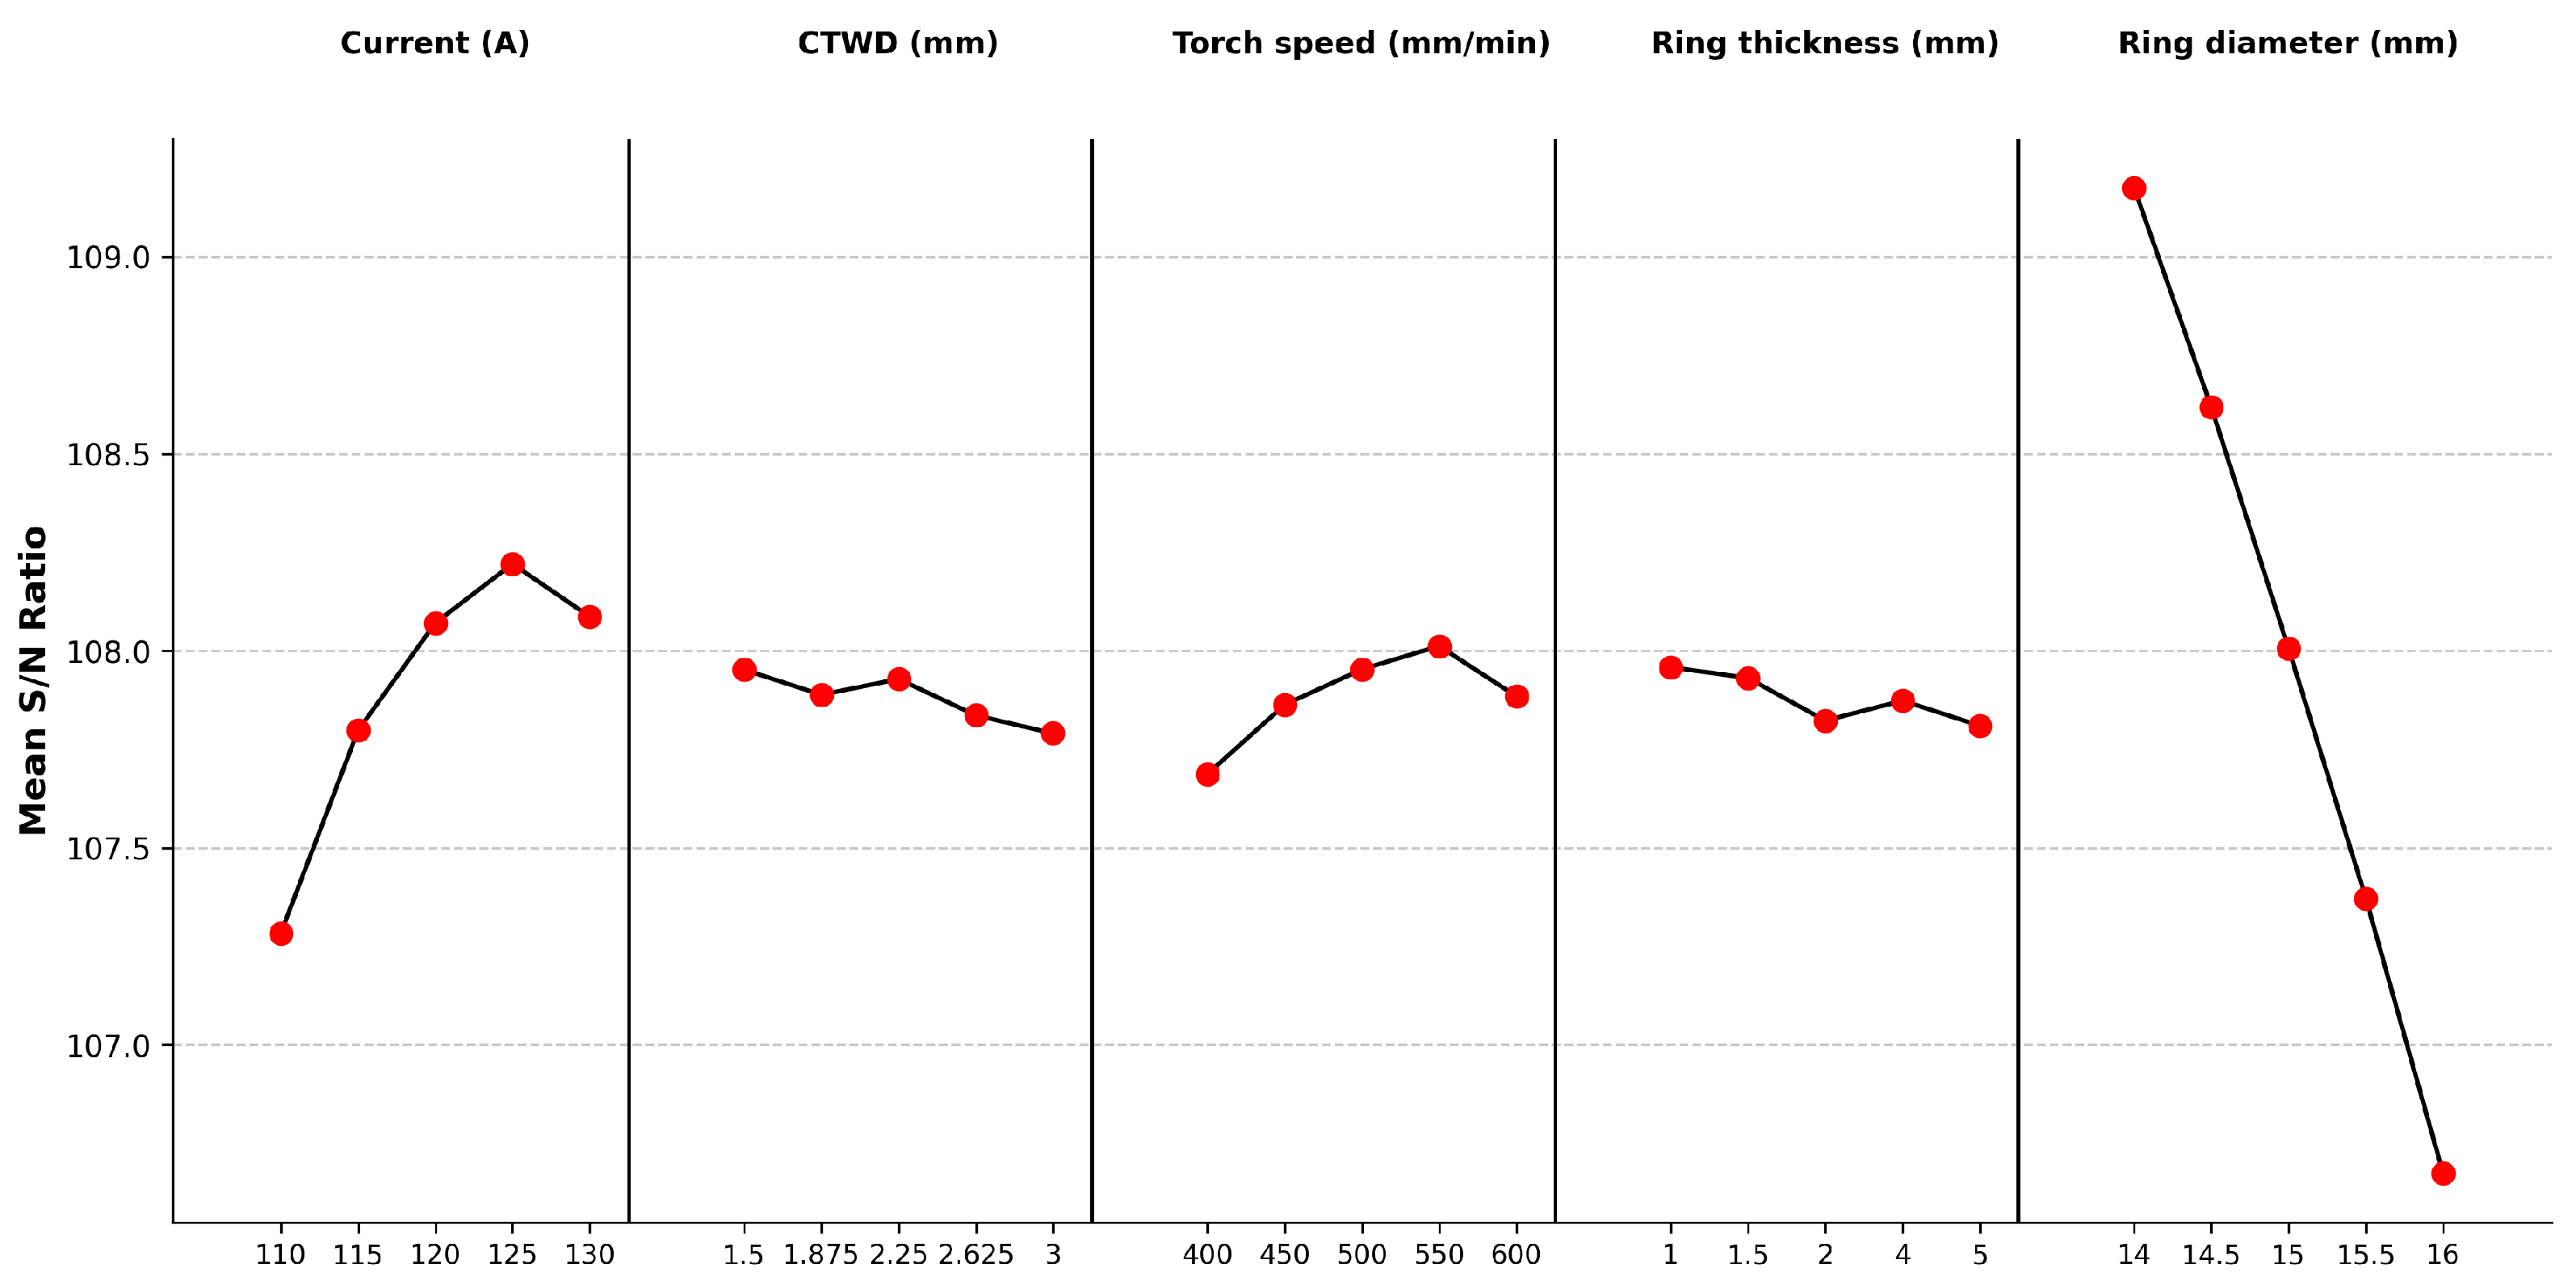
Table 4 and Figure 10 support the ANOVA findings, confirming ring diameter as the dominant factor (Rank 1, Delta 2.5, S/N = 109.2 at 14.0 mm, 85.79% contribution), followed by current intensity (Rank 2, Delta 0.9, S/N = 108.3 at 125 A, 9.11% contribution) and torch speed (Rank 3, Delta 0.4, S/N = 108.1 at 550 mm/min, 1.58% contribution). Ring thickness (Rank 5, Delta 0.0, S/N = 108.0 at 1.0 mm, 0.014% contribution) and CTWD (Rank 4, Delta 0.1, S/N = 108.0 at 1.5 mm, 0.032% contribution) have negligible impact. The low error (3.514%) indicates that the model explains 96.486% of fatigue life variance, with minor unexplained variability possibly due to parameter interactions.

3.3. S/N Ratio for Process Robustness

The Taguchi method was used to analyze the influence of the five process parameters—ring diameter, welding current, torch speed, ring thickness, and CTWD—on the fatigue life of WAAM-fabricated metal shafts. The signal-to-noise (S/N) ratio, using the “larger-the-better” criterion, was calculated for the fatigue life data from the Taguchi L25 orthogonal array experiments to identify optimal parameter settings for maximizing durability [39,42]. The S/N ratio is defined as
S / N = 10 · log 10 1 n i = 1 n 1 y i 2 ,
where y i is the fatigue life (cycles to failure) for each experimental run, and n is the number of replicates (five specimens per run). The mean S/N ratios for each parameter level were calculated and plotted to determine optimal settings. Table 5 shows the S/N ratio results for each parameter level (larger is better), highlighting optimal settings for robust performance.
The S/N ratio analysis aligns with the ANOVA results (Table 4), identifying ring diameter as the primary factor influencing fatigue life (Delta = 2.5, 85.79% contribution), with 14.0 mm yielding the highest S/N ratio (109.2) and fatigue life (299,730 cycles, run 17) by reducing weld interfaces and defects. Current intensity (Delta = 0.9, 9.11% contribution) at 125 A and torch speed (Delta = 0.4, 1.58% contribution) at 550 mm/min significantly enhance weld quality, contributing to peak fatigue performance [4,8]. Ring thickness (Delta = 0.0, 0.014% contribution) at 1.0 mm and CTWD (Delta = 0.1, 0.032% contribution) at 1.5 mm have minimal impact, with flat S/N trends (Figure 11), but support process stability.
Figure 12 displays the mean fatigue life (cycles to failure) for each level of the five process parameters, calculated from the Taguchi L25 experimental data in Table 3. This figure complements the S/N ratios by visually summarizing the direct impact of parameter levels on fatigue life.
Trends in Figure 11 (S/N ratios) and Figure 12 (mean fatigue life) are consistent, confirming the reliability of the optimal settings (14.0 mm, 125 A, 550 mm/min, 1.0 mm, 1.5 mm) identified through Taguchi analysis for high-fatigue-resistance components.

3.4. Standardized Regression Results

Standardized regression coefficients were calculated to evaluate the relative impact and direction of each parameter on fatigue life. This analysis quantifies the magnitude and direction (positive or negative) of each parameter’s effect, aiding in prioritizing process adjustments [31,40]. Table 6 lists the standardized regression coefficients.
Figure 13 presents a bar chart of the standardized regression coefficients for the five process parameters, as reported in Table 6. The results confirm ring diameter as the dominant factor, with the highest absolute standardized coefficient (25,557.3), indicating a strong negative correlation (−25,557.3) where smaller diameters (e.g., 14.0 mm) significantly enhance fatigue performance (299,730 cycles, run 17, Table 3). Current intensity follows with a coefficient of 8330.821, contributing notably to fatigue life through improved weld quality at 125 A. Torch speed (coefficient 3472.234) has a moderate positive effect, with 550 mm/min optimizing fatigue life. Ring thickness (coefficient 294.5029) and CTWD (coefficient −156.723, lowest absolute value 156.7231) have minimal impact, consistent with their negligible contributions in ANOVA (Table 4, 0.014% and 0.032%) and S/N ratios (Table 5, Delta 0.0 and 0.1). These results reinforce the optimal settings (14.0 mm, 125 A, 550 mm/min, 1.0 mm, 1.5 mm) for achieving high fatigue life, driven by reduced defects and enhanced weld uniformity [22,42].

3.5. R-Squared Model Fit Analysis

The R-squared and adjusted R-squared values were calculated to assess the goodness-of-fit of the linear regression model, quantifying its ability to explain variability in fatigue life based on the five process parameters. Table 7 presents the R2 values for the linear regression model across the training, validation, test, and overall datasets, derived from the fatigue life data, providing a clear measure of the model’s predictive accuracy for each data subset.
Figure 14 displays a bar chart of the R2 values for the linear regression model across the training, validation, test, and overall datasets, as reported in Table 7. The model demonstrates high predictive accuracy, with an overall R2 of 0.9603, indicating that 96.03% of the variance in fatigue life is explained by the process parameters. The training R2 (0.9427) and validation R2 (0.9734) reflect strong model fit across these datasets, while the test R2 (0.775) suggests moderate performance on unseen data. These results, aligned with the high fatigue life of 299,730 cycles at optimal settings (14.0 mm, 125 A, 550 mm/min, 1.0 mm, 1.5 mm), confirm the model’s reliability in capturing the influence of key parameters, particularly ring diameter (85.79% contribution; highest coefficient 25,557.3), followed by current intensity and torch speed. The low unexplained variance (3.97%) supports the model’s robustness, consistent with ANOVA and S/N ratio analyses [1,43].

4. Discussion

4.1. Parameter Effects

The Analysis of Variance (ANOVA) results identify ring diameter as the dominant factor influencing the fatigue performance of 3D-printed metal shafts fabricated via Wire Arc Additive Manufacturing (WAAM) with stacked steel ring substrates, followed by current intensity and torch speed, while ring thickness and contact tip to workpiece distance (CTWD) exhibit minimal influence. This section evaluates the impact of each parameter on fatigue performance under rotating bending, supported by experimental data, signal-to-noise (S/N) ratio analysis, and regression modeling, with comparisons to existing literature.

4.1.1. Ring Diameter

Ring diameter exerts the most substantial influence on fatigue performance, as evidenced by its high F-value (446.87) and low p-value (<0.001) in the ANOVA results, accounting for 85.79% of the variance. A smaller ring diameter of 14.0 mm yields the highest fatigue life, with experimental run 17 achieving 299,730 cycles, significantly outperforming larger diameters such as 16.0 mm (run 5, 200,682 cycles). This trend is confirmed by the S/N ratio analysis, where the 14.0 mm diameter corresponds to the highest S/N value (109.2), indicating optimal process robustness for fatigue performance [2,6]. The superior performance of smaller ring diameters can be attributed to reduced stress concentrations at the interfaces between stacked rings. In the WAAM process, specimens are machined to a uniform 17 mm diameter post-fabrication (Section 2.2). A 14.0 mm ring diameter requires a thicker deposited layer (1.5–2 mm) compared to larger diameters (e.g., 16.0 mm, requiring 0.5 mm deposition). This thicker layer minimizes weld interfaces, reducing defects such as porosity and lack-of-fusion, which are common crack initiation sites in WAAM components. Additionally, smaller diameters improve load distribution under rotating bending, slowing crack propagation. These findings align with studies on WAAM aluminum alloys, where geometric optimization reduces stress concentrations and enhances fatigue resistance [10,44], and on WAAM Ti-6Al-4V [17].

4.1.2. Current Intensity

Current intensity is the second most influential parameter, with a notable F-value and low p-value, indicating a substantial effect on fatigue life. The optimal current intensity of 125 A, identified through S/N ratio analysis, achieves high fatigue performance, as observed in run 17. Higher currents (e.g., 130 A in run 21) reduce fatigue life due to increased heat input, which promotes grain coarsening and oxide inclusions in the CT3 steel microstructure.
The 125 A setting balances heat input to ensure robust bonding at ring interfaces while minimizing defects. Excessive heat from higher currents can coarsen the microstructure, increasing susceptibility to fatigue crack initiation, as reported in WAAM super duplex stainless steel [16,33,43]. Conversely, lower currents (e.g., 120 A) may result in incomplete fusion, weakening interlayer bonding [4]. The regression analysis shows a positive coefficient for current intensity, suggesting that moderate increases within the tested range (120–130 A) enhance fatigue performance by improving weld quality. This aligns with research on WAAM steel, where controlled heat input improves microstructure and mechanical properties [22,40,41].

4.1.3. Torch Speed

Torch speed has a moderate influence on fatigue performance, with a significant but lower F-value compared to ring diameter and current intensity. The optimal torch speed of 550 mm/min is considered to balance weld pool geometry and cooling rate, as evidenced by the high fatigue life in run 17. Slower speeds (e.g., 400 mm/min) increase heat accumulation, leading to residual stresses that reduce fatigue resistance [21]. Faster speeds (e.g., 600 mm/min) can compromise interlayer bonding due to insufficient heat input, as observed in WAAM stainless steel [12].
At 550 mm/min, the cooling rate is considered to promote finer ferrite grains in CT3 steel, enhancing fracture toughness and fatigue performance [22]. This speed ensures uniform weld bead geometry, reducing surface irregularities that act as stress concentrators under cyclic loading. The regression coefficient for torch speed is positive, indicating that moderate increases in speed improve fatigue life by optimizing thermal conditions, consistent with findings in WAAM steel [21,37].

4.1.4. Ring Thickness and CTWD

Ring thickness and CTWD have negligible effects on fatigue performance, as indicated by low F-values and high p-values in the ANOVA results. The optimal ring thickness of 1.0 mm enhances interlayer bonding by increasing the number of weld interfaces, reducing defects such as porosity [16]. Similarly, a CTWD of 1.5 mm optimizes arc stability and metal transfer, minimizing spatter and ensuring consistent weld quality [45]. However, their contributions to fatigue life are minor compared to ring diameter, current intensity, and torch speed.
These findings align with literature indicating that ring thickness and CTWD play secondary roles in WAAM, primarily affecting surface quality and weld bead geometry rather than mechanical performance [23]. The regression coefficients for both parameters are small, confirming their limited impact in the stacked-ring configuration. Nevertheless, thinner rings and shorter CTWD contribute to overall process stability, supporting defect-free fabrication [2].

4.2. Optimal Parameter Settings and Process Implications

The S/N ratio analysis identifies optimal settings for maximizing fatigue performance: ring diameter at 14.0 mm (S/N = 109.1748706), current intensity at 125 A (S/N = 107.8849151), torch speed at 550 mm/min (S/N = 108.0097367), ring thickness at 1.0 mm (S/N = 107.9584119), and CTWD at 1.5 mm (S/N = 108.0097367). These settings, validated by run 17 achieving the highest fatigue life of 299,730 cycles, are optimal for producing durable components.
These findings have significant implications for WAAM process optimization. The stacked-ring configuration enables complex internal geometries, such as cooling channels or hollow structures, while maintaining fatigue performance comparable to wrought materials [4,29]. These optimal settings are ideal for producing high-fatigue-resistance components, such as turbine blades in aerospace or drivetrain shafts in automotive applications, meeting stringent reliability requirements [6,46]. The four-point welding strategy and CNC-controlled deposition ensure concentricity and robust bonding, minimizing thermal distortion and delamination risks [6]. However, the unexplained fatigue life variability of 3.5% suggests potential interactions (e.g., current-speed) and factors such as shielding gas composition, warranting further investigation [3].

4.3. Comparison with Literature and Novelty

The notable influence of ring diameter on fatigue performance, with an optimal value of 14.0 mm reducing surface waviness and stress concentrations, aligns with geometric optimization studies in WAAM [2,7]. The stacked-ring configuration enhances this effect through complex interfacial stress gradients, achieving a fatigue life of 299,730 cycles—surpassing the 150,000–250,000 cycles reported for conventional WAAM steel components under similar rotating bending conditions [6,14,19]. Current intensity at 125 A improves microstructure, consistent with findings in WAAM martensitic stainless steel [14], while a torch speed of 550 mm/min optimizes weld uniformity, corroborating Vishwanatha et al. (2024) [37]. Ring thickness (1.0 mm) and CTWD (1.5 mm) play secondary roles, supporting prior parameter analyses [23,31], though their impact on stacked configurations remains underexplored. The linear regression model (R2 = 0.9603) offers high predictive accuracy, aligning with predictive frameworks in WAAM steel studies [34,39]. Yet the 3.5% unexplained variance suggests unmodeled interactions (e.g., current-torch speed synergy), a limitation also noted by Wu (2018) [4]. The novelty of this study lies in the systematic evaluation of the stacked-ring WAAM configuration, enabling the fabrication of intricate structures with enhanced fatigue performance. The integrated Taguchi L25 design, ANOVA, S/N ratio, and regression analysis provide a robust optimization framework, addressing fatigue deficiencies in stacked-ring setups [7,22,42]. This approach outperforms traditional methods by tailoring parameters to complex geometries, with the four-point welding strategy (Figure 6) ensuring concentricity and robust interlayer bonding, thus mitigating delamination risks under cyclic loads [41]. The model’s predictive power supports reliable fatigue life estimation, enhancing WAAM’s applicability for inner complex shapes in aerospace turbine blades and automotive drivetrain components [6,8], while the current linear model is effective, the incorporation of Response Surface Methodology (RSM)—as demonstrated in powder-based AM for capturing non-linear effects [24,25]—could further refine optimization, addressing the 3.5% variance and aligning with future research directions.

4.4. Limitations and Future Research Directions

The linear regression model developed in this study demonstrates strong predictive accuracy with an R2 of 0.9603; however, approximately 3.5% of the variability in fatigue life remains unexplained, suggesting the presence of unmodeled interactions among process parameters such as current intensity, torch speed, and their impact on weld pool dynamics and defect formation [23]. The fixed Ar-CO2 shielding gas composition (8–10 L/min) limits the exploration of its effects on microstructure and defect density, whereas alternative mixtures like Ar-O2 could potentially reduce oxide inclusions and enhance fatigue resistance [3,29]. Additionally, the Taguchi L25 orthogonal array effectively captures main effects but lacks the capability to fully address synergistic interactions, particularly in the context of the stacked steel ring configuration, which may influence interlayer bonding and residual stress distribution [23,41]. The study’s focus on CT3 steel and a specific ring geometry further limits its generalizability to other materials, such as titanium or aluminum alloys, and alternative substrate designs critical for diverse industrial applications [17,20]. To address these limitations, future research should integrate Response Surface Methodology (RSM) to model non-linear effects and parameter interactions, building on the current ANOVA framework to refine weld quality optimization [24,25]. RSM could, for example, map the combined influence of current intensity and torch speed on fatigue life, addressing the 3.5% variance and providing a more comprehensive response surface for process control [26]. Concurrently, investigating a range of shielding gas compositions (e.g., Ar-O2 vs. Ar-CO2) is recommended to optimize microstructure and minimize defects, leveraging insights from studies on gas-metal interactions in WAAM [3,30,31]. Finite element analysis (FEA) should be employed to simulate stress distributions and thermal distortions in stacked ring configurations, enhancing the prediction of fatigue life under varying geometries [47]. Extending the scope to multiaxial fatigue testing beyond the current ISO 1143:2021 [35] rotating bending protocol will validate the robustness of optimal settings across complex loading conditions relevant to aerospace and automotive components [14,46]. Finally, implementing real-time monitoring systems to track arc stability, weld pool dynamics, and defect formation could ensure consistent quality, facilitating the transition of WAAM technology to high-reliability industrial applications [36,44]. These advancements will bridge the gap between current findings and the development of durable, industry-ready components.

5. Conclusions

The investigation of Wire Arc Additive Manufacturing (WAAM)-fabricated shafts with stacked steel ring substrates yields the following key outcomes:
  • Enhanced fatigue performance of 3D-printed metal shafts, achieving 299,730 cycles under rotating bending (ISO 1143:2021) with optimal parameters: ring diameter 14.0 mm, current 125 A, torch speed 550 mm/min, ring thickness 1.0 mm, and CTWD 1.5 mm.
  • ANOVA from the Taguchi L25 design identified ring diameter as the dominant factor (85.79% variance, F-value = 446.87, p < 0.001), optimizing fatigue life at 14.0 mm (S/N = 109.2). Current (9.11%, S/N = 108.3) and torch speed (1.58%, S/N = 108.1) at 125 A and 550 mm/min improved performance, while ring thickness and CTWD had minimal impact (0.014% and 0.032%, S/N = 108.0). The Ar-CO2 shielding gas (8–10 L/min) reduced oxide inclusions, with a regression model yielding R2 = 0.9603 and 3.5% unexplained variance.
  • The stacked-ring WAAM configuration, optimized via Taguchi L25, ANOVA, and regression, enables high-fatigue-resistance components for aerospace and automotive applications. The four-point welding strategy mitigates delamination, and Response Surface Methodology (RSM) is recommended to address the 3.5% variance using non-linear modeling.

Author Contributions

Conceptualization, P.S.M., Q.T.T. and V.-M.N.; methodology, V.-M.N. and P.S.M.; software, V.-M.N. and P.S.M.; validation, P.S.M., Q.T.T. and V.-M.N.; formal analysis, V.-M.N. and P.S.M.; investigation, V.-M.N., Q.T.T. and P.S.M.; resources, P.S.M. and V.-M.N.; data curation, V.-M.N. and P.S.M.; writing—original draft preparation, V.-M.N., P.S.M. and Q.T.T.; writing—review and editing, V.-M.N., P.S.M. and Q.T.T.; visualization, V.-M.N. and P.S.M.; supervision, V.-M.N. and P.S.M.; project administration, V.-M.N. and P.S.M.; funding acquisition, V.-M.N., P.S.M. and Q.T.T. All authors have read and agreed to the published version of the manuscript.

Funding

This research was funded by HCMC University of Technology and Education, grant number T2024-23.

Data Availability Statement

The original contributions presented in this study are included in the article. Further inquiries can be directed to the corresponding author.

Acknowledgments

The authors acknowledge the support of HCMC University of Technology and Education for this study.

Conflicts of Interest

The authors declare no conflicts of interest.

Abbreviations

The following abbreviations are used in this manuscript:
WAAMWire Arc Additive Manufacturing
ANOVAAnalysis of Variance
CTWDContact Tip to Workpiece Distance
MIGMetal Inert Gas
GMAWGas Metal Arc Welding
CT3Carbon Steel Type 3
S/NSignal-to-Noise Ratio

References

  1. Li, Y.; Su, C.; Zhu, J. Comprehensive Review of Wire Arc Additive Manufacturing: Hardware System, Physical Process, Monitoring, Property Characterization, Application and Future Prospects. Results Eng. 2022, 13, 100330. [Google Scholar] [CrossRef]
  2. Williams, S.W. Wire + Arc Additive Manufacturing. Mater. Sci. Technol. 2016, 32, 641–647. [Google Scholar] [CrossRef]
  3. Cunningham, C.R.; Flynn, J.M.; Shokrani, A.; Dhokia, V.; Newman, S.T. Invited Review Article: Strategies and Processes for High Quality Wire Arc Additive Manufacturing. Addit. Manuf. 2018, 22, 672–686. [Google Scholar] [CrossRef]
  4. Wu, B. A Review of the Wire Arc Additive Manufacturing of Metals: Properties, Defects and Quality Improvement. J. Manuf. Process. 2018, 35, 127–139. [Google Scholar] [CrossRef]
  5. Shah, A. A Review of the Recent Developments and Challenges in Wire Arc Additive Manufacturing (WAAM) Process. J. Manuf. Mater. Process. 2023, 7, 97. [Google Scholar] [CrossRef]
  6. Jafari, D.; Vaneker, T.H.J.; Gibson, I. Wire and Arc Additive Manufacturing: Opportunities and Challenges to Control the Quality and Accuracy of Manufactured Parts. Mater. Des. 2021, 202, 109471. [Google Scholar] [CrossRef]
  7. Ding, D. Wire-Feed Additive Manufacturing of Metal Components: Technologies, Developments and Future Interests. Int. J. Adv. Manuf. Technol. 2015, 81, 465–481. [Google Scholar] [CrossRef]
  8. Pant, H. Applications of Wire Arc Additive Manufacturing (WAAM) for Aerospace Component Manufacturing. Int. J. Adv. Manuf. Technol. 2023, 127, 4995–5011. [Google Scholar] [CrossRef]
  9. Langelandsvik, G. Comparative Study of Eutectic Al-Si Alloys Manufactured by WAAM and Casting. Int. J. Adv. Manuf. Technol. 2020, 110, 4995–5011. [Google Scholar] [CrossRef]
  10. Omiyale, B.O.; Olugbade, T.O.; Abioye, T.E.; Farayibi, P.K. Wire Arc Additive Manufacturing of Aluminium Alloys for Aerospace and Automotive Applications: A Review. Mater. Sci. Technol. 2022, 38, 391–408. [Google Scholar] [CrossRef]
  11. Ryan, E.M.; Sabin, T.J.; Watts, J.F.; Whiting, M.J. The Influence of Build Parameters and Wire Batch on Porosity of Wire and Arc Additive Manufactured Aluminium Alloy 2319. J. Mater. Process. Technol. 2018, 262, 577–584. [Google Scholar] [CrossRef]
  12. Tomar, B.; Shiva, S.; Nath, T. A Review on Wire Arc Additive Manufacturing: Processing Parameters, Defects, Quality Improvement and Recent Advances. Mater. Today Commun. 2022, 31, 103739. [Google Scholar] [CrossRef]
  13. Dias, M. Economic and Environmental Potential of Wire-Arc Additive Manufacturing. Sustainability 2022, 14, 5197. [Google Scholar] [CrossRef]
  14. Ayan, Y.; Kahraman, N. Bending Fatigue Properties of Structural Steel Fabricated through Wire Arc Additive Manufacturing (WAAM). Eng. Sci. Technol. Int. J. 2022, 35, 101247. [Google Scholar] [CrossRef]
  15. Pandey, A.; Gaur, V. Effect of Dwell Time on Fatigue Properties of Wire-Arc Additively Manufactured IN718 Alloy. Int. J. Fatigue 2023, 176, 107863. [Google Scholar] [CrossRef]
  16. Albannai, A.I. A Brief Review on the Common Defects in Wire Arc Additive Manufacturing. Int. J. Curr. Sci. Res. Rev. 2022, 5, 4556–4576. [Google Scholar] [CrossRef]
  17. Baufeld, B.; Biest, O.; Gault, R. Additive Manufacturing of Ti-6Al-4V Components by Shaped Metal Deposition: Microstructure and Mechanical Properties. Mater. Des. 2010, 31, S106–S111. [Google Scholar] [CrossRef]
  18. Rao, Z.H.; Zhou, J.; Tsai, H.L. Determination of Equilibrium Wire-Feed-Speeds for Stable Gas Metal Arc Welding. Int. J. Heat Mass Transf. 2012, 55, 6651–6664. [Google Scholar] [CrossRef]
  19. Zong, L.; Fang, W.; Huang, C.; Wang, Z.; Gardner, L. Low Cycle Fatigue Behaviour of Wire Arc Additively Manufactured ER70S-6 Steel. Int. J. Fatigue 2023, 176, 107910. [Google Scholar] [CrossRef]
  20. Wang, F. Microstructure and Mechanical Properties of Wire and Arc Additive Manufactured Ti-6Al-4V. Metall. Mater. Trans. A 2012, 44, 968–977. [Google Scholar] [CrossRef]
  21. Dekis, M.; Tawfik, M.; Egiza, M.; Dewidar, M. Unveiling the Characteristics of ER70S-6 Low Carbon Steel Alloy Produced by Wire Arc Additive Manufacturing at Different Travel Speeds. Met. Mater. Int. 2025, 31, 325–338. [Google Scholar] [CrossRef]
  22. Anshari, M.A.A.; Mishra, R.; Imam, M.; Pandit, D.; Jha, K.K.; Kesharwani, R.; Kar, M.; Chinthapenta, V. Comparison of the Microstructures and Mechanical Properties in the Overlapping Region of Low Carbon Steel Additive Bead Fabricated by WAAM and FSP. Metall. Mater. Trans. A 2023, 54, 869–895. [Google Scholar] [CrossRef]
  23. Dinovitzer, M. Effect of Wire and Arc Additive Manufacturing (WAAM) Process Parameters on Bead Geometry and Microstructure. Addit. Manuf. 2019, 26, 138–146. [Google Scholar] [CrossRef]
  24. Mehrabi, O.; Seyedkashi, S.H.; Moradi, M. Experimental and response surface study on additive manufacturing of functionally graded steel-inconel wall using direct laser metal deposition. Opt. Laser Technol. 2023, 167, 109707. [Google Scholar] [CrossRef]
  25. Bhardwaj, S.; Sharma, S. Design and analysis of a response surface model to realize the mechanical properties of stainless steel in additive manufacturing. Int. J. Eng. Res. Technol. 2024, 13, 1234–1245. Available online: https://www.ijert.org/design-and-analysis-of-a-response-surface-model-to-realize-the-mechanical-properties-of-stainless-steel-in-additive-manufacturing (accessed on 16 August 2025).
  26. Jerold, S.; Kumar, R.P.; Thamizhmaran, K. Optimization of process parameters using response surface methodology: A review. Mater. Today Proc. 2021, 45, 6514–6518. [Google Scholar] [CrossRef]
  27. Chia, H.Y.; Wu, J.; Wang, X.; Yan, W. Process parameter optimization of metal additive manufacturing: A review and outlook. J. Mater. Inform. 2022, 2, 16. [Google Scholar] [CrossRef]
  28. Lewandowski, J.J.; Seifi, M. Metal additive manufacturing: A review of mechanical properties. Annu. Rev. Mater. Res. 2016, 46, 151–186. [Google Scholar] [CrossRef]
  29. Yamaguchi, M. Influence of Metal Transfer Behavior under Ar and CO2 Shielding Gases on Geometry and Surface Roughness of Single and Multilayer Structures in GMAW-Based Wire Arc Additive Manufacturing of Mild Steel. Int. J. Adv. Manuf. Technol. 2021, 119, 911–926. [Google Scholar] [CrossRef]
  30. Jurić, I. Influence of Shielding Gas Composition on Structure and Mechanical Properties of Wire and Arc Additive Manufactured Inconel 625. JOM 2018, 71, 703–708. [Google Scholar] [CrossRef]
  31. Barath Kumar, M.D.; Arivazhagan, N.; Tofil, S.; Andersson, J.; Kozak, J.; Manikandan, M. Influence of Pulsed Current GTAW-WAAM Process Parameters on the Single Layer Bead Geometry and Multi Bead Multi-Layer Deposition of a Nickel-Based Superalloy. Mater. Today Commun. 2024, 39, 108824. [Google Scholar] [CrossRef]
  32. Ganesan, G. Effect of Varying Layer Thickness by Interlayer Machining on Microstructure and Mechanical Properties in Wire Arc Additive Manufacturing. J. Manuf. Mater. Process. 2025, 9, 135. [Google Scholar] [CrossRef]
  33. Qu, G.; Guo, W.; Shi, J.; He, D.; Zhang, Y.; Dong, Y.; Chi, J.; Shen, Z.; Li, Y.; Chen, Z.; et al. Improvement of gradient microstructure and properties of wire-arc directed energy deposition titanium alloy via laser shock peening. Mater. Sci. Eng. A 2024, 198, 147422. [Google Scholar] [CrossRef]
  34. Kumar, J.P.; Raman, R.J.; Festus, N.J.; Kanmani, M.; Nath, S.P. Optimization of Wire Arc Additive Manufacturing Parameters Using Taguchi Grey Relation Analysis. In Proceedings of the 2023 International Conference on Intelligent Systems for Communication, IoT and Security (ICISCoIS), Coimbatore, India, 9 February 2023; pp. 108–113. [Google Scholar]
  35. ISO 1143:2021; Metallic Materials — Rotating Bar Bending Fatigue Testing. International Organization for Standardization: Geneva, Switzerland, 2021.
  36. Treutler, K.; Wesling, V. The Current State of Research of Wire Arc Additive Manufacturing (WAAM): A Review. Appl. Sci. 2021, 18, 8619. [Google Scholar] [CrossRef]
  37. Vishwanatha, H.M.; Rao, R.N.; Maiya, M.; Kumar, P.; Gupta, N.; Saxena, K.K.; Vijayan, V. Effects of Arc Current and Travel Speed on the Processing of Stainless Steel via Wire Arc Additive Manufacturing (WAAM) Process. J. Adhes. Sci. Technol. 2024, 38, 2222–2239. [Google Scholar] [CrossRef]
  38. Chen, C. Effect of Equivalent Heat Input on WAAM Al-Si Alloy. Int. J. Mech. Sci. 2023, 238, 107831. [Google Scholar] [CrossRef]
  39. Albannai, A.I.; Ramirez, A.J. The Effect of Altering Heat Input & Torch Motion on the Grain Formation of SS316L Material in WAAM. Discov. Mech. Eng. 2024, 3, 49. [Google Scholar] [CrossRef]
  40. Ajay, V.; Nakrani, J.; Mishra, N.K.; Shrivastava, A. Anisotropic Fatigue Crack Propagation in Wire Arc Additively Manufactured 316L Stainless Steel. Int. J. Fatigue 2023, 177, 107976. [Google Scholar] [CrossRef]
  41. Aldalur, E.; Veiga, F.; Suárez, A.; Bilbao, J.; Lamikiz, A. High Deposition Wire Arc Additive Manufacturing of Mild Steel: Strategies and Heat Input Effect on Microstructure and Mechanical Properties. J. Manuf. Process. 2020, 58, 615–626. [Google Scholar] [CrossRef]
  42. Wani, Z.K.; Abdullah, A.B.; Jaafar, N.A.; Hussain, Z. Multi-Stages, Multi-Responses Optimisation of Wire Arc Additive Manufacturing Parameters Using Taguchi Method. Mater. Today Proc. 2022, 66, 2660–2664. [Google Scholar] [CrossRef]
  43. Ahsan, M.R.U. Effects of Process Parameters on Bead Shape, Microstructure, and Mechanical Properties in Wire + Arc Additive Manufacturing of Al0.1CoCrFeNi High-Entropy Alloy. J. Manuf. Process. 2021, 68, 1314–1327. [Google Scholar] [CrossRef]
  44. Zhang, H. State-of-Art Review on the Process-Structure-Properties-Performance Linkage in Wire Arc Additive Manufacturing. Virtual Phys. Prototyp. 2024, 19, e2390495. [Google Scholar] [CrossRef]
  45. Assunção, M.T.; Queiroz, A.; Bracarense, A.Q. A Novel Strategy to Improve Melting Efficiency and Arc Stability in Underwater FCAW via Contact Tip Air Chamber. J. Manuf. Process. 2023, 104, 1–16. [Google Scholar] [CrossRef]
  46. Liberini, M. Selection of Optimal Process Parameters for Wire Arc Additive Manufacturing. Procedia CIRP 2017, 62, 470–474. [Google Scholar] [CrossRef]
  47. Ali, M.H.; Han, Y.S. A Finite Element Analysis on the Effect of Scanning Pattern and Energy on Residual Stress and Deformation in Wire Arc Additive Manufacturing of EH36 Steel. Materials 2023, 16, 4698. [Google Scholar] [CrossRef]
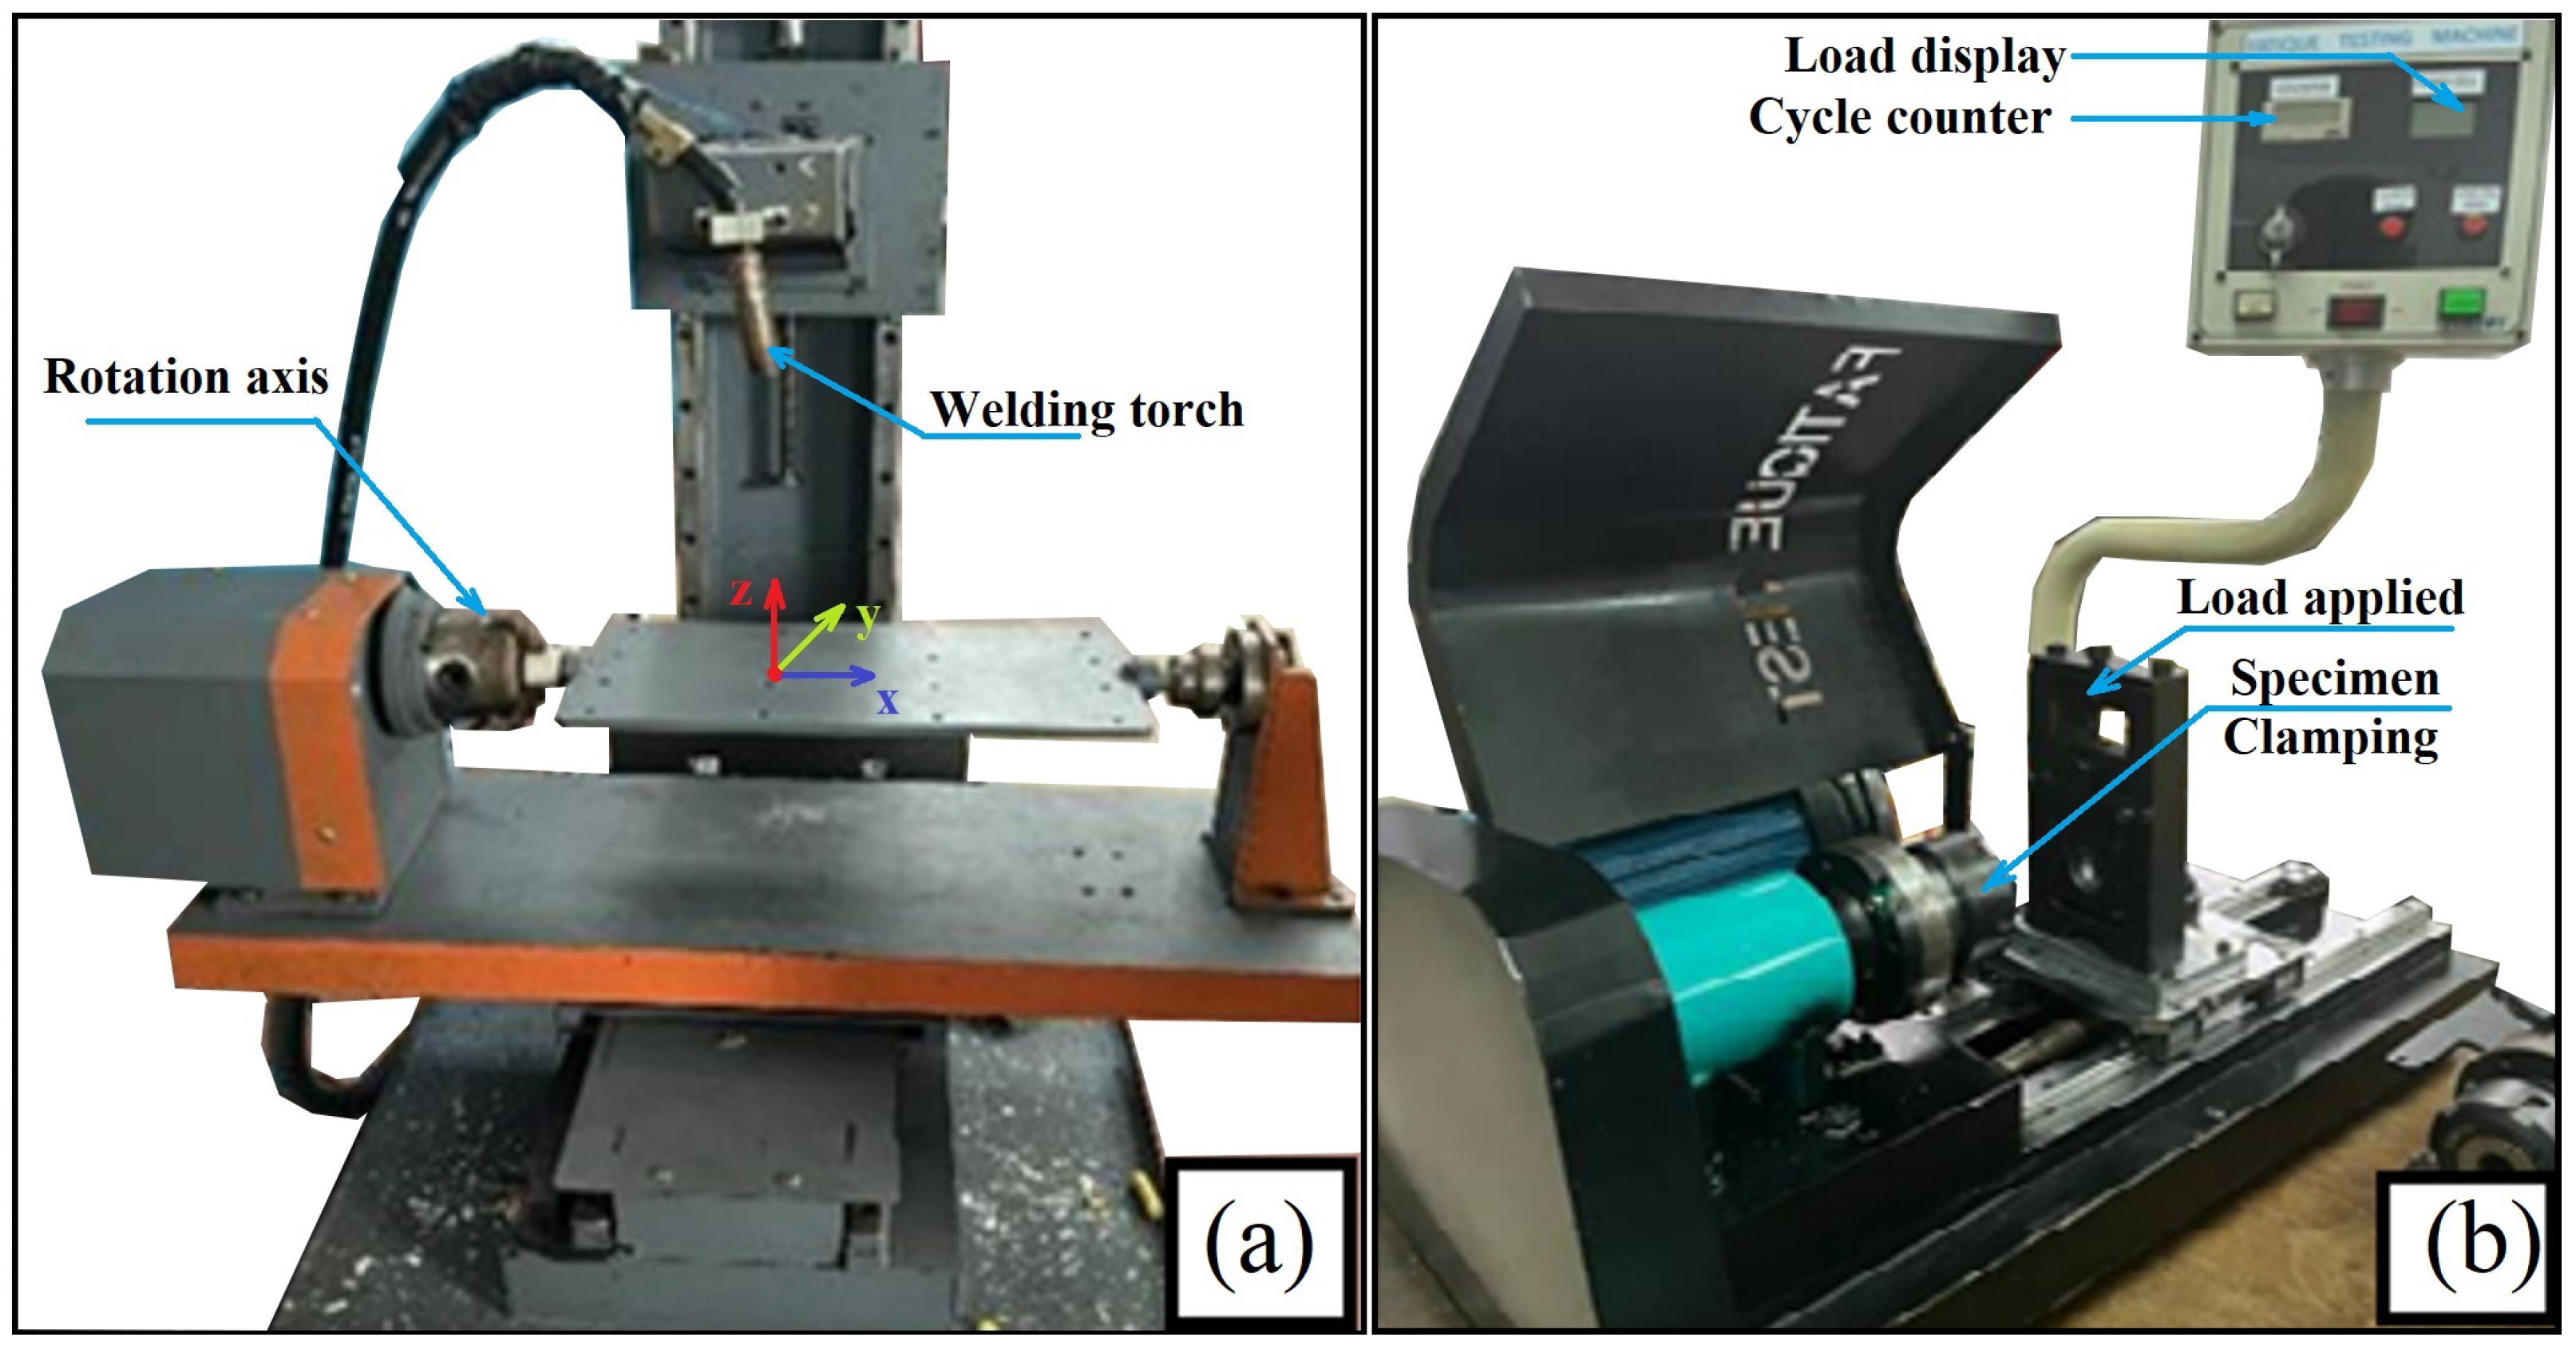
Figure 1. Experimental setup: (a) WAAM 4-Axis CNC system, (b) fatigue testing apparatus.
Metals 15 01110 g001
Figure 2. Schematic of contact tip to workpiece distance (CTWD) in WAAM.
Metals 15 01110 g002
Figure 3. Configuration of stacked steel ring substrates for WAAM.
Metals 15 01110 g003
Figure 4. Fatigue test specimen design.
Metals 15 01110 g004
Figure 5. Schematic of external WAAM process for cylindrical components.
Metals 15 01110 g005
Figure 6. WAAM welding strategies: (a) four-point welding, (b) multi-layered weld deposition.
Metals 15 01110 g006
Figure 7. Post-processing and inspection: (a) CNC Lathe machining, (b) inspected WAAM specimens.
Metals 15 01110 g007
Figure 8. Fatigue test results: (a) crack formation, (b) post-test specimens.
Metals 15 01110 g008
Figure 9. Mean fatigue life across Taguchi L25 experimental runs.
Metals 15 01110 g009
Figure 10. F-values for the five process parameters.
Metals 15 01110 g010
Figure 11. Main effects plot for S/N ratios of fatigue life.
Metals 15 01110 g011
Figure 12. Mean fatigue life across parameter levels.
Metals 15 01110 g012
Figure 13. Standardized regression coefficients for fatigue life.
Metals 15 01110 g013
Figure 14. R-squared values for linear regression model fit.
Metals 15 01110 g014
Table 1. Process parameters.
ParameterRange
Welding Current (I)110–130 A
Contact Tip to Workpiece Distance (CTWD)1.5–3 mm
Torch Speed (V)400–600 mm/min
Steel Ring Diameter (D)14–16 mm
Steel Ring Thickness (h)1–5 mm
Table 2. Process parameters and levels for WAAM fabrication.
ParameterLevel 1Level 2Level 3Level 4Level 5
Welding Current (A)110115120125130
CTWD (mm)1.51.8752.252.6253.0
Torch Speed (mm/min)400450500550600
Ring Thickness (mm)1.01.52.04.05.0
Ring Diameter (mm)14.014.515.015.516.0
Table 3. Fatigue life results from Taguchi L25 orthogonal array experiments.
RunWelding
Current (A)
CTWD (mm)Torch Speed
(mm/min)
Ring Thickness
(mm)
Ring Diameter
(mm)
Fatigue Life
(Cycles)
11101.54001.014.0250,120
21101.8754501.514.5245,890
31102.255002.015.0240,750
41102.6255504.015.5235,620
51103.06005.016.0200,682
61151.54502.015.5238,450
71151.8755004.016.0232,780
81152.255505.014.0260,340
91152.6256001.014.5255,670
101153.04001.515.0248,910
111201.55005.014.5252,430
121201.8755501.015.0258,760
131202.256001.515.5246,320
141202.6254002.016.0241,890
151203.04504.014.0265,230
161251.55501.516.0242,560
171251.8756002.014.0299,730
181252.254004.014.5254,890
191252.6254505.015.0249,670
201253.05001.015.5247,340
211301.56004.015.0243,120
221301.8754005.015.5239,890
231302.254501.016.0237,560
241302.6255001.514.0262,450
251303.05502.014.5256,780
Table 4. ANOVA results for fatigue life.
ParameterDoFSum of Squares (SS)F-Valuep-ValueContribution (%)
Welding Current (A)41.73 × 10947.480.0019.11
CTWD (mm)46.14 × 1050.020.8960.032
Torch Speed (mm/min)43.01 × 1088.250.0021.58
Ring Thickness (mm)42.16 × 1080.060.0480.014
Ring Diameter (mm)416.32 × 109446.87<0.00185.79
Error46.68 × 1083.514
Total2419.062 × 109100.0
Table 5. Signal-to-noise (S/N) ratios for fatigue life.
LevelCurrent (A)CTWD (mm)Torch Speed (mm/min)Ring Thickness (mm)Ring Diameter (mm)
1107.4108.0107.8108.0109.2
2107.9108.0107.9108.0108.6
3108.2108.0108.1108.0108.0
4108.3108.0108.1108.0107.4
5108.2107.9108.0108.0106.7
Delta0.90.10.40.02.5
Rank24351
Table 6. R2 Values for fatigue life regression.
ParameterStandardized CoefficientAbsolute Value
Ring diameter (mm)−25,557.325,557.3
Current (A)8330.8218330.821
Torch speed (mm/min)3472.2343472.234
Ring thickness (mm)294.5029294.5029
CTWD (mm)−156.723156.7231
Table 7. R2 values of the linear regression model.
Training R2Validation R2Test R2Overall R2
0.94270.97340.7750.9603
Disclaimer/Publisher’s Note: The statements, opinions and data contained in all publications are solely those of the individual author(s) and contributor(s) and not of MDPI and/or the editor(s). MDPI and/or the editor(s) disclaim responsibility for any injury to people or property resulting from any ideas, methods, instructions or products referred to in the content.