Article

Vacuum Diffusion Bonding Process Optimization for the Lap Shear Strength of 7B04 Aluminum Alloy Joints with a 7075 Aluminum Alloy Powder Interlayer Using the Response Surface Method

1
Engineering Technology Training Center, Nanjing University of Industry Technology, Nanjing 210023, China
2
Jiangsu Key Laboratory of Precision and Micro-Manufacturing Technology, Nanjing University of Aeronautics and Astronautics, Nanjing 210016, China
*
Author to whom correspondence should be addressed.
Metals 2025, 15(10), 1109; https://doi.org/10.3390/met15101109
Submission received: 19 September 2025 / Revised: 30 September 2025 / Accepted: 3 October 2025 / Published: 6 October 2025
(This article belongs to the Section Welding and Joining)

Abstract

The high-strength aluminum alloy 7B04 used in aircraft structures poses challenges in welding. In this study, 7075 aluminum alloy powder is used as an interlayer to strengthen the vacuum diffusion bonding (DB) joint of 7B04 aluminum alloy. Surface treatments with plasma activation before DB can effectively increase the bonding rate and lap shear strength (LSS) of the joint. The effects of DB temperature, pressure, and holding time on the joint LSS were analyzed by developing a quadratic regression model based on the response surface method (RSM). The model’s determination coefficient reached 99.52%, with a relative error of about 5%, making it suitable for 7B04 aluminum alloy DB process parameters optimization and joint performance prediction. Two sets of process parameters (505 °C-5.7 h-4.5 MPa and 515 °C-7.5 h-4.4 MPa) were acquired using the satisfaction function optimization method. Experimental results confirmed that the error between measured and predicted LSS is approximately 5%, and a higher LSS of 174 MPa was achieved at 515 °C-7.5 h-4.4 MPa.

Graphical Abstract

1. Introduction

Aluminum alloy 7B04 is a typical high-strength Al-Zn-Mg-Cu alloy mainly used in aircraft structures such as fuselage skins and stringers because of its excellent strength-toughness balance, low density, good stress corrosion resistance, and fatigue resistance [1,2,3]. However, welding aluminum alloys by traditional fusion welding methods is quite challenging due to the unstable arc, forming undesirable intermediate phases, distortion, porosity, excessive spatter, and softening of the heat-affected zone [4,5]. Additionally, porosity caused by the solubility of hydrogen from the base material, environment, and air can lead to cracks and reductions in mechanical properties in aluminum joints [6]. Diffusion (DB) bonding, a solid-state welding technology, can provide higher joint quality with comparatively less formation of brittle intermetallic compounds (IMC), residual stress, microstructural degradation, segregation, and minimal deformation [7,8]. It is ideal for welding applications that require precise connections, particularly for parts with complex structures and strict accuracy demands, such as cooling plates and microchannel heat sinks [9]. The DB process can join flat surfaces of similar and dissimilar materials with or without an interlayer [7,10]. A different metal interlayer can be introduced between the two connecting metals in DB to accelerate the diffusion process, to improve the contact of the connection surface by increasing local deformation, or to reduce the formation of intermetallic compounds at the interface [7]. Bonding temperature, pressure, holding time, and surface treatment are key factors influencing the joint performance [7,10,11,12].
Surface roughness significantly impacts the interface initially contacts, void evolution, and interface DB [12]. Chang et al. [11] suggest using a smoother, higher creep resistance surface on the base material to accelerate void closure and enhance the joint quality of solid-state diffusion-bonded austenitic/ferritic steel. Simulations indicate that rougher surfaces promote void formation on the base side. As roughness lessens, surface and interface source diffusion mechanisms encourage void shrinkage, greatly decreasing bonding time. Li et al. [13] found that the power law creep contribution to void shrinking increased and then decreased with roughness in Ti-6Al-4V alloy DB. Plastic deformation and surface source mechanisms were unaffected by roughness. Besides surface roughness, the surface oxide film significantly influences the DB process of aluminum alloy. The presence of the surface oxide film, which has limited solubility in the base metal and maintains good stability even at elevated temperatures, hinders atomic diffusion [14]. Surface oxide film must be removed or modified before DB. Zhang et al. [15] examined two different techniques for treating aluminum alloy surfaces: mechanical grinding and chemical etching. The experiments revealed that chemical etching was more effective than mechanical grinding at removing the oxide film from aluminum alloy surfaces and resulted in better welding quality. Increased surface roughness and coating with an organic solution immediately after removing surface oxides improved the bond quality [7]. Vacuum [16] or a protective environment [17] can also shield joining surfaces from oxidation, showing promising results.
The DB process is usually performed at a lower temperature range between 0.5 and 0.8 of the absolute melting point of parent metals, with slightly lower pressure and durations from minutes to hours [7]. In the published literature, many efforts have been made to study the effects of temperature, pressure, and holding time on both similar and dissimilar joints with aluminum alloys. Aravinda et al. [14] identified an optimal Al2024 DB process parameter combination of a 120 kN load and 30 min holding time at 400 °C to achieve maximum tensile strength through experiments performed at a holding time of 20–30 min under loads of 80–20 kN in open air. Kurgan [17] also investigated the AA7075 DB process and achieved a maximum shear strength of 131 MPa at 450 °C and 3 MPa for 180 min. Liu et al. [18] examined the DB mechanism of 6061 aluminum alloy with an Al foil interlayer at temperatures ranging from 500 to 540 °C, under a load of 4 MPa for 120 min. The bonding rate reached 95.91%, and the shear strength reached 79 MPa at 540 °C. Song et al. [19] used spark plasma DB to join 5A06 aluminum alloy with an Al-20Cu-5Si-2Ni interlayer at temperatures ranging from 520 to 550 °C, pressures from 0.3 to 6 MPa, and holding times from 10 to 20 min. The tensile strength reached 220 MPa at a bonding temperature of 540 °C and a pressure of 6 MPa for 10 min. Mixed hydride/alanate nano powders were used as an interlayer in alumina bodies DB at lower temperatures of 200–400 °C by Hosseinabadi et al. [20]. Spinel oxide with MgAl2O4 stoichiometry formed in the reaction layer contributes to a high shear strength of 202 MPa at 400 °C for 30 min under 20 MPa. Wang et al. [21] used 1060 pure Al as an interlayer to bond titanium (TA1)/aluminum (5052) composite plates at temperatures ranging from 400 to 600 °C with a specified load of 5 MPa and a duration of 120 min. The interfacial shear strength reached 85.3 MPa at the optimal temperature of 500 °C. Zhang et al. [22] used a two-stage vacuum DB method for copper/graphite joints with an Al foil interlayer. The joint tensile strength increased from 25.8 to 38.6 MPa as the temperature rose from 600 to 900 °C, due to the increased diffusion distance of C atoms in Cu9Al4. Yin et al. [23] bonded pure Mg to pure Al, with and without a Ni layer, at 400, 420, and 440 °C for 30 min under 1 MPa load in the argon atmosphere. The joint strength improved with the Ni interlayer, reaching a maximum of 5.8 MPa at 420 °C. Silva et al. [24] studied the DB of Ti6Al4V/alumina with a titanium foil interlayer at 900, 950, and 1000 °C for 10 and 60 min, under contact pressure. Promising results were obtained at 950 °C for 60 min and 1000 °C for both 10 and 60 min. Alhazaa et al. [25] diffusion bonded Al7075 and Ti-6Al-4V sheets with a copper interlayer using spark plasma sintering (SPS). Experiments were conducted at 480, 500, and 520 °C under both 5 MPa and 10 MPa loads for 10 min. Bond strength tests and microstructure analysis showed that both temperature and pressure enhance copper diffusion, with complete diffusion achieved at 520 °C and 10 MPa.
The above research on determining process parameters mainly relies on the control variable method. However, DB parameters have interdependent relationships. Empirical models between the DB parameters and joint mechanical performance have been established to find optimal parameter combinations using orthogonal and response surface methods (RSM) combined with optimization functions. Rajakumar et al. [26] optimized the AA7075/titanium DB process by RSM, creating an empirical model between the independent parameters and response values such as shear strength, interlayer thickness, and interface hardness. The joint achieved maximum shear strength and hardness at a temperature of 510 °C, pressure of 15 MPa, and duration of 37 min, as determined by the model. Fernandus et al. [27] developed an empirical model to predict the maximum shear strength and tensile strength of the DB joints of Al6061/AZ61A based on RSM. The joint reached a maximum shear strength of 51.24 MPa and tensile strength of 72.10 MPa at 420 °C under a 7.70 MPa load for 27.15 min and a base metal surface roughness of 0.1 μm. The theoretical model predicted shear strength and tensile strength to be 52 MPa and 71 MPa, respectively, showing a high agreement between experimental results and the model. Elangovan et al. [28] identified the process parameters for maximum welded joint strength through the combined optimization of RSM and the genetic algorithm (GA). The RSM binary regression equation relating process parameters to joint quality served as the fitness function in the GA. The performance of the bonded joint under the optimized parameters from GA closely matched the experimental results. Fernandus et al. [29] conducted research on the DB process of magnesium and aluminum alloys. The joint was evaluated based on the microstructure bonding rate and shear strength. Limitation diagrams of DB parameters under different pressures, temperatures, and times were established to improve bonding results. Negemiya et al. [30] obtained the optimal combination of DB parameters for enhancing the lap shear strength (LSS) and bonding strength of IN-718/MSS-410 joints using RSM. Using a pressure of 14 MPa, a temperature of 960 °C, and a time of 90 min yielded a higher LSS of 280 MPa and a bonding strength of 373 MPa. The developed model accurately predicted the joint LSS and bonding strengths within a 2% error margin at 95% confidence.
The literature review demonstrates that proper surface treatment and optimized DB parameters—such as temperature, pressure, and holding time—using the response surface method can achieve both similar and dissimilar joints in aluminum alloys. However, few studies have reported on the diffusion bonding process of 7B04 aluminum alloy. It is crucial to find an effective surface treatment method for oxide removal and to establish a mathematical model for the joint performance of 7B04 aluminum alloy. This research aims to optimize the diffusion bonding process parameters—namely, bonding temperature, pressure, and holding time—of 7B04 aluminum alloy with a 7075 aluminum alloy powder interlayer using the response surface method to attain ideal joint lap shear strength.

2. Materials and Methods

2.1. Materials

7B04 aluminum alloy sheets, 1.2 mm thick and in the T74 heat treatment condition, were used for vacuum diffusion bonding. The material has a shear strength of 260 MPa and a tensile strength of 424 MPa. 7075 aluminum alloy powder with a mean particle size of 5 μm was used as an interlayer. The elemental compositions of 7B04 and 7075 are listed in Table 1.

2.2. Surface Treatment

The dense oxide film on the surface of the 7B04 aluminum alloy must be removed before DB. This study investigates the effects of physical/chemical cleaning and plasma treatment on the quality of diffusion bonding joints.
In physics/chemistry cleaning, the 7B04 samples were first wiped with ethanol, polished using sandpaper (including 400 #, 800 #, and 1500 #), and rinsed with ultrasonic water. Then, the samples were immersed in 5% NaOH solution for 5 min, followed by 30% HNO3 solution for 3 min, and rinsed with water. Finally, ultrasonic cleaning was performed with anhydrous ethanol. In plasma treatment, the 7B04 samples were first cleaned using the physics/chemistry method and then placed in a plasma surface treatment machine, TS-PL05 (Shenzhen Tonson Tech Automation Equipment Co., LTD., Shenzhen, China). The chamber was first evacuated and then filled with argon at a 400 mL/min gas flow rate. The power supply operated at 40 KHz with a radio frequency power of 600 W during the 15 min plasma surface treatment. Anhydrous ethanol was used for storage to prevent prolonged contact with air.

2.3. Diffusion Bonding Experiment

Diethylene glycol dibutyl ether was injected into the vacuum-packed 7075 aluminum alloy powder. Its 256 °C boiling point, low vaporization at room temperature, and strong surface adsorption prevent oxidation by adhering to surfaces. As the temperature rises during the DB process, the protective agent reaches its boiling point, vaporizes, and is evacuated from the vacuum furnace.
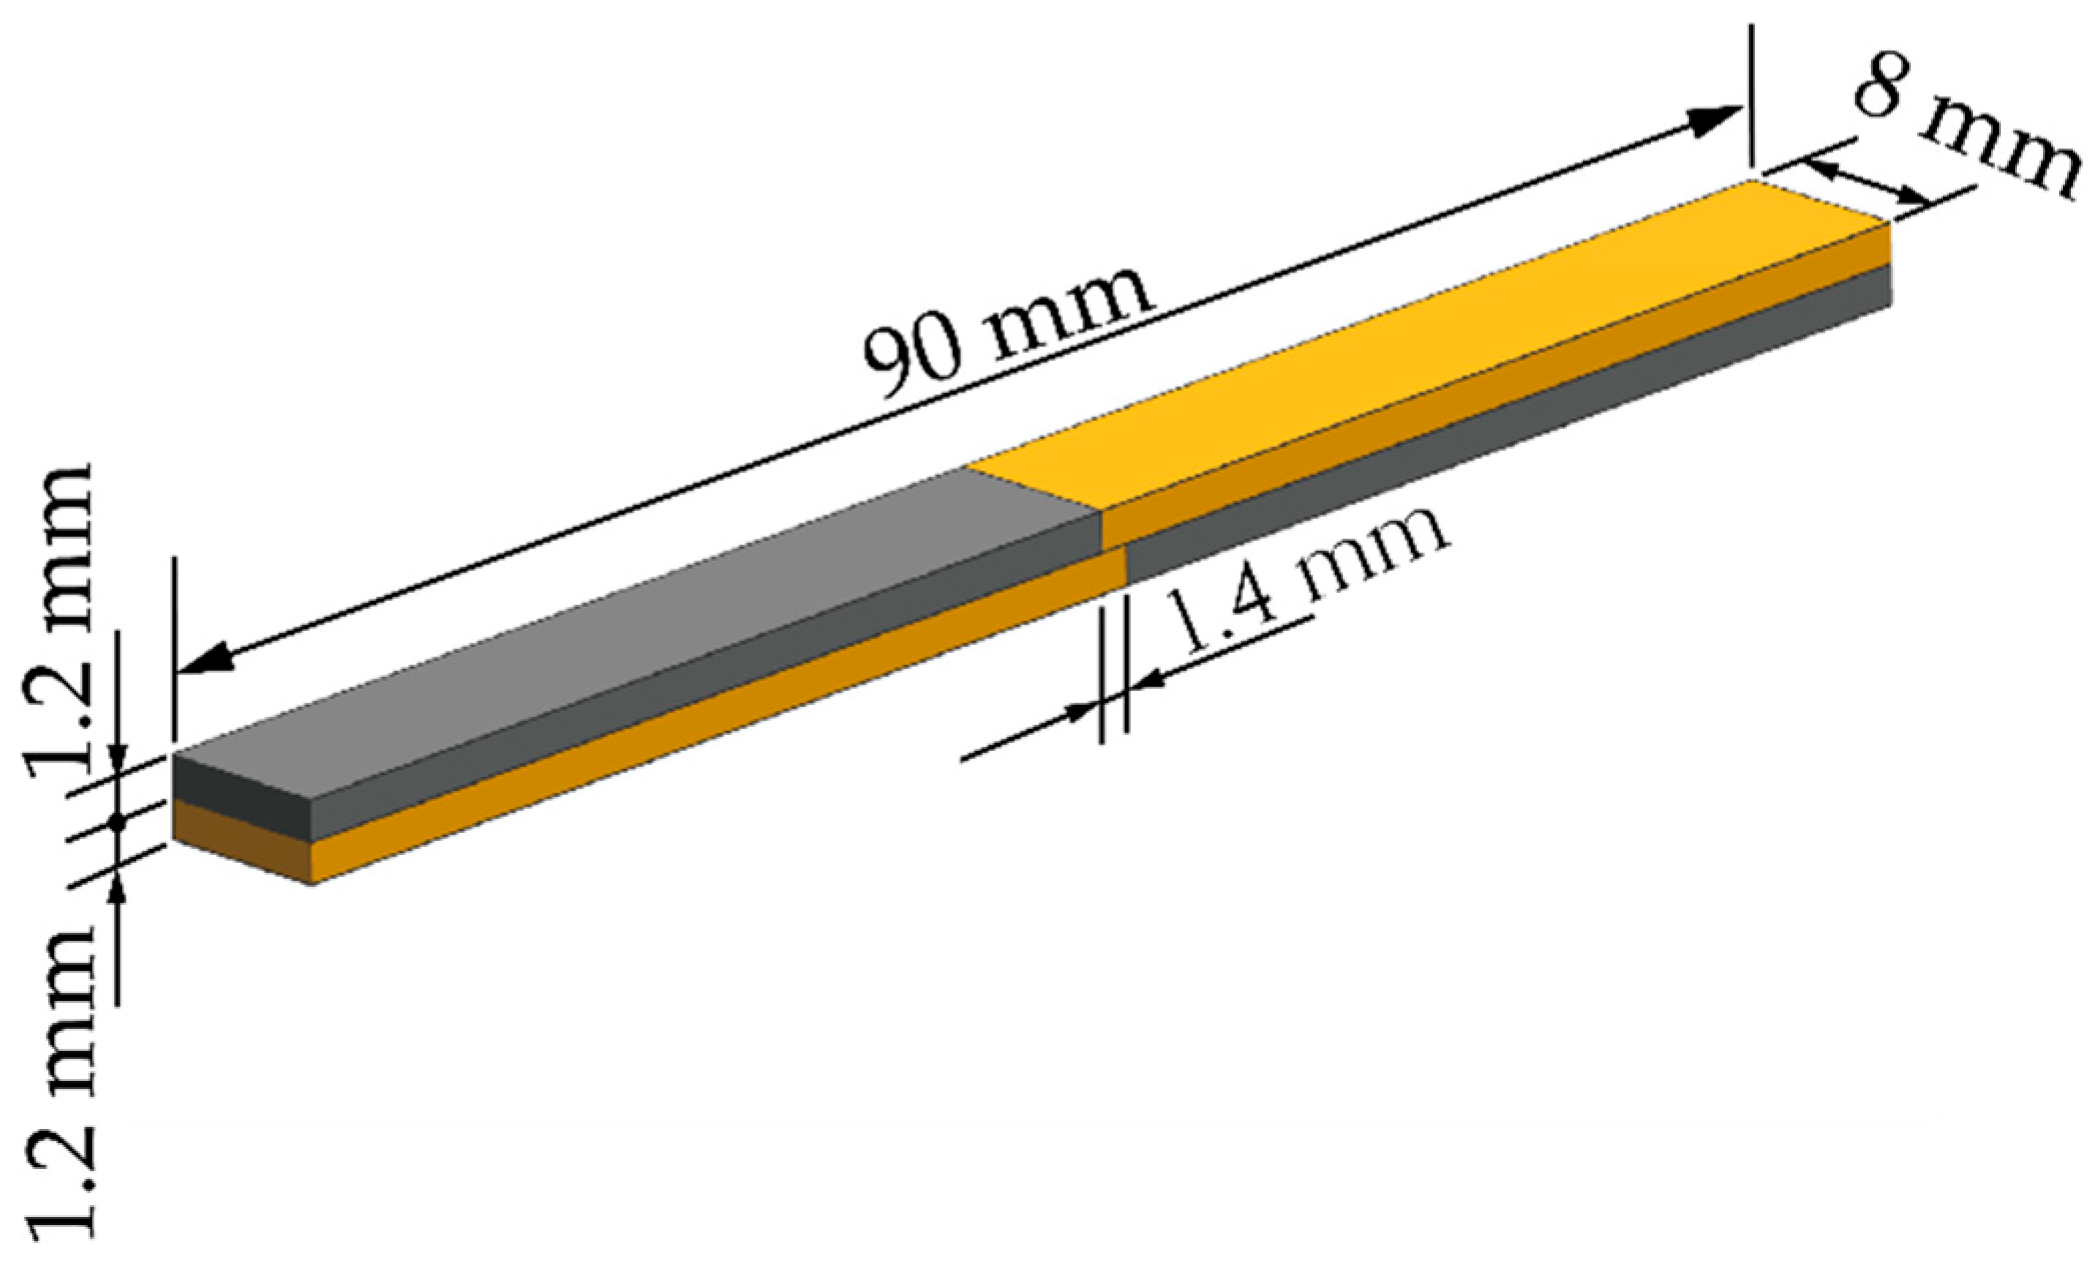
Figure 1 shows the assembly of 7B04 sheets and 7075 powder. The specimens used to determine the boundary conditions of the test and conduct microstructure analysis are 20 mm × 20 mm. The dimensions of specimens for the LSS tests of the diffusion-bonded joints are shown in Figure 2. The vacuum degree is below 10−3 Pa before heating and less than 10−2 Pa during the DB process. The load is applied when the mold reaches the target temperature and is maintained for a period. Then, the heating is turned off, and the pressure is released. The bonded samples are cooled in the furnace. During the DB process, the temperature was measured using a platinum-rhodium thermocouple with a tolerance of ±1.5 °C. The load was applied simultaneously to 10 LSS samples using a hydraulic press, with an error of ±1 KN (approximately ± 0.14 MPa) once the target temperature was reached. The timing started when the load was applied.
It is generally accepted that the diffusion bonding temperature range for materials is between 0.6 and 0.8 times the melting point of the base material. The melting point of 7B04 aluminum alloy is 640 °C, so the bonding temperature range would be from 384 °C to 512 °C. Based on relevant references and practical experience, the bonding temperature range for 7B04 aluminum alloy is set at 4550 °C to 530 °C. The pressure magnitude is a key factor in determining the quality of a bonded joint. If the pressure is too low, the contact surfaces will not be in full contact, preventing the formation of atomic diffusion channels and causing bonding failure. Conversely, if the bonding pressure is too high, the bonded parts may undergo severe deformation at high temperatures because of decreased yield strength. Based on previous test results, noticeable plastic deformation occurs in the base material if the pressure exceeds 5 MPa at a bonding temperature reaches 510 °C to 520 °C. Therefore, the bonding pressure should be kept below 5 MPa. Under the influence of temperature and pressure, atomic diffusion between materials also takes time. If the bonding time is too short, diffusion will be inadequate, leading to bonding failure. If the bonding time is too long, the grains in the base materials on both sides will grow, compromising the joint’s mechanical properties. Additionally, as the bonding time increases, the yield strength of the base material decreases, making the bonded parts more susceptible to significant deformation. Therefore, a proper bonding duration is essential for achieving successful welds and optimal performance. Based on previous project experience, the diffusion bonding test in this project specifies a bonding time of less than 10 h. The limits of DB process parameters were determined through tests using the single-factor method to achieve a sound joint without over-deformation or a significant reduction in mechanical properties. Tests show that the 7B04 base material experienced severe deformation at 530 °C. At 450 °C, the joint is not fully bonded. When the bonding time is 10 h, the base material undergoes severe deformation. The joint is still not fully bonded after 1 h. The base material undergoes severe deformation at 5 MPa, while at 2 MPa, the interface between the intermediate layer and the base material remains distinct, and the joint is not fully welded. The DB process parameters range is defined as temperature: 450–530 °C, pressure: 2–5 MPa, and time: 1–10 h.
A three-factor, five-level response surface experiment matrix was created using the central composite design (CCD) method. In the Design-Expert V.11 software, a small CCD design with four factorial experiments was used instead of a full CCD design to decrease the number of experimental points. The factor level values and coded values (±1, 0, ±21/2) are listed in Table 2. The detailed experimental design is shown in Table 3.

2.4. Microstructure Characterization

The metallographic sample was cut from the joint using electric discharge wire cutting. It was cold mounted and polished with sandpapers ranging from 400 # to 2500 #. Coarse polishing was performed using W3.5, W2.5, and W0.5 diamond grinding pastes to achieve a mirror surface. Then, an etching solution (1 mL HF, 1.5 mL HCl, 2.5 mL HNO3, 95 mL H2O) was applied for 10 s. The bonding interface was examined with a metallographic microscope MR5000 (Nanjing Ruiyuan Optical Instrument Co., Ltd., Nanjing, China).

2.5. Mechanical Test

The non-standard lap shear strength tests were conducted on diffusion-bonded joints of 7B04 aluminum alloy with a 7075 powder interlayer. The non-standard LSS specimen was designed as shown in Figure 2. The overlap length was designed as 1.4 mm to avoid fracture outside the overlap zone. To minimize the positioning error, the 7B04 sheets were electric discharge wire cut with a length tolerance of ±0.05 mm, and the LSS samples were assembled and held by a specific 310S steel mold with grooves measuring 90 mm × 10 mm × 1.5 mm. The LSS tests were performed on a UTM 5504X electronic universal testing machine (SUNSTEST Inc., Shenzhen, China). Additionally, an HVS-1000A microhardness tester (Laizhou MetalReader Test Instrument Co., Ltd., Laizhou, China) was used to measure the Vickers hardness of the bonded zone. The test force was 0.98 N, and the holding time was 10 s.

3. Results and Discussion

3.1. Effect of Surface Treatment on DB Joint Performance

3.1.1. Physics/Chemistry Cleaning

The surface roughness of 7B04 aluminum alloy after surface treatment was examined. Test results showed that the Ra values of the treated surfaces after polishing with 400 #, 800 #, and 1500 # grit sandpaper were 0.288 μm, 1.224 μm, 0.518 μm, and 0.409 μm, respectively. This demonstrates that after alkali and acid washing, the surface becomes extremely smooth, which helps ensure tight contact between the base material during bonding. The differences in surface roughness between the 800 # and 1500 # grit sandpaper were minimal, whereas the 400 # grit sandpaper produced higher roughness values.
The DB test used 5 μm 7075 aluminum alloy powder as the intermediate layer, with parameters set at 510 °C-4 h-4.5 MPa. Microstructural images of the joints treated with physics/chemistry cleaning using sandpapers of various grit sizes are shown in Figure 3. The results indicate that DB joints treated with coarse, medium, and fine sandpaper demonstrated good consistency and uniformity. However, insufficient atomic diffusion between the 7B04 base metal and the intermediate layer powder led to interfacial weld seams under the specified process parameters. Joints treated with 400 # sandpaper showed deep scratches, uneven bonding interfaces, and prominent interfacial weld seams. In contrast, joints processed without sandpaper, and with 800 # and 1500 # sandpapers, displayed narrow, fine weld seams. The surface roughness from different sandpaper treatments had little effect on bonding quality. Analysis suggests two main mechanisms: First, unlike diffusion bonding without powder interlayers, the 7075 powder embeds randomly into the surface of the base metal under pressure, increasing the effective physical contact area and improving bonding. Second, alkaline and acid washing reduced surface roughness variations across different sandpaper grades.

3.1.2. Plasma Treatment

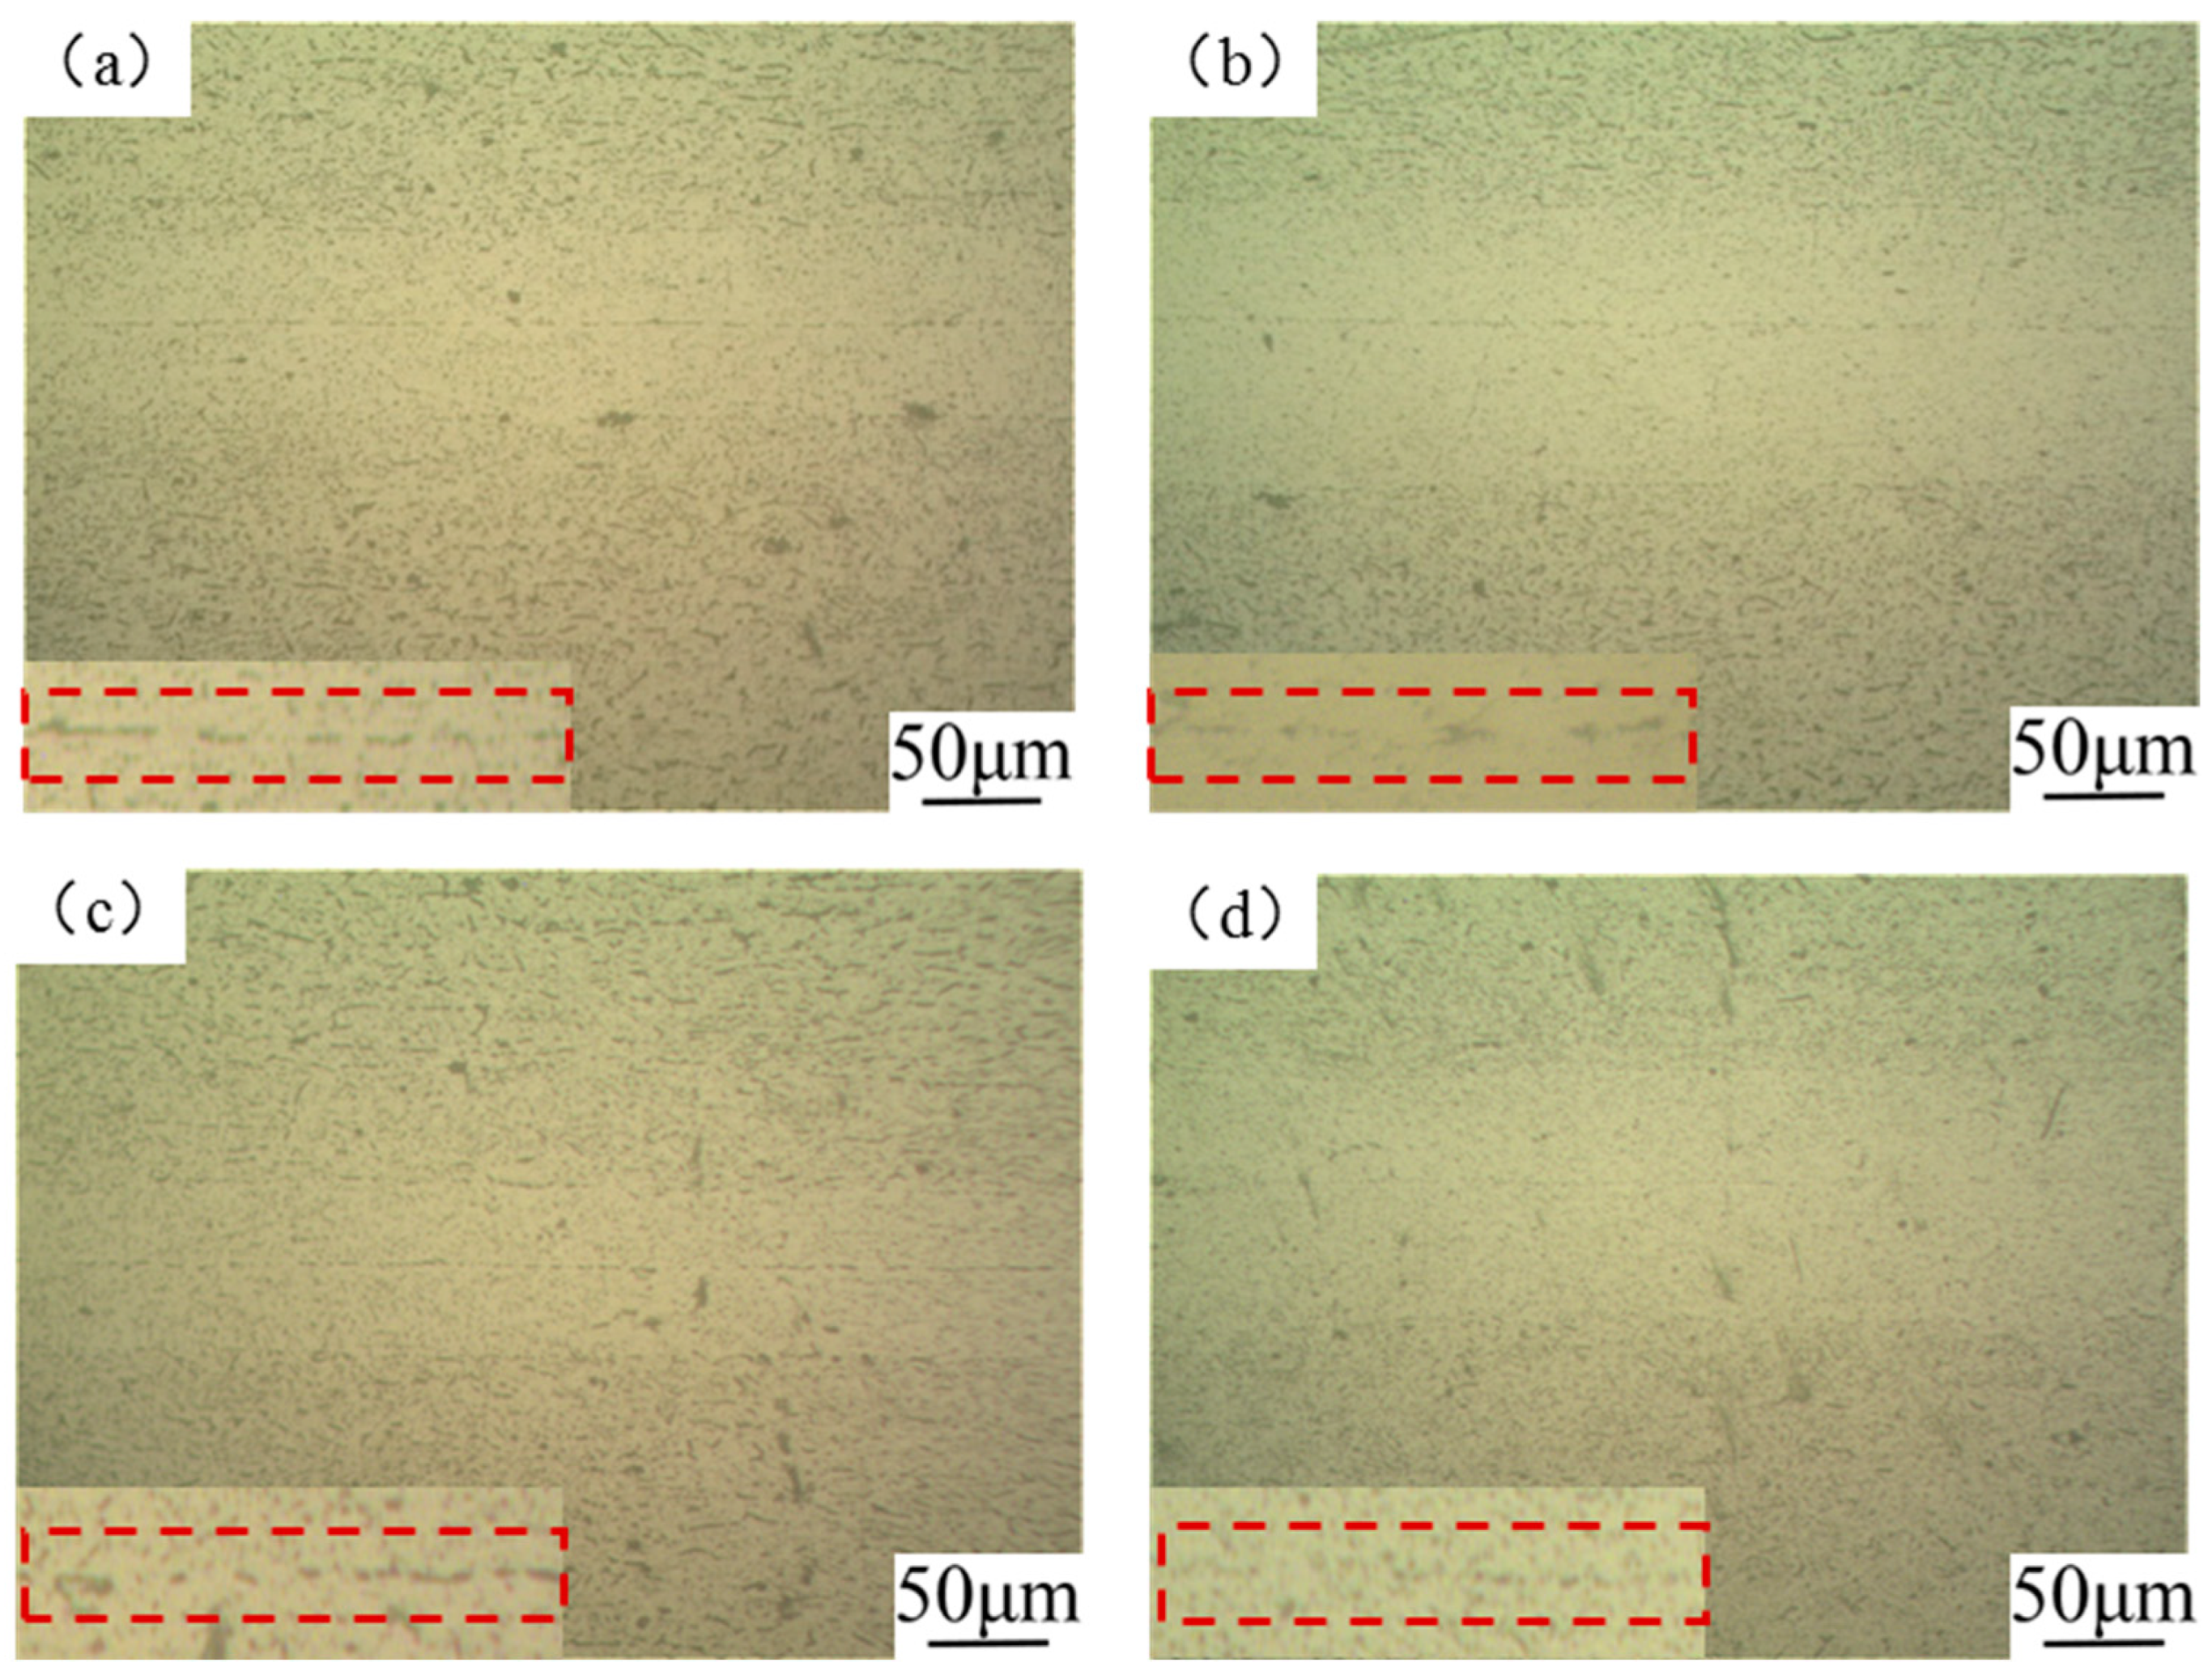
As shown in Figure 4, experimental results reveal that the weld seam at the joint interface after plasma treatment is not clear. Meanwhile, the continuous weld seam formed through DB with physical–chemical surface treatment becomes a point-connected structure after plasma treatment, indicating improved bonding. The physical impact of plasma on the surface of 7B04 base metal not only cleanses the material but also causes grain refinement to nanoscale sizes. This microcrystalline matrix structure promotes atomic diffusion between interfaces during bonding. Additionally, plasma treatment moderately increases surface roughness (measured as 0.436 μm after 1500 # sandpaper plasma cleaning), which enhances material wettability and adhesion. These improvements ensure the uniform coating of intermediate aluminum alloy powder layers.
Both experimental results with and without plasma treatment show that 1500 # sandpaper creates the best microstructure in bonded joints with medium surface roughness, leading to higher bonding rates. Using sandpaper with an appropriate particle size not only removes oxide layers but also loosens them, enabling more effective removal during alkali and acid washing processes and enhancing the DB process.
Figure 5 displays the LSS of diffusion bonded 7B04 aluminum alloy joints with physical/chemical and plasma cleaning treatments. The results show that joints treated with plasma surface treatment saw a slight improvement in LSS. Notably, the 1500 # sandpaper-treated specimens (both physical/chemical and plasma) had the highest LSS of 163.1MPa, which matches the microstructure observations. The plasma treatment improves the performance of DB joints, while the addition of a powder interlayer reduces the sensitivity of joint performance to surface roughness, making aluminum alloy surface preparation easier. However, to obtain the best experimental results and remove oxidation, we used 1500 # sandpaper pre-treatment before both alkaline and acid washing.

3.2. DB Process Parmeter Optimization with RSM

3.2.1. Establishment of LSS Prediction Model

In this experiment, the mathematical functional relationship between the response value LSS and DB parameters—specifically, bonding temperature, time, and pressure—is expressed as follows:
LSS = f(T, t, P)
In the formula, T is bonding temperature; t is bonding time; and P is bonding pressure.
The classical RSM model relies on variance consistency and employs a second-order polynomial regression equation expressed as follows:
LSS = b0 + Σbixi + Σbiixi2 + Σbijxixj + er
The specific formula for expanding the LSS of a 7B04 DB joint is as follows:
LSS = b0 + b1(T) + b2(t) + b3(P) + b11(T2) + bV(t2) + b33(P2) + b12(Tt) + b13(TP) + b23(tP)
In the formula, b0 is the average of response values, and b1, b2, … b23 are the regression coefficients for the linear, interaction, and quadratic terms of each parameter factor. The absolute values of these coefficients indicate how much each factor influences the LSS, while their positive or negative signs show the direction of the influence. The coefficients were calculated using Design-Expert V.11 software with the LSS test results shown in Table 3, and the final second-order response surface coding model equation was fitted accordingly.
LSS = 123.47 + 25.19(T) + 13.18(t) + 24.83(P) + 4.25(Tt) + 20.21(TP) − 13.27(tP) − 11.33(T2) − 16.06(t2) + 9.68(P2)
The significance of the fitted equation was tested using analysis of variance (ANOVA). The ANOVA results for the established second-order response surface model are shown in Table 4. The significance test results are indicated by the P1 value 0.0001 < P1 < 0.05, which shows the model is significant; 0.05 < P1 indicates the model is not significant; P1 < 0.0001 shows the model is highly significant. Additionally, the independent variables—temperature A, time B, and pressure C—as well as interaction terms AC and BC and secondary terms A2, B2, and C2 are significant (P1 < 0.05). The F-value suggests that the influence of the factors on LSS ranks as temperature > pressure > time.
The test range for the process parameters was determined through single-factor control variable tests based on the macroscopic deformation of the joint and its microscopic structure. Defects were observed using DB parameters set as shown in Table 5. The results indicate that the 7B04 base material experiences severe deformation at 530 °C, and the interface is not bonded at 450 °C. When the bonding time reaches 10 h, the base material is severely deformed, whereas at 1 h, the 7B04 is not bonded together. At a welding pressure of 5 MPa, the base material shows severe deformation, while at 2 MPa, the interface between the middle layer and the base material is clearly distinct.

3.2.2. Reliability Assessment of the LSS Prediction Model

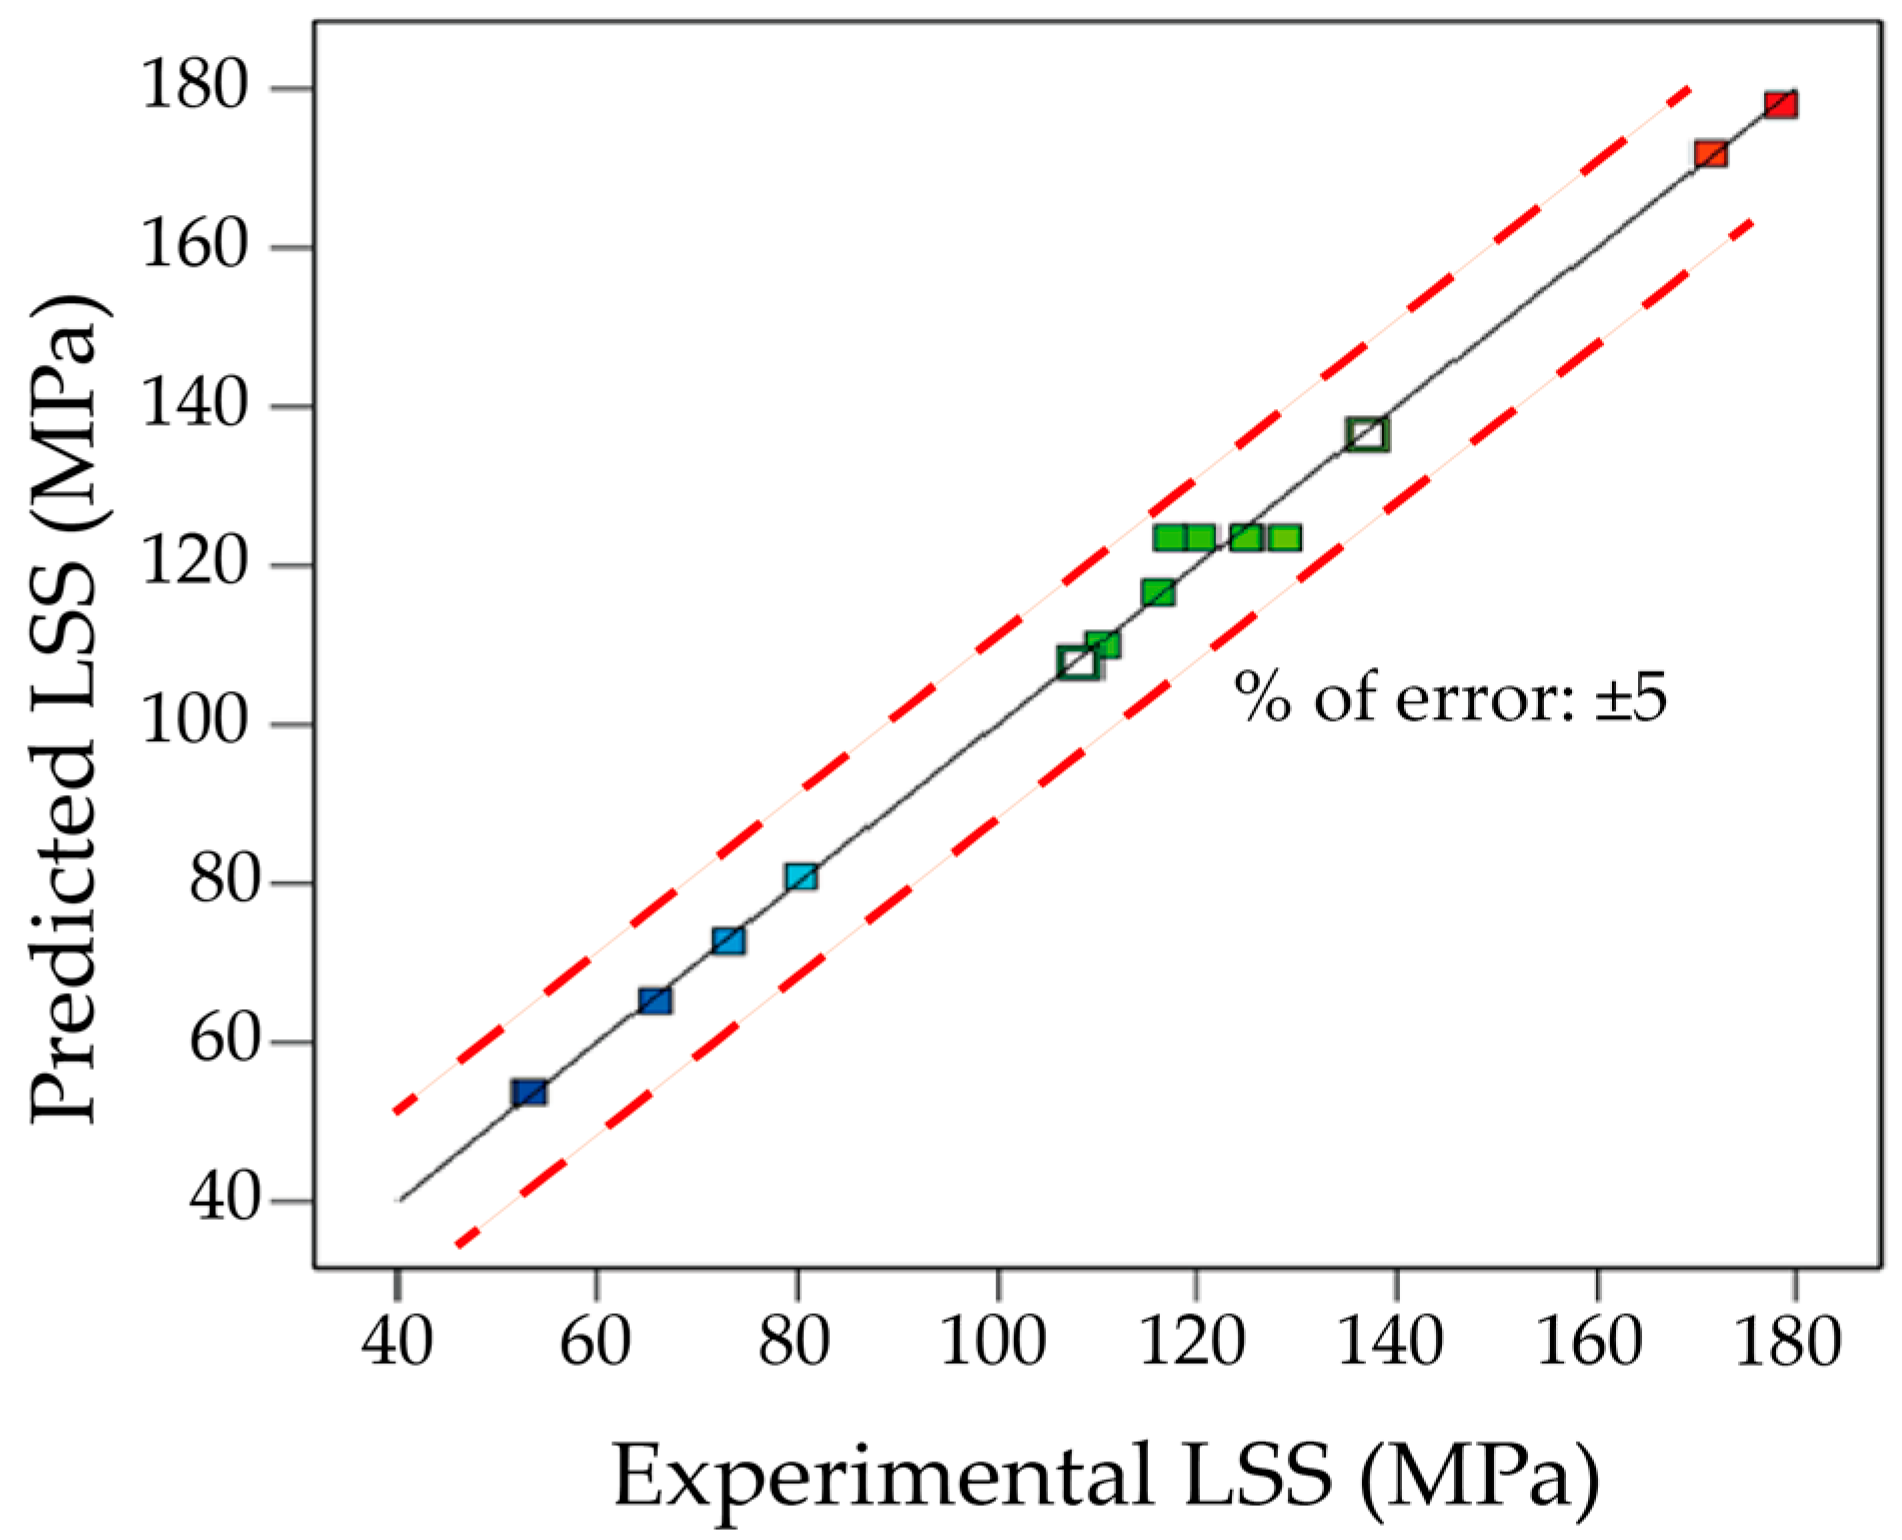
As shown in Table 4, the R2 of the established model is 0.9952, the corrected coefficient of determination R2 is 0.9866, and the coefficient of variation (CV) is 3.57%, indicating a good fit for the model. The predicted coefficient of determination R2 is 0.9737, which closely aligns with the corrected R2. The P1 value is 0.7130 > 0.05, indicating no significant lack of fit. Based on the analysis of the coefficients of the differences mentioned above, it is concluded that the regression model is suitable for predicting the process parameters of 7B04 aluminum alloy DB. Figure 6 shows the difference between the actual LSS measured by the test and the LSS calculated by the regression model. From the figure, it is evident that the difference is within ±5%, demonstrating that the established response model can accurately predict the LSS of the 7B04 diffusion bonded joint.

3.2.3. Effects of DB Parameters on LSS

  • Temperature effect on LSS
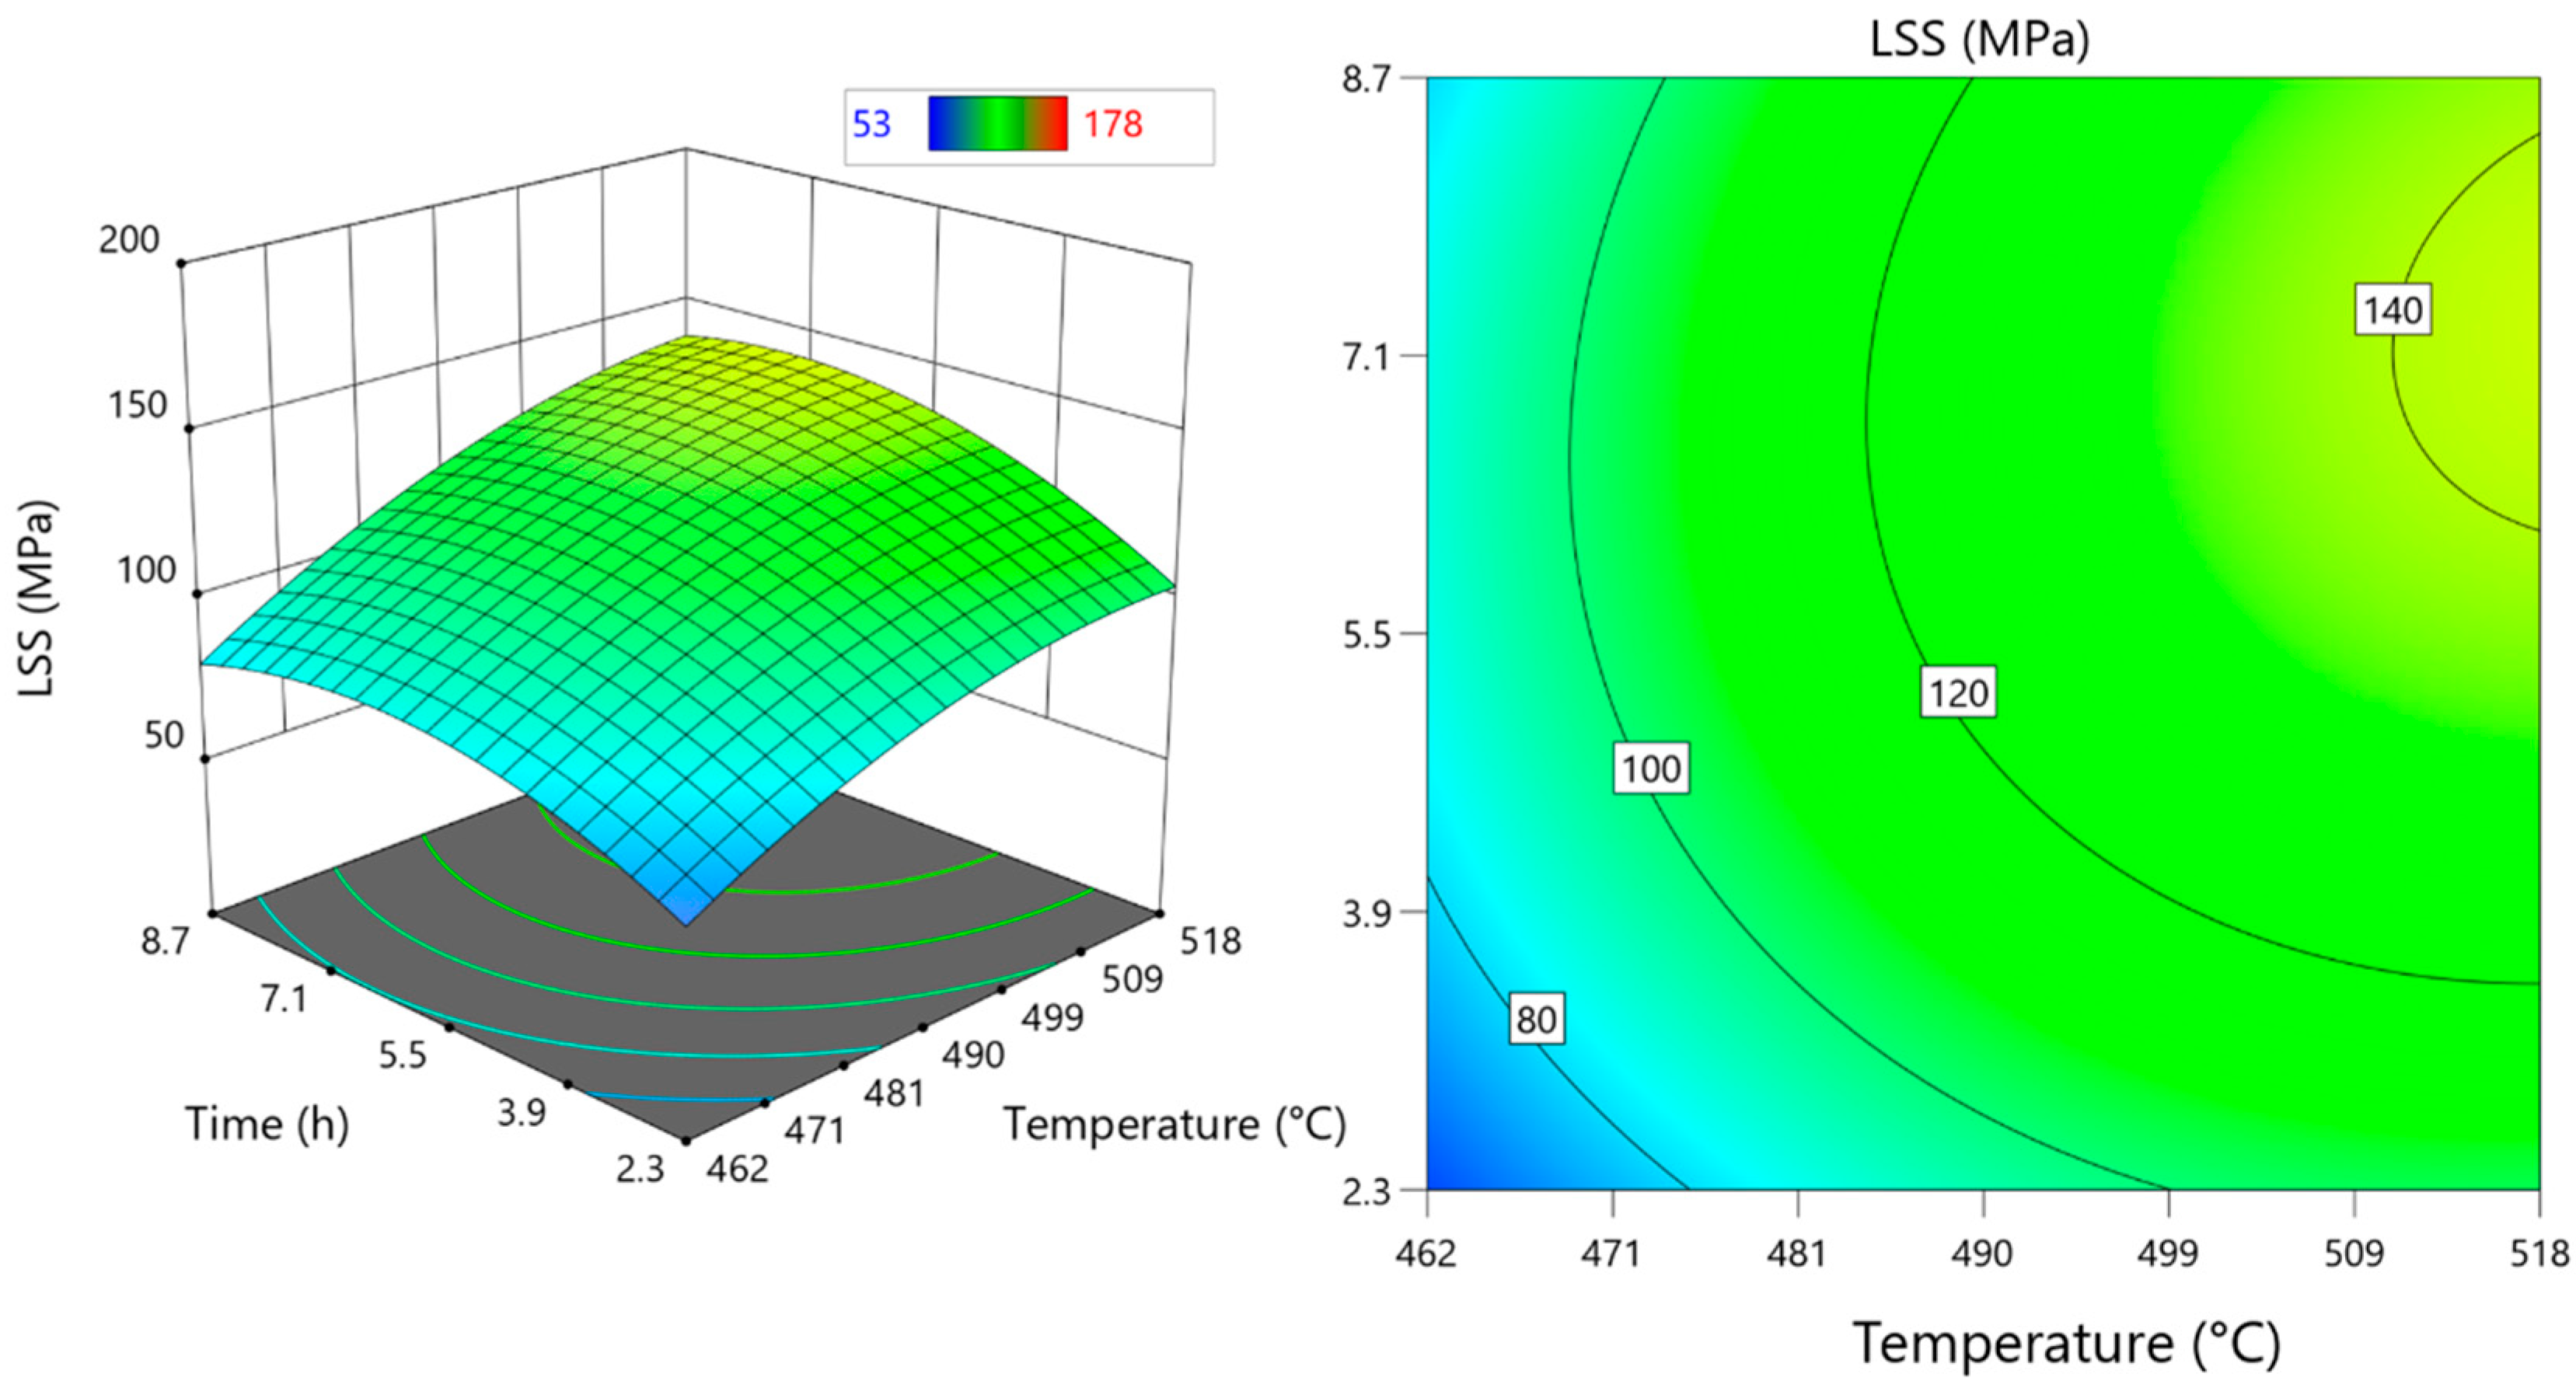
Figure 7 illustrates the three-dimensional response surface diagram and contour plot of temperature and time related to LSS. The graph shows that the response surface curve for temperature is more unstable than that for time. Additionally, moving toward the peak along the temperature axis results in a higher contour density compared to moving along the time axis, which indicates that temperature has a greater effect on LSS. This observation aligns with the analysis of variance. During the 7B04 DB, interfacial atom diffusion occurs due to the activation of alloying elements on both sides of the interface, based on the Arrhenius and creep equations as follows:
D = D0exp(−Q/RT)
ε . = A [ sin h ( α σ ) ] n exp ( Q / R T )
In the formula, D0 is the coefficient factor, Q is the diffusion activation energy, R is constant, T is the diffusion temperature, ε . is the creep rate, A is the material constant, σ is the loading pressure, and n is the nominal creep stress index.
The atomic diffusion coefficient has an exponential relationship with diffusion temperature. As temperature increases, the diffusion coefficient also increases, which promotes atom diffusion at the interface, leading to an increase in LSS. From Figure 7, it is observed that when the temperature reaches around 520 °C, the growth of LSS slows down. Equation (6) indicates that the creep deformation rate of the material gradually rises as temperature continues to increase. Additionally, the yield strength decreases, making more plastic deformation likely. At the same time, the grain size of the base material and the intermediate powder layer expands, resulting in reduced mechanical properties. In summary, the LSS of the 7B04 joint increases with rising temperature. The rate of increase slows at 520 °C, and LSS decreases at 530 °C.
  • Effect of time on LSS
To achieve a bonded joint with good performance, it is essential to ensure an adequate and appropriate holding time. The relationship between the average atomic movement distance during DB and the diffusion time is as follows:
X = Dt1/2
In the formula, X represents the average distance of atomic diffusion, D is the diffusion coefficient, and t denotes the time.
From Equation (7), it can be observed that increasing the DB time can improve joint quality. However, if the holding time is too long, it will not only cause coarse grains, which reduce mechanical properties, but also raise production costs and lower efficiency. As shown in Figure 7, the shear strength of the joint increases with the extension of time. When the time reaches about 7 h, the LSS hits its peak. Beyond this point, as time continues to increase, LSS grows slowly and then starts to decline.
  • The effect of pressure on LSS
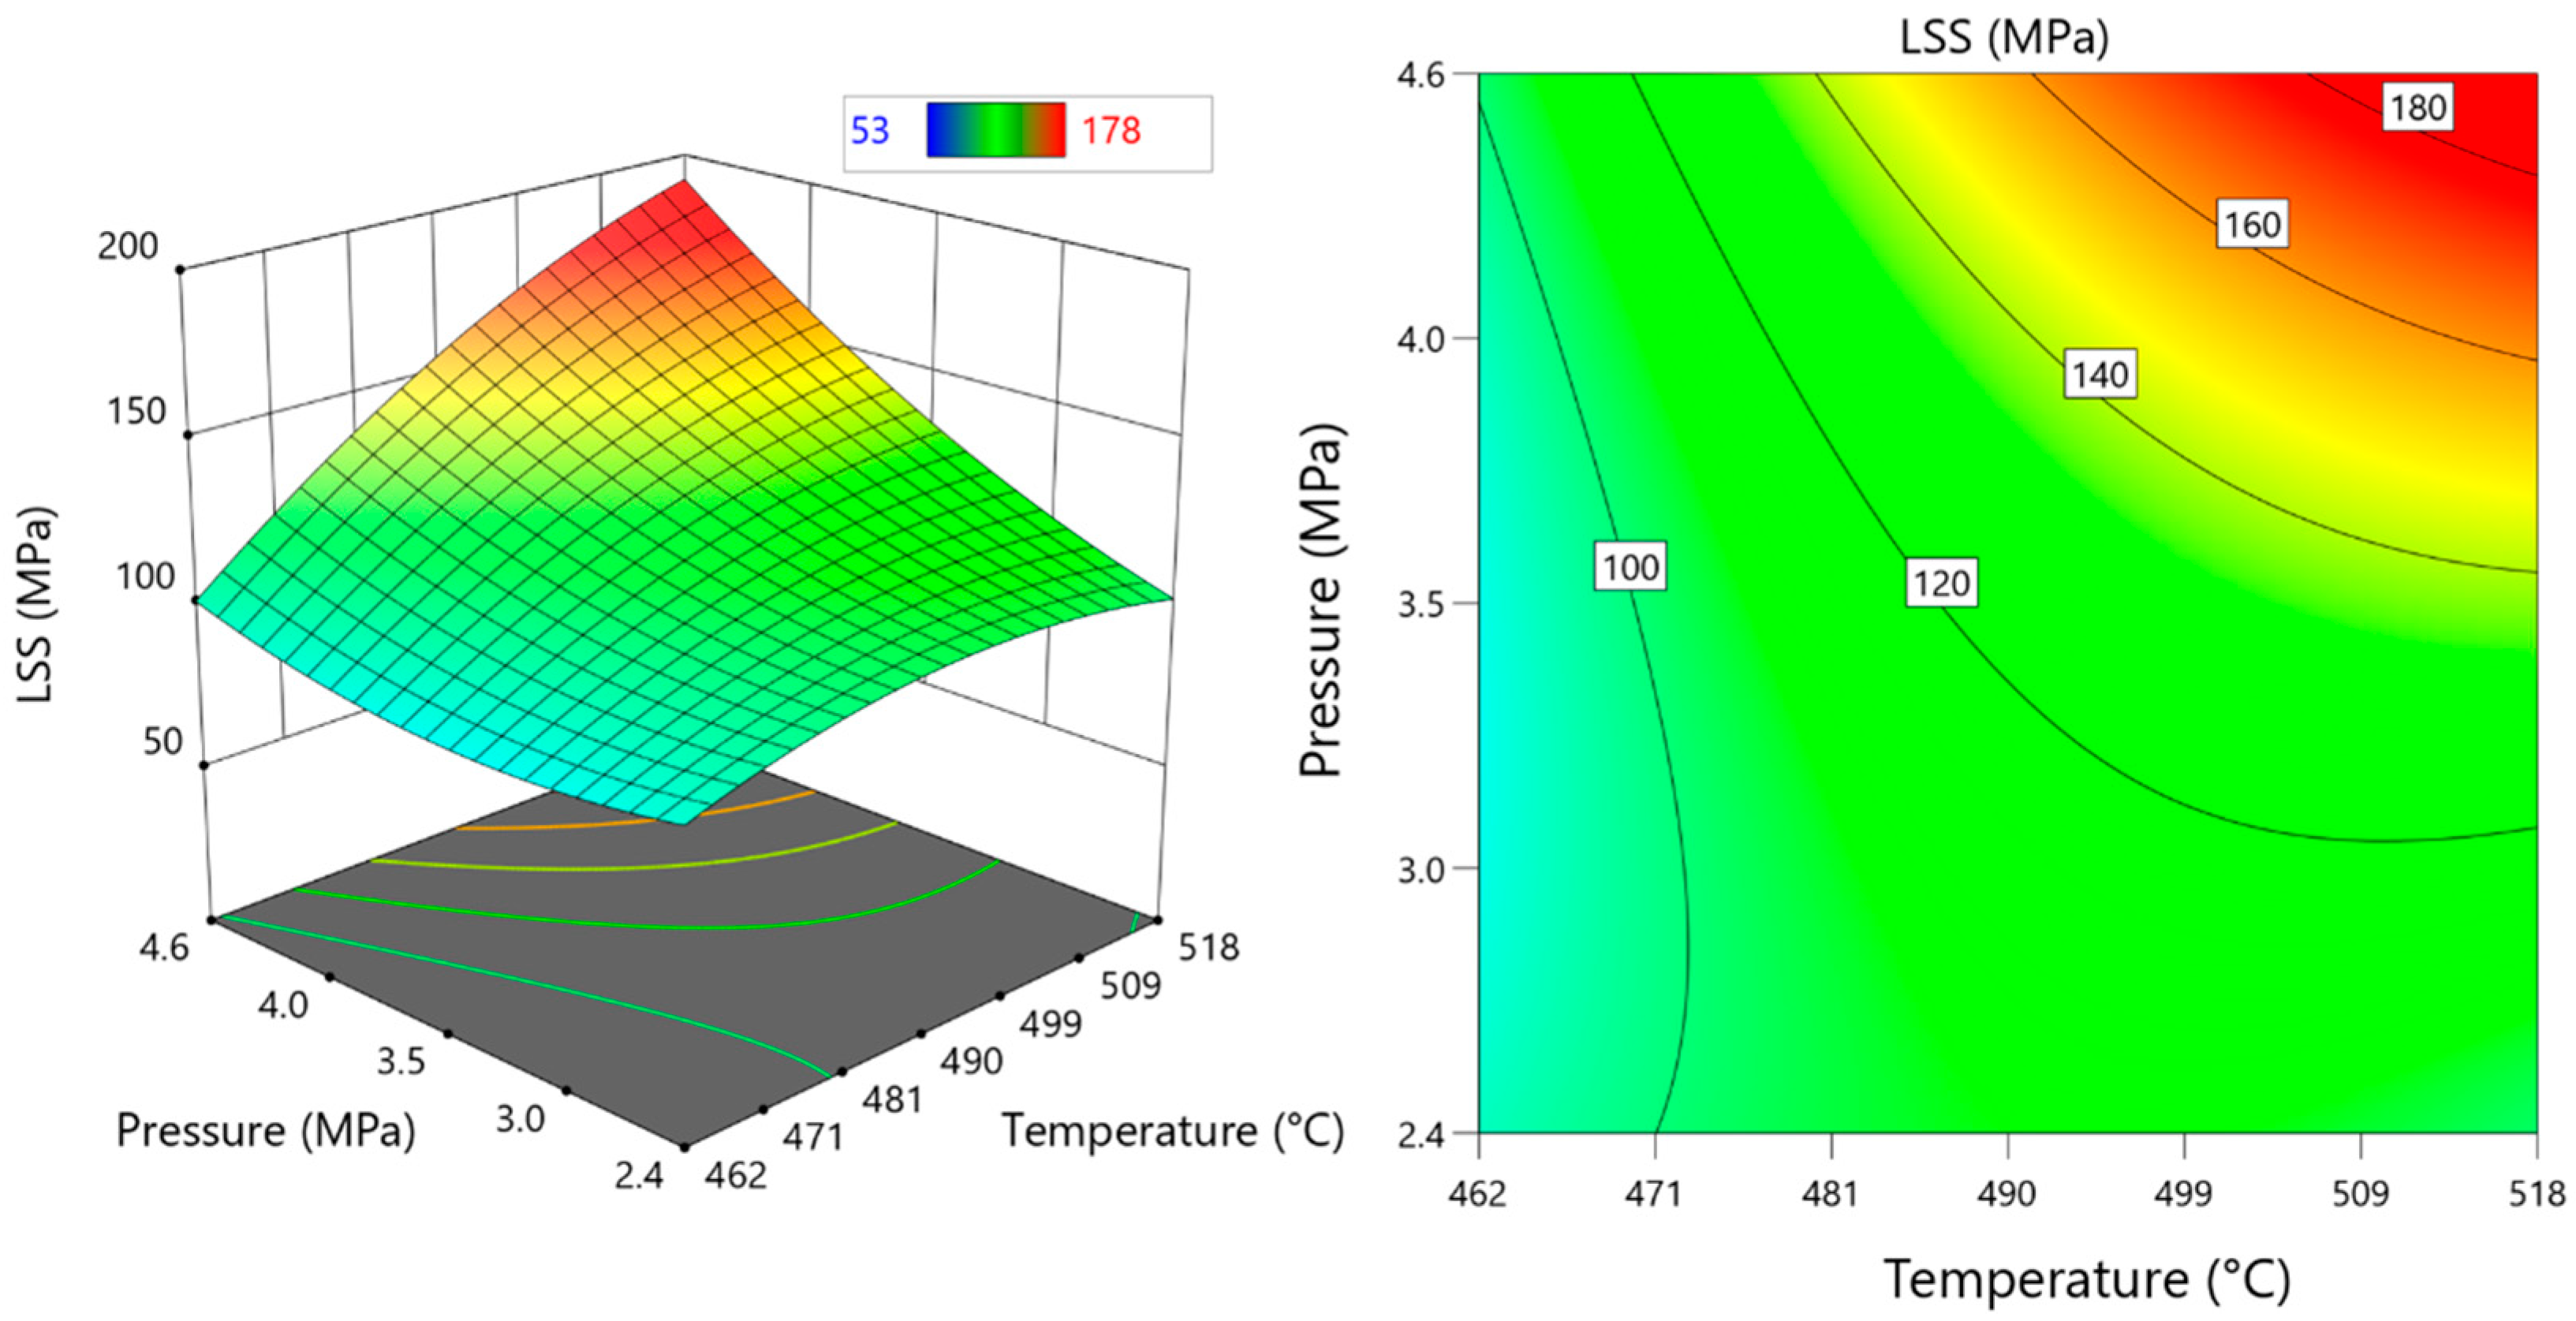
Figure 8 displays the three-dimensional response surface and contour plots of temperature and pressure on LSS. With a constant bonding time and at low temperature, the influence of pressure on LSS is minimal. As temperature increases, the impact of pressure on LSS becomes more significant. The steeper slope of the response surface indicates a stronger interaction between the two factors. The effects of temperature and pressure on LSS are similarly important, which aligns with the analysis of variance. Adding 7075 aluminum alloy powder increases the actual interfacial contact area. During welding, the powder contacts not only the base material but also each other. Increasing pressure is necessary to ensure proper interface contact and prevent bonding failure.
Therefore, pressure greatly influences the quality of the joint. An appropriate increase in pressure can promote the flow of powder into the capillary surface of the base material, thereby boosting the effective contact area. Additionally, higher pressure causes microscopic plastic deformation, which helps to break the oxide film. When the interatomic interaction distance is reached, atoms diffuse at the contact interface driven by heat. In theory, the higher the pressure, the greater the LSS achieved. However, previous tests have shown that pressures above 5 MPa can cause excessive deformation.
Figure 9 displays the three-dimensional response surface and contour plots of time and pressure for LSS. The response surface curve indicates that pressure has a more significant effect than time. It is evident that the influence order of the three DB parameters on LSS is temperature > pressure > time, which aligns with the results of the analysis of variance.

3.2.4. Optimization and Verification of the DB Process Parameter

The satisfaction function method converts each response value Yi into a dimensionless di (0 < di < 1), calculates the satisfaction level of each response, and then weights the average to maximize it. This process transforms a multi-response problem into a single-response problem. The response satisfaction value for each individual can be determined using Equations (8)–(11), where the weight represents the value of the target, including the maximum value, the minimum value, within the set range, or the target value. The satisfaction calculation function is as follows:
Response to the maximum target:
     0          Yi < Li
Di = ((YiLi)/(HiLi))Wti    LiYiHi
     1          Yi > Hi
Response to the minimum target:
     0          Yi > Hi
Di = ((HiYi)/(HiLi))Wti    LiYiHi
     1          Yi < Li
Response to the target:
((YiLi)/(TiLi))Wti1     Li < Yi < Ti
Di = ((YiHi)/(TiHi))Wti2     TiYiHi
                     0                    other
Response to the target in range:
Di = 1       Li < Yi < Hi
Di = 0             other
In the formula, i represents the number of responses, Di is the satisfaction value, Yi is the predicted value of the response, Li is the lower limit value of the current response, Hi is the upper limit of the current response, Ti is the target value of the current response, and weights Wti, Wti1, and Wti2 are constants that determine the shape of the satisfaction function.
The overall satisfaction score is determined by the weighted average of the satisfaction scores as follows:
De = (∏diri)1/∑ri
In the formula, De denotes the overall satisfaction value, and n indicates the number of responses.
Table 6 shows the criteria for optimizing process parameters and response values. The temperature, time, and pressure are within the specified upper and lower limits for the test, with the LSS target set to the maximum.
After numerical optimization, the combinations of process parameters that met the target requirements were identified. Two sets of process parameters are listed in Table 7 for optimizing the diffusion bonding of 7B04 aluminum alloy with a 7075 aluminum alloy powder interlayer.
The 7B04 DB test was performed using the optimized process parameters listed in Table 7 to further validate the RSM model. The deformation of the diffusion bonding specimens before and after testing was measured along the thickness direction, and the microscopic interface of the weld seam was observed. Figure 10a shows the microstructure of the joint at parameters of 505 °C-5.7 h-4.5 MPa, demonstrating a good metallurgical bond. However, some voids are present in certain areas. The interface welding of the diffusion joint lacked consistent quality due to uneven coating of 7075 powder by hand. Figure 10b displays the microstructure of the joint at parameters of 515 °C-7.5 h-4.4 MPa, showing a well-bonded interface with no obvious interfacial voids.
The LSS of the joint is compared with the shear strength of the base material 7B04 under the same process parameters using the following formula:
λ = σDS/σs
In the formula, λ is the specific shear strength, σDS is the LSS of joint, and σs is the shear strength of the base metal.
The above-mentioned process parameters are listed as serial numbers 1 and 2. The shear strengths of the base metal 7B04 after the DB processes of 505 °C-5.7 h-4.5 MPa and 515 °C-7.5 h-4.5 MPa were measured as 142 MPa and 130 MPa. And the joint performance was normalized to specific values via λ. The properties of the joints are shown in Table 8.
The LSS is 169 MPa at 505 °C and 174 MPa at 515 °C. The experimental result is slightly lower than the estimated value of the model, with an error of approximately 5%. This indicates that the optimization results derived from the model can achieve the goal of maximizing the joint lap shear strength of 7B04 aluminum alloy diffusion bonding with a 7075 powder interlayer. The optimized process parameters were set at 515 °C-7.5 h-4.4 MPa.
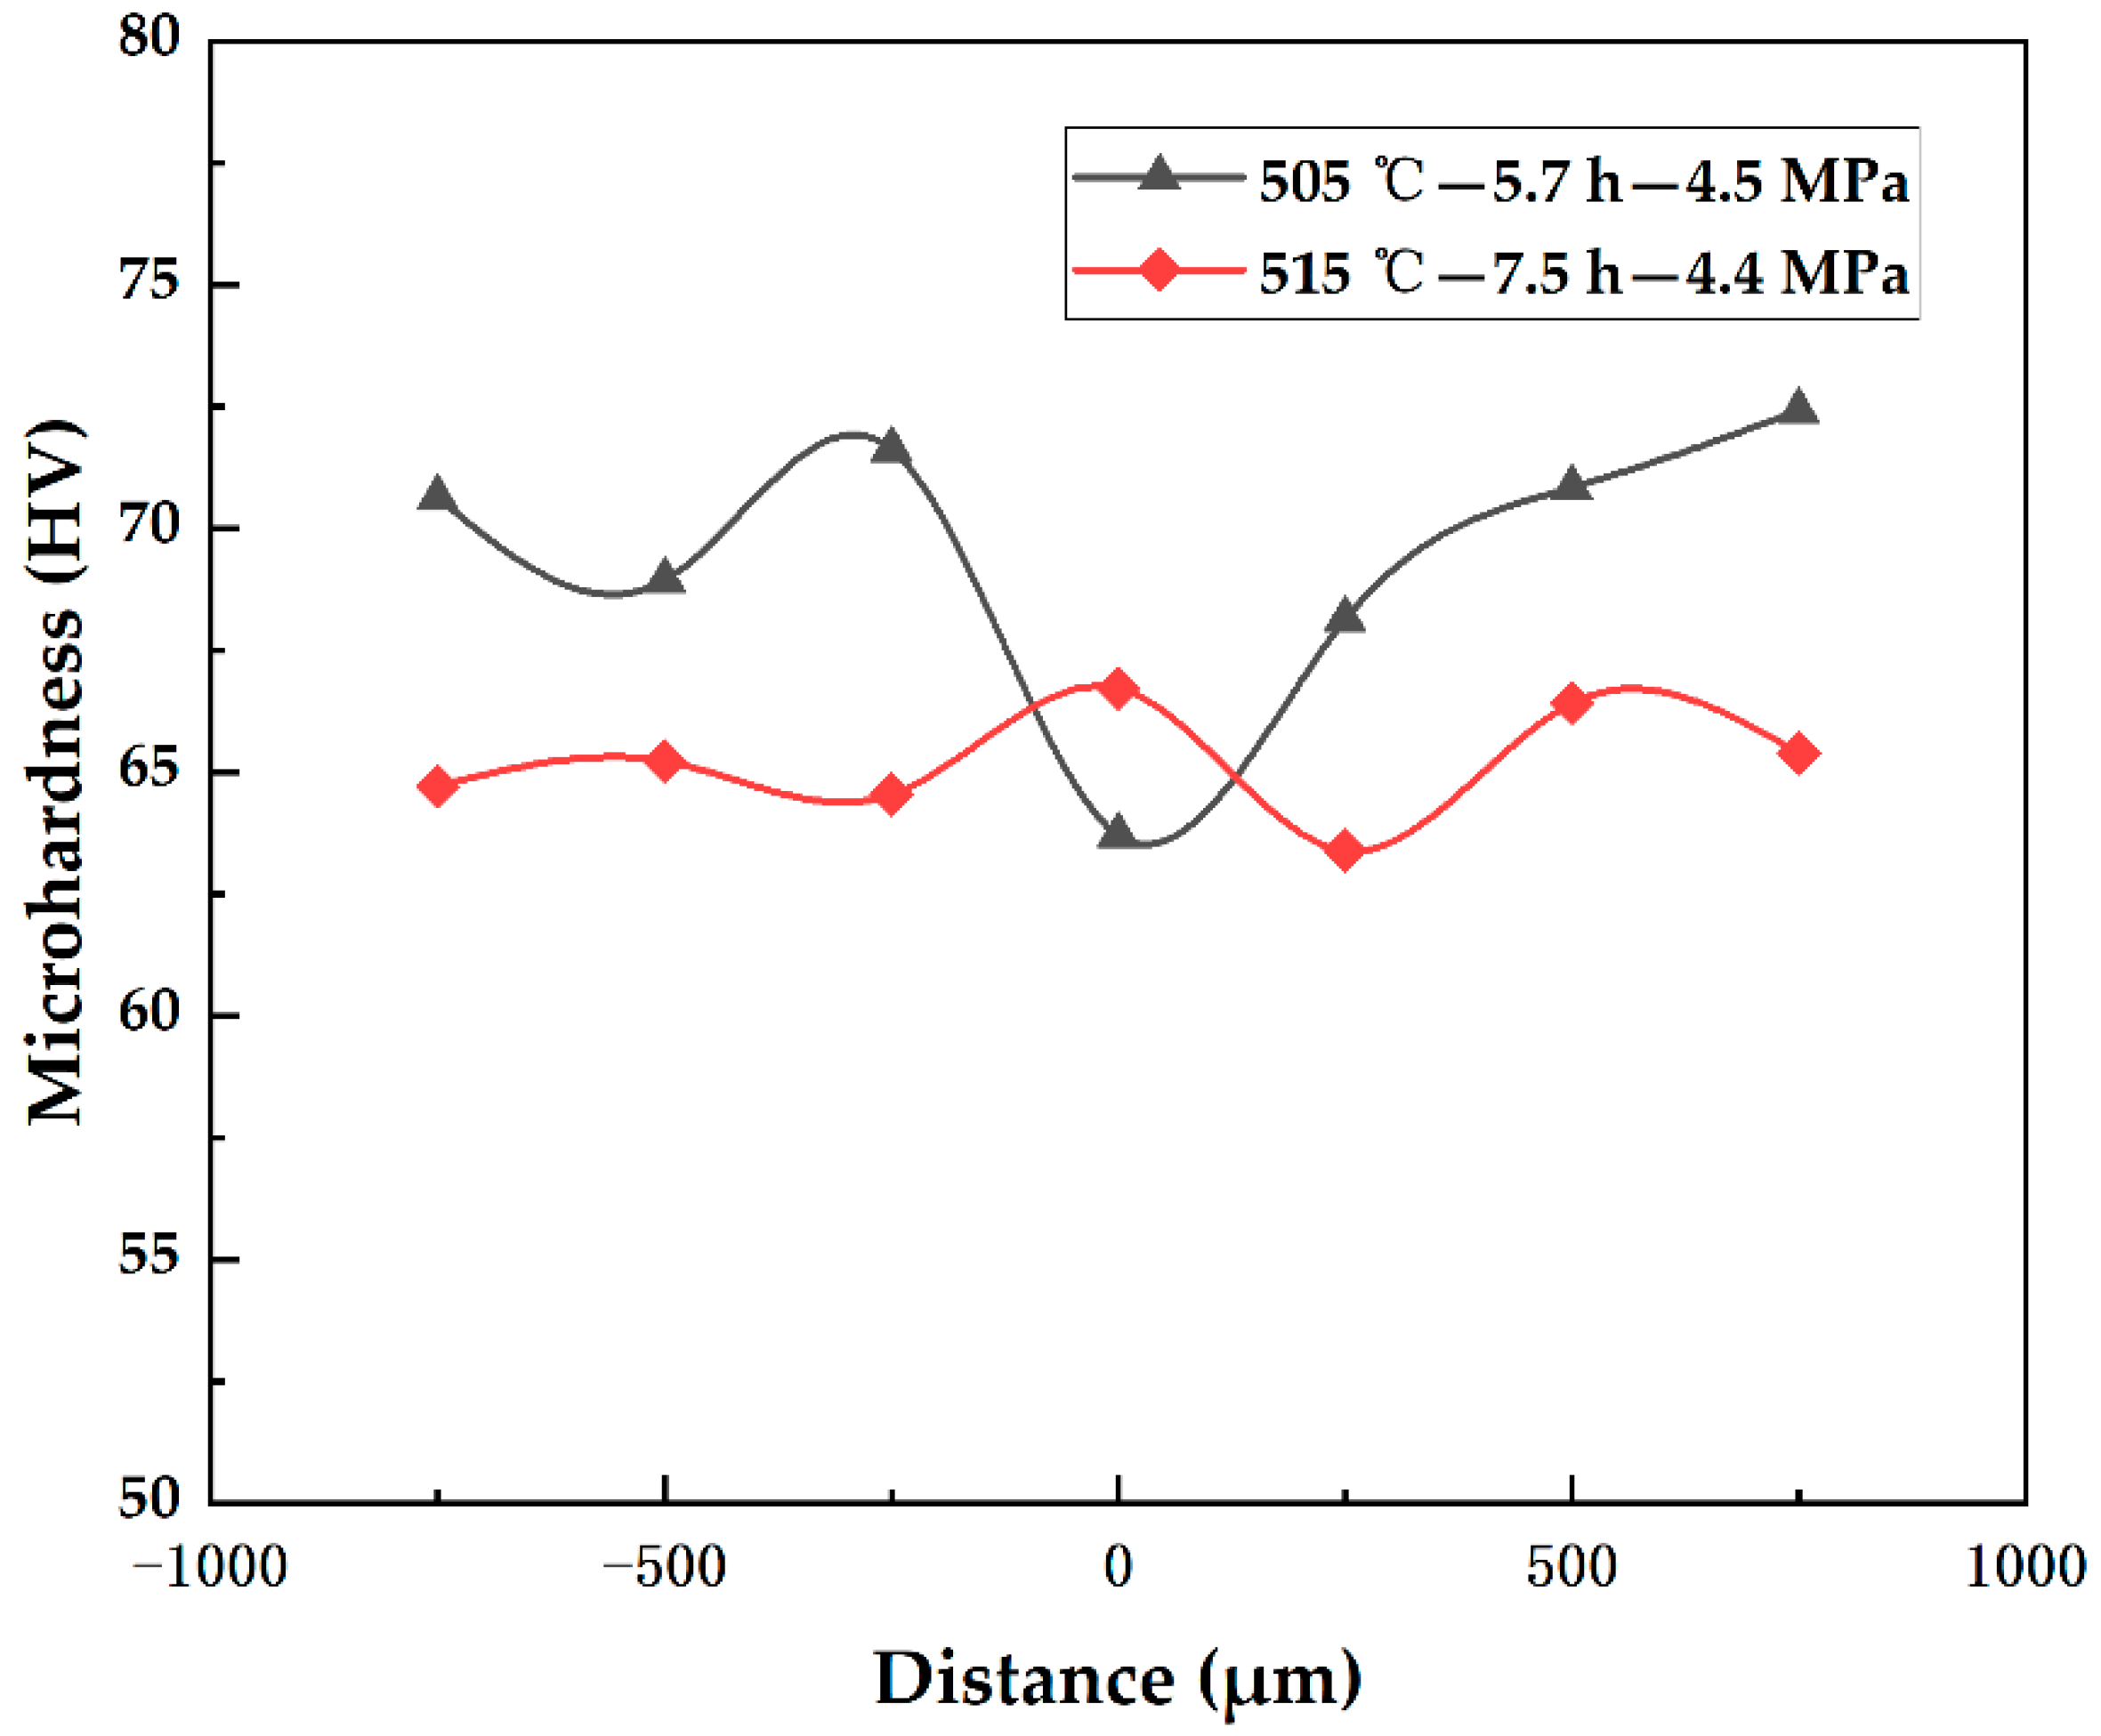
As shown in Figure 11, the microhardness distribution of the diffusion joint zone under the optimized process parameters indicates that the hardness at 515 °C is higher than at 505 °C. As the temperature and holding time increase, the grain size of the 7B04 base material grows, and the hardness of the base material on both sides of the 515 °C joint (about 65 HV) is lower than at 505 °C (about 70 HV).

4. Conclusions

In this study, to improve the joint quality, a novel surface treatment with plasma surface cleaning was used, and 7075 aluminum alloy powder was applied as an interlayer for the diffusion bonding of 7B04 aluminum alloy sheets. Additionally, based on the RSM with satisfaction function optimization, the DB process parameters for achieving maximum shear strength were determined. The main conclusions are as follows:
  • A comparative analysis of the effects of the surface treatment process on the performance of the diffusion joint shows no significant difference in the welding microstructure of the base material with different surface roughness levels, ranging from 400 # to 1500 # sandpaper polish. The plasma treatment enhanced diffusion bonding. Polishing with 1500 # sandpaper combined with plasma treatment results in the best overall joint performance.
  • Based on experiments designed by CCD with RSM, a quadratic regression model was established relating process parameters—temperature, pressure, and time—to the response parameter LSS, with a prediction accuracy of 99.52%. The model demonstrates high reliability and can be used to predict LSS for the DB joint of 7B04 aluminum alloy.
  • The satisfaction function optimization method was used to optimize the process parameters. The results were then experimentally verified, showing good agreement with the actual measured values, with an error of approximately 5%. The optimal process parameters for diffusion bonding 7B04 aluminum alloy were found to be 515 °C-7.5 h-4.4 MPa.

Author Contributions

Conceptualization, N.W. and L.X.; methodology, N.W.; validation, N.W., L.X. and M.C.; formal analysis, N.W.; investigation, N.W.; resources, L.X.; writing—review and editing, N.W., L.X. and M.C.; visualization, N.W.; supervision, L.X. and M.C.; project administration, M.C.; funding acquisition, M.C. All authors have read and agreed to the published version of the manuscript.

Funding

This research was funded by Jiangsu Key Laboratory of Precision and Micro-Manufacturing Technology, grant number JSKL122K09.

Data Availability Statement

The original contributions presented in this study are included in the article. Further inquiries can be directed to the corresponding author.

Acknowledgments

We thank Chunbo Li for his contribution in the experiments of diffusion bonding and data processing.

Conflicts of Interest

The authors declare no conflicts of interest.

Abbreviations

The following abbreviations are used in this manuscript:
DBDiffusion bonding
LSSLap shear strength
RSMResponse surface method
IMCIntermetallic compounds
SPSSpark plasma sintering
GAGenetic algorithm
CCDCentral composite design
ANOVAAnalysis of variance
CVCoefficient of variation

References

  1. Wang, Y.; Chai, P.; Guo, X.; Qi, B. Effect of Connection Processes on Mechanical Properties of 7B04 Aluminum Alloy Structures. China Weld. 2021, 30, 50–57. [Google Scholar] [CrossRef]
  2. Du, J.; Wang, L.; Li, J.; Cui, L.; Jiang, X. The Influence of Pre-Strain Levels on the Microstructure and Performance of Aircraft 7b04 Aluminum Alloy Skin. J. Phys. Conf. Ser. 2024, 2691, 012059. [Google Scholar] [CrossRef]
  3. Lao, S.; Zhan, L.; Qian, W.; Xu, Y.; Ma, B.; Liu, C.; Huang, M.; Yang, Y.; Chen, K.; Peng, N.; et al. Creep Aging Behavior of a Thermo-Mechanical Treated 7B04 Aluminum Alloy. Metals 2023, 13, 182. [Google Scholar] [CrossRef]
  4. Ramaswamy, A.; Malarvizhi, S.; Balasubramanian, V. Effect of Variants of Gas Metal Arc Welding Process on Tensile Properties of AA6061-T6 Aluminium Alloy Joints. Int. J. Adv. Manuf. Technol. 2020, 108, 2967–2983. [Google Scholar] [CrossRef]
  5. John, V.C.; Abdel-Hamid, I.M.; Muhammad, M.S.; Shivamurthy, B. Review of Recent Trends in Friction Stir Welding Process of Aluminum Alloys and Aluminum Metal Matrix Composites. Trans. Nonferrous Met. Soc. China 2021, 31, 3281–3309. [Google Scholar] [CrossRef]
  6. Ardika, R.D.; Triyono, T.; Muhayat, N.; Triyono. A Review Porosity in Aluminum Welding. Procedia Struct. Integr. 2021, 33, 171–180. [Google Scholar] [CrossRef]
  7. Lathashankar, B.; Tejaswini, G.C.; Suresh, R.; Swamy, N.H.S. Advancements in Diffusion Bonding of Aluminium and Its Alloys: A Comprehensive Review of Similar and Dissimilar Joints. Adv. Mater. Process. Technol. 2022, 8, 4659–4677. [Google Scholar] [CrossRef]
  8. Wang, Y.; Li, Y.; Bai, Y.; Liu, Y.; Zhu, Z.; Chen, H. The Influence of Hydrogen Content on the Zr-4 Alloy Diffusion Bonding Joint: From Experiments to Molecular Dynamics Simulations. Mater. Today Commun. 2024, 40, 109568. [Google Scholar] [CrossRef]
  9. Li, Q.; Liu, M.; Hou, B.; Qin, H.; Dai, Z. Diffusion Welding Process and Welding Properties of 6061 Aluminum Alloy Water-cooled Plate. Mater. Res. Appl. 2018, 12, 303–307. [Google Scholar]
  10. Aravinda, T.; Niranjan, B.H.; Babu, S.B.; Ravi, U.M. Solid State Diffusion Bonding Process-A Review. IOP Conf. Ser. Mater. Sci. Eng. 2021, 1013, 012011. [Google Scholar] [CrossRef]
  11. Chang, R.; Guo, Q.; Ma, Z.; Ding, R.; Liu, C.; Liu, Y. Kinetics of Voids Evolution during Diffusion Bonding of Dissimilar Metals on Consideration of the Realistic Surface Morphology: Modeling and Experiments. Acta Mater. 2024, 276, 120121. [Google Scholar] [CrossRef]
  12. Wei, Y.; Zhang, S.; Jia, L.; Li, Q.; Ma, M. Study on the Influence of Surface Roughness and Temperature on the Interface Void Closure and Microstructure Evolution of Stainless Steel Diffusion Bonding Joints. Metals 2024, 14, 812. [Google Scholar] [CrossRef]
  13. Li, H.; Li, M.Q.; Kang, P.J. Void Shrinking Process and Mechanisms of the Diffusion Bonded Ti–6Al–4V Alloy with Different Surface Roughness. Appl. Phys. A 2016, 122, 18. [Google Scholar] [CrossRef]
  14. Aravinda, T.; Niranjan, H.B.; Boppana, S.B.; Dayanand, R.S. Solid State Diffusion Bonding of Al2024 Sheets. J. Mines Met. Fuels 2021, 69, 455–460. [Google Scholar]
  15. Zhang, J.; Zhou, Y.; Liu, X.; Niu, J. Effects of Surface Treatment on the Diffusion Bonding of LF6 Alloy. Mater. Sci. Technol. 1995, 3, 108–111. [Google Scholar]
  16. Kenevisi, M.S.; Mousavi Khoie, S.M.; Alaei, M. Microstructural Evaluation and Mechanical Properties of the Diffusion Bonded Al/Ti Alloys Joint. Mech. Mater. 2013, 64, 69–75. [Google Scholar] [CrossRef]
  17. Kurgan, N. Investigation of the Effect of Diffusion Bonding Parameters on Microstructure and Mechanical Properties of 7075 Aluminium Alloy. Int. J. Adv. Manuf. Technol. 2014, 71, 2115–2124. [Google Scholar] [CrossRef]
  18. Liu, D.; Xu, J.; Li, X.; Wei, P.; Liang, Y.; Qin, J.; Sun, H.; Ding, T.; Ding, Z.; Zhong, S.; et al. Influence of Al Foil Interlayer on Performance of Vacuum Diffusion Bonding Joint of 6061 Aluminium Alloy. J. Iron Steel Res. Int. 2024, 31, 2404–2412. [Google Scholar] [CrossRef]
  19. Song, K.; Lv, L.; Zhu, S.; Liu, F.; Luo, J.; Qing, Z.; Zhong, Z.; Zhu, Z.; Wu, Y. Microstructure and Mechanical Properties of Spark Plasma Diffusion-Bonded 5A06Al Joints with Al–20Cu–5Si–2Ni Interlayer. Int. J. Adv. Manuf. Technol. 2021, 114, 3627–3643. [Google Scholar] [CrossRef]
  20. Hosseinabadi, N.; Sarraf-Mamoory, R.; Mohammad Hadian, A. Diffusion Bonding of Alumina Using Interlayer of Mixed Hydride Nano Powders. Ceram. Int. 2014, 40, 3011–3021. [Google Scholar] [CrossRef]
  21. Wang, Y.; Zhao, W.; Zhang, B.; Mao, C.; Wang, X.; Pan, W.; Du, J.; Xiao, H. Enhanced Interfacial Properties and Deformation Behavior of Ti/Al Composite Plates through Pure Al Interlayer-Assisted Diffusion Bonding. Mater. Sci. Eng. A 2025, 944, 148947. [Google Scholar] [CrossRef]
  22. Zhang, S.; Ma, T.; Zhao, Y.; Zhang, Z.; Shao, W.; Huang, J.; Zhang, X.; Ye, Z.; Wang, W.; Yang, J. Microstructure and Mechanical Properties of Copper/al Interlayer/Graphite Joint Prepared Utilizing “Two-Stage Method” Vacuum Diffusion Bonding. Vacuum 2024, 227, 113414. [Google Scholar] [CrossRef]
  23. Yin, F.; Liu, C.; Zhang, Y.; Qin, Y.; Liu, N. Effect of Ni Interlayer on Characteristics of Diffusion Bonded Mg/Al Joints. Mater. Sci. Technol. 2018, 34, 1104–1111. [Google Scholar] [CrossRef]
  24. Silva, M.; Ramos, A.S.; Simões, S. Joining Ti6Al4V to Alumina by Diffusion Bonding Using Titanium Interlayers. Metals 2021, 11, 1728. [Google Scholar] [CrossRef]
  25. Alhazaa, A.; Albrithen, H.; Hezam, M.; Shar, M.A.; Alhwaimel, I.; Alharbi, Y.; Estournes, C. Diffusion Bonding of Al7075 to Ti-6Al-4V by Spark Plasma Sintering and Using a Copper Interlayer. Crystals 2022, 12, 1293. [Google Scholar] [CrossRef]
  26. Rajakumar, S.; Balasubramanian, V. Diffusion Bonding of Titanium and AA 7075 Aluminum Alloy Dissimilar Joints—Process Modeling and Optimization Using Desirability Approach. Int. J. Adv. Manuf. Technol. 2016, 86, 1095–1112. [Google Scholar] [CrossRef]
  27. Fernandus, M.J.; Senthilkumar, T.; Balasubramanian, V.; Rajakumar, S. Optimizing Diffusion Bonding Parameters to Maximize the Strength of AA6061 Aluminum and AZ61A Magnesium Alloy Joints. Exp. Tech. 2014, 38, 21–36. [Google Scholar] [CrossRef]
  28. Elangovan, S.; Venkateshwaran, S.; Prakasan, K. Experimental investigations on optimization of ultrasonic welding parameters for copper to brass joints using response surface method and genetic algorithm. Int. J. Adv. Eng. Res. Stud. 2012, 1, 1–6. [Google Scholar]
  29. Fernandus, M.J.; Senthilkumar, T.; Balasubramanian, V.; Rajakumar, S. Optimizing Diffusion Bonding Parameters in AA6061-T6 Aluminum and AZ80 Magnesium Alloy Dissimilar Joints. J. Mater. Eng. Perform. 2012, 21, 2303–2315. [Google Scholar] [CrossRef]
  30. Negemiya, A.; Rajakumar, S.; Sonar, T.; Ivanov, M. Mathematical Modeling and Optimization of Vacuum Diffusion Bonding Parameters for Predicting and Enhancing the Strength of Dissimilar IN-718/MSS-410 Joints Using RSM for Power Generation Applications. J. Adv. Join. Process. 2024, 9, 100214. [Google Scholar] [CrossRef]
Figure 1. Assembly diagram of diffusion bonding specimens.
Metals 15 01109 g001
Figure 2. Dimensions of LSS test specimens.
Metals 15 01109 g002
Figure 3. Microstructures of 7B04 joints with physics/chemistry cleaning using sandpaper of different particle sizes: (a) no sandpaper polishing; (b) 400 #; (c) 800 #; (d) 1500 #.
Metals 15 01109 g003
Figure 4. Microstructure of 7B04 aluminum alloy diffusion joint specimens polished with sandpaper of different particle sizes followed by plasma treatment: (a) No sandpaper polishing; (b) 400 #; (c) 800 #; (d) 1500 #.
Metals 15 01109 g004
Figure 5. LSS of the bonded specimens.
Metals 15 01109 g005
Figure 6. Deviation of shear strength test values from predicted values.
Metals 15 01109 g006
Figure 7. 3D surface response and contour plots of temperature and time to LSS.
Metals 15 01109 g007
Figure 8. 3D surface response and contour plots of temperature and pressure.
Metals 15 01109 g008
Figure 9. 3D surface response and contour plots of time and pressure.
Metals 15 01109 g009
Figure 10. Microstructure of the 7B04 aluminum alloy diffusion joint under optimized process parameters: (a) 505 °C-5.7 h-4.5 MPa; (b) 515 °C-7.5 h-4.5 MPa.
Metals 15 01109 g010
Figure 11. Microhardness distribution at the interface of the 7B04 aluminum alloy diffusion bonded joint under optimized process parameters.
Metals 15 01109 g011
Table 1. Chemical composition (wt%) of 7B04 and 7075 aluminum alloys.
ElementZnMgCuCrFeMnSiAl
7B045.0–6.51.8–2.81.4–2.00.1–0.250.05–0.250.2–0.60.1Bal.
70755.1–6.12.1–2.91.2–2.00.16–0.280.50.30.4Bal.
Table 2. Factors and their levels for a DB experiment of 7B04 with a 7075 powder interlayer.
ParameterUnitNotationLevels
−21/2−10121/2
Temperature°CT450462490518530
Timeht12.35.58.710
PressureMPaP22.43.54.65
Table 3. CCD matrix and LSS results of a DB experiment of 7B04 with a 7075 powder interlayer.
Sr. No.Coded ValueActual ValueLSS
(MPa)
TtPTemperature (°C)Time (h)Pressure (MPa)
111−15188.72.4116
21−115182.34.6171
3−1114628.74.680
4−1−1−14622.32.453
51.414005305.53.5137
6−1.414004505.53.566
701.4140490103.5111
80−1.414049013.573
9001.4144905.55178
1000−1.4144905.52108
110004905.53.5117
120004905.53.5120
130004905.53.5125
140004905.53.5125
150004905.53.5129
Table 4. Statistical validation of LSS prediction model using ANOVA.
SourceLSS
Sum of SquaresDFMean SquareF-ValueP1-Value
Model17,262.1691918.02115.76<0.0001significant
A—Temperature2537.5712537.57153.16<0.0001
B—Time694.901694.9041.940.0013
C—Pressure2465.4212465.42148.80<0.0001
AB36.07136.072.180.2001
AC816.521816.5249.280.0009
BC352.071352.0721.250.0058
A2990.571990.5759.790.0006
B21990.1111990.11120.110.0001
C2723.351723.3543.660.0012
Residual82.84516.57
Lack of Fit3.1113.110.15600.7130not significant
Pure Error79.73419.93
Cor Total17,345.0014
Fit StatisticsStd.Dev4.07R20.9952
Mean114.02Adjusted R20.9866
C.V.%3.57Predicted R20.9737
Table 5. Results of DB experiments with boundary parameter values.
Sr. No.ParameterValueJointDefects
1Temperature530 °CMetals 15 01109 i001Excessive plastic deformation
2Temperature450 °CMetals 15 01109 i002Unbonded
3Pressure5 MPaMetals 15 01109 i003Excessive plastic deformation
4Pressure2 MPaMetals 15 01109 i004Unbonded
5Time10 hMetals 15 01109 i005Excessive plastic deformation
6Time1 hMetals 15 01109 i006Unbonded
Table 6. Optimization criteria for process parameters and response values.
ParameterLimitImportanceGuidelines
Upper LimitLower Limit
Temperature (°C)4625183In range
Time (h)2.38.73In range
Pressure (MPa)2.44.63In range
LSS (MPa)53.21783Maximize
Table 7. Optimized process parameters that meet the requirements.
Temperature (°C)Time (h)Pressure (MPa)LSS (MPa)Satisfaction Values
15055.74.51791.000
25157.54.51821.000
Table 8. Performance of 7B04 aluminum alloy diffusion joint under optimized process parameters.
Sr. No.LSS (MPa)λDeformation Rate (%)
11691.193.9
21741.344.4
Disclaimer/Publisher’s Note: The statements, opinions and data contained in all publications are solely those of the individual author(s) and contributor(s) and not of MDPI and/or the editor(s). MDPI and/or the editor(s) disclaim responsibility for any injury to people or property resulting from any ideas, methods, instructions or products referred to in the content.