Article

Effect of Mechanical Activation on Electrochemical Properties of Chalcopyrite in Iron-Containing Sulfuric Acid Solutions

1
School of Minerals Processing and Bioengineering, Central South University, Changsha 410083, China
2
Key Laboratory of Hunan Province for Clean and Efficient Utilization of Strategic Calcium-Containing Mineral Resources, Central South University, Changsha 410083, China
*
Author to whom correspondence should be addressed.
Metals 2025, 15(10), 1075; https://doi.org/10.3390/met15101075
Submission received: 27 August 2025 / Revised: 18 September 2025 / Accepted: 23 September 2025 / Published: 25 September 2025
(This article belongs to the Section Extractive Metallurgy)

Abstract

Mechanical activation significantly enhances the leaching of chalcopyrite, a process that is fundamentally electrochemical in nature. Thus, a comprehensive understanding of its impact on the electrochemical behavior of chalcopyrite in leaching systems is crucial. This study examines the effect of mechanical activation on the electrochemical and semiconductor properties of chalcopyrite in H2SO4 solutions containing Fe2+ or/and Fe3+ at pH = 1.5. Mechanical activation was carried out using a planetary ball mill at 700 rpm for durations ranging from 0 to 2.5 h to reduce particle size and induce lattice distortion, thereby increasing its electrochemical activity. In iron-containing electrolytes, mechanically activated chalcopyrite is more readily reduced, releasing Fe2+ and leading to a higher surface concentration of Fe2+, which consequently increases the diffusion coefficient at the solid–liquid interface. Mott–Schottky analysis revealed a decrease in flat band potentials (from 261.7 mV to 131.2 mV in 0.1 mol/L Fe3+ after 1.0 h of activation) and an elevation in Fermi levels. As a result, mechanical activation markedly accelerates the corrosion rate of chalcopyrite in ferric solutions—the corrosion current increased from 40.27 µA to 70.71 µA in 0.1 mol/L Fe3+ after 1.0 h of activation. These findings provide valuable insights for developing strategies to enhance mineral dissolution, and advance the hydrometallurgical processing of chalcopyrite.

Graphical Abstract

1. Introduction

Chalcopyrite hydrometallurgy has been limited by its low leaching rate, which hinders large-scale implementation [1,2,3,4]. The H2SO4-Fe3+ system is widely employed for chalcopyrite leaching, but even with biological assistance, it fails to address the issue of slow dissolution kinetics. This may be due to the unique crystal structure of chalcopyrite and the formation of a ‘passivation’ layer during leaching. Metal-deficient sulfides and polysulfides are major contributors to reduced dissolution kinetics and a low leaching rate [5,6,7,8]. Additionally, semiconductor properties and electronic structure impact the leaching of chalcopyrite. From a semiconductor band theory perspective, natural chalcopyrite exhibits an electronic structure that impedes anodic current conduction in electrolyte solutions, resulting in slow dissolution rates [9,10,11,12].
Inhibiting the passivation product during chalcopyrite leaching and altering its microscopic electronic structure are crucial factors in improving its leaching kinetics. Researchers have devoted significant efforts to enhancing the leaching rate of chalcopyrite through mechanical activation pretreatment and controlling the redox potential within the leaching solution. Mechanical activation induces changes in microcrystal structure and physicochemical properties by applying high-strength mechanical force to minerals, resulting in reduced particle size, enhanced structural disorder, and modified semiconductor properties [13,14,15,16]. These alterations lead to increased reactivity and facilitate the dissolution of chalcopyrite [17]. Research findings from Bai et al. [14] and Granata et al. [18] demonstrated that mechanical activation significantly increased the crystal lattice distortion of chalcopyrite, thereby greatly accelerating its leaching kinetics and effectively increasing the leaching rate. Cao et al. [19] found that mechanical activation promoted the redox reaction on the surface of chalcopyrite, accelerated its dissolution, and mitigated passivation during bioleaching, resulting in an increase in the leaching rate from 9.39% to 87.41%. Yang et al. [20] investigated the impact of mechanical activation mode on the microstructure and leaching rate of chalcopyrite. They concluded that both dry- and wet-milling cause “sulfur channels” on the surface of chalcopyrite to weaken the “passivation” effect, but dry-milling led to more severe surface oxidation and selective fracture within its lattice, yielding a better leaching effect.
When Fe2+, Fe3+, and Cu2+ coexist in a solution, the potential is primarily determined by the concentration of Fe3+ and Fe2+ [21,22,23,24,25,26]. The ratio of Fe3+/Fe2+ significantly influences the leaching of chalcopyrite. Vilcaez et al. [22,23] have reported that when the solution potential exceeded 450 mV (vs. Ag/AgCl)—corresponding to high initial Fe3+ concentrations (5000 mg/L)—chalcopyrite underwent direct oxidation by Fe3+, resulting in ineffective leaching. Conversely, at potentials below 450 mV (vs. Ag/AgCl) with low initial Fe3+ concentrations (200 mg/L), chalcopyrite initially forms intermediate species that are readily oxidized and decomposed, thereby enhancing dissolution. Córdoba et al. [25] have validated the aforementioned model by demonstrating that effective leaching becomes increasingly difficult when the solution potential exceeds 500 mV (vs. Ag/AgCl). Additionally, Santos et al. [26] have discovered that the leaching rate of chalcopyrite reaches its peak at a solution potential of 410–470 mV (vs. Ag/AgCl) with an Fe2+ concentration between 0.125 and 0.215 mol/L, once again highlighting the crucial role played by both the presence and redox potential of Fe2+ in oxidation and dissolution processes.
As reported in previous work [27,28], mechanical activation significantly refines chalcopyrite particles. However, as activation time increases, particle size tends to stabilize, possibly due to inhibited agglomeration. XRD analysis in [28] showed decreased diffraction peak intensity and peak broadening, indicating altered internal crystal structure (reduced grain size and increased micro-strain).
However, there has been limited research on electrochemical behavior and electronic structure analysis regarding mechanically activated chalcopyrite in a leaching system. Therefore, this study investigated the effect of mechanical activation on the electrochemical behavior of chalcopyrite in the leaching system, aiming to explore the electrochemical properties and semiconductor properties of mechanically activated chalcopyrite in the H2SO4-Fe3+ or/and Fe2+ system, which may help to improve its hydrometallurgical process and use electrochemical technology to explore the effect of mechanical activation, which is of great significance for chalcopyrite leaching.

2. Materials and Methods

2.1. Chalcopyrite Samples

The chalcopyrite sample was obtained from Dongchuan City, Yunnan Province, China. The particle size of the chalcopyrite sample used for mechanical activation testing is less than 0.15 mm. The sample was mainly chalcopyrite peaks without other obvious impurity peaks, as detailed in previous work [27,28]. Chemical analysis demonstrated that the sample comprised 32.75% Cu, 28.60% Fe, 31.78% S, and minor impurities accounting for 3.01%. These analytical findings indicate that the purity of the chalcopyrite samples meets test requirements.

2.2. Mechanical Activation Experiments

The mechanical activation parameters (700 rpm, 0.5–2.5 h) were selected based on previous optimization studies [14,19]. The mechanical activation test was conducted using a YXQM planetary ball mill (Mitr, Changsha, China), wherein a 100 g grinding ball and 5 g chalcopyrite sample with a particle size smaller than 0.15 mm were added to a 100 mL zirconia ball mill (Mitr, Changsha, China). The grinding ball consisted of zirconia and comprised balls with diameters of 3 mm, 5 mm, and 10 mm with proportions of 30%, 50%, and 20%, respectively. The mechanical activation speed was set at 700 rpm, while the activation time varied between 0.5 and 2.5 h at intervals of 0.5 h. Subsequent analysis and testing were performed immediately after the completion of the mechanical activation test.

2.3. Electrochemical Experiments

The working electrode used in the electrochemical test is a 4 mm diameter glassy carbon electrode. In order to achieve a contamination-free, mirror-like surface on the glassy carbon electrode, it was initially polished using alumina powder with particle sizes of 1.0 μm and 0.3 μm for 5 min each. The electrode was then ultrasonically oscillated in deionized water, concentrated nitric acid (volume ratio: 1:1), anhydrous ethanol, and deionized water for 30 s before drying under an infrared lamp. A chalcopyrite suspension was prepared by mixing 10 mg of chalcopyrite, 0.5 mL of anhydrous ethanol, 1.5 mL of deionized water, and 50 μL of Nafion membrane solution in a 10 mL serum bottle, followed by 15 min of ultrasonic oscillation for uniform distribution. Exactly 8 μL of the prepared chalcopyrite suspension droplets were deposited onto the surface of the glassy carbon electrode, ensuring even distribution across its entire area. Finally, the electrode was dried again under an infrared lamp to obtain the working electrode. The electrode preparation method was referred to in the literature [29,30,31].
The electrochemical test utilizing a three-electrode system was conducted on a Gamry electrochemical workstation (Gamry, Philadelphia, PA, USA), where the prepared glassy carbon electrode served as the working electrode, while graphite electrodes and mercurous sulfate electrodes (Sat K2SO4) were used as counter electrodes and reference electrodes, respectively [29,30,31]. The electrolyte consisted of a pH = 1.5 sulfuric acid solution along with a concentration of Fe2+ = 0.1 mol/L, or Fe2+: Fe3+ = 0.05 mol/L:0.05 mol/L, or Fe3+ = 0.1 mol/L. The pH of the electrolyte is measured with a magnetic-thunder E-201C pH meter (Leici, Shanghai, China). Before each measurement, the electrode is calibrated with a standard buffer solution to ensure accurate and reliable measurement results. The cyclic voltammetry tests scan from the open-circuit potential towards the anode. The cyclic voltammetry curve (scanning rate of 20 mV/s, scanning range from −400 to +1000 mV, consistent with previous studies on sulfide minerals [32]). Mott–Schottky tests were conducted at a frequency of 1 kHz, and the potential was converted to hydrogen standard potential (SHE). Electrochemical tests were carried out in an open atmosphere at room temperature.

3. Results and Discussion

3.1. Cyclic Voltammetry of Chalcopyrite After Mechanical Activation

The electrochemical behavior of chalcopyrite was investigated under various mechanical activation conditions in different systems. The cyclic voltammetry curve is presented in Figure 1. As depicted in Figure 1a, the non-activated chalcopyrite exhibited three anodic oxidation peaks (A1–A3) and four cathodic reduction peaks (C1–C4) in the H2SO4 system.
Upon scanning from the open circuit potential towards the positive potential direction, the initial appearance of oxidation peak A1 (740 mV) indicated preferential dissolution of iron from the chalcopyrite lattice, resulting in the formation of metal-deficient sulfides (Cu1−xFe1−yS2−z, y > x) [32,33,34,35,36] (Equation (1)). Simultaneously, chalcopyrite also underwent oxidation to form covellite (CuS) [37] (Equation (2)). As the scanning potential increased to 1000 mV, A2 indicated complete oxidation of chalcopyrite and the release of iron and copper ions (Equations (3) and (4)). At this time, covellite (CuS) formed by oxidation at peak A1 will also dissolve [38,39] (Equation (5)). The current densities of oxidation peaks A1 and A2 exhibited an increase with prolonged mechanical activation time.
Shifting the anode scan from 1000 mV to the cathode resulted in a reduction peak C1 emerging at approximately 640 mV, indicating the conversion of Fe3+ produced by chalcopyrite oxidation to Fe2+ [35,39] (Equation (6)). Reduction peaks C2 and C3 occurred within a potential range of 360–400 mV, signifying the reduction in Cu2+ and S to CuS, respectively, along with further reactions between Cu2+ and generated covellite leading to the formation of Cu2S [33,40,41] (Equations (7) and (8)). A continuing scan towards the cathode revealed a C4 peak appearing around −110 mV, indicating the reduction in chalcopyrite to bornite Cu5FeS4 and chalcocite Cu2S [32,37] (Equations (9) and (10)). Additionally, there may be a reaction where chalcopyrite is reduced to Cu9Fe8S16 [42] (Equation (11)). The reduction peak current for mechanically activated chalcopyrite increased with longer activation times; however, the intensity of the reduction peak C2 decreased, disappearing after 0.5 h of activation.
When the scanning direction is reversed back to the anode at about 390 mV, oxidation peak A3 is observed, which involves the conversion of H2S it formed by reduction in chalcopyrite to bornite, chalcocite, etc., into elemental S [32,34,36,40] (Equation (12)), and the oxidation of chalcocite through a series of reactions [40,42,43] (Equations (13)–(15)). The oxidation peak currents of mechanically activated chalcopyrite increased with prolonged activation time; however, no new oxidation or reduction peaks were generated.
CuFe S 2 Cu 1 - x Fe 1 - y S 2 - z + x Cu 2 + + y Fe 2 + + z S 0 + 2 ( x + y ) e -
CuFe S 2 0.75 Cu S + 0.25 Cu 2 + + Fe 2 + + 1.25 S 0 + 2.5 e -
CuFe S 2 Cu 2 + + Fe 3 + + 2 S 0 + 5 e -
CuFe S 2 + 8 H 2 O C u 2 + + F e 3 + + 2 S O 4 2 - + 16 H + + 17 e -
CuS + 4 H 2 O C u 2 + + S O 4 2 - + 8 H + + 8 e -
F e 3 + + e - F e 2 +
C u 2 + + S 0 + 2 e - CuS
C u 2 + + Cu S + 2 e - C u 2 S
2 CuFe S 2 + 3 C u 2 + + 4 e - C u 5 Fe S 4 + F e 2 +
CuFe S 2 + 3 C u 2 + + 4 e - 2 C u 2 S + F e 2 +
9 CuFe S 2 + 4 H + + 2 e - C u 9 F e 8 S 16 + 2 H 2 S + F e 2 +
H 2 S S 2 2 - S n 2 - S 0
C u 2 S C u 1.92 S + 0.08 C u 2 + + 0.16 e -
C u 1.92 S C u 1.6 S + 0.32 C u 2 + + 0.64 e -
C u 1.6 S CuS + 0.6 C u 2 + + 1.2 e -
In the Fe2+ = 0.1 mol/L system, compared to the sulfuric acid system, the current densities of oxidation peaks A1 and A2 are significantly enhanced and increase with prolonged mechanical activation time. The A1 peak indicates preferential dissolution of iron from the chalcopyrite lattice and oxidation of Fe2+, while A2 represents complete oxidation of chalcopyrite. The reduction peak remains similar to that observed in the sulfuric acid system, suggesting comparable reduction reactions of chalcopyrite in both systems.
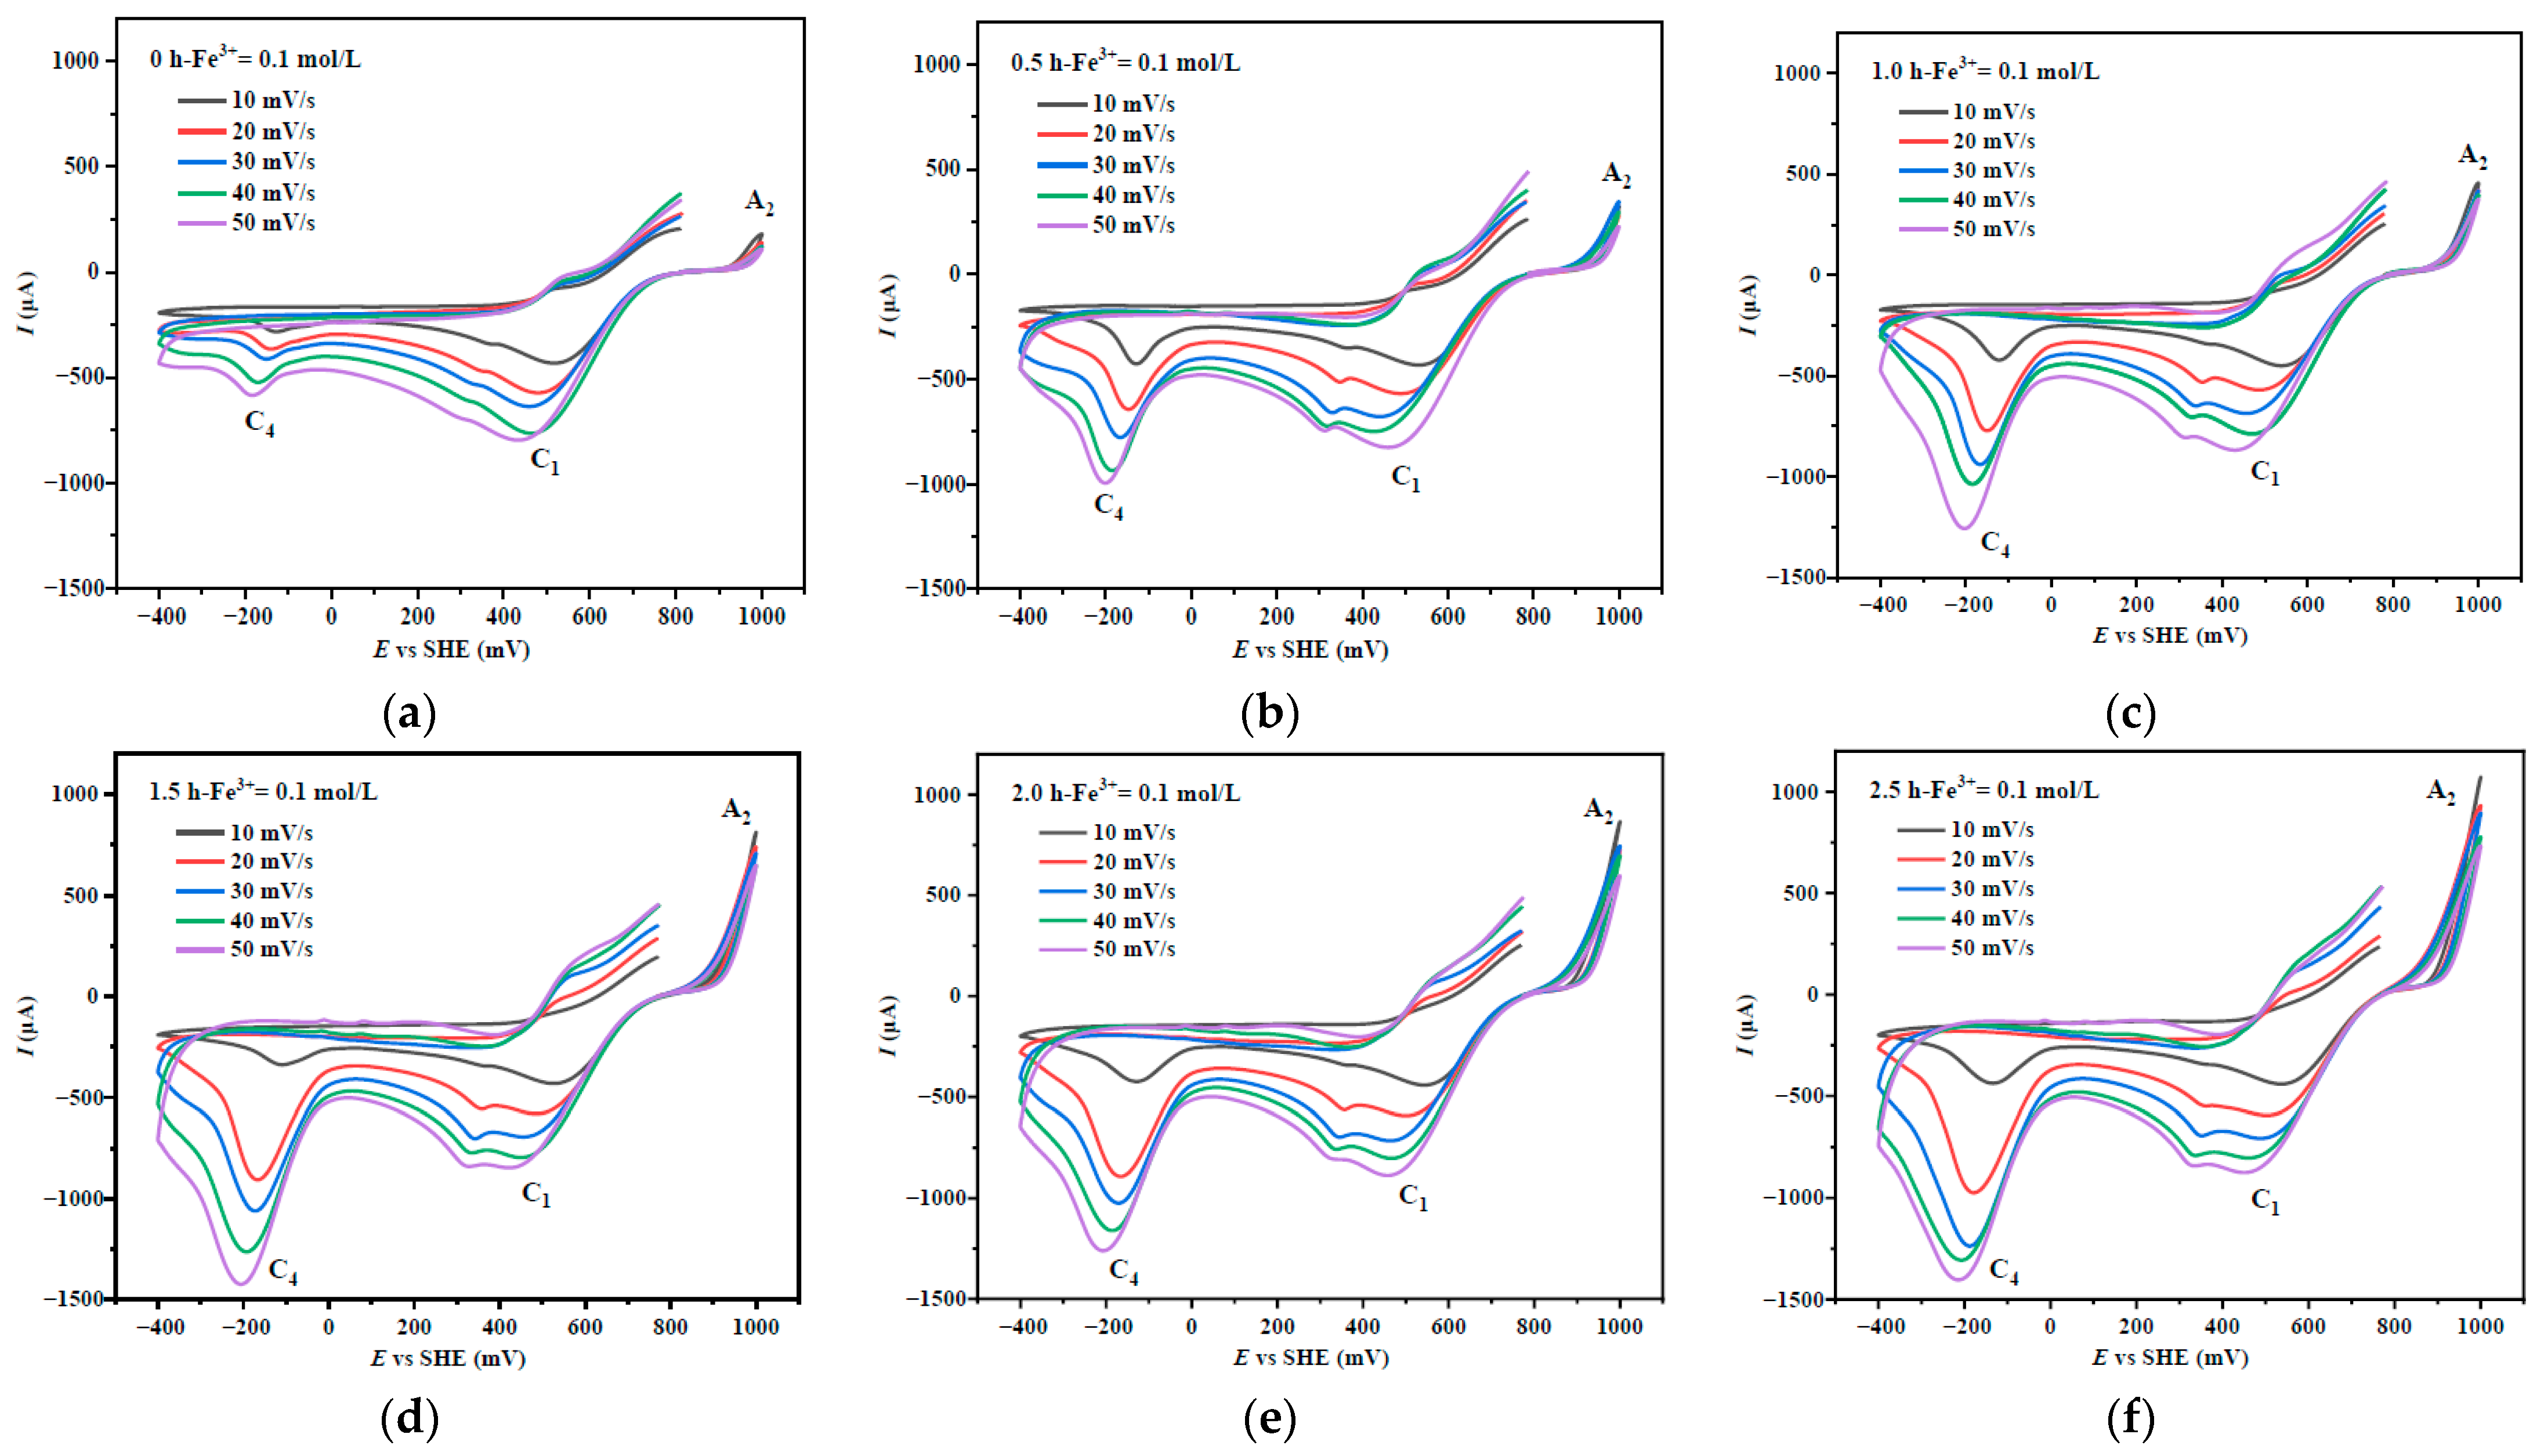
In the Fe2+: Fe3+ = 0.05 mol/L:0.05 mol/L and Fe3+ = 0.1 mol/L systems, the oxidation peak labeled as A4 was observed at 510–570 mV, with both peaks (A3 and A4) indicating exclusive oxidization of chalcocite only. The intensities for oxidation peak A2 and reduction peak C4 increased significantly along with extended activation time; however, other peaks showed no sensitivity towards activation time without significant differences in intensity.
In the three iron-containing systems, the oxidation peak (A1) current decreases as the concentration of Fe3+ increases. This can be attributed to the increase in redox potential of the solution with an increasing Fe3+ concentration. Prior to reaching the peak potential of oxidation, partial oxidation occurs on the surface of chalcopyrite, resulting in a reduction in the oxidation peak current. Conversely, the reduction peak current increases with higher Fe3+. Simultaneously, mechanical activation induces lattice expansion and defects within chalcopyrite, thereby fundamentally driving varying degrees of increase in its electrochemical activity and reactivity towards redox reactions.
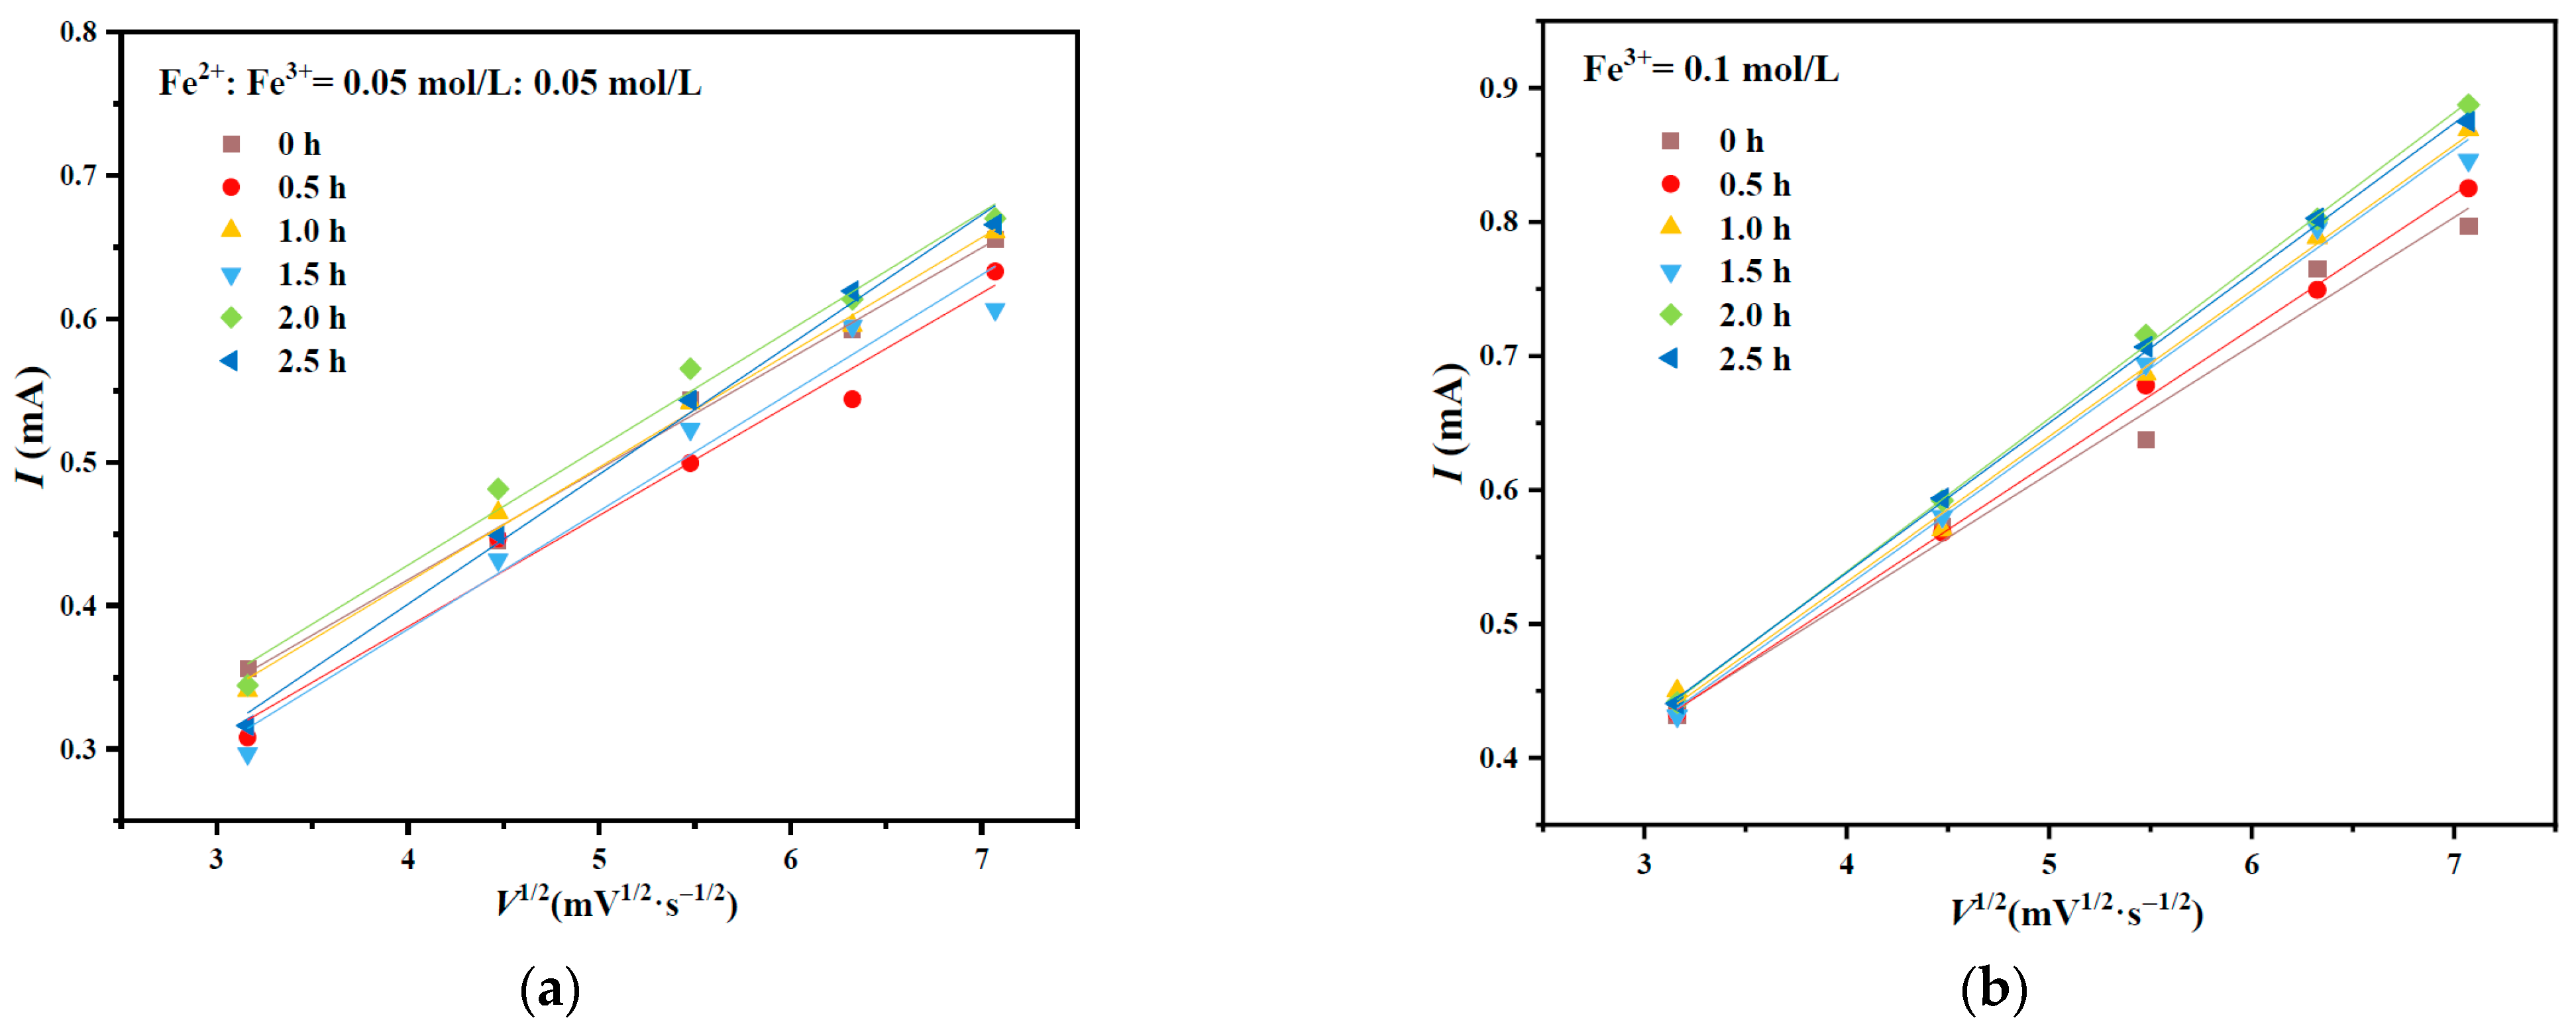
According to Randles–Sevcik Equation (16) [39], the cyclic voltammetry curves of chalcopyrite were measured in different systems with Fe2+ = 0.1 mol/L, Fe2+:Fe3+ = 0.05 mol/L:0.05 mol/L, and Fe3+ = 0.1 mol/L systems at various scanning rates (10 mV/s, 20 mV/s, 30 mV/s, 40 mV/s, and 50 mV/s) (Figure 2, Figure 3 and Figure 4). The currents of reduction peak C1 and C4 were plotted against the square root of the scanning rate (Figure 5 and Figure 6). Data fitting results are presented in Table 1 and Table 2 to evaluate the electrochemical activity of mechanically activated chalcopyrite. The slope in Figure 5 and Figure 6 is represented as K = 2.99 × 10⁵α1/2AD1/2C, which can be utilized as an indicator for changes in diffusion coefficient to demonstrate the impact of mechanical activation on the electrochemical activity of chalcopyrite in leaching systems.
ip = 2.99 × 10⁵α1/2AD1/2CV1/2
In the formula, ip represents the peak current (A); α denotes the transfer coefficient of electrode reaction, typically ranging from 0.3 to 0.7, and in this case, we assume it as 0.5; A signifies the electrode area (cm2), which is precisely measured as 0.1256 cm2; D stands for the diffusion coefficient of the material (cm2/s); C represents the concentration (mol/cm3); and V indicates the scanning speed (mV/s).
The reduction peak C1 corresponds to the reduction in Fe3+ on the surface of chalcopyrite (Figure 5). Table 1 demonstrates that in an electrolyte solution containing Fe2+: Fe3+ = 0.05 mol/L:0.05 mol/L and Fe3+ = 0.1 mol/L, there is a high degree of fitting between the current and scan rate for reduction peak C1.
In the same electrolyte solution, the slope of mechanically activated chalcopyrite slightly increases compared with that of non-mechanically activated chalcopyrite. In Fe2+: Fe3+= 0.05:0.05 mol/L: K increased from 0.077 (0 h) to 0.090 (2.5 h). In Fe3+ = 0.1 mol/L: K increased from 0.096 (0 h) to 0.112 (2.5 h). This indicates that the effect of mechanical activation on the reduction in Fe3+ on the surface of chalcopyrite can be ignored. Under identical activation conditions, the K value in Fe3+ = 0.1 mol/L was greater than that in the Fe2+: Fe3+ = 0.05 mol/L:0.05 mol/L system, suggesting that as the concentration of Fe3+ increases, it reduces more quickly to form Fe2+ on mechanically activated chalcopyrite surfaces.
The reduction peak C4 is associated with the conversion of chalcopyrite into intermediate products such as chalcocite and bornite, indicating that ion diffusion occurs at the solid–liquid interface (Figure 6). A higher K value corresponds to a faster reduction rate of chalcopyrite; meanwhile, the released ferrous ions diffuse into the bulk solution, according to the findings in Table 2, which demonstrate a better fit between current values for reduction peak C4 and the scan rates employed during testing procedures. Mechanically activated chalcopyrite displays a significantly steeper slope compared to non-activated samples when tested under identical electrolyte solutions, suggesting that mechanical activation greatly enhances electrochemical activity within these materials. As activation time increases up until 1.5 h, both slopes rise accordingly, reaching their peaks at this point. Indicative evidence suggests an increasing diffusion coefficient for Fe2+ ions along with faster rates of reducing chalcopyrite, ultimately leading to easier formation processes involving intermediate products.
The slope (K) of mechanically activated chalcopyrite exhibits an increasing trend in different electrolyte solutions under identical activation conditions. Specifically, this trend is observed in systems with Fe2+ = 0.1 mol/L, Fe2+: Fe3+ = 0.05 mol/L:0.05 mol/L, and Fe3+ = 0.1 mol/L, respectively. These findings suggest that the surface reduction product Fe2+ demonstrates rapid diffusion kinetics within the Fe3+ system.

3.2. Effect of Mechanical Activation on the Semiconductor Properties of Chalcopyrite

The natural chalcopyrite can be categorized as n-type and p-type semiconductors [44], with its redox reaction closely linked to electronic structure and semiconductor properties. The mechanical activation enhances the lattice distortion of chalcopyrite. Upon contact between the chalcopyrite surface and the electrolyte solution, the total capacitance of the semiconductor–solution interface is represented by Equation (17). Mott–Schottky analysis is an electrochemical method used to measure the capacitance on the electrode surface when an alternating current potential is applied. The Mott–Schottky curve was utilized to investigate the semiconductor properties of chalcopyrite (Equations (18) and (19)), which facilitates the analysis of the influence of mechanical activation on the carrier concentration, flat-band potential and semiconductor type of chalcopyrite [45].
C = C SC + C H + C D
p-type semiconductor:
1 C SC 2 = - 2 ε 0 ε r A 2   N A ( E - E FB kT e )
n-type semiconductor:
1 C SC 2 = 2 ε 0 ε r A 2   N D ( E - E FB - kT e )
In the formula, CSC is the capacitance of the space charge region (F); CH is the Helmholtz layer capacitance (F); CD is the diffusion layer capacitance (F); ε 0 is the vacuum dielectric constant (8.854 × 10⁻¹² F/m); ε r is the relative dielectric constant (F/m); A is the electrode area (m2); N D is the donor concentration; N A is the acceptor concentration; E is the applied voltage (V); E FB is flat band potential; k is the Boltzmann constant (1.38 × 10⁻²³ J/K); T is the thermodynamic temperature in Kelvin (K); e is the elementary charge (1.602 × 10⁻¹⁹ C); the value of kT /e at room temperature is negligible and typically disregarded.
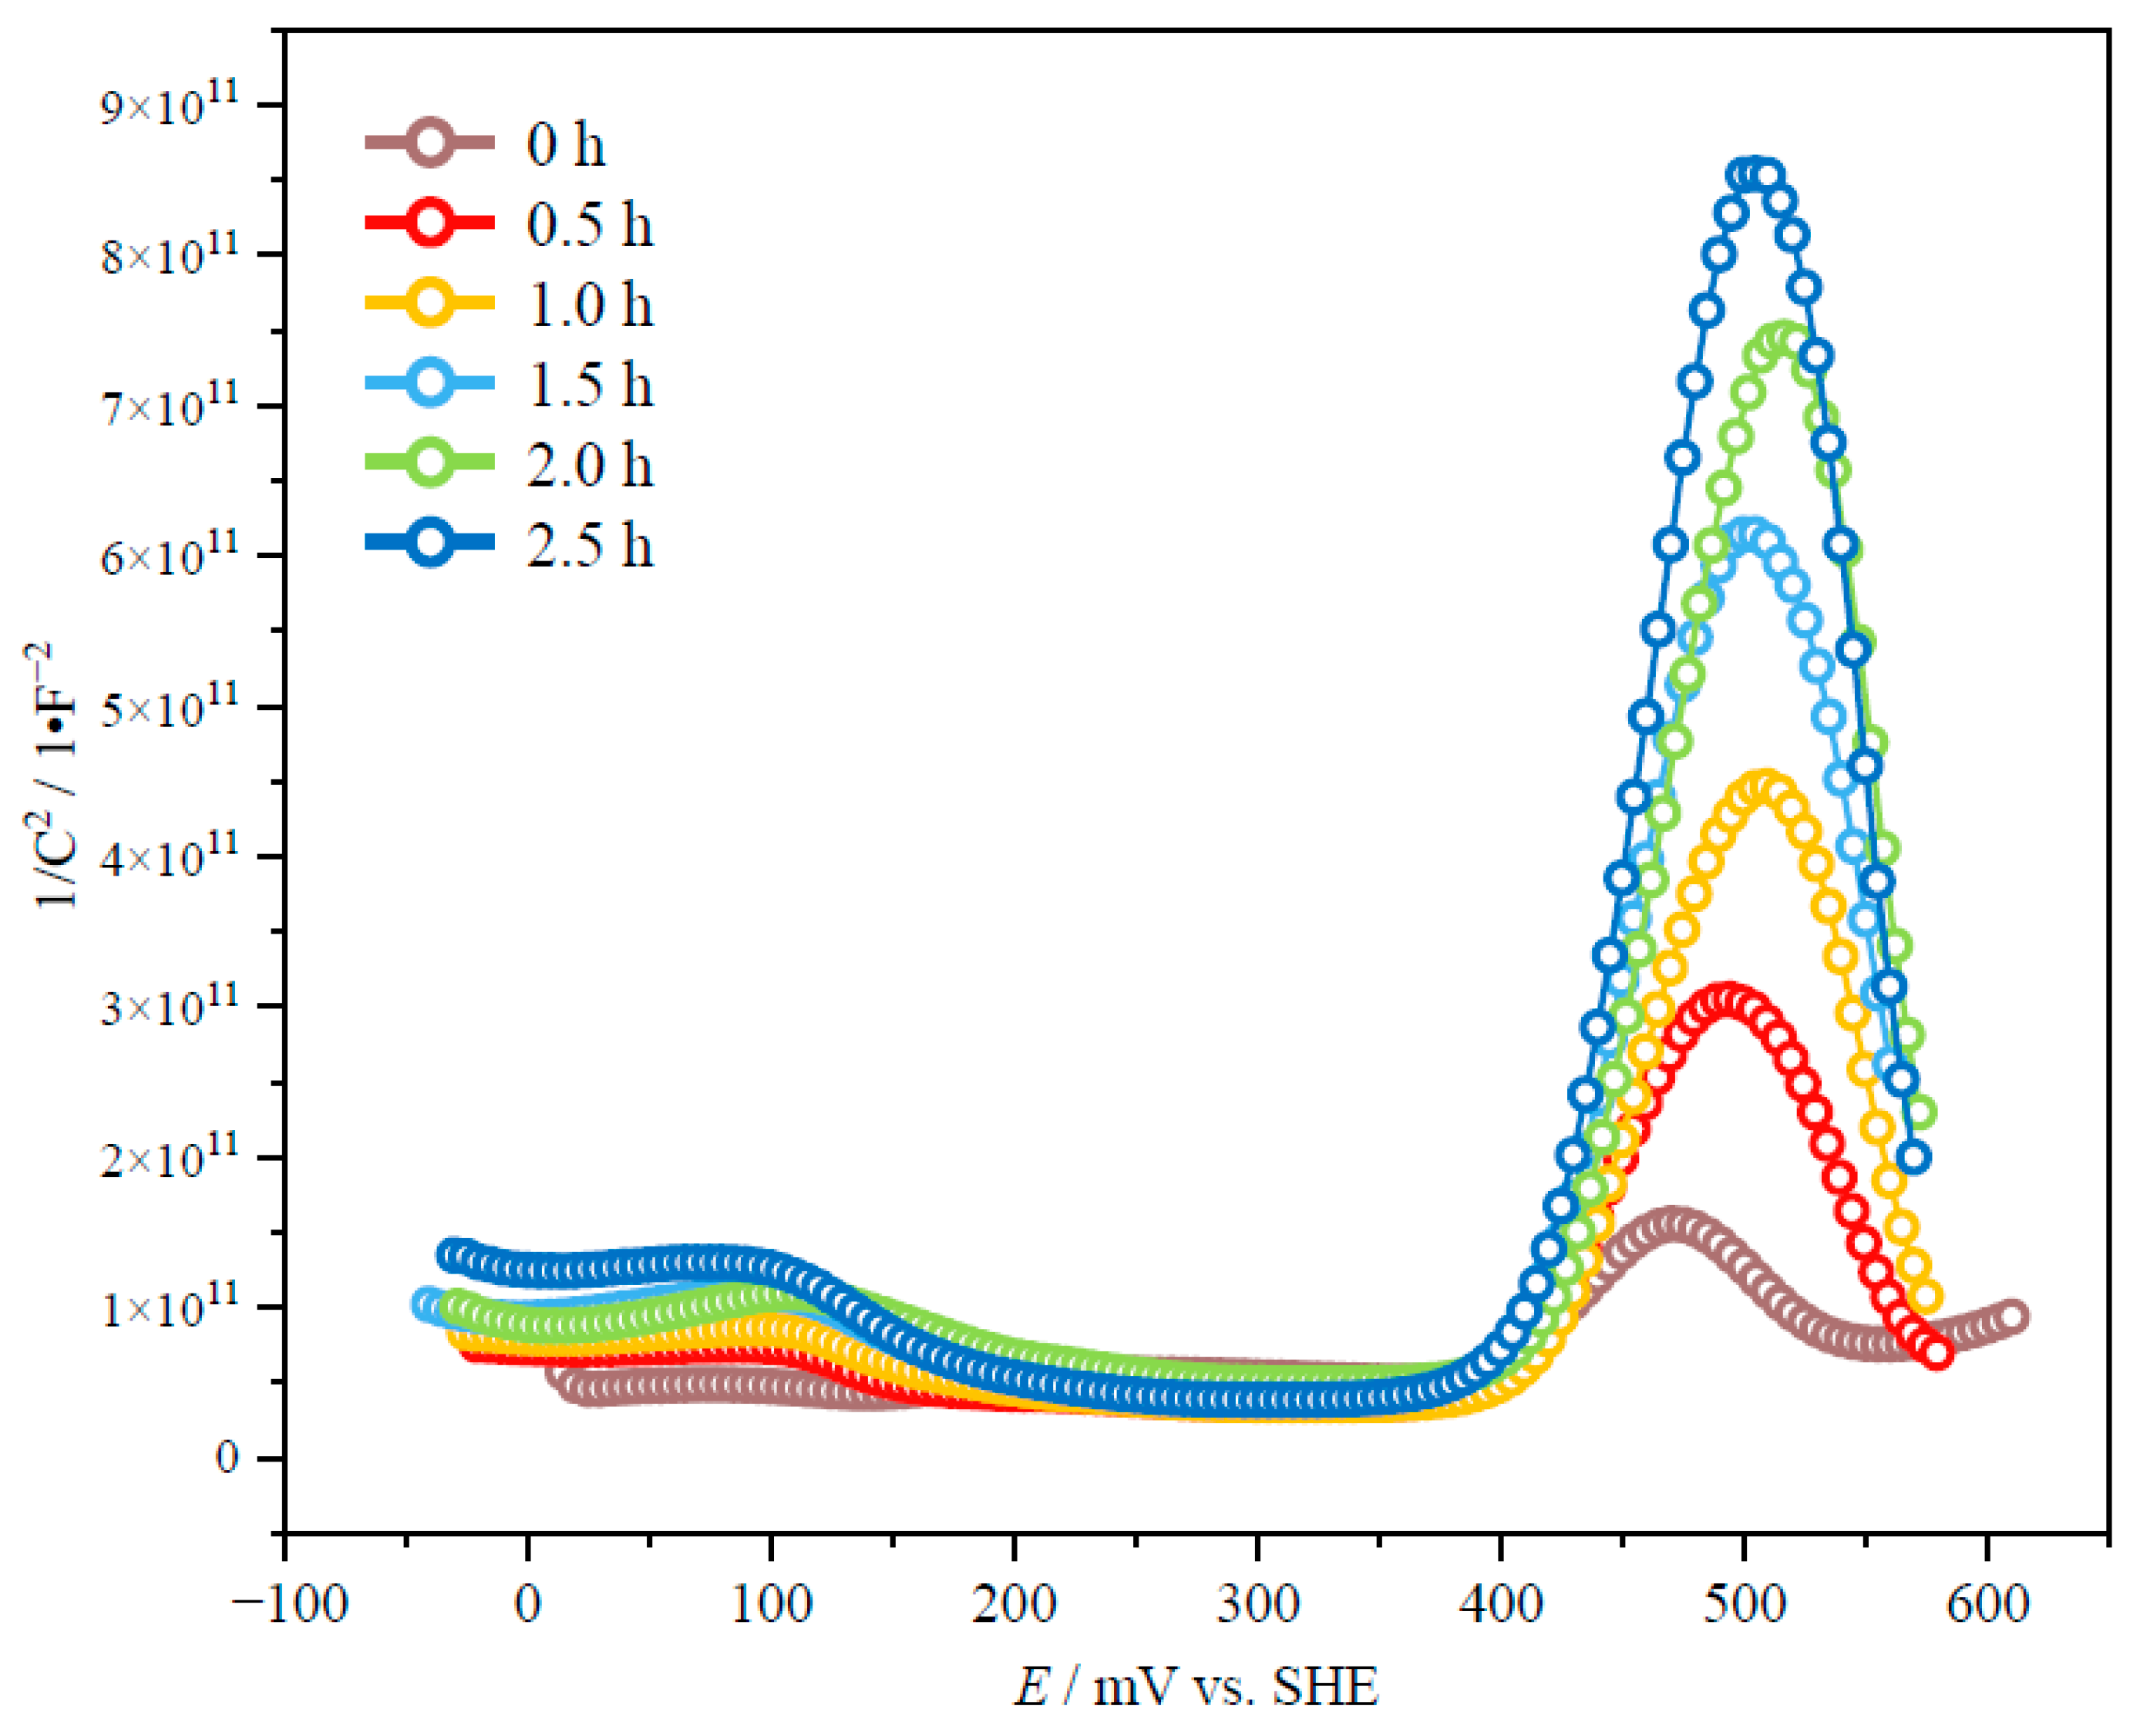
The Mott–Schottky curve of mechanically activated chalcopyrite in the H2SO4 system is illustrated in Figure 7. Within the potential range of 400–480 mV, the M–S curve for non-activated chalcopyrite exhibits a positive slope, indicating n-type behavior. However, within the range of 480–560 mV, the slope becomes negative and suggests a p-type characteristic for chalcopyrite. Transitions from n-type to p-type behavior are observed at voltages between 560 and 600 mV, resulting in multiple changes in semiconductor type within the measured potential range. When subjected to mechanical activation times ranging from 0.5 h to 2.5 h, chalcopyrite demonstrates n-type behavior at potentials between 400 and 500 mV and switches to p-type at potentials between 500 and 600 mV.
According to Table 3, it can be observed that during a mechanical activation time period of 0 h–1.0 h, chalcopyrite acts as an n-type semiconductor, with its flat band potential decreasing as activation time increases. This indicates an increase in Fermi level and greater instability in electronic energy levels for this semiconductor material under such conditions. Furthermore, higher electrochemical activity corresponds to easier reactivity with particles present in the solution. After a duration of 1.5 h during chalcopyrite activation, only minimal differences in flat band potential values are observed, suggesting that prolonged mechanical activation time has a limited impact on enhancing electrochemical activity beyond a certain threshold range.
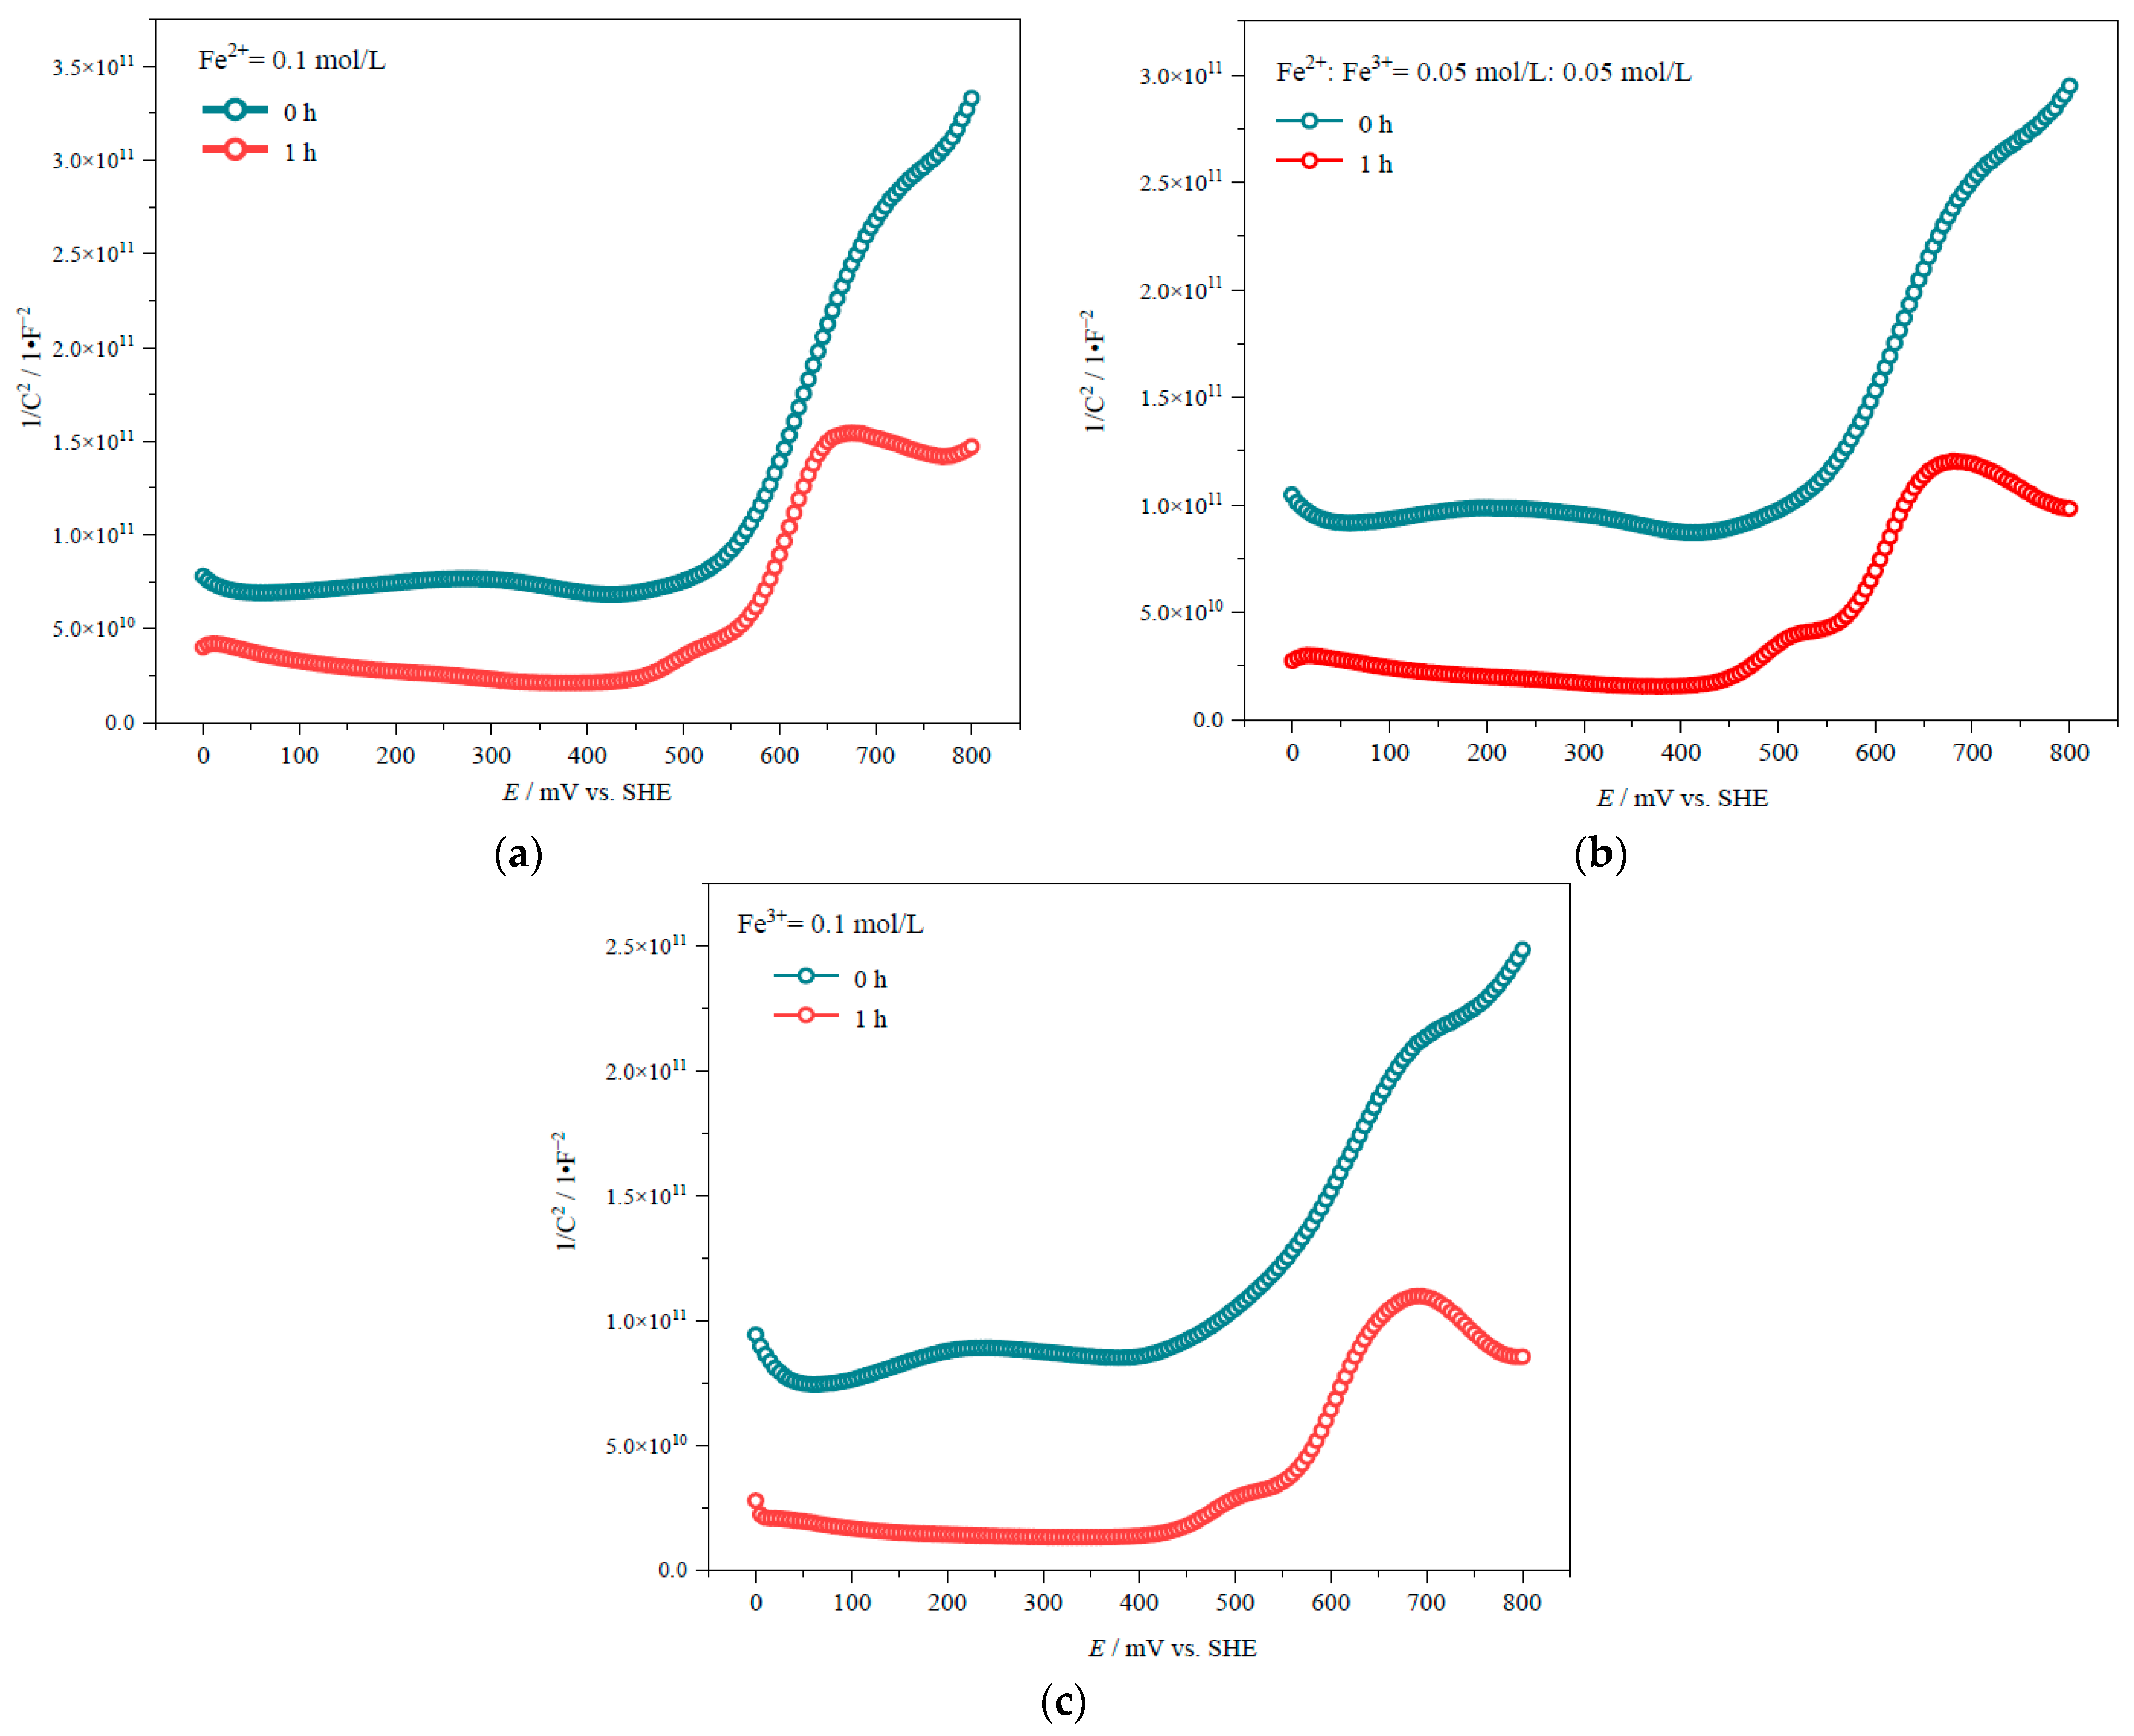
The variations in the energy band structure of chalcopyrite in different electrolyte solutions before and after mechanical activation were investigated. The conditions for mechanical activation included an activation time of 1.0 h and a rotation speed of 700 rpm. A comparison was made between the Mott–Schottky curves of chalcopyrite in different solutions before and after mechanical activation (Figure 7), with corresponding calculation results presented in Table 4. The results depicted in Figure 8 demonstrate that within the potential range of 550–650 mV, under Fe2+ = 0.1 mol/L, Fe2+: Fe3+ = 0.05 mol/L:0.05 mol/L and Fe3+ = 0.1 mol/L, chalcopyrite exhibits n-type semiconductor behavior. Table 4 reveals that mechanical activation leads to a reduction in the flat band potential of chalcopyrite across various systems. This mechanical activation elevates the Fermi level of semiconductors and renders electronic energy levels more unstable [46]. Consequently, mechanically activated chalcopyrite exhibits enhanced electrochemical activity, facilitating its reaction with ions present in the solution. Notably, in the Fe3+ = 0.1 mol/L solution, chalcopyrite experiences the most significant decrease in flat band potential, indicating an increase in reactivity towards Fe3+.

3.3. Tafel Curve of Chalcopyrite After Mechanical Activation

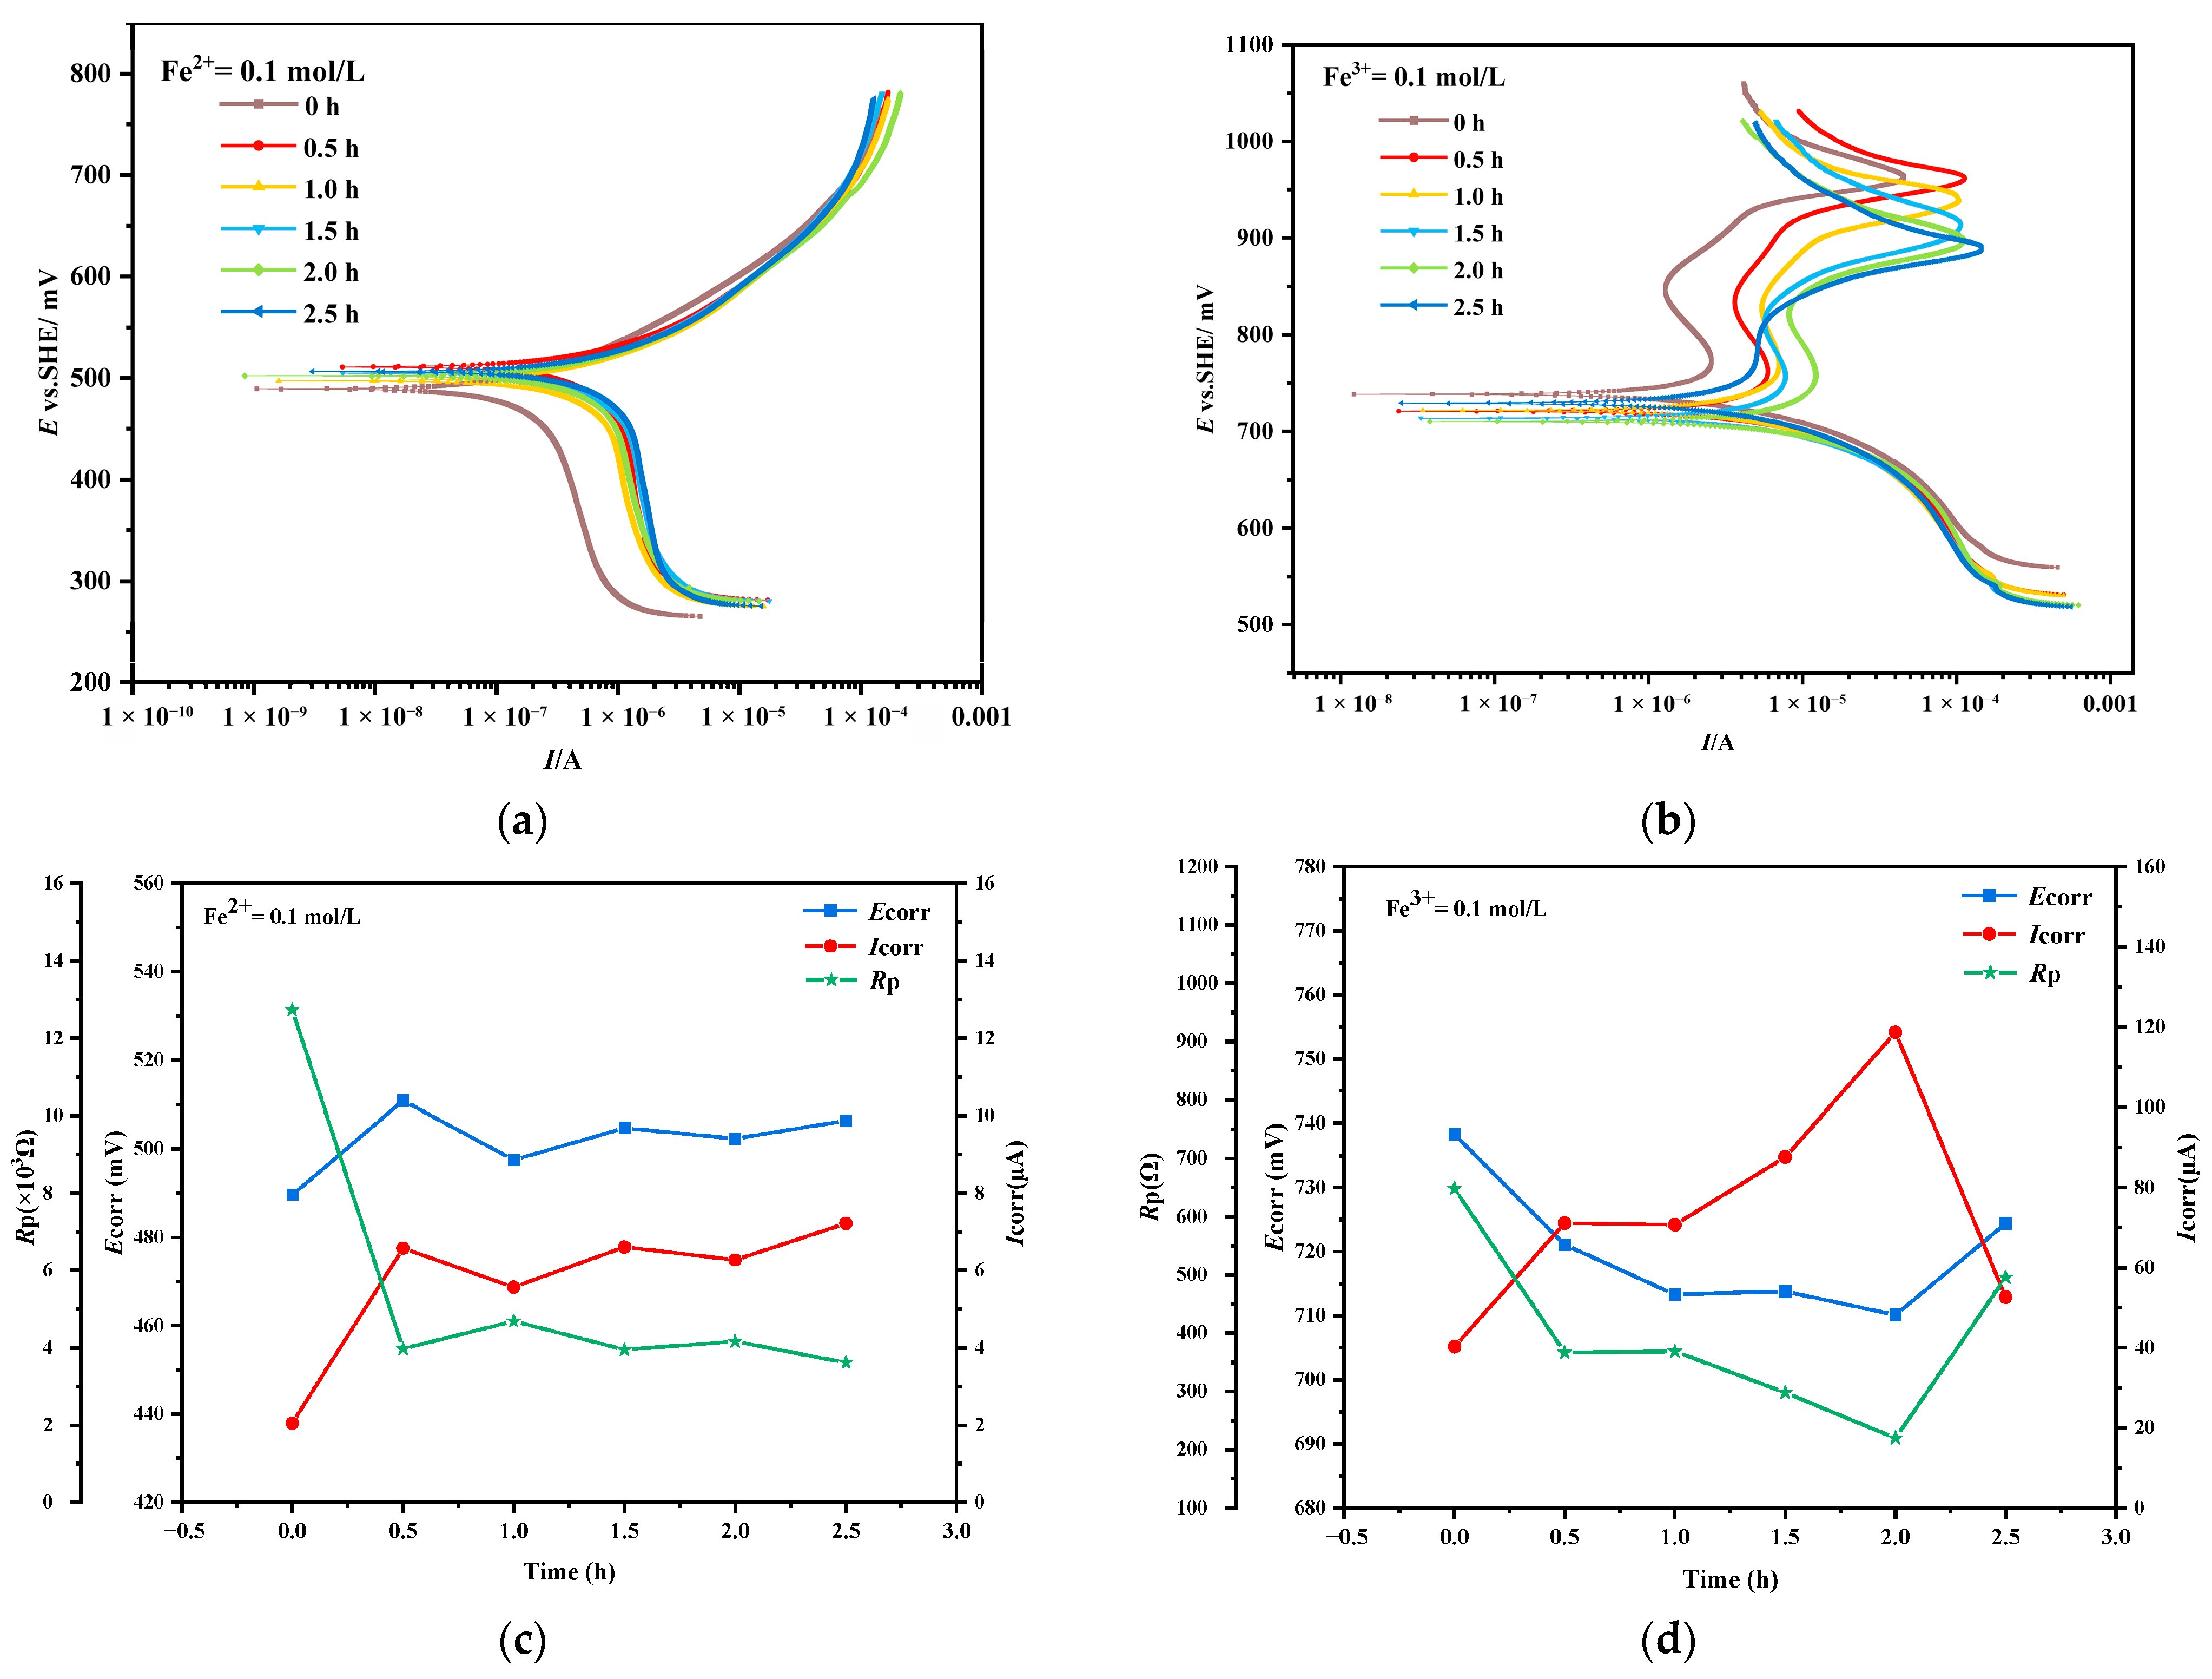
Previous research indicates that the leaching rate of chalcopyrite in the Fe2+ system is higher than that in the Fe3+ system, but the mechanically activated chalcopyrite has a higher leaching rate in the Fe3+ system [28]. Therefore, the influence of mechanical activation time on the electrochemical corrosion of chalcopyrite in Fe2+ and Fe3+ systems was studied. The Tafel curves of mechanically activated chalcopyrite in Fe2+ = 0.1 mol/L and Fe3+ = 0.1 mol/L solution were plotted in Figure 9a,b, and the corrosion kinetic parameters, including corrosion potential, corrosion current, and polarization resistance, were calculated (Figure 9c,d) [47,48]. It can be observed from Figure 9c that obvious changes occur in corrosion potential, corrosion current, and polarization resistance after mechanical activation in Fe2+ = 0.1 mol/L systems, but the Tafel curves of chalcopyrite after mechanical activation are almost the same, with prolonged mechanical activation time from 0.5 to 2.5 h, and there is little variation observed in terms of these corrosion kinetic parameters.
In Figure 9b we calculate the relevant parameters in the weakly polarized region less than 10 mV. The anode branch shows that the chalcopyrite has undergone a polysulfide–copper sulfide–elemental sulfur transition [49]. The reduction behavior of ferrous ions is basically consistent with that of cathode branching. The Tafel curve of chalcopyrite in the Fe3+ system is significantly different from that in the Fe2+ system, especially as the passivation–activation–passivation phenomenon occurs in the anode branch (Figure 9b). However, as the mechanical activation time increases, the passivation near the corrosion potential weakens. In an Fe3+ = 0.1 mol/L system, both the corrosion currents increase with prolonged mechanical activation time; however, they return to non-activated levels after exceeding 2 h of activation time, indicating that there is an effective range for mechanical activation duration beyond which it affects the dissolution rate of chalcopyrite (Figure 9d). Compared to the Fe2+ = 0.1 mol/L solution, the corrosion current showed a significant increase in the Fe3+ = 0.1 mol/L solution. This suggests that mechanical activation can accelerate the dissolution rate of chalcopyrite in ferric solution.

4. Conclusions

Mechanical activation significantly modifies the electrochemical and semiconductor properties of chalcopyrite. Through particle size reduction and the introduction of lattice distortion, this pretreatment markedly alters the electrochemical behavior of chalcopyrite in H2SO4-Fe2+/Fe3+ systems. Cyclic voltammetry results demonstrate intensified oxidation and reduction peaks with extended mechanical activation, indicating a substantial enhancement in redox activity. Specifically, after 1.5 h of activation at 700 rpm, the Randles–Sevcik slope (K) in the Fe3+ system increased from 0.039 to 0.266, which is equivalent to a significant increase in the ion diffusion rate at the solid–liquid interface. Additionally, Mott–Schottky analysis indicated a decrease in the flat band potential from 261.7 mV to 131.2 mV, which promotes more efficient electron transfer and facilitates electron capture by Fe3+ from the chalcopyrite surface. These quantitative results confirm that mechanical activation considerably enhances the electrochemical reactivity of chalcopyrite, leading to an accelerated corrosion rate in ferric sulfate solutions. In summary, mechanical activation pretreatment effectively enhances the redox activity of chalcopyrite.

Author Contributions

Conceptualization, C.Y.; methodology, Y.L. and Z.T.; formal analysis, Y.L. and Z.T.; investigation, Z.T.; writing—original draft preparation, Y.L. and Z.T.; writing—review and editing, C.Y.; visualization, Y.L.; supervision, X.W.; project administration, X.W.; funding acquisition, C.Y. All authors have read and agreed to the published version of the manuscript.

Funding

This research was funded by National Key R&D Program of China (Grant No. 2022YFC2105301).

Data Availability Statement

The original contributions presented in the study are included in the article, further inquiries can be directed to the corresponding author.

Conflicts of Interest

The authors declare no conflicts of interest.

References

  1. Kartal, M.; Xia, F.; Ralph, D.; Rickard, W.D.A.; Renard, F.; Li, W. Enhancing chalcopyrite leaching by tetrachloroethylene-assisted removal of sulphur passivation and the mechanism of jarosite formation. Hydrometallurgy 2020, 191, 105192. [Google Scholar] [CrossRef]
  2. Khoshkhoo, M.; Dopson, M.; Engström, F.; Sandström, Å. New insights into the influence of redox potential on chalcopyrite leaching behaviour. Miner. Eng. 2017, 100, 9–16. [Google Scholar] [CrossRef]
  3. Chen, B.W.; Wen, J.K. Feasibility study on heap bioleaching of chalcopyrite. Rare Met. 2013, 32, 524–531. [Google Scholar] [CrossRef]
  4. Ríos, D.; Bellenberg, S.; Christel, S.; Lindblom, P.; Giroux, T.; Dopson, M. Potential of single and designed mixed cultures to enhance the bioleaching of chalcopyrite by oxidation-reduction potential control. Hydrometallurgy 2024, 224, 106245. [Google Scholar] [CrossRef]
  5. Barton, I.F.; Hiskey, J.B. Chalcopyrite leaching in novel lixiviants. Hydrometallurgy 2022, 207, 105775. [Google Scholar] [CrossRef]
  6. Ahn, J.; Wu, J.J.; Lee, J. A Comparative Kinetic Study of Chalcopyrite Leaching Using Alternative Oxidants in Methanesulfonic Acid System. Mineral Process. Extr. Metall. Rev. 2022, 43, 390–401. [Google Scholar] [CrossRef]
  7. O’Connor, G.M.; Lepkova, K.; Eksteen, J.J.; Oraby, E.A. Electrochemical behaviour and surface analysis of chalcopyrite in alkaline glycine solutions. Hydrometallurgy 2018, 182, 32–43. [Google Scholar] [CrossRef]
  8. Jiang, L.S.; Leng, H.G.; Han, B.S. Dissolution and Passivation Mechanism of Chalcopyrite during Pressurized Water Leaching. Minerals 2023, 13, 996. [Google Scholar] [CrossRef]
  9. Zhou, S.; Gan, M.; Zhu, J.Y.; Li, Q.; Jie, S.Q.; Yang, B.J.; Liu, X.D. Catalytic effect of light illumination on bioleaching of chalcopyrite. Bioresour. Technol. 2015, 182, 345–352. [Google Scholar] [CrossRef] [PubMed]
  10. Crundwell, F.K. The semiconductor mechanism of dissolution and the pseudo-passivation of chalcopyrite. Can. Metall. Q. 2015, 54, 279–288. [Google Scholar] [CrossRef]
  11. Zhao, H.B.; Huang, X.T.; Wang, J.; Li, Y.N.; Liao, R.; Wang, X.X.; Qiu, X.; Xiong, Y.M.; Qin, W.Q.; Qiu, G.Z. Comparison of bioleaching and dissolution process of p-type and n-type chalcopyrite. Miner. Eng. 2017, 109, 153–161. [Google Scholar] [CrossRef]
  12. Zhao, C.X.; Yang, B.J.; Liao, R.; Hong, M.X.; Yu, S.C.; Liu, S.T.; Wang, J.; Qiu, G.Z. Combined effect and mechanism of visible light and Ag+ on chalcopyrite bioleaching. Miner. Eng. 2022, 175, 107283. [Google Scholar] [CrossRef]
  13. Li, Y.B.; Wang, B.; Xiao, Q.; Lartey, C.; Zhang, Q.W. The mechanisms of improved chalcopyrite leaching due to mechanical activation. Hydrometallurgy 2017, 173, 149–155. [Google Scholar] [CrossRef]
  14. Bai, Y.; Wang, W.; Zhao, S.; Lu, D.; Xie, F.; Dreisinger, D. Effect of Mechanical Activation on Leaching Behavior and Mechanism of Chalcopyrite. Miner. Process. Extr. Metall. Rev. 2022, 43, 440–452. [Google Scholar] [CrossRef]
  15. Xiao, Q.; Qiu, G.Z.; Hu, Y.H. Computational simulation to mechanical activation of pyrite (I)—Relation of structural strain to chemistry reaction activity. Chin. J. Nonferrous Met. 2001, 11, 900–905. [Google Scholar] [CrossRef]
  16. Wei, Z.L.; Yang, X.; Li, W.Q.; Ma, Q.; Wu, X.Y.; Li, Y.B. An Improved Understanding of Chalcopyrite Leaching Mechanisms: The Influence of Anisotropic Crystal Planes. Minerals 2023, 13, 1461. [Google Scholar] [CrossRef]
  17. Baláž, P. Mechanical activation in hydrometallurgy. Int. J. Miner. Process. 2003, 72, 341–354. [Google Scholar] [CrossRef]
  18. Granata, G.; Takahashi, K.; Kato, T.; Tokoro, C. Mechanochemical activation of chalcopyrite: Relationship between activation mechanism and leaching enhancement. Miner. Eng. 2019, 131, 280–285. [Google Scholar] [CrossRef]
  19. Cao, S.T.; Zheng, X.F.; Nie, Z.Y.; Zhou, Y.H.; Liu, H.C.; Chen, J.H.; Yang, H.Y.; Xia, J.L. Mechanical Activation on Bioleaching of Chalcopyrite: A New Insight. Minerals 2020, 10, 788. [Google Scholar] [CrossRef]
  20. Yang, H.Y.; Zhao, S.X.; Wang, G.R.; Zhang, Q.; Jin, Z.N.; Tong, L.L.; Chen, G.B.; Qiu, X.M. Mechanical activation modes of chalcopyrite concentrate and relationship between microstructure and leaching efficiency. Hydrometallurgy 2022, 207, 105778. [Google Scholar] [CrossRef]
  21. Yang, C.R.; Jiao, F.; Qin, W.Q. Leaching of chalcopyrite: An emphasis on effect of copper and iron ions. J. Cent. South Univ. 2018, 25, 2380–2386. [Google Scholar] [CrossRef]
  22. Vilcáez, J.; Yamada, R.; Inoue, C. Effect of pH reduction and ferric ion addition on the leaching of chalcopyrite at thermophilic temperatures. Hydrometallurgy 2009, 96, 62–71. [Google Scholar] [CrossRef]
  23. Vilcáez, J.; Inoue, C. Mathematical modeling of thermophilic bioleaching of chalcopyrite. Miner. Eng. 2009, 22, 951–960. [Google Scholar] [CrossRef]
  24. Kaplun, K.; Li, J.; Kawashima, N.; Gerson, A.R. Cu and Fe chalcopyrite leach activation energies and the effect of added Fe3+. Geochim. Cosmochim. Acta 2011, 75, 5865–5878. [Google Scholar] [CrossRef]
  25. Córdoba, E.M.; Muñoz, J.A.; Blázquez, M.L.; González, F.; Ballester, A. Leaching of chalcopyrite with ferric ion. Part I: General aspects. Hydrometallurgy 2008, 93, 81–87. [Google Scholar] [CrossRef]
  26. Santos, A.L.A.; Arena, F.A.; Benedetti, A.V.; Bevilaqua, D. Effect of redox potential on chalcopyrite dissolution imposed by addition of ferrous ions. Eclética Quím. J. 2017, 42, 40. [Google Scholar] [CrossRef]
  27. Yang, C.R.; Li, Y.X.; Tian, Z.Y.; Qin, W.Q.; Liu, X.D.; Wang, X. Enhanced chalcopyrite leaching by mechanical activation: New insights from microstructure. Miner. Eng. 2024, 212, 108719. [Google Scholar] [CrossRef]
  28. Li, Y.X.; Tian, Z.Y.; Wang, X.; Wen, J.; Mao, Q.M.; Yang, C.R. Enhanced chalcopyrite bioleaching with mechanical activation and redox potential regulation. Miner. Eng. 2025, 227, 109292. [Google Scholar] [CrossRef]
  29. Xie, X.; Gan, T.; Sun, D.; Wu, K. Application of Multi-walled Carbon Nanotubes/Nafion Composite Film in Electrochemical Determination of Pb2+. Fuller. Nanotub. Carbon Nanostruct. 2008, 16, 103–113. [Google Scholar] [CrossRef]
  30. Wang, X.; Liu, B.; Chen, M.; Qian, D.J. Electrochemistry of Single-Walled Carbon Nanotubes-Viologen Composites on the Glass Carbon Electrodes. J. Nanosci. Nanotechnol. 2009, 9, 1441–1444. [Google Scholar] [CrossRef] [PubMed]
  31. Nazari, G.; Dixon, D.G.; Dreisinger, D.B. The Mechanism of Chalcopyrite Leaching in the Presence of Silver-Enhanced Pyrite in the Galvanox™ Process. Hydrometallurgy 2012, 113–114, 122–130. [Google Scholar] [CrossRef]
  32. Liang, C.L.; Xia, J.L.; Yang, Y.; Nie, Z.Y.; Zhao, X.J.; Zheng, L.; Ma, C.Y.; Zhao, Y.D. Characterization of the thermo-reduction process of chalcopyrite at 65 °C by cyclic voltammetry and XANES spectroscopy. Hydrometallurgy 2011, 107, 13–21. [Google Scholar] [CrossRef]
  33. Mikhlin, Y.L.; Tomashevich, Y.V.; Asanov, I.P.; Okotrub, A.V.; Varnek, V.A.; Vyalikh, D.V. Spectroscopic and electrochemical characterization of the surface layers of chalcopyrite (CuFeS2) reacted in acidic solutions. Appl. Surf. Sci. 2004, 225, 395–409. [Google Scholar] [CrossRef]
  34. Elsherief, A.E. The influence of cathodic reduction, Fe2+ and Cu2+ ions on the electrochemical dissolution of chalcopyrite in acidic solution. Miner. Eng. 2002, 15, 215–223. [Google Scholar] [CrossRef]
  35. Zeng, W.M.; Qiu, G.Z.; Zhou, H.B.; Chen, M. Electrochemical behaviour of massive chalcopyrite electrodes bioleached by moderately thermophilic microorganisms at 48 °C. Hydrometallurgy 2011, 105, 259–263. [Google Scholar] [CrossRef]
  36. Sauber, M.; Dixon, D.G. Electrochemical study of leached chalcopyrite using solid paraffin-based carbon paste electrodes. Hydrometallurgy 2011, 110, 1–12. [Google Scholar] [CrossRef]
  37. Price, D.W.; Warren, G.W. The influence of silver ion on the electrochemical response of chalcopyrite and other mineral sulfide electrodes in sulfuric acid. Hydrometallurgy 1986, 15, 303–324. [Google Scholar] [CrossRef]
  38. López-Juárez, A.; Gutiérrez-Arenas, N.; Rivera-Santillán, R.E. Electrochemical behavior of massive chalcopyrite bioleached electrodes in presence of silver at 35 °C. Hydrometallurgy 2006, 83, 63–68. [Google Scholar] [CrossRef]
  39. Gómez, C.; Figueroa, M.; Muñoz, J.; Blázquez, M.L.; Ballester, A. Electrochemistry of chalcopyrite. Hydrometallurgy 1996, 43, 331–344. [Google Scholar] [CrossRef]
  40. Gu, G.H.; Hu, K.T.; Zhang, X.; Xiong, X.X.; Yang, H.S. The stepwise dissolution of chalcopyrite bioleached by Leptospirillum ferriphilum. Electrochim. Acta 2013, 103, 50–57. [Google Scholar] [CrossRef]
  41. Lee, M.S.; Nicol, M.J.; Basson, P. Cathodic processes in the leaching and electrochemistry of covellite in mixed sulfate–chloride media. J. Appl. Electrochem. 2008, 38, 363–369. [Google Scholar] [CrossRef]
  42. Nava, D.; González, I.; Leinen, D.; Ramos-Barrado, J.R. Surface characterization by X-ray photoelectron spectroscopy and cyclic voltammetry of products formed during the potentiostatic reduction of chalcopyrite. Electrochim. Acta 2008, 53, 4889–4899. [Google Scholar] [CrossRef]
  43. Nava, D.; González, I. Electrochemical characterization of chemical species formed during the electrochemical treatment of chalcopyrite in sulfuric acid. Electrochim. Acta 2006, 51, 5295–5303. [Google Scholar] [CrossRef]
  44. Li, Y.; Kawashima, N.; Li, J.; Chandra, A.P.; Gerson, A.R. A review of the structure, and fundamental mechanisms and kinetics of the leaching of chalcopyrite. Adv. Colloid Interface Sci. 2013, 197–198, 1–32. [Google Scholar] [CrossRef] [PubMed]
  45. Cheng, Y.F.; Luo, J.L. Electronic Structure and Pitting Susceptibility of Passive Film on Carbon Steel. Electrochim. Acta 1999, 44, 2947–2957. [Google Scholar] [CrossRef]
  46. Baláž, P.; Achimovičová, M.; Baláž, M.; Billik, P.; Cherkezova-Zheleva, Z.; Criado, J.M.; Delogu, F.; Dutková, E.; Gaffet, E.; Gotor, F.J.; et al. Hallmarks of mechanochemistry: From nanoparticles to technology. Chem. Soc. Rev. 2013, 42, 7571. [Google Scholar] [CrossRef] [PubMed]
  47. Flitt, H.J.; Schweinsberg, D.P. Evaluation of corrosion rate from polarisation curves not exhibiting a Tafel region. Corros. Sci. 2005, 47, 3034–3052. [Google Scholar] [CrossRef]
  48. Rybalka, K.V.; Beketaeva, L.A.; Bukhan’ko, N.G.; Davydov, A.D. Electrochemical behavior and the rate of general corrosion of NiAl intermetallic compound in the unbuffered sodium chloride solutions. Corros. Sci. 2011, 53, 630–636. [Google Scholar] [CrossRef]
  49. Ghahremaninezhad, A.; Dixon, D.G.; Asselin, E. Electrochemical and XPS Analysis of Chalcopyrite (CuFeS2) Dissolution in Sulfuric Acid Solution. Electrochim. Acta 2013, 87, 97–112. [Google Scholar] [CrossRef]
Figure 1. Effect of mechanical activation time on cyclic voltammetry of chalcopyrite. (a) H2SO4, (b) Fe2+ = 0.1 mol/L, (c) Fe2+: Fe3+ = 0.05 mol/L: 0.05 mol/L, (d) Fe3+ = 0.1 mol/L.
Metals 15 01075 g001
Figure 2. Cyclic voltammetry curve of chalcopyrite in Fe2+ = 0.1 mol/L system at different scan rates. (a) 0 h; (b) 0.5 h; (c) 1.0 h; (d) 1.5 h; (e) 2.0 h; (f) 2.5 h.
Metals 15 01075 g002
Figure 3. Cyclic voltammetry curve of chalcopyrite in Fe2+: Fe3+= 0.05 mol/L: 0.05 mol/L system at different scan rates. (a) 0 h; (b) 0.5 h; (c) 1.0 h; (d) 1.5 h; (e) 2.0 h; (f) 2.5 h.
Metals 15 01075 g003aMetals 15 01075 g003b
Figure 4. Cyclic voltammetry curve of chalcopyrite in Fe3+ = 0.1 mol/L system at different scan rates. (a) 0 h; (b) 0.5 h; (c) 1.0 h; (d) 1.5 h; (e) 2.0 h; (f) 2.5 h.
Metals 15 01075 g004
Figure 5. The relationship between the reduction peak C1 peak current and the square root of the scanning rate. (a) Fe2+: Fe3+ = 0.05 mol/L:0.05 mol/L, (b) Fe3+ = 0.1 mol/L.
Metals 15 01075 g005
Figure 6. The relationship between the oxidation peak C4 peak current and the square root of the scanning rate. (a) Fe2+ = 0.1 mol/; (b) Fe2+: Fe3+ = 0.05 mol/L:0.05 mol/L; (c) Fe3+ = 0.1 mol/L.
Metals 15 01075 g006
Figure 7. Effect of mechanical activation time on Mott–Schottky curve of chalcopyrite.
Metals 15 01075 g007
Figure 8. Mott–Schottky curves of chalcopyrite in different solutions: (a) Fe2+ = 0.1 mol/L; (b) Fe2+: Fe3+ = 0.05 mol/L: 0.05 mol/L; (c) Fe3+ = 0.1 mol/L.
Metals 15 01075 g008
Figure 9. Effect of mechanical activation time on the Tafel curve of chalcopyrite and calculation results of corrosion kinetic parameters: (a,c) Fe2+ = 0.1 mol/L, (b,d) Fe3+ = 0.1 mol/L.
Metals 15 01075 g009
Table 1. Randles–Sevcik calculation data for the reduction peak C1 peak equation.
Time/hFe2+:Fe3+ = 0.05 mol/L:0.05 mol/LFe3+ = 0.1 mol/L
KR2KR2
00.0770.9940.0960.979
0.50.0780.9700.1000.998
1.00.0800.9940.1090.996
1.50.0820.9590.1090.994
2.00.0820.9830.1140.999
2.50.0900.9930.1120.999
Table 2. Randles–Sevcik calculation data for the reduction peak C4 peak equation.
Time/hFe2+ = 0.1 mol/LFe2+:Fe3+ =0.05 mol/L:0.05 mol/LFe3+ = 0.1 mol/L
KR2KR2KR2
00.0390.9730.0590.9930.0770.959
0.50.0810.9610.1240.9920.1480.989
1.00.1230.9520.1330.9920.2010.974
1.50.1590.9670.2020.9590.2660.949
2.00.1330.9140.1850.8730.2060.923
2.50.1490.9500.1950.9320.2420.892
Table 3. Mott–Schottky curve calculation data of chalcopyrite.
Time/hFlat Band Potential (EFB)/mVSemiconductor Physics Type
0289.2n
0.5259.6n
1.0244.1n
1.5247.0n
2.0237.1n
2.5242.0n
Table 4. Calculation results of Mott–Schottky curve of chalcopyrite in different solutions.
Leaching SystemTime/hFlat Band Potential (EFB)/mVSemiconductor Type
Fe2+ = 0.1 mol/L0149.2n
1.0118.4n
Fe2+: Fe3+ = 0.05 mol/L:0.05 mol/L0192.5n
1.0123.8n
Fe3+ = 0.1 mol/L0261.7n
1.0131.2n
Disclaimer/Publisher’s Note: The statements, opinions and data contained in all publications are solely those of the individual author(s) and contributor(s) and not of MDPI and/or the editor(s). MDPI and/or the editor(s) disclaim responsibility for any injury to people or property resulting from any ideas, methods, instructions or products referred to in the content.