Article

Alternatives to Reduce Hot Cracking Susceptibility of IN718 Casting Alloy Laser Beam Welds with a Mushroom Shape

1
LORTEK, Basque Research and Technology Alliance (BRTA), Arranomendia Kalea 4A, 20240 Ordizia, Spain
2
AZTERLAN Fundation, Basque Research and Technology Alliance (BRTA), Aliendalde Auzunea 6, 48200 Durango, Spain
*
Author to whom correspondence should be addressed.
Metals 2024, 14(9), 1067; https://doi.org/10.3390/met14091067
Submission received: 30 July 2024 / Revised: 2 September 2024 / Accepted: 12 September 2024 / Published: 18 September 2024

Abstract

Reducing hot cracking is essential for ensuring seamless production of nickel superalloys, which are extensively used in welded structures for aircraft engines. The prevalence of hot cracking in precipitation-strengthened alloy 718 is primarily governed by two factors: firstly, the chemical composition and the coarse microstructure formed during solidification, and secondly, the activation of hot cracking mechanisms, which is particularly critical in mushroom-shaped welding morphologies. In this study, different nickel-based superalloys welded using laser beam welding (LBW), more specifically bead on plate welding (BoP), specimens are compared. The cracking susceptibility of both wrought and two investment casting 718 alloys with tailored chemical compositions is examined through the application of both continuous and pulsed LBW. Additionally, various pre-weld treatments, including with and without Pre-HIP (hot isostatic pressing), are analyzed. The influences of chemical composition, LBW parameters and pre- and post-welding treatments on both internal and external cracks determined by conventional and advanced non-destructive tests are studied. A clear reduction of hot cracking susceptibility and overall welding quality improvement was observed in a tailored 718 alloy with relatively high Ni (55.6% wt) and Co (1.11% wt) contents.

1. Introduction

The manufacturing of turbine components in the aerospace sector faces significant challenges due to its reliance on large-scale foundries, which limits production flexibility and material utilization. Traditionally, critical components such as the turbine rear frame are produced in a few specialized foundries worldwide, resulting in high costs and limitations in optimizing material properties. Thus, alternative production based on welding smaller cast and wrought components could bring many technical and cost related benefits. However, welding precipitation-strengthened nickel superalloys is not straightforward and entails significant challenge.
The main strengthening elements in alloy 718 are chromium (Cr), molybdenum (Mo), cobalt (Co), and iron (Fe), which contribute to solid solution strengthening. Additionally, aluminum (Al), titanium (Ti), nickel (Ni), and niobium (Nb) are essential for precipitation strengthening of the γ′ (Ni3 (Al, Ti)) and γ″ (Ni3Nb) phases [1]. During solidification in casting and welding processes, niobium tends to segregate, promoting the formation of niobium carbide (NbC) and Laves phase [2,3]. This segregation broadens the solidification range and can promote hot cracking, both in the fusion zone and in the heat-affected zone (HAZ) due to the liquation of these phases [4]. Thus, two main problems must be solved to avoid hot cracking during welding. Firstly, the formation of NbC and Laves phase during solidification must be minimized, and secondly, the incipient melting of Laves phase which could be in the base material must be prevented. Finally, thermal treatment and microstructure before welding are critical.
Replacing iron with nickel can reduce the presence of Laves phase. A study by Frank et. al. [5] observed that, in alloys with a low nickel content (51.5%), secondary Laves phases appeared after exposure to 925 °C, whereas alloys with a nickel content of 53.1% did not exhibit Laves phases.
Among the minor elements, replacing iron with cobalt in the RENE 220 [6] alloy has shown its ability to reduce the amount of Laves phases [7], thereby improving weldability. Additionally, cobalt enhances the stress rupture resistance at high temperatures. During solidification, boron (B) [8] and zirconium (Zr) segregate strongly, forming low-melting eutectic constituents that can promote hot cracking in the fusion zone. It has also been observed that other minor elements [9], such as lead (Pb), sulfur (S), phosphorus (P), silicon (Si), and carbon (C), can have a detrimental effect on cracking in the heat-affected zones [10,11].
Sulfur significantly reduces the stress rupture life when its content exceeds 50 ppm, due to its segregation to grain boundaries. To minimize this effect, it is recommended to use sulfide formers such as magnesium (Mg), cerium (Ce), zirconium (Zr), titanium (Ti), and manganese (Mn). In general, the sulfur content should be kept as low as possible; always lower than 30 ppm is the commitment of most capable ingot suppliers [12].
Alloy 718 is typically welded in a solution-annealed condition, which shows much lower hot cracking susceptibility compared to the aged condition due to the previous solubilization of Laves phase in the base material [13]. Nonetheless, cracks can still appear in the heat-affected zone (HAZ) due to liquation cracking [14] and in the fusion zone (FZ) due to solidification cracking [15,16]. Coarse microstructures in the HAZ and presence of δ phase promote this cracking [17]. As stated above, solidification cracking in the FZ can occur due to the formation of γ/NbC and γ/Laves constituents in the interdendritic zones, resulting from the segregation of elements like B, C, and Zr or impurities. Residual stresses, solidification shrinkage, and weld pool size also influence susceptibility to this cracking mechanism.
Previous research has extensively investigated the impact of chemical composition and microstructure [18], influenced by various initial heat treatments, on the hot cracking susceptibility of alloy 718 [19]. Findings have been contradictory regarding the influence of grain size on the hot cracking susceptibility of alloy 718 castings. Some studies [20] show that coarser base metal grain sizes enhance FZ solidification cracking, while others indicate reduced cracking susceptibility in samples with coarser grains.
Alloy 718 investment castings are typically melted and poured inside vacuum furnaces and subsequently heat-treated by hot isostatic pressing (HIP) [21] to ensure optimal performance. Sophisticated thermal treatments have been developed to reduce the amount of Laves phases and consequently the cracking susceptibility of alloy 718 castings [22]. These treatments aim to solubilize deleterious Laves phases and reduce compositional gradients in the as-cast microstructure. Welding technology and parameters also significantly impact hot cracking susceptibility of alloy 718 [23,24]. Recent studies have highlighted the benefits of using pulsed current to refine the solidification microstructure and reduce Laves phase and Nb segregations in TIG welds. Laser beam welding (LBW) [25,26] has been extensively investigated for manufacturing alloy 718 parts. Compared to arc welding technologies [27], LBW offers higher depth/width weld bead ratios, lower residual stresses and distortion, lower heat input, and faster solidification, reducing hot cracking susceptibility. However, LBW of alloy 718 can lead to porosity within the FZ and cracking if proper shielding conditions and welding parameters are not employed [28].
Recent studies concluded that hot cracking is enhanced in LBW samples due to extended centerline FZ cracking, showing a fishbone-like pattern in the Varestraint test [29,30]. The influence of pulsation mode and grain size is minor, with casting samples with grain sizes 30 times coarser showing slightly better performance than wrought material. Pulsed current can refine solidification microstructure and reduce Laves phase and Nb segregations in TIG welds [31]. Combining high-frequency micro-vibration with LBW can reduce the length of liquation cracks in the HAZ under specific vibration frequencies.
In this work, the weldability and hot cracking susceptibility in laser beam welds of three alloy 718 investment castings were investigated, two of them with tailored chemical compositions to reduce formation of detrimental phases and precipitates during solidification either during casting or welding. The influence of chemical composition, welding parameters, and pre-weld heat treatment was studied through laser beam welding–bead on plate tests [25]. Cracking behavior was compared, and results were completed with detailed microstructural analysis and non-destructive testing after welding tests [32,33].
One of the key innovations of this research, compared to previous studies [34], is the reduction in cracking and the overall improvement in welding quality observed in a tailored 718 alloy with relatively high Ni (55.6% wt) and Co (1.11% wt) contents, even though these alloys exhibit a mushroom-shaped weld bead morphology.

2. Materials and Methods

2.1. Materials

Three different 718 alloys (Aref, A1 and A2) were produced by investment casting with plates of three different steps with 10, 5 and 2.5 mm thicknesses. Regarding the process, the elements with a lower risk of evaporation (Ni, Cr, Fe, etc.) were mixed in the melting pot along with the charge, and once they had melted and stabilized at a temperature of 1500 °C, the rest of the alloying elements (Al, Ti, Mo, etc.) were added. After 2–3 min were allowed for homogenization, the casting was performed in molds at 800 °C. The melting was performed in a VIM furnace.
The chemical composition is shown in Table 1. The measurements were made by LECO according to internal procedure P-343 for C and S, which complies with ASTM E1019-2018. For the other elements, the measurements were carried out according to internal procedure P-142 by spark spectrometry.
The chemical composition of the Aref alloy was according to UNE EN 10302:2010 standard, with the exception of Si content that has a value of 0.45% and should be less than 0.35% (Table 1). The other alternative chemical compositions were defined after dedicated alloy design process using Thermo-Calc to analyze the formation of Laves phase and determine melting temperature range between solidus and liquidus temperatures. Thermo-Calc v2020b, based on CALPHAD methodology, and the TCNI 8.2 and MOBNI 4.1 databases were used for these thermodynamic calculations.
Figure 1 presents the Thermo-Calc analysis for the three alloys, the reference alloy Aref (a) and the new ones, A1 (b) and A2 (c). The graph titled “Equilibrium diagram of phases formation” is a phase equilibrium diagram in which back diffusion (homogenization) of chemical elements has occurred during solidification. This graph represents the phases γ (gamma), γ′ (Ni3 (Al, Ti)), δ (delta), and σ (sigma) along with the phases M23C6 and MC. The graph on the right illustrates the diagram considering the Scheil equation for “non-equilibrium condition in phases formation (no back diffusion)”. In this instance, the diagram shows non-equilibrium conditions, applying the Scheil equation to model the elemental segregation and phase formation processes, without accounting for the phenomenon of back diffusion (homogenization) during and after solidification.
It is important to consider both graphs regarding solidification ranges, as the diffusion kinetics of each alloy and the actual cooling conditions of each process may result in closer alignment with one diagram or the other. Consequently, if the solidification ranges are narrower in both cases, the weldability situation will generally be enhanced.
In the graphic shown on the left (first column), it can be observed that the new alloys, A1 and A2, had a higher amount of γ′ phase mass fraction. Therefore, examining the graph on the right, it can be concluded that alloys A1 and A2 were initially more desirable compared to the reference alloy, due to their more restricted solidification ranges and reduced formation of undesirable phases such as Laves and sigma (see Table 2).
Based on results and conclusions of the Thermo-Calc study, the nickel content was increased in A1 and A2 alloys, to slightly above the limit of the industrial standard. This minor increment led to a reduction of iron content, and it was considered beneficial due to the reduction of the solidification temperature range and the reduction of the percentage of Laves phase predicted by Thermo-Calc.
Additionally, the cobalt content was increased to 1,11% in the A2 alloy, also to just above the limit set by the current industrial standard. The increase of cobalt content was proposed to increase stress to rupture properties. Cobalt will remain in a solid solution state within the matrix, and no detrimental effects on the solidification temperature range, the amount of Laves phase, or other detrimental phases (such us NbC, δ or σ) was observed in the thermodynamic analysis.
Last but not least, in A1 and A2, silicon and molybdenum were kept lower than in the reference alloy Aref, whereas titanium and aluminum were increased, all of them within the limits described in the industrial standard. The rest of the chemical elements, such as sulfur, chromium, copper, phosphorus, boron and niobium, as well as tantalum and manganese, were comparable in the three alloys. Final iron content differed in the three alloys, since this was considered as the balance element to complete the chemical composition.
For the weldability analysis tests conducted with the manufactured reference, A1 and A2 alloys, a standard HIP (hot isostatic pressing), post-HIP and solubilization treatments were applied. Additionally, in order to dissolve and reduce the amount of Laves phases on the base material before welding, which are considered to have a direct effect on weldability, some samples from the alloys A1, A2, and Aref were submitted to a specific thermal treatment carried out before the HIP (pre-HIP). The whole treatment was as follows:
  • Pre-HIP (homogenization): 1052 °C for 8 h, air cooling in open atmosphere (only to some samples of alloys under study) for comparison with standard ones.
  • HIP (hot isostatic pressing): 1121 °C for 4 h, furnace cooling until room temperature in inert atmosphere.
  • Post-HIP: 1052 °C for 1 h, furnace cooling.
  • Solubilization: 954 °C for 1 h, air cooling.

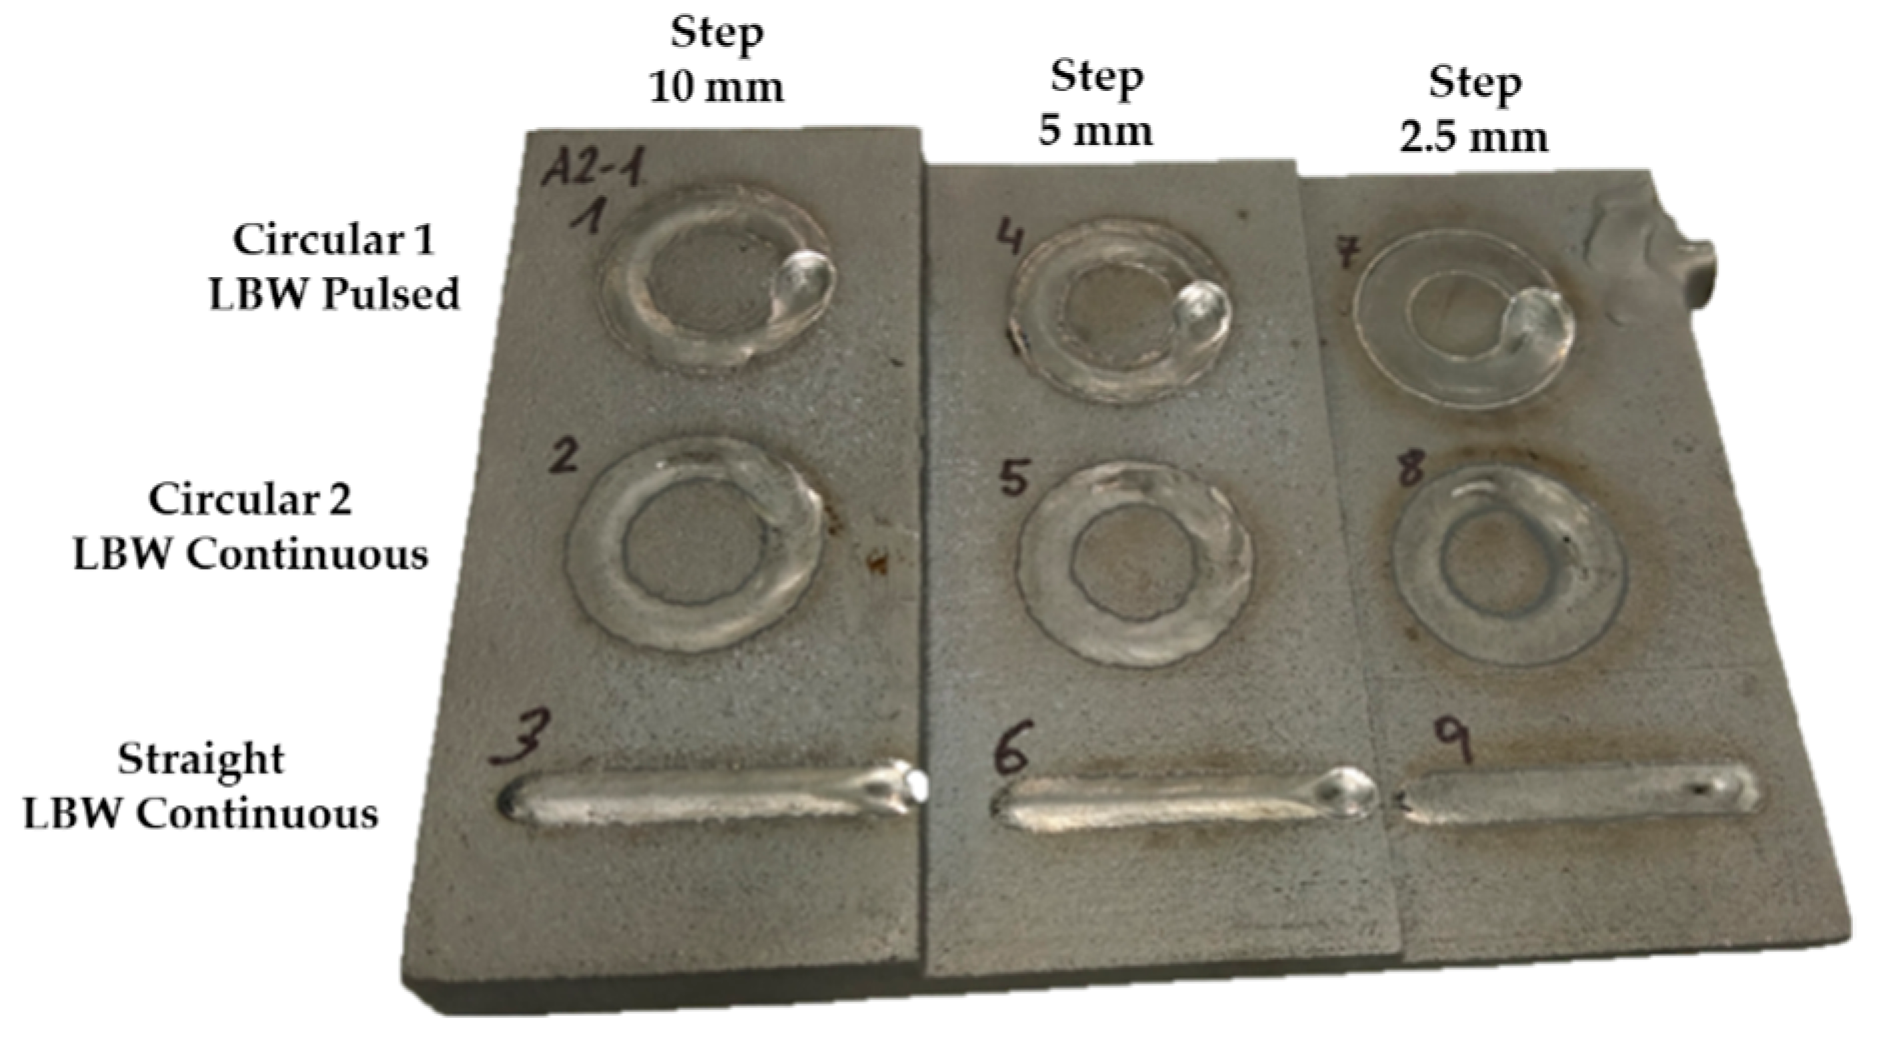
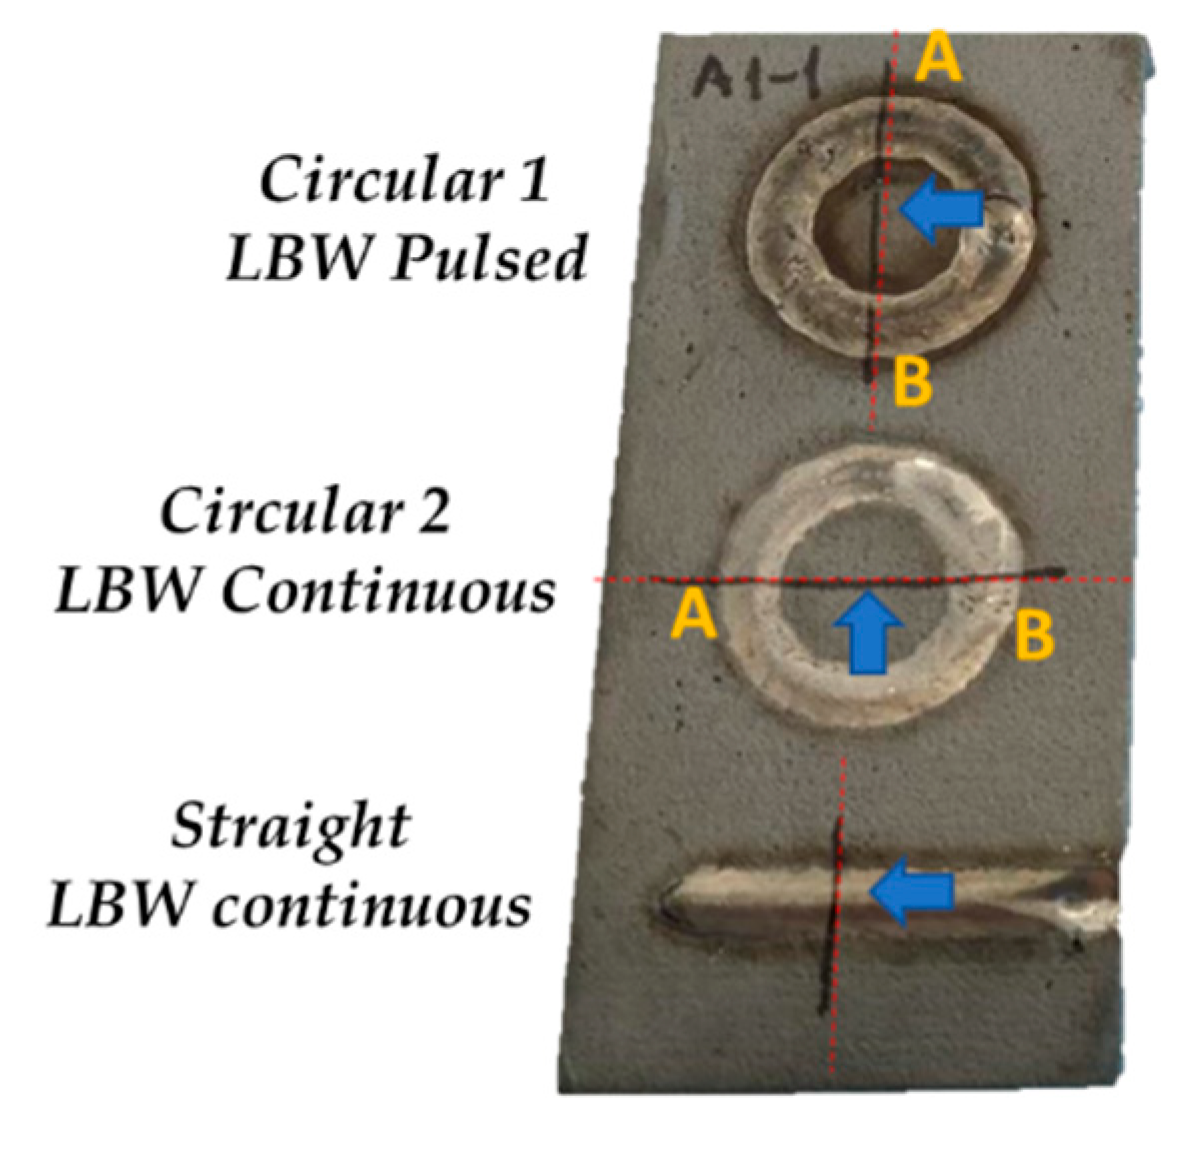
2.2. Laser Bead on Plate Welding Process

Bead on plate tests with straight and circular paths were employed to investigate weldability of the three 718 investment casting alloys. In these tests, the remelting of the investment-cast material is performed in a process similar to autogenous welding (without filler metal). The general parameters used in each case are listed in Table 3.
In Figure 2, an example of the stepped plate after carrying out the bead on plate welding test is shown. The different beads are identified according to the trajectories used (circular or lineal path) at each step. At each step with a given thickness (10, 5 and 2.5 mm), two circular trajectories (circular 1, continuous LBW and circular 2, pulsed LBW) and one straight trajectory (continuous LBW) were welded.
The impact of continuous and pulsed LBW parameters, as well as circular and straight trajectories, on welding morphology is explained herein. Selected LBW parameters were effective in producing sound welds and meeting the stringent quality criteria typically required for aeronautical applications. Laser power was initially adjusted for both continuous and pulsed LBW, employing rectangular modulation with short pulses lasting 6 ms, to achieve full penetration and minimal overhang. The optimal LBW parameters are detailed in Table 4. In this study, both energy and energy density were found to be comparable for the two conditions, pulsed and continuous.

2.3. Non-Destructive Inspection Techniques and Microstructural Characterization

In order to identify any cracking resulting from the welding test, each circular or straight trajectory was characterized using non-destructive techniques including inductive thermography, fluorescent penetrant inspection testing—FPI—and X-rays. The last is a volumetric non-destructive inspection technique, while the first two can only detect defects on the surface of the samples.
Additionally, metallographic analysis was performed in cross-sections that were cut randomly form the weld beads in order to analyze internal cracks, welding morphology and microstructure.

2.3.1. Fluorescent Penetrant Inspection Testing (FPI)

This completely manual inspection technology allows for detection of superficial defects, like cracks. The inspection process begins with the application of fluorescent liquids on the component using a fine brush, carefully covering the inspection area to avoid staining the entire sample. After allowing 10 min for the liquids to penetrate into the crack, the sample is cleaned using a cloth and cleaning spray, ensuring no fibers are left behind. Next, the developer is applied uniformly across the analysis area. While it typically takes some time for the liquid to seep out of the cracks and reveal its presence, due to the proximity and abundance of cracks, this waiting period is bypassed, and the sample is promptly examined visually.
In this work, since the samples considered were small, they were analyzed under a microscope. Photographs were captured using various light settings, including visible and ultraviolet light.

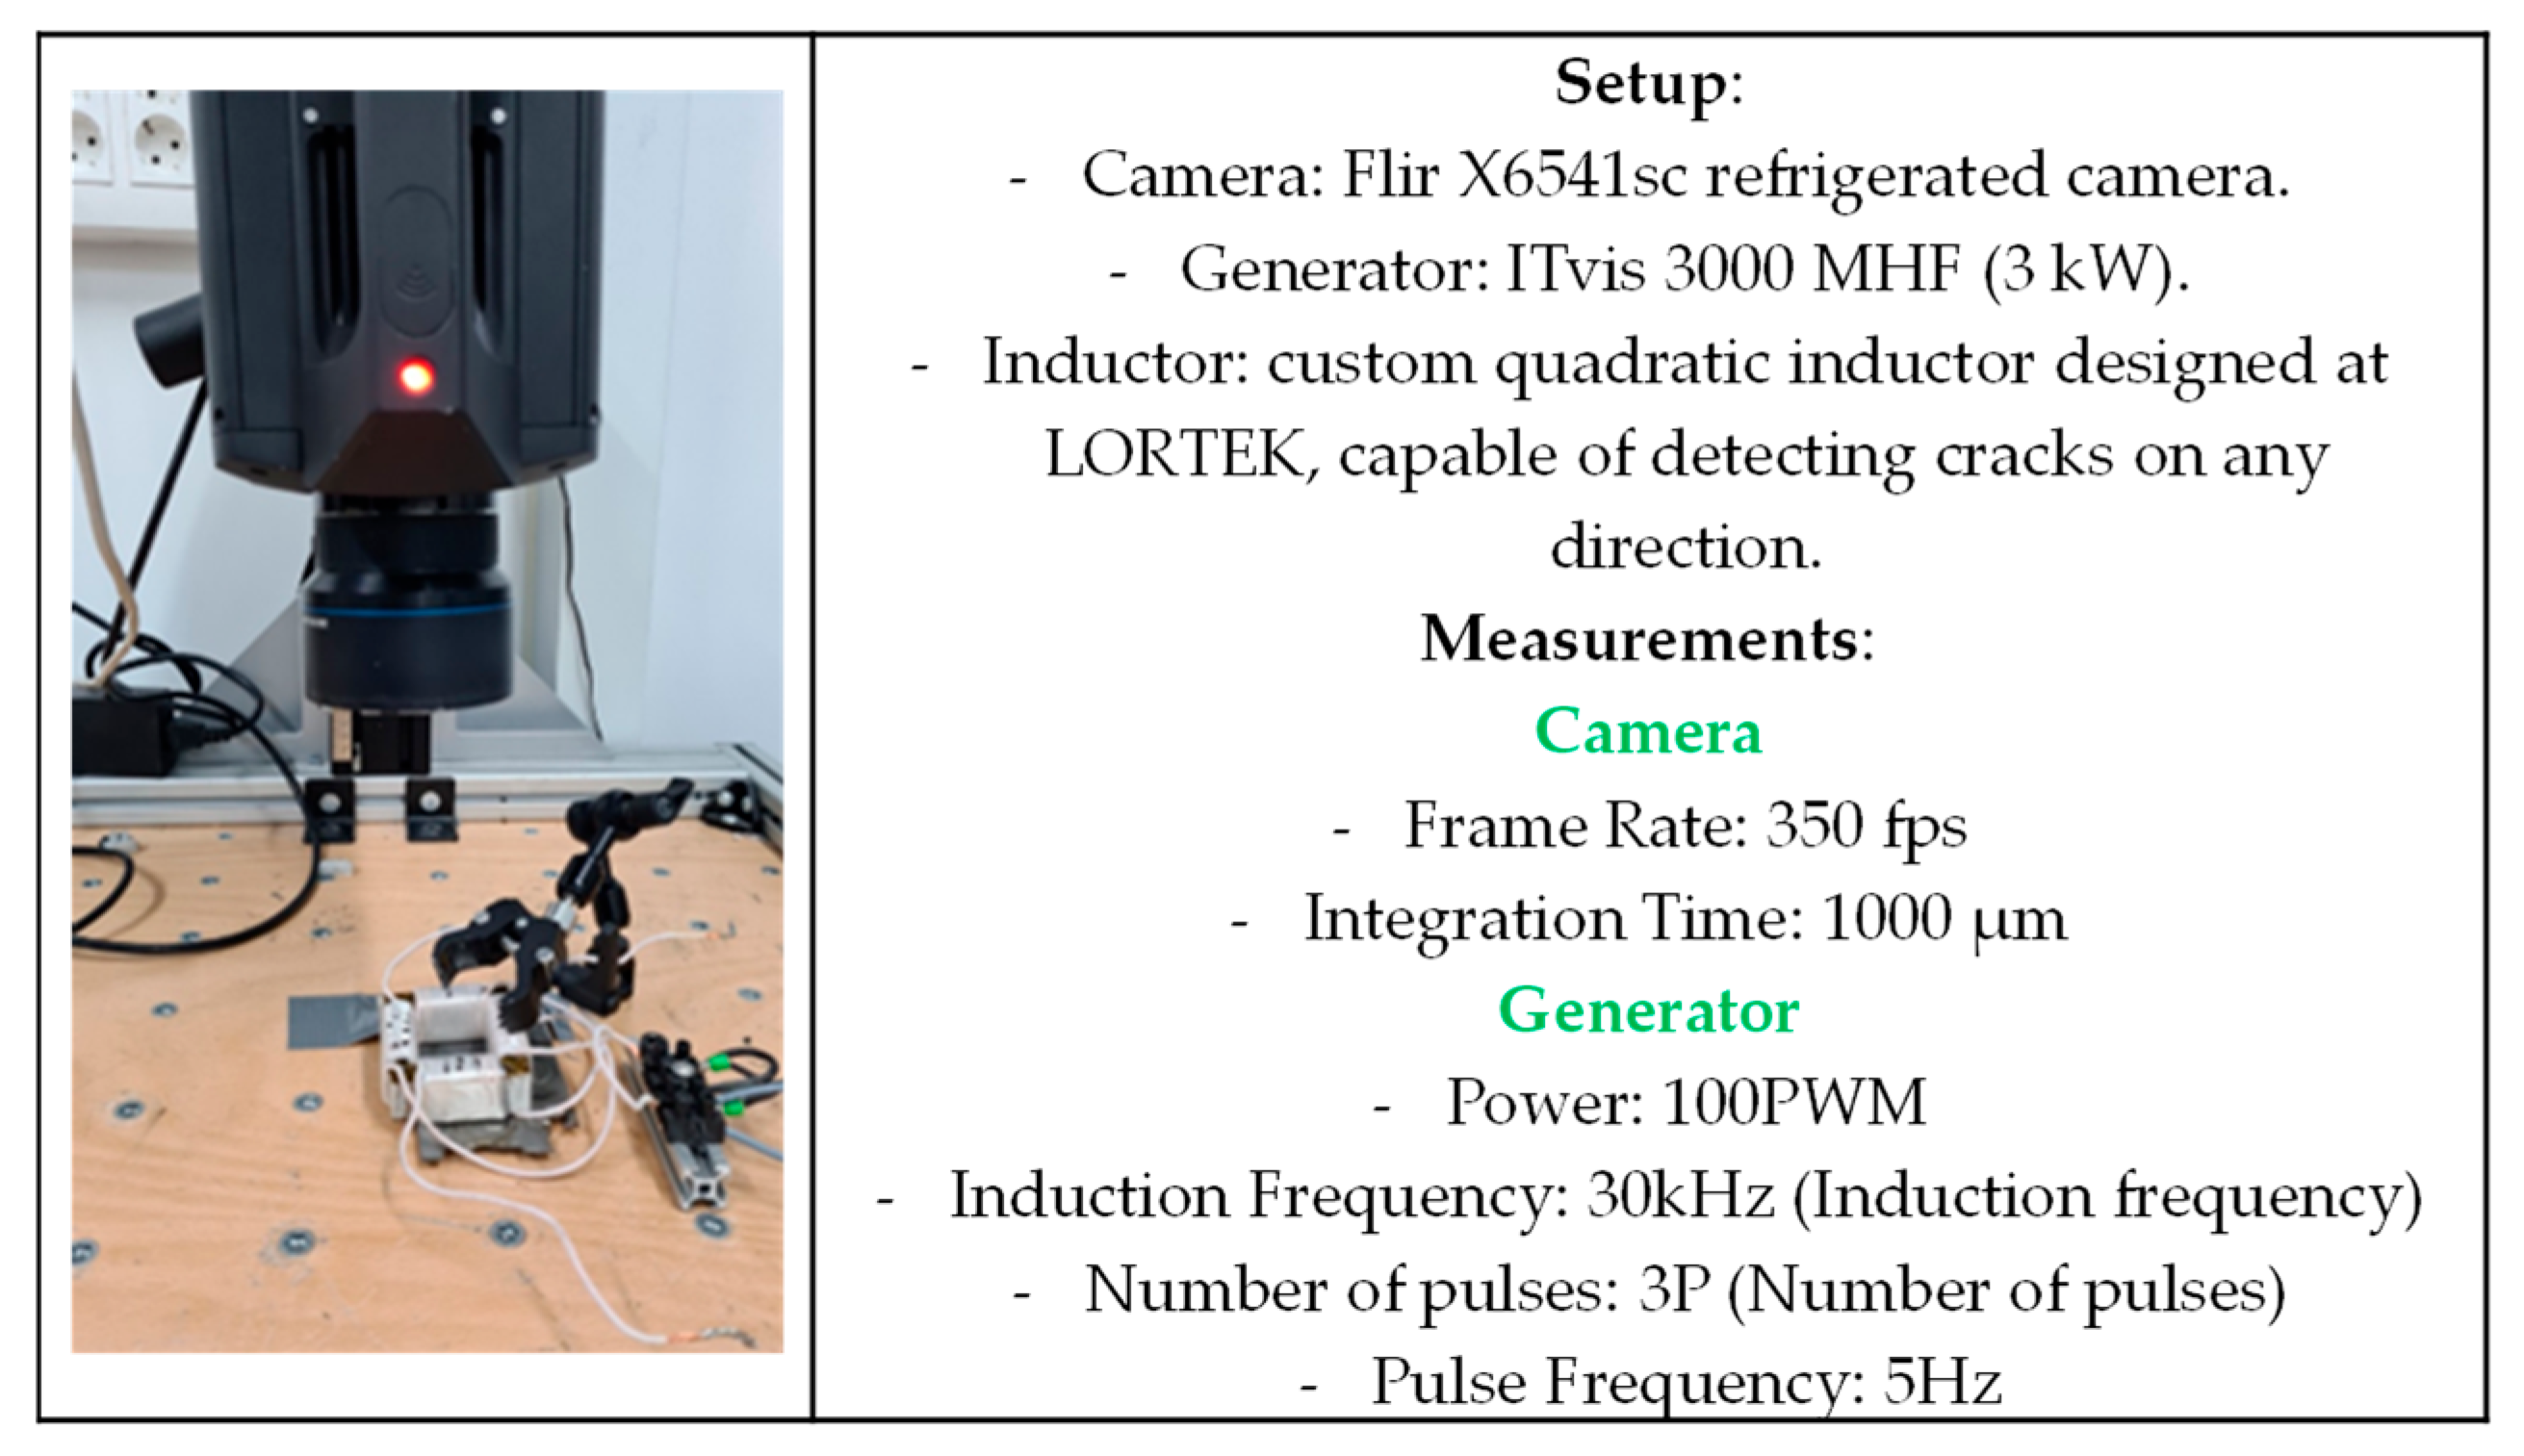
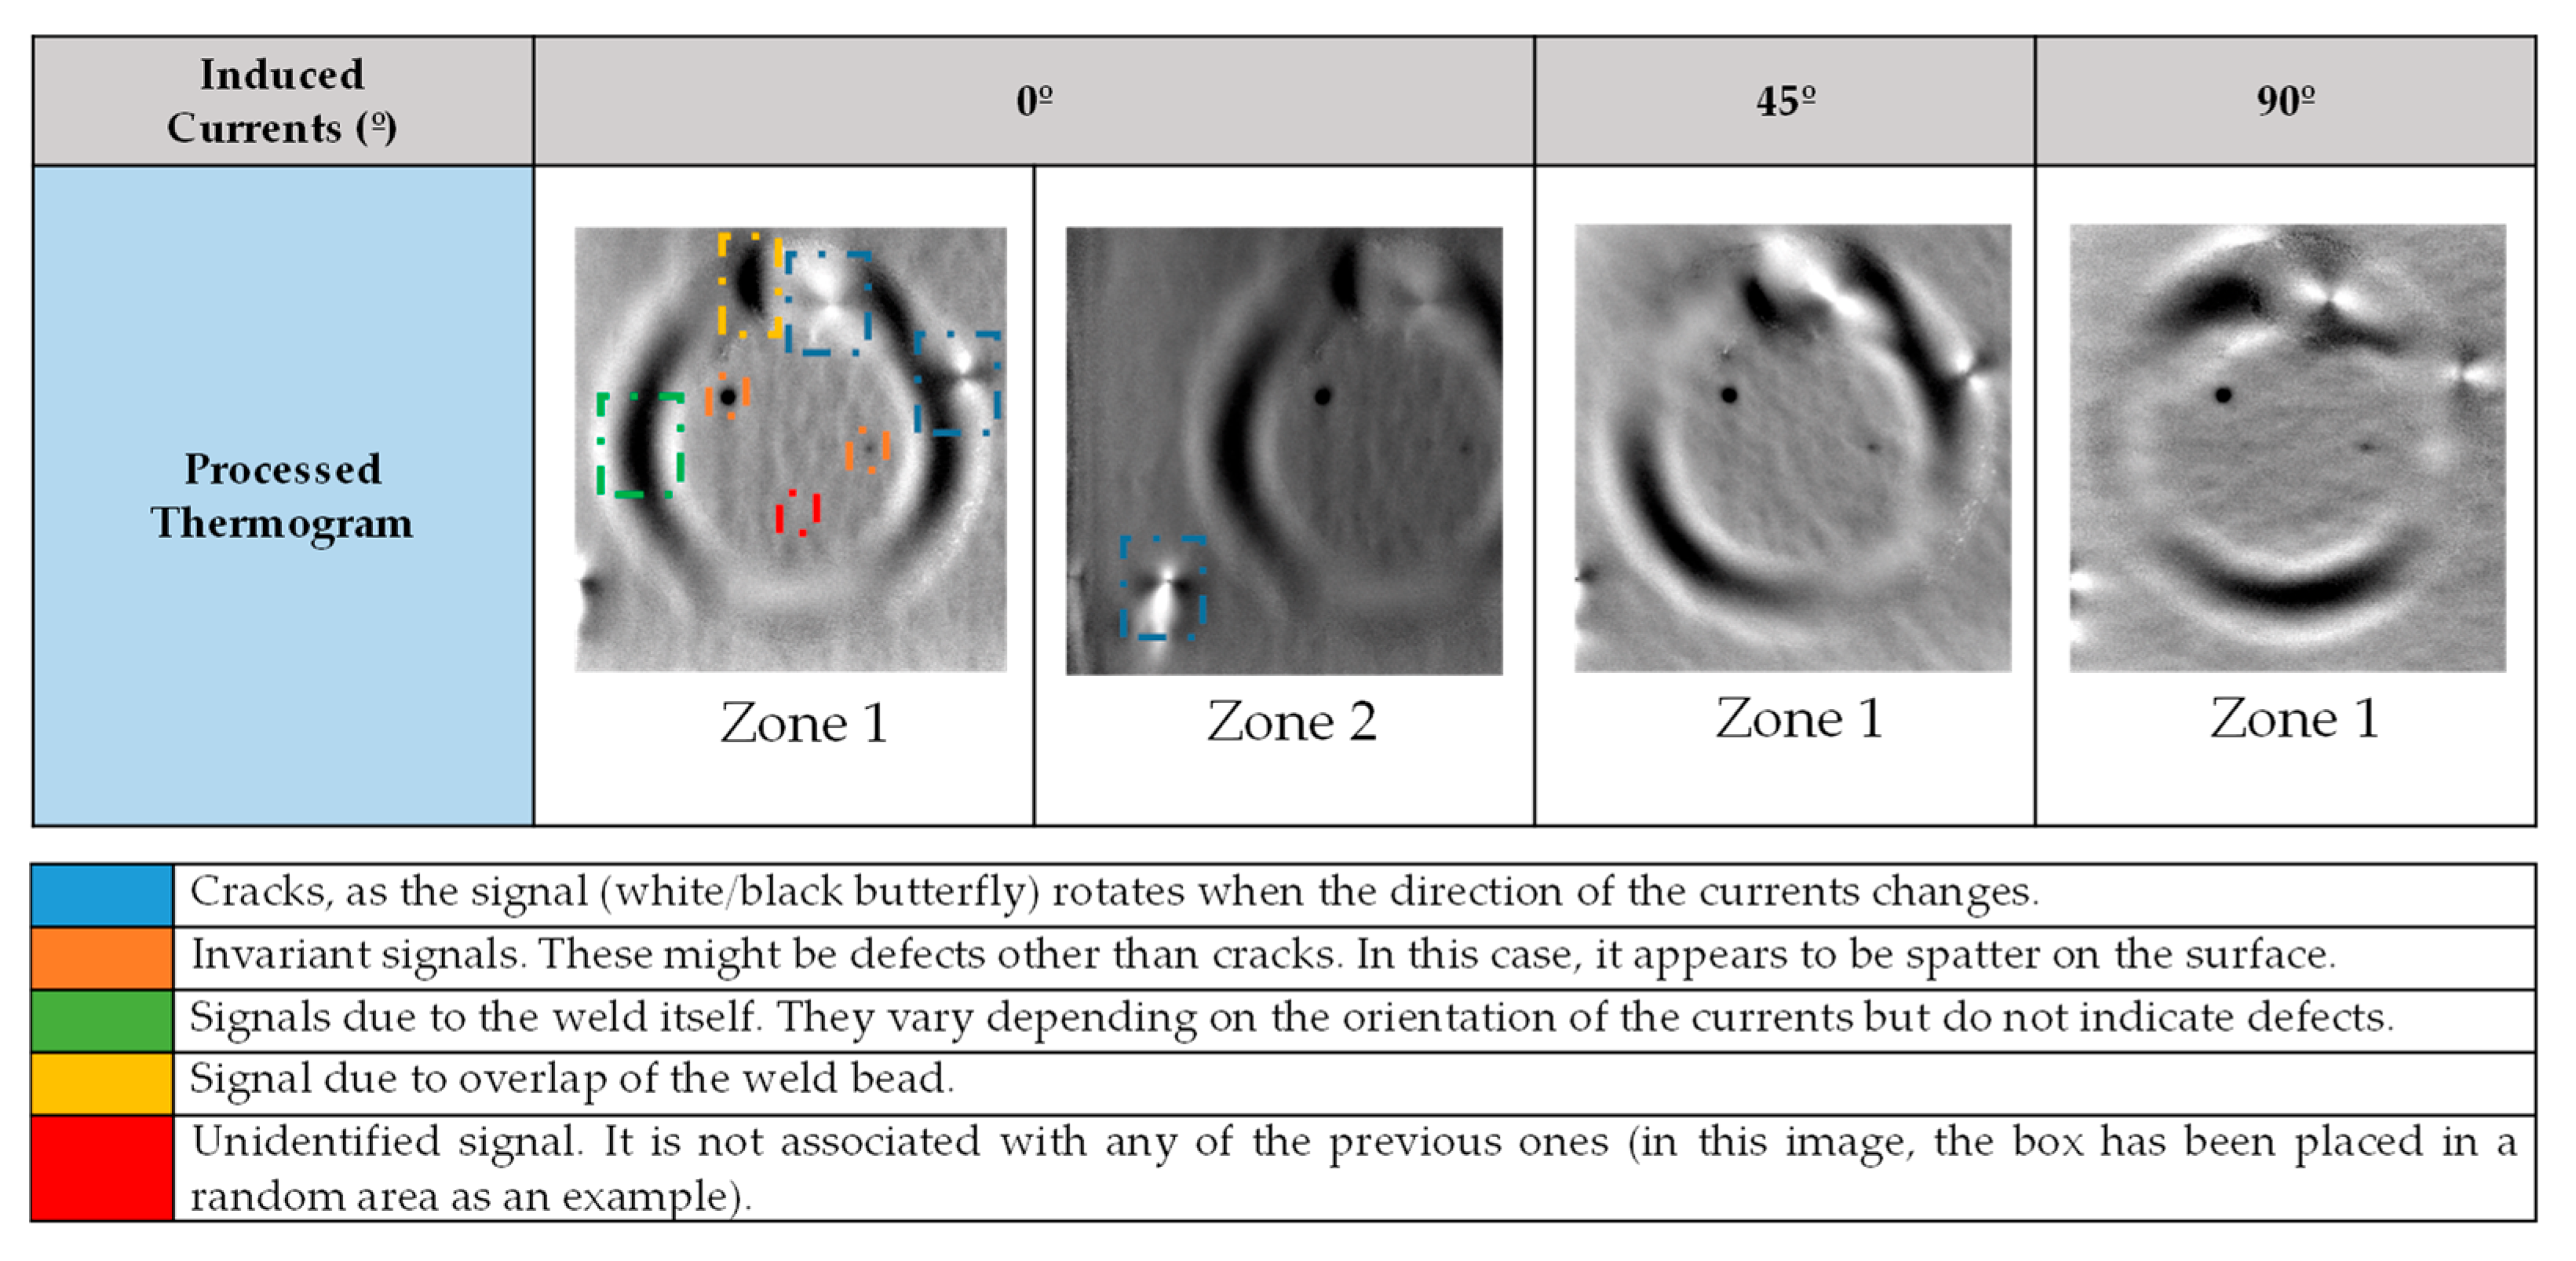
2.3.2. Inductive Thermography

The inductive thermography inspection process described in [35,36] was employed. Figure 3 presents the setup and experimental parameters used in the inductive thermography tests in this work. With the selected inductor, each circular weld was inspected in a single test, ensuring the detection of cracks with any orientation, while linear welds required two measurements. The recorded data were then processed using the fast Fourier transform (FFT), resulting in an image that was interpreted by an expert technician following the criteria included in Figure 4.

2.3.3. X-ray Inspection

To conduct this non-destructive volumetric inspection, Eresco X-ray emission equipment with maximum voltage of 200 kV and amperage of 4.5 mA was utilized. AGFA D5 films were employed, along with automatic processing. The test specimens were radiographed with the X-ray source positioned perpendicular to them, at a distance of 730 mm from the film. For the scanning, 120 kV and 4 mA were employed.

2.4. Metallographic Characterization

Cross-sections of stepped plates in the as-cast, heat-treated and after bead on plate tests were characterized by stereoscopic microscope LEICA DVM6, optical microscopy (OM) in LEICA MICROSYSTEMS GmbH (Wetzlar, Germany), and scanning electron microscopy (FESEM) with a ZEISS Ultra Plus microscope at a magnification of 1000× (Oberkochen, Germany). An energy dispersive X-ray spectroscopy (EDX) analysis was conducted to determine the local chemical composition of precipitates and phases.
For the microstructural analysis of 10, 5, and 2.5 mm steps of casting plates, transversal cuts were made at approximately 5 mm from the edge, using EDM. The area percentages of Laves phases and carbides were calculated as the average of 6 images taken at 1000× magnification using SEM/EDX with image analysis performed using Leica Application Suite V4.2.
Regarding the weld beads, cross-sectional cuts were made to examine any kind of defects, such as cracks or pores, and the morphology in the weld bead. The observed cross-sections were as indicated in Figure 5. In the case of the circular 2 samples, cuts A and B correspond to 180° and 0° of the beginning and end of the weld bead. In contrast, for the circular 1 sample, cuts A and B are located at 90° and −90° of the beginning and end of the weld bead.
This analysis aimed to validate the results obtained through non-destructive testing and particularly X-ray inspection. Following this, metallographic analysis was conducted on the nine different welds by etching them with Kalling’s 2 reagent (2 g CuCl2, 49 mL HCl, 40–80 mL ethanol).

3. Results

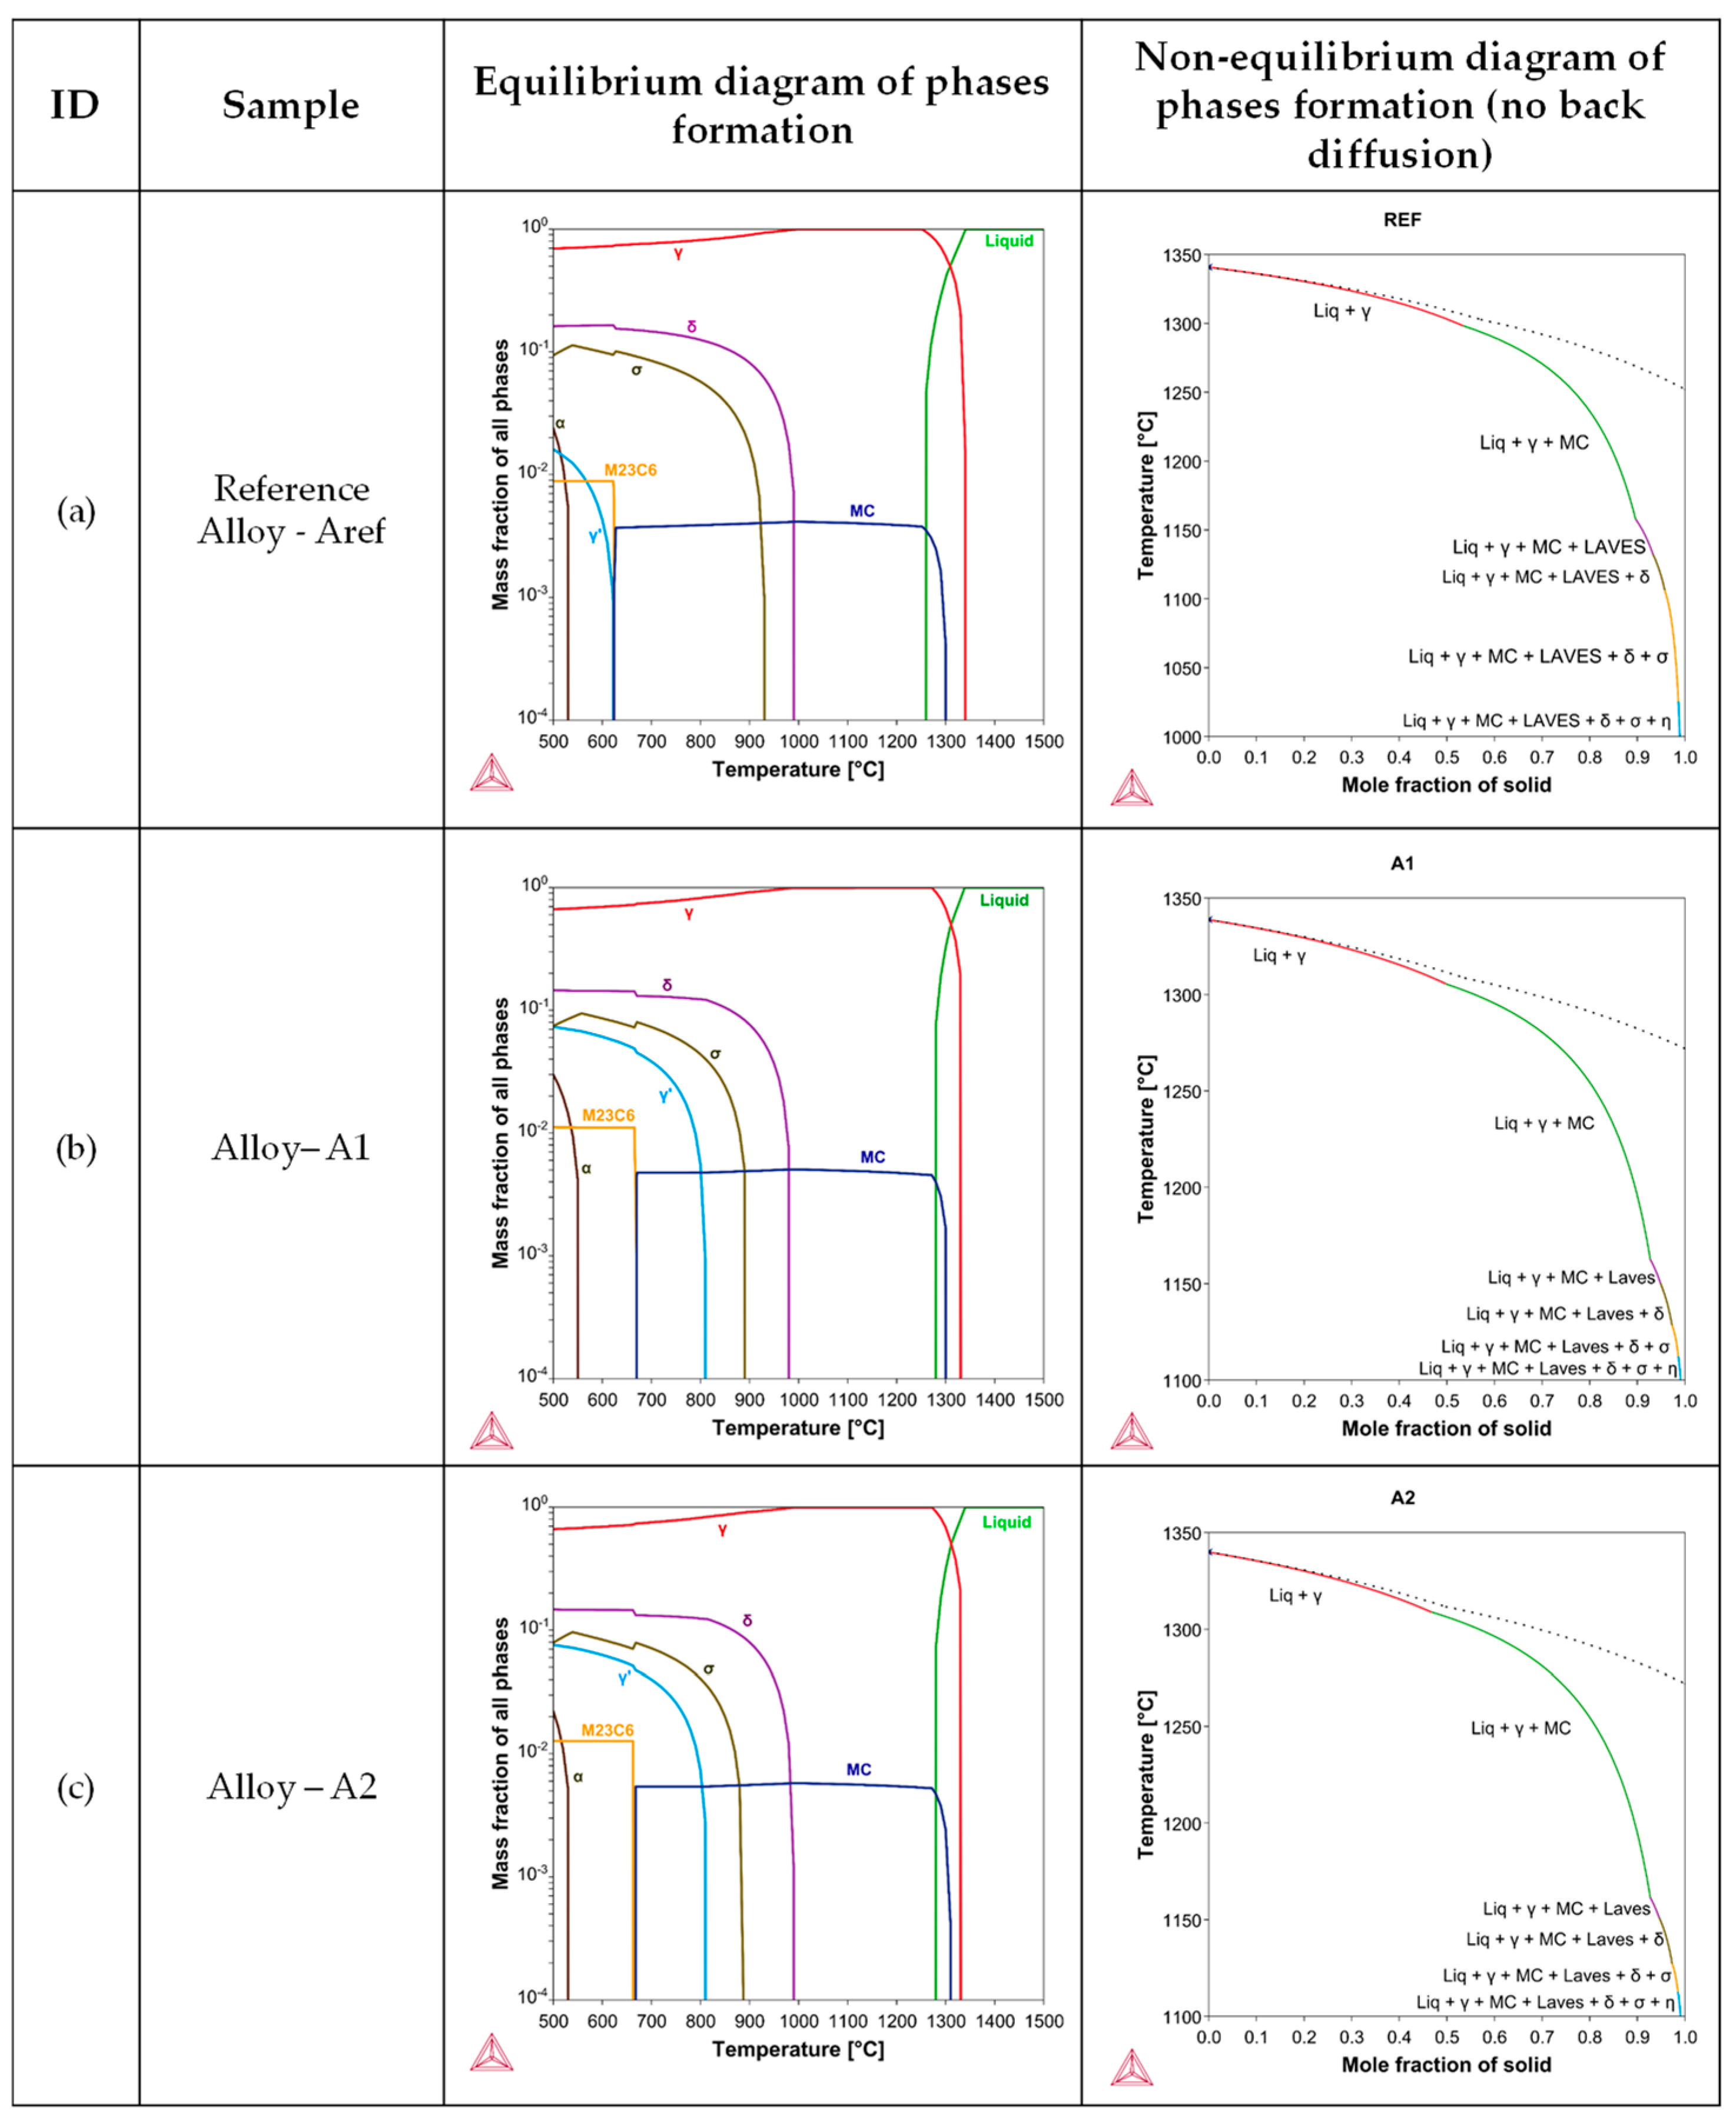
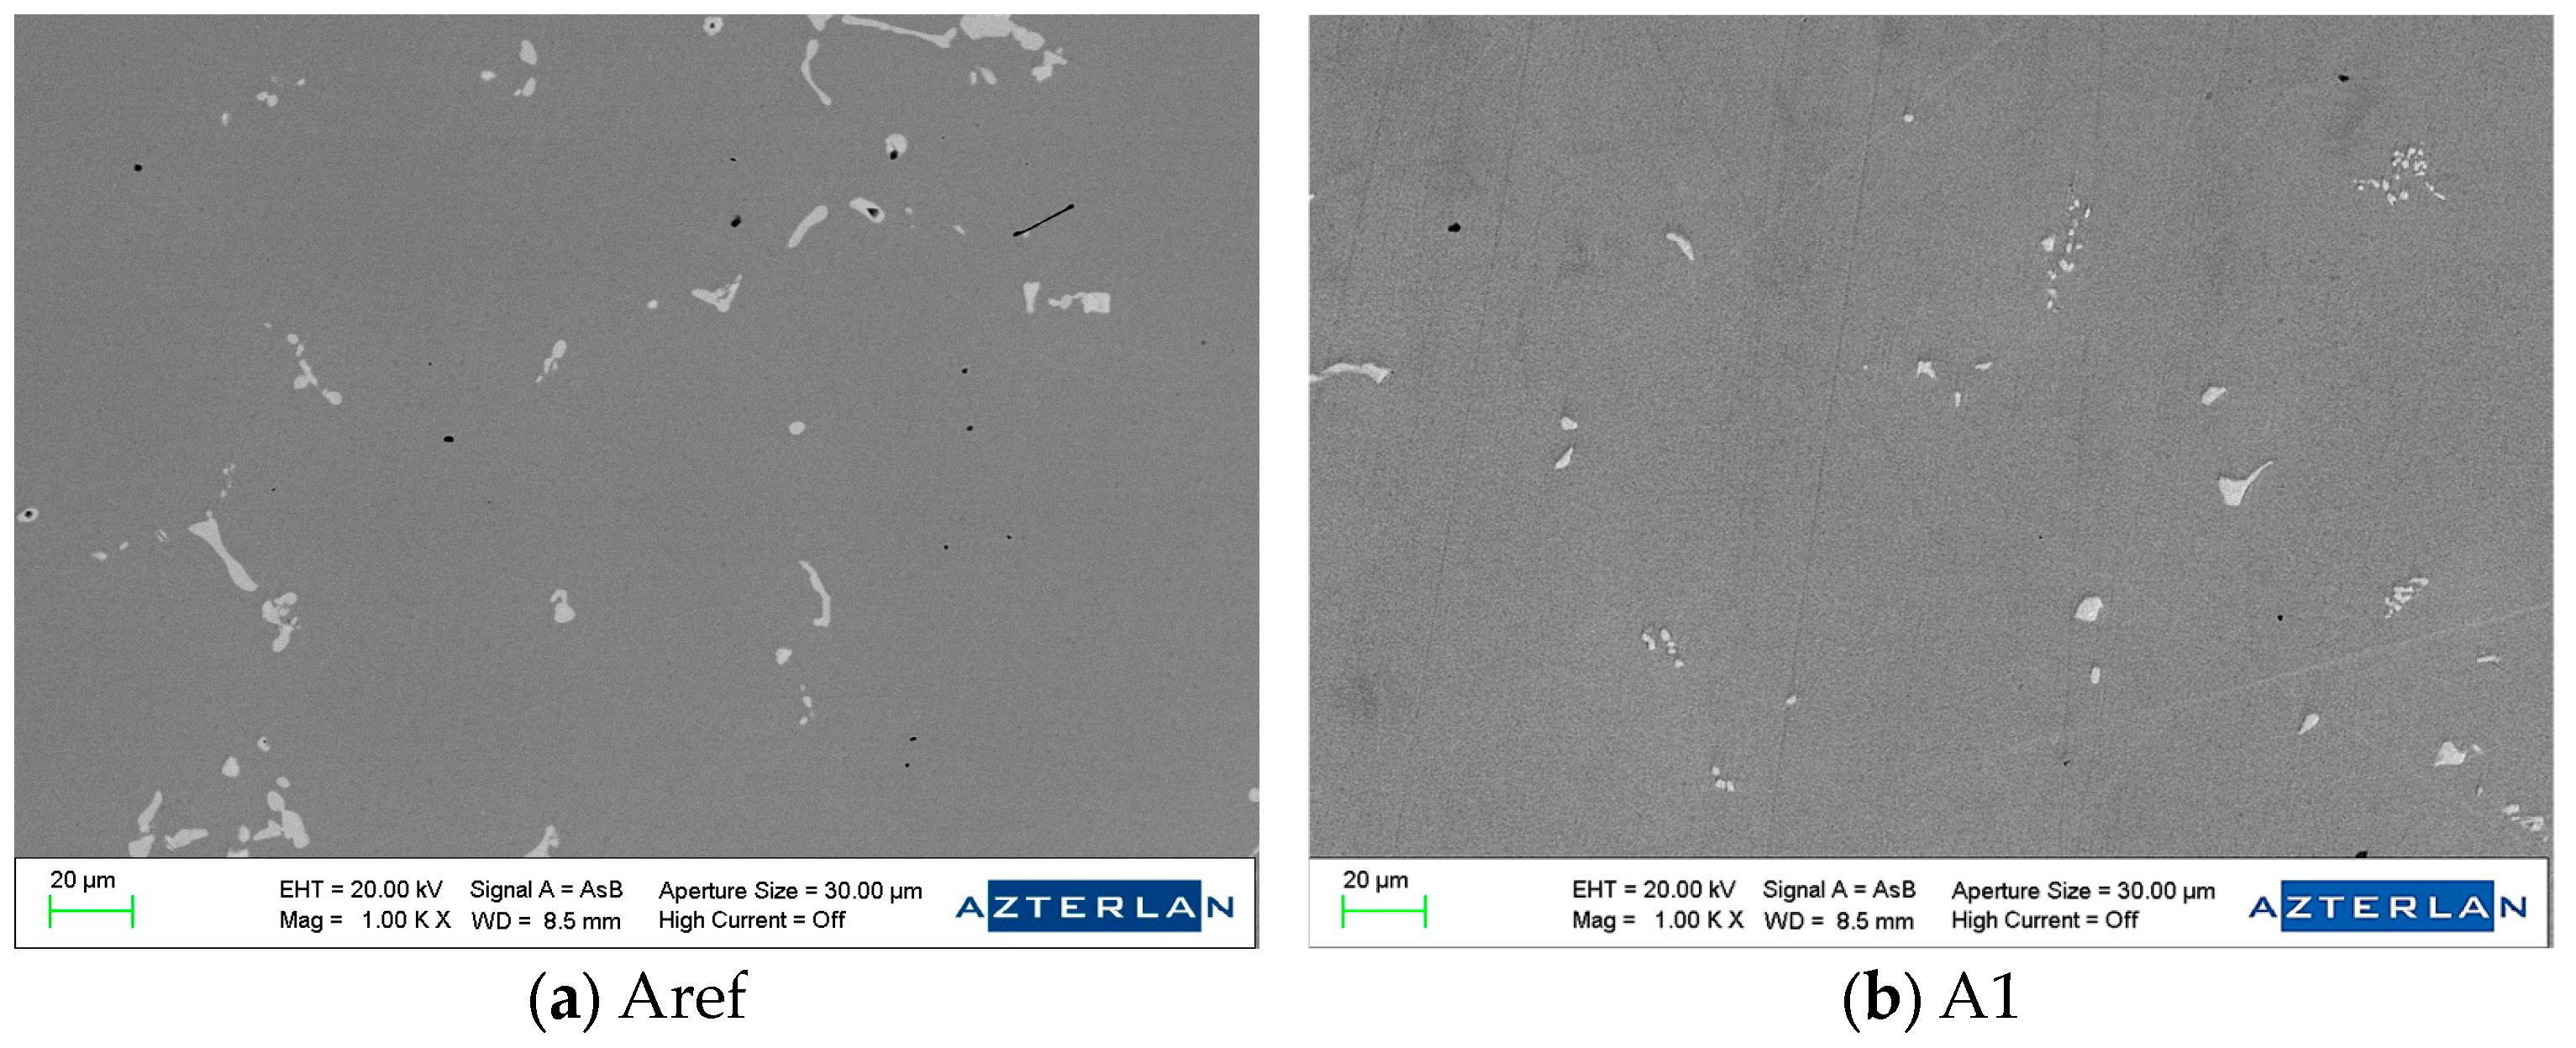
3.1. As-Cast Microstructure and Chemical Composition

The results of the analysis of Laves phases and carbides in the as-cast state of the 718 casting alloys, i.e., Aref, A1 and A2, are shown in Table 5. Table 5 shows a clear reduction in the total amount of Laves phases and carbides as the thickness decreases. Furthermore, it is notable that there were much more second phases in the reference alloy (Aref) than in the two newly proposed alloys (A1 and A2). This result is also shown in Figure 6 and underscores the differences in phase distribution between the reference and the two new alloys.
Regarding the effect of heat treatments after casting and before welding tests, it is observed that although the pre-HIP treatment on its own partially dissolved Laves phases, it did not result in a significant difference in phases quantity when comparing the entire thermal treatment (HIP + S) with and without pre-HIP. In this sense, the conclusion is that the addition of a new step in the thermal treatment did not help in modifying the microstructure before welding tests.

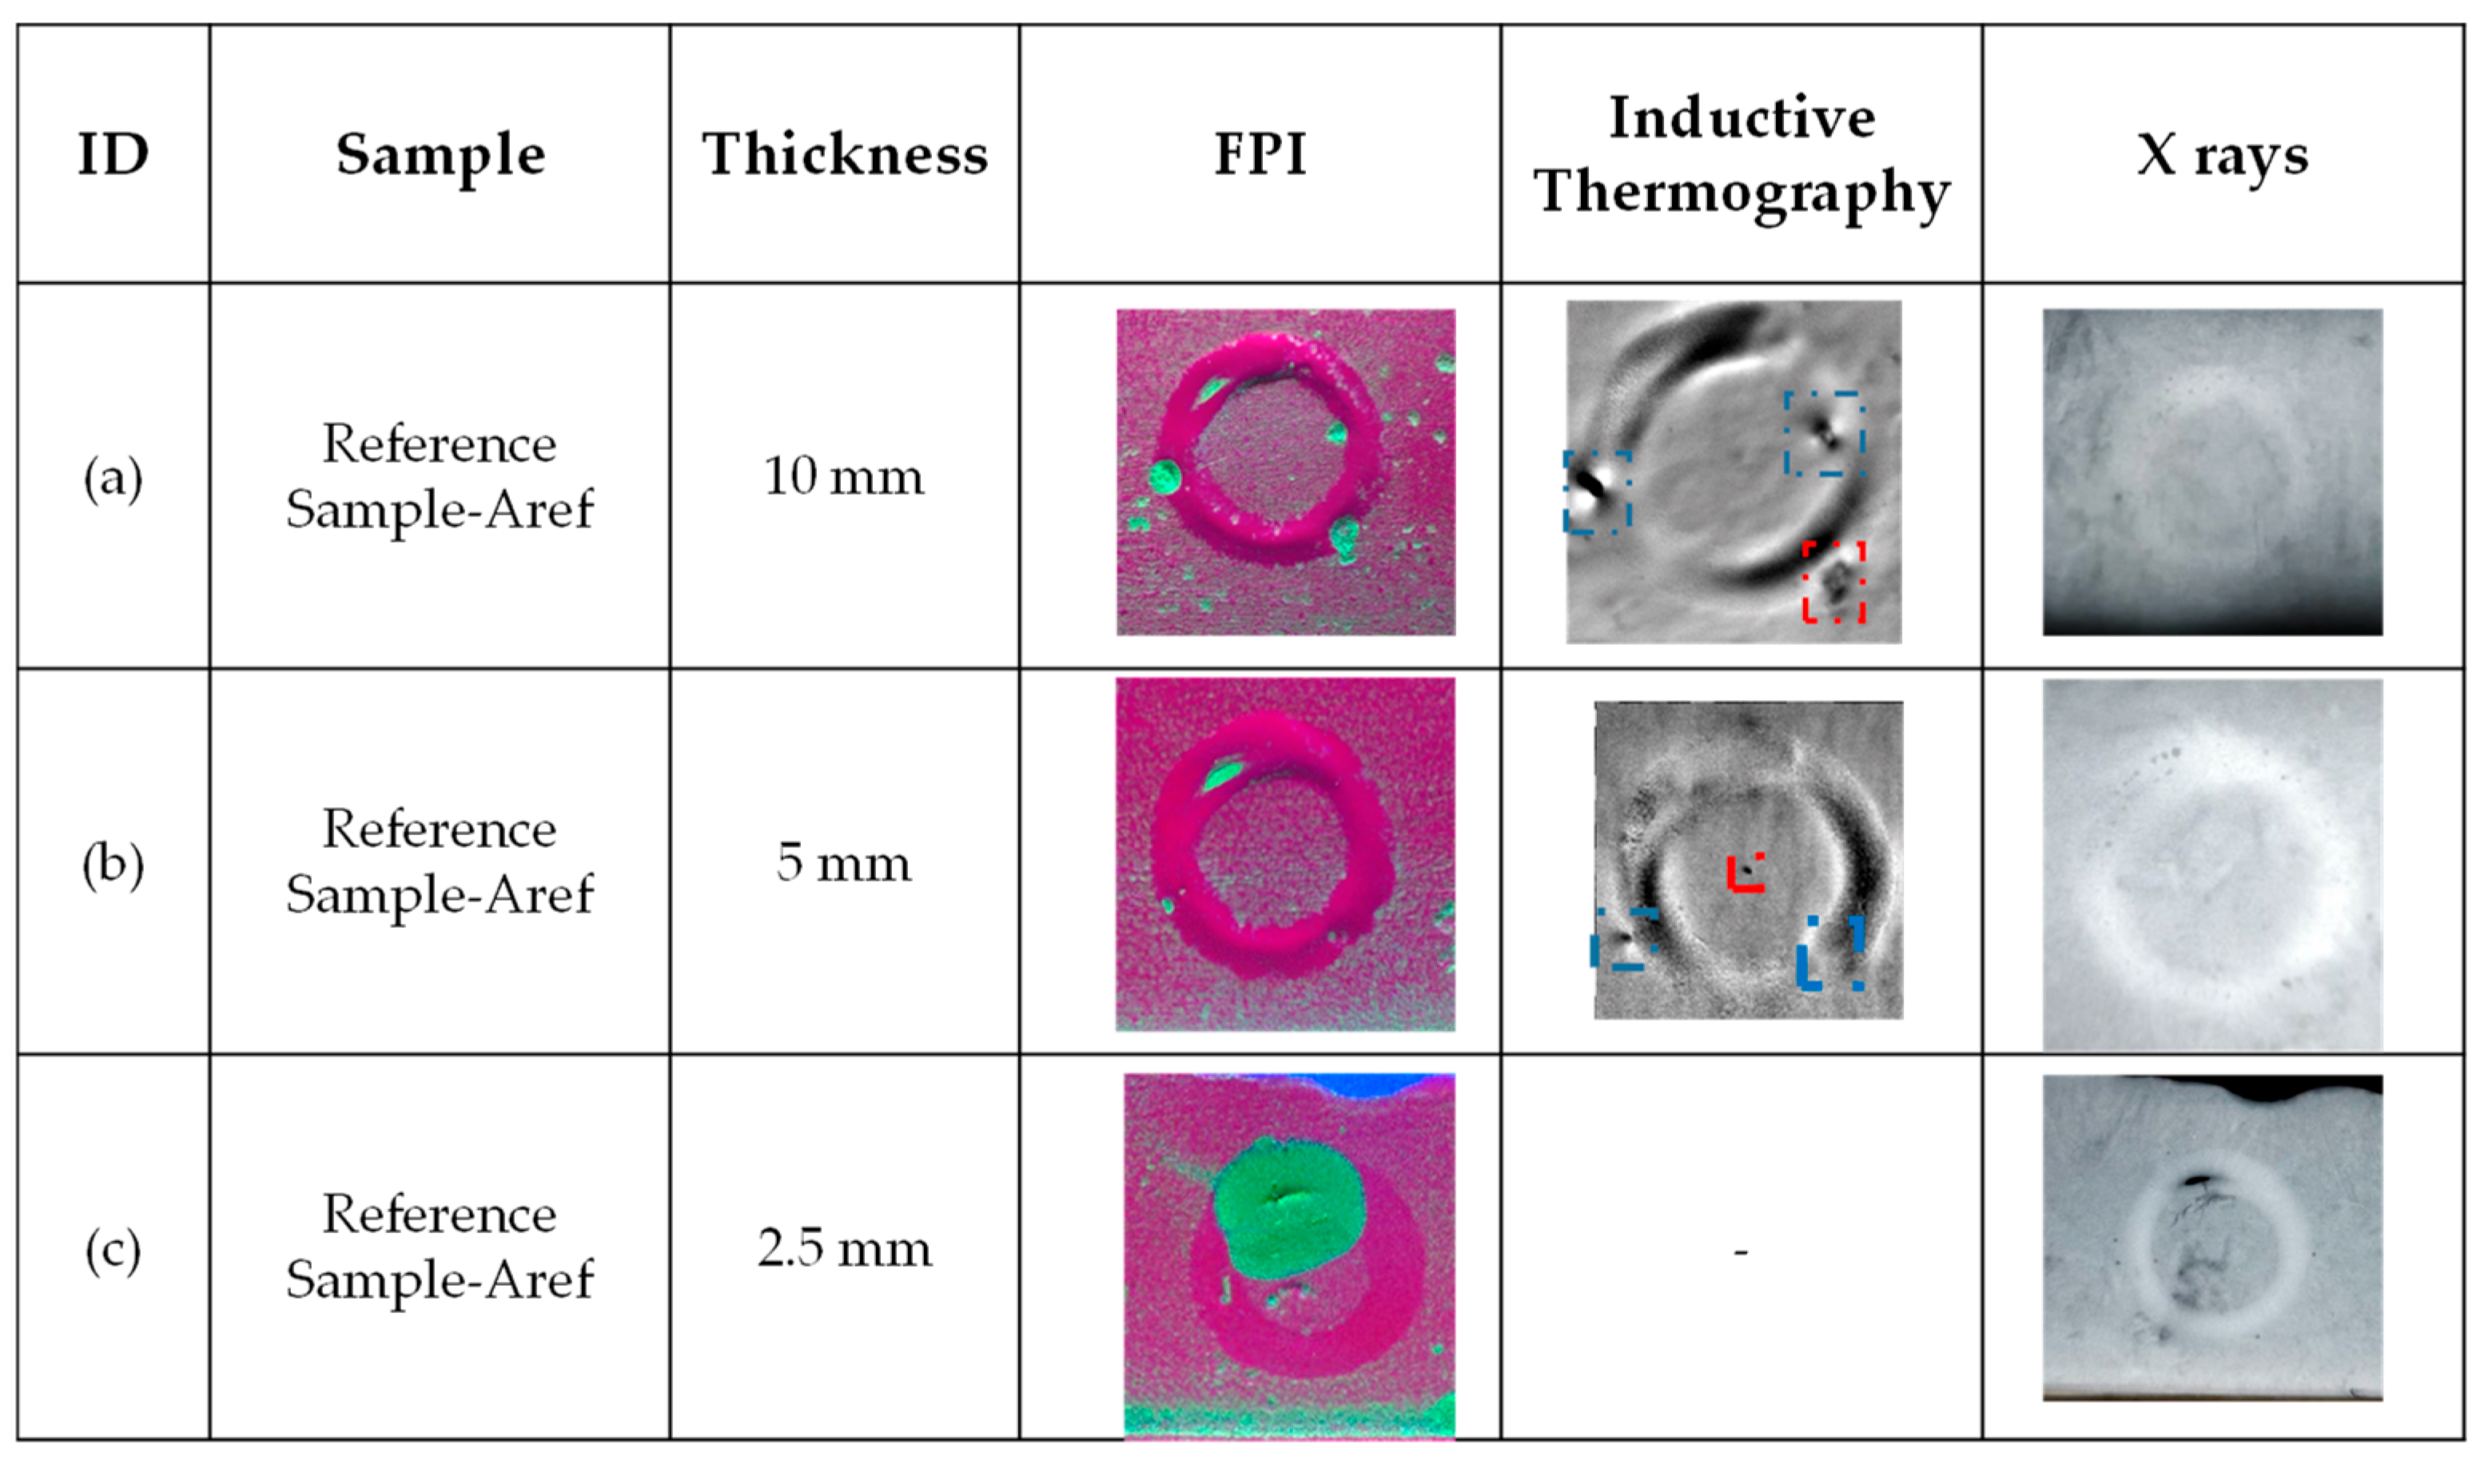
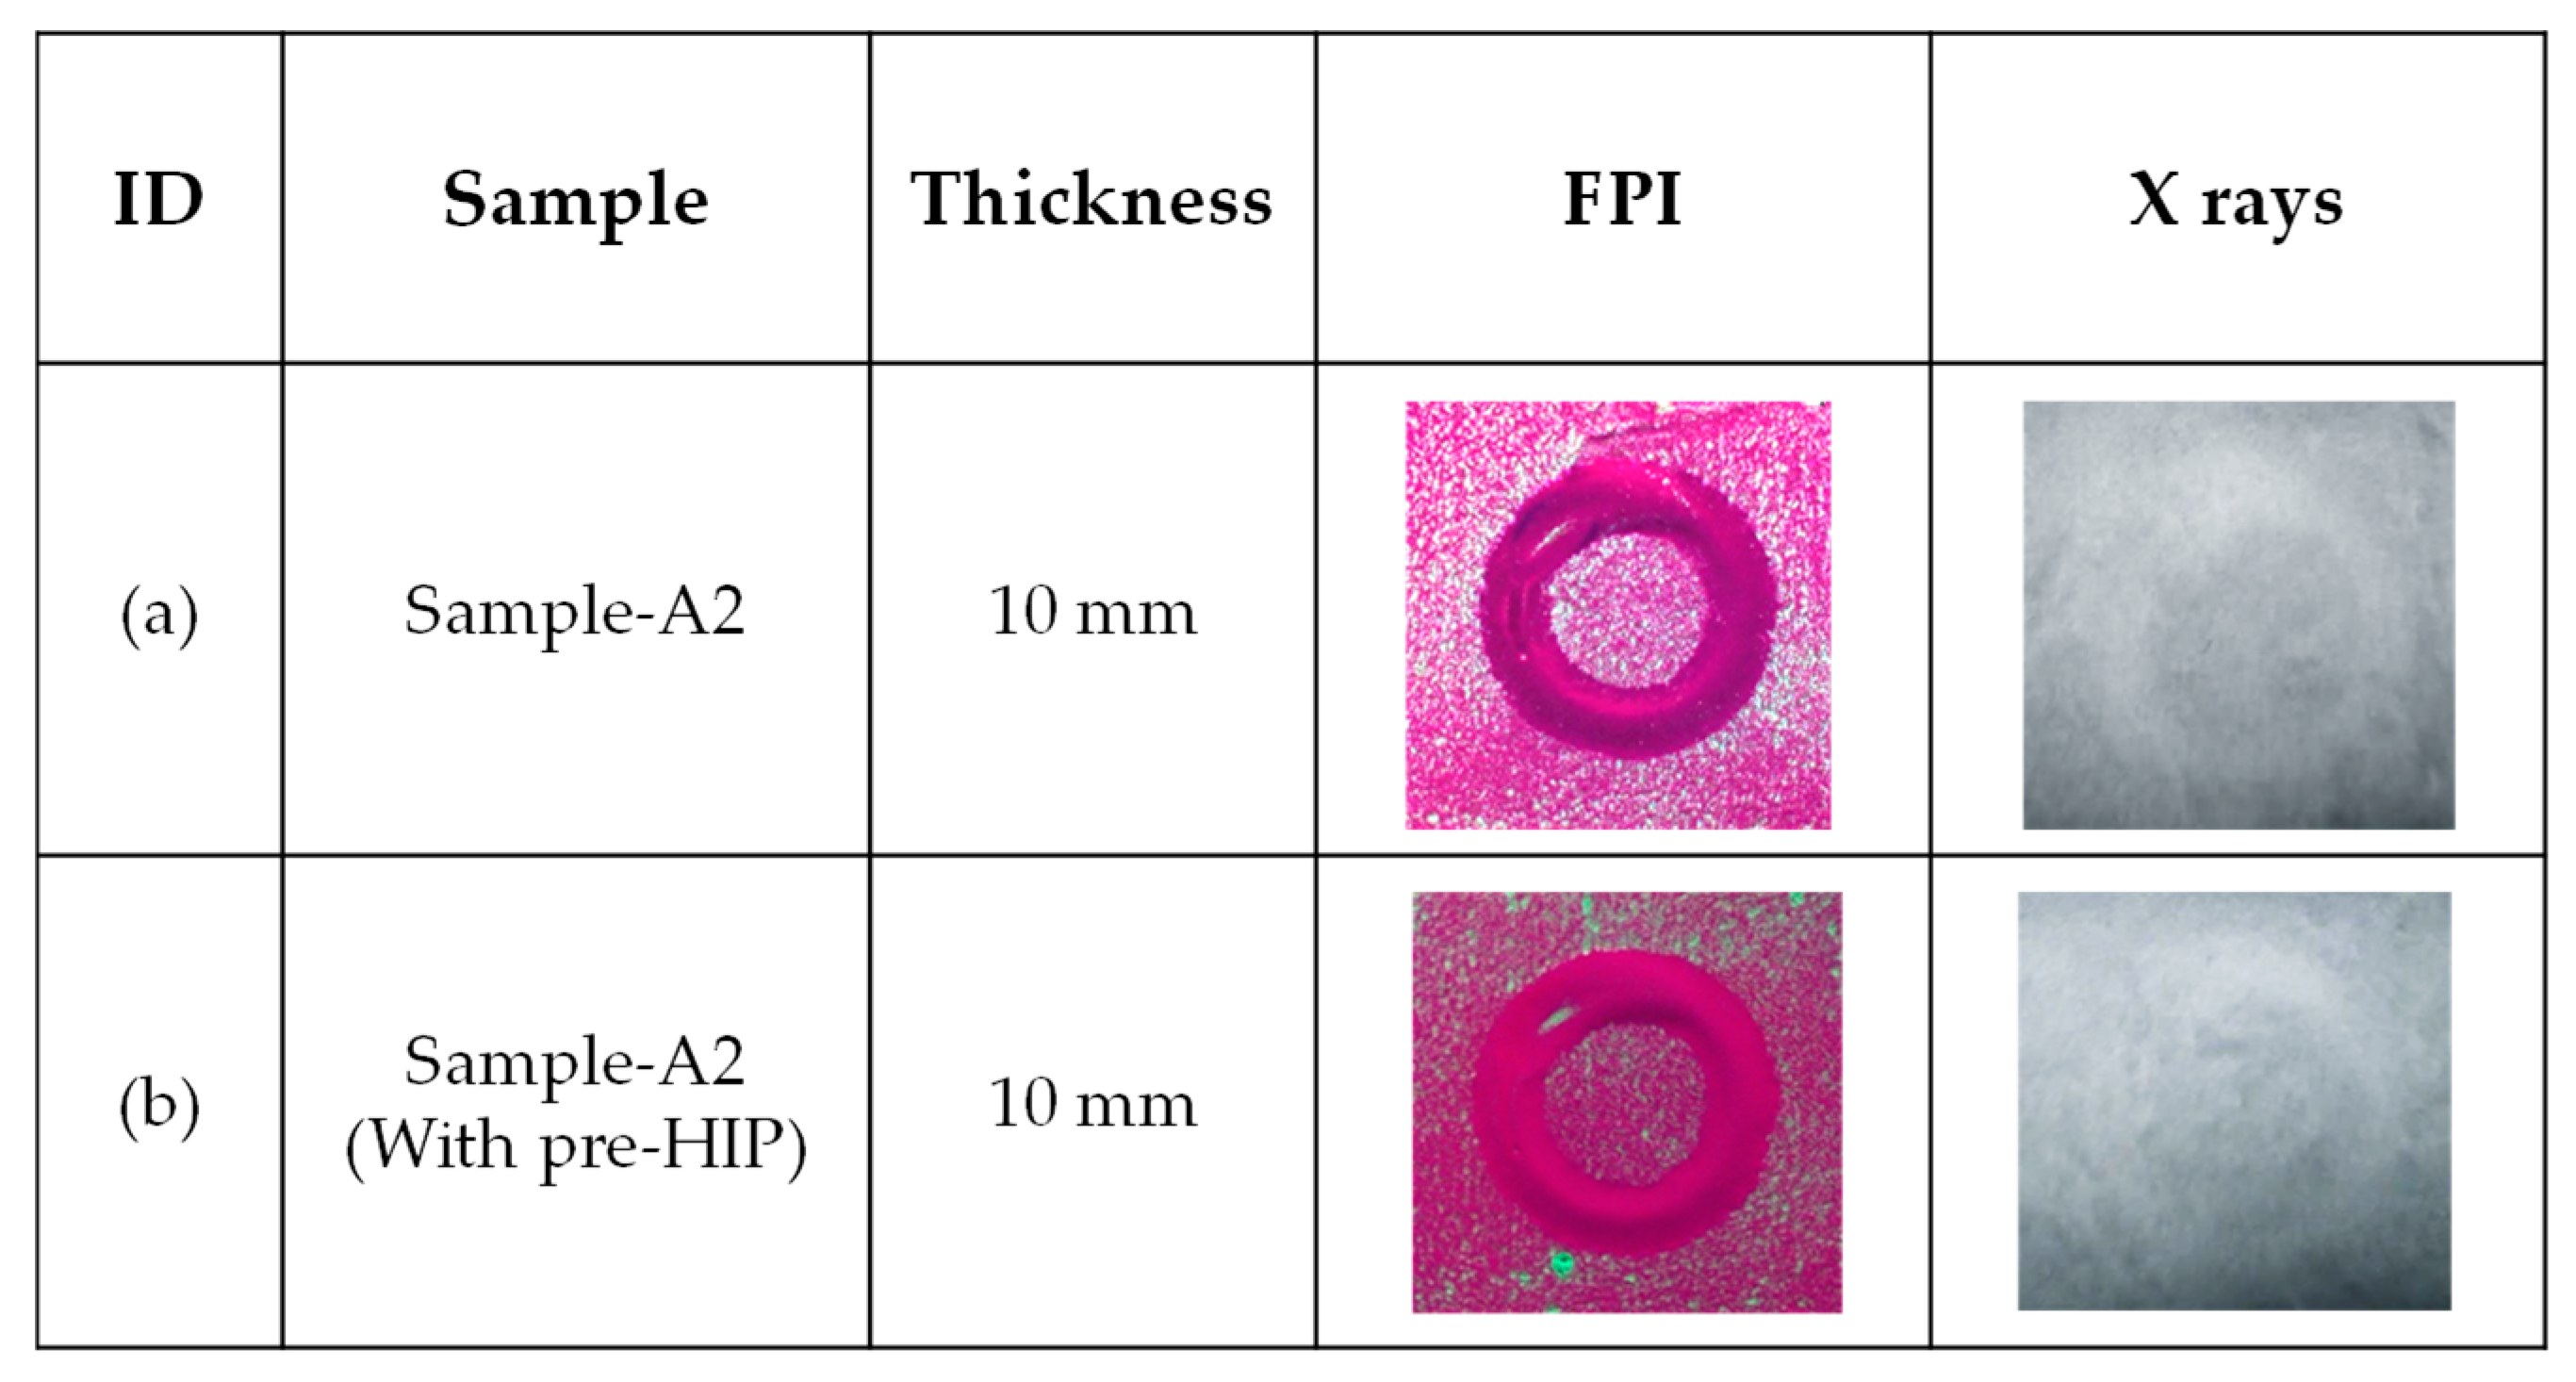
3.2. Non-Destructive Tests (NDT)

This section presents the outcomes derived from non-destructive assessments across three plate thicknesses (10, 5, and 2.5 mm). All inspection methodologies—FPI, thermography, and X-ray—consistently identify areas harboring defects.
Due to the lack of significant differences observed between the pulsed and continuous lasers, the continuous circular LBW trajectory has been adopted as the reference.
In Figure 7, the three technologies are presented, and the defects are identified as follows. Firstly, in the fluorescence liquid penetrant inspection, FPI, the defects appear in green on a purple background. In the case of thermography, these same defects are identified with blue squares, which are related to cracks. Lastly, the signal acquired using X-ray technology is identified in black against the white of the weld bead.
As shown in Figure 7, for the reference alloy Aref, defects are identified at all three thicknesses, with no correlation between the thickness steps and the number of surface defects detected.
Figure 8 displays the sample A2 under the same continuous LBW laser conditions, circular 2 trajectory, without and with pre-HIP. Although an improvement in weldability for the pre-treated Pre-HIP samples was expected by the authors of this study as an initial hypothesis, no evident enhancement was observed in the welding tests. Conversely, a clear improvement in reducing cracking is evident for the two new samples (samples A1 and A2) with tailored chemical compositions compared to the reference one (Aref—Figure 7a, and particularly for sample A2—Figure 8a).
In order to provide further evidence of the improvement in weldability and reduction in defectology in alloy A2, a summary is presented below (Table 6) detailing the number of defects detected by FPI and X-ray inspection for the circular 2 trajectory continuous LBW and considering the three thickness steps. Defects far away from the weld bead and heat-affected zone (HAZ), as well as crater end cracks (CEC) were excluded in this analysis. As a result, the reference sample Aref exhibits a higher number of defects compared to alloy A2. Furthermore, the X-ray measurement technique demonstrated superior defect detection capabilities, identifying not only superficial defects but also defects inside the weld.

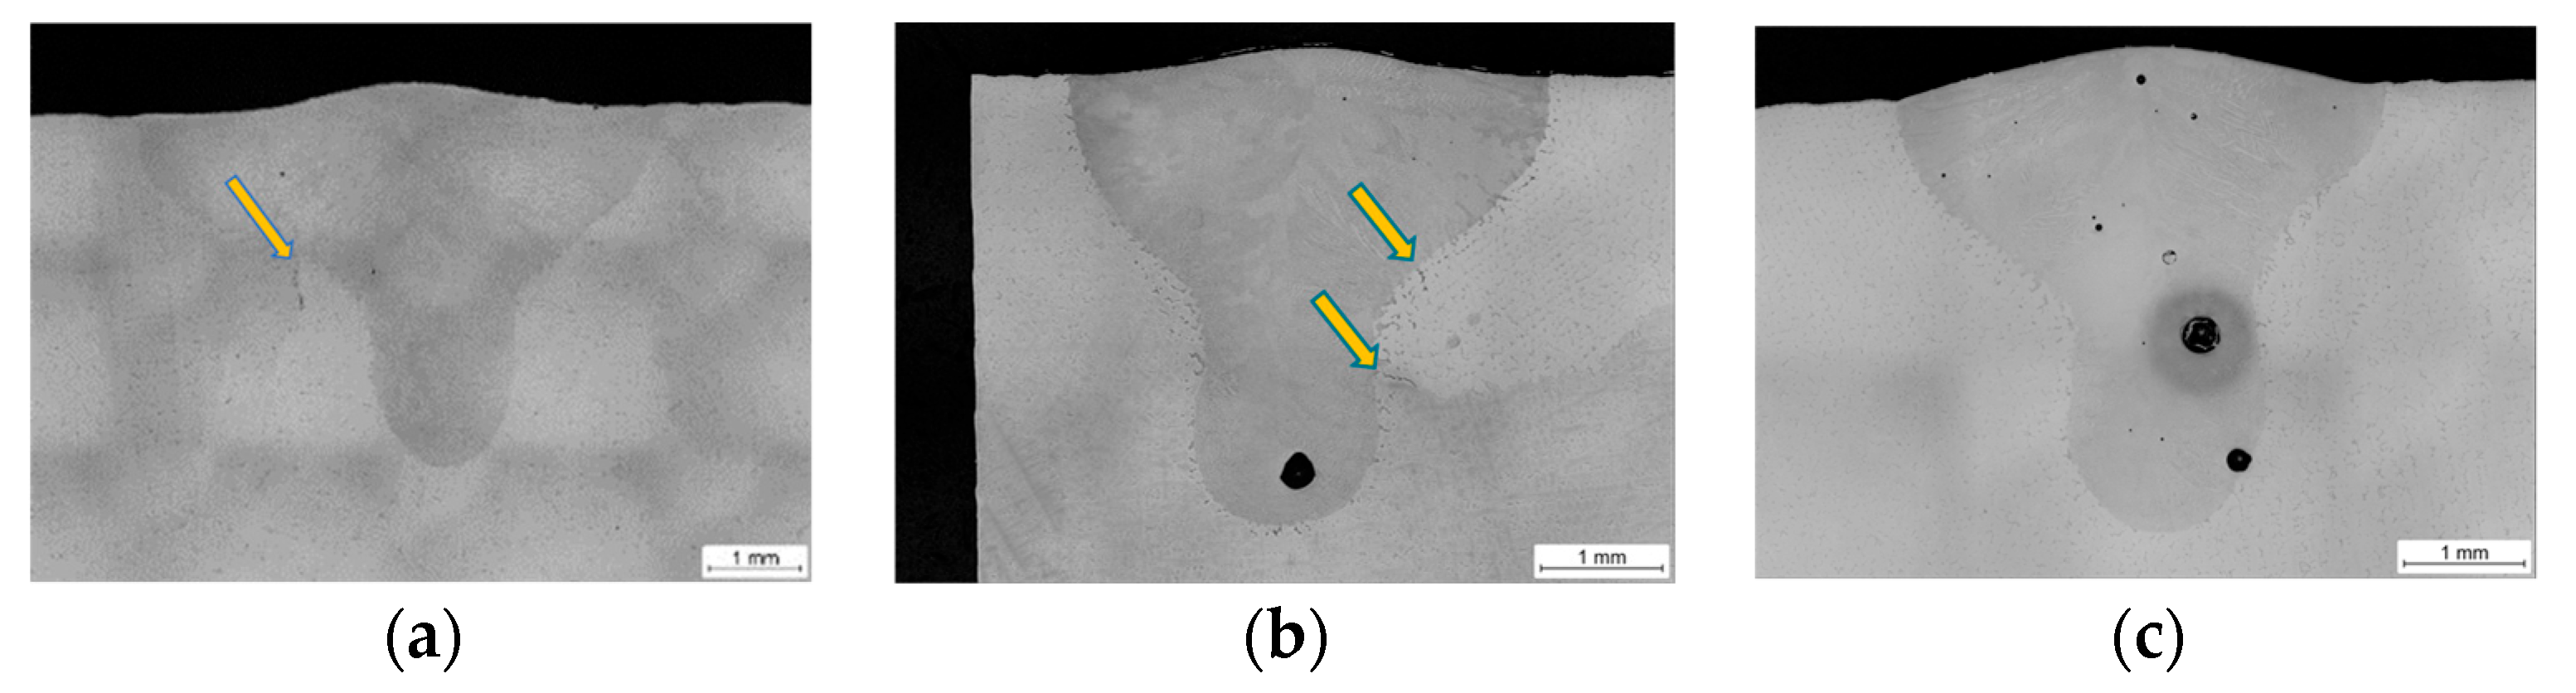
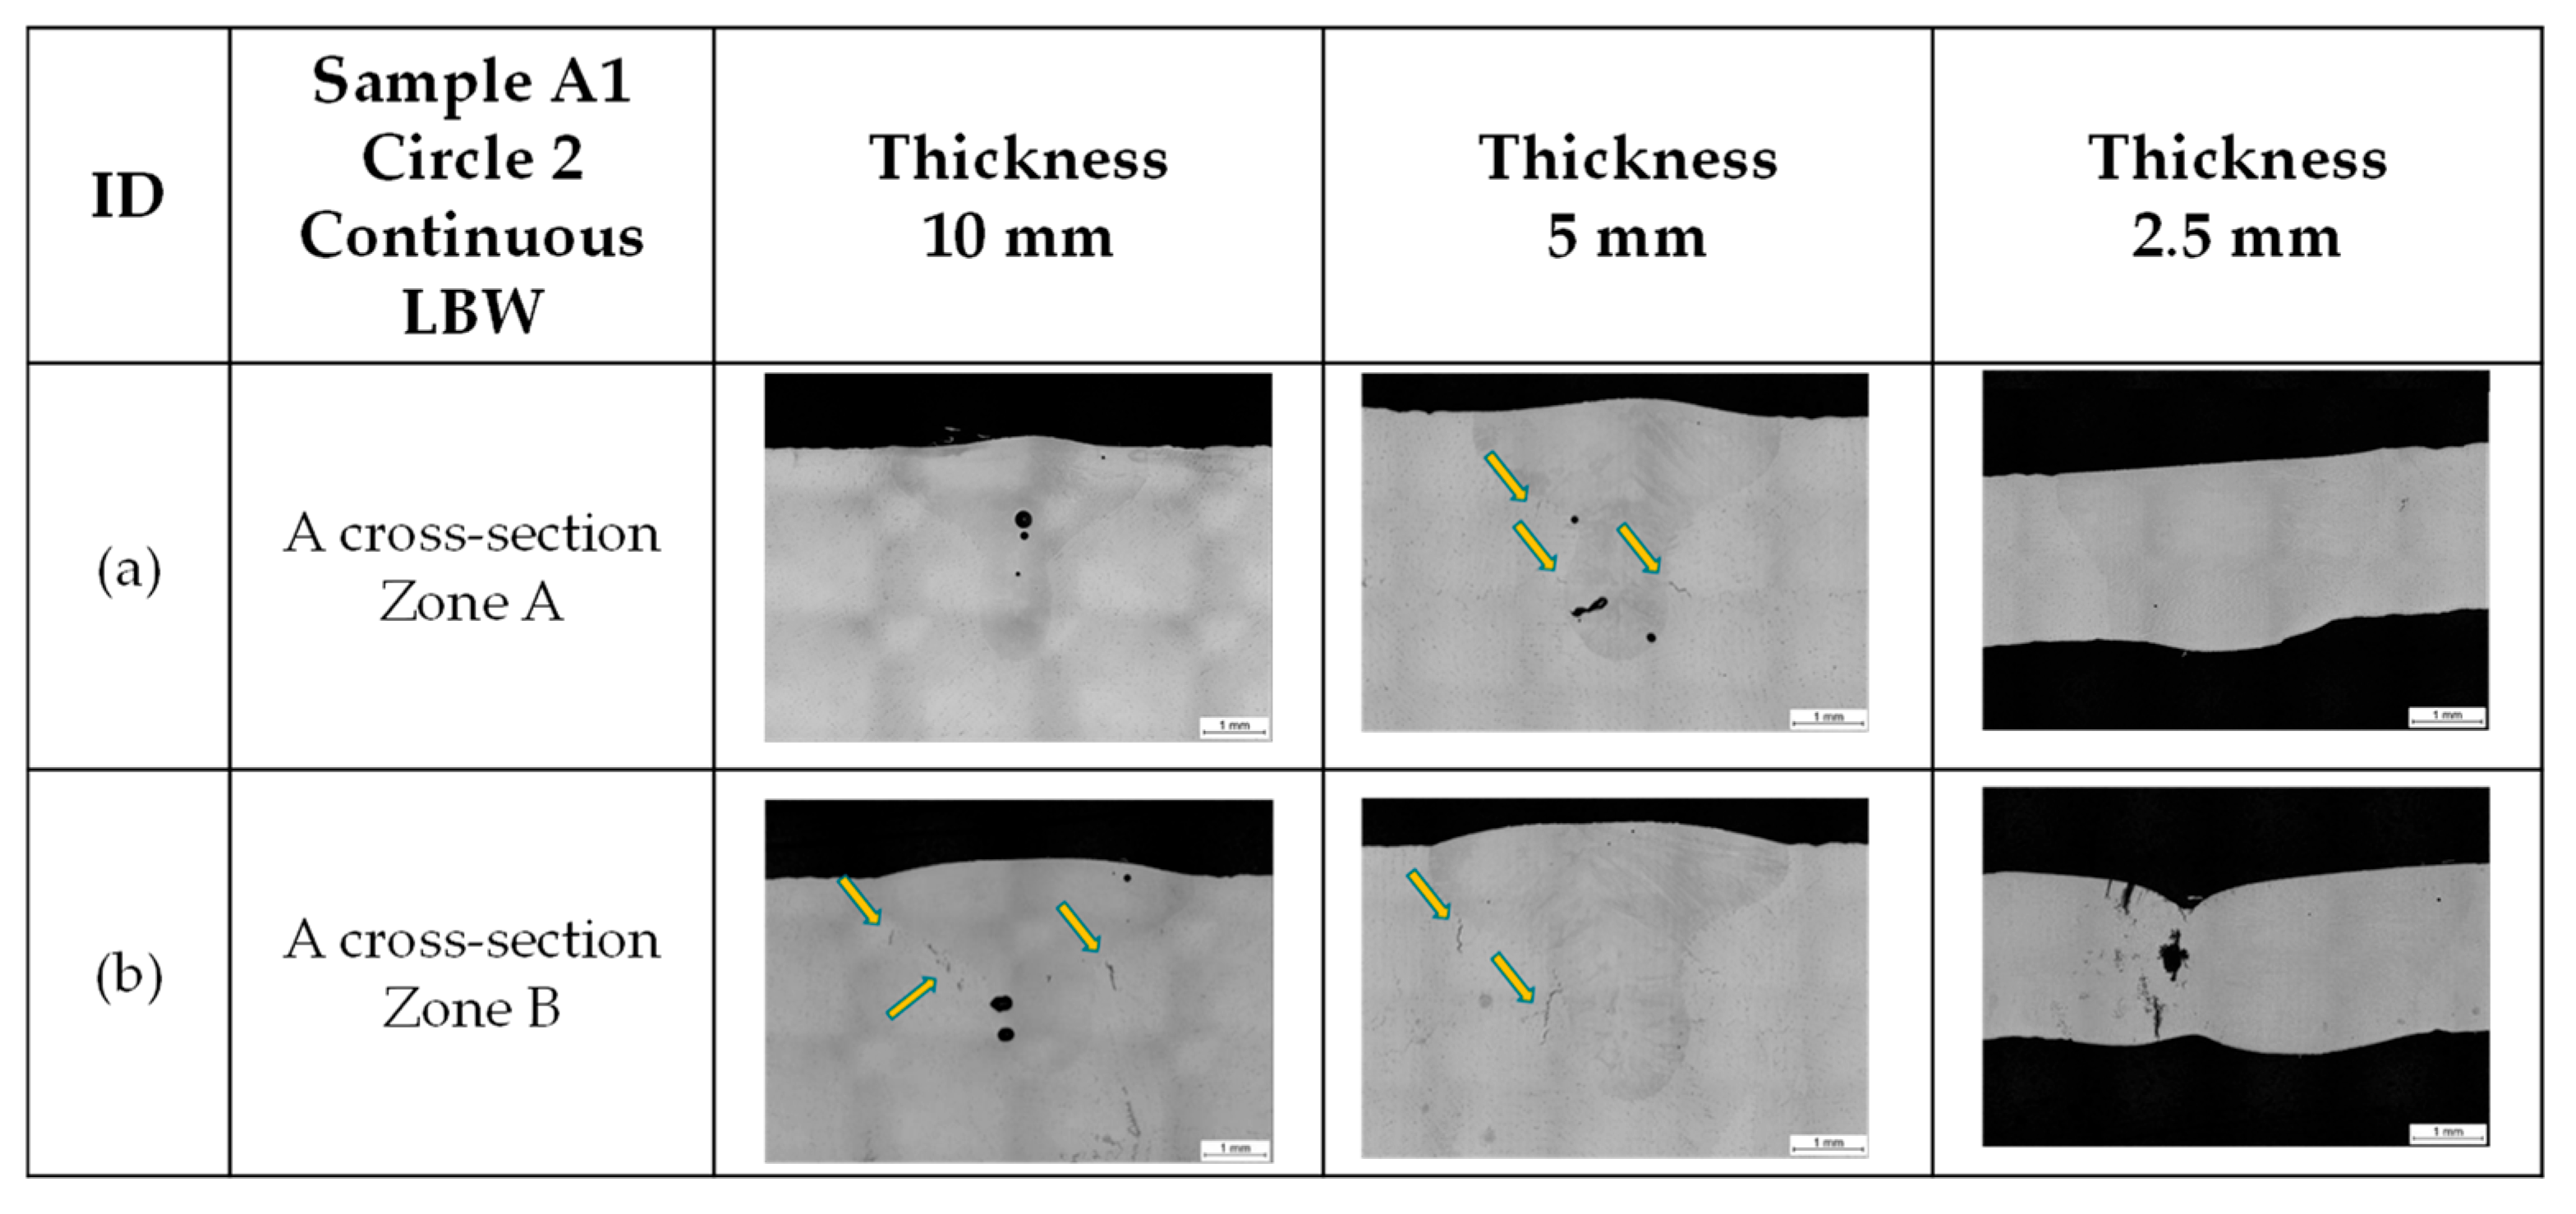
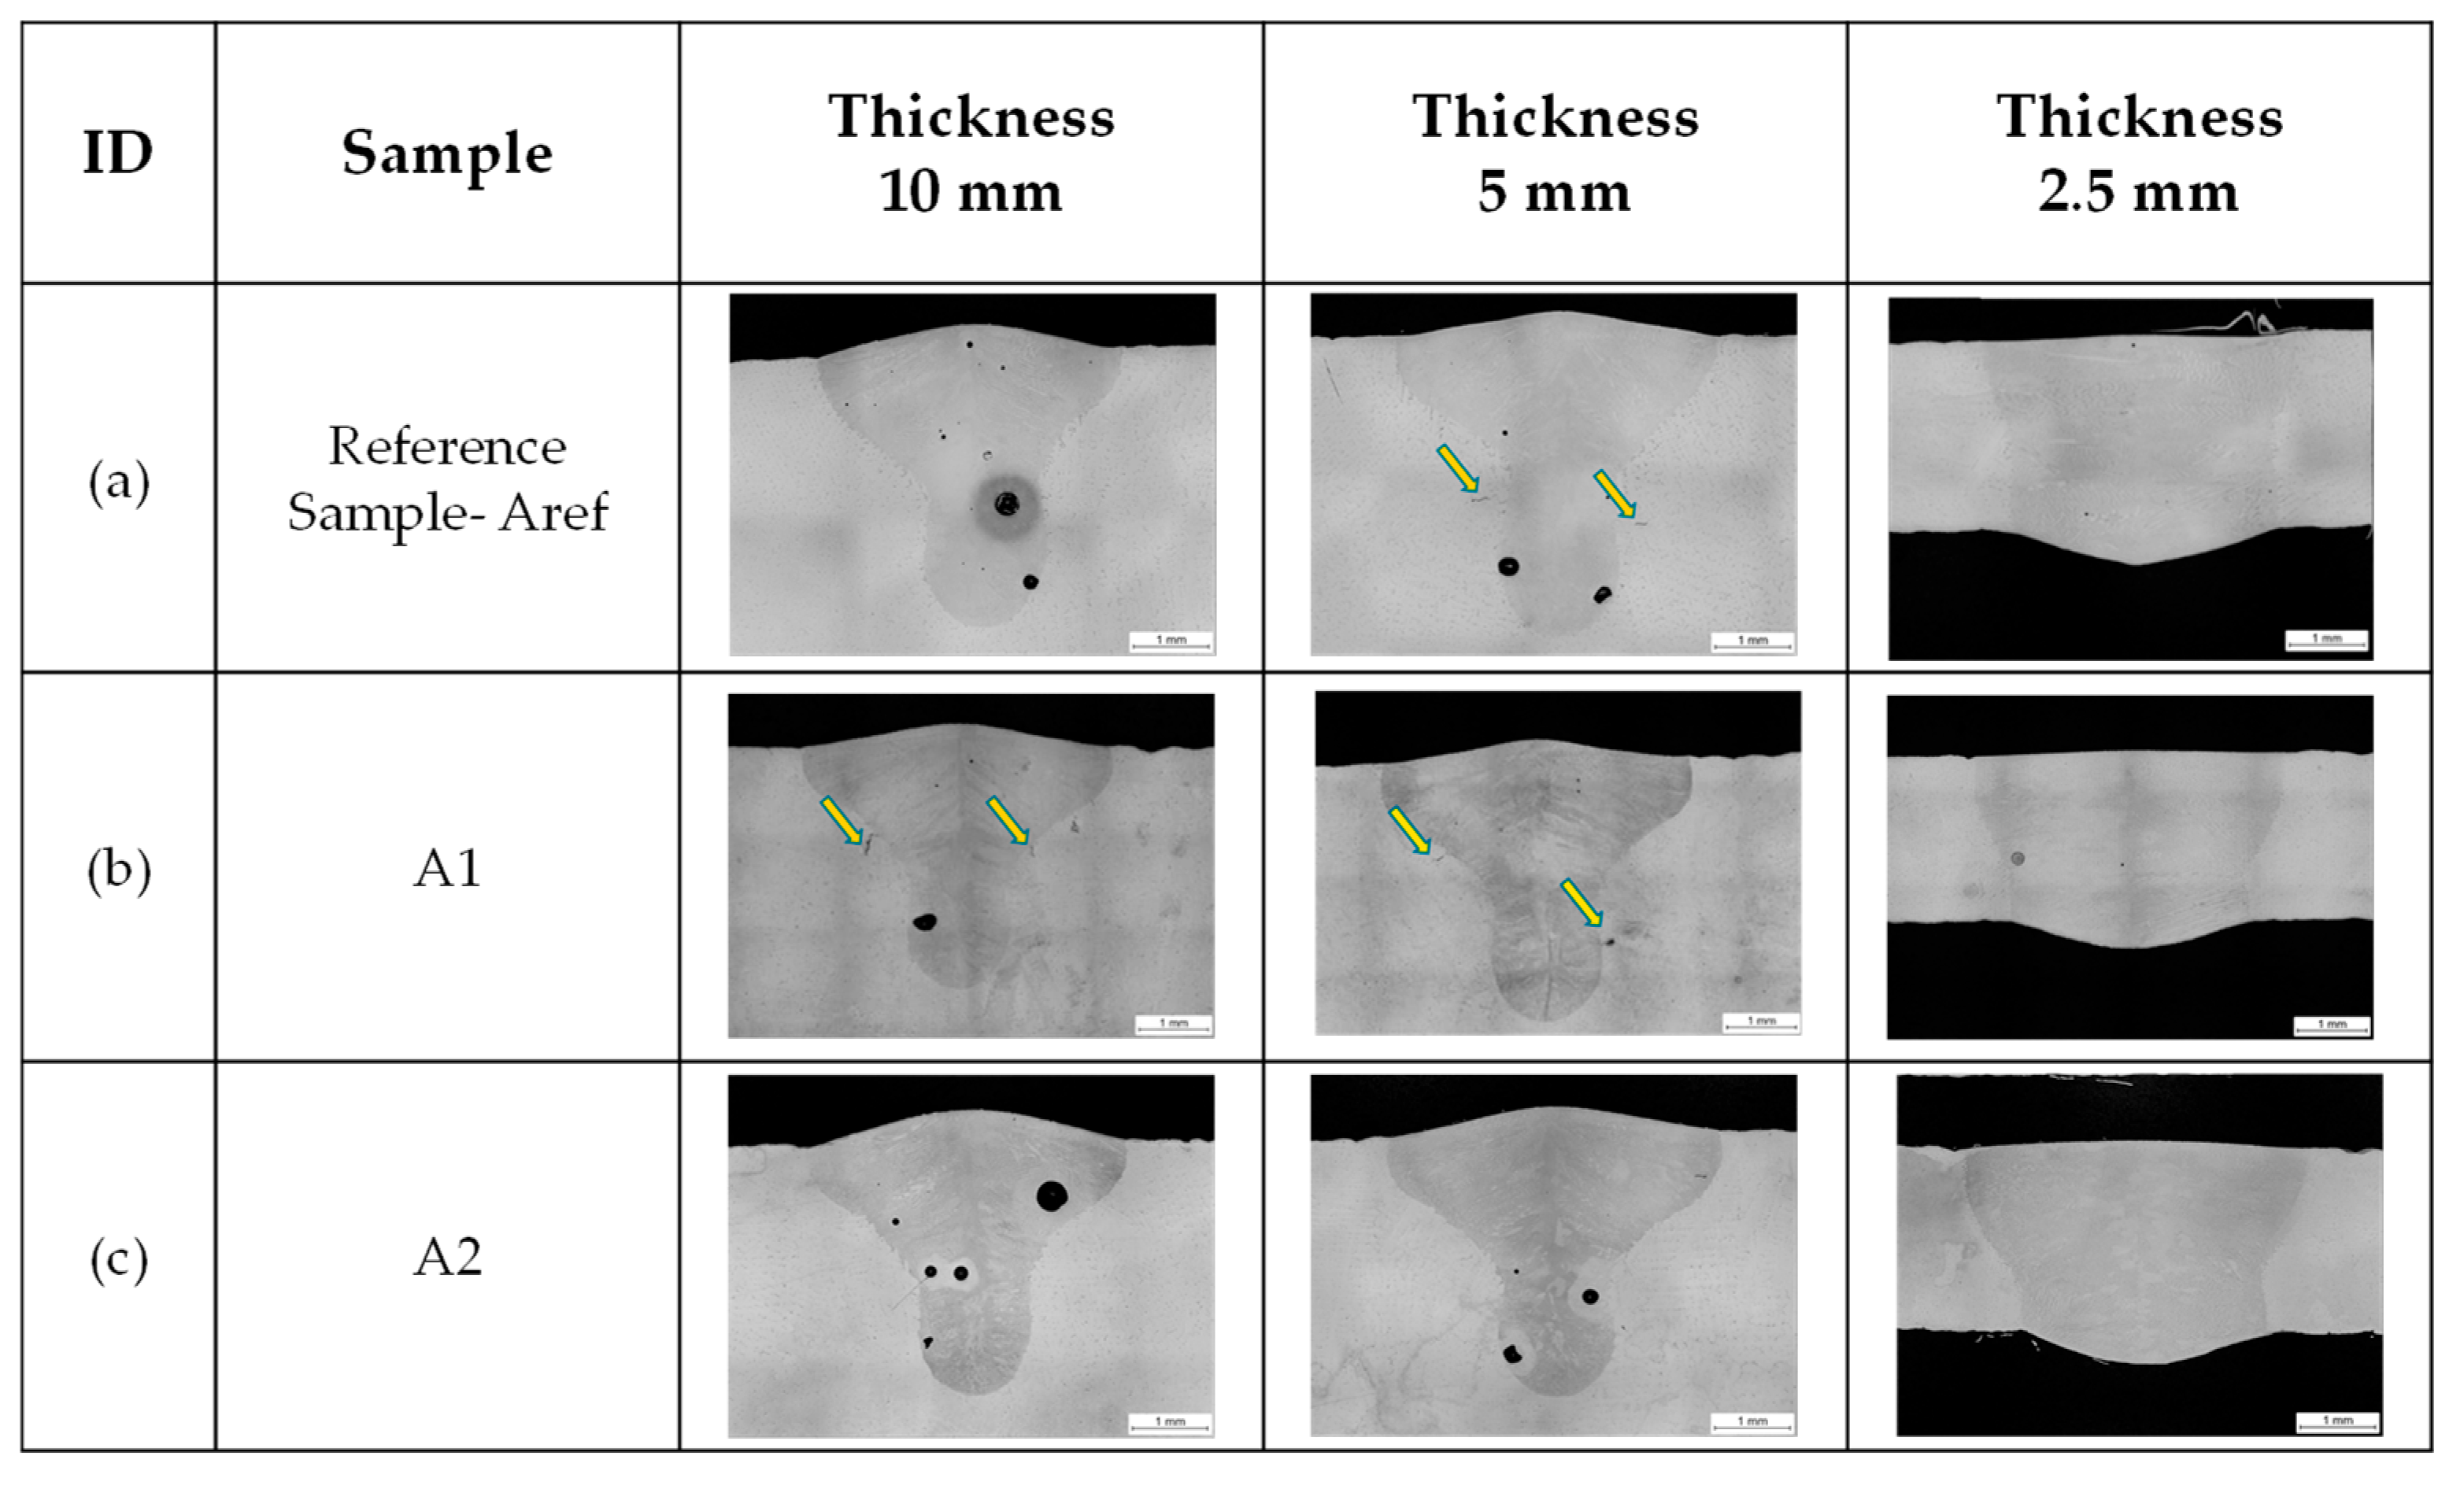
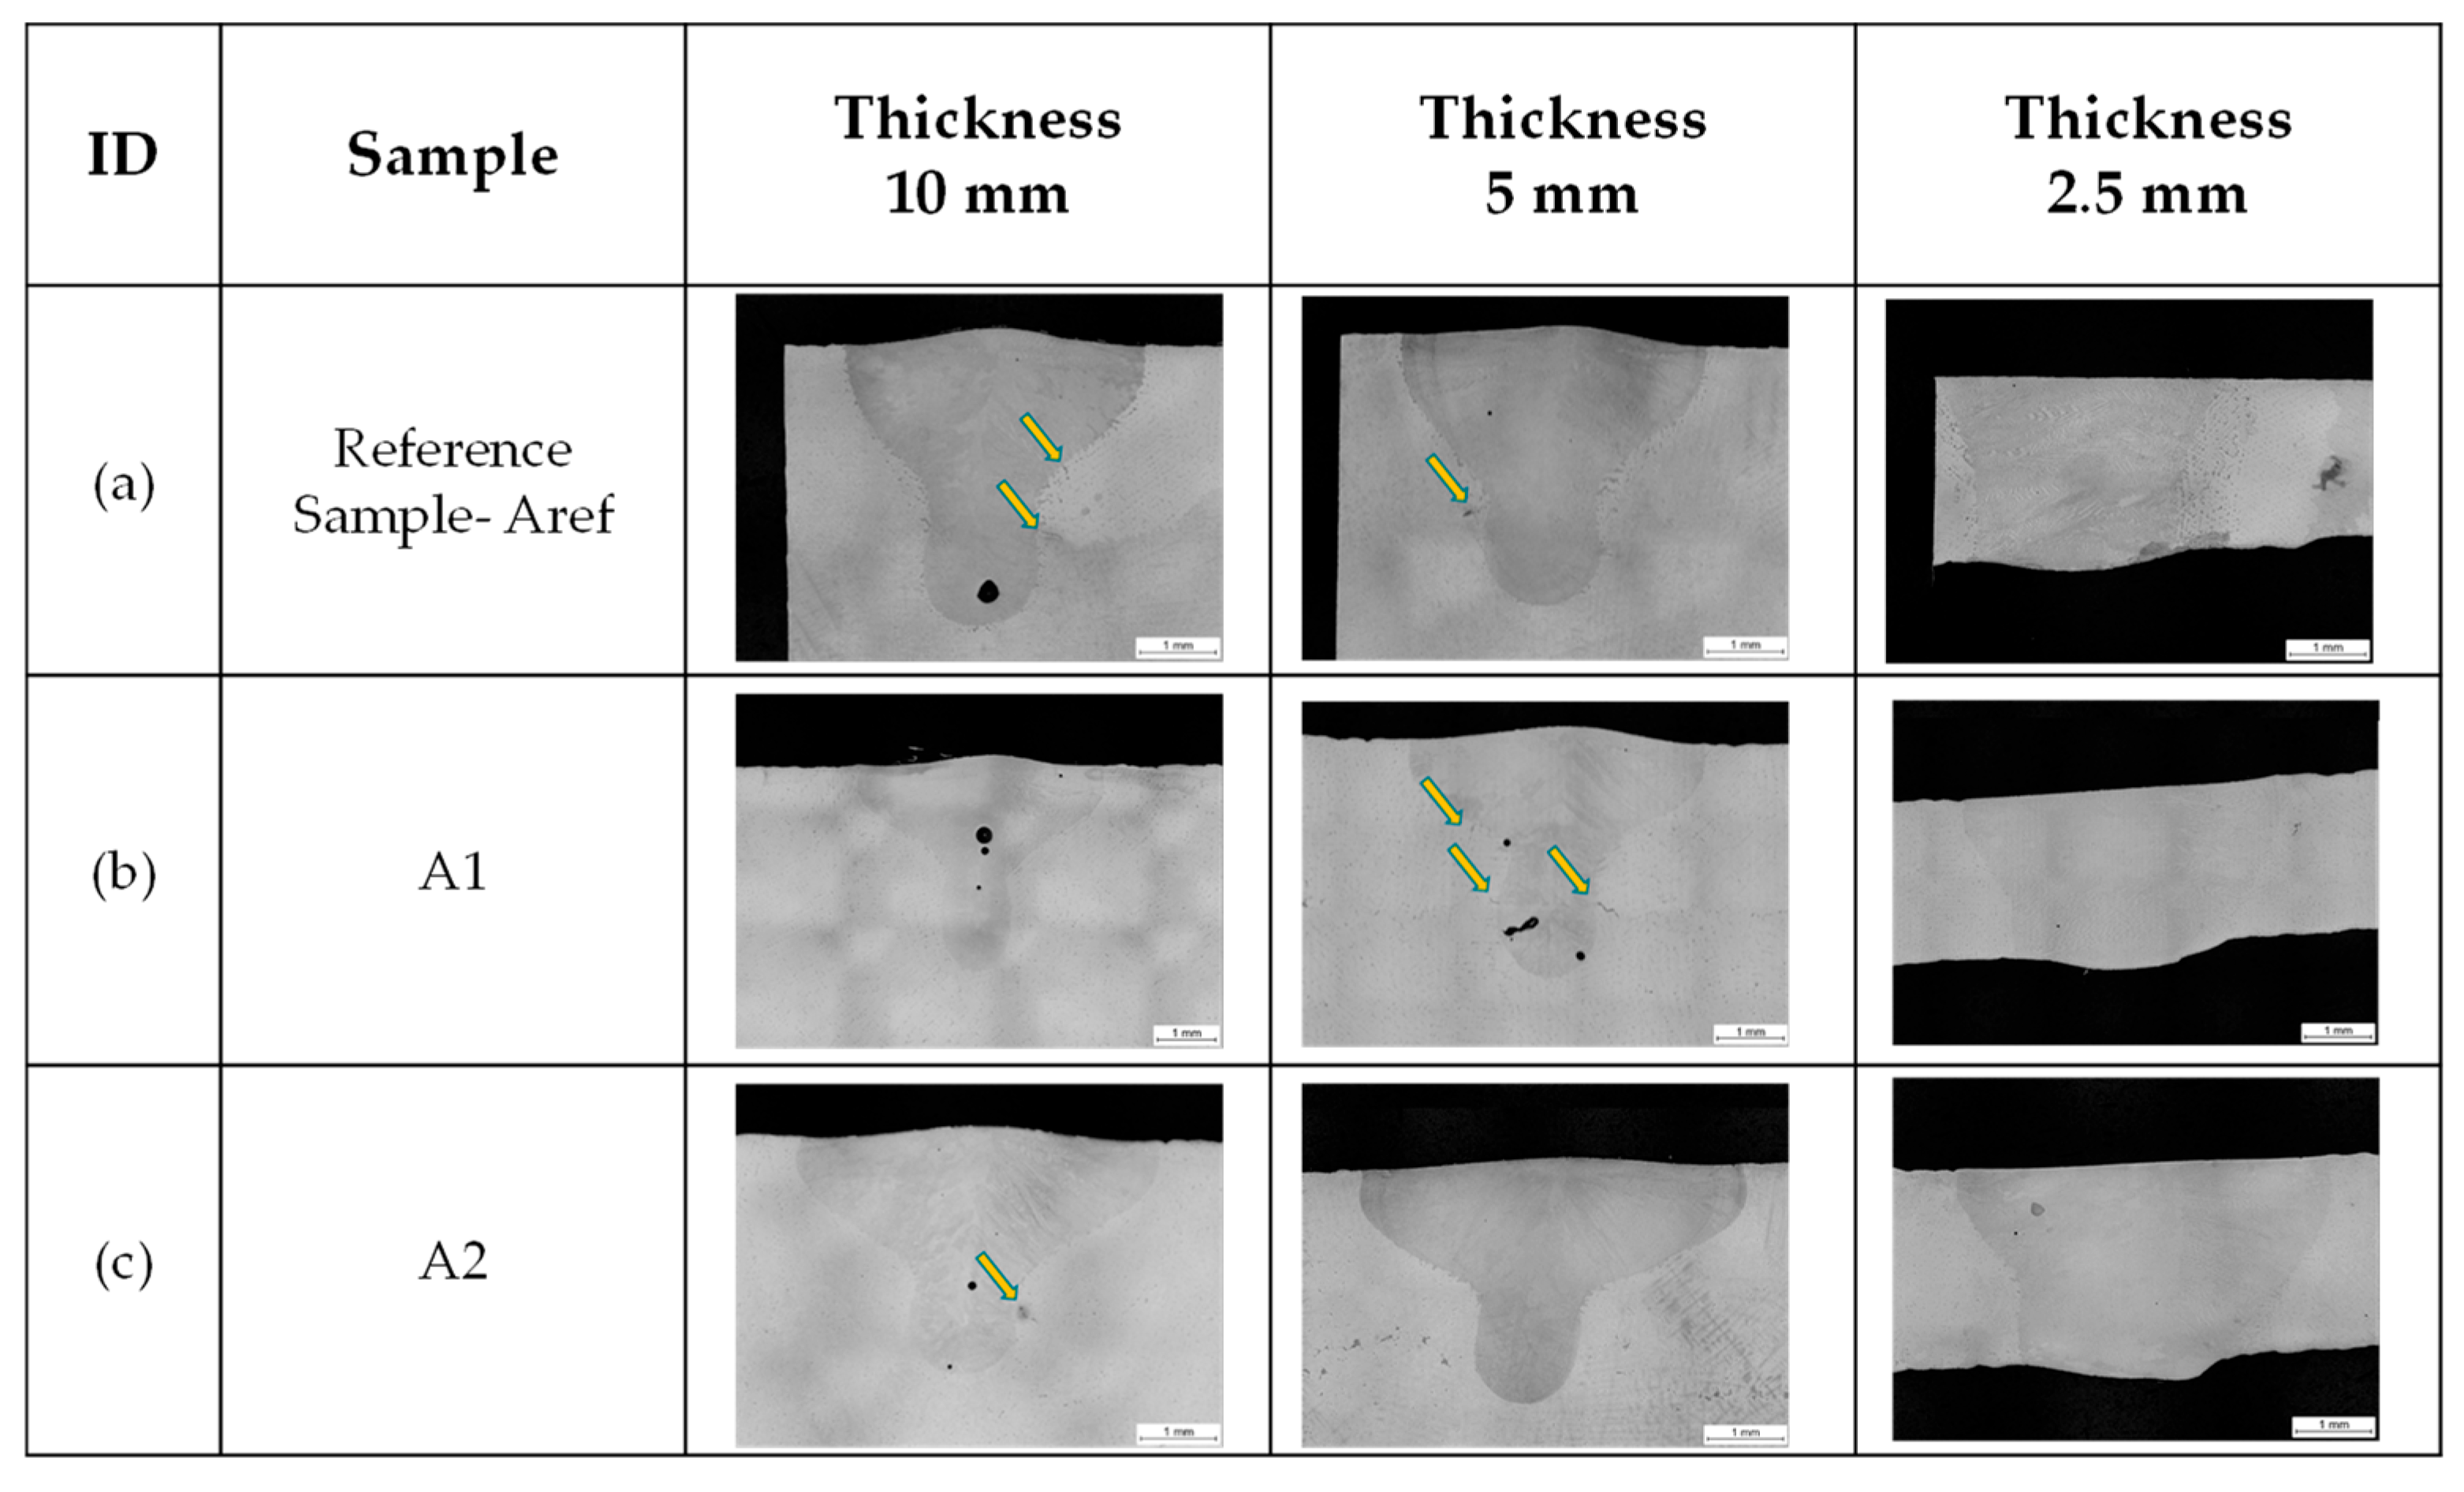
3.3. Metallographic Characterization Results

The metallographic analysis of cross-sectional areas of weld beads in the different samples and steps enabled the identification of characteristic internal cracks in the heat-affected zone (HAZ) and pores inside the fusion zone (FZ) which are not observed in the surface.
In Figure 9, weld bead morphologies of reference sample (Aref)—10 mm step and different trajectories, circular 1 pulsed, circular 2 continuous and straight continuous, are shown. In all three cases, the weld bead exhibits a mushroom shape and the same defectology (microcracks) is observed.
Figure 10 shows additional cross-sections analysis for alloy A1. Two types of defects are identified: microcracks and pores. Arrows have been used to mark the microcracks. In this case of A1 alloy–2.5 mm thickness, Figure 10b shows a crater end crack (CEC) region, or overlapping zone which is not fully representative of the whole sample.
As shown in Figure 11 and Figure 12, under straight and circular 2 continuous LBW conditions, respectively, samples with thicknesses of 10 mm and 5 mm, exhibit a mushroom-like shape welding morphology and partial penetration for all three alloys. Conversely, samples with a thickness of 2.5 mm exhibited a bowl-like shape and complete penetration.
Regarding the comparison of defects induced by hot cracking, smaller amounts of microcracks (yellow arrows) were detected in alloy A2 compared to the other alloys, Aref and A1.
In order to quantify the cracks detected in cross-section by metallographic analysis and compare cracking susceptibility between alloys, Table 7 and Table 8 presents the results of the characterization of the straight and circular 2 trajectories respectively, continuous LBW. “G” represents the total length of detected cracks in the cross-section, and “P” refers to the total area of pores. Therefore, it is clearly observed that as the plate thickness decreases, the crack length decreases, or the existence of cracks even disappears.

4. Discussion

The reported results show a clear improvement of alloy A2, especially for intermediate (5 mm) and thick (10 mm) steps, in the conditions that give rise to mushroom shape-like weld morphologies. These results were observed either by non-destructive tests (inductive thermography, FPI and X-ray analysis) and by detailed microstructural examination in cross-sections.

Alternatives to Reduce Hot Cracking

Previous studies [13,37,38] have observed that in cast Alloy 718, weld cracking in the heat-affected zone (HAZ) is caused by the liquation of secondary phases and precipitates. Therefore, the Nb-rich Laves phase must be minimized to reduce issues related to HAZ hot cracking [19,20], as the local Nb content significantly affects particle liquation and matrix melting, potentially influenced by Si. Additionally, S, P, and B play a role in suppressing the liquation temperature along the grain boundaries.
In this study, contrary to studies such as [20], it is clearly observed in both non-destructive and destructive analyses that the pre-HIP treatment does not help to reduce hot cracking.
As [5,39] mentioned, one of the strategies to prevent hot cracking is to increase the Ni content in order to reduce the presence of Laves phases and carbides. Alloys A1 and A2 designed in this study had a higher Ni content, of 55.8% and 55.6% wt pct, respectively, compared to the reference alloy Aref with 52.8% wt pct. Therefore, the amount of Laves phases and carbides was reduced in alloys A1 and A2 (Table 5), both in as-cast and after full thermal treatment conditions, as expected.
Despite the A1 alloy showing lower content of Laves phase and carbides in the as-cast and fully treated conditions, the A2 alloy had a comparable lower hot cracking susceptibility and better welding quality than the A1 alloy. This can be linked to the lower iron content due to the partial substitution of this alloying element by cobalt. The cobalt content was increased to 1.11% in the A2 alloy, compared to the A1 alloy (<0.10%), as reported in previous studies [6], in order to improve stress to rupture properties. However, in this study it had been demonstrated that this also had a collateral beneficial effect on weldability and this difference was crucial, as alloy A2 clearly showed less cracking compared to alloy A1, as seen in Table 7 and Table 8.
On the other hand, in A1 and A2, silicon was kept lower (0.11 wt pct) compared to the reference alloy, Aref (0.45 wt pct). Some studies [29,38] have investigated the impact of Si content in alloy 718, finding that the Laves phase content in as-cast states increased with higher Si content and slower solidification rates. In castings with higher Si contents (0.17% wt) and low solidification rates (0.52 °C/second), incipient melting of Laves phases led to an early reduction in ductility as determined by the hot ductility test, LBW Varestraint tests, which revealed increased fusion zone (FZ) cracking with significantly reduced heat-affected zone (HAZ) cracking on the surface [40]. Aligned with what was observed, for samples with low and conventional Si contents (0.051 and 0.11 wt pct), the loss of ductility was attributed to constitutional NbC liquation.
The composition of the regenerated FZ Laves phase corresponded to the continuous Laves phase film observed along HAZ microcracks in LBW bead on plate samples, which exhibited mushroom shapes typical of keyhole mode LBW. The HAZ cracking observed can be explained by a hot cracking mechanism involving the backfilling and infiltration of terminal liquid along the parent material grain boundaries at three-point intersections, where columnar grain boundaries cross the fusion line perpendicularly. This cracking mechanism was exacerbated by the nail or mushroom weld shapes and the narrow, columnar grain sizes of the castings [29].
Therefore, the described cracking mechanism was not influenced by the Si content, the effective dissolution of the Laves phase before welding, or the homogenization of segregation gradients through appropriate heat treatments prior to welding. This is because detrimental Laves phases form during the final solidification of the melt pool after welding, occurring at very rapid cooling rates that limit Nb segregation compared to slower cooling conditions.
In this work, it is also observed that the shape of the weld bead is crucial to prevent hot cracking. In accordance with this, if a bowl-shaped weld bead is achieved, hot cracking does not occur. However, when a mushroom-shaped weld bead is formed, cracking is observed in the heat-affected zone (HAZ) with an aspect that is fully consistent with the hot cracking mechanism described above, i.e., backfilling at three-point intersections. This study also notes that for the three alloys with full penetration in 2.5 mm thickness steps, the weld bead shape had bowl-like shape, whereas for partial penetration, the shape resembled a mushroom (see Figure 11 and Figure 12). In bowl-like shapes, three-point intersections between grain boundaries and perpendicular fusion line are not feasible and this explains the lack of microcracks in every alloy studied.
Nonetheless, one of the novelties of this research compared with older published articles has been the reduction in cracking and overall welding quality improvement observed in alloy A2 compared to alloy A1, despite both alloys having a mushroom-shaped weld bead morphology. As previously mentioned, the main difference between them is the Co content.

5. Conclusions

The main conclusions of the current work can be summarized as:
Combining superficial and volumetric non-destructive tests (inductive thermography, FPI and X-ray analysis) and detailed microstructural analysis in cross-sections, alloy A2 (55.6% Ni, 1.11% Co, 16.1% Fe) demonstrated a significant improvement in reducing pores and cracks in the heat-affected zone (HAZ) of LBW welds compared to Aref (chemical composition according to standard alloy 718) and A1 (55.8% Ni, 17.0% Fe). Alloy A2 effectively eliminated microcracks in circular and straight beads, and internal porosity in both partial and complete penetration LBW welds was reduced.
Consistent with what has been noted, the reduction in cracking and improvement in welding quality in alloy A2 relative to alloy A1, both exhibiting a mushroom-shaped weld bead morphology, could be attributed to the difference in cobalt (Co) content which replaced iron content, a chemical element that is known to contribute to the formation of Laves phase in alloy 718.
Pre-HIP treatment did not enhance weldability or joint quality in any of the three tested alloys, even though the goal was to dissolve detrimental Laves phase in base material before conducting LBW to avoid liquation cracking in HAZ.

Author Contributions

Conceptualization, L.G.-S. and F.S.; Methodology, L.G.-S., P.Á., I.H. and F.S.; Validation, P.Á.; Formal analysis, L.G.-S., P.Á. and F.S.; Investigation, L.G.-S., P.Á., I.H. and F.S.; Resources, I.H.; Data curation, L.G.-S., P.Á. and F.S.; Writing—original draft, L.G.-S.; Writing—review & editing, L.G.-S., P.Á., E.G.-C. and F.S.; Visualization, I.H.; Supervision, P.Á.; Funding acquisition, F.S. All authors have read and agreed to the published version of the manuscript.

Funding

This research was supported by the Industry Department of the Basque Government through the ELKARTEK-CEMAP (KK-2020/00047) and ELKARTEK-MINERVA (KK-2022/00082) projects.

Data Availability Statement

Data available on request due to restrictions. The data presented in this study are available on request from the corresponding author. The data are not publicly available due to some IPR and confidentiality issues.

Conflicts of Interest

The authors declare no conflicts of interest.

References

  1. Andersson, J. Weldability of Precipitation Hardening Superalloys: Influence of Microstructure. Ph.D. Thesis, Chalmers Tekniska Hogskola, Göteborg, Sweden, 2011. [Google Scholar]
  2. Donachie, M.J.; Donachie, S.J. Superalloys: A Technical Guide, 2nd ed.; ASM International: Novelty, OH, USA, 2002. [Google Scholar]
  3. DuPont, J.N.; John, N.; Lippold, J.C.; John, C.; Kiser, S.D.; Samuel, D. Welding Metallurgy and Weldability of Nickel-Base Alloys; John Wiley & Sons: Hoboken, NJ, USA, 2009. [Google Scholar]
  4. Andersson, J.; Raza, S.; Eliasson, A.; Surreddi, K.B. Solidification of Alloy 718, ATI 718Plus and Waspaloy. In Proceedings of the 8th International Symposium on Superalloy, Pittsburgh, PA, USA, 28 September–1 October 2014; Volume 718, pp. 181–192. [Google Scholar] [CrossRef]
  5. Frank, R.B.; Roberts, C.G.; Zhang, J. Effect of Nickel Content on Delta Solvus Temperature and Mechanical Properties of Alloy 718. In Superalloy 718 and Derivatives; John Wiley & Sons: Hoboken, NJ, USA, 2010; pp. 724–736. [Google Scholar] [CrossRef]
  6. Chang, K.-M.; Nahm, A.H. Rene 220: 100 F Improvement Over Alloy 718. In Superalloy 718-Metallurgy and Applications; Loria, E.A., Ed.; The Minerals, Metals & Materials Society: Evendale, OH, USA, 1989; pp. 631–646. [Google Scholar] [CrossRef]
  7. DuPont, J.N.; Notis, M.R.; Marder, A.R.; Robino, C.V.; Michael, J.R. Solidification of Nb-Bearing Superalloys: Part I. Reaction Sequences. Metall. Mater. Trans. A 1998, 29, 2785–2796. [Google Scholar] [CrossRef]
  8. Guo, H.; Chaturvedi, M.C.; Richards, N.L. Effect of Boron Concentration and Grain Size on Weld Heat Affected Zone Microfissuring in Inconel 718 Base Superalloys. Sci. Technol. Weld. Join. 1999, 4, 257–264. [Google Scholar] [CrossRef]
  9. Richards, N.L.; Chaturvedi, M.C. Effect of Minor Elements on Weldability of Nickel Base Superalloys. Int. Mater. Rev. 2000, 45, 109–129. [Google Scholar] [CrossRef]
  10. Kelly, T.J. Elemental Effects on Cast 718 Weldability Boron, an Essential Element in Alloy 718, Appears to Cause the Most Detriment to Weldability, Creating a Dilemma for Improvement. Weld. Res. Suppl. 1989, 68, 44–51. [Google Scholar]
  11. Swalin, R.A.; Martin, A.; Olson, R. Diffusion of Magnesium, Silicon, and Molybdenum in Nickel. Jom 1957, 9, 936–939. [Google Scholar] [CrossRef]
  12. Dong, J.X.; Xie, X.S.; Thompson, R.G. The Influence of Sulfur on Stress-Rupture Fracture in Inconel 718 Superalloys. Metall. Mater. Trans. A 2000, 31, 2135–2144. [Google Scholar] [CrossRef]
  13. Singh, S.; Andersson, J. Hot Cracking in Cast Alloy 718. Sci. Technol. Weld. Join. 2018, 23, 568–574. [Google Scholar] [CrossRef]
  14. Ojo, O.A.; Richards, N.L. Heat-Affected Zone Cracking in Welded Nickel Superalloys. In Welding and Joining of Aerospace Materials; Elsevier: Amsterdam, The Netherlands, 2012; pp. 142–177. [Google Scholar]
  15. Oshobe, O.E. Fiber Laser Welding of Nickel-Based Superalloy Inconel 718; University of Manitoba: Winnipeg, MB, Canada, 2012. [Google Scholar]
  16. Khan, A.; Hilton, P.; Blackburn, J.; Allen, C. Meeting Weld Quality Criteria When Laser Welding Ni-Based Alloy 718. In Proceedings of the International Congress on Applications of Lasers & Electro-Optics, Anaheim, CA, USA, 23–27 September 2012; pp. 549–557. [Google Scholar]
  17. Huang, X. A Microstructural Study of Heat Affected Zone Microfissuring of Electron Beam Welds in Cast Alloy 718; Department of Mechanical and Industrial Engineering: Winnipeg, MA, Canada, 1994. [Google Scholar]
  18. Zhang, Y.; Li, J. Characterization of the Microstructure Evolution and Microsegregation in a Ni-Based Superalloy under Super-High Thermal Gradient Directional Solidification. Mater. Trans. 2012, 53, 1910–1914. [Google Scholar] [CrossRef]
  19. Nishimoto, K. The Factors Affecting HAZ Crack Susceptibility in the Laser Weld-Study on Weldability of Cast Alloy 718 (Report 4). Quar. J. JWS 2001, 19, 308–316. [Google Scholar]
  20. Woo, I.; Nishimoto, K.; Tanaka, K.; Shirai, M. Effect of Grain Size on Heat Affected Zone Cracking Susceptibility. Study of Weldability of Inconel 718 Cast Alloy (2nd Report). Weld. Int. 2000, 14, 514–522. [Google Scholar] [CrossRef]
  21. Schirra, J.J.; Caless, R.H.; Hatala, R.W. The Effect of Laves Phase on The Mechanical Properties of Wrought and Cast + HIP Inconel 718. Miner. Met. Mater. Soc. 1991, 375–388. [Google Scholar]
  22. Muralidharan, B.G.; Shankar, V.; Gill, T.P.S. Weldability of Inconel 718—A Review; Indira Gandhi Centre for Atomic Research: Kalpakkam, India, 1996. [Google Scholar]
  23. Tharappel, J.T.; Babu, J. Welding Processes for Inconel 718—A Brief Review. IOP Conf. Ser. Mater. Sci. Eng. 2018, 330, 012082. [Google Scholar] [CrossRef]
  24. Sonar, T.; Balasubramanian, V.; Malarvizhi, S.; Venkateswaran, T.; Sivakumar, D. An Overview on Welding of Inconel 718 Alloy—Effect of Welding Processes on Microstructural Evolution and Mechanical Properties of Joints. Mater. Charact. 2021, 174, 110997. [Google Scholar] [CrossRef]
  25. Bai, Y.; Lu, Q.; Ren, X.; Yan, H.; Zhang, P. Study of Inconel 718 Welded by Bead-on-Plate Laser Welding under High-Frequency Micro-Vibration Condition. Metals 2019, 9, 1335. [Google Scholar] [CrossRef]
  26. Odabaci, A.; Ünlü, N.I.; Göller, G.I.; Eruslu, M.N.I.I. A Study on Laser Beam Welding (LBW) Technique: Effect of Heat Input on the Microstructural Evolution of Superalloy Inconel 718. Metall. Mater. Trans. A 2010, 41, 2357–2365. [Google Scholar] [CrossRef]
  27. Alvarez, P.; Vázquez, L.; Ruiz, N.; Rodríguez, P.; Magaña, A.; Niklas, A.; Santos, F. Comparison of Hot Cracking Susceptibility of Tig and Laser Beam Welded Alloy 718 by Varestraint Testing. Metals 2019, 9, 958. [Google Scholar] [CrossRef]
  28. Kuo, T.-Y.; Jeng, S.-L. Porosity Reduction in Nd–YAG Laser Welding of Stainless Steel and Inconel Alloy by Using a Pulsed Wave. J. Phys. D Appl. Phys. 2005, 38, 722. [Google Scholar] [CrossRef]
  29. Álvarez, P.; Cobos, A.; Vázquez, L.; Ruiz, N.; Rodríguez, P.P.; Magaña, A.; Niklas, A.; Santos, F. Weldability Evaluation of Alloy 718 Investment Castings with Different Si Contents and Thermal Stories and Hot Cracking Mechanism in Their Laser Beam Welds. Metals 2021, 11, 402. [Google Scholar] [CrossRef]
  30. Raza, T.; Andersson, J.; Svensson, L.E. Varestraint Testing of Selective Laser Additive Manufactured Alloy 718—Influence of Grain Orientation. Metals 2019, 9, 1113. [Google Scholar] [CrossRef]
  31. Janaki Ram, G.D.; Venugopal Reddy, A.; Prasad Rao, K.; Madhusudhan Reddy, G. Control of Laves Phase in Inconel 718 GTA Welds with Current Pulsing. Sci. Technol. Weld. Join. 2013, 9, 390–398. [Google Scholar] [CrossRef]
  32. Alvarez, P.; Vázquez, L.; García-Riesco, P.M.; Rodríguez, P.P.; Magaña, A.; Santos, F. A Simplified Varestraint Test for Analyzing Weldability of Fe-Ni Based Superalloys. In Proceedings of the 9th International Symposium on Superalloy 718 & Derivatives: Energy, Aerospace, and Industrial Applications, Pittsburgh, PA, USA, 3–6 June 2018; pp. 849–865. [Google Scholar]
  33. Andersson, J.; Jacobsson, J.; Lundin, C. A Historical Perspective on Varestraint Testing and the Importance of Testing Parameters. In Cracking Phenomena in Welds IV; Springer: Berlin/Heidelberg, Germany, 2016; pp. 3–23. [Google Scholar]
  34. Rösler, J.; Hentrich, T.; Gehrmann, B. On the Development Concept for a New 718-Type Superalloy with Improved Temperature Capability. Metals 2019, 9, 1130. [Google Scholar] [CrossRef]
  35. Gorostegui Colinas, E.; Muniategui, A.; López de Uralde, P.; Gorosmendi, I.; Hériz, B.; Sabalza, X. A Novel Automatic Defect Detection Method for Electron Beam Welded Inconel 718 Components Using Inductive Thermography. In Proceedings of the 14th International Conference on Quantitative Infrared Thermography, Berlin, Germany, 18 July 2018. [Google Scholar]
  36. Urtasun, B.; Andonegui, I.; Gorostegui-Colinas, E. Phase-Shifted Imaging on Multi-Directional Induction Thermography. Sci. Rep. 2023, 13, 17540. [Google Scholar] [CrossRef] [PubMed]
  37. Singh, S.; Hanning, F.; Andersson, J. Influence of Hot Isostatic Pressing on the Hot Ductility of Cast Alloy 718: The Effect of Niobium and Minor Elements on the Liquation Mechanism. Metall. Mater. Trans. A Phys. Metall. Mater. Sci. 2020, 51, 6248–6257. [Google Scholar] [CrossRef]
  38. Niklas, A.; Santos, F.; Gonzalez-Martinez, R.; Rodríguez, P.P.; Bernal, D.; Cobos, A.; Vázquez, L.; Álvarez, P. Effects of Different Si Content and Thermal Stories on the Secondary Phase Formation, Hot Ductility, and Stress Rupture Properties of Alloy 718 Investment Castings. Metall. Mater. Trans. A Phys. Metall. Mater. Sci. 2023, 54, 2670–2688. [Google Scholar] [CrossRef]
  39. Allen, C.; Shaw-Edwards, R.; Nijdam, T. Nickel-Containing Superalloy Laser Weld Qualities and Properties. J. Laser Appl. 2015, 27, S29001. [Google Scholar] [CrossRef]
  40. Thompson, R.; Genculu, S. Microstructural Evolution in the HAZ of Inconel 718 and Correlation with the Hot Ductility Test. Weld. J. 1983, 62, 337s–345s. [Google Scholar] [CrossRef]
Figure 1. Thermo-Calc analysis for the three alloys: the reference alloy Aref (a) and the new ones, A1 (b) and A2 (c).
Metals 14 01067 g001
Figure 2. Plate welded using the bead on plate test. Identification of trajectories and steps.
Metals 14 01067 g002
Figure 3. Inductive thermography setup and parameters.
Metals 14 01067 g003
Figure 4. Criteria defined for defect identification.
Metals 14 01067 g004
Figure 5. Cuts performed for a cross-sectional analysis and A or B zones identified.
Metals 14 01067 g005
Figure 6. SEM images showing Laves phase and carbides in Aref and A1 Alloys, as-cast state, step 10 mm.
Metals 14 01067 g006
Figure 7. Comparison of three technologies and thicknesses (a) 10 mm, (b) 5 mm and (c) 2.5 mm, in the reference sample Aref, circular 2 continuous LBW strategy.
Metals 14 01067 g007
Figure 8. Comparison of defectology in sample A2, circular 2 continuous LBW trajectory, (a) with and (b) without pre-HIP.
Metals 14 01067 g008
Figure 9. Weld bead morphology. reference sample (Aref) cross sections with different trajectories: (a) Circular 1 pulsed, (b) Circular 2 continuous and (c) Straight continuous LBW welds in 10 mm step.
Metals 14 01067 g009
Figure 10. Cross-sections analysis in (a) zone A and (b) Zone B or overlapping zone, sample A1, circular 2–continuous LBW trajectory.
Metals 14 01067 g010
Figure 11. Welding morphology and penetration analysis, straight LBW continuous for the alloys (a) Aref, (b) A1 and (c) A2.
Metals 14 01067 g011
Figure 12. Welding morphology and penetration analysis, circle 2-LBW continuous for the alloys (a) Aref, (b) A1 and (c) A2.
Metals 14 01067 g012
Table 1. Chemical composition of wrought and investment casting alloy 718 in weight %.
Ref.CSiSCoCrMoCuMnPTiAlBNi 1Nb + TaFeMg
Aref0.0460.45<0.0050.09917.63.030.016<0.050<0.0100.660.230.002552.84.9320.00.0012
A10.0580.11<0.005<0.1017.62.820.015<0.050<0.0100.920.620.001955.85.0017.00.0012
A20.0660.11<0.0051.1117.62.830.015<0.0500.0030.930.620.002155.65.0816.10.0012
UNE EN 10302:2010 Standard
INCO 7180.02–0.080.350.0151.017.0–21.02.8–3.30.300.350.0150.6–1.20.3–0.70.002–0.00650.0–55.04.7–5.5Bal.-
1 The Ni content has been determined by difference.
Table 2. Thermo-Calc phase calculations for Aref, A1 and A2 alloys.
AlloyPhases [%-Mass]
LavesMCSigmaDelta
Aref1.790.430.612.09
A10.980.620.41.11
A21.130.610.441.32
Table 3. Laser welding general parameters used in the bead on plate weldability tests.
General Parameters
TRUDISK 6002
400-micron fibre diameter
BEO D70 (200:200)
Vweld: 0.5 m/min (8.33 mm/s)
Spot size: 0.8 mm
Ar Camera (30 l/min)
Shot blasting followed by alcohol cleaning
Table 4. Selected welding parameters for continuous and pulsed LBW.
LBW CurveWs (mm/s)Ppeak 2 (W)Pbase 2 (W)Frequency (Hz)Energy (J/mm)Energy
Density (J/mm3)
Circular 1 Pulsed8.333166158278.7285567
Circular 2 Continuous8.3323002300-276549
Straight Continuous8.3323002300-276549
2 Ppeak and Pbase stand for maximum and minimum power of the pulsed curve.
Table 5. Analysis of Laves phases and carbides (% area) in the as-cast state.
Aref A1 A2
Step 10 mm5 mm2.5 mm10 mm5 mm3 mm10 mm5 mm2.5 mm
As-Cast3.83.731.51.31.11.61.41.1
Pre-HIP2.62.41.70.980.880.771.11.00.8
Pre-HIP + HIP + S1.81.91.20.30.30.40.40.40.4
HIP + S1.71.81.00.30.40.20.50.40.4
Table 6. Defectology analysis from FPI and X-ray tests for the circular 2 LBW continuous trajectory across the three thickness steps.
Circular 2
Continuous LBW
Step/Thickness
10 mm5 mm2.5 mm
FPIX-rayFPIX-rayFPIX-ray
Aref334615
A2000202
Table 7. Results of defects in the straight beads of different steps (G: mm and P: mm2).
Step/
Thickness
ArefA1A2PreHIP Aref
10 mm G: 0G: 0.74G: 0G: 1.14
P: 0.20P: 0.32P: 0.19P: 0.39
5 mm G: 0.37G: 0.25G: 0G: 0.37
P: 0.16P: 0P: 0.18P: 0.08
2.5 mmG: 0 G: 0 G: 0G: 0
Table 8. Results of defects in the circular 2 beads of different steps (G: mm and P: mm2).
Step/
Thickness
ArefA1A2PreHIP Aref
10 mm G: 0.31G: 0G: 0.26G: 1.14
P: 0.31P: 0.17P: 0.08P: 0.39
5 mm G: 0.29G: 0.68G: 0G: 0
P: 0P: 0.27P: 0P: 0
2.5 mmG: 0 G: 0 G: 0G: 0
Disclaimer/Publisher’s Note: The statements, opinions and data contained in all publications are solely those of the individual author(s) and contributor(s) and not of MDPI and/or the editor(s). MDPI and/or the editor(s) disclaim responsibility for any injury to people or property resulting from any ideas, methods, instructions or products referred to in the content.

