Article

Simulation Study of Crystalline Al2O3 Thin Films Prepared at Low Temperatures: Effect of Deposition Temperature and Biasing Voltage

1
School of Materials Science and Chemical Engineering, Harbin University of Science and Technology, Harbin 150080, China
2
State Key Laboratory of Advanced Welding and Joining, Harbin Institute of Technology, Harbin 150006, China
3
Key Laboratory of Superlight Material and Surface Technology of Ministry of Education, College of Material Science and Chemical Engineering, Harbin Engineering University, Harbin 150001, China
*
Author to whom correspondence should be addressed.
Metals 2024, 14(8), 875; https://doi.org/10.3390/met14080875
Submission received: 28 June 2024 / Revised: 27 July 2024 / Accepted: 27 July 2024 / Published: 29 July 2024

Abstract

In this paper, classical molecular dynamics simulations were used to explore the impact of deposition temperature and bias voltage on the growth of Al2O3 thin films through magnetron sputtering. Ion energy distributions were derived from plasma mass spectrometer measurements. The fluxes of deposited particles (Ar+, Al+, and O−) were categorized into low, medium, and high energies, and the results show that the films are dominated by amorphous Al2O3 at low incident energies without applying bias. As the deposition temperature increased, the crystallinity of the films also increased, with the crystals predominantly consisting of γ-Al2O3. The crystal content of the deposited films increased when biased with −20 V compared to when no bias was applied. Crystalline films were successfully obtained at a deposition temperature of 773 K with a −20 V bias. When biased with −40 V, crystals could be obtained at a lower deposition temperature of 573 K. Increasing the bias enables the particles to have higher energy to overcome the nucleation barrier of the crystallization process, leading to a greater degree of film crystallization. At this stage, the average bond length between Al-O is measured to be approximately 1.89 Å to 1.91 Å, closely resembling that of the crystal.

1. Introduction

Alumina (Al2O3) is commonly used in industrial production and other areas, including optics, electronics, catalysis, and coatings, due to its superior hardness, remarkable wear resistance, exceptional optical transparency, and thermal stability [1,2,3]. In addition to stable α-Al2O3 (corundum), it contains various transition phases, such as γ-, κ-, and δ- [4]. Among the various phases, the geometrical arrangement of ions in the amorphous Al2O3 structure is more similar to γ-Al2O3 than to other phases. Consequently, upon heating, amorphous Al2O3 films undergo crystallization into the γ-phase, which then transforms into the α-phase at elevated temperatures [5]. Therefore, it is possible to synthesize γ-Al2O3 crystals at low temperatures. Moreover, γ-Al2O3 plays a crucial role in industrial production as both a catalyst [6,7] and a protective coating material [8,9].
High power impulse magnetron sputtering (HiPIMS), among the various ionized physical vapor deposition (PVD) techniques, has garnered substantial attention over recent decades [10]. HiPIMS was developed in 1999 by Kouznetsov et al. [11]. In particular, HiPIMS has a low duty cycle (<5%) and low repetition frequency (50–500 Hz). This results in an elevated peak power density of the HiPIMS discharge, exceeding 0.5 kW·cm−2, leading to an increased dissociation rate of particles during sputtering. As a result, these properties benefit the modulation of film microstructure and properties. Recently, Ferreira et al. [12] investigated the effect of depositing Al2O3 thin films at different sputtering parameters by HiPIMS and medium frequency (MF). The results show that film quality is correlated with the energy of the deposition process (i.e., higher energy leads to higher film density and refractive index).
Recent studies have conducted various experiments and simulations to investigate the production of Al2O3 thin films through magnetron sputtering. These studies also aim to analyze how deposition parameters influence the structure and properties of the films. The focus is often on understanding the impact of factors such as particle energy distribution and deposition temperature on the films’ characteristics. The factors affecting the growth of Al2O3 films can be attributed to two aspects. On the one hand, Al2O3 thin films, in various phases encompassing a broad spectrum of applications, can be fabricated by adjusting external parameters such as sputtering power [13], bias voltage [14], and heating temperature [12]. On the other hand, film growth is actually influenced by internal factors, including bombardment particle content flux [15], energy flux composition [16], and surface temperature [17]. In Ref. [18], the structural transformation of Al2O3 thin films under irradiation with various energy fields was investigated. The study revealed that thin films experience an amorphous transition to γ-Al2O3 when assisted by an energy field at 300 °C. Current research has focused on simulating the production of thin films through magnetron sputtering. In Ref. [19], classical molecular dynamics (MD) were employed to systematically describe the growth of Al2O3 under different sputtering parameters. The results show that there is an optimal crystallization temperature for the growth of Al2O3 thin films that is influenced by the deposition energy and that low deposition energies are detrimental to the crystallization of the films. Pham et al. [20] explored the formation of Cux(FeAlCr)100-x thin films on Ni(001) substrates using MD, where an elevation in deposition temperature led to a reduction in roughness but a decrease in the percentage of thin film crystallization when the film structure was Cu25Fe25Al25Cr25.
In this paper, molecular dynamics were used to analyze the influence of deposition parameters, in particular the deposition temperature and bias voltage (Vb) on the structure of Al2O3 thin films. The crystal transformation (radial distribution function and coordination number), crystal type (bond statistics), and surface roughness in thin films are discussed based on the plasma mass spectrometer test results to classify the energy flux of the incident particles, and the influence law of sputtering parameters on the transformation of the film crystal structure during magnetron sputtering is explored to explain the low-temperature crystallization transformation mechanism of Al2O3 thin films.

2. Method

2.1. Simulation Method

The MD simulations in this paper utilize the LAMMPS (Large Scale Atomic/Molecular Massively Parallel, version-2 Aug 2023, Sandia National Laboratories, Albuquerque, NM, USA) [21] open-source code. The model consists of two parts: α-Al2O3 substrate and deposited Al and O particles. Figure 1a shows a schematic diagram of the cell of α-Al2O3, with Al particles in grey and O particles in red. The type of Al2O3 cell is a rhombic cell and the crystal system is tripartite. Following Sigumonrong’s recommendation [22], the crystal system was then transformed into an orthorhombic system with its z-axis aligned along the (001) direction. The substrate was obtained by cell expansion of an orthorhombic crystal system with a substrate size of 33.3 Å × 28.8 Å × 13.2 Å and a total number of substrate atoms of 1440 (Figure 1b). The substrate was partitioned into three regions: the bottom three atomic layers were fixed to prevent movement during deposition; the middle ten atomic layers were temperature controlled using the NVT ensemble to maintain a constant temperature; and the top five atomic layers were free layers, employing the NVE ensemble for heat transfer and energy exchange with the deposited particles. Furthermore, periodic boundary conditions were applied to x- and y-axes and the non-periodic boundary condition was applied to z-axes. The Ar particle incidence and elimination regions were set at 40~45 Å and 45~50 Å from the substrate surface, respectively. The generation regions of Al and O particles were set at 50~60 Å from the substrate surface. The boundary in the z-direction of the model was set to be the reflective layer of Al and O particles. The time step was set to 1 fs and the following rules were followed during deposition:
(1)
The substrate (α-Al2O3) was subjected to a “thermalization campaign” of 1 ps at a given temperature of 1300 K (using Nose-Hoover temperature control) before growth was initiated.
(2)
Random generation of new atoms was at a rate consistent with the distribution of energy in the deposition particle generation zone, using the NVE ensemble.
(3)
Generation of atoms was followed by 5 ps collisional deposition for heat exchange with the substrate and energy dissipation.
(4)
The deposition was followed by a 1 ps thermalization run (microcanonical ensemble) to remove the remaining energy.
(5)
Ar particles were inserted for collision rebound during Al, O deposition.
(6)
There was a return to step (2) and the process was repeated. In order to show whether crystallization can occur, steps (2–6) were cycled until the number of particles deposited was not less than 2200 for Al and O, and not less than 320 for Ar particles for sputtering collisions (based on the ratio of the number of O to Ar in the mass spectrometry data).
It is widely recognized that the selection of interaction potential plays a crucial role in ensuring the accuracy of classical MD simulations. For thin film growth, it has been shown [19,23] that the role of Coulomb forces needs to be taken into account (remote ordering of atoms requires interactions between remote atoms). In this paper, the choice of the potential function for alumina film deposition is based on the partial-charge (Al+1.4175, O−0.945) Buckingham interaction potential (U = Ae−r/ρ − Cr−6 (r < rc), where ρ is an ionic-pair dependent length parameter, and rc is the cutoff on both terms) proposed in reference [24], which has been proved [19,23] to meet the requirements of this paper, and the parameters are shown in Table 1. The non-film-forming Ar+ is only involved in the bombardment of the film; therefore, the Lennard–Jones (L-J) potential was chosen with the parameters shown in Table 2.
In the process of high-power pulsed magnetron sputtering deposition, the applied bias voltage is positively correlated with the particle energy hitting the substrate. Bubenzer [27] proposed an equation for the relationship between bias voltage and particle energy:
E = K V b i a s p m ; 0 m 1
where V b i a s   denotes the applied bias amplitude, K is a constant, p is the discharge voltage, and m is a coefficient. As described in Equation (1), the energy of the particles impacting the substrate is proportional to the amplitude of the applied bias, while ensuring that the other parameters remain constant. However, in this paper, O is used as a simulation object to have a deceleration effect under negative bias conditions. Therefore, the effect of low- and medium-energy O that disappears due to bias on the film is ignored, according to Table 3.

2.2. Calculation and Analysis Methods

The radial distribution function g(r) describes the ratio of ρ(r), the average atomic number density in a spherical shell with a distance to the atom of r and a thickness of Δr, to the average atomic number density of the whole system, ρ0:
g r = ρ r ρ 0 = V i = 1 N N i r 4 π r 2 r N 2
where V is the volume of the system, N is the number of atoms in the system, and Ni(r) is the number of atoms in the spherical shell at a distance r from atom i.
The coordination number refers to the number of atoms within a specific range (first nearest neighbor) surrounding a given atom, serving as a tool for structural analysis. It offers insight into the atomic density of the atom within its immediate surroundings. This study utilizes the Al-O cutoff radius as the designated distance limit. The quantity of O atoms present around the Al atom within this cutoff distance plays a crucial role in determining the structure and indicating the level of crystal crystallization. Al atoms exhibiting a coordination number of 6 are classified as octahedral structures, while those with a coordination number of 4 are identified as tetrahedral structures.
Common neighbor analysis (CNA) [28] was used to describe the bonding correlations between neighboring atoms. CNA uses three statistical parameters (jkl): where j is the number of co-neighbors of two bonded atoms; k is the number of bonds between these neighboring atoms; and l is the maximum length consisting of these bonds. The structural characteristics of FCC are 6 ternary 421 per atom, while the structural characteristics of HCP are a combination of 3 ternary 421 and 3 ternary 422 per atom.
For deposition, surface roughness is an important parameter. On the atomic scale, it means the measurement of the maximum and minimum average surface height somewhere on the surface. The root mean square roughness, Rq, is calculated as follows:
R q = i = 1 N z i z ¯ 2 N
where N is the number of atoms on the surface of the film, z ¯ is the average height of surface atoms, and z i is the height of the ith atom.

2.3. Sample Preparation and Characterization

Al2O3 films were deposited on (100) single-crystal silicon wafers using a twin-target reactive high-power impulse magnetron sputtering system. The system was equipped with two identical Al targets, and during each discharge cycle, both target electrodes were converted once. This configuration allows the two targets to alternately function as the anode and cathode. The average power applied to the target in each pulse cycle was 180 W. The pulse frequency and width of the power supply were 2000 Hz and 40 µs, respectively. The target material was a 99.999% pure round aluminum target with a 100 mm diameter and 6 mm thickness. The angle between the target and the central axis of the sample stage was set at 45°, with a distance of 100 mm. Before deposition, the single-crystal silicon (100) substrate was continuously ultrasonically cleaned with alcohol and petroleum ether for 10 min each for later use. The vacuum chamber background vacuum was 1.0 × 10⁻³ Pa. During the deposition process, the argon flow rate was 50 sccm, and the oxygen flow rate was 14 sccm. The working pressure and deposition time were 0.2 Pa and 3 h, respectively. A resistance heater was used to regulate the substrate temperature, which was measured with a k-type thermocouple. The substrate bias and temperature parameters are shown in Table 3.
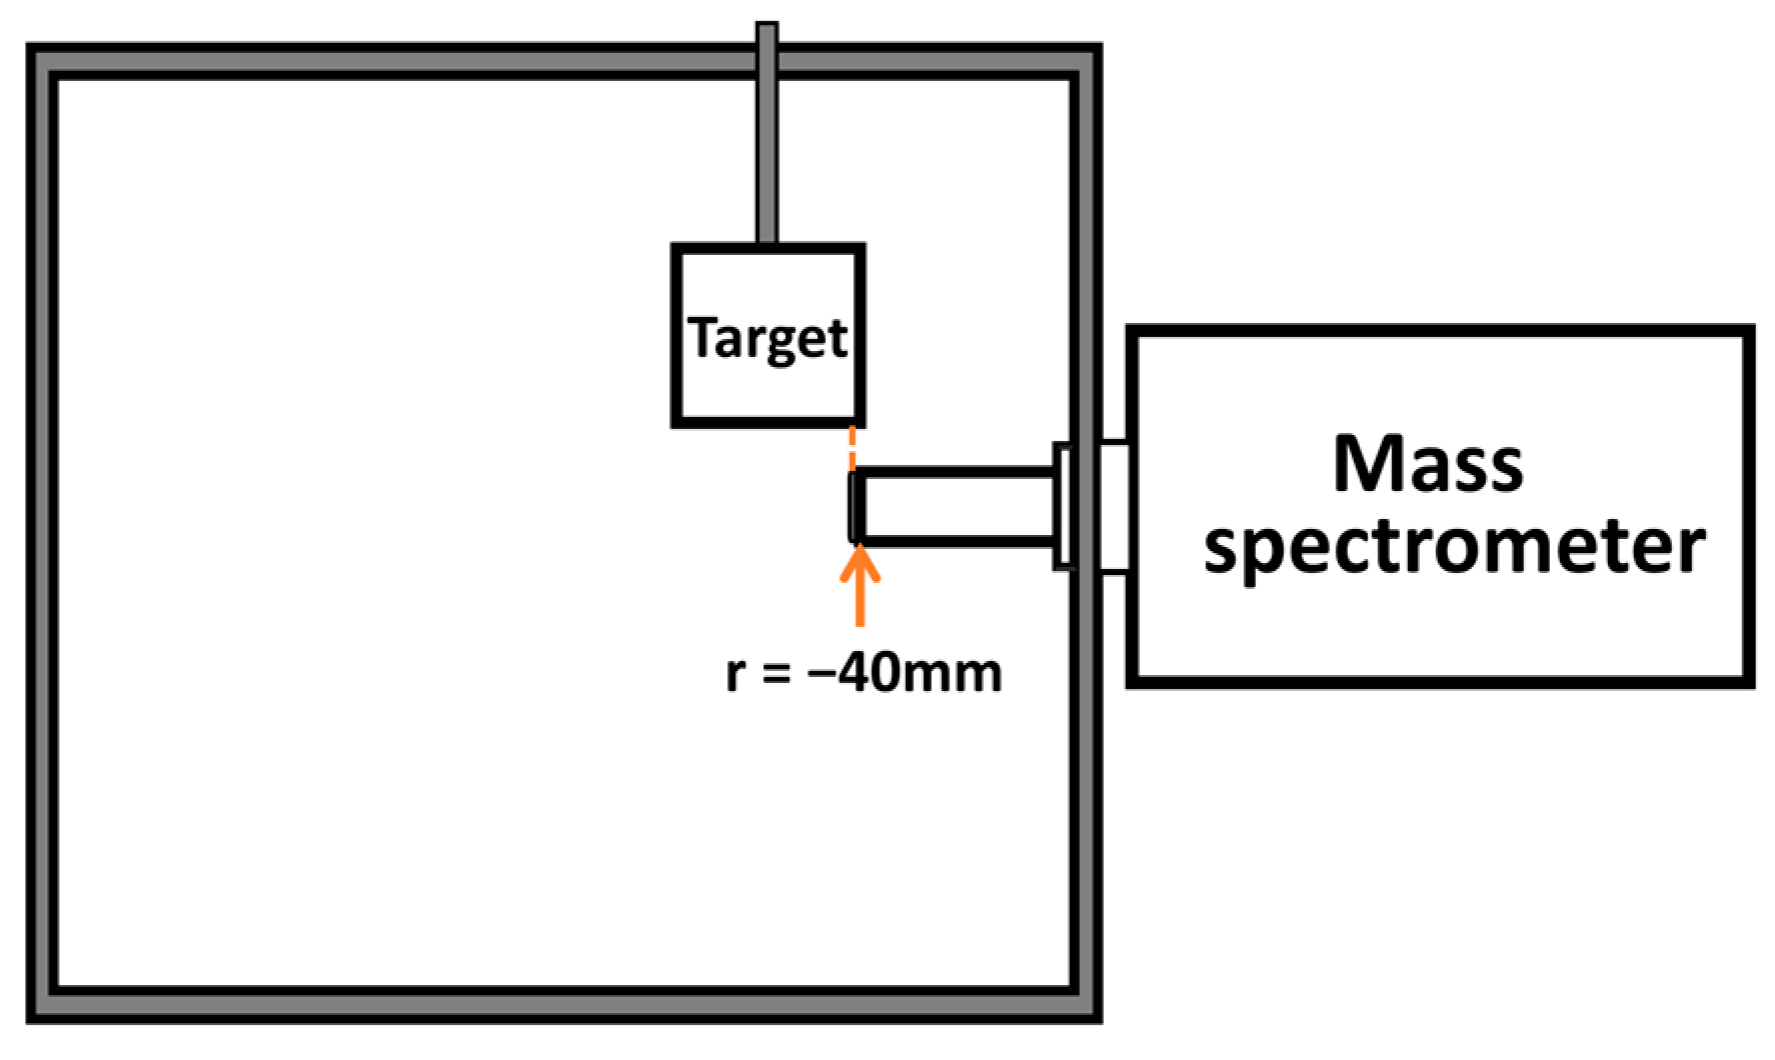
The mass spectrometer, model PSM003 from Hiden Analytical in the UK (PSM003, Hiden Analytical, Warrington, UK), was connected to the vacuum chamber to obtain an Ion Energy Distribution Function (IEDF). The connection was made through the side transfer port of the vacuum chamber, with the front detector positioned at a distance of r = −40 mm below the target, as illustrated in Figure 2. Prior to testing, the mass spectrometer was evacuated to a pressure below 2 × 10⁻⁵ Pa using a vacuum pump. To prevent counter saturation, the isotope 36Ar+ of Argon, with relatively low content, was used to calibrate the electrostatic lens system of the mass spectrometer for optimal sensitivity. The energy sweep range during testing was set from 0–80 eV in increments of 0.1 V, with a test time of 100 ms for each energy step to maximize signal strength.
The crystal structure of the deposited thin films was measured by Empyrean X-ray diffraction (XRD) produced by Panalytical in the Netherlands (GIXRD; Empyrean, PANalytical, Almelo, Holland). The device used a Cu target (λ = 0.15418 nm) as the X-ray source, and the operating voltage and current were set to 40 kV and 40 mA, respectively. Since the sample in this study was a thin film, the grazing incidence method (GIXRD) was used to set the incidence angle to 1°.

3. Results

Based on the scanning results of the mass spectrometer, the positive ions 36Ar+ and 27Al+ and the negative ion 16O were selected for the simulation study, and the results obtained are shown in Figure 3a–c.
The categorization of 27Al+ and 16O ions into high, medium, and low energy levels is determined by Breilmann’s division of ion energy distribution functions (IEDFs) [29]. The contribution of 36Ar+ was averaged across the IEDFs due to its minimal involvement in film formation and low concentration. During simulation, the average value and proportion of each energy interval for 27Al+ and 16O ions were calculated, and they are detailed in Table 4.
The growth of the films was investigated at different bias voltages (0 V, −20 V, and −40 V) in the range of substrate temperature T = 300 K~773 K (Figure 4). When no bias is applied (Figure 4a), the rise in temperature does not significantly impact the film structure (300–673 K), which remains amorphous. As the temperature nears 773 K, some regularity in the atomic arrangement at the film’s interface starts to appear, although most atoms in the film remain irregularly arranged. This is due to the low energy of the ions upon impact, with the substrate temperature increase unable to compensate for the lack of particle energy. Consequently, Al atoms are unable to move to the octahedral positions typical of crystalline Al2O3 (similarly for O). When a −20 V bias voltage is applied (Figure 4b), the film maintains an amorphous structure at 300 K−673 K. In contrast, the film structure shows a more orderly atomic arrangement at T = 773 K compared to that shown in Figure 4a. This suggests the development of a distinct crystalline structure in the film, promoting the formation of a continuous crystalline film. Since the negative bias is able to attract positive ions, this increases the energy for particles to bombard the substrate. When these high-energy particles bombard the surface of the substrate, they transfer energy to the substrate, which creates additional temperature on the substrate surface. The increase in temperature promotes the migration of particles, which increases the degree of crystallization of the Al2O3 film. Figure 4c illustrates the atomic structure of Al2O3 thin films with a bias increased to −40 V. The continuous growth of crystalline alumina films is observed at deposition temperatures near T = 573 K. Essentially, the deposition temperature required for the formation of continuously grown films decreases with an increase in bias. However, excessively high temperatures (T = 773 K) can lead to damage to the film structure. This is attributed to the substrate’s high temperature causing excessive particle migration, leading to defects accumulating faster than they can be repaired.
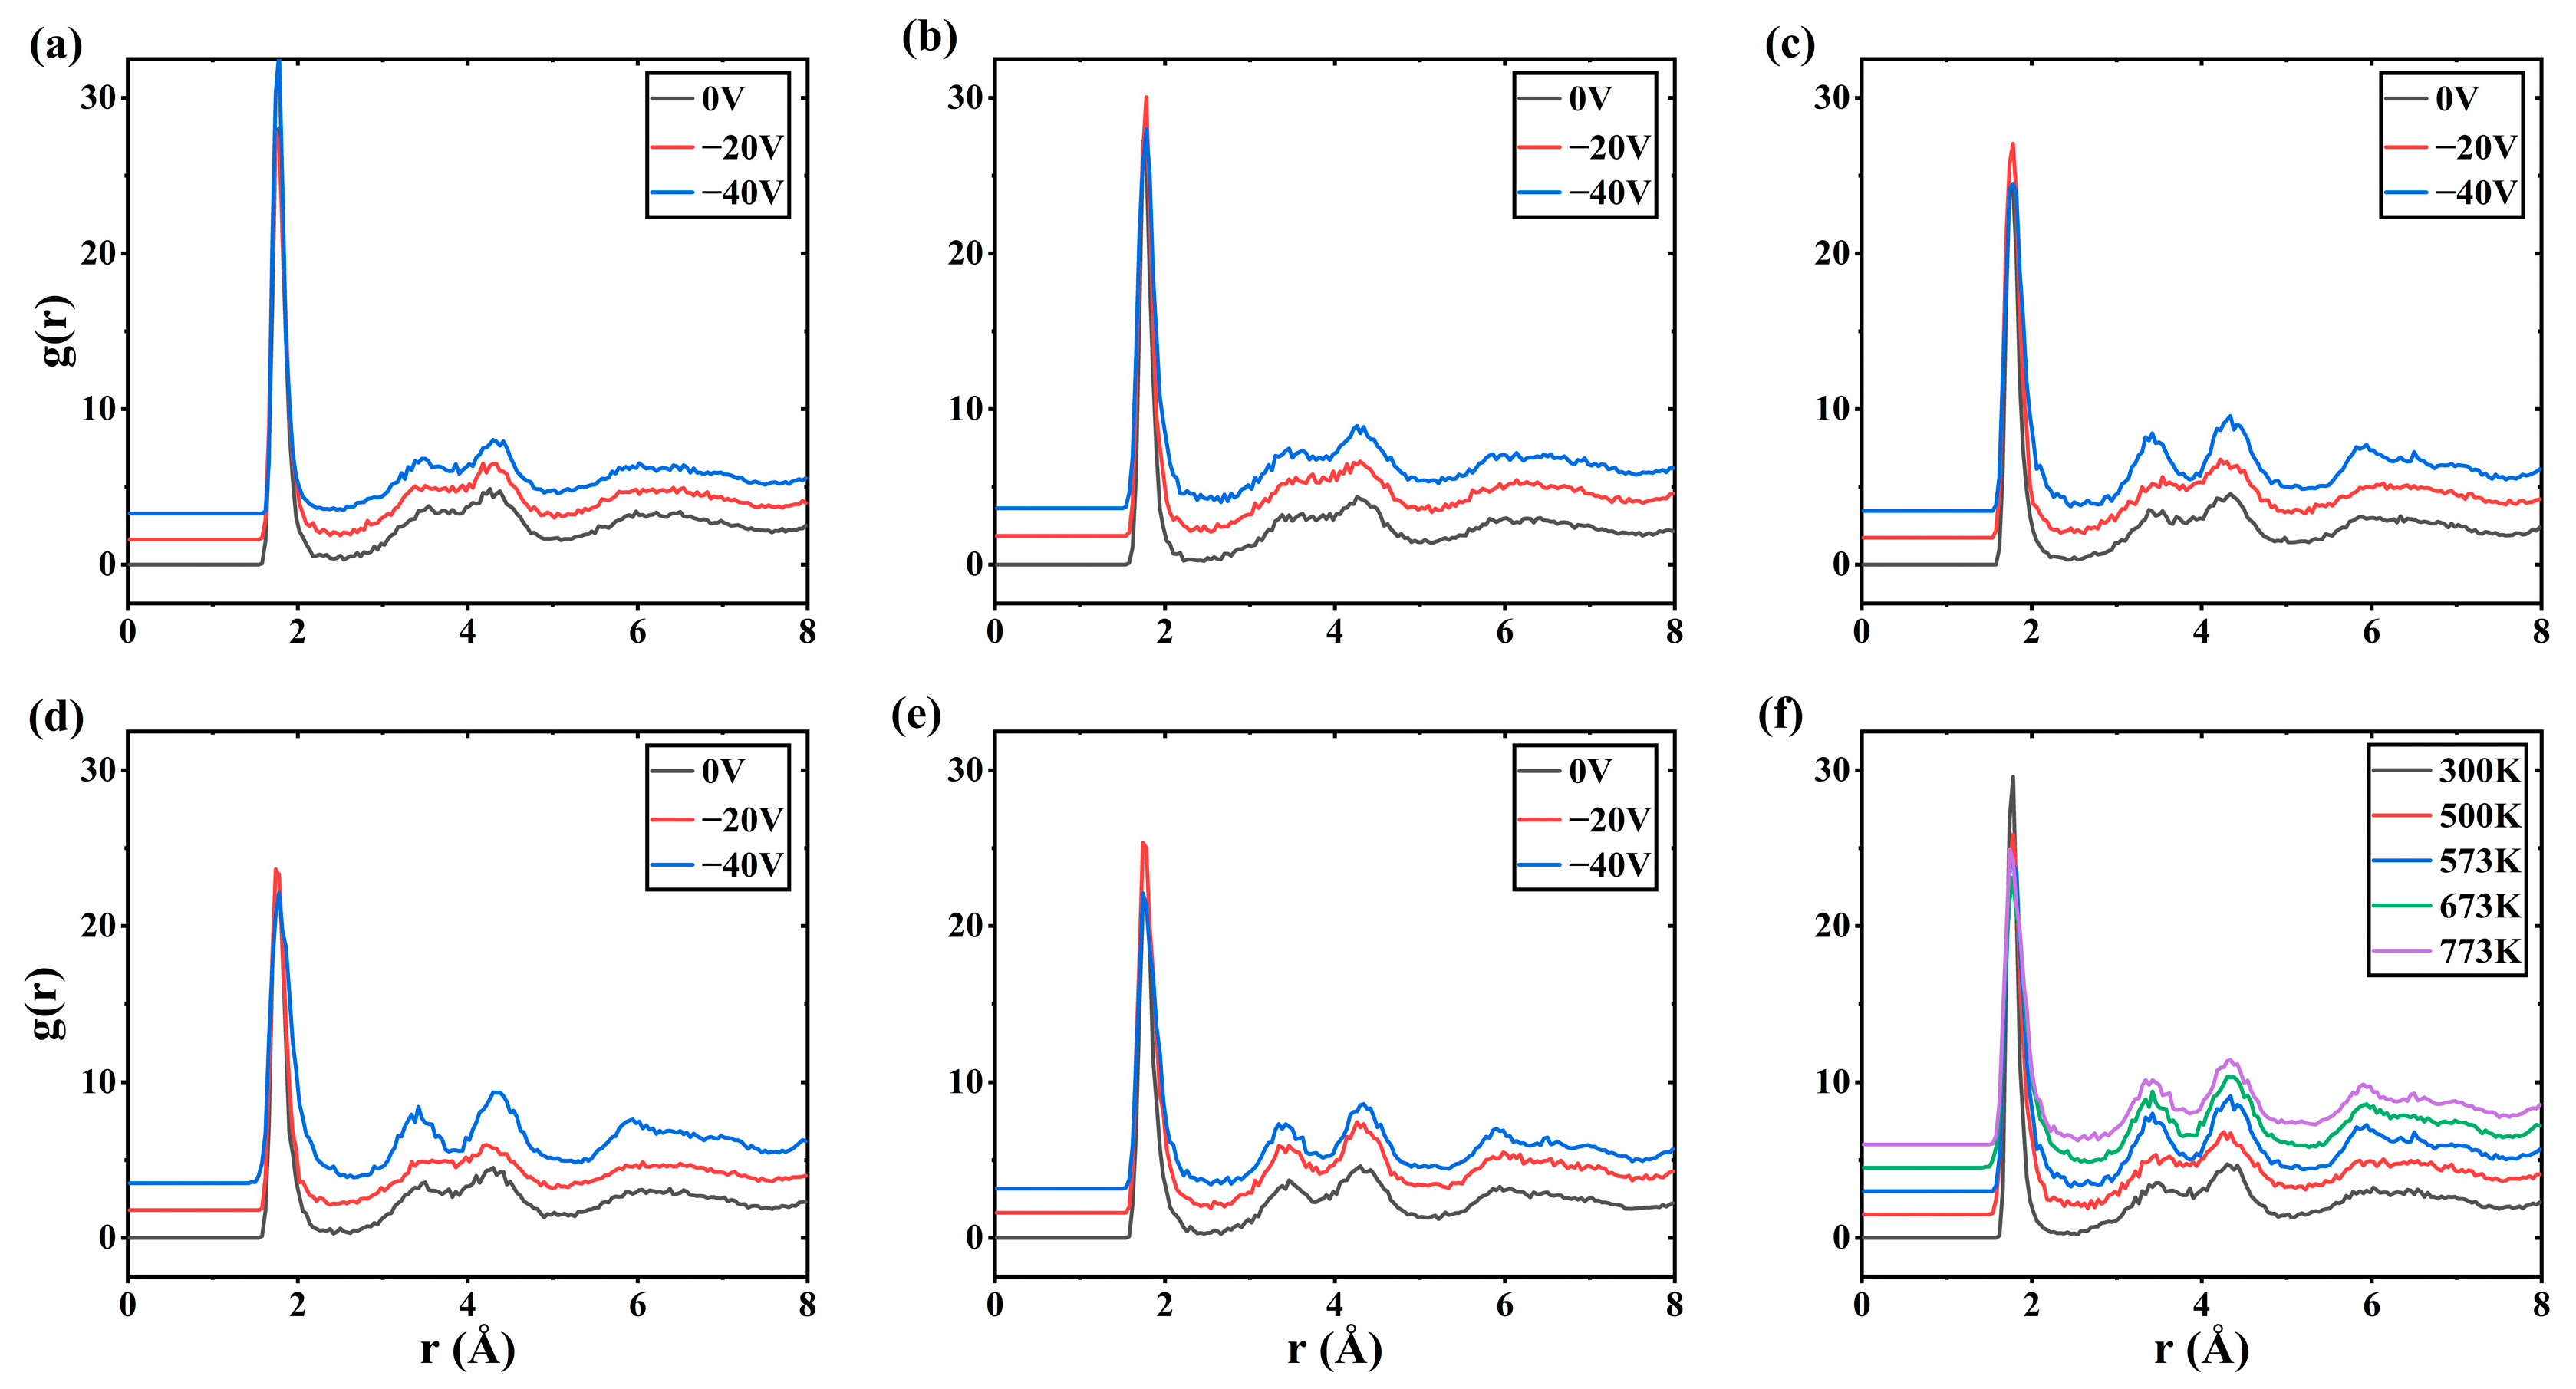
Figure 5 shows the radial distribution function between Al-O (cutoff radius 8 Å) in the films at different substrate temperatures and bias voltage. In Figure 5a,b, only the first peak (short-range ordering) is evident, and the rest of the long-range peaks are weak, indicating that the films are in an amorphous state at T = 300 K and 500 K, −40 V bias. Upon reaching a substrate temperature of 573 K (Figure 5c) and Vb = −40 V, not only is the first peak clear, but the subsequent long-range peaks are also prominent, indicating ordering between Al-O in the film. Figure 5d (T = 673 K) shows similar results to Figure 5c, with the noteworthy observation that at Vb = −40 V, the half-width of the first peak increases, the average distance between Al-O atoms increases, and particle migration ability improves. Upon further increasing the substrate temperature to 773 K, multiple peaks are evident at Vb = −20 V, indicating successful crystallization of the thin film. This suggests that raising the substrate temperature can decrease the energy required for particle bombardment. Figure 5f provides a more intuitive illustration of the temperature’s impact on thin film crystallization. When combined with Figure 4, it can be qualitatively concluded that crystalline thin films can be achieved at a lower temperature of T = 573 K with a bias voltage of −40 V.
It is well known that the high-density α-Al2O3 phase is composed of complete octahedral (coordination number = 6) coordination Al atoms and the γ-Al2O3 phase is defined by a blend of predominantly octahedrally coordinated and a minor fraction of tetrahedrally coordinated (coordination number = 4) Al atoms, while most tetrahedrally coordinated Al atoms are present in the non-crystalline phase [5,10,30].
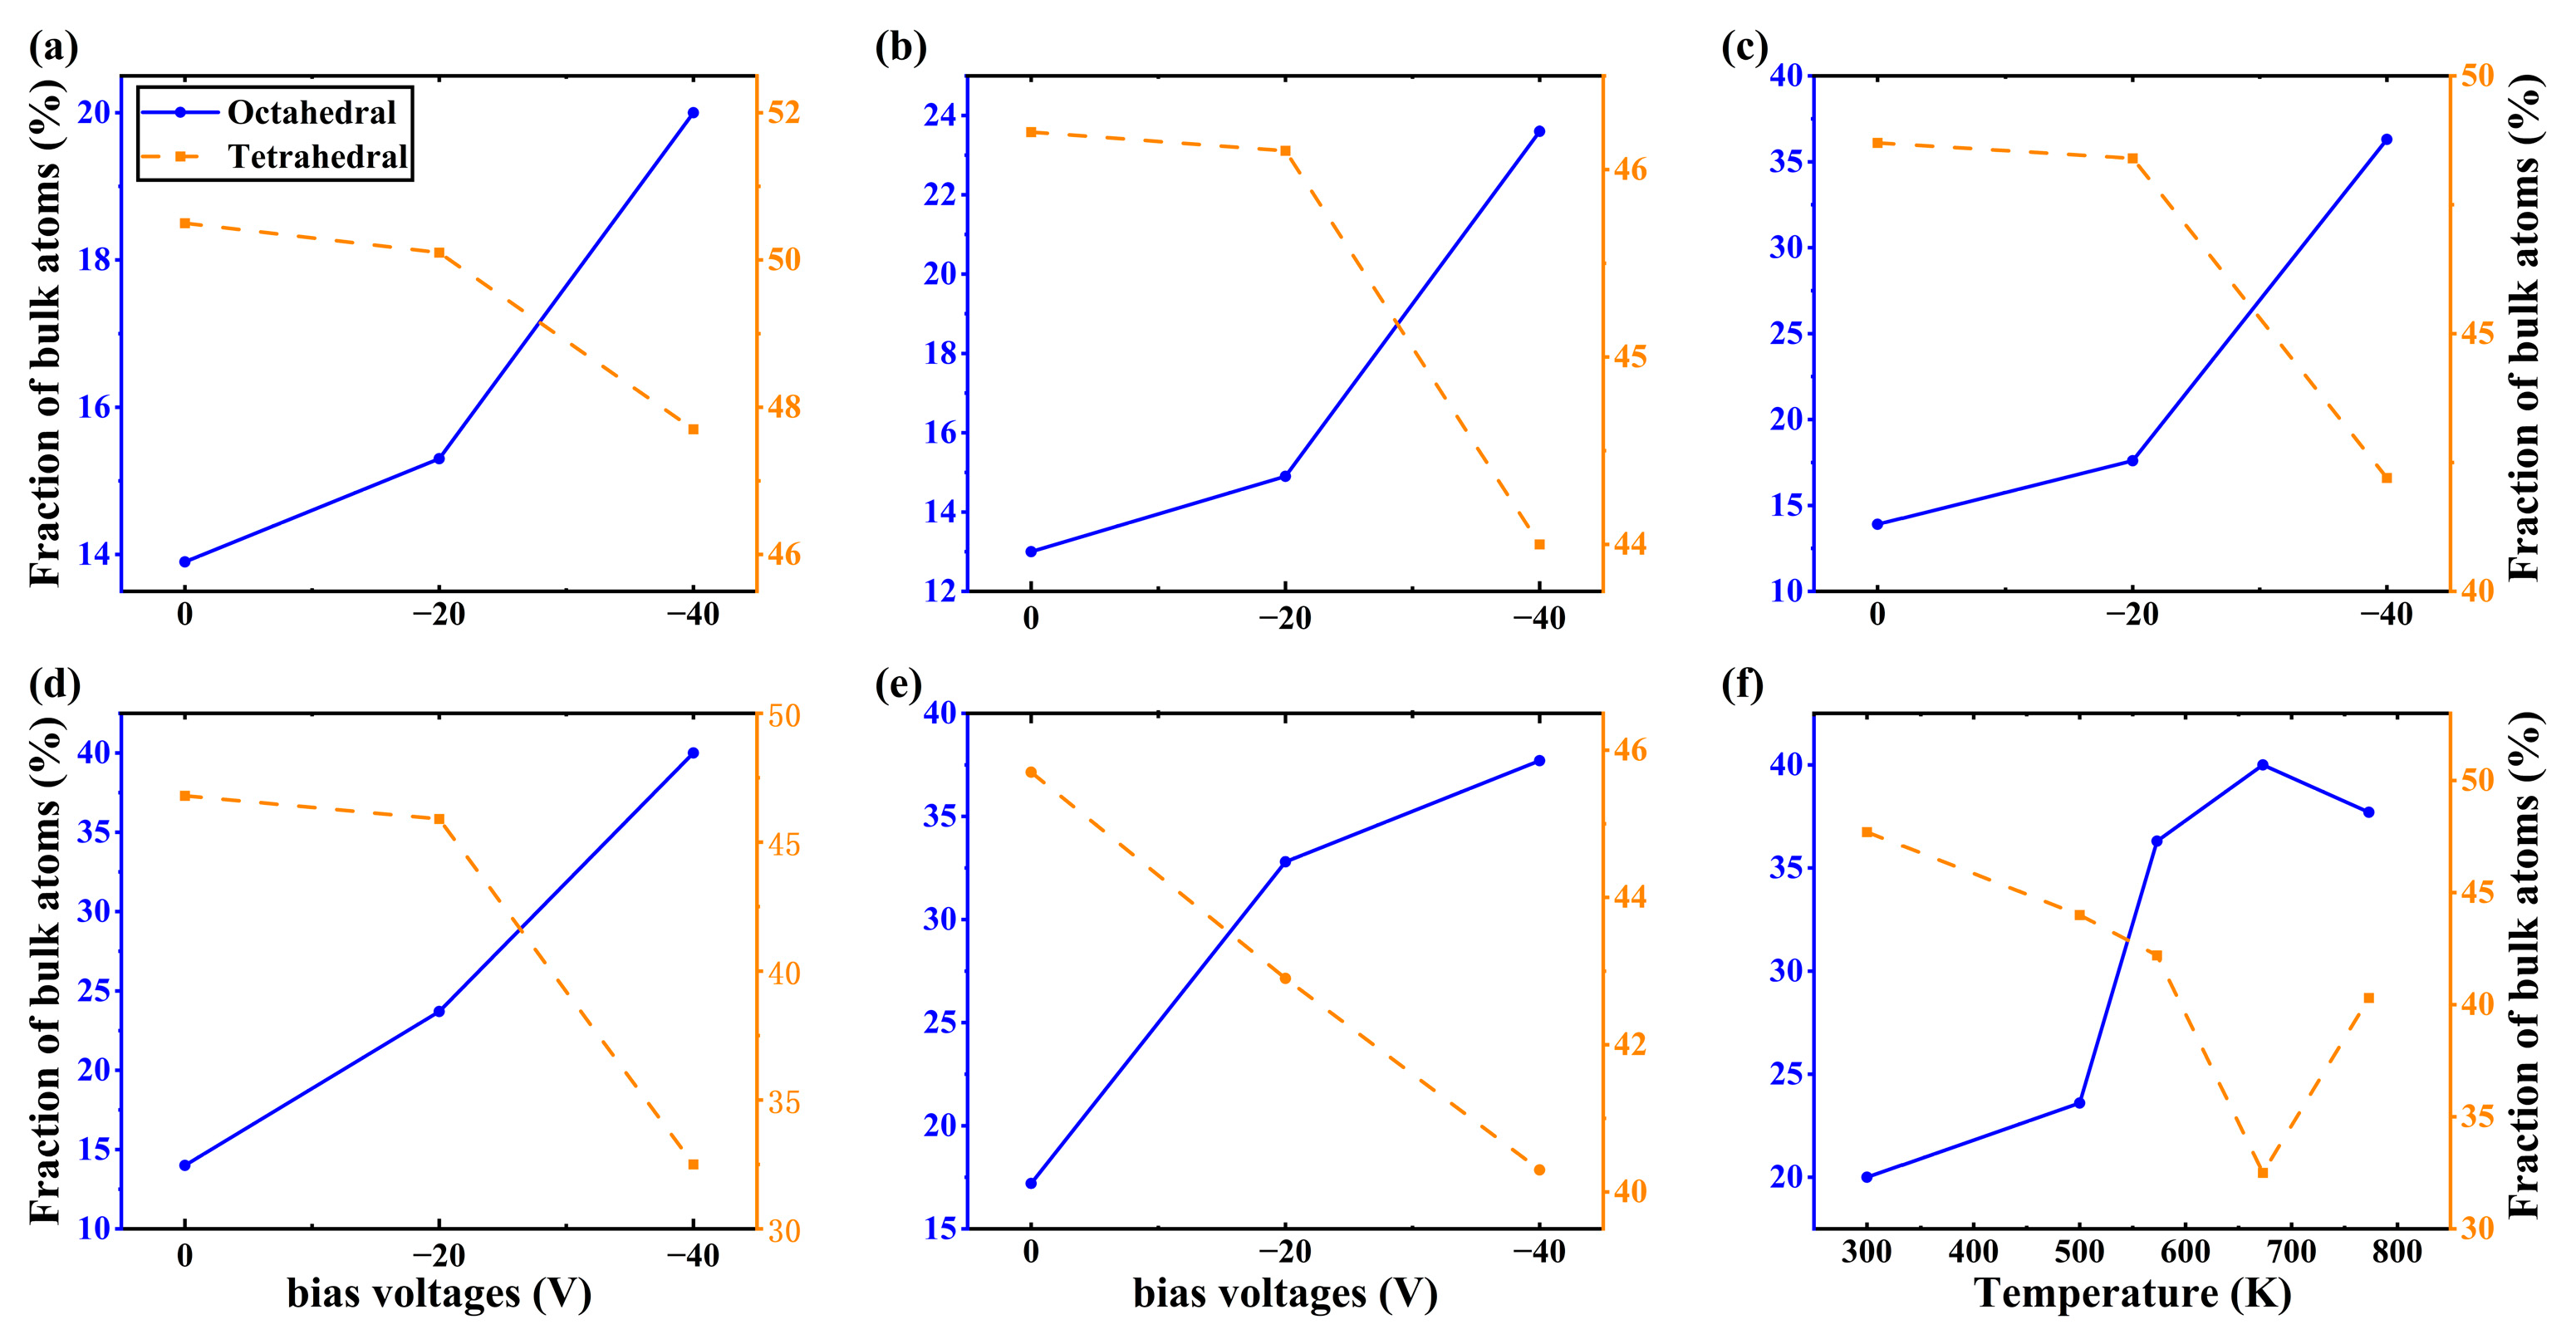
In order to quantitatively determine the crystal structure of Al2O3 films with substrate bias, Figure 6a–e shows the structural proportion of coordinated Al atoms in Al2O3 films deposited under different bias voltage in the range of T = 300 K~773 K. It is evident that as the applied bias value increases, there is a rise in the content of octahedral coordination Al atoms, accompanied by a decline in tetrahedral counterparts, particularly notable when the bias shifts from −20 V to −40 V. In particular, the octahedral content increased from 17% to 36% at the deposition temperature of 573 K, indicating that the crystal content in the film increased significantly. It is worth mentioning that at T = 773 K, the content of octahedrally coordinated Al atoms increases more for the 0–20 V bias than for the 20–40 V bias, which is due to the slow amorphization in the films caused by the bombardment of energetic particles. Figure 6f illustrates this point more intuitively. When the bias voltage is −40 V, the octahedra increases from 20% to 40%, and the tetrahedron decreases from 48% to 33% as the substrate temperature rises from 300 K to 673 K. Nevertheless, at T = 773 K, the octahedral content decreased by 2%. At the atomic level, the lower deposition temperature requires the bombardment of high-energy particles to provide energy for the film-forming particles so that the crystal velocity formed is higher than the damage caused by the bombardment. Once the temperature is high (T = 773 K), the high-energy particle bombardment (with a −40 V bias applied) causes the defects to accumulate faster than the crystals formed by diffusion, which leads to slow amorphization of the film.
Figure 7 shows the average coordination number of Al atoms in the Al2O3 film, showcasing varying coordination numbers, including 4, 6, 5, and 3. The results indicate that with increased temperature under the same bias voltage, the average coordination value of Al rises. However, at a bias voltage of −40 V, the average Al coordination decreases by 0.2 from 673 K to 773 K at the substrate temperature. This aligns with the conclusion from Figure 6, suggesting that crystallization in the film is not strongly correlated with Al atoms of coordination 4 and 6. The presence of defects in the film is indicated by most Al atomic coordination numbers being below 5. Possible reasons for these defects include the influence of Al+ and Ar+ promotion and O inhibition during negative bias application, as well as the presence of Al vacancies in γ-Al2O3 itself.
Figure 8 quantified the medium-range order in the film and analyzed it using common neighbor statistics [28], showing the statistical data of the O lattice structure. Notably, α-Al2O3 consists of a local HCP arrangement of O, while γ-Al2O3 consists of a local FCC arrangement [31].
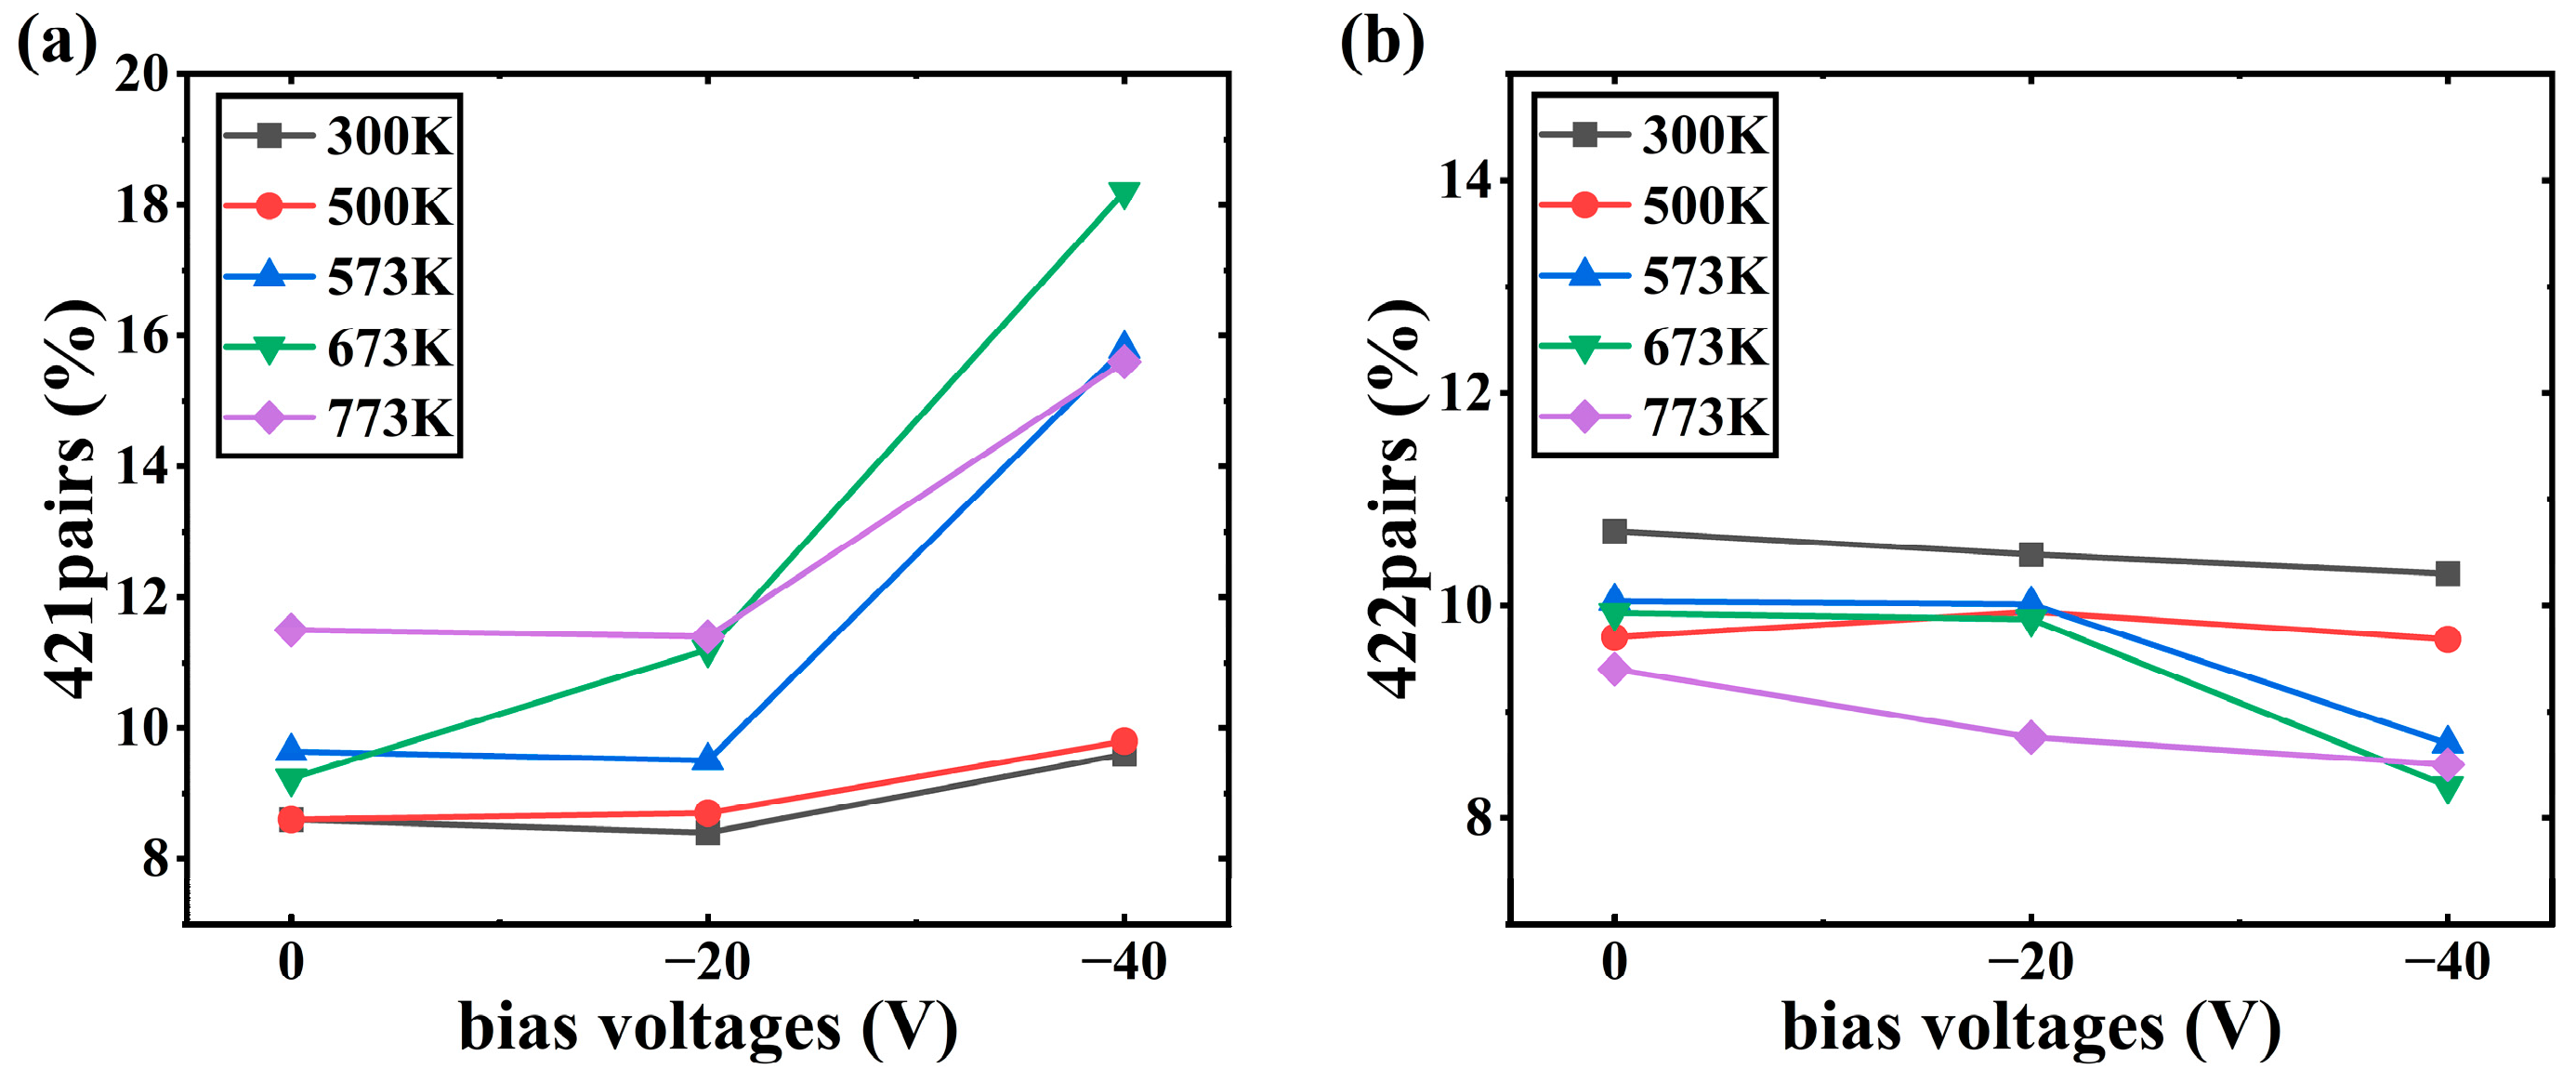
Firstly, with the increase of bias voltage, the content of ternary 421 bonding pairs increases and 422 bonding pairs decreases. This suggests that increasing the bias leads to a higher number of FCC structures of O in the film, generating crystalline Al2O3 dominated by the γ phase. The influence of substrate temperature on the type of thin film crystal is evident, as shown in Figure 8a. At a temperature of 773 K with no bias applied, the content of ternary 421 bonding pairs is 11.5%, which is 2~3% higher than that at lower temperatures. However, with a bias voltage of −40 V, the content of 421 bonding pairs at 773 K decreases to 15.6%, lower than at 673 K (18.2%). This suggests that slow amorphization resulting from high-energy particle bombardment primarily impacts the formation of γ-Al2O3. Additionally, the presence of α-Al2O3 (Figure 8b) in the film may indicate epitaxial growth of a small fraction of Al2O3, a phenomenon that has been previously observed [32]. With the increase of γ-phase content, the α-phase shows a decreasing trend, which may be attributed to (1) part of the α-phase being transformed to the γ-phase [33]; and (2) the increase of the migration energy of film-forming particles weakens the epitaxial growth effect, resulting in a decrease in the content, which is the same as the conclusion that the bombardment will induce local epitaxial growth to be terminated during the formation of the film in Ref. [17].
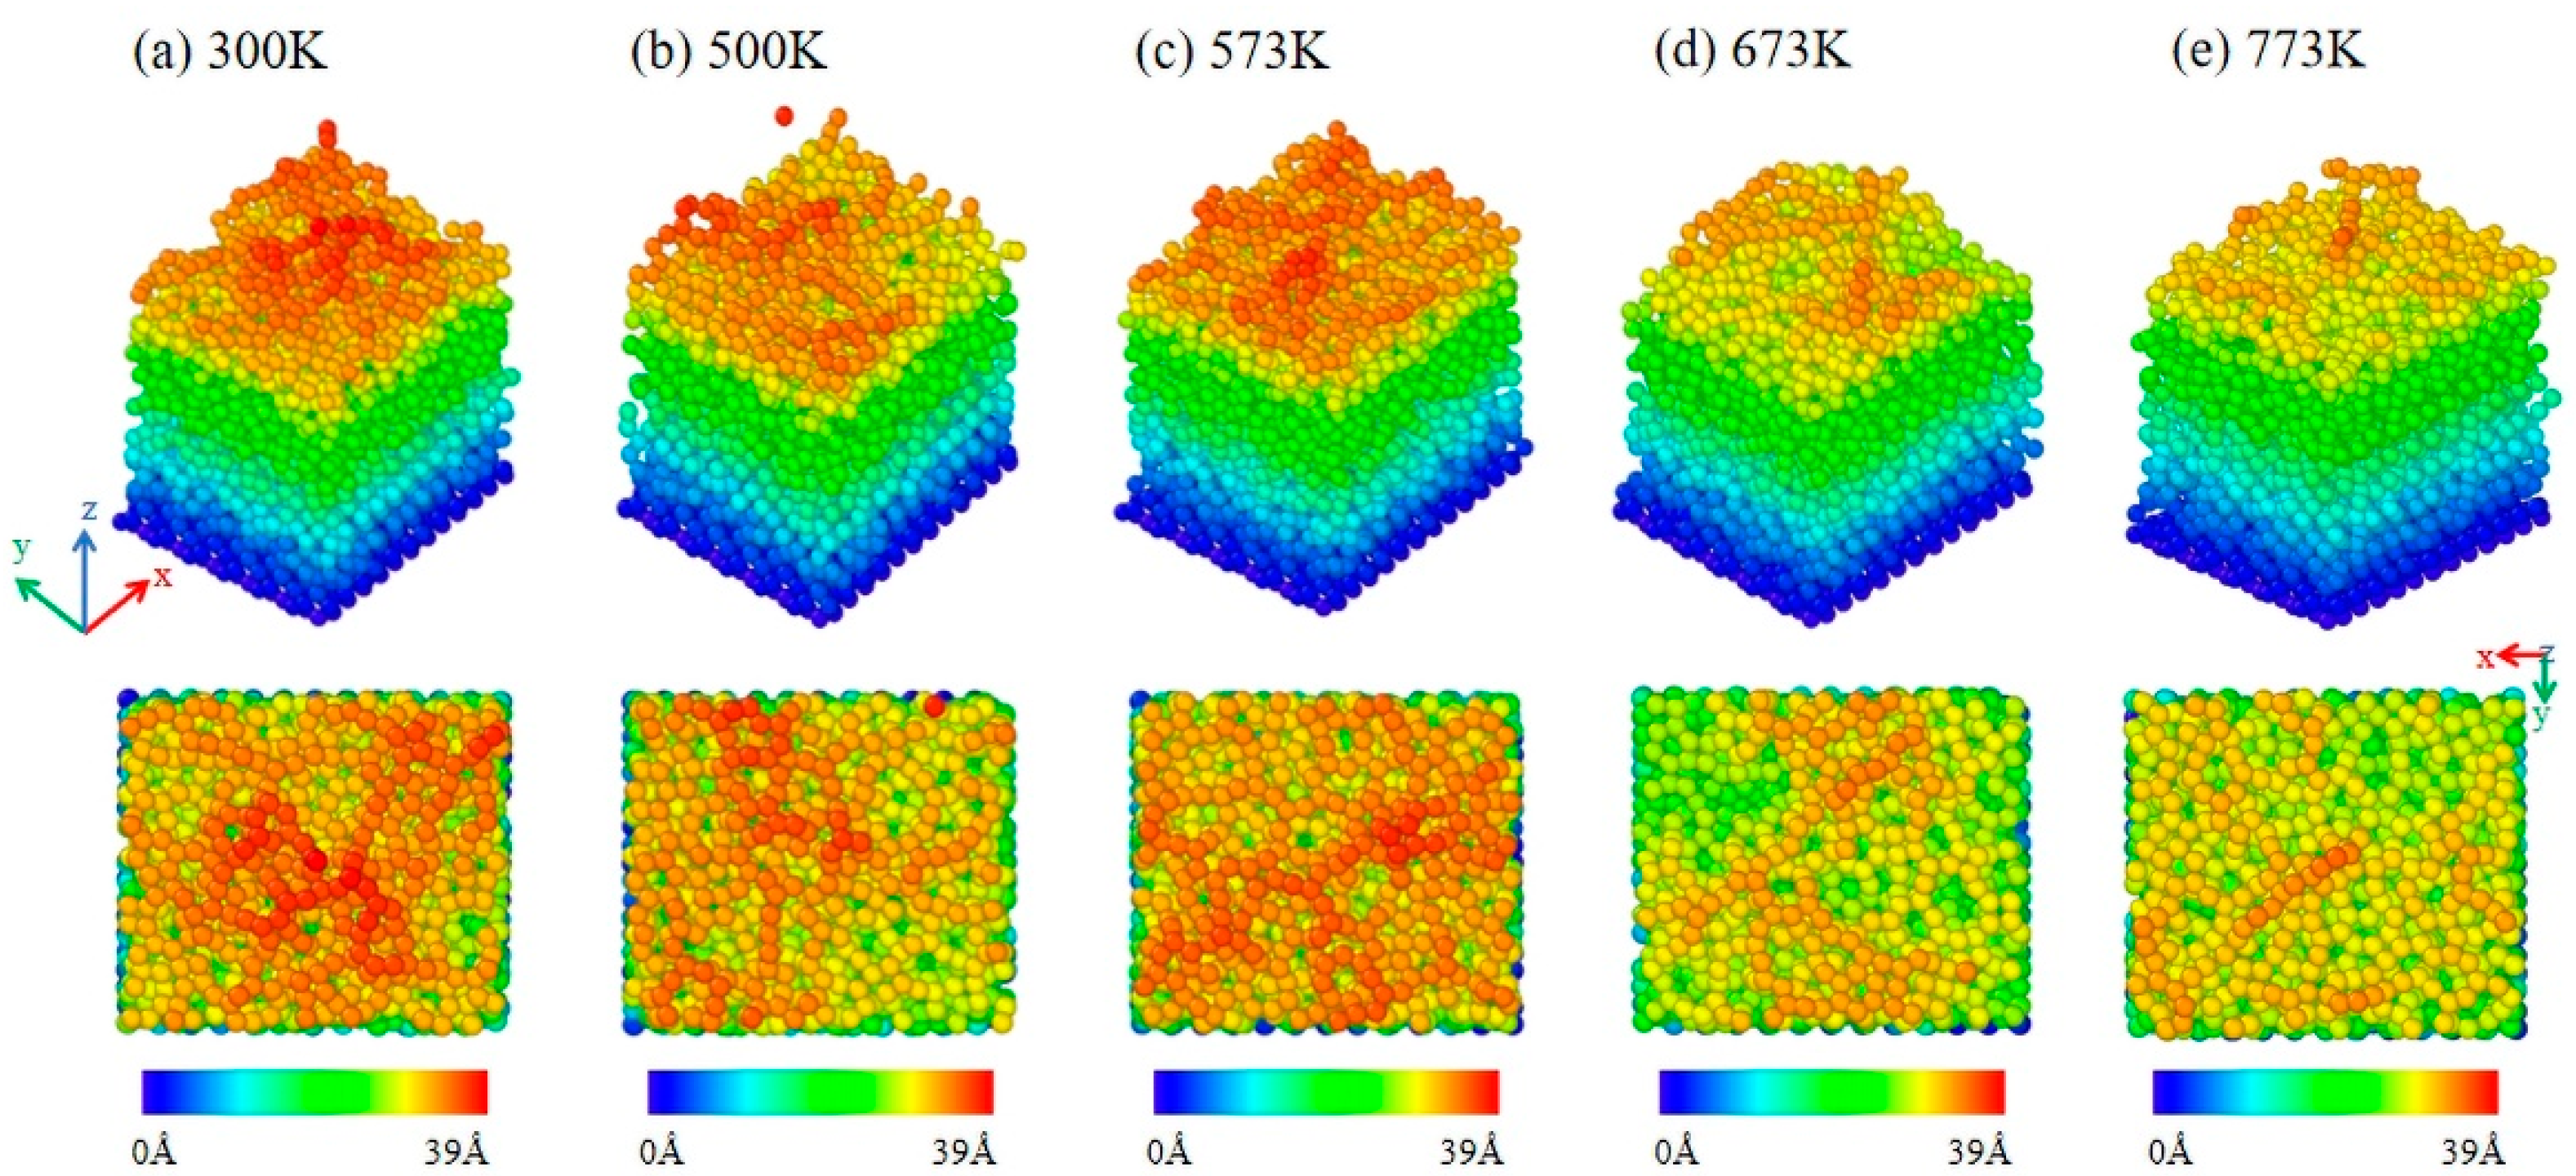
Figure 9 shows a top view of the deposition of a thin film at different temperatures with a −40 V bias applied, providing information on the effect of the simulated conditions on the morphology of the film. As the deposition temperature increases, there are some differences in the atomic structure of the films formed on the substrate surface, especially in terms of atomic height. Under the bias voltage of −40 V, there are no large bumps and pits on the surface of the Al2O3 film, the peak-to-valley distance is between 4.7 Å~6.3 Å, and the surface is relatively smooth. The surface roughness is shown in Table 5. In addition, an analysis of the atomic surface height shows that as the substrate temperature increases, the film’s compactness is enhanced and the atomic surface height diminishes. This phenomenon is particularly pronounced at T = 673 K (Figure 9d) and T = 773 K (Figure 9e).
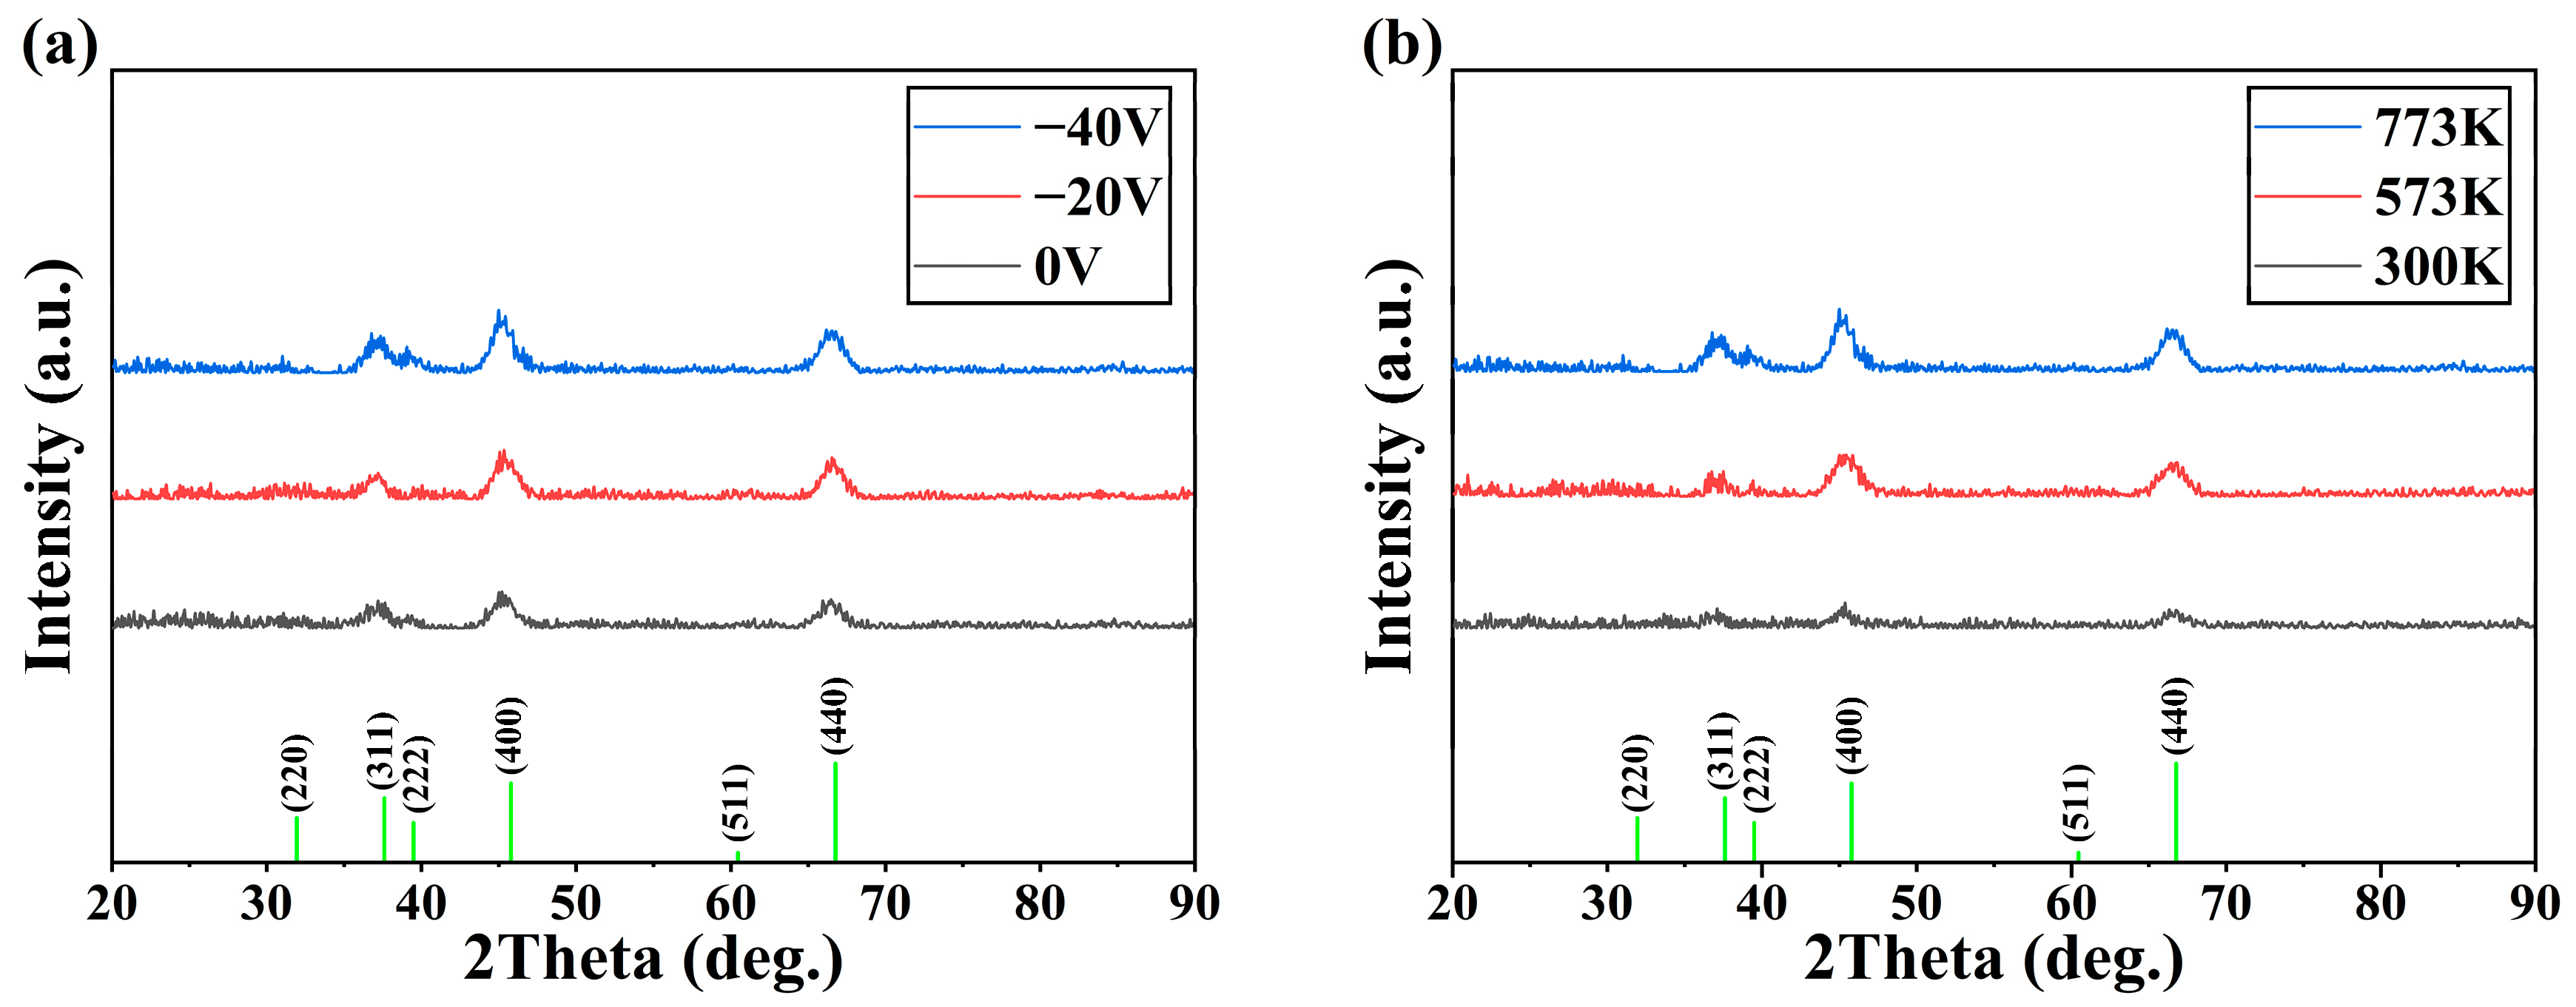
The XRD patterns of the Al2O3 films prepared at different deposition parameters are shown in Figure 10. The green vertical line in the figure is the standard diffraction peak of γ-Al2O3 (PDF#29-0063). Figure 10a shows the XRD results with a bias voltage of 0 V, −20 V, and −40 V at T = 773 K. The diffraction peaks correspond to the (400), (440), and (311) crystal planes of the Al2O3 phases, respectively. This result shows that crystalline Al2O3 films can be obtained at a substrate temperature of 773 K and a bias voltage of 0 V. As the bias voltage increases from 0 V to −40 V, the intensity of each diffraction peak increases, and the peaks become sharper. This indicates that the increase in bias improves the crystallinity of Al2O3 films. The changing trend of the crystallinity of Al2O3 films is similar to the simulation results. Figure 10b is an XRD image of 300 K, 573 K, and 773 K at a bias voltage of −40 V. When the temperature rises, the intensity of the diffraction peak increases significantly, and the crystallinity of the Al2O3 film is the highest when the temperature is 773 K. The intensity of the diffraction peak increases with the substrate temperature, indicating that increasing the substrate temperature is beneficial for the crystallization of the film, which is basically consistent with previous publications [34].

4. Discussion

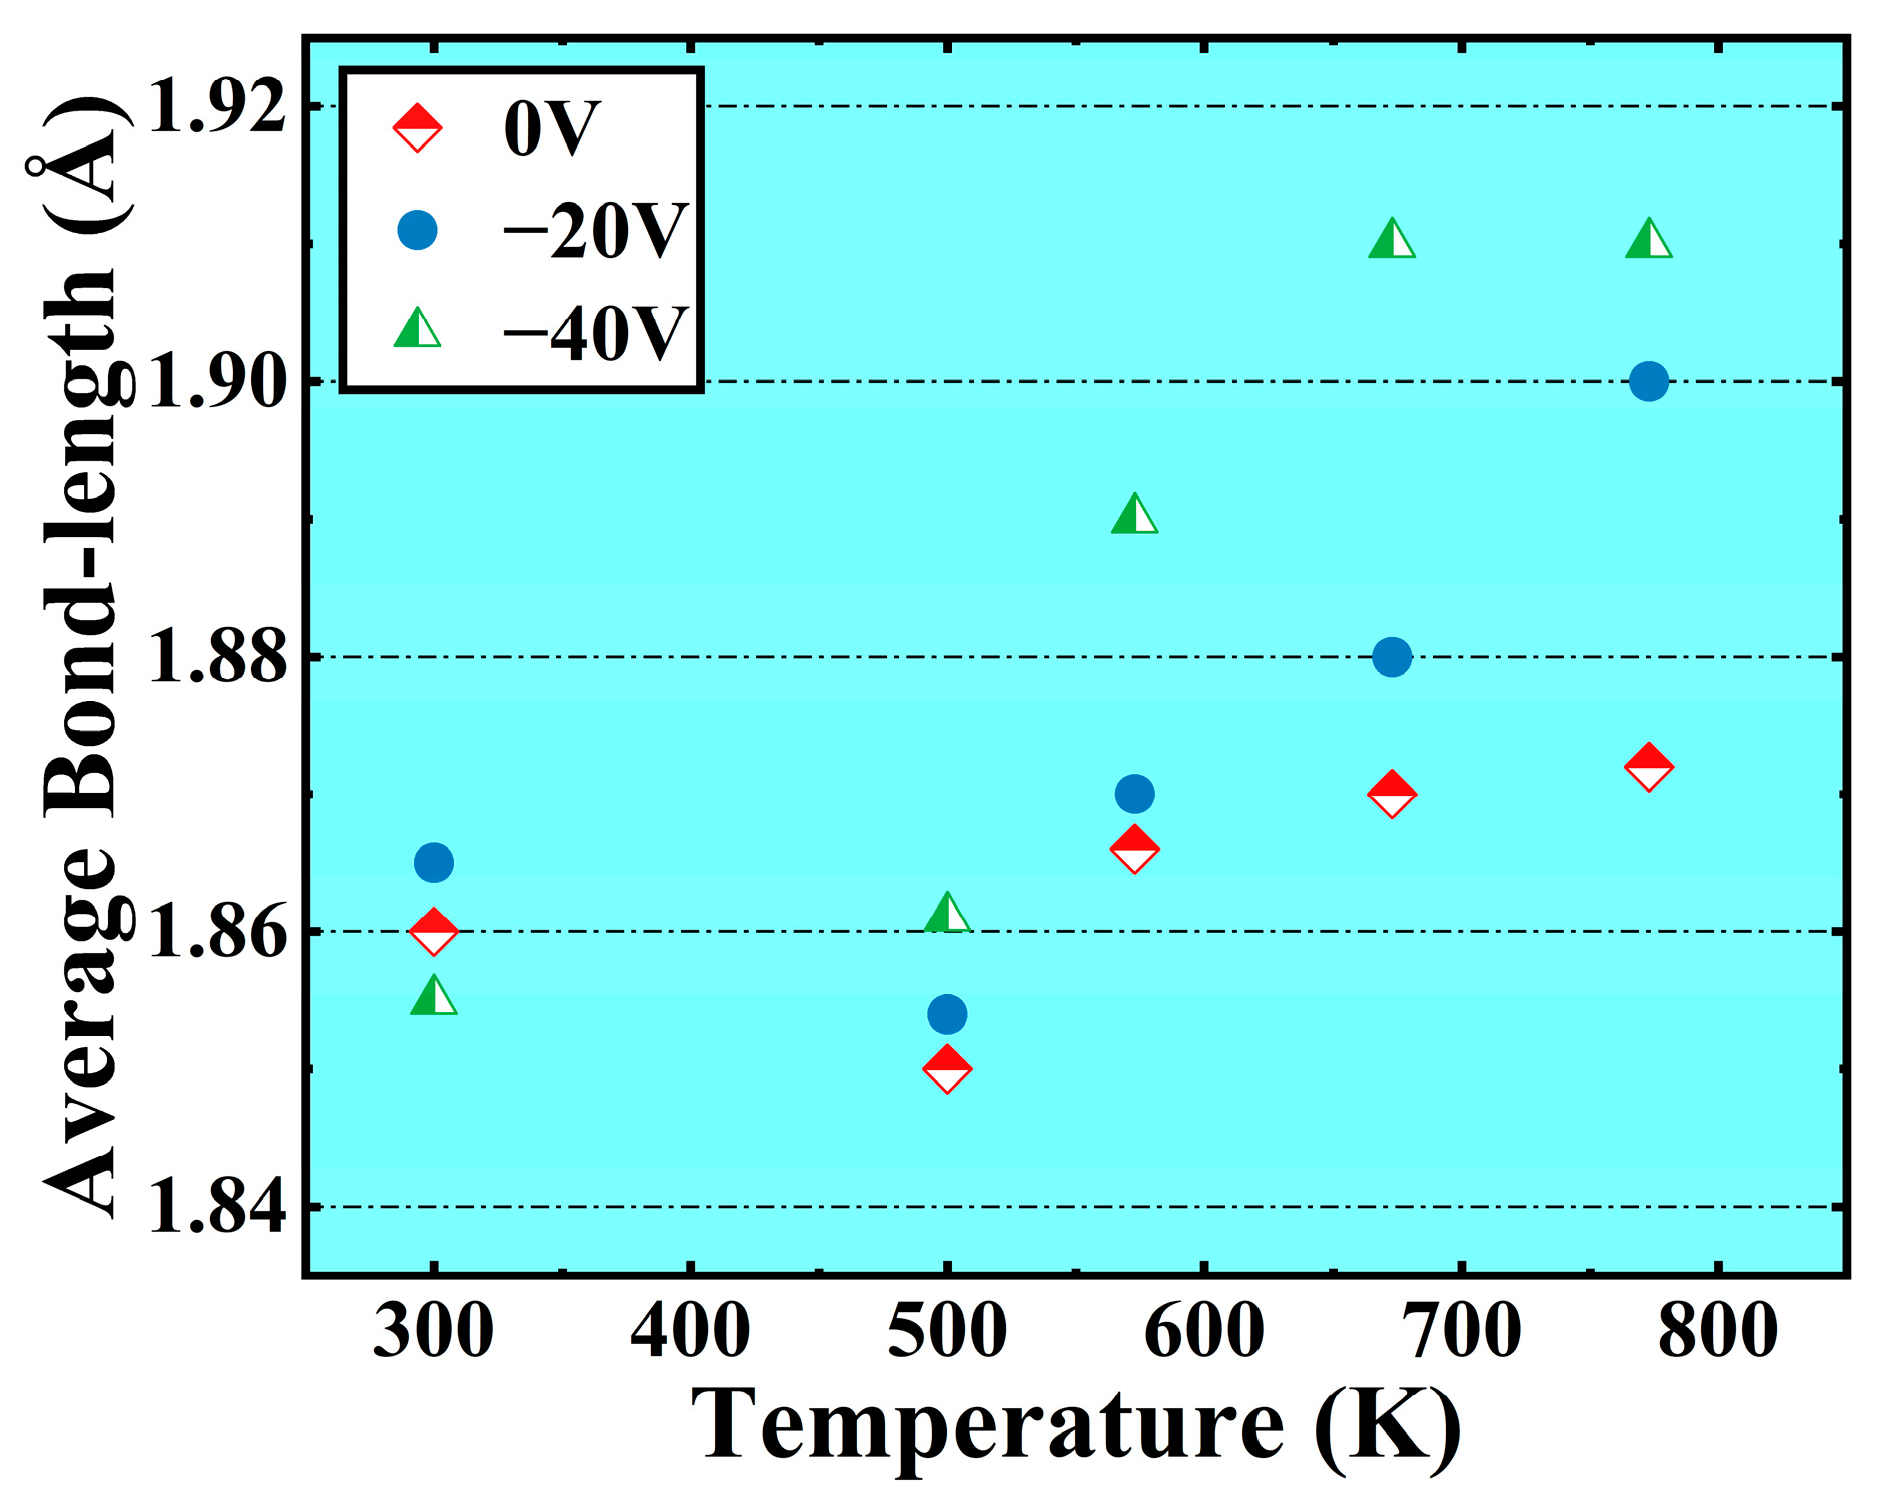
In this paper, Al2O3 thin films were deposited using simulated magnetron sputtering to facilitate low-temperature crystallization. The migration of particles is heavily influenced by their energy, requiring sufficient energy to overcome the nucleation potential barrier during crystallization. This energy is necessary for particles to move to lattice positions in crystalline alumina during crystal formation. In a previous study, the effect of deposition temperature on the crystal structure of alumina films without substrate bias was analyzed [35]. The results showed that the grain size increased from 15 nm at 300 °C to 25 nm at 500 °C, indicating that the crystallization degree of the film increased from 300 °C to 500 °C. The growth of crystalline Al2O3 films at relatively low substrate temperatures can be attributed to the following reasons: (i) the scattering effect of the particles is weakened at low pressure, and the high-energy bombardment particles are retained; and (ii) the energy provided by energetic ions (Al+, Ar+, O+, O) increases the possibilities for thin film crystallization. Similarly, in the previous simulation, the degree of crystallization of the film increases with increasing temperature when no bias voltage is applied. However, the energy required for crystallization only from the perspective of increasing thermodynamics (without applying bias) requires a very high substrate temperature, which makes the preparation of crystalline Al2O3 thin films more expensive and process intensive. When a bias is applied to the substrate, the deposited ions receive additional kinetic energy and bombard the surface of the film with higher energy. High-energy particles bombarding the surface will undergo an energy conversion so that the atoms on the surface of the film will obtain additional energy and this extra energy will promote the orderly arrangement of the atoms and increase the degree of crystallization of the film. In the above circumstances, the simulation and XRD results also show a tendency for the degree of crystallization of the film to increase with increased bias. Figure 11 shows the statistical results of Al-O bond lengths. The Al-O bond lengths in crystalline Al2O3 are 1.91 Å to 1.92 Å [19]. In general, thin film crystallization requires a minimum amount of free energy to bring its structure to a stable state. This obtained energy is mainly supplied to the deposited atoms so that they can diffuse to the desired lattice position for crystallization. According to the previous section, applying a bias voltage of −20 V is necessary to obtain crystalline Al2O3 films at T = 773 K with an Al-O bond length of 1.90 Å. Applying a bias voltage of −40 V reduces the deposition temperature to 573 K with an Al-O bond length of 1.89 Å, which is close to that of the Al-O in crystalline Al2O3. This indicates that the bias increases the diffusion capacity of the atoms, allowing the deposited atoms to diffuse to the desired lattice position for crystallization. In other words, the bias provides additional energy to the incident particles, allowing them to compensate for the crystallization activation energy that would otherwise need to be provided by the thermal energy. From Figure 11, we can see that by setting the substrate temperature, bias, and particle incident energy in the simulation, the statistical bond length can predict the influence of the three parameters on the crystallization of the thin film and predict the appropriate process window for the preparation of crystalline alumina films before an experiment.

5. Conclusions

In this paper, molecular dynamics simulations were used to analyze the growth of Al2O3 films under bias and substrate temperature during magnetron sputtering. The principle of low-temperature crystallization was investigated by assigning values to incident particles through ion energy distributions measured by plasma mass spectrometry. The simulation results show that:
(1)
Under low-energy particle deposition conditions, the growth of Al2O3 thin film crystals requires high deposition temperatures for optimal results. Without applying bias to the particles during the deposition process, even at 773 K, achieving a well-crystallized Al2O3 film is challenging, with only 17.2% octahedral coordination of Al content in the film.
(2)
The bias is conducive to the deposition of crystalline Al2O3 films at low temperatures. When the bias of −40 V is applied, the content of octahedral coordination of Al in the Al2O3 film is 36.3% and that of ternary 421 increases by 6% at T = 573 K, the crystallinity in the film rises, and the Al2O3 crystal is dominated by γ phases. However, the average coordination number in the film remains mostly below 5, indicating a significant presence of defects. This observation may be attributed to the fast deposition of Al+ ions and slow deposition of O- ions.
(3)
The low-temperature preparation of crystalline Al2O3 films is attributed to the energy of the particles, and the application of a bias enables the diffusion of the thin particles to be enhanced, compensating for the crystallization energy supplied by the substrate temperature and allowing the films to be prepared at low temperatures.

Author Contributions

Conceptualization, L.W. and Z.W.; Data curation, J.J. and Y.S.; Formal analysis, J.J., Y.S., X.W. and J.L.; Funding acquisition, W.J.; Methodology, W.J., L.W., Z.W. and E.W.; Supervision, L.W. and Z.W.; Validation, X.W. and J.L.; Visualization, J.J. and Y.S.; Writing—original draft, W.J., J.J., Y.S. and E.W.; Writing—review & editing, W.J. and E.W. All authors have read and agreed to the published version of the manuscript.

Funding

This work was supported by Heilongjiang Provincial Natural Science Foundation of China (LH2020E084), the General Program of China Postdoctoral Science Foundation (Grant. No. 2023M740943), the National Funded Postdoctoral Researchers Program (Grant. No. GZC20230637), and the Open Project of Collaborative Innovation Center of Intelligent Tunneling Equipment (No. ITBM202301).

Data Availability Statement

The raw data supporting the conclusions of this article will be made available by the authors on request.

Acknowledgments

The authors are grateful to Guangxue Zhou for his technical support in mass spectrometry detection.

Conflicts of Interest

The authors declare no conflicts of interest.

References

  1. Zhang, Y.; Chen, C.; Xiong, J.; Guo, Z.; Liu, J.; You, Q.; Yang, L.; Zhang, D.; Liu, Y.; Liu, Q.; et al. Effects of Nano-Al2O3 Addition on Microstructure, Mechanical Properties, and Wear Resistance of Ti(C, N)-Based Cermets. Int. J. Refract. Met. Hard Mat. 2023, 115, 106290. [Google Scholar] [CrossRef]
  2. Lizarraga-Medina, E.G.; Caballero-Espitia, D.L.; Jurado-Gonzalez, J.; Lopez, J.; Marquez, H.; Contreras-Lopez, O.E.; Tiznado, H. Al2O3-Y2O3 Nanolaminated Slab Optical Waveguides by Atomic Layer Deposition. Opt. Mater. 2020, 103, 109822. [Google Scholar] [CrossRef]
  3. Ali, M.K.A.; Hou, X. Improving the Heat Transfer Capability and Thermal Stability of Vehicle Engine Oils Using Al2O3/TiO2 Nanomaterials. Powder Technol. 2020, 363, 48–58. [Google Scholar] [CrossRef]
  4. Levin, I.; Bendersky, L.A.; Brandon, D.G.; Rühle, M. Cubic to Monoclinic Phase Transformations in Alumina. Acta Mater. 1997, 45, 3659–3669. [Google Scholar] [CrossRef]
  5. Liu, R.; Elleuch, O.; Wan, Z.; Zuo, P.; Janicki, T.D.; Alfieri, A.D.; Babcock, S.E.; Savage, D.E.; Schmidt, J.R.; Evans, P.G.; et al. Phase Selection and Structure of Low-Defect-Density γ-Al2O3 Created by Epitaxial Crystallization of Amorphous Al2O3. ACS Appl. Mater. Interfaces 2020, 12, 57598–57608. [Google Scholar] [CrossRef]
  6. Pinto, D.; Minorello, S.; Zhou, Z.; Urakawa, A. Integrated CO2 Capture and Reduction Catalysis: Role of γ-Al2O3 Support, Unique State of Potassium and Synergy with Copper. J. Environ. Sci. 2024, 140, 113–122. [Google Scholar] [CrossRef]
  7. Yang, R.; Xu, S.; Wang, X.; Xiao, Y.; Li, J.; Hu, C. Selective Stereoretention of Carbohydrates upon C-C Cleavage Enabling D-Glyceric Acid Production with High Optical Purity over a Ag/γ-Al2O3 Catalyst. Angew. Chem.-Int. Ed. 2024, 136, e202403547. [Google Scholar] [CrossRef]
  8. Demirtas, H.; Cug, H.; Elkilani, R. Properties of Al2O3 Particle Reinforced Composites Coating on IF Steel. Surf. Eng. 2022, 38, 62–71. [Google Scholar] [CrossRef]
  9. Gecu, R.; Birol, B.; Ozcan, M. Improving Wear and Corrosion Protection of AISI 304 Stainless Steel by Al2O3-TiO2 Hybrid Coating via Sol-Gel Process. Trans. Inst. Met. Finish. 2022, 100, 324–332. [Google Scholar] [CrossRef]
  10. Kateb, M.; Gudmundsson, J.T.; Ingvarsson, S. Effect of Substrate Bias on Microstructure of Epitaxial Film Grown by HiPIMS: An Atomistic Simulation. J. Vac. Sci. Technol. A 2020, 38, 043006. [Google Scholar] [CrossRef]
  11. Kouznetsov, V.; Macák, K.; Schneider, J.M.; Helmersson, U.; Petrov, I. A Novel Pulsed Magnetron Sputter Technique Utilizing Very High Target Power Densities. Surf. Coat. Technol. 1999, 122, 290–293. [Google Scholar] [CrossRef]
  12. Ferreira, M.; Martinez-Martinez, D.; Chemin, J.-B.; Choquet, P. Tuning the Characteristics of Al2O3 Thin Films Using Different Pulse Configurations: Mid-Frequency, High-Power Impulse Magnetron Sputtering, and Their Combination. Surf. Coat. Technol. 2023, 466, 129648. [Google Scholar] [CrossRef]
  13. Chianu, E. The Influence of Deposition Parameters on Structural, Optical and Electrical Properties of AZO Thin Film. J. Optoelectron. Adv. Mater. 2021, 23, 270–274. [Google Scholar]
  14. Wu, Z.; Ye, R.; Bakhit, B.; Petrov, I.; Hultman, L.; Greczynski, G. Improving Oxidation and Wear Resistance of TiB2 Films by Nano-Multilayering with Cr. Surf. Coat. Technol. 2022, 436, 128337. [Google Scholar] [CrossRef]
  15. Houska, J.; Zeman, P. Role of Al in Cu-Zr-Al Thin Film Metallic Glasses: Molecular Dynamics and Experimental Study. Comput. Mater. Sci. 2023, 222, 112104. [Google Scholar] [CrossRef]
  16. Houska, J.; Rezek, J.; Cerstvy, R. Dependence of the ZrO2 Growth on the Crystal Orientation: Growth Simulations and Magnetron Sputtering. Appl. Surf. Sci. 2022, 572, 151422. [Google Scholar] [CrossRef]
  17. Ghaemi, M.; Lopez-Cazalilla, A.; Sarakinos, K.; Rosaz, G.J.; Carlos, C.P.A.; Leith, S.; Calatroni, S.; Himmerlich, M.; Djurabekova, F. Growth of Nb Films on Cu for Superconducting Radio Frequency Cavities by Direct Current and High Power Impulse Magnetron Sputtering: A Molecular Dynamics and Experimental Study. Surf. Coat. Technol. 2024, 476, 130199. [Google Scholar] [CrossRef]
  18. Ding, J.C.; Zhang, T.F.; Mane, R.S.; Kim, K.-H.; Kang, M.C.; Zou, C.W.; Wang, Q.M. Low-Temperature Deposition of Nanocrystalline Al2O3 Films by Ion Source-Assisted Magnetron Sputtering. Vacuum 2018, 149, 284–290. [Google Scholar] [CrossRef]
  19. Houska, J. Pathway for a Low-Temperature Deposition of α-Al2O3: A Molecular Dynamics Study. Surf. Coat. Technol. 2013, 235, 333–341. [Google Scholar] [CrossRef]
  20. Pham, A.-V.; Fang, T.-H.; Nguyen, V.-T.; Chen, T.-H. Investigating the Structures and Residual Stress of Cux(FeAlCr)100−x Film on Ni Substrate Using Molecular Dynamics. Mater. Today Commun. 2022, 31, 103378. [Google Scholar] [CrossRef]
  21. Thompson, A.P.; Aktulga, H.M.; Berger, R.; Bolintineanu, D.S.; Brown, W.M.; Crozier, P.S.; in ’t Veld, P.J.; Kohlmeyer, A.; Moore, S.G.; Nguyen, T.D.; et al. LAMMPS—A Flexible Simulation Tool for Particle-Based Materials Modeling at the Atomic, Meso, and Continuum Scales. Comput. Phys. Commun. 2022, 271, 108171. [Google Scholar] [CrossRef]
  22. Sigumonrong, D.P.; Music, D.; Schneider, J.M. Efficient Supercell Design for Surface and Interface Calculations of Hexagonal Phases: α-Al2O3 Case Study. Comput. Mater. Sci. 2011, 50, 1197–1201. [Google Scholar] [CrossRef]
  23. Houska, J. Quantitative Investigation of the Role of High-Energy Particles in Al2O3 Thin Film Growth: A Molecular-Dynamics Study. Surf. Coat. Technol. 2014, 254, 131–137. [Google Scholar] [CrossRef]
  24. Matsui, M. Molecular Dynamics Study of the Structures and Bulk Moduli of Crystals in the System CaO-MgO-Al2O3-SiO2. Phys. Chem. Miner. 1996, 23, 345–353. [Google Scholar] [CrossRef]
  25. Yang, L.; Sun, L.; Deng, W.-Q. Combination Rules for Morse-Based van Der Waals Force Fields. J. Phys. Chem. A 2018, 122, 1672–1677. [Google Scholar] [CrossRef] [PubMed]
  26. Mourits, F.M.; Rummens, F.H.A. A Critical Evaluation of Lennard–Jones and Stockmayer Potential Parameters and of Some Correlation Methods. Can. J. Chem. 1977, 55, 3007–3020. [Google Scholar] [CrossRef]
  27. Bubenzer, A.; Dischler, B.; Brandt, G.; Koidl, P. Rf-plasma Deposited Amorphous Hydrogenated Hard Carbon Thin Films: Preparation, Properties, and Applications. J. Appl. Phys. 1983, 54, 4590–4595. [Google Scholar] [CrossRef]
  28. Houska, J.; Machanova, P.; Zitek, M.; Zeman, P. Molecular Dynamics and Experimental Study of the Growth, Structure and Properties of Zr–Cu Films. J. Alloys Compd. 2020, 828, 154433. [Google Scholar] [CrossRef]
  29. Breilmann, W.; Maszl, C.; Hecimovic, A.; Keudell, A. von Influence of Nitrogen Admixture to Argon on the Ion Energy Distribution in Reactive High Power Pulsed Magnetron Sputtering of Chromium. J. Phys. D Appl. Phys. 2017, 50, 135203. [Google Scholar] [CrossRef]
  30. Zhou, H.; Ji, Y.; Wang, Y.; Feng, K.; Luan, B.; Zhang, X.; Chen, L.-Q. First-Principles Lattice Dynamics and Thermodynamic Properties of α-, θ-, κ- and γ-Al2O3 and Solid State Temperature-Pressure Phase Diagram. Acta Mater. 2024, 263, 119513. [Google Scholar] [CrossRef]
  31. Tane, M.; Kimizuka, H.; Ichitsubo, T. Two Distinct Crystallization Processes in Supercooled Liquid. J. Chem. Phys. 2016, 144, 194505. [Google Scholar] [CrossRef]
  32. Eklund, P.; Sridharan, M.; Sillassen, M.; Bøttiger, J. α-Cr2O3 Template-Texture Effect on α-Al2O3 Thin-Film Growth. Thin Solid Films 2008, 516, 7447–7450. [Google Scholar] [CrossRef]
  33. Kohara, T.; Tamagaki, H.; Ikari, Y.; Fujii, H. Deposition of α-Al2O3 Hard Coatings by Reactive Magnetron Sputtering. Surf. Coat. Technol. 2004, 185, 166–171. [Google Scholar] [CrossRef]
  34. Alam, S.N.; Anaraky, M.; Shafeizadeh, Z.; Parbrook, P.J. Optimization of Nanocrystalline γ-Alumina Coating for Direct Spray Water-Cooling of Optical Devices. Bull. Mater. Sci. 2014, 37, 1583–1588. [Google Scholar] [CrossRef]
  35. Zhou, G.; Wang, L.; Wang, X.; Yu, Y. Deposition of Nanostructured Crystalline Alumina Thin Film by Twin Targets Reactive High Power Impulse Magnetron Sputtering. Appl. Surf. Sci. 2018, 455, 310–317. [Google Scholar] [CrossRef]
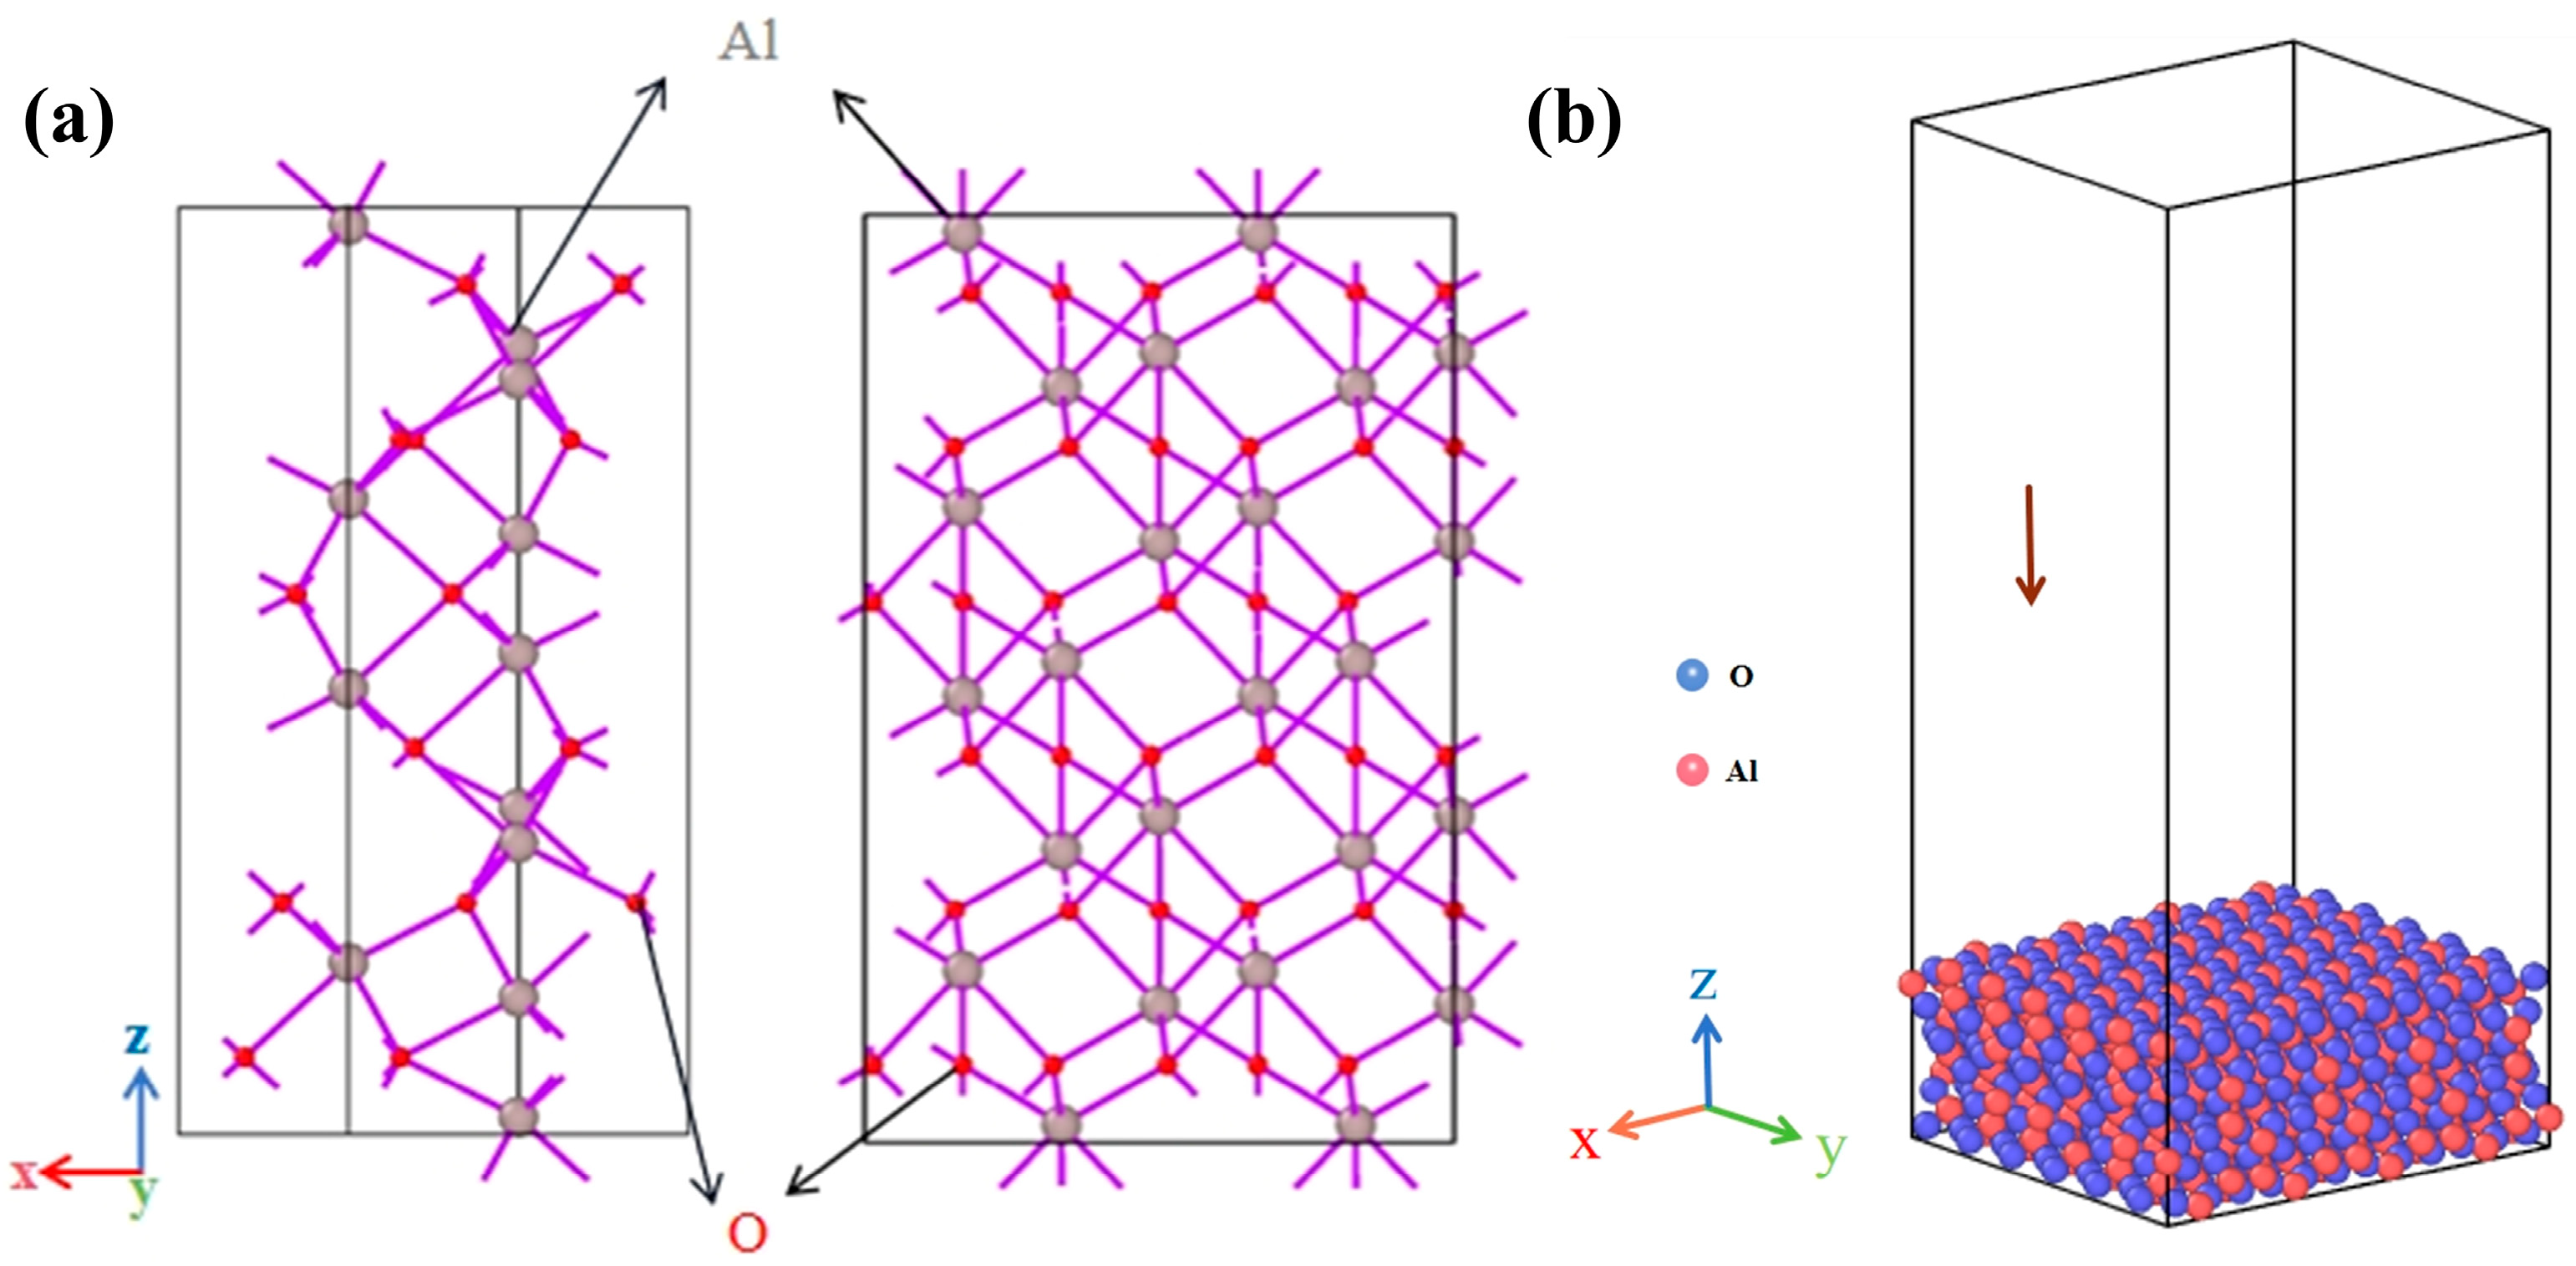
Figure 1. Schematic diagram of the model: (a) Trigonal and orthorhombic unit cells; (b) Substrate model.
Metals 14 00875 g001
Figure 2. Schematic diagram of the mass spectrometer position.
Metals 14 00875 g002
Figure 3. Ion energy distribution function for (a) 27Al+; (b) 36Ar+; (c)16O.
Metals 14 00875 g003
Figure 4. Panel a shows Al2O3 grown on α-Al2O3 (001) at T = 300 K~773 K (incident energy and ratio during deposition conform to the ion distribution in Table 4). Panels b and c show Al2O3 grown by α-Al2O3 (001) at T = 300 K~773 K under the application of −20 V and −40 V, respectively. The arrows indicate the boundary between the original substrate and the film.
Metals 14 00875 g004
Figure 5. RDF between Al and O atoms of films at different bias voltages: (a) 300 K, (b) 500 K, (c) 573 K, (d) 673 K, and (e) 773 K. Panel (f) shows the RDF of films at different temperatures for a bias of −40 V.
Metals 14 00875 g005
Figure 6. Structures of Al2O3 grown at T = 300 K (Panel (a)), 500 K (Panel (b)), 573 K (Panel (c)), 673 K (Panel (d)), and 773 K (Panel (e)), and at different temperatures when applying −40 V (Panel (f)).
Metals 14 00875 g006
Figure 7. Average coordination of Al atoms in α-Al2O3 (001) surface-grown thin films of Al2O3.
Metals 14 00875 g007
Figure 8. Correlation of medium-range order on temperature and energy quantified by the co-neighborhood statistic. The atomic pairs (each deposited film atom) in the figure are characterized by (a) ijk = 421 and (b) ijk = 422 (The FCC structure is characterized by 6 ternary 421s per atom and the HCP structure is characterized by 3 ternary 421s + 3 ternary 422s per atom, based on the above structure as a perfect crystal).
Metals 14 00875 g008
Figure 9. Surface topography obtained at different temperatures after the deposition was completed at a bias voltage of −40 V, (a) 300 K, (b) 500 K, (c) 573 K, (d) 673 K, (e) 773 K. The color bar indicates the height from the bottom of the substrate, the dark blue color indicates the substrate surface, and the top 39 Å of the film is marked by red.
Metals 14 00875 g009
Figure 10. XRD patterns of Al2O3 films deposited under different process parameters. (a) The substrate temperature is 773 K, and the bias voltages are 0 V, −20 V, and −40 V, respectively; (b) The substrate bias voltage is −40 V, and the substrate temperatures are 300 K, 573 K, and 773 K, respectively.
Metals 14 00875 g010
Figure 11. Average bond lengths of Al-O in Al2O3 films at different parameters (T = 300 K~773 K and Vb = 0 V~−40 V).
Metals 14 00875 g011
Table 1. Matsui (data from [24]) potential function parameters.
Interacting ParticlesA (eV)ρ (Å)C (eV·A6)
O-O6463.40.27685.22
Al-O28,4800.17234.63
Al-Al31,574,4700.06814.07
Table 2. Lennard–Jones potential parameters (data from [25,26]).
Potential Function CoefficientsArAlO
ε0.00978 eV0.39217 eV0.00844 eV
σ3.465 Å2.62 Å3.541 Å
Table 3. Substrate temperature and bias voltage for deposition of different thin film samples.
Samples 12345
Substrate temperature (K)300573773773773
Substrate bias (V)−40−40−40−200
Table 4. Percentage of each ion in IEDFs and average energy values.
Energy Division27Al+16O36Ar+
low energy0~3.15 eV0~8 eV
percentage35%80%
average1.2 eV2.45 eV
moderate energy3.15~13.2 eV8~34 eV
percentage55%17%3.5 eV
average7.5 eV18.6 eV
high energy13.2~25.5 eV34~60 eV
percentage10%3%
average16.9 eV48 eV
Table 5. Surface roughness at different deposition temperatures at a bias voltage of −40 V.
Temperature300 K500 K573 K673 K773 K
Rq (Å)1.39 ± 0.051.37 ± 0.021.42 ± 0.031.36 ± 0.030.92 ± 0.02
Disclaimer/Publisher’s Note: The statements, opinions and data contained in all publications are solely those of the individual author(s) and contributor(s) and not of MDPI and/or the editor(s). MDPI and/or the editor(s) disclaim responsibility for any injury to people or property resulting from any ideas, methods, instructions or products referred to in the content.