Article

Analysis of Inclusions and Impurities Present in Typical HPDC, Stamping and Extrusion Alloys Produced with Different Scrap Levels

1
Eurecat, Centre Tecnològic de Catalunya, Unit of Metallic and Ceramic Materials, Avda. Universitat Autònoma 23, 08290 Cerdanyola del Vallès, Spain
2
Lukasiewicz Research Network—Institute of Non Ferrous Metals, Light Metals Centre, Pilsudski 19 Street, 32-050 Skawina, Poland
*
Author to whom correspondence should be addressed.
Metals 2024, 14(6), 626; https://doi.org/10.3390/met14060626
Submission received: 5 April 2024 / Revised: 17 May 2024 / Accepted: 20 May 2024 / Published: 25 May 2024

Abstract

:
The European Green Deal poses a two-pronged challenge for the automotive industry: migrating to solutions based on light structures, requiring lightweight concepts and light materials, while at the same time avoiding dependence on the importation of these advanced materials. Aluminium alloys are lightweight and cost-effective materials that can successfully meet the requirements of many structural applications; however, their production requires bauxite and other Critical Raw Materials (CRMs), such as Si and Mg. Aluminium alloys are fully recyclable, but scrap is usually contaminated and its use is related to an increment of impurities, tramp elements and undesired inclusions. Traditionally, the use of secondary alloys has been restricted to low-performance applications. The present work analyses the effect that the use of scrap has on the quantity of inclusions present in the alloy and on other properties relevant for material processing. This study was carried out using common alloys associated with three of the most common aluminium processes used in the car manufacturing industry: high-pressure die casting (HPDC) (AB-43500), extrusion (6063) and sheet metal forming (5754 and 6181). The reference alloys were mixed with different levels of scrap (0, 20, 40, 60, 80 and 100%), with an aim to keep the chemical composition as unaffected as possible. The inclusion level of the alloy was characterized using the Prefil Footprinter® test. In addition, the obtained materials, after being cast in an open mould, were subjected to metallographic characterization. Relevant properties were measured to assess the processability of the alloys for the corresponding transforming process using the flowability test for the HPDC alloy and high-temperature compression for the extrusion alloys. The results obtained suggest that the number of inclusions present in the melt highly increase with the amount of scrap used to produce the alloy. These inclusions are also related to a significant loss of flowability, but do not have a noticeable impact on microstructure.

1. Introduction

The European Green Deal poses a two-pronged challenge for the automotive industry: migrating to solutions based on light structures, requiring lightweight concepts and light materials, while at the same time avoiding dependence on the importation of these advanced materials.
Aluminium is a lightweight and cost-effective material that can successfully meet the requirements of many structural applications. The use of aluminium in vehicles has been steadily growing over the last few decades [1], substituting steel and cast iron and making vehicles more efficient and less fuel-demanding [2]. As a reference, a weight reduction potential of up to 20–30% was estimated by making use of high-performance aluminium grades when compared to traditional steel-based construction [3]. However, these high-performance parts need to be produced using primary aluminium alloys requiring bauxite, as well as other alloying elements classified as sensitive by the CRM alliance, the most common of those being metallic silicon (Si) and magnesium (Mg).
While aluminium recycling is widespread in the automotive industry, recycled alloys are currently not able to fulfil the property requirements for structural applications due to limitations in their formability and mechanical performance. As a reference, a 2011 study estimated that in the making of high-performance alloys, recycled scrap accounted for approximately one-third of the input materials, with the rest being primary alloys [4]. Moreover, parts traditionally produced with the intensive use of recycled aluminium (motor blocks, gear boxes, oil pans, valve covers) [5] are not present in electrical vehicles. Therefore, a better understanding of how scrap affects aluminium’s properties is required in order to develop new high-performance, environmentally and strategically sustainable aluminium grades and their forming processes, which is fundamental for the sustainable electrification of the automotive industry.
The assessment of the purity of aluminium alloys is critical for both quality and process control and is defined by the number of inclusions (native and/or exogenous particles) present in the molten metal [6,7]. Depending on the size and proportion of the inclusions, i.e., a single large inclusion or a large number of small inclusions, these can have a negative effect on the mechanical and chemical properties of the final product.
For cast products, in order to be able to produce the highest possible quality aluminium alloy, liquid metal preparation processes are carried out first [8,9]. These processes require effective purification and refining procedures, for which salt additives are used and refining is carried out by degassing [6,8,9,10,11].
In the case of wrought products, material improvement needs to be performed during the production of the intermediate form; e.g., hot rolling for a sheet metal grade, extrusion of a cast ingot through a die, or shaping a bulk material through hot forging. All these hot forming processes change the cast microstructure into a more homogeneous and textured recrystallized morphology; correcting segregation while at the same time fragmenting inclusions and closing small voids. Despite these measures, the impurity content still affects the mechanical properties of the material. In the particular case of sheet metal, intermetallic particles can be detrimental to the formability of the alloy, as discussed, for instance, in references [7,12].
On the other hand, alternative processing strategies exist for high-purity alloys, such as filtration. In this case, the casting process is carried out by pouring the liquid metal through appropriately selected ceramic filters [6,10]. By using this procedure, a significant amount of solid inclusions are entrapped in the filter and do not reach the product. This process can also be used as an analytical device to characterize the inclusion profile in an alloy; the work in this paper has been performed using this technique.
A great deal of research has already been performed on the subject of inclusion analysis, which has led to the division of impurities into groups: oxide films, carbides, magnesium oxides, refractory materials, compounds formed during the melt treatment, other contaminations, and additives [10]. In the case of casting alloys, it has been shown that oxide films in solid aluminium alloys are formed by the entrainment of the surface of the metal in the liquid state. The oxide layers act as substrates for the precipitation of other phases on their wetted external surfaces. Oxides observed in Al-11.5Si-0.4Mg casting alloys include MgAl2O4, Al2O3 and MgO. Oxide is one of the most deleterious and pervasive inclusion types present in Al-Mg melts. They are generally formed by oxidative reactions due to the high oxygen affinity that it exhibited by aluminium and magnesium. In Al-Mg alloys, the tendency to oxidize increases rapidly with increasing Mg content. The oxidation reaction path depends on the amount of Mg and probably starts with the formation of amorphous MgO, MgAl2O4 or Al2O3, which then transforms into crystalline MgO, MgAl2O4 or γ-Al2O3 films. The high concentration of Mg on the alloy surface promotes the initial oxidation into MgO. Moreover, since MgAl2O4 is more thermodynamically stable than MgO, MgO gives way to MgAl2O4 with longer reaction times [13,14]. The MgAl2O4 spinels are the most detrimental inclusions in aluminium alloys because of their large size and hardness. Spinel (MgAl2O4) is the most common type of inclusions found in experimental alloys due to the fact that all of them are alloyed with magnesium. Aluminium oxide (Al2O3) is formed either under conditions of local magnesium depletion or is derived from the feedstock. The MgO film can come from the original ingots. SiO2 inclusions are trapped either in the sand or in the refractory material and are themselves surrounded by an oxide film [15].
These oxide layers and inclusions are also present in wrought alloys. Samples of AA5038 alloys taken in the Wagstaff plant at a temperature of 680–690 °C contained Al2O3 inclusions, which could have originated from the electrolysis raw material (aluminium oxide not dissolved in the salt bath), or from the refractory filter or from the casting ladle. Spherical agglomerates of magnesium and aluminium silicate and TiB2 particles formed from AlTi5B1 grain refiner additions were observed at the interface between the ceramic filter and the 5038 alloy [9,16]. Microscopic analysis of the inclusions above the filter as well as the billet samples showed the presence of magnesium oxides and spinels due to Mg contents of 0.4 to 0.55% in the 6063 alloys. In addition to the dominant oxides, TiB2 and Al4C3 inclusions were also observed. The carbides are formed during the reduction in the pot cells in the aluminium smelting process. Al4C3 inclusions < 3 μm are not considered harmful. TiB2 agglomerates were present in significant amounts and formed as a result of the addition of the AlTi5B1 grain refiner to the melt. For alloys purified by SNIF degassing, it has been shown that oxides greater than 50 μm and borides greater than 20 μm are removed while smaller borides agglomerate [6].
The chemical reactivity leading to the formation of non-metallic inclusions, their decomposition and size is mainly due to small changes in the chemical composition of the alloy and the conditions under which the process of preparing the liquid metal for casting is carried out [6,17]. Therefore, in the current research to achieve a zero waste effect, it is extremely valuable to know how to remelt scrap with maximum contributions.
This paper presents an analysis of the effect of increased scrap content on the microstructure and formability of alloys in HDPC, sheet metal and extrusion processes. A Prefil Footprinter® was used to control the level of inclusions by assessing the liquid metal flow rate and the type and size of inclusions appearing in the filtered material as a function of the scrap content. Specific performance tests to assess alloy processability were employed for the different materials, including the flowability for HPDC, the hot compression ductility for the extrusion alloys and the microstructural evolution for the sheet metals.

2. Materials and Methods

2.1. Materials

2.1.1. Aluminium Alloys

Alloys corresponding to three different production processes were analysed: AB-43500 for high-pressure die casting (HPDC), 6063 for extrusion, and finally age hardening 6181A and strain hardening 5754 for sheet metal. The aim of this choice was to select representative examples of the major types of aluminium alloys and forming processes used in passenger automobiles. Chemical composition of the source materials used in this work is shown in Table 1.

2.1.2. Scrap

In order to obtain different levels of recycling, base materials were increasingly mixed with scrap from similar alloys. This procedure will be described in Section 2.2. Scrap fragments were sorted based on their morphology and appearance. Sorting methodologies proposed will be described in a specific article in the future.
For die casting, scrap consisted of typical die cast parts; chemical analysis was performed on selected examples, and average values are reported in Table 2 as “die casting scrap”.
For extrusion and sheet metal materials, the reference alloy was mixed with selected scrap initially identified as 6xxx series fragments, even though, upon closer inspection, some residual 5xxx and even 3xxx series could be visually identified. An analysis of the scrap composition was performed by measuring 10 different 6xxx series scrap fragments. The average chemical composition of the scrap is presented in Table 2.

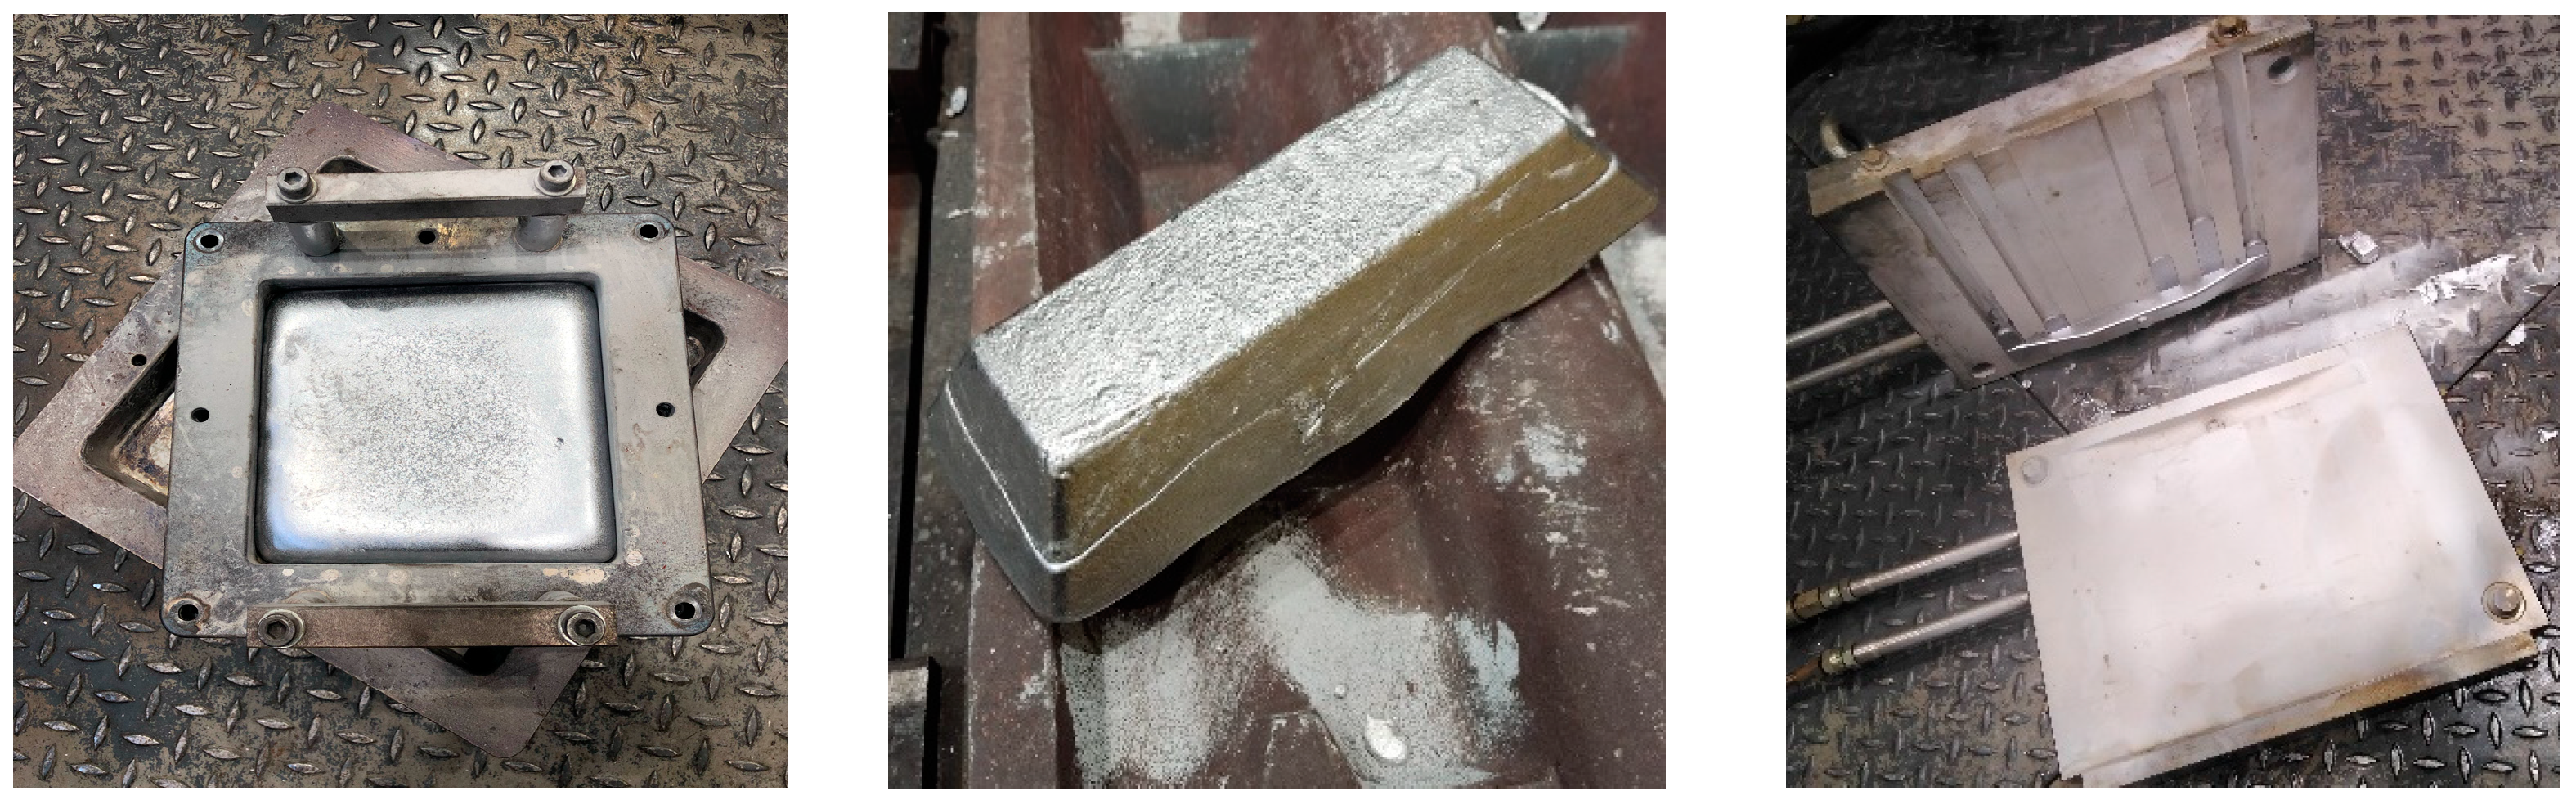
2.2. Sample Production

For each alloy, specimens were produced for material characterization with different levels of scrap: 0, 20, 40, 60, 80 and 100%. In order to combine several of these tests into one single trial, we used the approach of starting with 100% reference alloy or 100% scrap and adding the other component, first, to a concentration of 20% and then, in a second step, to a concentration of 40%.

2.2.1. HPDC

For the tests with the HPDC alloys, the furnace was charged with about 24.4 kg of one of the materials, either ingots of AlSi10MnMg alloy or of scrap and heated up to a temperature of 710 ± 10 °C.
Scrap was sequentially added; the composition of the different mixtures investigated is presented in Table 3. From the results obtained for the 100% scrap, it can be inferred that the average composition obtained from the measured scrap is in line with the actual average composition of the scrap, and most of the scrap belongs to AB-43500 alloy.
Three different sample types were cast from the melt: 3 square plates, 3 small ingots and 1 flowability test specimen (Figure 1). These plates (150 × 150 mm) were filled up to about 25 mm and were used to measure the chemical composition of the batch and to observe the alloy’s microstructure.

2.2.2. Extrusion Alloy: 6063

The base material used was 6063 alloy extrusion billets produced by the company ASAS (Table 1); the reference alloy was mixed in different proportions with selected “6xxx-scrap” (Table 2).
A similar procedure as described for the HPDC tests was carried out. About 24.4 kg was charged into the furnace; additions of either scrap or billet were introduced into the melt to modify the proportion of feedstock materials used. A total of 3 square plates and 3 small ingots (Figure 1) were cast in each step and were used to characterize the alloys with Prefil Footprinter® and optical microscopy following the same procedure described for HPDC. The chemical composition measured by spectrometry from one of the plates for each batch produced is presented in Table 4.

2.2.3. Sheet Metal Alloys 6181A and 5754

The company Profilglass supplied commercial 6181A alloy sheets, 2 mm thick, cut in 900 mm × 500 mm blanks. The chemical composition, as determined through spectroscopy, is reported in Table 1. The blanks were melted in the furnace mixed with different proportions of “6xxx scrap” (Table 2). The content of Si and Mg was corrected with the addition of master alloys of the corresponding elements. The chemical composition obtained for each batch is presented in Table 5.
For 6181 (Table 5), the main alloying elements fall within acceptable limits inside the whole range of trials, with some observations. Iron is kept fairly low, mainly due to the carefully selected scrap; in fact, the level of Fe decreases as scrap rate is increased. This behaviour is not expected to be representative of a scaled-up case of circularity in the current industrial environment, as seen in reference [12]. Manganese was the other element flagged as conflictive, as the used scrap may have included 3xxx-series profiles. Manganese turned out to not be an issue due to the scrap selection. Finally, Zn and trace elements Cr and Ti did not significantly worsen throughout the experiment.
As the desired alloying elements, silicon and magnesium were already present in the scrap mix, and additions were calculated considering the average contribution presented in Table 2. Amounts were slightly miscalculated, resulting in an increase in Si content, but it was within the acceptable range of the alloy. Magnesium, on the other hand, was expected to be partially recovered from scrap in the mix. Unfortunately, this contribution was overestimated, and resulted in decreased alloying content throughout the experiment. It is believed that part of this Mg difference may have oxidated into the dross.
In the case of 5754 alloy, the base material was again 2 mm thick commercial 5754 blanks, 900 mm × 500 mm in size; chemical composition is presented in the first row of Table 6. As in the previous experiments, this material was mixed with scrap that had been identified as 5xxx sheet rests in increasing amounts. In this case, it is noteworthy that the selected scrap appeared to include some fragments of 6xxx alloy.
As a result of this mixture, the chemical composition (Table 6) did not remain as stable as in 6xxx; the value of silicon in particular experiences significant drift and falls out of specification already at the 40% scrap level. Fe, Cu and Mn, however, are kept in the acceptable range of the alloy, as the 5754 standard tolerates relatively high levels of these elements.
From each of the batches, specimens in the shape of ingots and plates were cast (Figure 1) to characterize the alloy properties with the Prefil Footprinter® ABB, Québec, Canada (Figure 2) and light microscope.

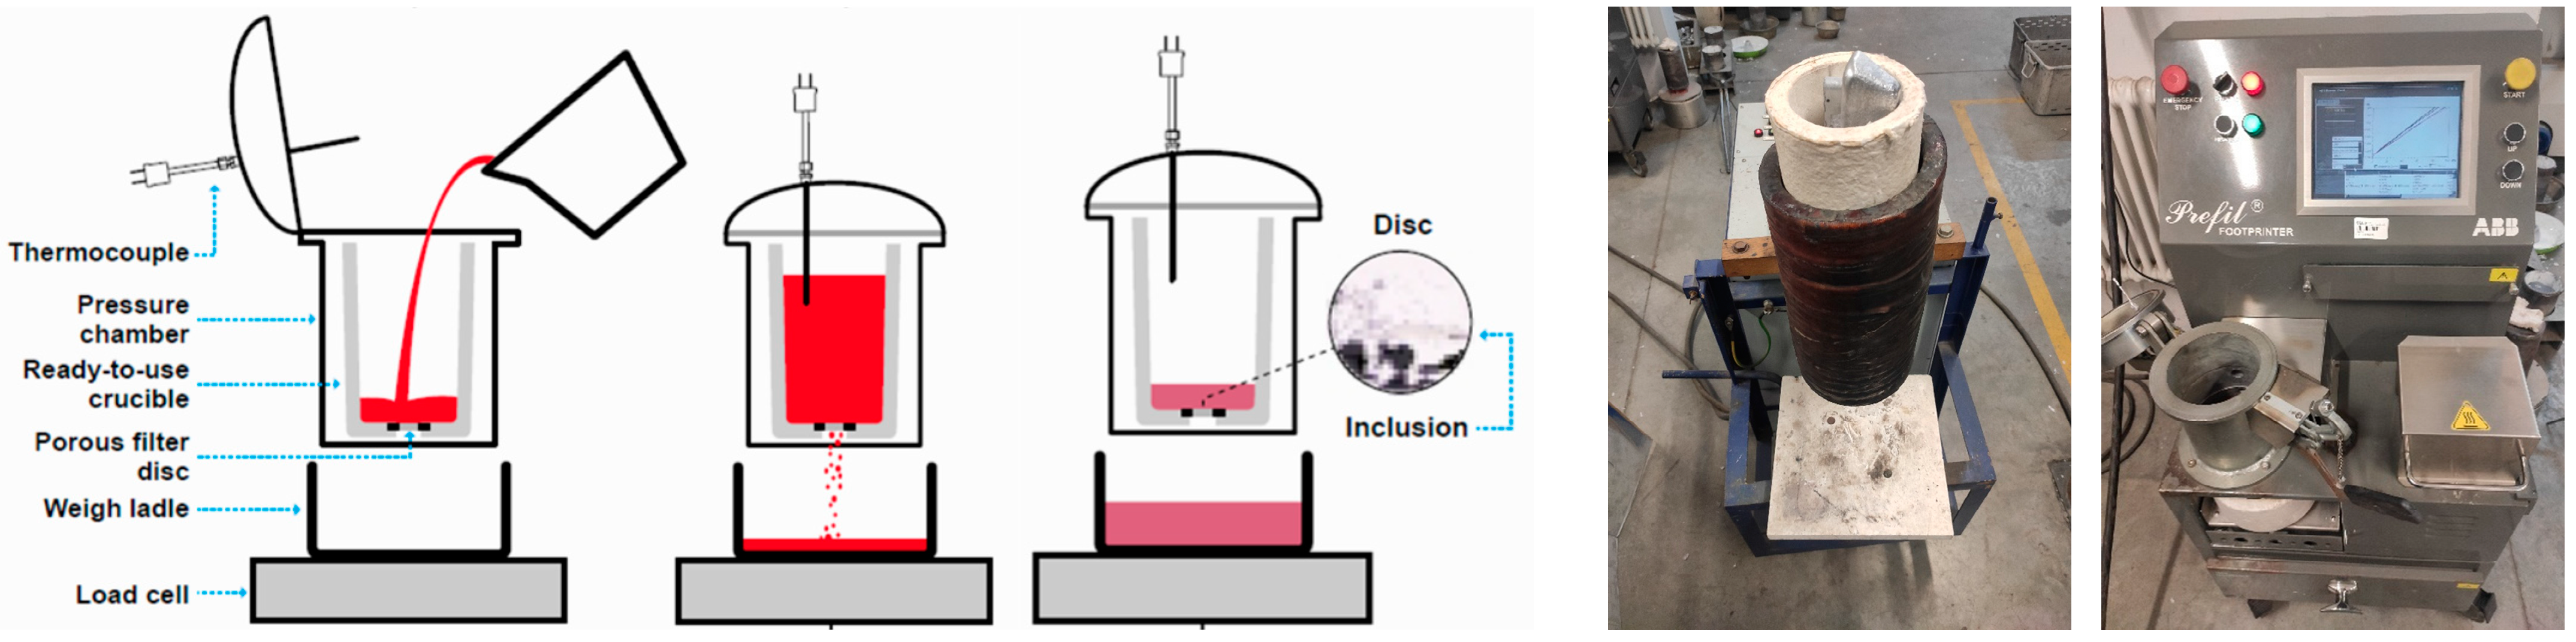
2.3. Filtration and Analysis by Means of Profil Footprinter®

Ingots produced for each of the material variants, with an average weight of 1.5 kg and approximate measures of 240 × 90 × 45 mm, were remelted for the Prefil Footprinter® test, an instrument used to determine the amount and type of inclusions present in alloy, based on the pressure filtration principle (Figure 2). A ready-to-use crucible, equipped with a porous filter disc at the bottom, was preheated and installed in the pressure chamber. Then, a sample of liquid metal, remelted at 730–740 °C, was taken and poured into the crucible. The test started once the metal was at 700 °C. During the test, the system continuously weighed the metal and displayed a curve of the accumulated weight versus the elapsed time.
Figure 2. Images of the Prefil Footprinter® equipment: scheme of the equipment adapted from Ref. [18] with the different parts and steps of the test (left), picture of the crucible (middle) and picture of the screen (right).
Metals 14 00626 g002
Metallographic analysis consists of examining the residue of unfiltered metal collected on the filter surface of the Prefil Footprinter®. The Prefil Footprinter® device uses a filter with a pore size of 90 μm. The residue remaining in the filter was sectioned through the central plane perpendicular to the disc, ground and polished to a mirror-like finish. Metallographic examinations were observed on light microscopy (LM) Zeiss Axio Observer 7 and scanning electron microscope (SEM) Inspect F50 with energy-dispersive X-ray spectroscopy (EDS) EDAX chemical analysis in microareas. Research on the identification of inclusions involved the use of the EDS technique, which enables the analysis of the chemical composition in microareas on the sample surface. The quantitative analysis of inclusions was carried out on LM and SEM pictures. The content of the inclusions concentrated on the surface of the test filter is then quantified using image analysis software. This was then normalised by both nominal chord length, and by the mass of metal filtered, to give the familiar units of mm2/kg according to the generally accepted formula [19,20]. The inclusion concentration is reported in mm2/kg, indicating the area of inclusions in the sectioned part. Inclusions are classified arbitrarily regarding the class and content (in mm2/kg).

2.4. Additional Tests

Tests were performed on the various material variants. The aim of these tests was to evaluate a property or characteristic relevant for each of the applications; this way, flowability was measured for HPDC alloys; hot compression behaviour was measured for extrusion metals; and sheet metal samples were recrystallized by introducing deformation, and their hardness was measured.

2.4.1. Flowability (HPDC Alloys)

Alloy castability is a basic requirement for any aluminium casting alloy. One of the physical properties that relate to the casting ability is the alloy fluidity. Experimentally, there are different setups to assess alloy fluidity or flowability [21]. For the present study, a mould and procedure to assess aluminium alloy flowability were designed and tested [22] and a paper dedicated to flowability test results is currently under preparation. Flowability specimens, with 6 strips of different thicknesses (1, 3, 5, 7, 9 and 11 mm), were cast and measured to determine the alloy flowability of the batch produced for the different scrap level.
The flowability tests were conducted at the same melt temperature as the casting of the rest of the specimens (710 ± 10 °C). The mould was equipped with tempering circuits, where oil at 180 °C was circulated at least 30 min before starting the tests [22].

2.4.2. Hot Compression (Extrusion Alloys)

To evaluate the behaviour of the processability of the aluminium under extrusion conditions, hot compression tests were performed, as they are commonly used in the literature to assess the alloy extrudability [23,24]. Cylindrical samples of 8 mm in diameter and 12 mm in length were extracted from the ingots and compressed in an Instron 5582 universal testing machine at a temperature of 500 ± 5 °C. Samples were heated for 15 min before testing, and the test was conducted as crosshead speeds of 250 and 450 mm/min until reaching 65% deformation. All contact points between the samples and the testing equipment were lubricated.

2.4.3. Production of Hot-Deformed Samples (Sheet Metal)

In order to produce representative materials for microstructure and hardness analysis, a hot deformation and recrystallization procedure was followed. The aim of this step was to transform the cast ingots into a microstructure comparable to a wrought alloy.
These samples were cut into small blocks, forged in a press to an approximate 40% reduction at 530 °C and finally annealed at 550 °C for 10 min and quenched, in order to force some recrystallization to occur and break the casting structure.
After this, the samples were subject to post-processing: 6181A samples were then subject to artificial aging for 1 h at 200 °C. On the other hand, 5754 samples were cold-formed at approximately 60% reduction to verify that the material showed the desired strain hardening behaviour; these conditions were chosen as relevant based on the work of Snopinski et al. [25].

3. Results

3.1. High-Pressure Die Casting (HPDC) Alloys

3.1.1. Flowability Test Results

In order to assess the processability of the AB-43500 alloy developed for HPDC, strip moulds with different thicknesses were used. The lengths of the strips for the different samples investigated in the flowability test are presented in Table 7.
It can be observed that, in general, the materials obtained with a higher amount of scrap show a lower flowability than the ingot or those with a lower scrap content. Another observation that can be made is that, in general, the metal flows better in the right side of the mould (channels 3, 7 and 9 mm thick) than in the left side of the mould (1, 5 and 11).

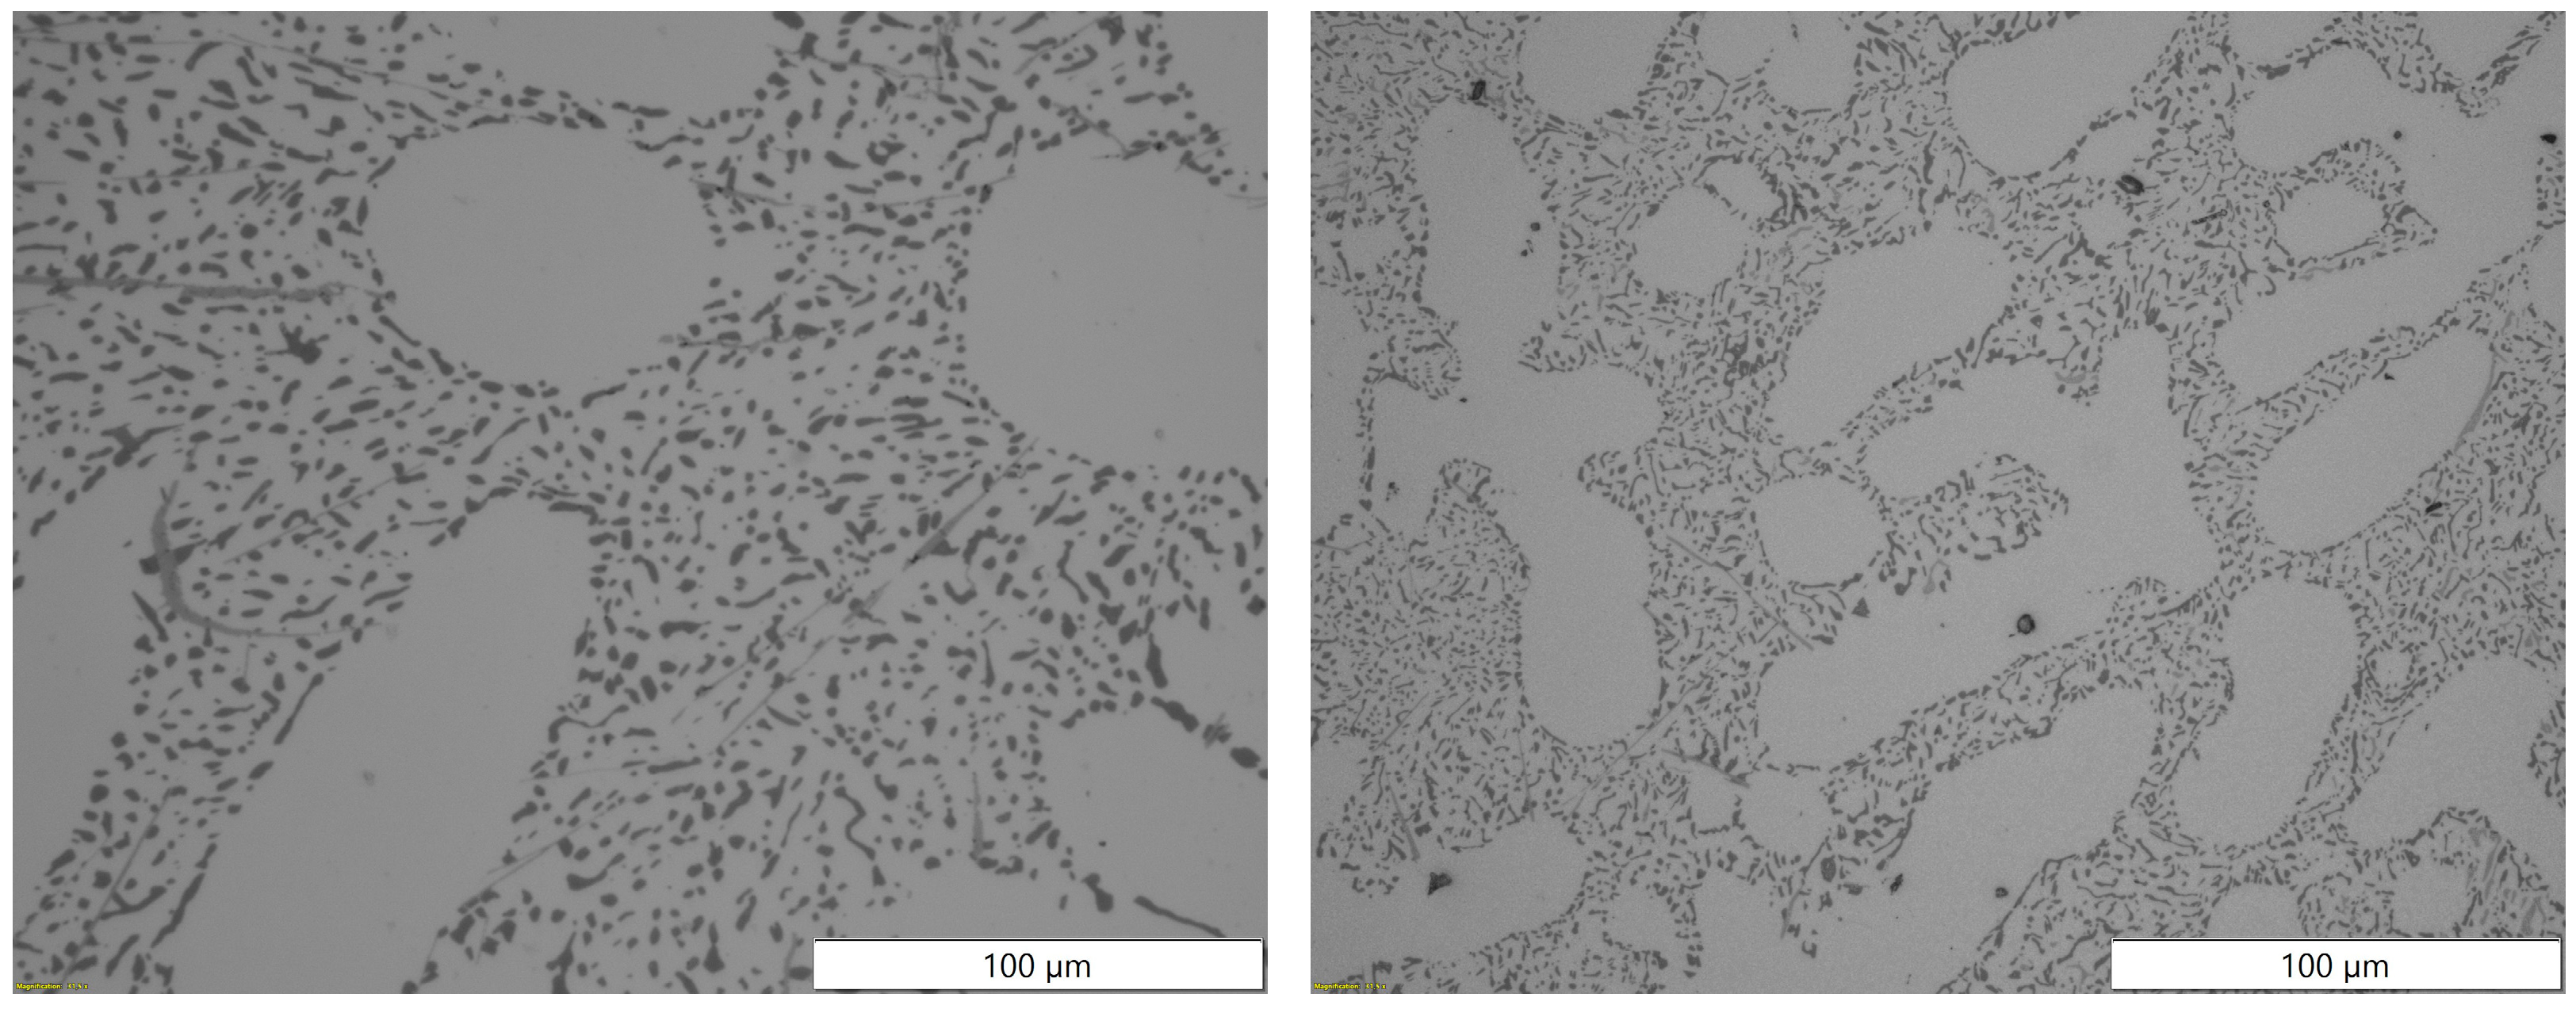
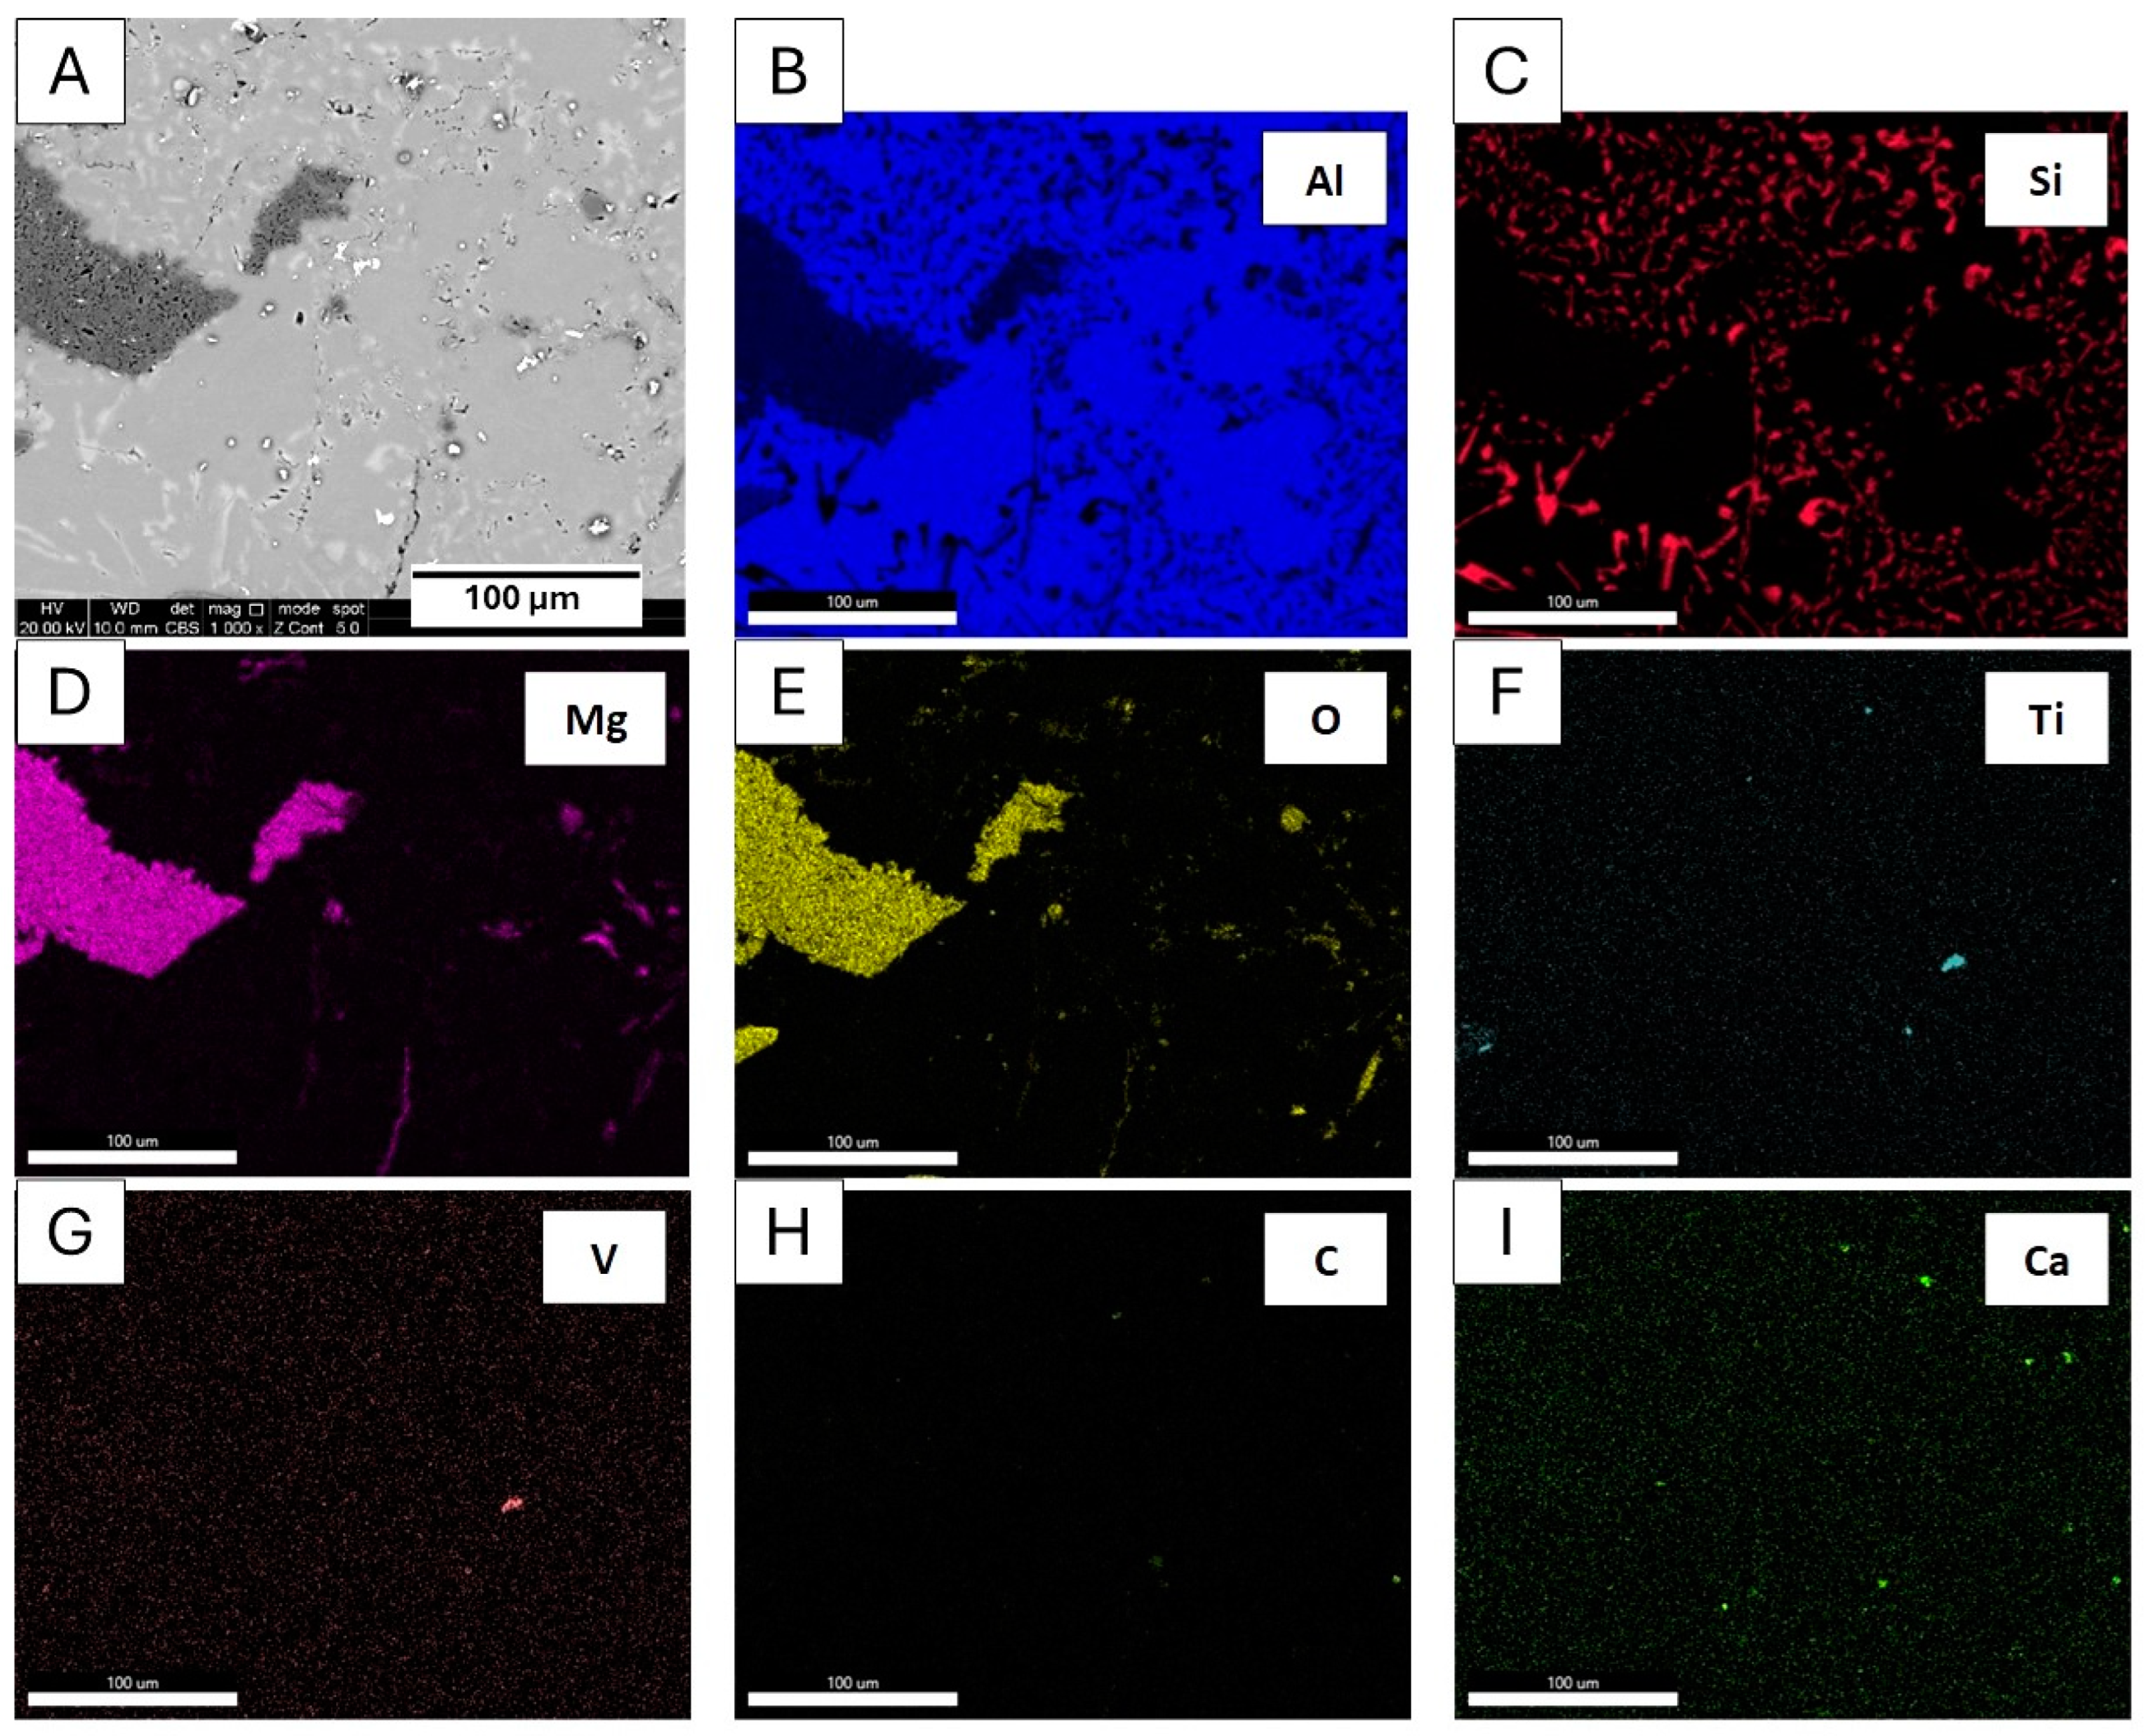
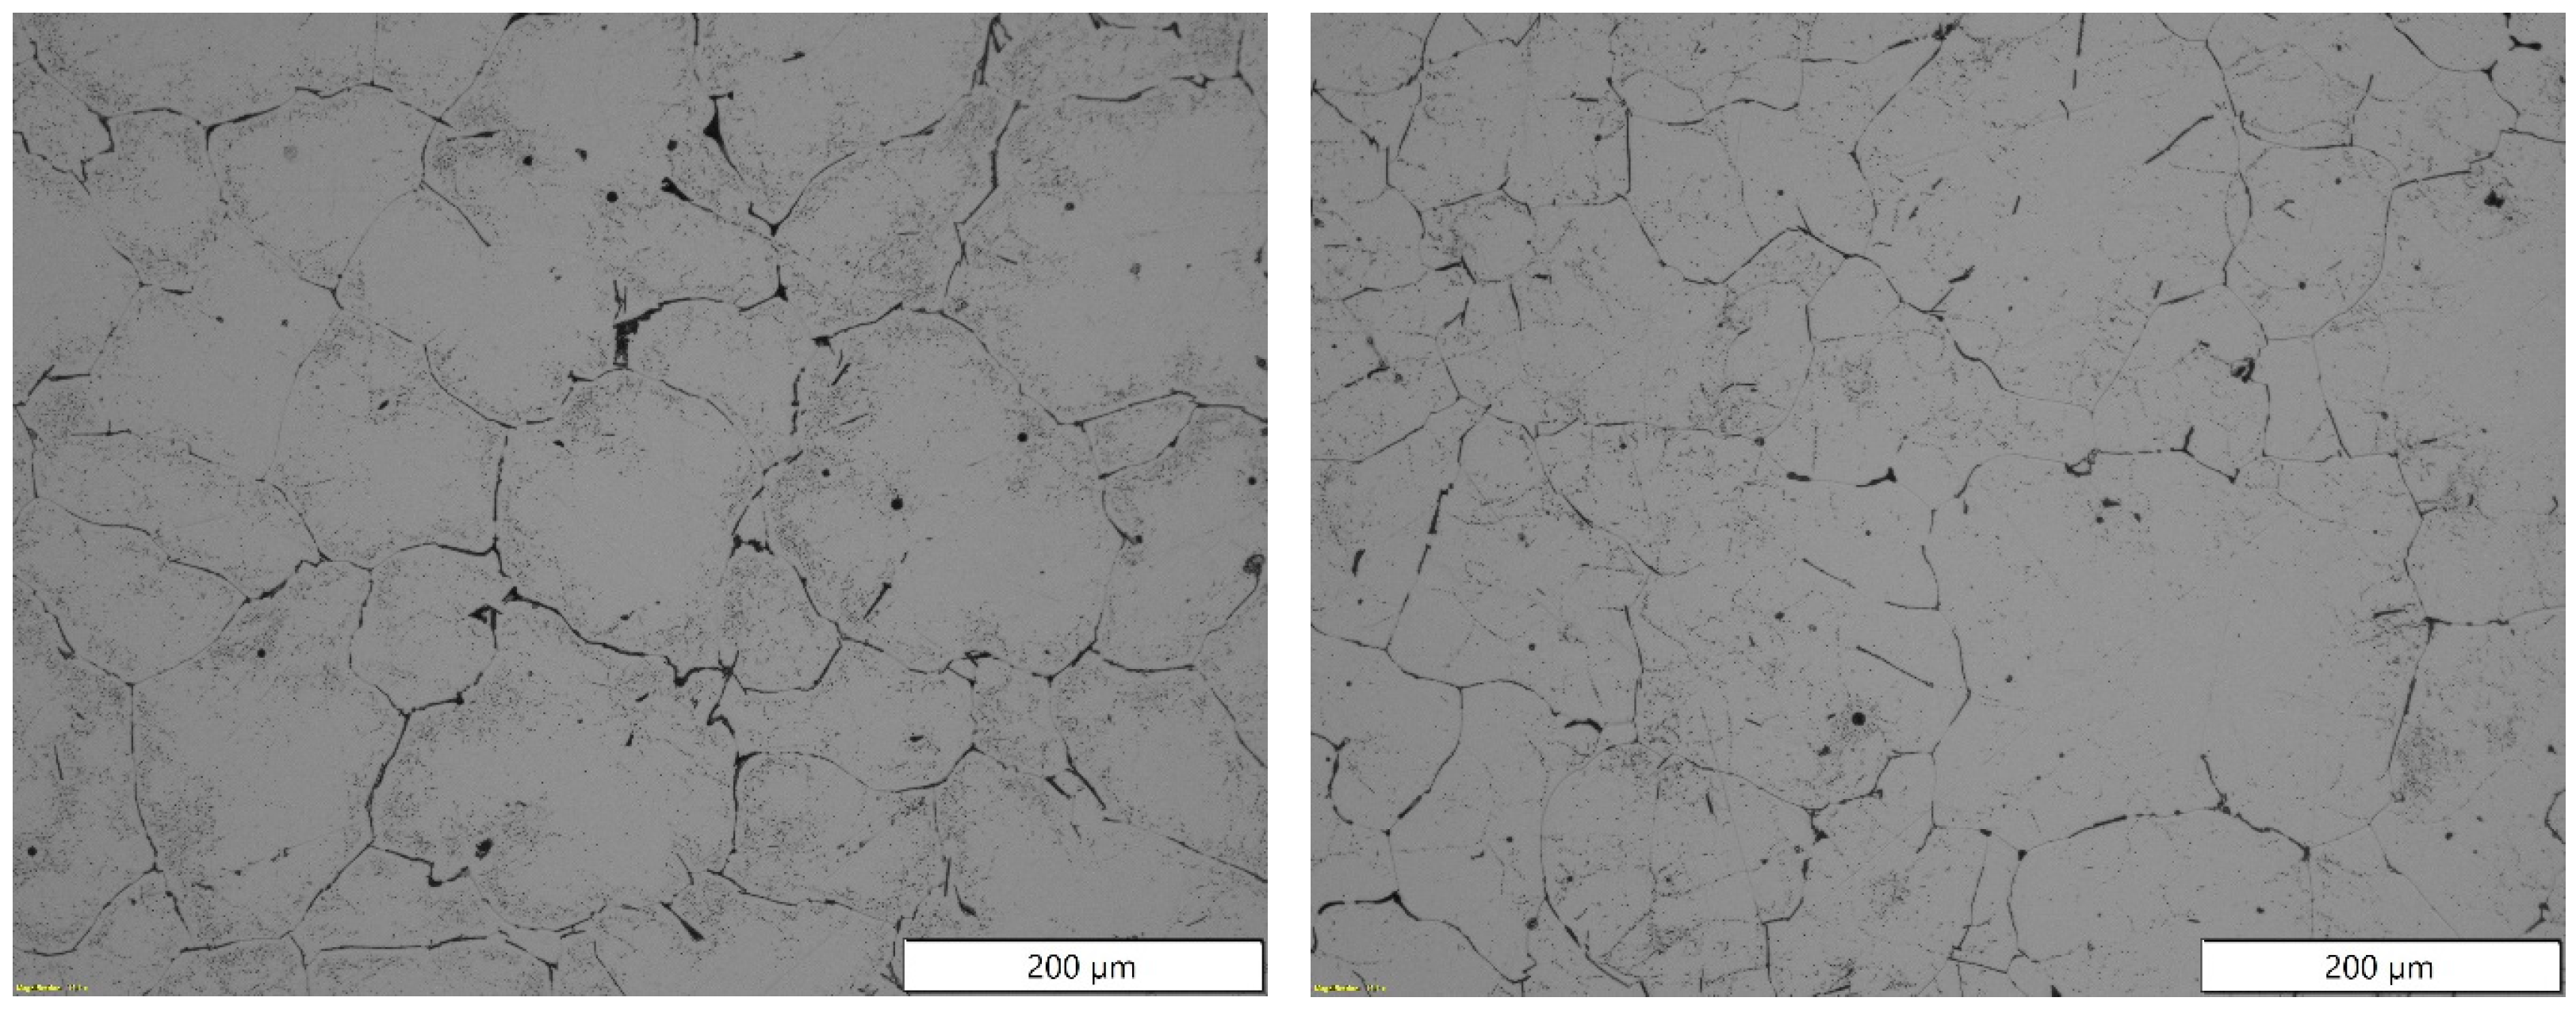
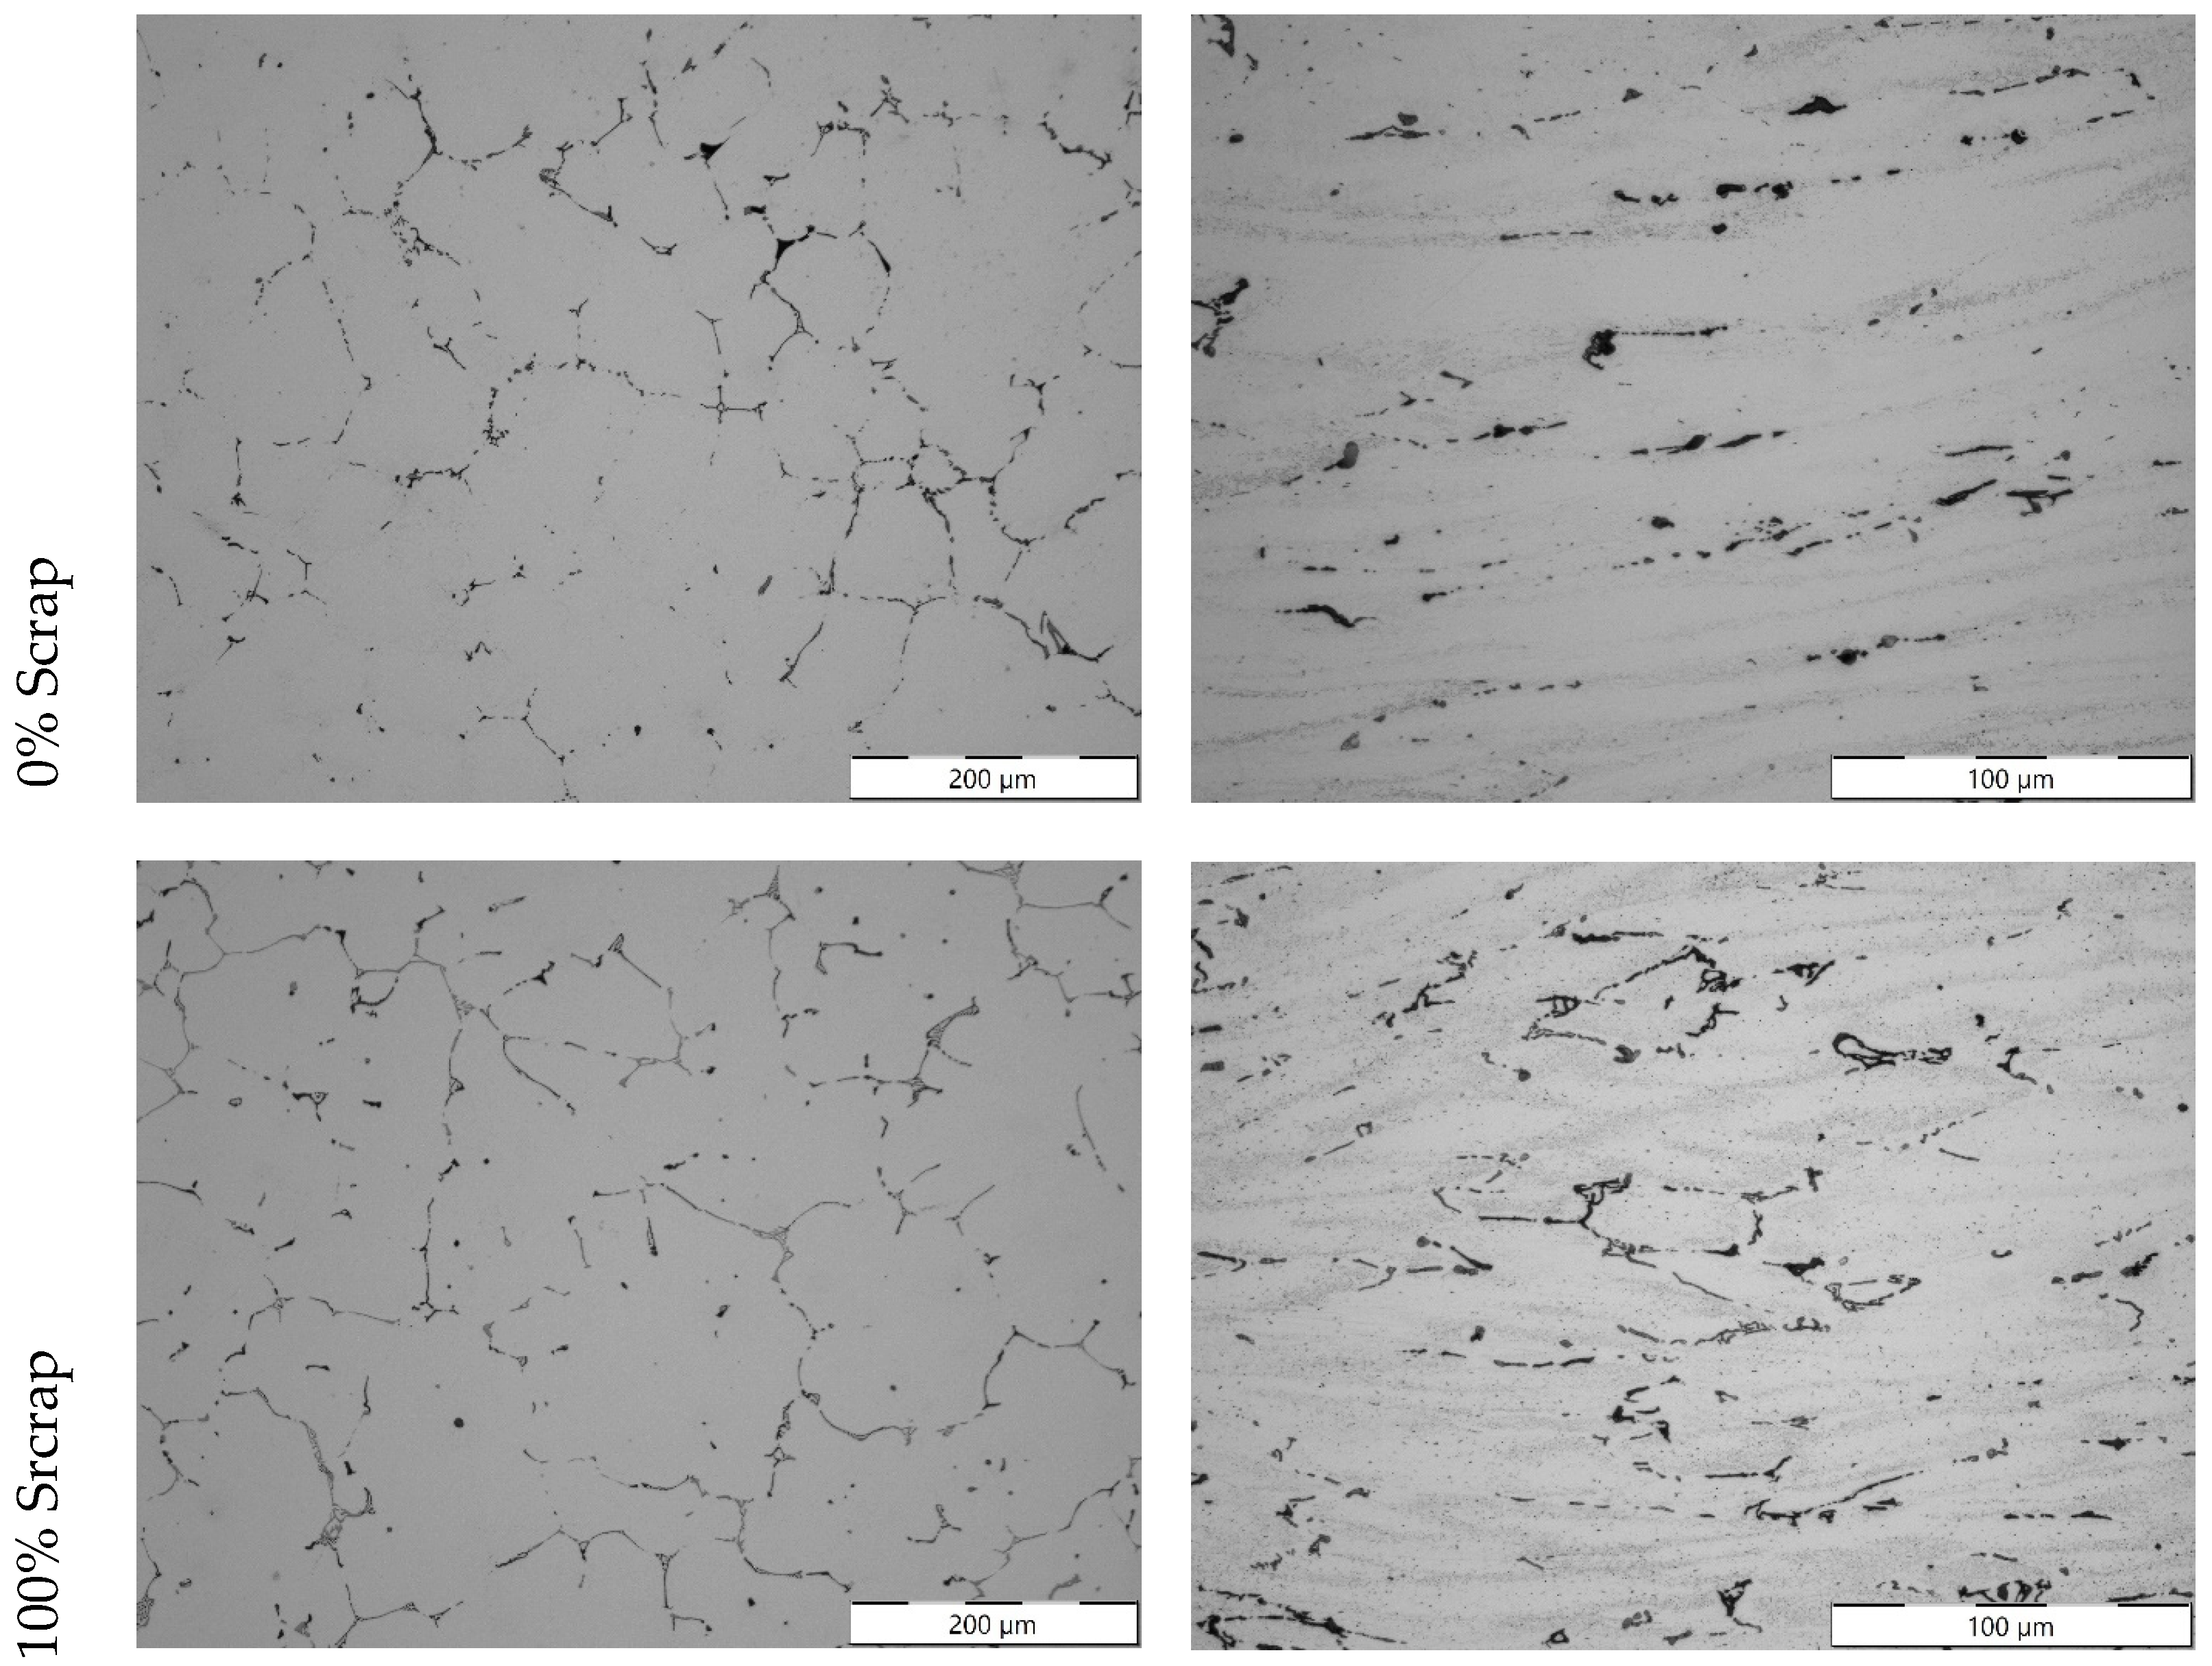
3.1.2. Microstructure

The observation of polished specimens extracted from the produced square plates (Figure 1) revealed a similar microstructure for all six scrap proportions. No new phases or foreign particles were detected in the specimens with a higher scrap content; neither a significative difference in the shape or size of the different phases was observed (Figure 3).

3.1.3. Prefil Footprinter®

Table 8 summarises the main results of the Prefil Footprinter® test. For each of the batches, a decrease in the rate of filtration is observed with an increase in the proportion of scrap used. The filtration rates obtained for the AB-43500 alloy decreased when the proportion of scrap in the alloy was increased. It was observed that samples with a 0 and 20% scrap content presented a high filtration rate of 17–14 g/s; in the samples with a 40–60% scrap content, the filtration rate was decreased to about 13 g/s and for the samples with 80 and 100% scrap, the filtration rate was about 10 g/s.
It is observed that an increase in the amount of scrap led to a higher filtration time caused by an increase in the amount of settled contaminants in the filter.
The samples from the filtered inclusions were cut and metallographic analysis was performed on the polished surfaces close to the ceramic filter where the inclusions were located. The samples were analysed using SEM. Figure 4 shows the results of the quantification of the microinclusions. Figure 5B–I shows an example of the EDS elemental mapping analysis on an SEM image (Figure 5A) for the specimen produced with 80% scrap. As similar results in terms of the inclusion type and distribution were found, only the sample with the highest content of identified inclusions is reported here.
The elemental distribution profile obtained by the mapping (Figure 5) technique shows that the dark inclusion compounds are rich in Mg, O and/or Al, which were identified as magnesium oxides and spinel, and the brighter compounds are rich in Ti and V, which were identified as additions. In addition, the presence of compounds rich in Si or Ca and O was observed; these were identified as refractory materials, and this also revealed the carbides were mainly compounds rich in C.
The analysis of the chemical composition of the inclusions above the filter in the tested samples of alloy AB-43500 (Figure 5) shows that the most common component present in the filter residue was magnesium oxides (MgO, MgAl2O4—cuboid, MgAl2O4—spinel). For pure alloy with 0.2% Mg, the total inclusion content (TIC) was 0.01 mm2/kg, while for the samples containing 80% and 100% scrap, the TIC was approx. 0.4 mm2/kg.

3.2. Extrusion Alloys

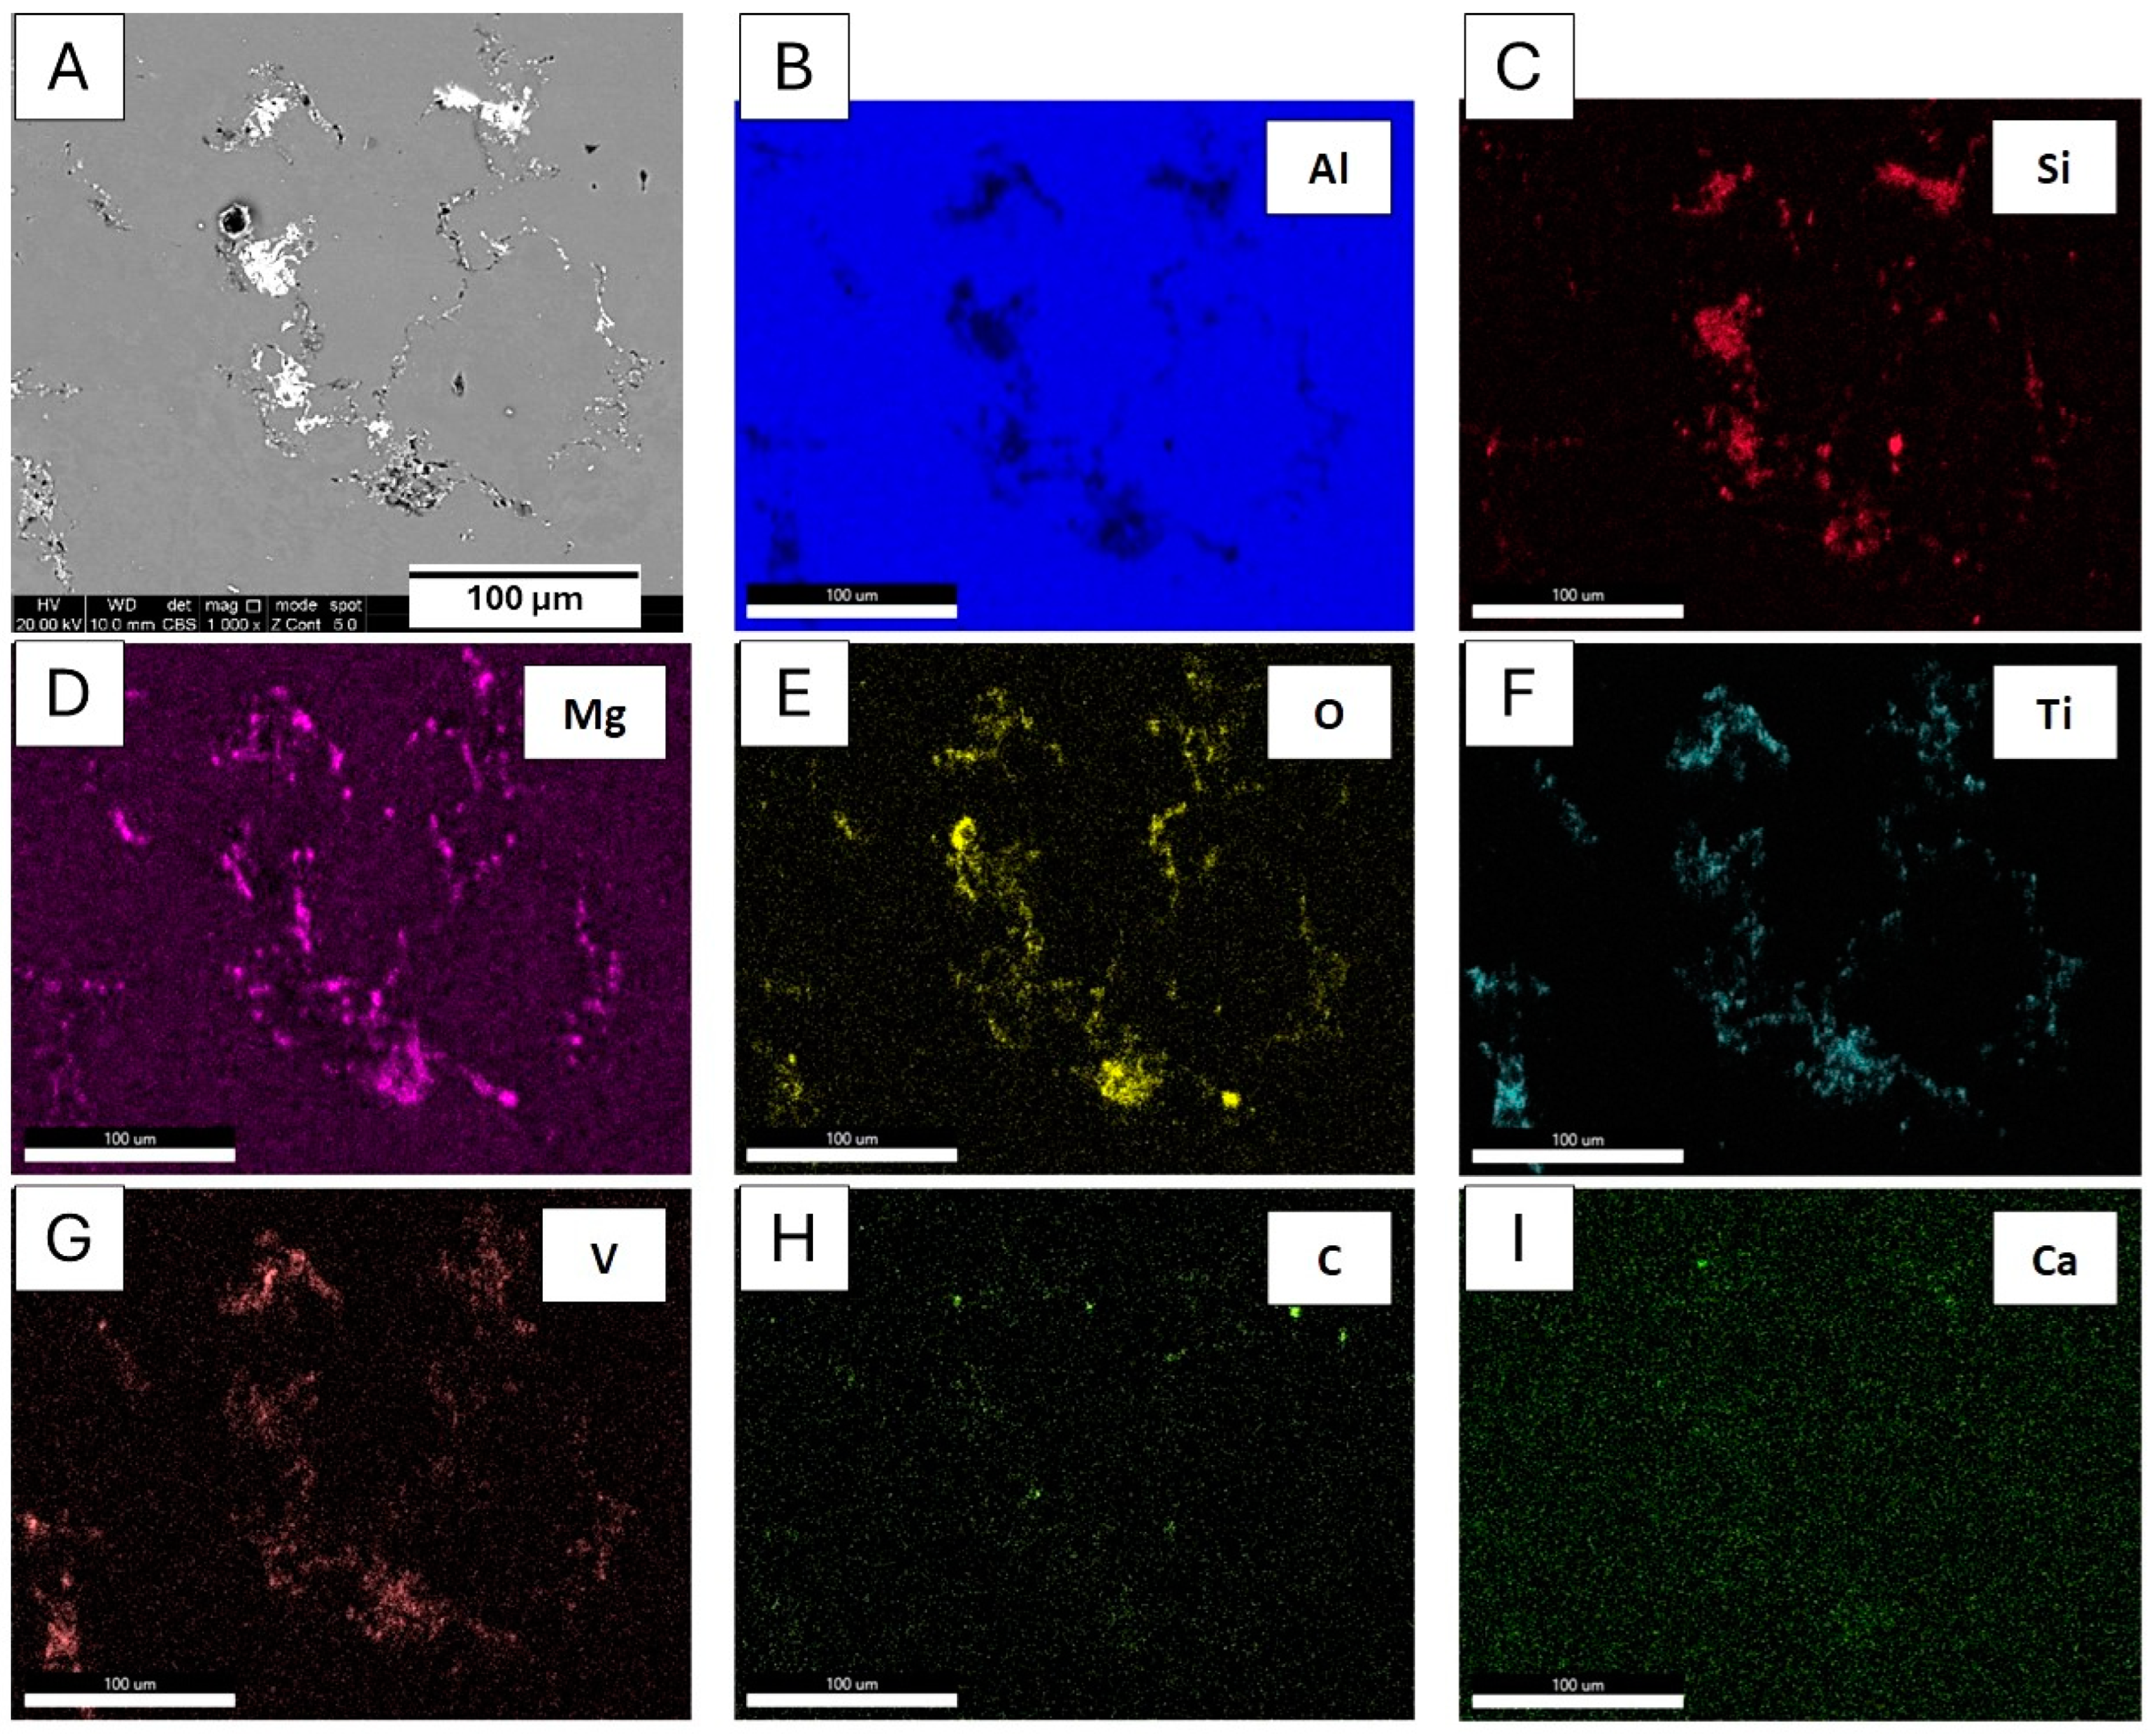
3.2.1. Microstructure

The microstructure of the extrusion alloys was similar, regardless of the amount of scrap used, showing a typical solidification structure composed of alpha grains surrounded by low-melting-point constituents, segregated to the grain boundaries. The microstructures observed on LM corresponding to the 100% scrap ingot are presented in Figure 6.
Notably, this cursory OM investigation did not detect a significantly different amount of inclusions. To better refine this assessment, the samples were subjected to the filtration and analysis procedure previously described for the HPDC alloys. The results are reported in the following section.

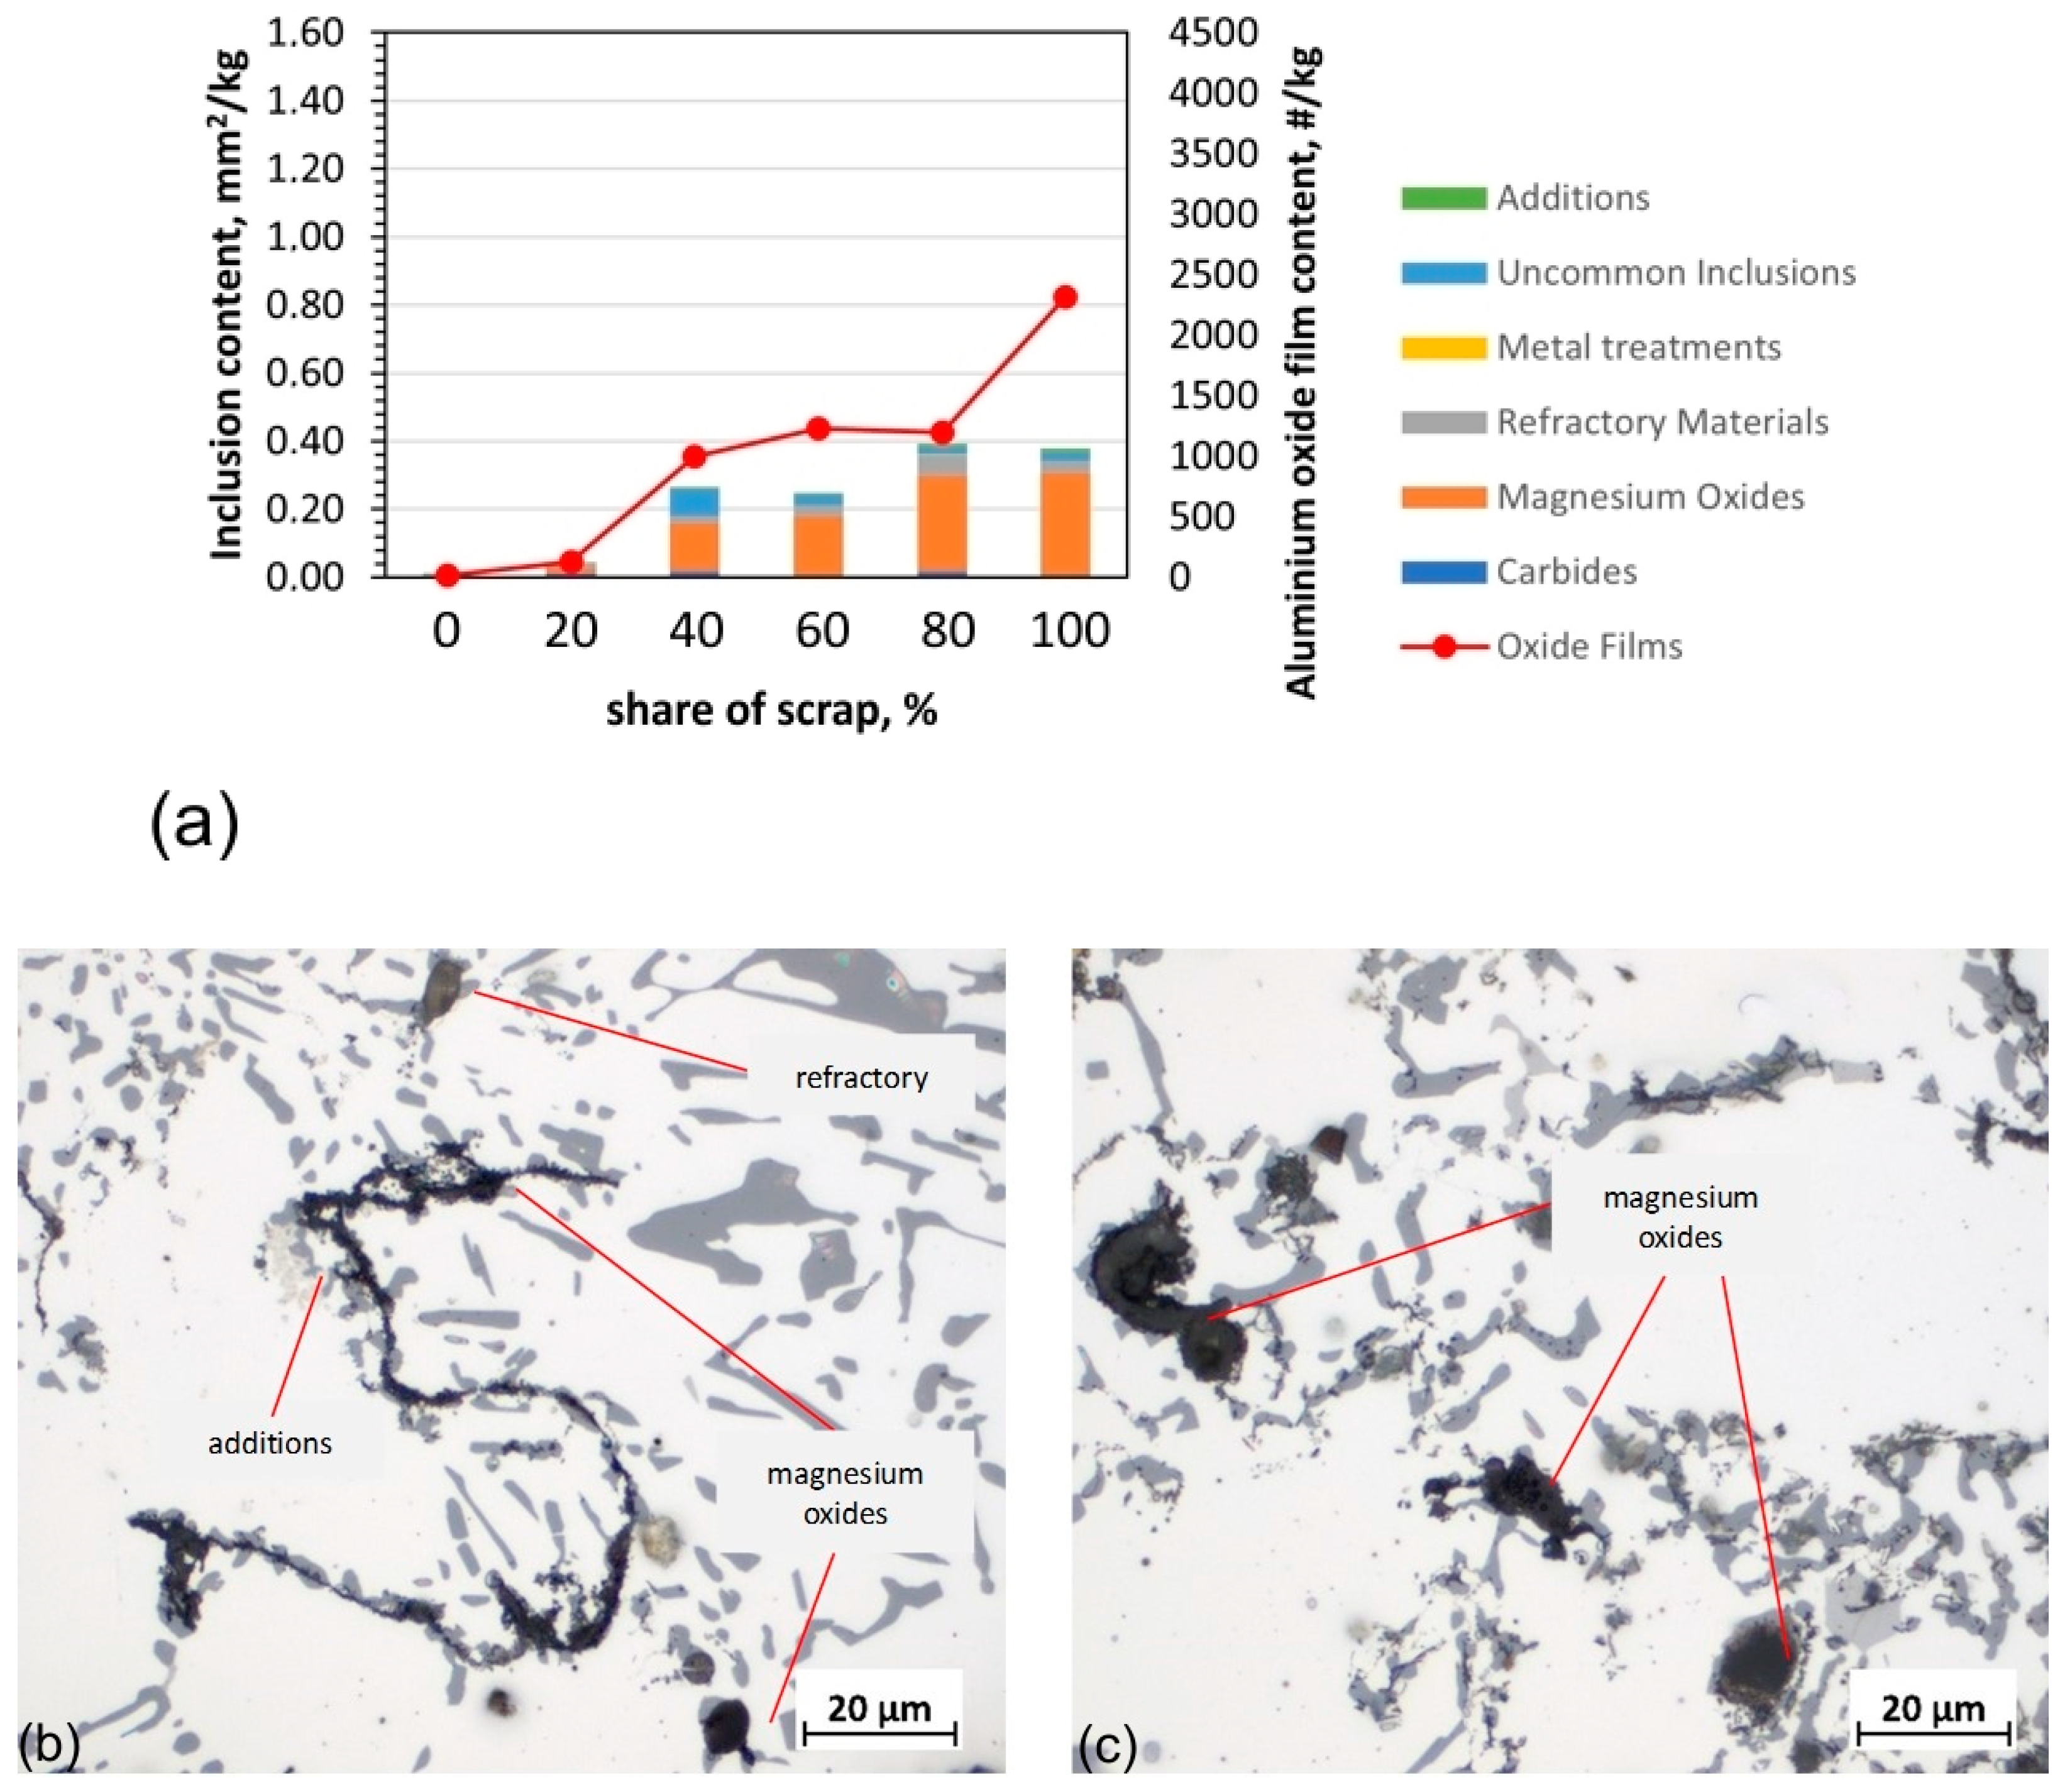
3.2.2. Analysis of Inclusions by Means of Prefil Footprinter

The presence of inclusions was analysed in detail using the Prefil Footprinter® in a manner analogous to the procedure described for the HPDC alloy. Table 9 shows the results of the experiment carried out. The amount of scrap did not significantly affect the filtering speed for the 6063 extrusion alloy. In the case of alloy 6063, for samples with a scrap content 0 to 100%, the filtration rate was low and at a comparable level, which was about 5 g/s.
The samples were analysed using SEM. Figure 7B–I shows an example of the EDS elemental mapping analysis for the SEM image of Figure 7A, while the results of the quantification of the microinclusions are shown in Figure 8.
The elemental distributions produced by the mapping technique for alloy 6063 show areas rich in Mg, O, Ti and V (Figure 8). In addition, C-enriched areas were revealed, which were identified as carbides.
The results of the metallographic analysis, shown in Figure 7, revealed that all the samples (from 0 to 100% scrap) showed a higher proportion of additives (0.2–0.6 mm2/kg) than magnesium oxides (0.006–0.17 mm2/kg). A non-major scatter of TIC in the range of 0.4–0.5 mm2/kg was determined for the samples, except for those containing 60 and 80% scrap. The sample containing 60% scrap was the most contaminated (TIC over 0.8 mm2/kg). In addition to additives, a significant proportion of magnesium oxides were found in the filtered residue of this sample. On the contrary, the lowest TIC of 0.2 mm2/kg and trace amounts of magnesium oxides were found in the sample produced with an 80% scrap content.

3.2.3. Compression Tests

Compression tests were carried out at two crosshead speeds of 250 mm/min and 450 mm/min, simulating the metal flow rate during extrusion. The samples were deformed up to 60%. The results obtained from the compression tests are in Table 10 and Table 11.
The hot compression tests conducted at crosshead speeds of 250 mm/min and 450 mm/min showed that none of the specimens with different scrap contents differed significantly from the average in terms of the conventional yield strengths (Rp 0.2, Rp 0.5) and true stresses (Rrpmax, Rrmax). The compression tests conducted at crosshead speeds of 250 mm/min and 450 mm/min showed differences in the compressive strength (Rmax) and maximum force (Fmax) between the samples with different scrap contents. An increase in the maximum compressive strength of approximately 10 MPa and maximum force of approximately 0.6 kN was found for the 100% scrap sample compared to the 0% scrap sample.

3.3. Sheet Metal Alloys

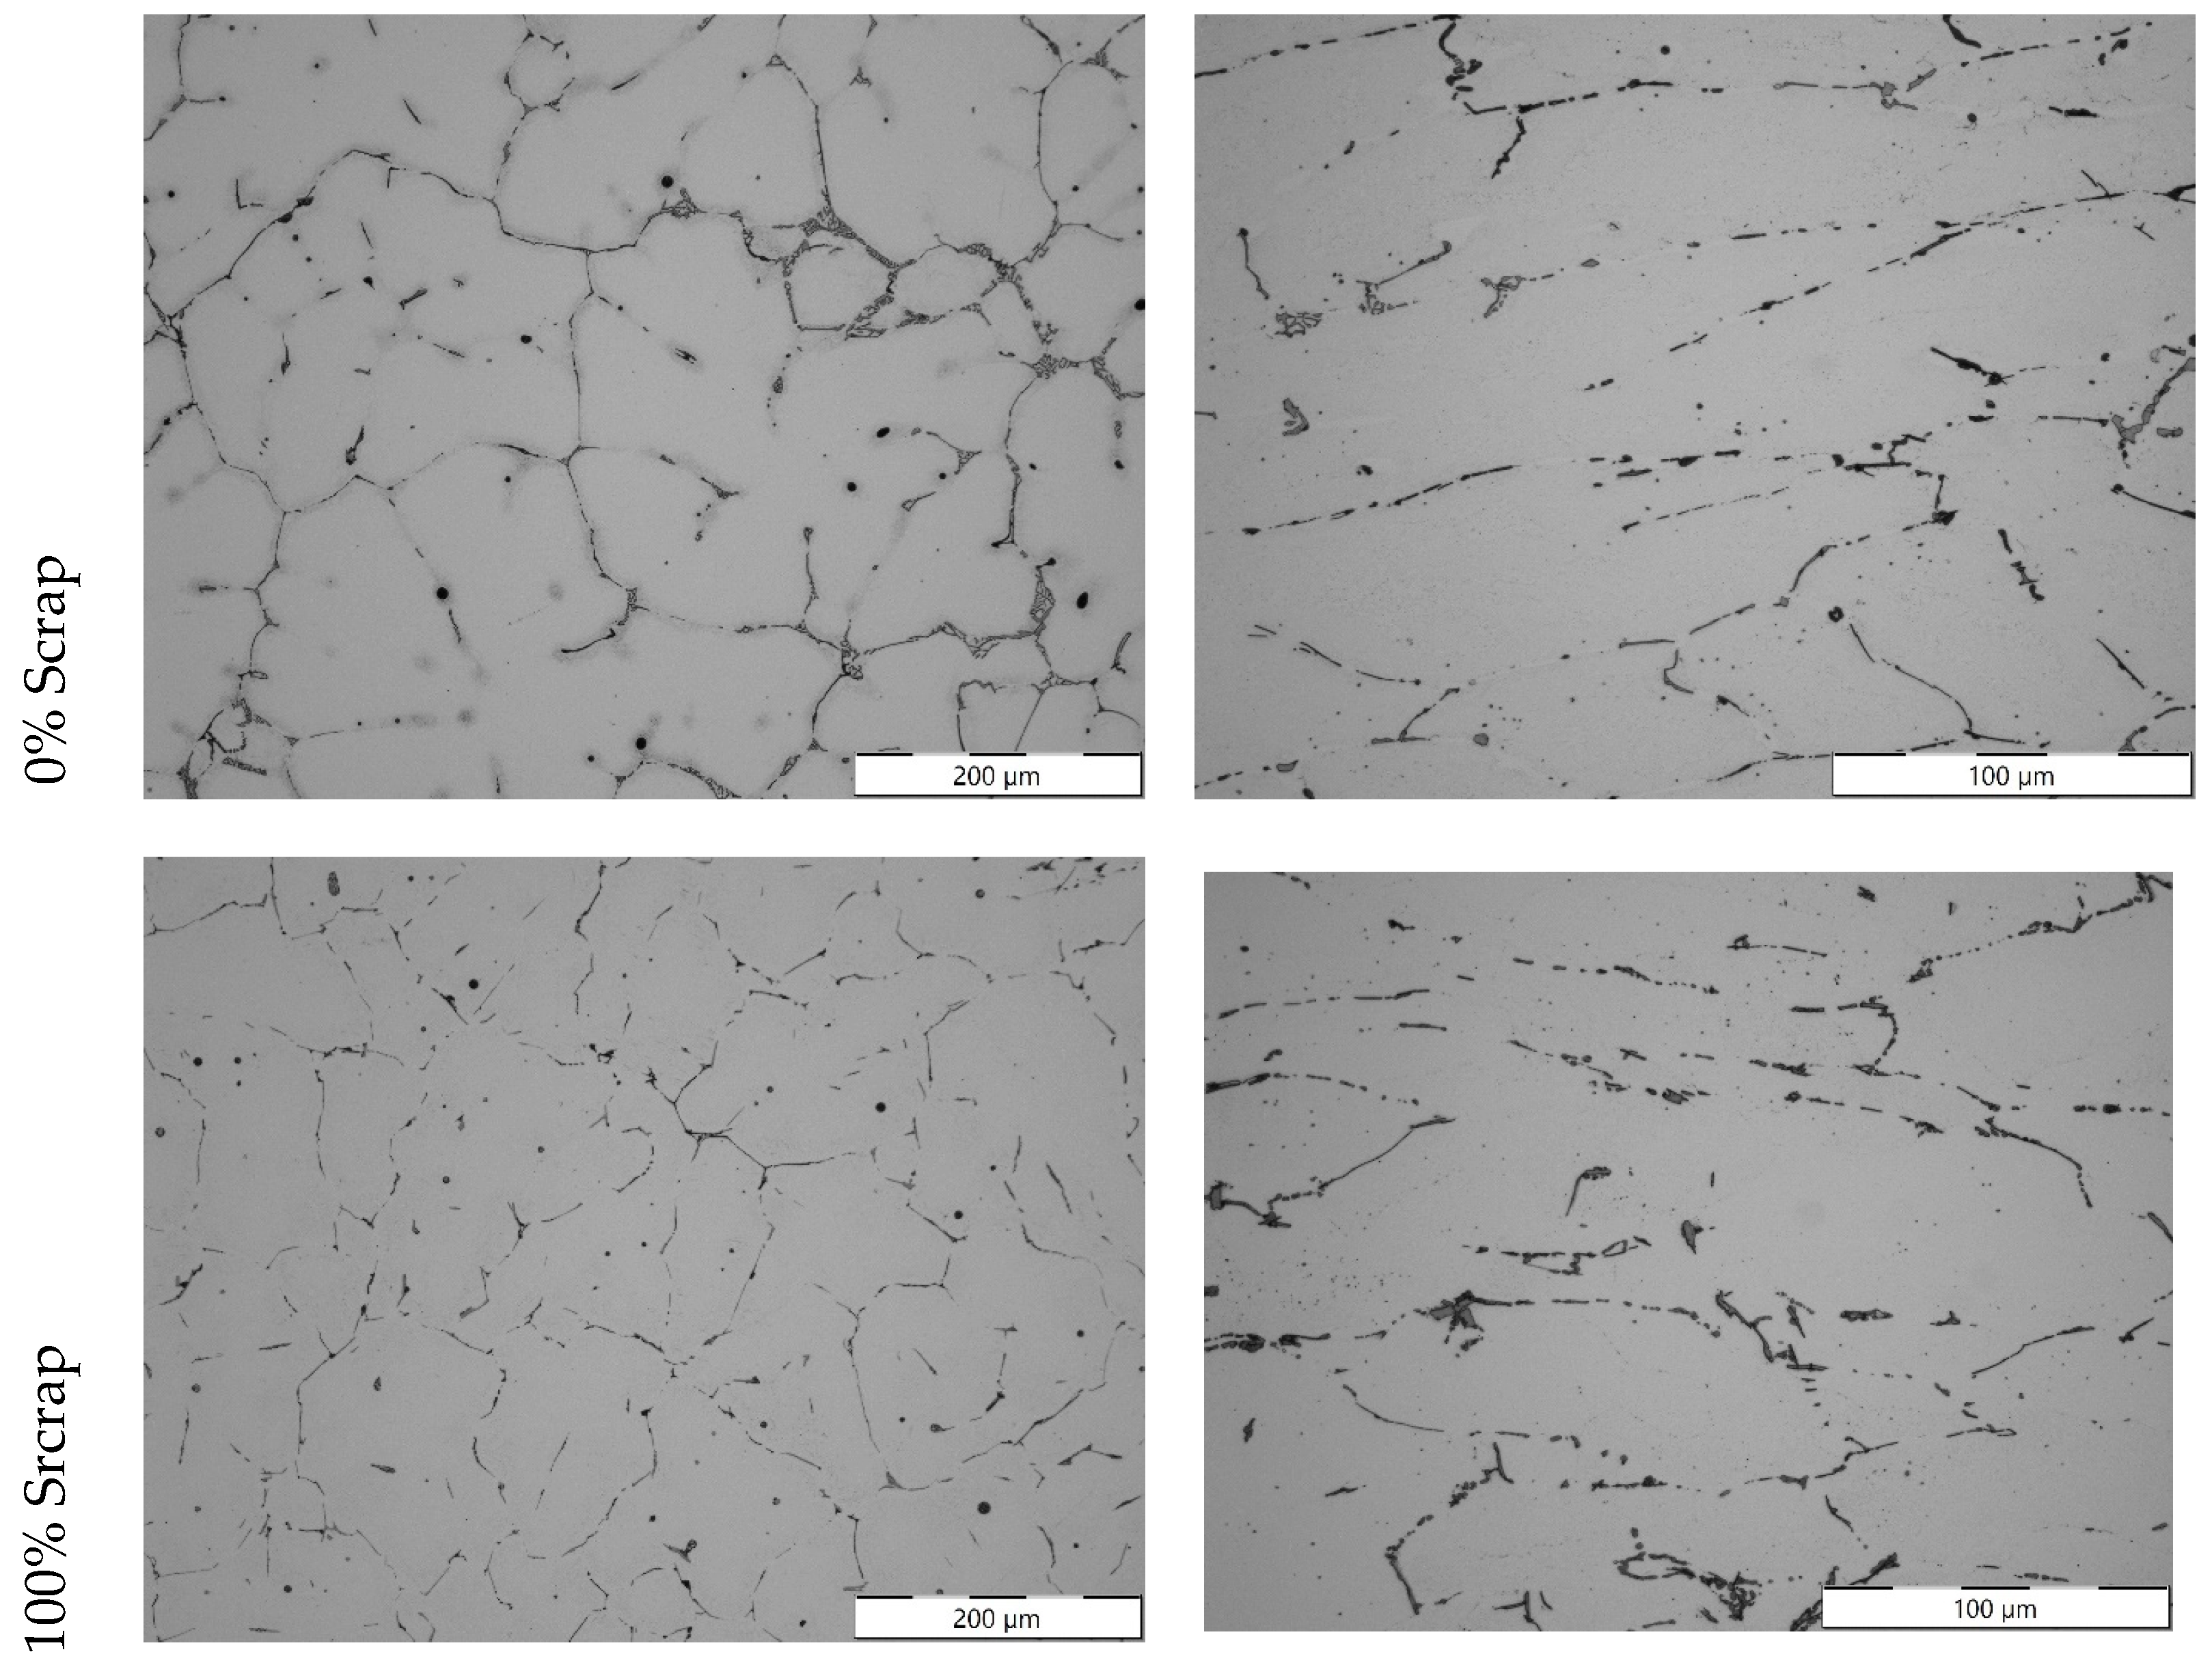
3.3.1. Microstructure

Basic microstructural analysis was performed in order to determine if the different amounts of recycled material affected the microstructure in a relevant way. A basic plastic deformation and recrystallization procedure was followed (Section 2.4.3) to ensure that the casting microstructure was transformed into a hot-formed microstructure more representative of a wrought product.
The as-cast ingots (left column in Figure 9 for 6181A, Figure 10 for 5754) show a reticular structure, composed of low-melting-point phases (dark particles) surrounding bright alpha grains, suggesting a dendritic microstructure with non-alpha phases segregated in the grain boundaries in eutectic-like formations. This structure and phase composition is to be expected for a cast aluminium ingot and it is found for all the scrap amounts and in both 5754 and 6181. It is worth commenting that the amount of scrap does not seem to have an impact on the structure or presence of macro phases.
The deformed samples (right column in Figure 9 for 6181A, Figure 10 for 5754) show how the plastic forming and recovery mechanisms have broken the as-cast structure. Clearly elongated grains can be recognized, particularly for the cold-formed 5754 alloy. However, the overall microstructure still presents silicon-based particles and intermetallic (dark phases) concentrating along the alpha grain boundaries (bright). In this regard, the proposed experiment generates a structure closer to that of a wrought product, but not entirely equivalent to a rolled sheet, where non-alpha phases are smaller and more sparsely distributed due to the higher amount of deformation applied.
In the light microscopy analysis of these samples, the presence of inclusions does not appear to significantly differ for the varying percentages of scrap. While some oxides or Fe-based phases can be occasionally found, these do not appear to follow a particular relationship with the amount of scrap used in casting.

3.3.2. Analysis of Inclusions by Means of Prefil Footprinter

As performed for the previous cases, a detailed characterization of the inclusions was performed through the specific filtration and analysis method described in the experimental section.
For alloy 6181A, the analysis of the filtration rate (Table 10) did not show a clear influence of the amount of recycled material in the range of 0–80% (7.5–8.8 g/s), whereas for the sample with the highest amount of scrap (100%), the filtration is slower (6.2 g/s). However, this result does not seem to be related to a higher presence of inclusions in the material.
The samples were analysed using SEM. Figure 11B–I shows an example of the EDS elemental mapping analysis of the SEM image in Figure 11A, while the results of the quantification of the microinclusions are shown in Figure 12.
The analyses of the elemental distribution maps of alloy 6181A show the presence of inclusions similar to those found in alloy 6063 for extrusion. Regions rich in Mg, O, Ti and V were found as well as numerous regions containing Ca, Si and C with Ca or Al compounds.
The highest levels of inclusions were found in both the pure alloy and the 100% alloy. High levels of magnesium oxide, additions, refractories, carbides and oxide films were found in the samples tested. The presence of magnesium oxides determined the high level of inclusions in the pure 6181A alloy.
In the case of alloy 5754, the analysis of the filtration rates (Table 11) did not show a clear influence of the recycling amount, with all the filtration rates values being very similar, at around 8 g/s.
The samples were analysed using SEM. Figure 13B–I shows an example of the EDS elemental mapping analysis of the SEM image in Figure 13A, while the results of the quantification of the microinclusions are shown in Figure 14.
The detailed analysis shows a very high inclusion content for this material, which further increases with the content of recycled material, together with the presence of oxide films.
The chemical composition of the inclusions filtered in the 5457 alloy samples shows that the largest component of them was magnesium oxides, which correlates with the high magnesium content in the alloy (about 3% by weight). For the pure alloy, the TIC was 0.761 mm2/kg. For the sample containing 100% scrap, the TIC was approximately 1.5 mm2/kg, which is the highest amount obtained for all the samples analysed. In addition, an increasing amount of refractory material was found as the scrap content increased. Additives were observed at similar levels in all the samples of 5754 alloy analysed.

3.3.3. Hardness

In order to obtain a first assessment about the effect of recycling on the service properties of the sheet metal, hardness measurements were performed on these samples. This test could be performed with the small amount of material available, and offers a good correlation with the tensile properties. Table 12 and Table 13 summarize the values obtained for 6181A and 5754; the % reduction applied during thermomechanical forming (as described in Section 2.4.3) is also reported, as well as the heat treatment cycle when applicable.
In terms of the mechanical properties, in both cases, the effect of recycling is not apparent. For 6181A alloys (Table 14), virtually the same hardness level is attained in the three studied conditions.
For 5754 (Table 15), the initial hardness differs between the three hot-formed samples; however, this is believed to be related to the different degree of effective reduction attained in each case. However, for the annealed and cold-formed samples, an equivalent hardness is reached (95 HV) regardless of the recycling amount. This is a noteworthy result, as the chemical composition in this case differed notably in terms of silicon and magnesium: 0.1% Si and 2.8% Mg for the 0% scrap samples, and 0.4% Si and 2.4% Mg for the 100% scrap samples. However, in all the cases, a level of hardness compatible with work-hardened 5754 is obtained.

4. Discussion

In this study, the following series of alloys was tested in the processes used: AB-43500 alloy for HPDC metals, 6063 for extrusion metals and 6181A and 5754 for stamping metals with different levels of scrap. The effects that the inclusion level had on the microstructure and relevant properties for the alloy processability (flowability, compression tests at high temperature and ability to recrystallize, respectively) were also investigated.
The effect of increasing the scrap content on the properties of the alloys studied was comparable. In general, an increase in various types of inclusion with increasing scrap content was found. Large differences between the AB-43500 casting alloy and the wrought alloys were found in the rates of liquid metal flow through the Prefil Footprinter® filter (Figure 5 and Figure 10). This appears to be related to the flowability of the alloys. Casting alloys, especially for HPDC casting, are characterised by a very good flowability [25,26], which is also confirmed by the tests carried out in this study (Table 8). It can also be concluded that an increasing amount of scrap leads to a decrease in the flowability. However, the general microstructural analysis of the specimens did not reveal the presence of new phases or large foreign particles that could be observed with the light microscope, neither for HPDC (Figure 3) nor the other processing routes investigated in the present work (Figure 6, Figure 11 and Figure 12), even if these differences were detected in the more sensitive and detailed Prefil Footprinter® analysis, particularly in the case of HPDC. This suggests that the main difference is due to the presence of small non-metallic particles, such as oxides, present in the scrap or generated by the oxidation produced during the melting process due to the reactions of residues adhered to the scrap surface. Even though this small amount of contamination does not translate into microstructural changes, it does highly affect the alloy’s flowability (Table 7). Therefore, even if the composition and microstructure are unaffected, it is observed that a specific pretreatment of the scrap, before melting, and/or a subsequent melt treatment will be required in order to avoid and/or remove the inclusions formed and yield a good-quality material.
Typical oxides in the film and cuboid particles formed were identified with different compositions. The metallographic examination of the filter for the AB-43500 alloy showed that the magnesium oxide content and refractory materials, which included Al2O3 and CaO, increased with the amount of scrap. According to studies [6,12,26], these are typical inclusions for this type of alloy due to the Mg content. The magnesium content increased with the addition of scrap. In the pure AB-43500 alloy, it was 0.18 wt.%, while in the same alloy cast from 100% scrap, it was 0.25 wt.%. Regarding the oxides in the refractory materials, they can enter the melt through the abrasion of the furnace and channel lining, and are usually silicates or other complex oxides, which may also contain Na, K and Ca [7,15]. In addition to the prevalent oxides, (Ti, V)B2 inclusions also were observed. Especially in the case of the 6063 and 6181A alloys, which are intended for extrusion and plastic stamping, despite the higher Mg content in the structure, additives, i.e., (Ti, V)B2 agglomerations, were present above the filter in a significant quantity. Their presence is confirmed by studies carried out by other researchers [9]. In both our own research (Figure 10) and that of others [6,27], borides have been found to inhibit the flow of liquid metal through the Prefil Footprinter® filter. According to the authors of Yang et al. [28], the reduction in efficiency is due to the strong adherence of TiB2 particles to oxide films in the filter. The adherence and agglomeration of heavy grain refiner particles onto oxide films counter the gravitation number of oxide films, making them difficult to be filtrated [28]. This can also lead to the inhibition of the filtration process during alloy casting. TiB2 inclusions are hard and have adverse effects on extrusion and machining tools [6].
This can be confirmed by a slight increase in the strength values obtained during the compression tests (Table 10 and Table 11) as the scrap content of the 6063 alloy increases. According to reference [29], TiB2 particles could tend to agglomerate, which could lead to the formation of thick oxides. This is related to the presence of a superficial aluminide layer in Al-Ti-B. Therefore, it is necessary to check the chemical composition with regard to the Ti and B content before the casting process to overcome particle agglomeration problems. In addition, the 6181A alloy contained MgO due to its even higher Mg content.
In the 5754 and 6181A alloys, high levels of inclusions such as magnesium and aluminium oxides and additives were found after the addition of 100% scrap. This is particularly true for 5754. In Al-Mg alloys, the tendency to oxidize increases rapidly with increasing Mg content [13,14]. The results obtained during the analysis (Figure 13) are consistent considering the high magnesium content of this alloy, as can be observed in the chemical analysis of the ingots presented in Table 8, where the Mg level decreased when the scrap level was increased. It is likely that some of the added Mg, as well as the alloying elements already present in the melt, were lost to the slag during melting experiments.
In addition, the presence of carbides was revealed (Figure 13 and Figure 14). According to reference [7], melting scraps with organic contaminations can lead to an increased amount of carbide formation. During the smelting process, organic compounds can react with aluminium and other elements. These reactions can lead to the formation of carbides in the alloy. The recycling-friendly coating removal practices proposed by the authors of [30], which involve the thermal treatment (pyrolysis) of scrap before it is smelted, may avoid this problem.
Studies related to the thermomechanical treatment of alloys for the stamping process did not reveal any effect of the scrap content on properties, despite the variations in chemical composition. Alloy 5754 showed strengthening due to cold work, reaching about 95 HV1 hardness for the three compositions compared despite the decreasing Mg content. Similarly, 6181A showed a similar level of age hardening after a treatment cycle. As hardness strongly correlates with tensile properties, this study shows that the intensive use of scrap will not adversely affect the alloy properties, as long as the chemical composition is kept within reasonable ranges.
This observation is consistent with the results of reference [12]: in that work, the increased recycling content of alloy 6181 did not result in the modification of monotonic mechanical properties. However, increased recycling did result in a loss of FLD formability, a parameter that could not be studied in the present work due to the material not being available in sheet metal format.

5. Conclusions

It is possible to obtain high-quality aluminium alloys within the range defined in standards with a high proportion of selected scrap, close to 100%, and the addition of required elements. The overall microstructural analysis did not reveal the presence of new phases or large foreign particles in the samples, indicating the stability of the microstructure of the alloys tested.
  • Using careful scrap selection, it was possible to produce high-quality recycled aluminium alloys. However, unwanted elements were introduced in the cases where the scrap selection was not excellent. This reinforces scrap selection as a major area of research into the circular economy related to structural metals.
  • The results obtained show that recycling is possible, but it may lead to an increment in oxides and other inclusions. In order to avoid this effect, it is necessary to define a good pretreatment for the scrap before melting and/or a melt treatment of the molten metal.
  • For alloys with a high Mg content, the oxidation of magnesium caused a reduction in its content in the final sample composition, as well as the presence of oxide MgO inclusions. Therefore, even in recycling-intensive material production, some magnesium will need to be added in addition to the element contained in the sourced scrap.
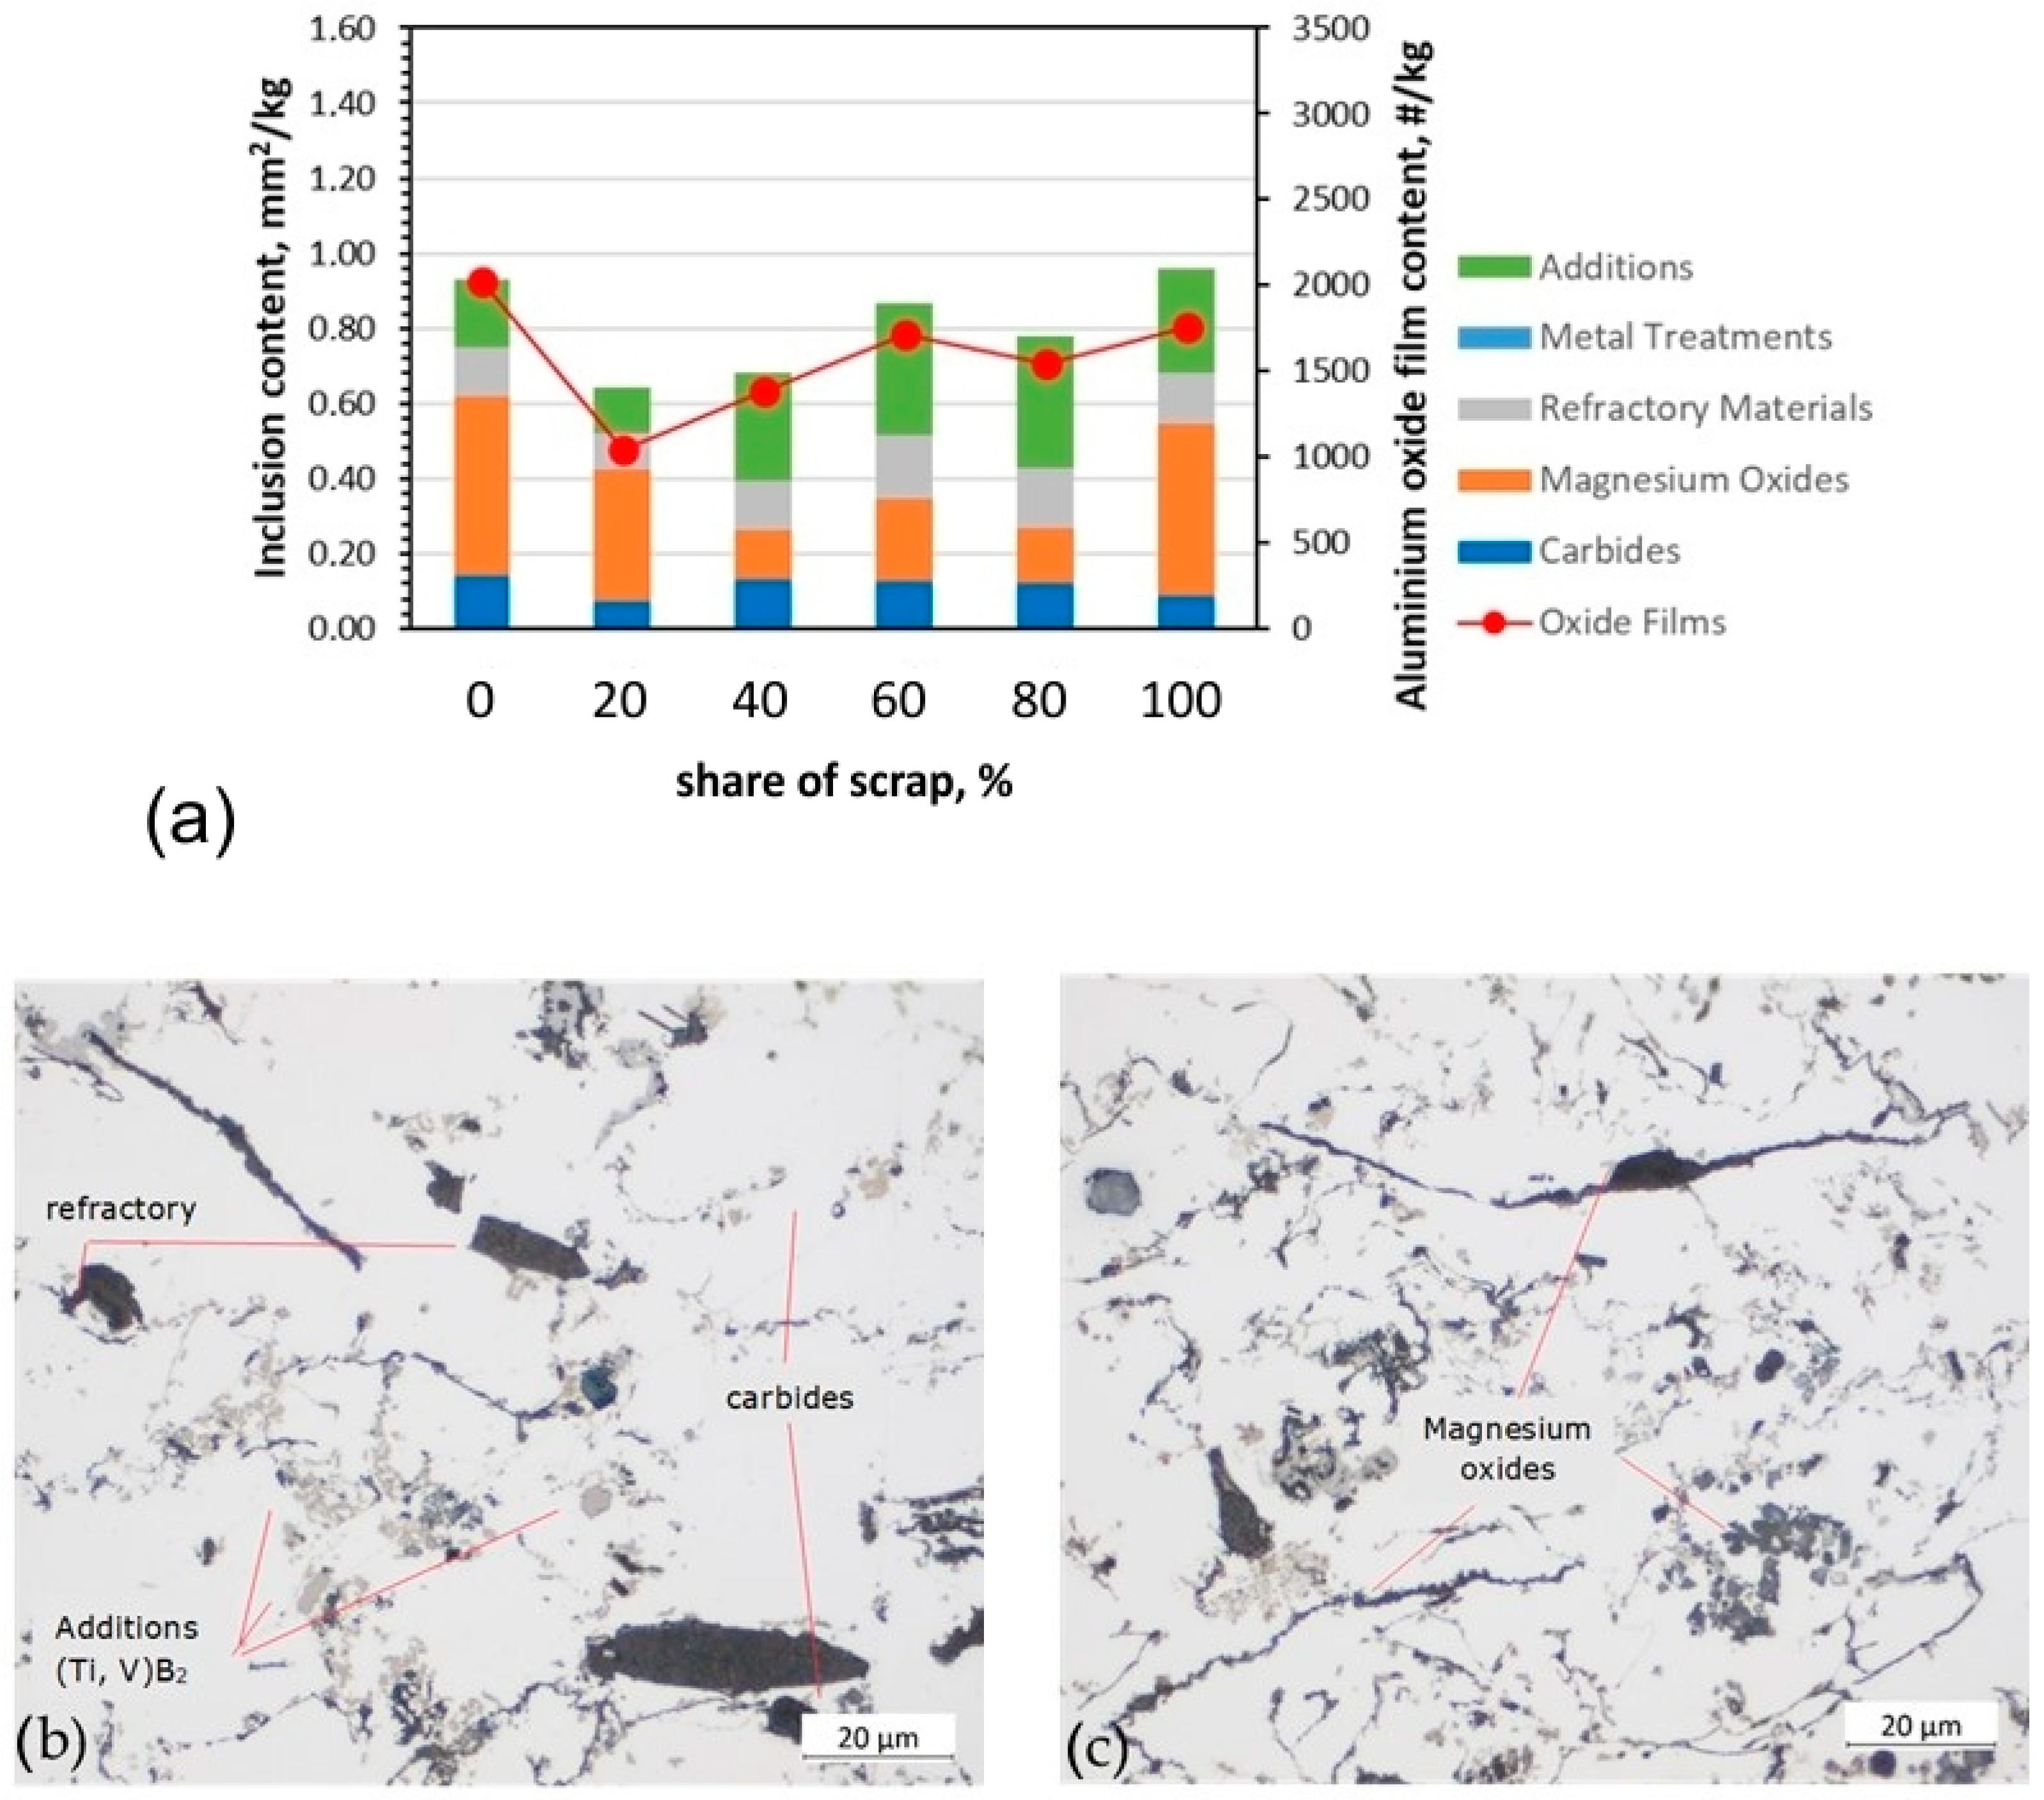
  • The detailed Prefil Footprinter® analysis revealed significant differences in the content and nature of the inclusions in the aluminium alloys, mainly oxides, additives and carbides, which are important for the HDCP, extrusion and stamping processes.
  • Although the observed differences in the non-metallic particle content do not affect the microstructural changes, they do have a significant effect on the melt flowability, which is critical for HDCP processes. For AB-43500 alloy intended for casting, an increase in the scrap content results in an increase in the magnesium oxide content, which reduces the castability of the alloy.
  • The 6063 alloys intended for extrusion were characterised by a high level of additives, the proportion of which was independent of the amount of scrap used.
  • The sheet metal alloys 6181A and 5754 showed no modification in terms of the monotonic mechanical properties due to recycling. However, differences were observed in terms of the inclusions. Alloy 6181A, similar to 6063, shows no change in the inclusion content when the scrap content is increased, whereas in alloy 5754, an increase in the scrap content results in an increase in the amount of magnesium oxides.

Author Contributions

Conceptualization, M.d.S. and J.P.; methodology, M.d.S., J.P., J.H.-W., B.A., D.K. and M.W.; validation, M.d.S., J.P., J.H.-W. and S.B.; formal analysis, M.d.S., J.P., S.B. and J.H.-W.; investigation, M.d.S., J.P., J.H.-W., B.A., D.K. and M.W. resources, M.d.S., J.H.-W. and S.B.; data curation, M.d.S., J.P., J.H.-W. and S.B.; writing—original draft preparation, M.d.S. and J.P.; writing—review and editing, M.d.S., J.P., S.B., J.H.-W., B.A. and D.K.; visualization, M.d.S., J.P., S.B. and J.H.-W.; supervision, M.d.S.; project administration, M.d.S.; funding acquisition, M.d.S. All authors have read and agreed to the published version of the manuscript.

Funding

This research was carried out as part of the SALEMA project that received funding from the EU research and innovation program Horizon 2020 under grant agreement No. 101003785.

Data Availability Statement

The original contributions presented in the study are included in the article, further inquiries can be directed to the corresponding author.

Acknowledgments

The authors acknowledge the assistance of Javier Marfil (Eurecat) with the HPDC trials and Marc Soler (Eurecat) with the analysis of the chemical composition by EOS. The authors also acknowledge Raffmetal, ASAS and Profilglass, SALEMA project partners, for supplying the alloys used for the HPDC, extrusion and stamping studies, respectively.

Conflicts of Interest

The authors declare no conflicts of interest.

References

  1. European Aluminium. Available online: https://european-aluminium.eu/wp-content/uploads/2022/10/aluminum-content-in-european-cars_european-aluminium_public-summary_101019-1.pdf (accessed on 23 May 2023).
  2. Ismail, A.; Mohamed, M.S. Review on sheet metal forming process of aluminium alloys. In Proceedings of the 17th International AMME Conference, Cairo, Egypt, 19–21 April 2016. [Google Scholar]
  3. Miller, W.S.; Zhuang, L.; Bottema, J.; Wittebrood, A.J.; De Smet, P.; Haszler, A.; Vieregge, A. Recent development in aluminium alloys for the automotive industry. Mater. Sci. Eng. A 2000, 280, 37–49. [Google Scholar] [CrossRef]
  4. Graedel, T.E.; Allwood, J.; Birat, J.-P.; Buchert, M.; Hagelüken, C.; Reck, B.K.; Sibley, S.F. Guido Sonnemann: What do We Know about Metal Recycling Rates? J. Ind. Ecol. 2011, 15, 355–366. [Google Scholar] [CrossRef]
  5. Kaufmann, H. Science of dirty alloys. AluReport 2019, 2, 22–23. [Google Scholar]
  6. Jaradeh, M.; Carlberg, T. Method Developed for Quantitative Analysis of Inclusions in Solidified Aluminum Ingots. Metall. Mater. Trans. B 2011, 42, 121–132. [Google Scholar] [CrossRef]
  7. Raabe, D.; Ponge, D. Making sustainable aluminum by recycling scrap: The science of “dirty” alloys. Prog. Mater. Sci. 2022, 128, 100947. [Google Scholar] [CrossRef]
  8. Samuel, A.M.; Samuel, F.H. Metallurgical aspects of inclusion assessment in Al–6%Si casting alloy using the LIMCA technique. Int. J. Met. 2018, 12, 643–657. [Google Scholar] [CrossRef]
  9. Pana, M.A.; Moldovan, P. Researches Concerning PoDFA Method for 5083 Alloys. In Proceedings of the 12th International Conference on Aluminium Alloys, Yokohama, Japan, 5–9 September 2010. [Google Scholar]
  10. Prillhofer, B.; Antrekowitsch, H.; Böttcher, H.; Enright, P. Nonmetallic inclusions in the secondary aluminum industry for the Production of aerospace alloys. In Proceedings of the TMS Light Metals, New Orleans, LA, USA, 9–13 March 2008. [Google Scholar]
  11. Boczkal, S.; Augustyn, B.; Hrabia-Wiśnios, J.; Kapinos, D.; Lewis, G.; Bareel, P.-F.; Savelli, S.; da Silva, M.; Özen, T. Preparation of High-Quality 6xxx Aluminium Eco Alloys Cast in Billets. Eng. Proc. 2023, 43, 23. [Google Scholar] [CrossRef]
  12. De Caro, D.; Tedesco, M.M.; Pujante, J.; Bongiovanni, A.; Sbrega, G.; Bricco, M.; Rizzo, P. Effect of Recycling on the Mechanical Properties of 6000 Series Aluminum-Alloy Sheet. Materials 2023, 16, 6778. [Google Scholar] [CrossRef] [PubMed]
  13. Scamans, G.; Li, H.T.; Fan, Z. Melt Conditioned Casting of Aluminum Alloys. In Proceedings of the ICAA13, Pittsburgh, PA, USA, 3–7 June 2012. [Google Scholar] [CrossRef]
  14. Smith, N.; Kvithyld, A.; Tranell, G. The Mechanism Behind the Oxidation Protection of High Mg Al Alloys with Beryllium. Metall. Mater. Trans. B 2018, 49, 2846–2857. [Google Scholar] [CrossRef]
  15. Cao, X.; Cambpell, J. Oxide inclusion defects in Al-Si-Mg cast alloys. Can. Metall. Q. 2005, 44, 435–448. [Google Scholar] [CrossRef]
  16. Vonica, D.; Moldovan, P.; Stănică, C.; Buțu, M.; Ciurdaș, M.; Pană, M. Investigations of the nature of non-metallic inclusions in Al-Mg-Mn alloys. U.P.B. Sci. Bull. Ser. B 2013, 75, 199–208. [Google Scholar]
  17. Baquedano, A.; Niklas, A.; Fernández-Calvo, A.I.; Plata, G.; Lozares, J.; Berlanga-Labari, C. Comparative Study of the Metallurgical Quality of Primary and Secondary AlSi10MnMg Aluminium Alloys. Metals 2021, 11, 1147. [Google Scholar] [CrossRef]
  18. Available online: https://search.abb.com/library/Download.aspx?DocumentID=PB%2fPrefil-Footprinter%2fEN%2fA4&LanguageCode=en&DocumentPartId=&Action=Launch (accessed on 23 May 2023).
  19. Stanică, C.; Moldovan, P. Aluminum melt cleanliness performance evaluation using PoDFA (porous disk filtration apparatus) technology. U.P.B. Sci. Bull. B Chem. Mater. Sci. 2009, 71, 107–114. [Google Scholar]
  20. Ásbjörnsson, E.J. Dispersion of Grain Refiner Particles in Molten Aluminium. Ph.D. Thesis, University of Nottingham, Nottingham, UK, 2001. [Google Scholar]
  21. Caliari, D.; Timelli, G.; Bonollo, F.; Amalberto, P. Fluidity of aluminium foundry alloys: Development of a testing procedure. Metall. Ital. 2015, 107, 17–24. [Google Scholar]
  22. CWA 18112:2024; Aluminium and Its Alloys—Fluidity Evaluation via Multi Strip Testing Moulds; CEN-CENELEC Workshop Agreements. CEN-CENELEC Management Centre: Brussels, Belgium, 2024.
  23. Chamanfar, A.; Alamoudi, M.; Nanninga, N.; Misiolek, W. Analysis of flow stress and microstructure during hot compression of 6099 aluminum alloy (AA6099). Mater. Sci. Eng. A 2019, 743, 684–696. [Google Scholar] [CrossRef]
  24. Lech-Grega, M.; Szymański, W.; Gawlik, M.; Bigaj, M. Homogenization of 6XXX alloy ingots with addition of vanadium. In Proceedings of the 13th International Conference on Aluminum Alloys (ICAA13), Pittsburgh, PA, USA, 3–7 June 2012; pp. 1551–1552. [Google Scholar]
  25. Snopinski, P.; Tanski, T.; Gołombek, K.; Rusz, S.; Hilser, O.; Donic, T.; Nuckowski, P.M.; Benedyk, M. Strengthening of AA5754 Aluminum Alloy by DRECE Process Followed by Annealing Response Investigation. Materials 2020, 13, 301. [Google Scholar] [CrossRef] [PubMed]
  26. Dou, K.; Lordan, E.; Zhang, Y.; Jacot, A.; Fan, Z. A novel approach to optimize mechanical properties for aluminium alloy in High pressure die casting (HPDC) process combining experiment and modelling. J. Mater. Process. Technol. 2021, 296, 117193. [Google Scholar] [CrossRef]
  27. Akhtar, S.; Molina, R.; Di Sabatino, M.; Arnberg, L. On the quality of A354 ingots and its impact on cast product. Metall. Sci. Technol. 2009, 27, 2–10. [Google Scholar]
  28. Yang, J.; Bao, S.; Akhtar, S.; Tundal, U.; Tjřtta, S.; Li, Y. The Influences of Grain Refiner, Inclusion Level, and Filter Grade on the Filtration Performance of Aluminium Melt. Metall. Mater. Trans. B 2021, 52, 3946–3960. [Google Scholar] [CrossRef]
  29. Detomi, A.M.; Messias, A.J.; Majer, S.; Cooper, P.S. The imact of TiCAl and TiBAl Grain Refiners on Cast house Processing. In Proceedings of the TMS Light Metals, New Orleans, LA, USA, 11–15 February 2001; pp. 919–925. [Google Scholar]
  30. Kvithyld, A.; Meskers CE, M.; Gaal, S.; Reuter, M.; Engh, T.A. Recycling light metals: Optimal thermal de-coating. JOM 2008, 60, 47–51. [Google Scholar] [CrossRef]
Figure 1. Images of the different samples taken for the tests: square plate (left), small ingot (middle) and flowability test specimen (right).
Metals 14 00626 g001
Figure 3. Microstructures obtained by light microscope for the most extreme batches produced for EN AB-43500 alloy: 0% scrap (left) and 100% scrap (right).
Metals 14 00626 g003
Figure 4. Analysis of inclusions in AB-43500 alloy variants: (a) summary of identified inclusions and quantification of oxides; (b) microstructure with identified types of inclusions in a sample containing 20% scrap; (c) microstructure with identified types of inclusions in a sample containing 80% scrap; LM.
Metals 14 00626 g004
Figure 5. Microstructure (A) and energy-dispersive X-ray spectroscopy (EDS) maps (BI) of distribution of elements: Al, Si, Mg, O, Ti, V, C, Ca; SEM of the AB-43500 with 80% scrap content.
Metals 14 00626 g005
Figure 6. Microstructures obtained by light microscope for the most extreme batches produced for 6063 alloy: 0% scrap (left) and 100% scrap (right).
Metals 14 00626 g006
Figure 7. Microstructure (A) and energy-dispersive X-ray spectroscopy (EDS) maps (BI) of distribution of elements: Al, Si, Mg, O, Ti, V, C, Ca; SEM of the 6063 extrusion alloy with 80% scrap content.
Metals 14 00626 g007
Figure 8. Analysis of inclusions in 6063 extrusion alloy variants: (a) summary of identified inclusions and quantification of oxides; (b) microstructure with identified types of inclusions in a sample containing 20% scrap; (c) microstructure with identified types of inclusions in a sample containing 80% scrap; LM.
Metals 14 00626 g008
Figure 9. Microstructures for the different batches produced for 6181A alloy: extreme cases of 0 and 100% scrap as cast (left column) and after processing by 40% hot deformation and 65% cold reduction (right column).
Metals 14 00626 g009
Figure 10. Microstructures for 5754 alloy: extreme cases of 0 and 100% scrap as cast (left column) and after processing by 40% hot deformation and 65% cold reduction (right column).
Metals 14 00626 g010
Figure 11. Microstructure (A) and energy-dispersive X-ray spectroscopy (EDS) maps (BI) of distribution of elements: Al, Si, Mg, O, Ti, V, C, Ca; SEM of the 6181A alloy with 100% scrap content.
Metals 14 00626 g011
Figure 12. Analysis of inclusions in 6181A variants: (a) summary of identified inclusions and quantification of oxides; (b) identification of refractory inclusions, carbides and additions in a 40% scrap sample; (c) magnesium oxides (thin and layer-like) in 80% scrap sample.
Metals 14 00626 g012
Figure 13. Microstructure (A) and energy-dispersive X-ray spectroscopy (EDS) maps (BI) of distribution of elements: Al, Si, Mg, O, Ti, V, C, Ca; SEM of the 5754 alloy with 60% scrap content.
Metals 14 00626 g013
Figure 14. Analysis of inclusions in 5754 variants: (a) summary of identified inclusions and quantification of oxides; (b) identification of refractory inclusions, carbides and additions in a 40% scrap sample; (c) high presence of magnesium oxides and oxide films in 100% scrap sample.
Metals 14 00626 g014
Table 1. Average chemical composition (wt.%) of the alloys used in this work determined by mass spectrometry.
n = 5 SiFeCuMnMgZnCrNiPbSnTi
EN AB-4350010.400.160.030.650.18<0.01<0.01<0.01<0.01<0.010.07
60630.580.2<0.030.030.48 <0.03<0.03 <0.03
6181A 0.910.0270.140.30.760.060.02<0.03<0.03<0.03<0.03
5754 0.140.160.020.162.86<0.03<0.03<0.03<0.03<0.03<0.03
Table 2. Average chemical composition (wt.%) of scrap used in this work as determined by mass spectrometry.
n = 5 SiFeCuMnMgZnCrNiPbSnTi
Die casting scrap10.810.150.010.620.260.01<0.01<0.01<0.01<0.010.07
“6xxx” scrap0.450.230.010.040.430.01<0.01<0.01<0.01<0.010.02
Table 3. Average chemical composition (wt.%) determined by mass spectrometry of samples taken from the different batches produced from AB-43500 alloy.
n = 5 SiFeCuMnMgZnCrNiPbSnTi
0% scrap10.340.170.030.580.18<0.03<0.03<0.03<0.01<0.010.06
20% scrap10.290.160.020.580.18<0.03<0.03<0.03<0.01<0.010.06
40% scrap10.250.160.020.560.19<0.03<0.03<0.03<0.01<0.010.06
60% scrap10.10.160.030.530.21<0.03<0.03<0.03<0.01<0.010.06
80% scrap10.220.170.030.540.23<0.03<0.03<0.03<0.01<0.010.06
100% scrap10.010.140.030.510.25<0.03<0.03<0.03<0.01<0.010.06
EN AB-435009–11.5<0.20<0.030.4–0.80.15–0.6<0.07<0.05<0.05<0.05<0.05<0.15
Table 4. Average chemical composition (wt.%) determined by mass spectrometry of samples taken from the different batches produced from 6063 alloy.
n = 5 SiFeCuMnMgZnCrNiPbSnTi
0% scrap0.80.20.020.050.48<0.03<0.03<0.03<0.03<0.03<0.03
20% scrap0.720.210.020.050.47<0.03<0.03<0.03<0.03<0.03<0.03
40% scrap0.620.210.020.050.47<0.03<0.03<0.03<0.03<0.03<0.03
60% scrap0.510.230.010.050.45<0.03<0.03<0.03<0.03<0.03<0.03
80% scrap0.510.230.020.060.45<0.03<0.03<0.03<0.03<0.03<0.03
100% scrap0.50.230.020.060.43<0.03<0.03<0.03<0.03<0.03<0.03
Table 5. Average chemical composition (wt.%) determined by mass spectrometry of samples taken from the different batches produced from 6181A alloy.
n = 5 SiFeCuMnMgZnCrNiPbSnTi
0% scrap0.880.320.130.290.740.06<0.03<0.03<0.03<0.03<0.03
20% scrap0.920.330.110.250.760.08<0.03<0.03<0.03<0.03<0.03
40% scrap0.950.320.100.220.710.08<0.03<0.03<0.03<0.03<0.03
60% scrap0.960.290.060.140.680.08<0.03<0.03<0.03<0.03<0.03
80% scrap1.000.270.050.100.660.08<0.03<0.03<0.03<0.03<0.03
100% scrap1.070.260.030.060.650.08<0.03<0.03<0.03<0.03<0.03
Table 6. Average chemical composition (wt.%) determined by mass spectrometry of samples taken from the different batch produced from 5754 alloy.
n = 5 SiFeCuMnMgZnCrNiPbSnTi
0% scrap0.180.290.020.162.78<0.03<0.03<0.03<0.03<0.03<0.03
20% scrap0.230.280.030.182.72<0.03<0.03<0.03<0.03<0.03<0.03
40% scrap0.250.260.040.192.66<0.03<0.03<0.03<0.03<0.03<0.03
60% scrap0.350.280.060.212.49<0.03<0.03<0.03<0.03<0.03<0.03
80% scrap0.390.270.060.222.44<0.03<0.03<0.03<0.03<0.03<0.03
100% scrap0.430.280.070.232.37<0.03<0.03<0.03<0.03<0.03<0.03
Table 7. Length measured for the 6 strips of the flowability specimens and average values.
1 mm3 mm5 mm7 mm9 mm11 mmAverage
Ref. ingot013535135608575.00
20% scrap010055110957071.67
40% scrap0904080656055.83
60% scrap013030105752060.00
80% scrap04057020022.50
100% scrap070575201030.00
Table 8. Values obtained from the Prefil Footprinter® test of the AB-43500 alloy.
Samples0%
Scrap
20%
Scrap
40%
Scrap
60%
Scrap
80%
Scrap
100% Scrap
Weight (kg)1.4161.4321.4061.4151.4031.402
Duration (s)85100109112134140
Filtration rate (g/s)16.714.312.912.610.510.0
Table 9. Values obtained from the Prefil Footprinter® test of the 6063 extrusion alloy.
Samples0%
Scrap
20%
Scrap
40%
Scrap
60%
Scrap
80%
Scrap
100%
Scrap
Weight (kg)0.6870.6320.770.6490.7470.749
Duration (s)150150150150150150
Filtration rate (g/s)4.64.25.14.35.05.0
Table 10. Compression results with crosshead speed 250 mm/min (average of 3 samples).
Crosshead Speed 250 mm/min
Scrap ContentRp0.2 [MPa]Rp0.5 [MPa]Rmax [MPa]Max. Displacement [mm] *Atotal [%] *Rrpmax [MPa]Rrmax [MPa]Fmax [kN] *
0% scrap23.5 ± 0.525.4 ± 0.3113.2 ± 1.48.2968.935.0 ± 0.435.2 ± 0.45.70
20% scrap22.0 ± 0.823.9 ± 0.7115.9 ± 0.48.3970.634.1 ± 0.934.1 ± 1.25.83
40% scrap23.3 ± 0.725.1 ± 0.8118.1 ± 4.18.5270.834.5 ± 1.634.5 ± 1.75.93
60% scrap22.7 ± 1.424.5 ± 1.1121.5 ± 18.4970.633.9 ± 0.733.9 ± 0.56.12
80% scrap22.2 ± 0.724.1 ± 0.3121.6 ± 28.6271.934.2 ± 0.434.2 ± 0.86.11
100% scrap21.6 ± 223.6 ± 1.5125.6 ± 2.48.6972.434.6 ± 0.934.6 ± 0.96.29
* The standard deviation for the other results was <0.2.
Table 11. Compression results with crosshead speed 450 mm/min (average of 3 samples).
Crosshead Speed 450 mm/min
Scrap ContentRp0.2 [MPa]Rp0.5 [MPa]Rmax [MPa]Max. Displacement [mm] *Atotal [%] *Rrpmax [MPa]Rrmax [MPa]Fmax [kN] *
0% scrap26.0 ± 0.428.7 ± 0.4111.3 ± 1.67.9766.437.4 ± 0.537.4 ± 18.35.59
20% scrap24.2 ± 0.626.5 ± 0.4111.1 ± 2.28.1968.235.4 ± 0.235.4 ± 0.25.60
40% scrap24.3 ± 0.926.7 ± 1.1112.4 ± 2.68.3069.134.8 ± 1.434.8 ± 1.45.65
60% scrap25.1 ± 1.827.8 ± 1.9119.3 ± 4.68.3269.236.8 ± 1.736.8 ± 1.76.00
80% scrap25.7 ± 2.128.7 ± 2.3122.3 ± 2.68.4169.936.8 ± 1.236.8 ± 1.26.15
100% scrap24.6 ± 1.527.4 ± 1.6120.5 ± 1.28.4570.335.8 ± 0.735.8 ± 0.76.07
* The standard deviation for the other results was <0.6.
Table 12. Values obtained from the Prefil Footprinter® test in 6181A variants.
Samples0%
Scrap
20%
Scrap
40%
Scrap
60%
Scrap
80%
Scrap
100%
Scrap
Weight (kg)1.1271.2871.323 1.2471.273 0.934
Duration (s)150150150150150150
Filtration rate (g/s)7.58.68.88.38.56.2
Table 13. Values obtained from the Prefil Footprinter® test in 5754 variants.
Samples0%
Scrap
20%
Scrap
40%
Scrap
60%
Scrap
80%
Scrap
100%
Scrap
Weight (kg)1.1151.2721.2361.2171.2321.278
Duration (s)150150150150150150
Filtration rate (g/s)7.48.58.28.18.28.5
Table 14. Hardness values measured on 6181A-based samples.
Hot-FormedAged
Scrap Level% ReductionHV1TreatmentHV1
0%42%66 ± 21 h 200 °C86 ± 3
40%35%67 ± 31 h 200 °C84 ± 3
100%44%67 ± 31 h 200 °C82 ± 3
Table 15. Hardness values measured on 5754-based samples.
Hot-FormedCold-Worked
Scrap Level% ReductionHV1% ReductionHV1
0%35%71 ± 366%94 ± 3
40%35%71 ± 367%94 ± 3
100%42%85 ± 364%95 ± 3
Disclaimer/Publisher’s Note: The statements, opinions and data contained in all publications are solely those of the individual author(s) and contributor(s) and not of MDPI and/or the editor(s). MDPI and/or the editor(s) disclaim responsibility for any injury to people or property resulting from any ideas, methods, instructions or products referred to in the content.

