


Research on the Chloride Ion Corrosion Resistance of Cu-Sb-Added Low-Carbon Steel
Abstract
1. Introduction
2. Materials and Methods
2.1. Materials
2.2. Electrochemical Measurements
2.3. Accelerated Corrosion Test
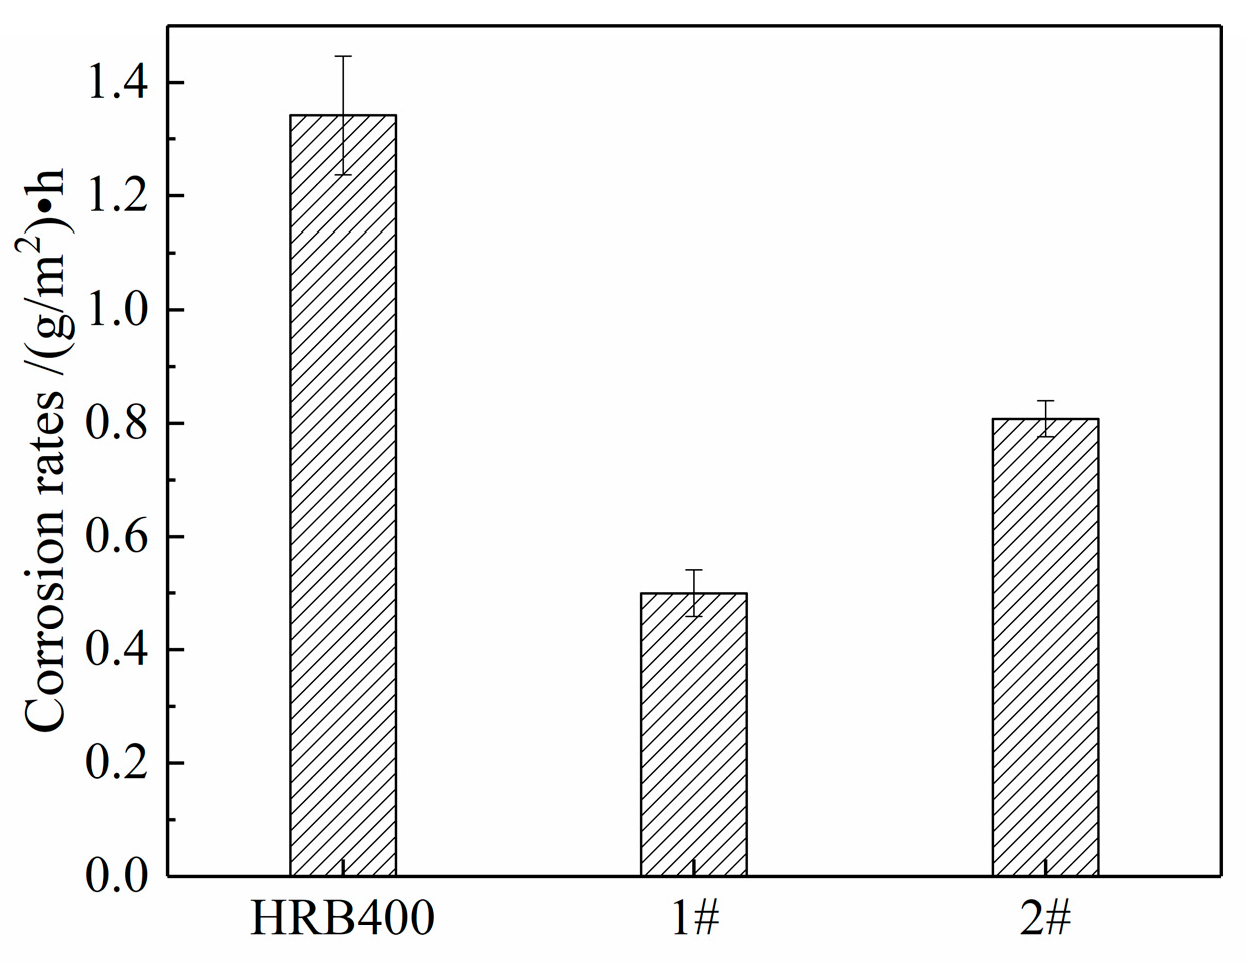
2.4. Corrosion Rate Measurements
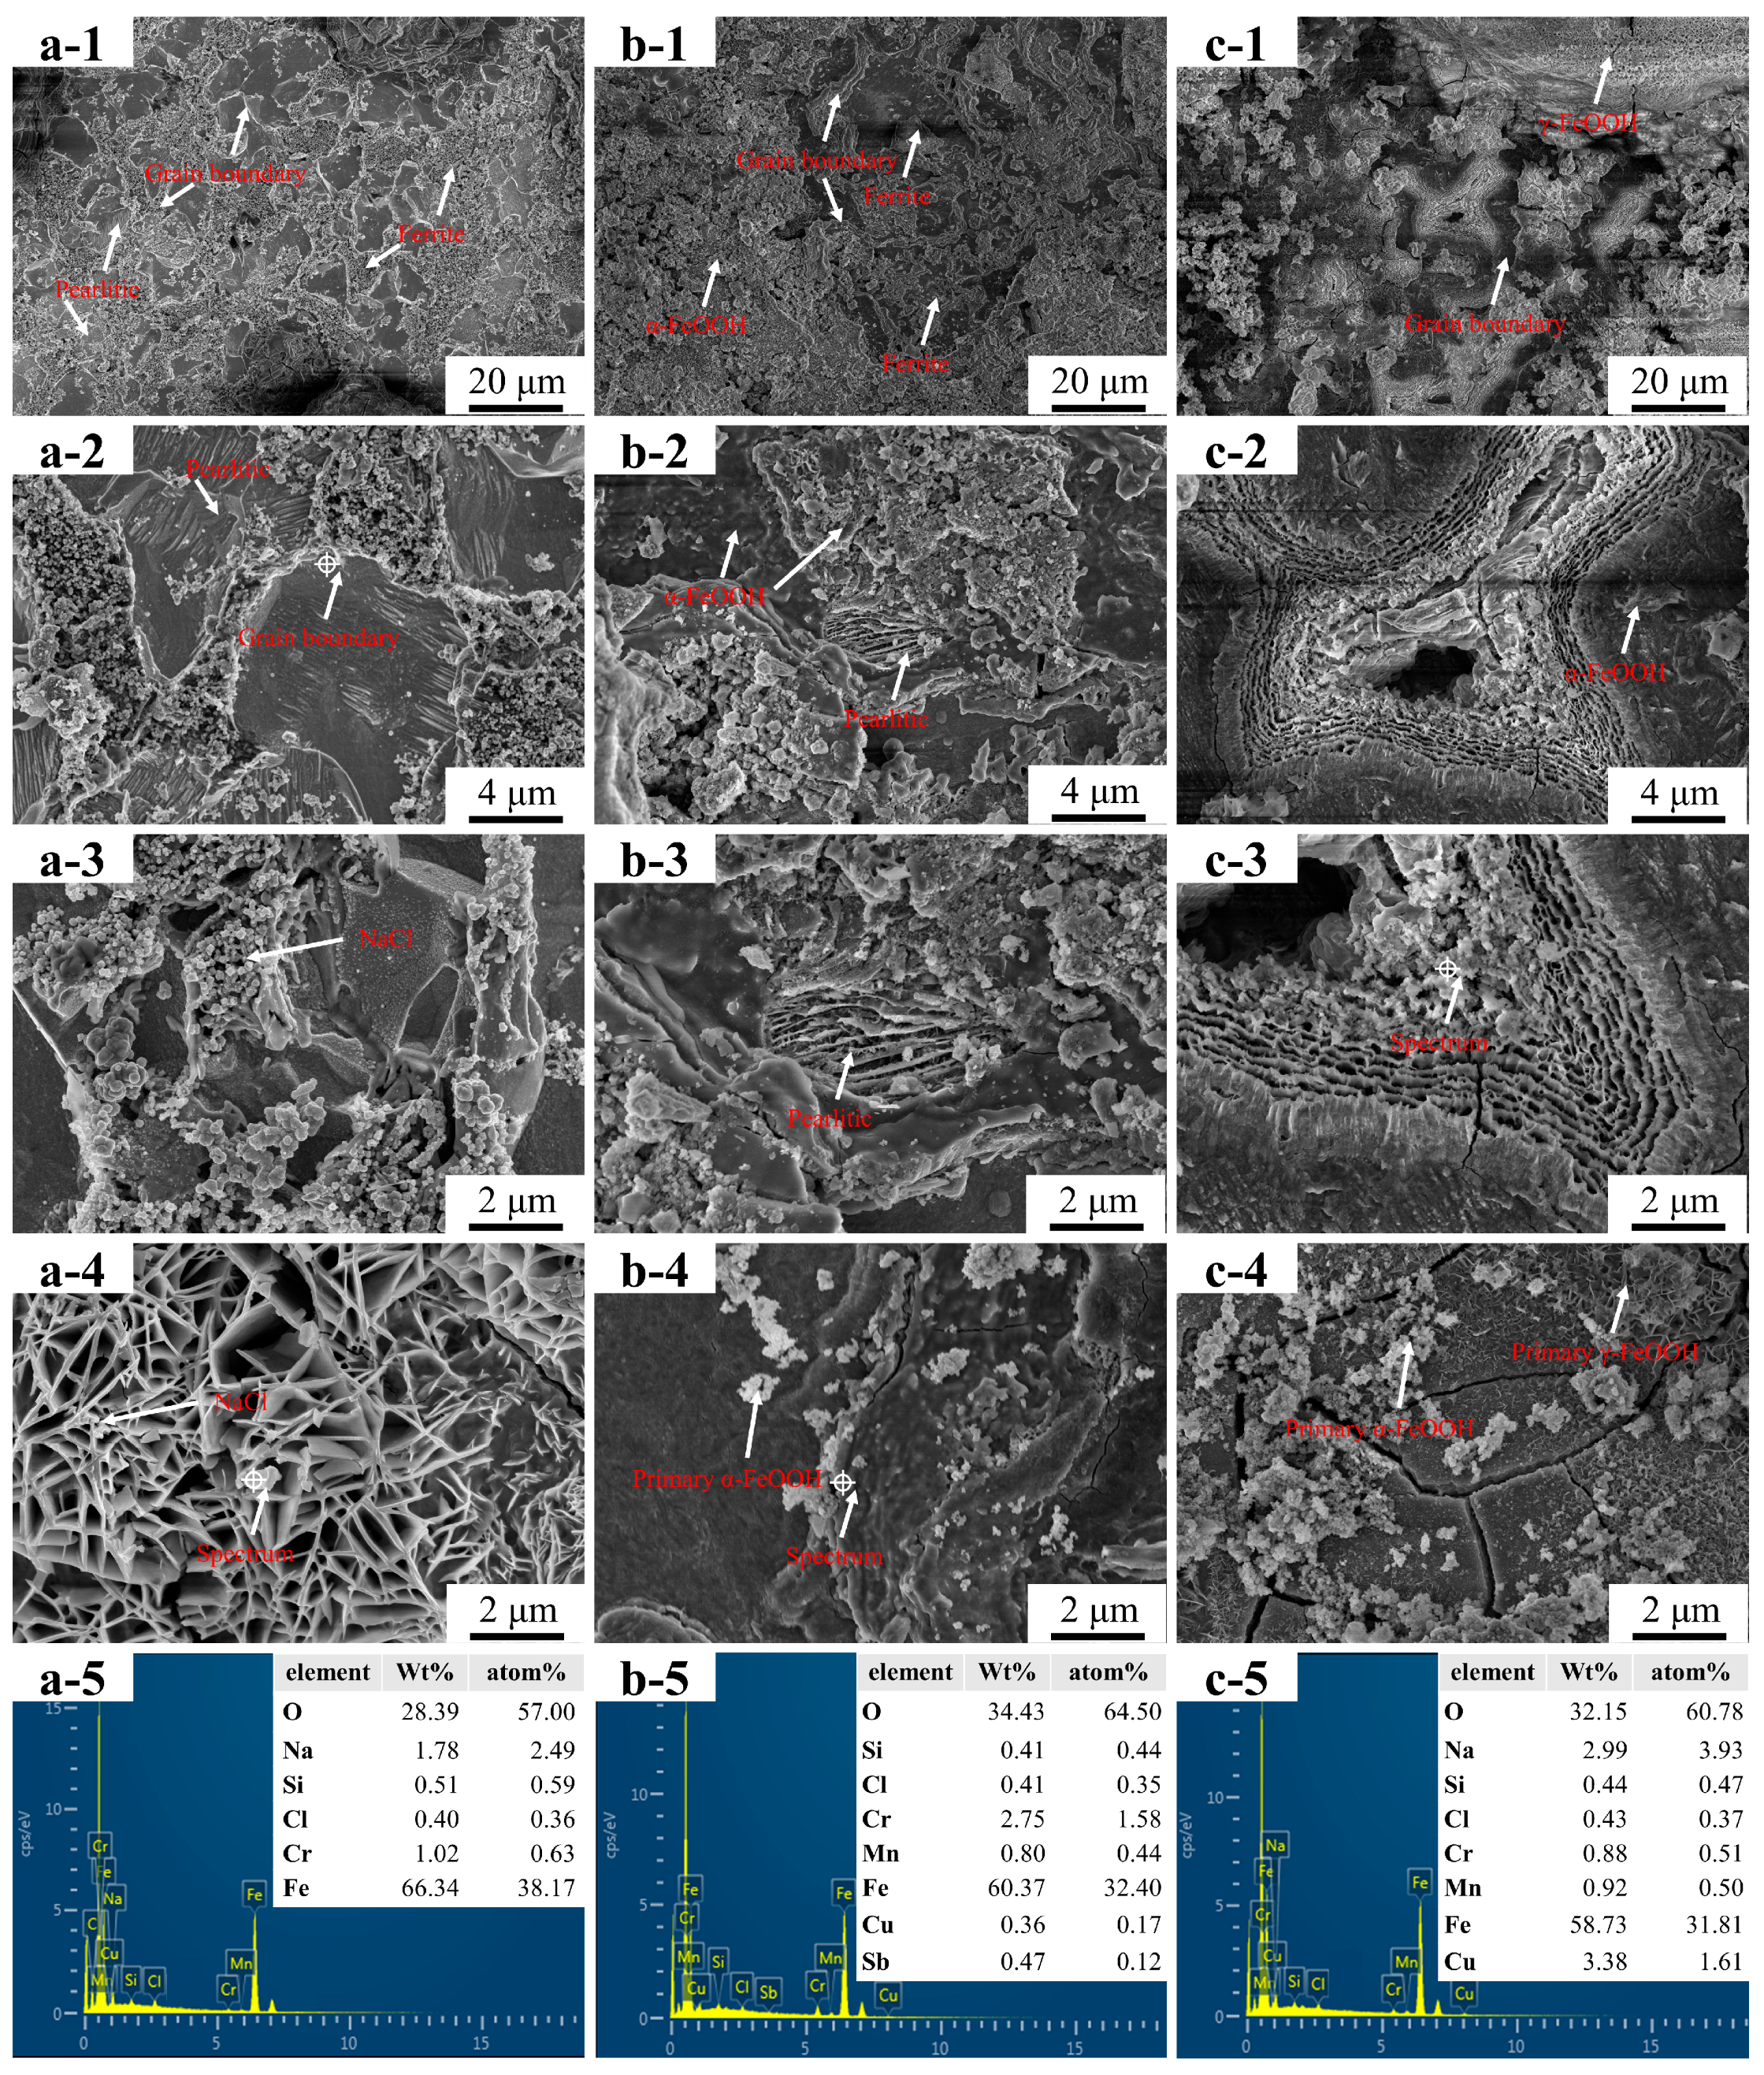
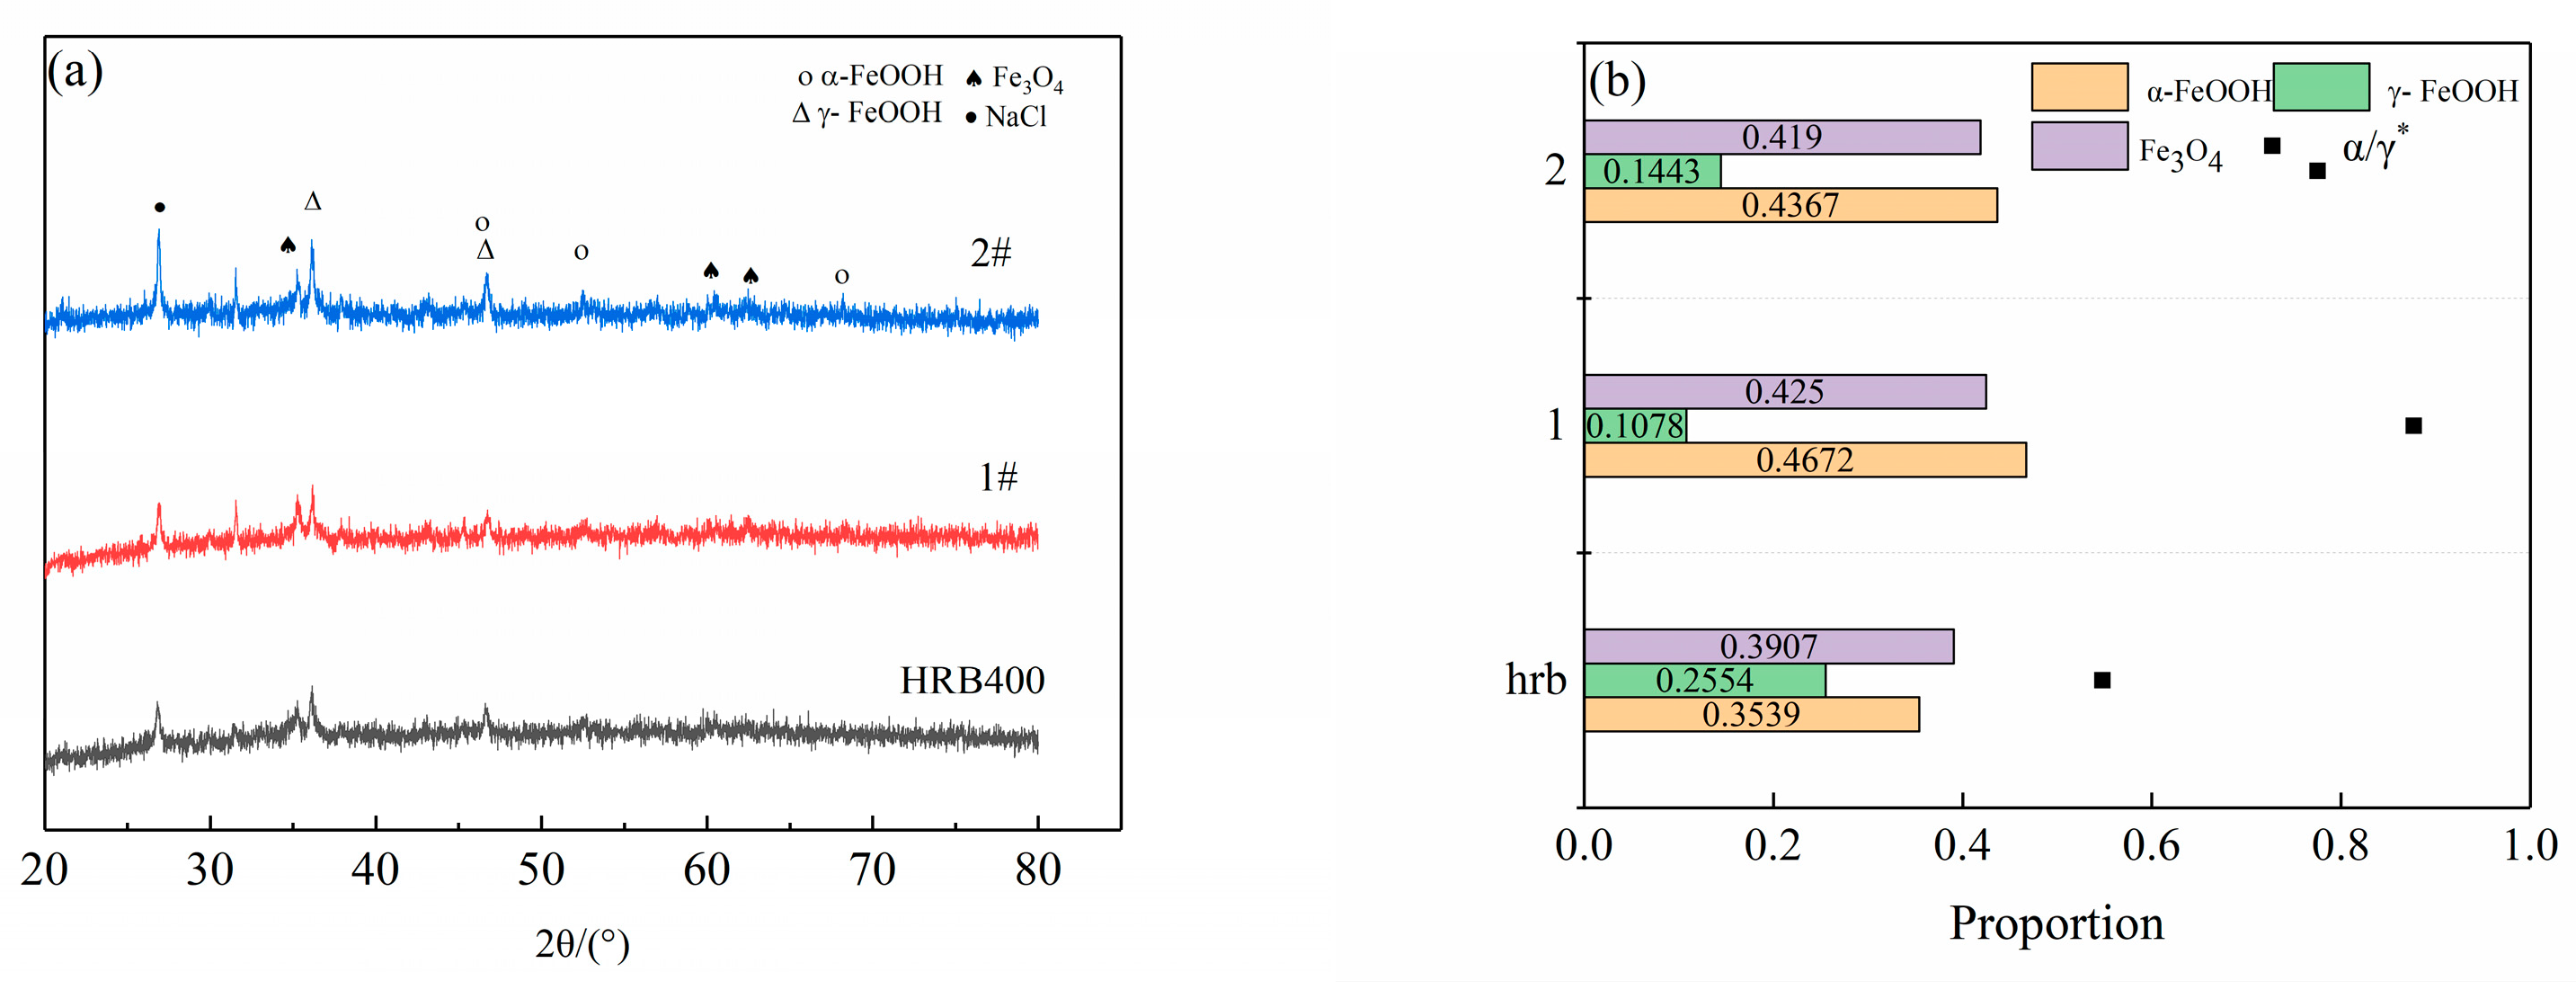
2.5. Corrosion Product Analysis
3. Results
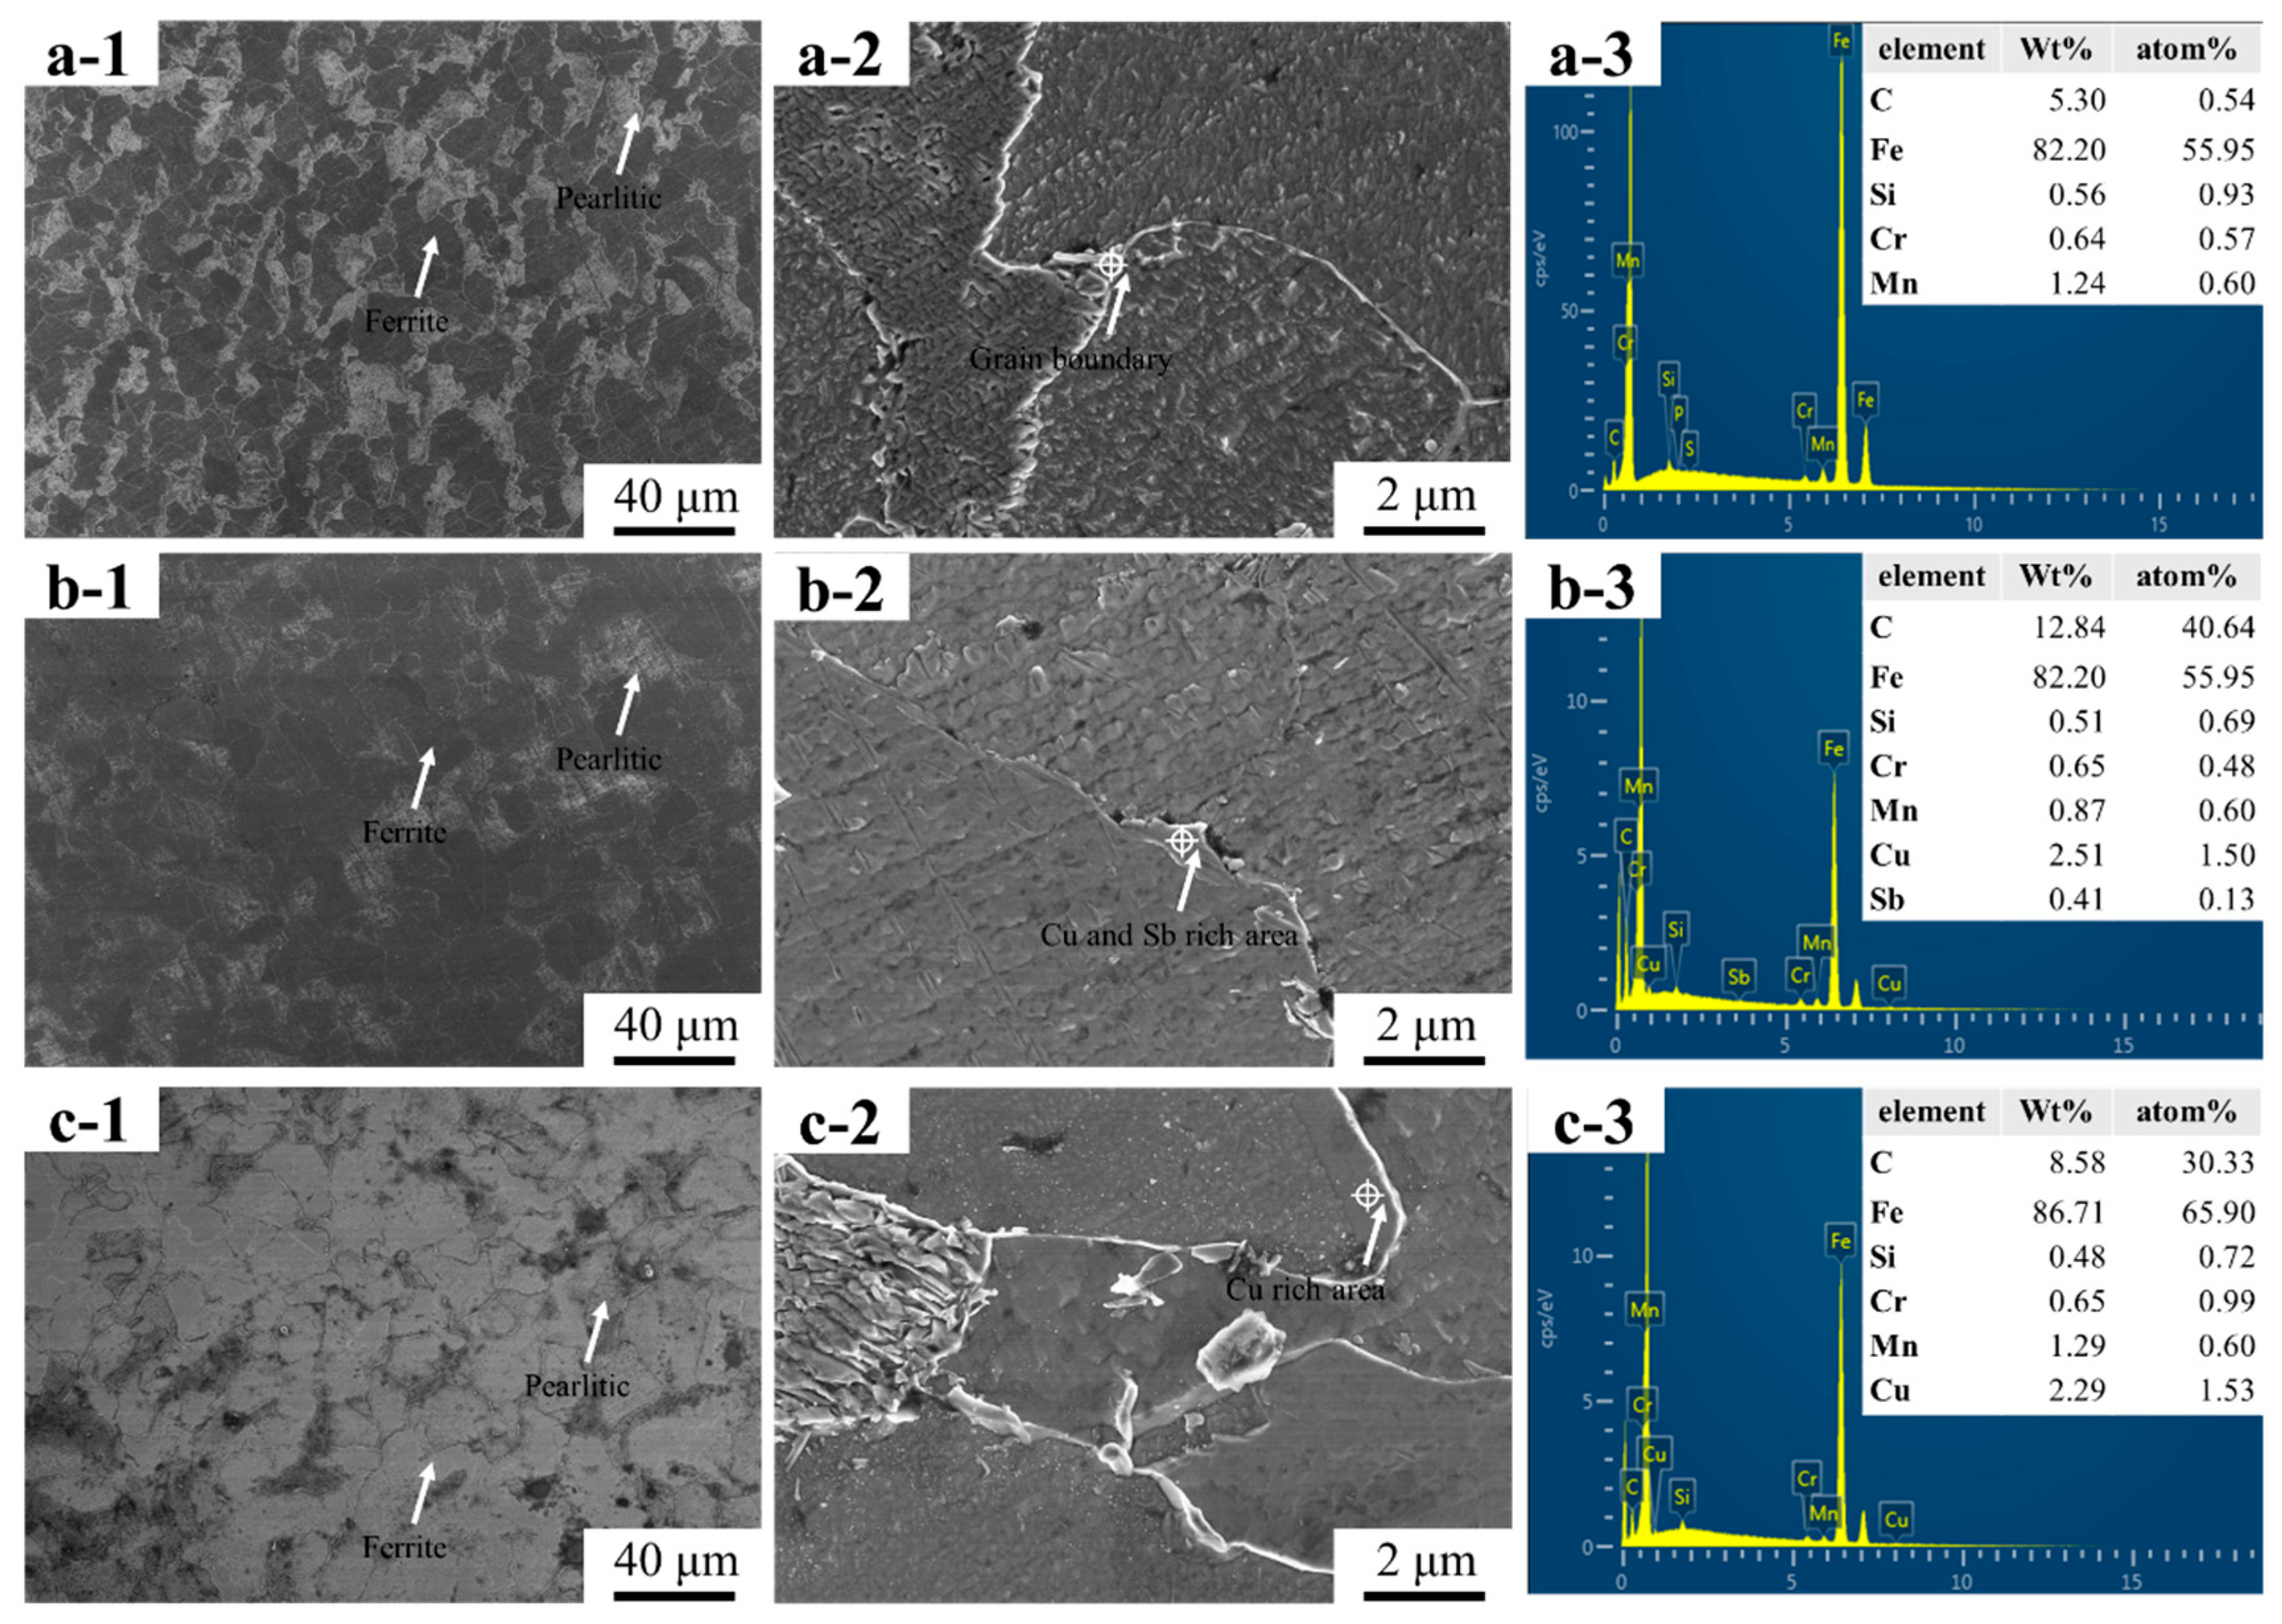
3.1. Microstructure
3.2. EIS Results
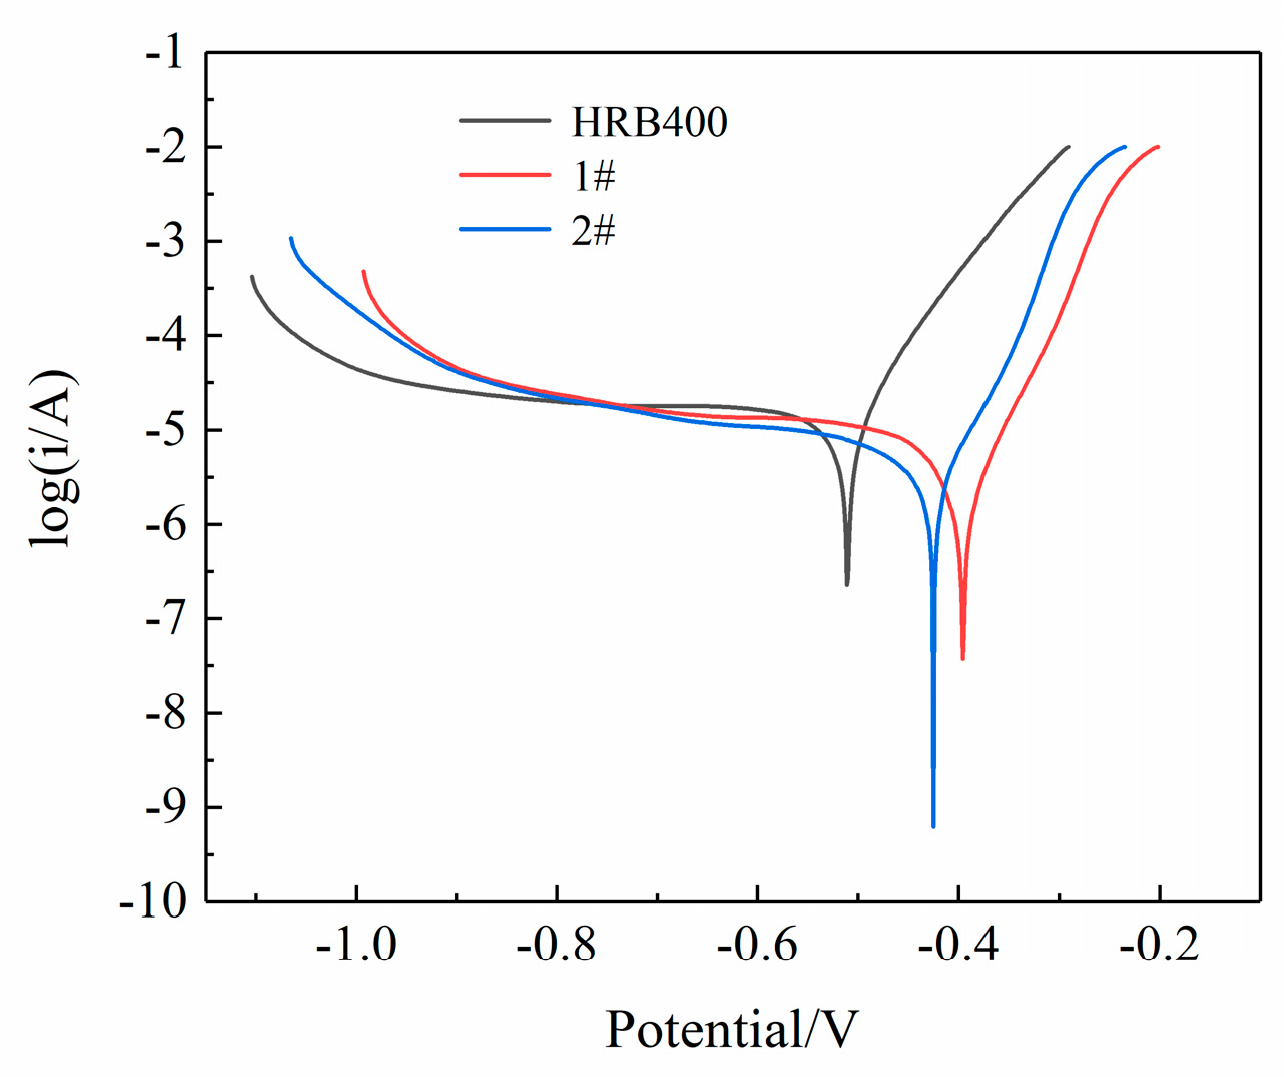
3.3. Potentiodynamic Polarization Results
3.4. Cyclic Immersion Test
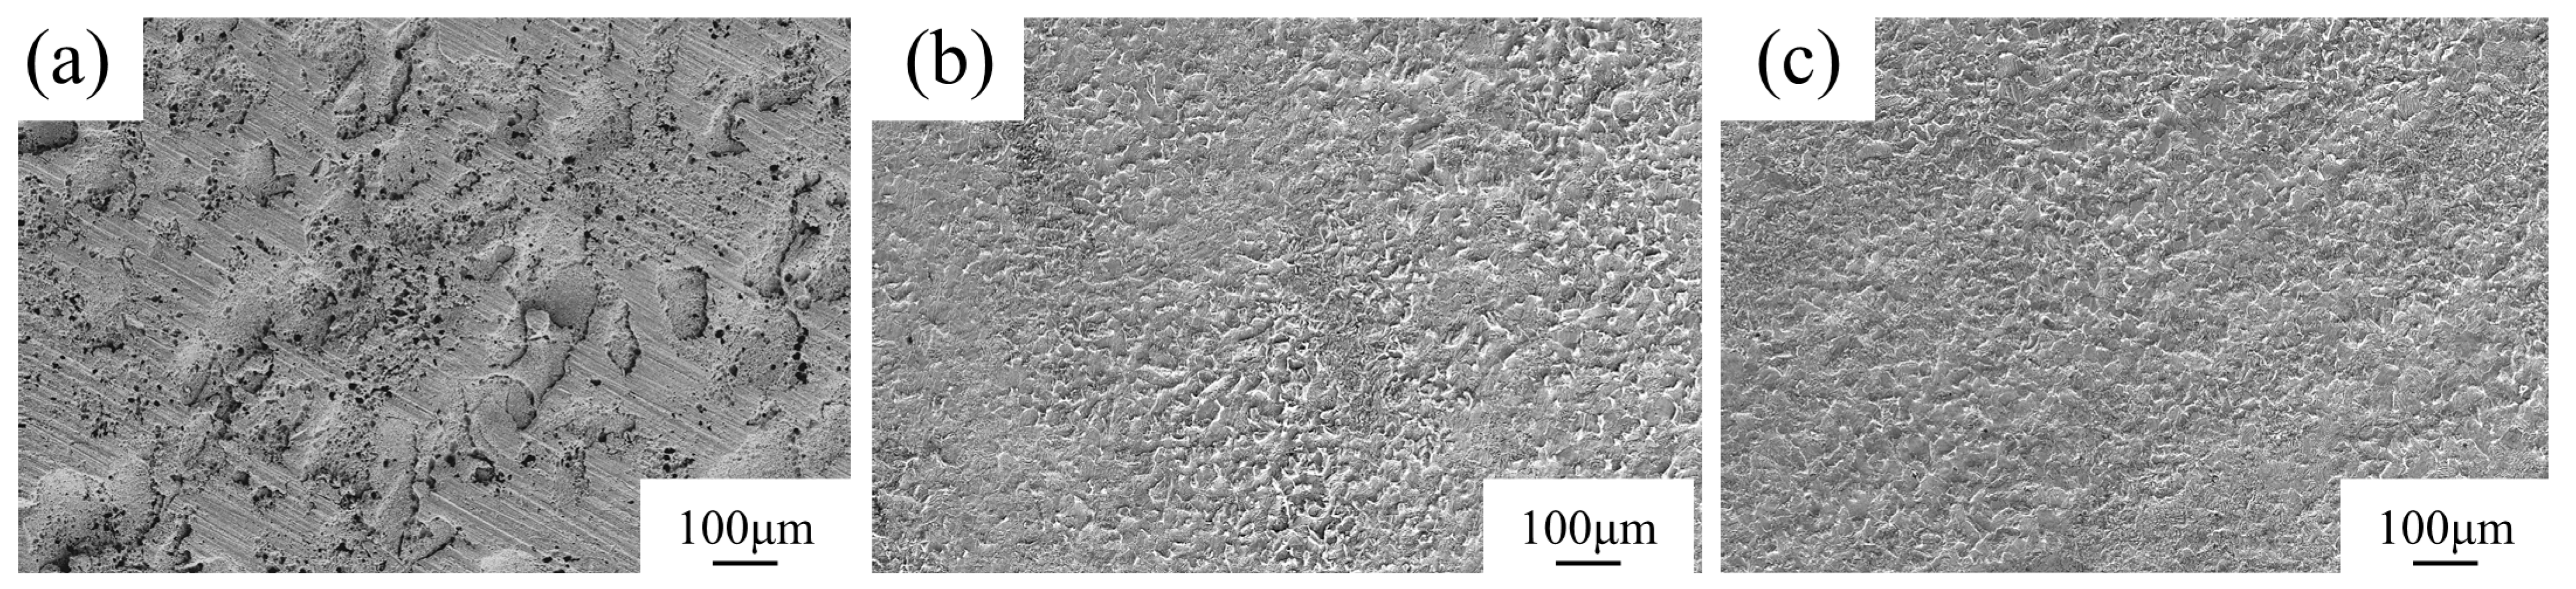
3.5. Salt Spray Test
4. Discussion
5. Conclusions
Author Contributions
Funding
Data Availability Statement
Conflicts of Interest
References
- Jeong, J.; Ha, J. Improvement of throwing power of cathodic protection in reinforced concrete structure with conductive mortar. J. Adv. Mar. Eng. Technol. 2021, 45, 21–25. [Google Scholar] [CrossRef]
- Chen, J.; Ji, L.; Song, J. Study of Crevice Corrosion Behavior and Cathodic Protection of Carbon Steel Reinforcement in Concrete. Int. J. Electrochem. Sci. 2022, 17, 220140. [Google Scholar] [CrossRef]
- Fürbeth, W. Special Issue: Advanced Coatings for Corrosion Protection. Materials 2020, 13, 3401. [Google Scholar] [CrossRef] [PubMed]
- Cuong, P.; Thao, D. Effect of surface roughness and plasma current to adhesion of Cr3C2-NiCr coating fabricated by plasma spray technique on 16Mn steel. Int. J. Mod. Phys. B 2021, 35, 2140037. [Google Scholar] [CrossRef]
- Wei, X.; Fu, D.; Chen, M.; Wu, W.; Wu, D.; Liu, C. Data mining to effect of key alloying elements on corrosion resistance of low alloy steels in Sanya seawater environmentAlloying Elements. J. Mater. Sci. Technol. 2021, 64, 222. [Google Scholar] [CrossRef]
- Wu, Y. Brief Analysis of Stainless Steel, from the Type, Performance, Cost and the Application. South. Met. 2018, 3, 43–47. [Google Scholar]
- Jing, Q.; Fang, X.; Ni, J.; Tang, B. Use of 2304 Stainless Steel Reinforcement in Hong Kong-Zhuhai-Macau Bridge—Corrosion Behaviors of 2304 Stainless Steel Reinforcement. J. Highw. Transp. Res. Dev. 2017, 34, 51–56. [Google Scholar]
- Nishimura, T.; Katayama, H.; Noda, K.; Kodama, T. Effect of Co and Ni on the corrosion behavior of low alloy steels in wet/dry environments. Corros. Sci. 2000, 42, 1611–1621. [Google Scholar] [CrossRef]
- Zhou, Y.; Chen, J.; Xu, Y.; Liu, Z. Effects of Cr, Ni and Cu on the Corrosion Behavior of Low Carbon Microalloying Steel in a CF− Containing Environment. J. Mater. Sci. Technol. 2013, 29, 168–174. [Google Scholar] [CrossRef]
- Yin, X.; Meng, Z.; Hu, H. Research on Corrosion Resistance of Low Cost Al-Ti-Cr High Strength Seawater Corrosion Resistant Steel. Mater. Rev. 2021, 35, 14084–14088. [Google Scholar]
- Holm, S.; Holm, T.; Martinsen, O.G. Simple circuit equivalents for the constant phase element. PLoS ONE 2021, 16, 0248786. [Google Scholar] [CrossRef] [PubMed]
- Zong, Y.; Liu, C. Microstructure, Mechanical Properties, and Corrosion Behavior of Ultra-Low Carbon Bainite Steel with Different Niobium Content. Materials 2021, 14, 311. [Google Scholar] [CrossRef] [PubMed]
- Tian, Y.; Zhang, G.; Ye, H.; Zeng, Q.; Zhang, Z.; Tian, Z.; Jin, X.; Jin, N.; Chen, Z.; Wang, J. Corrosion of steel rebar in concrete induced by chloride ions under natural environments. Constr. Build. Mater. 2023, 369, 130504. [Google Scholar] [CrossRef]
- Feng, G.; Jin, Z.; Xiong, C.; Fan, J. Corrosion Behavior of Corrosion-resistant Steel in Cracked Concrete Exposed to Marine Tidal Area for 700 Days. Mater. Rev. 2020, 34, 8064–8070. [Google Scholar]
- Moshtaghi, M.; Eskinja, M.; Mori, G.; Griesser, T.; Safyari, M.; Cole, I. The effect of HPAM polymer for enhanced oil recovery on corrosion behaviour of a carbon steel and interaction with the inhibitor under simulated brine conditions. Corros. Sci. 2023, 217, 111118. [Google Scholar] [CrossRef]
- Wu, W.; Dai, Z.; Liu, Z.; Liu, C.; Li, X. Synergy of Cu and Sb to enhance the resistance of 3%Ni weathering steel to marine atmospheric corrosion. Corros. Sci. 2021, 183, 109353. [Google Scholar] [CrossRef]
- Wu, W.; Wang, Q.; Yang, L.; Liu, Z.; Li, X.; Li, Y. Corrosion and SCC initiation behavior of low-alloy high-strength steels microalloyed with Nb and Sb in a simulated polluted marine atmosphere. J. Mater. Res. Technol. 2020, 9, 12976–12995. [Google Scholar] [CrossRef]
- Kamimura, T.; Hara, S.; Miyuki, H.; Yamashita, M.; Uchida, H. Composition and protective ability of rust layer formed on weathering steel exposed to various environments. Corros. Sci. 2006, 48, 2799–2812. [Google Scholar] [CrossRef]
- Hao, W.; Liu, Z.; Wu, W.; Li, X.; Du, C.; Zhang, D. Electrochemical characterization and stress corrosion cracking of E690 high strength steel in wet-dry cyclic marine environments. Mater. Sci. Eng. A 2018, 710, 318–328. [Google Scholar] [CrossRef]
- Xiao, Z.; Huang, Y.; Liu, Z.; Hu, W.; Wang, Q.; Hu, C. The Role of Grain Boundaries in the Corrosion Process of Fe Surface: Insights from ReaxFF Molecular Dynamic Simulations. Metals 2022, 12, 876. [Google Scholar] [CrossRef]
- Pan, M.; Liu, X.; Jin, W.; Fu, S.; Yang, E.; Liu, X.; Zhao, L.; Zhang, X.; Yan, M. Effect of Cu grain boundary modification on microstructure and corrosion resistance in recycled Nd-Fe-B sintered magnets. J. Magn. Magn. Mater. 2022, 550, 169109. [Google Scholar] [CrossRef]
- Du, H.; An, N.; Wang, X.; Li, Y.; Liu, Z.; Jin, A.; Yang, R.; Pan, Y.; Li, X. Enhancing the SCC Resistance of the Anchor Steel with Microalloying in a Simulated Mine Environment. Materials 2023, 16, 5965. [Google Scholar] [CrossRef]
- Wang, G.; Wu, Q.; Li, X.; Xu, J.; Xu, Y.; Shi, W.; Wang, S. Microscopic Analysis of Steel Corrosion Products in Seawater and Sea-Sand Concrete. Materials 2019, 12, 3330. [Google Scholar] [CrossRef] [PubMed]
- Hao, X.; Dong, J.; Wei, J.; Etim, I.; Ke, W. Effect of Cu on corrosion behavior of low alloy steel under the simulated bottom plate environment of cargo oil tank. Corros. Sci. 2017, 121, 84–93. [Google Scholar] [CrossRef]
- Ratnani, S.; Kumari, A.; Verma, C. Corrosion protection effect of rust and scales: A “metal protects metal” perception by considering the examples of hematite and magnetite. Asia-Pac. J. Chem. Sci. 2024, 19, 3003. [Google Scholar] [CrossRef]
- Daniel, E.; Li, C.; Wang, C.; Dong, J.; Udoh, I.; Okafor, P.; Zhang, D.; Zhong, W.; Zhong, S. Insights into the characteristics of corrosion products formed on the contact and exposed regions of C1045 steel bolt and nut fasteners exposed to aqueous chloride environments. J. Mater. Sci. Technol. 2022, 135, 250–264. [Google Scholar] [CrossRef]
- Yang, Y.; Cheng, X.; Zhao, J.; Fan, Y.; Li, X. A study of rust layer of low alloy structural steel containing 0.1 % Sb in atmospheric environment of the Yellow Sea in China. Corros. Sci. 2021, 188, 109549. [Google Scholar] [CrossRef]
- Ahn, S.; Park, K.; Oh, K.; Hwang, S.; Park, B.; Kwon, H.; Shon, M. Effects of Sn and Sb on the Corrosion Resistance of AH 32 Steel in a Cargo Oil Tank Environment. Met. Mater. Int. 2015, 21, 865–873. [Google Scholar] [CrossRef]


| Steel | C | Mn | Si | Cu | Sb | P | V | Fe |
|---|---|---|---|---|---|---|---|---|
| HRB400 | 0.215 | 1.342 | 0.389 | - | - | 0.032 | 0.002 | Balance |
| 1# | 0.204 | 1.314 | 0.403 | 0.246 | 0.152 | 0.078 | 0.054 | Balance |
| 2# | 0.212 | 1.322 | 0.419 | 0.253 | - | 0.080 | 0.050 | Balance |
| Rs/(Ω·cm2) | R1/(Ω·cm2) | CPE1 | Rf/(Ω·cm2) | CPE2 | χ2 | |||
|---|---|---|---|---|---|---|---|---|
| C/(F·cm−2) | n | C/(F·cm−2) | n | |||||
| HRB400 | 4.707 | 7.21 | 2.14 × 10⁻⁵ | 0.8112 | 803 | 3.83 × 10⁻⁴ | 0.8045 | 1.197 × 10⁻³ |
| 1# | 6.109 | 32.18 | 11.5 × 10⁻⁵ | 0.7650 | 1356 | 1.19 × 10⁻⁴ | 0.9123 | 1.452 × 10⁻³ |
| 2# | 5.936 | 15.36 | 8.95 × 10⁻⁵ | 0.8353 | 1076 | 2.42 × 10⁻⁴ | 0.8894 | 1.953 × 10⁻³ |
| Ecorr (V) | Icorr (A·cm−2) | βa (1/V) | βc (1/V) | Rp (Ω) | |
|---|---|---|---|---|---|
| HRB400 | −0.511 | 1.375 × 10⁻⁵ | 14.442 | 1.275 | 2012 |
| 1# | −0.392 | 2.086 × 10⁻⁶ | 23.948 | 2.539 | 7870 |
| 2# | −0.427 | 2.699 × 10⁻⁶ | 27.067 | 2.935 | 5414 |
Disclaimer/Publisher’s Note: The statements, opinions and data contained in all publications are solely those of the individual author(s) and contributor(s) and not of MDPI and/or the editor(s). MDPI and/or the editor(s) disclaim responsibility for any injury to people or property resulting from any ideas, methods, instructions or products referred to in the content. |
© 2024 by the authors. Licensee MDPI, Basel, Switzerland. This article is an open access article distributed under the terms and conditions of the Creative Commons Attribution (CC BY) license (https://creativecommons.org/licenses/by/4.0/).
Share and Cite
Chen, Y.; Meng, Z.; Li, Y.; Shen, J. Research on the Chloride Ion Corrosion Resistance of Cu-Sb-Added Low-Carbon Steel. Metals 2024, 14, 611. https://doi.org/10.3390/met14060611
Chen Y, Meng Z, Li Y, Shen J. Research on the Chloride Ion Corrosion Resistance of Cu-Sb-Added Low-Carbon Steel. Metals. 2024; 14(6):611. https://doi.org/10.3390/met14060611
Chicago/Turabian StyleChen, Yuanyu, Zhengbing Meng, Yuxiang Li, and Jialong Shen. 2024. "Research on the Chloride Ion Corrosion Resistance of Cu-Sb-Added Low-Carbon Steel" Metals 14, no. 6: 611. https://doi.org/10.3390/met14060611
APA StyleChen, Y., Meng, Z., Li, Y., & Shen, J. (2024). Research on the Chloride Ion Corrosion Resistance of Cu-Sb-Added Low-Carbon Steel. Metals, 14(6), 611. https://doi.org/10.3390/met14060611