Article

The Effect of Hot Forming–Quenching and Heat Treatment Processes on the Mechanical Properties of AA6016 Aluminum Alloy Sheets

1
College of Materials Science and Engineering, Nanjing Tech University, Nanjing 211816, China
2
Yangtze Delta Region Institute of Advanced Materials, Suzhou 215133, China
3
College of Mechanical and Vehicle Engineering, Chongqing Jiaotong University, Chongqing 400074, China
*
Authors to whom correspondence should be addressed.
Metals 2024, 14(5), 599; https://doi.org/10.3390/met14050599
Submission received: 22 April 2024 / Revised: 15 May 2024 / Accepted: 17 May 2024 / Published: 20 May 2024

Abstract

:
This study explored the impact of Hot Forming–Quenching (HFQ) and heat treatment processes on the mechanical properties of AA6016 sheets. The experimental findings demonstrated that at high-temperature pre-straining (HT-PS) of 15%, the strength performance of the AA6016 sheet exhibited enhancement, with a progressive increase in both the heat treatment temperature and duration. Conversely, under HT-PS conditions of 3% and 7%, the heat treatment process exhibited a relatively modest impact on the mechanical properties of the AA6016 sheet. Differential scanning calorimetry (DSC) was employed to understand the influence of different process conditions on the precipitated phases. By comparing the precipitation peaks of the β phase at HT-PS of 3% and 15%, it was observed that the precipitation peak of the β phase decreased with an increase in HT-PS. This indicated that HT-PS promoted the precipitation of the β phase. In order to forecast the mechanical performance of the AA6016 sheets after applying various pre-straining and heat treatment parameters, two models were used: a backpropagation (BP) neural network and a genetic algorithm (GA)-BP neural network. These models were evaluated for their fitting and predictive capabilities. The research findings demonstrated that the GA-BP neural network model exhibited superior fitting and predictive accuracy compared to the BP neural network model.

1. Introduction

Under high-temperature conditions, aluminum alloy sheets exhibit a remarkable plastic deformation ability, which greatly facilitates the production of high-performance components. Among various aluminum alloy hot stamping techniques, Hot Forming–Quenching (HFQ) technology has gained significant attention. This technology involves rapidly transferring a fully solutionized aluminum alloy onto a cold die, promptly closing the die, and achieving in-die quenching [1]. In a study conducted by Omer [2] et al., the influence of the HFQ process on the mechanical properties of AA5754 was investigated. The results demonstrated that the HFQ process was highly advantageous for forming parts and enhancing their performance. Similarly, Zheng [3] et al. explored the effects of the HFQ process on AA7075 and AA6082. The findings indicated that HFQ significantly reduced the post-treatment mechanical properties of highly quench-sensitive AA7075, but improved those of less quench-sensitive AA6082. This process enables dual enhancement of the formability and strength of aluminum alloys, aligning with the lightweighting trend in the automotive industry. As a result, it holds promising prospects for development in the automotive sector.
Hot stamping and heat treatment processes have a notable impact on the properties of aluminum alloy sheets. However, in collision simulations, the current material models often overlook the effects of stamping and heat treatment, focusing only on the initial properties of the sheet. This oversight can lead to inaccuracies in collision simulations. Consequently, researchers have directed their attention towards understanding the influence of pre-strain (resulting from stamping) and heat treatment processes on the performance of aluminum alloy sheets. Tetsuya [4] conducted a study on the combined effects of pre-strain and pre-aging on the bake-hardening of an Al-0.6 mass%Mg-1.0 mass%Si alloy. The results revealed that pre-strain and pre-aging accelerated the precipitation of the β phase after heat treatment. Li [5] investigated the impact of the strain path, pre-strain direction, and pre-strain level on the performance of AA6111-T4 after heat treatment. The findings indicated that the pre-strain level and strain path significantly influence the material properties. Notably, when the stretching orientation aligns with the pre-strain direction, the yield strength is significantly increased. Engler [6] studied the combined effects of natural aging and pre-strain on the tensile properties and in-plane anisotropy of AA6016. The results demonstrated that extending the natural aging and pre-strain can considerably enhance the mechanical properties of AA6016 sheets. However, a pre-strain of 2% resulted in anisotropy while maintaining the same texture. Extensive research has also been conducted on the mechanistic effects of pre-strain and heat treatment processes on aluminum alloys. Pre-strain exerts a significant influence on precipitation behavior in Al-Mg-Si alloys [7]. The dislocations introduced by pre-strain are considered nucleation sites for fixed vacancies during quenching, preventing their accumulation at room temperature and suppressing the negative effects of natural aging. During heat treatment, dislocations serve as heterogeneous nucleation sites for Guinier–Preston (GP) zones, which can easily grow and transform into the β phase through enhanced atomic transport [8,9]. The β phase significantly affects the heat treatment hardening response (BHR) of aluminum alloys [10], as its continuous formation during heat treatment effectively mitigates the detrimental effects of natural aging [11]. Therefore, researchers have demonstrated through DSC and transmission electron microscopy (TEM) studies that at a heat treatment temperature of around 240 °C, the precipitates were primarily in the β phase [12,13]. Zandbergen [14] et al. analyzed the effects of heat treatment on the precipitation in Al-Mg-Si (6xxx) alloys using atom probe tomography (APT). The results showed that with an increasing heat treatment time and temperature, more of the β phase precipitated.
Constitutive models of initial aluminum alloy sheets have been extensively studied by researchers [15,16,17]. However, there is a lack of research on constitutive models that consider HT-PS and heat treatment processes. The traditional constitutive models used to describe the stress–strain behavior of materials often rely on assumptions and simplifications that may not accurately capture the intricate behavior of the material. Furthermore, these models typically do not incorporate pre-strain and heat treatment parameters as variable factors. In contrast, neural network models have shown promise in accurately fitting the entire stress–strain curve, including different stages such as elasticity, plasticity, yield, and fracture. Researchers such as Yang [18] have utilized artificial neural network (ANN) models to predict the mechanical properties of the A357 alloy, demonstrating that the backpropagation (BP) model achieves a higher prediction accuracy. Li [19] and others have employed BP neural network models, BP neural networks optimized with genetic algorithms (GAs), and radial basis function (RBF) neural network models for modeling analysis, comparing their predictive results. The findings indicate that the GA-optimized BP neural network (GA-BP) outperforms BP and RBF neural networks in terms of its prediction accuracy.
Most of the studies mentioned above have primarily focused on investigating the mechanical properties of aluminum alloy sheets after undergoing cold deformation and heat treatment processes. However, limited research has been conducted on the effects of hot deformation, particularly the HFQ process and heat treatment process, on the properties of aluminum alloy sheets. Furthermore, there is a lack of research on constitutive models for aluminum alloys that take into account the HFQ and heat treatment processes. Therefore, the objective of this study is to examine the microstructure of AA6016 according to HT-PS parameters and heat treatment processes parameters. The experimental results serve as the basis for employing the backpropagation (BP) neural network model and a BP neural network model optimized with a genetic algorithm (GA-BP) to fit the data. Subsequently, the accuracy of fitting and the prediction of the two models are analyzed.

2. Materials and Experimental Methods

2.1. Materials

The experimental specimens were fabricated from 1.1 mm thick AA6016 rolled aluminum sheets, with their chemical composition provided by the material manufacturer, as shown in Table 1. The dimensions of the hot tensile specimens were depicted in Figure 1, featuring a total length of 110 mm and a gauge length of 15mm.

2.2. HT-PS and Heat Treatment Experiments

In order to accurately reflect the mechanical behavior of AA6016 during the hot stamping process and after heat treatment, an experimental plan for AA6016 was developed based on the deformation temperature during hot stamping and the heat treatment temperature and the holding time during the heat treatment. The specific process parameters for AA6016 are outlined in Table 2, and the designated process flow is illustrated in Figure 2. It should be noted that the heat treatment in this paper is intended to simulate the automotive paint baking process.
The specimens were subjected to HT-PS using the 200 kN Thermecmastor (Tokyo, Japan) thermal simulation testing machine. Thermocouples (Type K) were welded to the center of the gauge length section of the samples to measure the temperature. The welding of the thermocouples onto the gauge length section allowed for control over the heating time and cooling rate. The AA6016 sheet undergoes a solution treatment at 550 °C for 200 s, followed by air cooling to 450 °C (cooling rate of 10 °C/s). Subsequently, at 390 °C, the sheets were deformed at a strain rate of 0.01 s−1 to different pre-strain levels (3%, 7%, 15%, 18%). Simultaneously, the cooling process was conducted during the deformation of the sheets. After the pre-strain, all the samples were kept at room temperature for 2 days and then subjected to the heat treatment process following natural aging. It should be noted that each set of processes was tested at least twice. If there were significant differences between the results of the two tests, a third test was conducted to ensure the accuracy of the experimental data. A representative set of data was selected from each group of experiments to construct the stress–strain curves. The mechanical properties of the AA6016 sheet were obtained by calculating the deviation from the two most accurate sets of data chosen.

2.3. Mechanical Testing before and after the Heat Treatment Process

Both the samples before and after the heat treatment process underwent quasi-static tensile testing at room temperature. This testing was conducted using a universal testing machine, specifically model 5982 (Boston, MA, USA). The crosshead speed during the testing was set at 0.8 mm/min. This testing procedure provided valuable data for evaluating the mechanical properties of the samples.

2.4. Microstructure Characterization

Samples were selected from the vicinity of the gauge length section of the tensile specimens. These samples underwent grinding and polishing processes until a mirror-like finish was achieved, without the need for etching. Subsequently, scanning electron microscopy (SEM) with a tungsten filament Vega scanning electron microscope (Zeiss, Tokyo, Japan, accelerating voltage of 10 kV) was utilized to perform microstructure analysis on the samples. SEM combined with backscattered electrons (BSE) was used to enhance the visibility and facilitate the statistical analysis of the second phase (iron-rich phase). All the specimens were scanned using SEM-BSE, capturing a total of 24 images each. Images numbered 8–16 represent the second phase (iron-rich phase) in the central region, while images numbered 1–7 and 17–24 represent the second phase (iron-rich phase) on both sides. Data statistics were calculated for all the captured images, employing threshold segmentation and batch processing with machine learning techniques. Additionally, the fractured surfaces of the tensile samples were cut and analyzed using the same SEM (accelerating voltage of 15 kV).
Samples were taken from the gauge length section of the specimens that underwent HT-PS. The samples were directly fabricated into circular discs with a diameter of 3 mm and a thickness of 1 mm. The precipitation behavior of AA6016 was analyzed using the Netzsch DSC 214 (Selb, Germany) differential scanning calorimetry (DSC) instrument. This method involved operating the 1100LF system within a temperature range of 50 °C to 550 °C, with a heating rate of 10 °C/min, under an argon atmosphere.

3. Neural Network Model

3.1. BP Neural Network Model

The essence of an artificial neural network is to recognize and predict data using nonlinear equations. After inputting data into the input layer, the initial data begin to pass through the neural network. The data inputted by multiple neurons undergo multiple iterations in the hidden layer and are eventually output in the output layer. The backpropagation (BP) neural network [20] has historically been one of the most widely used error backpropagation network structures. This algorithm had advantages such as a high classification accuracy, a fast self-learning speed, and strong parallel processing capabilities. BP primarily achieves the predetermined design or minimum value of the system error of the entire network by iteratively adjusting the network weights and thresholds [21]. Its structure is shown in Figure 3. In this study, HT-PS, heat treatment temperature, heat treatment time, and strain were used as inputs, while stress, yield strength, tensile strength, and elongation were used as outputs. This allowed for fitting of the constitutive model of AA6016 by utilizing HT-PS and heat treatment parameters as the parameters.

3.1.1. Data Normalization

A large amount of experimental data were obtained from uniaxial tensile tests, and the range of the data was relatively large. Therefore, the data needed to be standardized and organized into a certain range for ease of calculation. In this paper, the method of maximum–minimum normalization was adopted for normalization, and the method for normalization of type A is as follows:
Y = 0.1 + 0.8 × a x m i n a m a x a m i n a
In this method, Y represents the normalized data, mina is the minimum value in class a, and maxa is the maximum value. This method was used to normalize the temperature and stress data obtained from the uniaxial tensile tests.

3.1.2. Function Selection and Forward Propagation

The Sigmoid function was chosen as the transfer function in the model, and its mathematical formula is as follows:
f ( x ) = 1 1 + e x
Take x 1 , x 2 , x 3 ~ x n as the input variables, y as the output variable, and u m as the output of the hidden layer neurons, which, passing through the neurons, goes through the activation function; let v i j be the weight of the ith input variable and the jth hidden layer neuron, and let θ j u be the jth neuron threshold of the hidden layer u: then, the expression of u j can be written as:
u j = f i = 1 n v i j x i + θ j u j = 1,2 ~ m
Let w j be the weight of the jth neuron connected to y and θ y be the threshold of y, which is obtained by activating the Sigmoid function:
y = f j = 1 m w j u j + θ y

3.2. Genetic Algorithm Optimization of BP Neural Networks

Although BP neural networks have strong nonlinear analysis capabilities, they often encounter issues such as local error minimization and slow convergence, which can result in reduced predictive accuracy. Genetic algorithms (GAs) are adaptive parallel optimization algorithms that simulate biological genetic evolution mechanisms. They possess several advantages, including global search, high parallelism, and a strong generalization ability [22]. By applying genetic algorithms to BP neural networks, we can enhance the accuracy of the network training convergence and leverage the global optimization properties of genetic algorithms. In the GA-BP neural network, the initial weights and thresholds of the BP neural network are improved using a genetic algorithm to obtain the global optimal region. Subsequently, the BP neural network is trained using these optimal weights and thresholds until the training process is completed while simultaneously searching for parameters corresponding to the optimal fitness [23]. Figure 4 depicts a schematic diagram generated by the machine learning model. In this study, the genetic algorithm primarily serves to optimize the weights and thresholds of the neural network.
The multi-objective problem can be described by the following equation:
T m i n f x = [ f 1 x , f 2 x , f 3 x , f n x ] T
In the equation, T m i n represents vector minimization, indicating that each sub-objective function f 1 x , f 2 x , f 3 x , f n x should be minimized to the greatest extent possible. In practical applications, there is often interdependence and conflict between the objectives and parameters. It becomes challenging to accurately describe the relationship between the target values and input values using precise functional relationships. Moreover, conflicts frequently arise between multiple target values. Enhancing the performance of one sub-objective may lead to a decrease in the performance of another sub-objective [24]. In other words, it is not feasible to simultaneously achieve optimal values for multiple sub-objectives. Therefore, compromises and coordination must be made to optimize each sub-objective as much as possible, aiming to achieve the best overall optimization results for the system.

4. Results and Discussion

4.1. Mechanical Properties

Figure 5 illustrates the stress–strain curves of AA6016 sheets under different heat treatment treatments after HT-PS. In the diagram, the first set of numbers (3, 7, 15, 18) represents the HT-PS values, the second set of numbers (170, 185, 200) indicates the heat treatment temperatures, and the third set of numbers (10, 20, 30) denotes the heat treatment durations. In Figure 5a, for HT-PS (HT-PS) of 3%, different heat treatments had a minimal effect on the strength of the AA6016 sheet but slightly impacted the elongation. Figure 5b showed that for HT-PS of 7%, particularly with a heat treatment temperature of 185 °C for 30 min, the strength of the AA6016 sheet increased. In Figure 5c, for an HT-PS of 15%, there was a noticeable increase in strength with an increase in the heat treatment temperature and time, but the elongation decreased significantly.
The mechanical properties under different experimental conditions are shown in Table 3, and Figure 6 shows a relationship graph of the yield strength (YS), tensile strength (UTS), and elongation (EI) under different HT-PS conditions. It can be seen in Figure 6a that the YS and UTS for HT-PS3% and HT-PS7% remained relatively stable, while the average values for yield strength and tensile strength at HT-PS15% and 18% were noticeably higher. It can be seen in Figure 6b that the average values of EI decrease with an increase in HT-PS. Therefore, HT-PS has a positive correlation with strength and a negative correlation with elongation. Specifically, when HT-PS increased from 15% to 18%, the heat treatment temperature was set to 200 °C, and the heat treatment time was 30 min, the yield strength significantly increased from 229 MPa to 257 MPa, and elongation decreased from 19% to 9%. This indicated that higher HT-PS combined with the appropriate heat treatment temperature and time could significantly enhance the material’s yield strength, but it could decrease the elongation dramatically.
To further study the impact of the heat treatment process on the mechanical properties, mechanical property tests were conducted on specimens that had undergone HT-PS and natural aging treatment (without the heat treatment process). The experimental results are shown in Table 4. For low HT-PS (3%), an increase in the heat treatment temperature and time did not significantly enhance the yield strength and tensile strength. This demonstrated that the strengthening effect of the heat treatment process was limited at lower levels of HT-PS. For high HT-PS (15%), the strengthening effect of the heat treatment process depends on the heat treatment temperatures and times. The heat treatment effect became more pronounced when the temperature was higher than 185 °C and the heat treatment time was 30 min. Under HT-PS (3% and 15%) conditions, the heat treatment process had a minor impact on the elongation of the AA6016 sheet.

4.2. Influence of the Manufacturing Process on Microstructure and Properties

Based on the analysis of the tensile test results, it was concluded that the heat treatment process had a negligible impact on the elongation of the samples. To further validate this conclusion, all the fracture surfaces of the tensile specimens were sectioned. The cut surfaces were then scanned using SEM, and various fracture morphologies were analyzed. Four fracture surface images with significantly different elongation values were selected for comparison, as shown in Figure 7. As shown in Figure 7a,b, when the HT-PS was 3%, the fracture morphologies of the different heat-treated specimens were similar, exhibiting ductile fractures with deep dimples. Similarly, as depicted in Figure 7c,d, when the HT-PS was 15%, the fracture morphologies of the different heat-treated specimens were also similar but with shallower dimples. By comparing images with different pre-strains, it was evident that with increasing pre-strain, the number of dimples decreased, and the dimples became shallower. Therefore, the influence of HT-PS on the material fracture mode was greater than that of heat treatment.
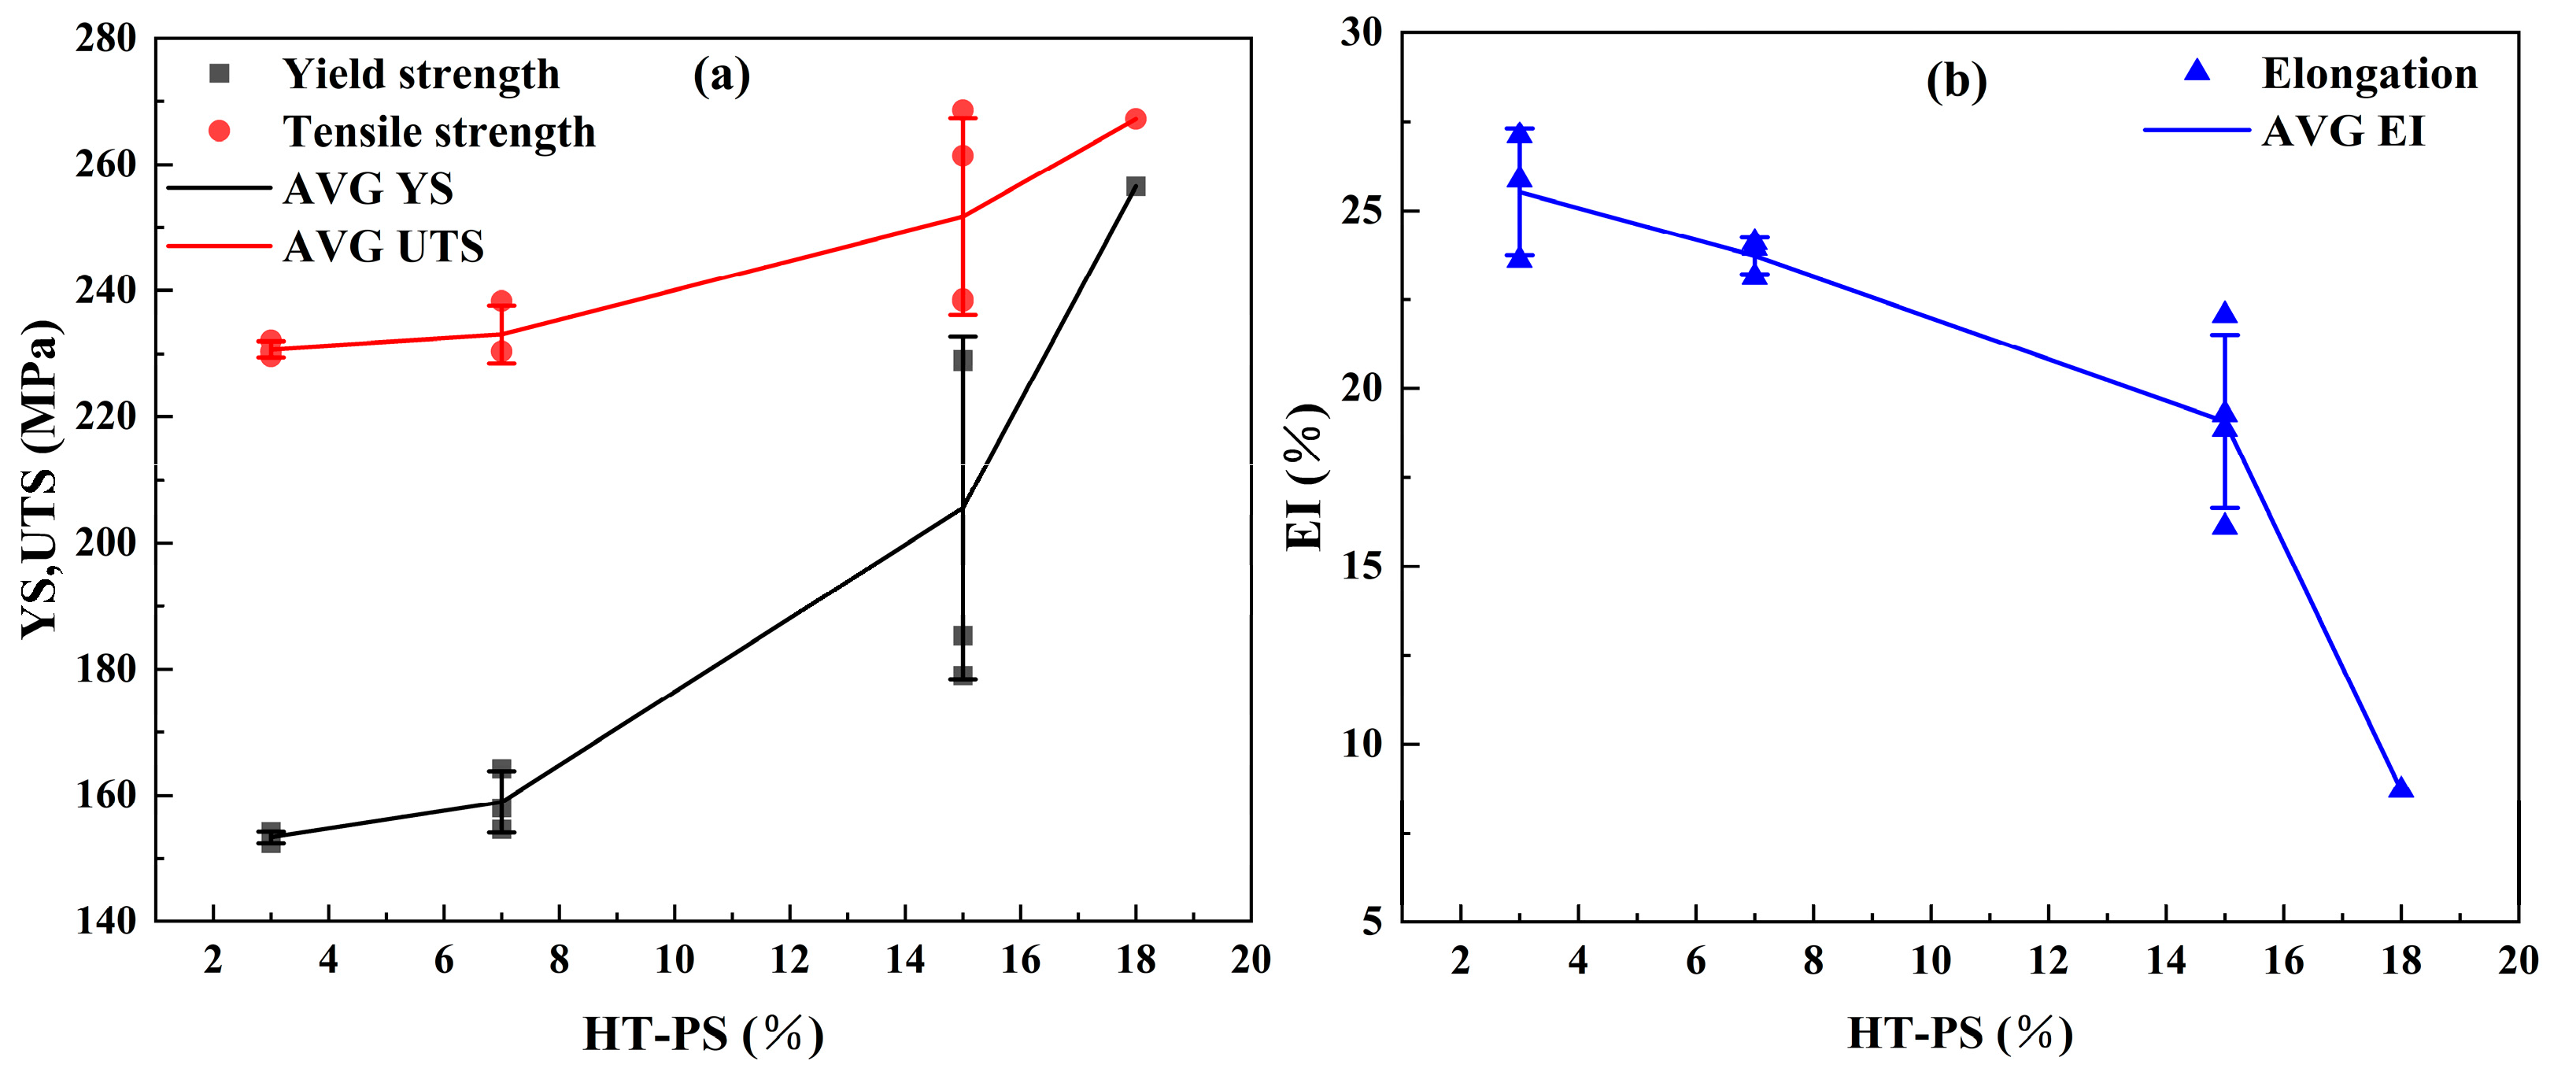
The tensile test results indicated that the heat treatment process significantly improved the strength of the AA6016 sheet under high HT-PS conditions. 
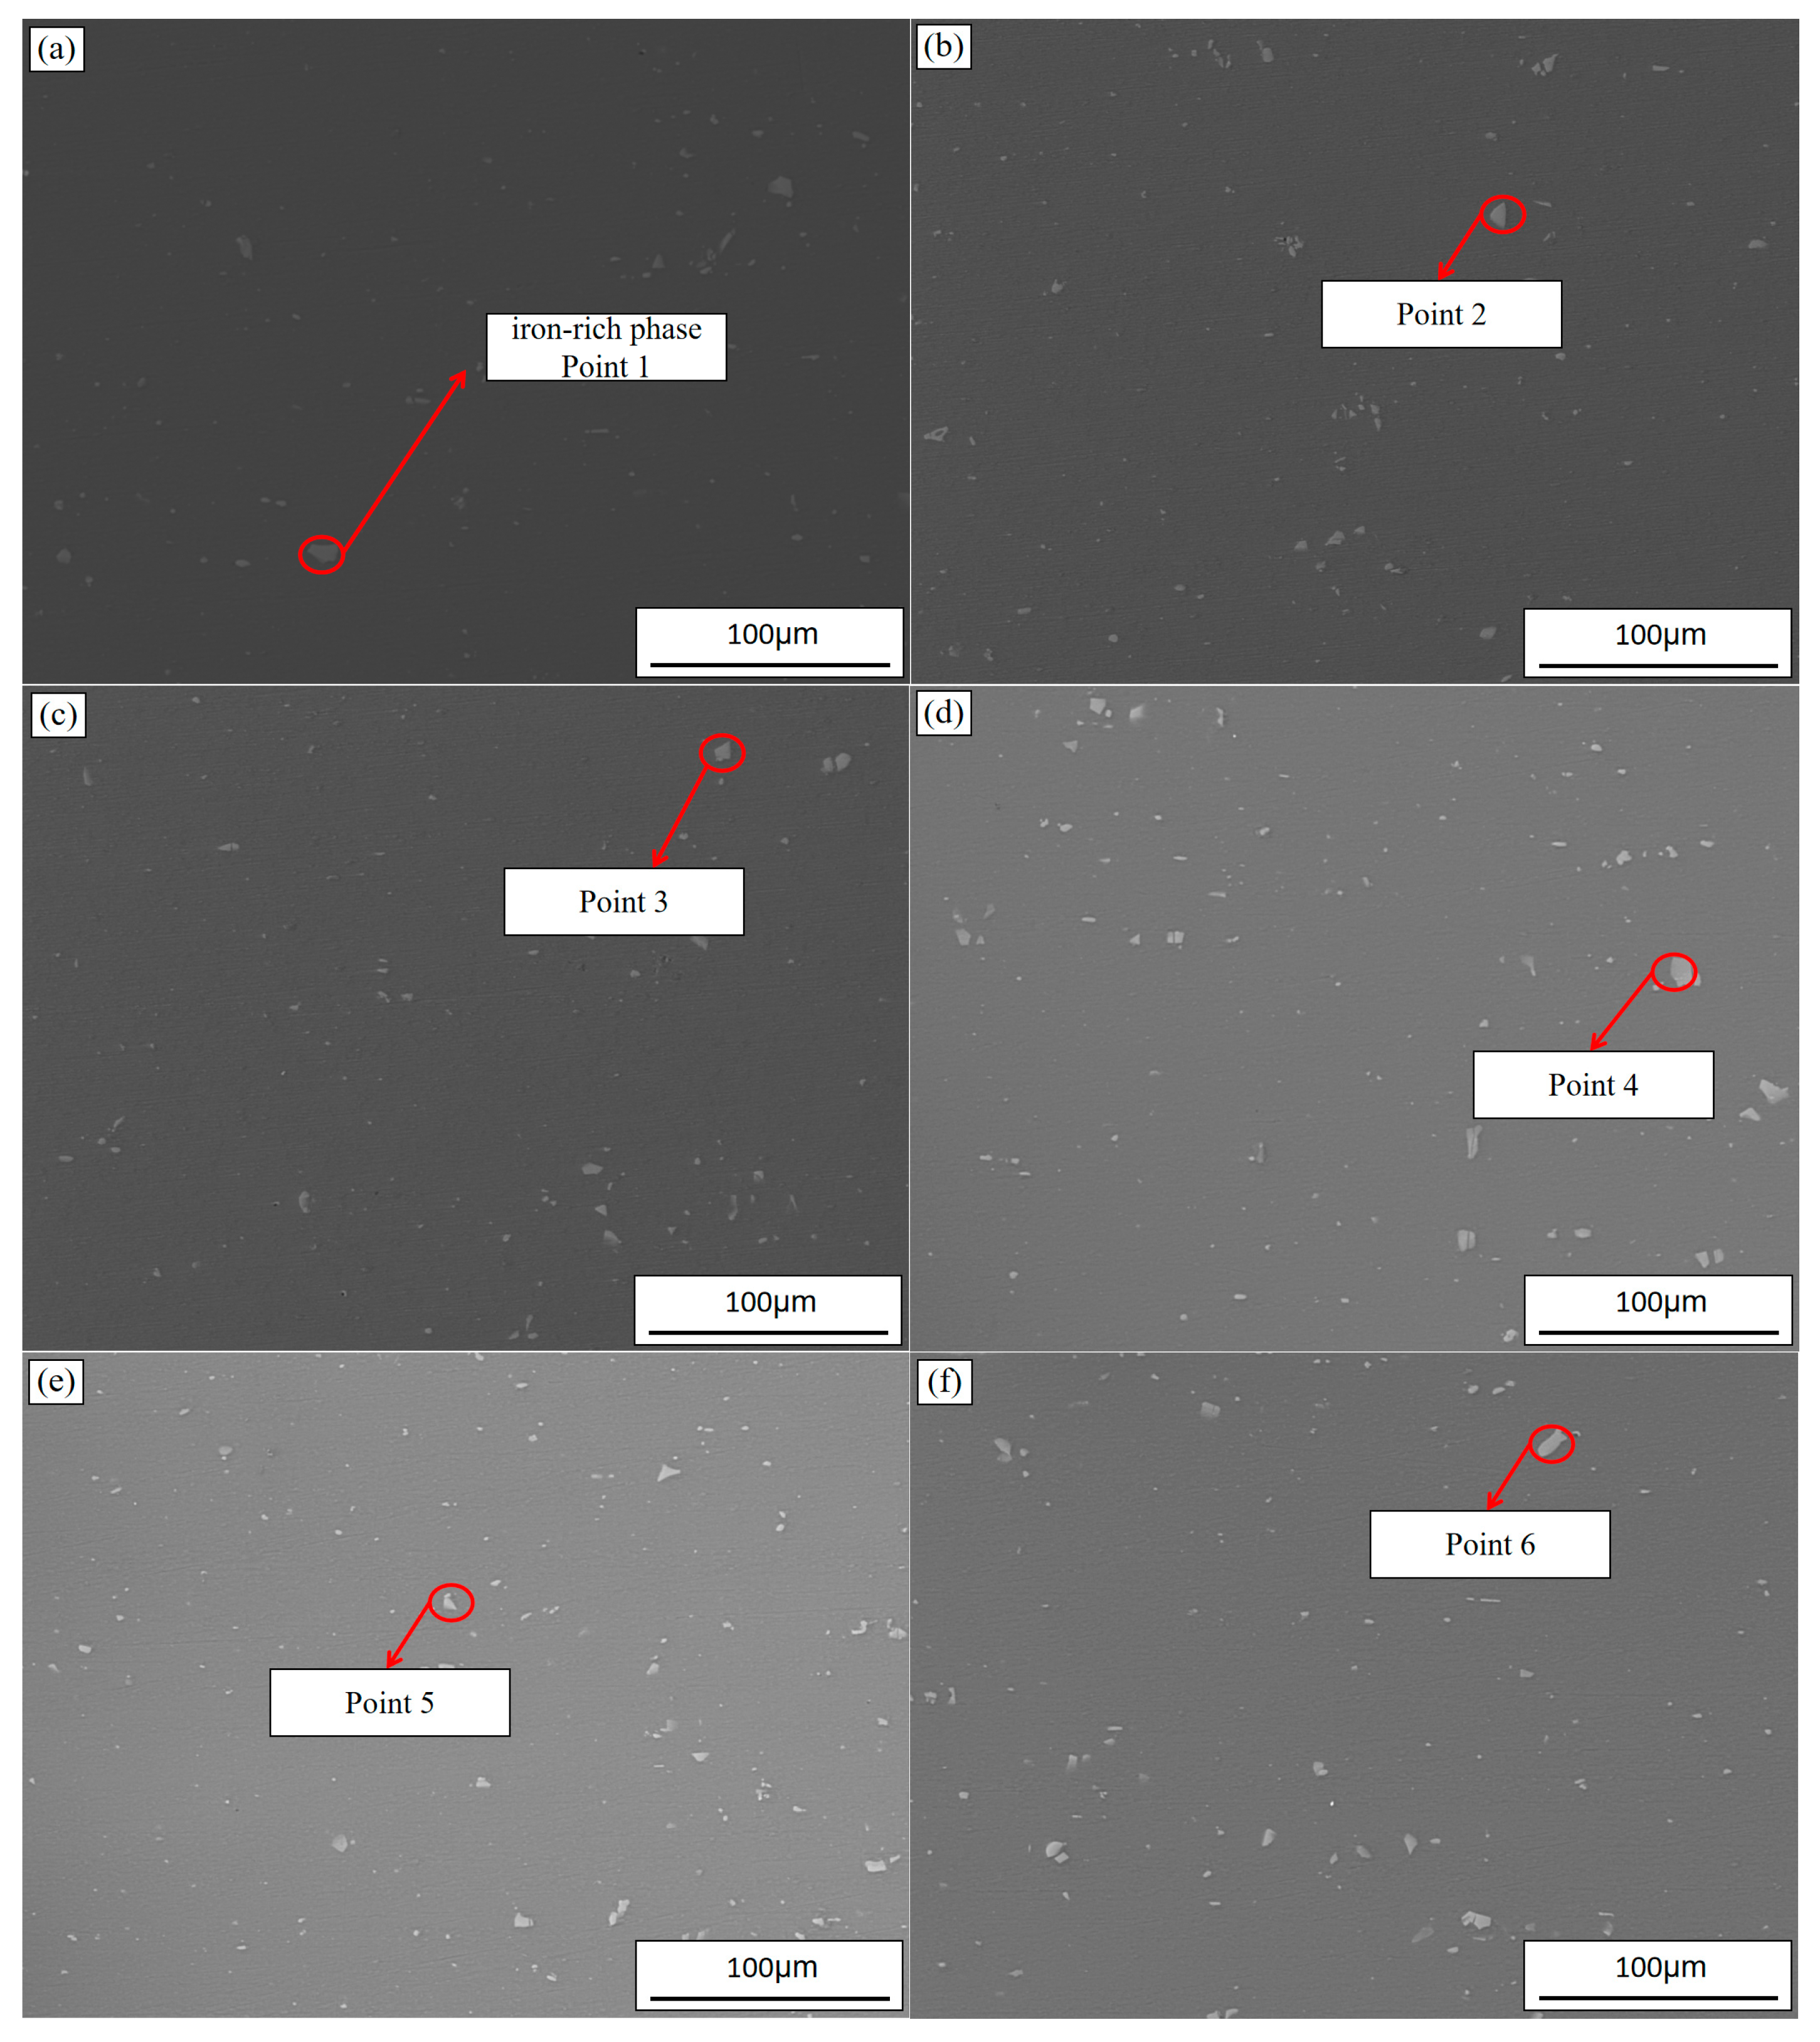
Figure 8 shows SEM-BSE images of the second phase under partial processing conditions. According to the SEM-EDX spectra, it was observed that these micron-scale second phases were iron-rich phases, with the EDX results shown in Table 5. To further analyze the size and distribution of the micron-scale second phases (iron-rich phases) in Figure 8, quantitative statistics were calculated, as presented in Table 6.
In Table 6, it was observed that the quantified statistical results on the second phase at different positions on the same specimen were very close. Additionally, there was little difference in the proportion of the second phases between process 1 (3-200-20) and process 2 (15-200-30). The number density of the second phase in process 2 was slightly higher than that in process 1, and the average size of the second phase in process 2 was also slightly higher than that in process 1. However, there was a significant difference in the mechanical properties of the materials obtained from process 1 and process 2, despite the small difference in the statistical data on the micron-scale second phases. This indicated that there was no apparent relationship between the micron-scale second phases and the mechanical properties of the material, suggesting the need for further research on nanoprecipitates.
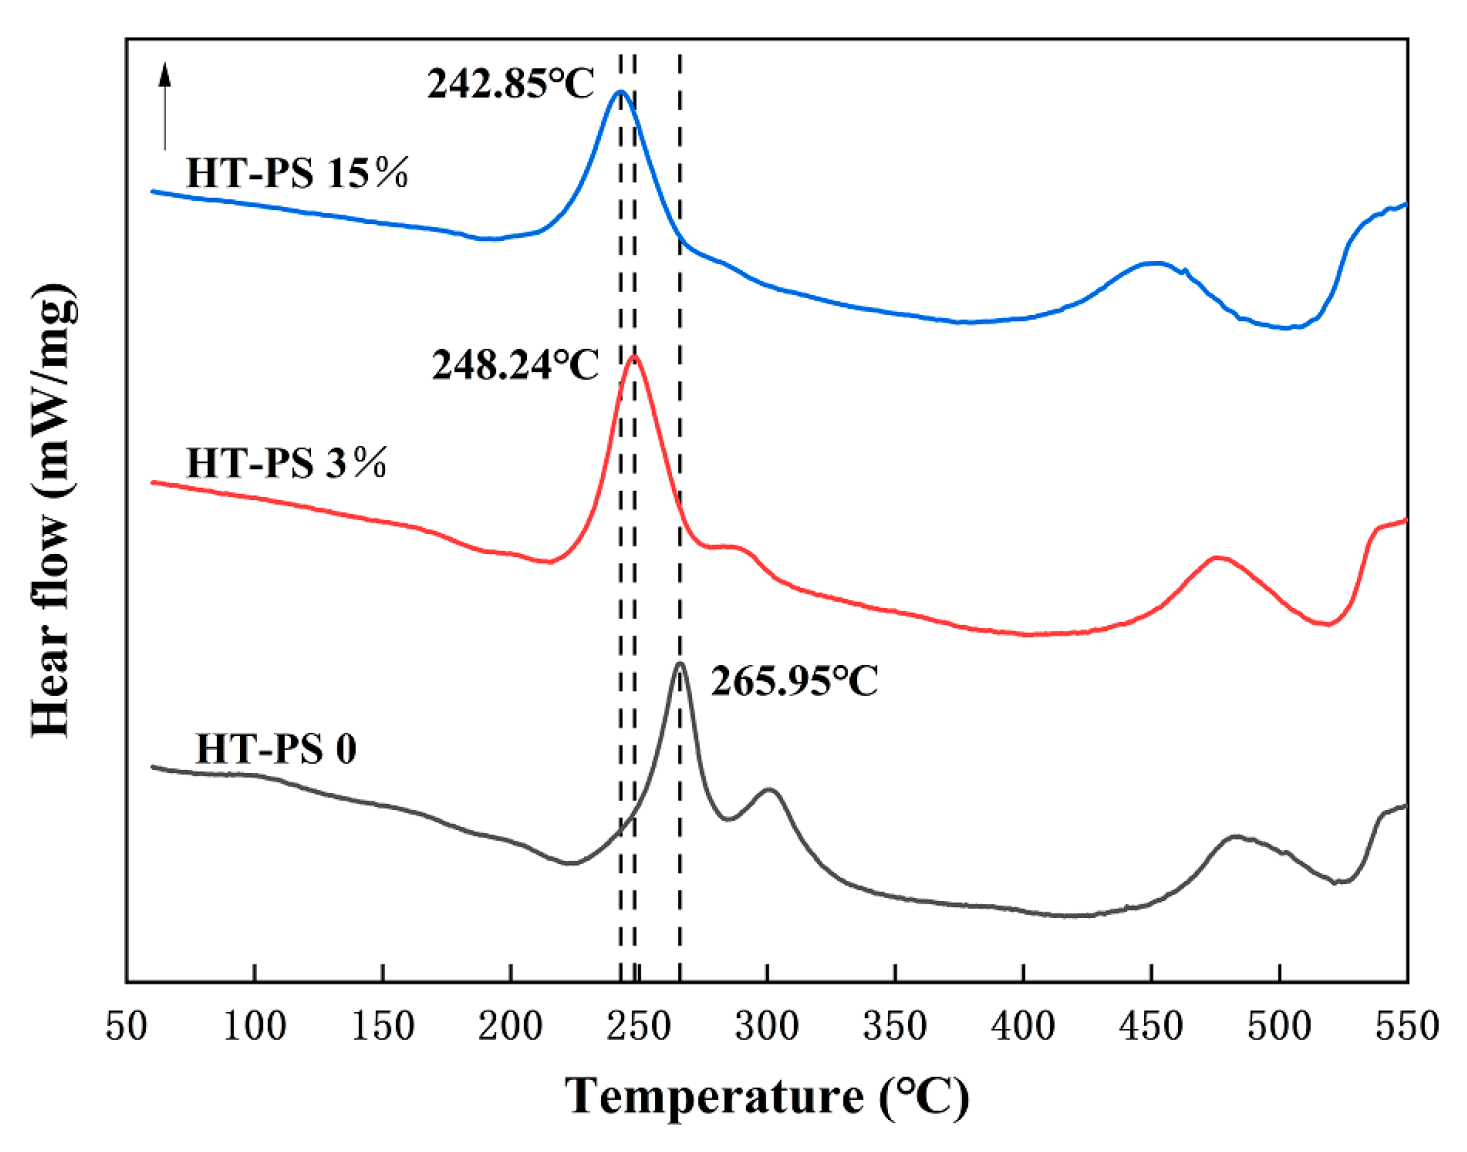
To study the effect of HT-PS on the precipitation phases in AA6016, DSC experiments were conducted, and the results are depicted in Figure 9. In the HT-PS samples, it was observed that the dissolution trough between 200 °C and 220 °C, arising from cluster reversion during natural aging, decreased or disappeared [25,26]. This indicates that HT-PS treatment effectively inhibits natural aging [27]. Moreover, as the HT-PS increased, the precipitation peak of the β phase in the samples shifted towards lower temperatures. The precipitation temperature of the β phase in the HT-PS 3% sample (248.24 °C) was higher than that in the HT-PS 15% sample (242.85 °C), suggesting that a higher degree of HT-PS promotes the precipitation of the β phase.
The precipitation modeling is based on classic theory [28], and an incoherent interface of the precipitate/matrix is assumed. The stationary nucleation rate is given by:
J s = Z β * N e x p ( G n u c l k B T )
Z is the Zeldovich factor, β * is the condensation rate of solute atoms in nuclei, N is the number of nucleation sites per unit volume, k B is the Boltzmann constant, T is temperature. G n u c l is the energy barrier for nucleation. According to the references, heterogeneous nucleation on dislocations releases the core energy of the dislocations, and hence the nucleation barrier is reduced [29,30]. By analyzing the reduction in the nucleation barrier described by Equation (6), under the premise of the same material and the same precipitated phase, where Z , β * , N , k B , and T are all constant, only the nucleation barrier G n u c l decreases. Therefore, the nucleation rate J s of the precipitated phase will increase. Consequently, with an increase in HT-PS, the dislocation density also increases, indicating an increase in the nucleation rate of the precipitate phase. This increased nucleation rate results in the precipitation of a greater amount of the β phase.
The numerical method employed to track the evolution of the precipitates, including nucleation, growth, and coarsening, is the numerical Kampmann–Wagner (KWN) model [31]. In this kinetic simulation model, a crucial parameter for calculating the nucleation rate of precipitates is the change in Gibbs free energy associated with the formation of critical nuclei. The total energy change resulting from nucleation can be expressed as follows:
G n u c l = 4 3 π r 3 G b u l k 0 + 4 π r 2 γ
r represents the radius of the precipitate phase, γ represents the interfacial energy, and G b u l k 0 represents the volume free energy. Based on the aforementioned Equation (7), under the premise of the same material and the same precipitated phase, G n u c l and γ are constants. Analyzing the reduction in nucleation potential energy indicates that the corresponding precipitate radius decreases. Therefore, with an increase in HT-PS, the reduction in the nucleation barrier leads to a decrease in the precipitation radius. This suggests that higher HT-PS can promote the formation of finer precipitates.
During the HT-PS treatment process, an increase in the dislocation density within the crystals occurred [32]. The dislocations introduced by straining acted as vacancy sinks. These vacancy sinks played a crucial role in the aggregation activity during natural aging, as the relaxation of over-saturated vacancies could significantly suppress the formation of Cluster (1) during natural aging. Serizawa et al. [33] reported two types of nanoclusters, denoted as Cluster (1) and Cluster (2), formed near room temperature and at 100 °C, respectively. The Cluster (1) structure had a wider range of Mg/Si ratios and was nearly insoluble at heat treatment temperature (180–200 °C). Cluster (2) could form above 100 °C, suppressing the formation of Cluster (1) during room temperature storage, and over-saturated vacancies inhibited natural aging, thus inhibiting the formation of Cluster (1). Cluster (2) had a Mg/Si ratio similar to the β phase, facilitating the formation of the β phase during the heat treatment process. In Al-Mg-Si alloys, the β phase was the primary strengthening phase [34,35]. During heat treatment, dislocations could provide heterogeneous nucleation sites for Cluster (2) and accelerate β phase precipitation [34]. Meanwhile, as the HT-PS increased, the dislocation density increased, and more dislocations led to a decrease in the nucleation barrier [29,30], combined with the previous Equations (8) and (9), resulting in an increase in the nucleation rate of the precipitates and a decrease in their radius with increasing HT-PS. Jia [12] studied and compared precipitates in samples with HT-PS of 7% and RT-PS of 7% (mainly the β phase), revealing that the precipitates in the high-temperature pre-strained samples had a higher volume fraction and a smaller average radius than those in the room-temperature pre-strained samples, resulting in a higher BHR. Therefore, with increasing HT-PS, the precipitates exhibited a higher volume fraction and a smaller average radius, leading to a significant increase in the mechanical properties of AA6016.
Research by Zandbergen [14] et al. indicated that increasing the heat treatment temperature and time promoted the precipitation of the β phase. Combined with the finding of the previous discussion, where the heat treatment process facilitated the formation of Cluster (2), and Cluster (2) promoted the precipitation of the β phase [34]. Due to the hindrance of dislocation motion by the β phase. Therefore, greater force was required for dislocations to bypass these β phases, resulting in an improvement in the mechanical properties. Therefore, when the percentage of precipitates was higher and their average size was smaller, it was easier to impede dislocation motion, thus also facilitating the improvement of material strength.
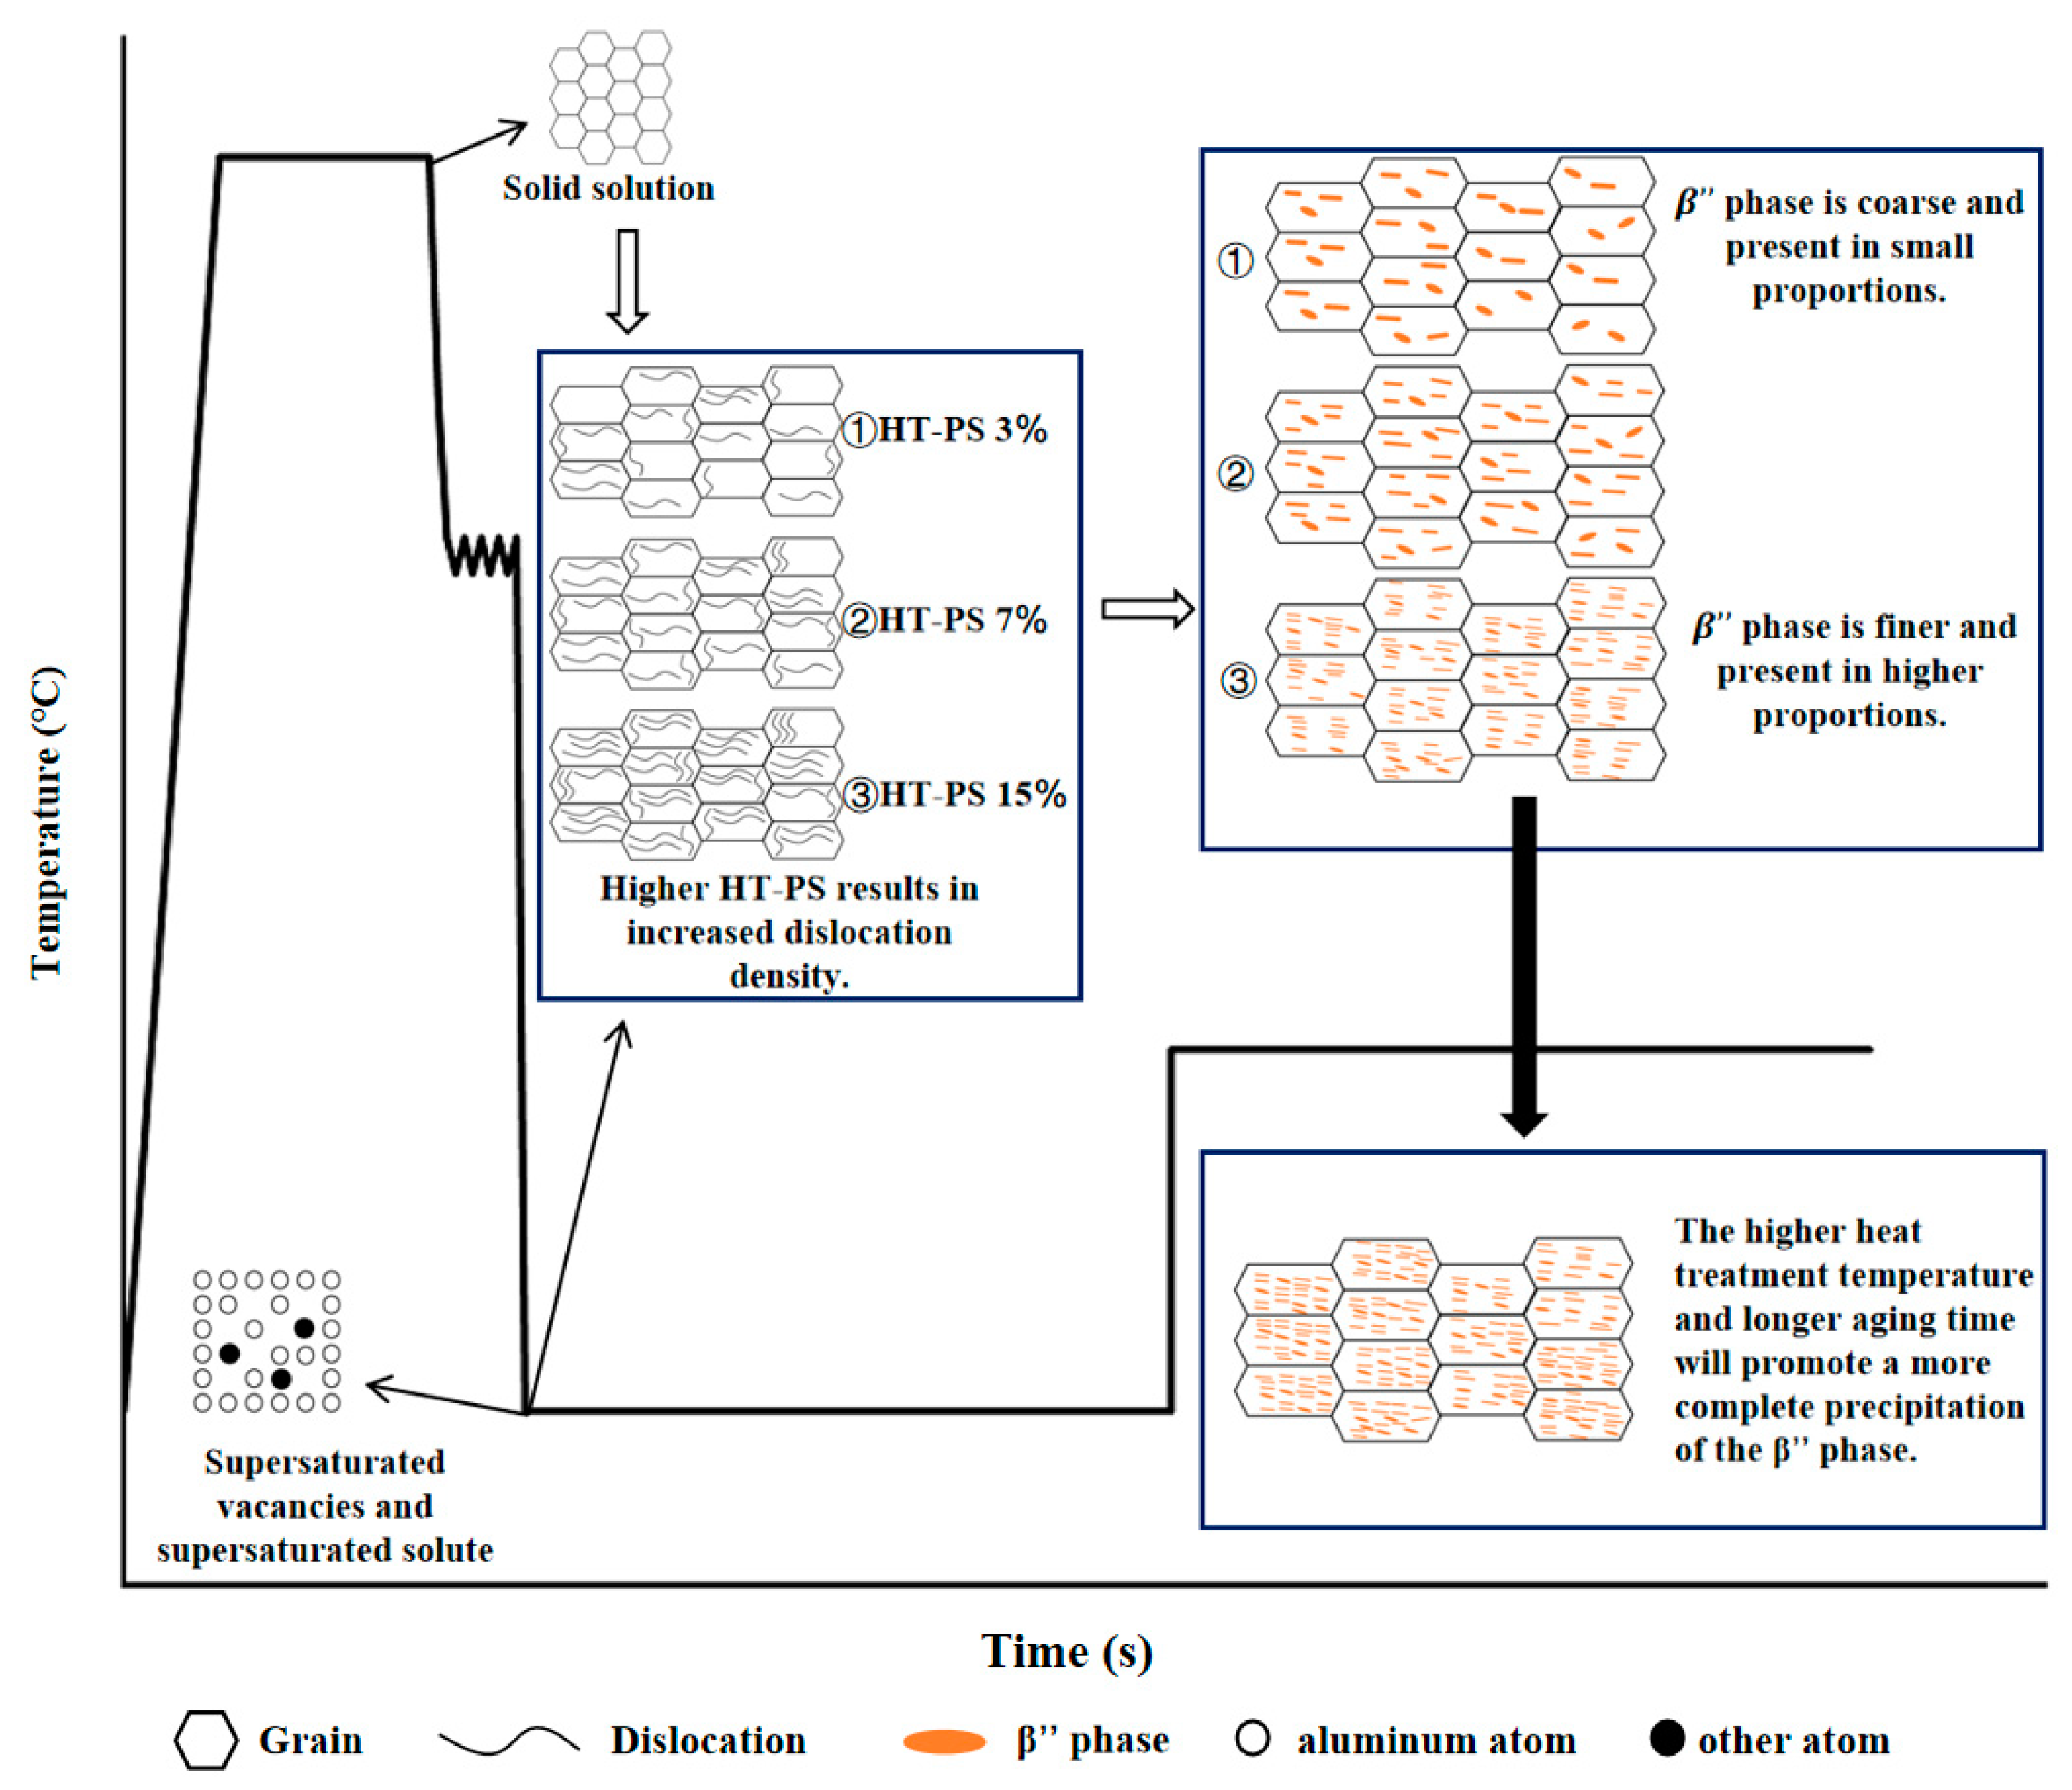
In summary, the combined effect of HT-PS treatment and the heat treatment process on the mechanical properties of AA6016 was investigated. With increasing HT-PS treatment, as well as an increasing heat treatment temperature and time, a higher volume fraction and a smaller average radius of the β phase were precipitated. The increased presence of the β phase hindered dislocations, consequently enhancing the mechanical properties of AA6016. The overall mechanism is illustrated in Figure 10.

4.3. Comparative Analysis of Neural Network Model Fitting Accuracy and Prediction Accuracy

4.3.1. Comparison of Neural Network Model Fitting Accuracy

Figure 11 depicts a comparison between the experimental and fitted stress–strain curves of AA6016. In order to objectively assess the prediction accuracy of the two models, random experimental data were selected for each model. As depicted in Figure 11, the fitting accuracy of the two models was quite similar. To further quantitatively evaluate the fitting performance, this study utilized statistical metrics such as the coefficient of determination (R2), mean absolute error (MAE), and root mean square error (RMSE). These metrics provided a comprehensive assessment of the model’s performance:
R 2 = S S R S S T = i = 1 N ( σ P i σ E ¯ ) 2 i = 1 N ( σ E i σ E ¯ ) 2
M A E = i = 1 N ( σ P i σ E i ) N
R M S E = i = 1 N ( σ P i σ E i ) 2 N
where σ E i is the experimental value; σ P i is the fitted value; σ E ¯ is is the mean of the experimental value; N is the amount of experimental data.
The fitting values of the models were comprehensively evaluated using the coefficient of determination (R2), mean absolute error (MAE), and root mean square error (RMSE). Figure 12 presents the statistical values for both models. The correlation coefficients of the GA-BP and BP models were 0.986 and 0.985, respectively, indicating that the two models had similar correlations. The GA-BP model had a slightly lower MAE of 2.147 compared to the BP model. Additionally, the RMSE of the GA-BP model was also lower than that of the BP model, indicating that the GA-BP model had an advantage in overall fitting accuracy. To further validate the accuracy of the GA-BP model in predicting the mechanical properties, yield strength, tensile strength, and elongation were used as the fitting results. Table 7 shows a comparison between the fitting results of AA6016 and the experimental data. From Table 7, it can be observed that the data fitted by the GA-BP model approximated the experimental data, significantly outperforming the BP model. The GA-BP artificial neural network model demonstrated good fitting accuracy.

4.3.2. Comparison of Model Prediction Accuracy

The trained neural network models have the capability to predict data, and in this study, two types of predictions were conducted for each model. Firstly, the models were utilized to predict the experimental data within the range of the training set (15-170-20, the data were not used as a training set to train the model). Secondly, the models were used to predict the data points outside the range of the training set (18-200-30), as illustrated in Figure 13. It was observed that the GA-BP model outperformed the BP model in terms of its prediction accuracy. To further evaluate the prediction performance of the two models, the aforementioned Equations (7)–(9) were employed to provide a comprehensive assessment of their performance, as presented in Table 8. Table 8 showcases the statistical values of the predictions generated by the two models. The GA-BP model achieved a higher correlation coefficient compared to the BP model, indicating a stronger relationship between the predicted and actual values. Additionally, the GA-BP model exhibited smaller mean absolute error (MAE) and root mean square error (RMSE) values than the BP model, suggesting the better prediction accuracy of the GA-BP model.
Figure 14 illustrates a comparison between the experimental and predicted values of the mechanical properties. In Figure 14a, data prediction is conducted for the experimental values within the training set range (15-170-20). The GA-BP model predicts a yield strength of 173.6 MPa, which is 5.4 MPa lower than the experimental value. On the other hand, the BP model predicts a yield strength that is 36.8 MPa higher than the experimental value. The GA-BP model provides predicted values of tensile strength and elongation that are closer to the experimental values compared to the BP model. Overall, both models perform reasonably well in predicting the mechanical properties within the training set range, but the GA-BP model exhibits a better prediction accuracy. In Figure 14b, data prediction is carried out for the experimental values outside the training set range (18-200-20). The results indicate that the GA-BP model offers significantly better predictions for both yield strength and tensile strength compared to the BP model. However, both models show notable deviations in predicting elongation. In summary, the GA-BP model demonstrates a better prediction accuracy for both sets of results, particularly in terms of yield strength and tensile strength.

5. Conclusions

This study investigated the mechanical properties of AA6016 sheets after undergoing the HFQ process and subsequent heat treatment. The following conclusions could be drawn:
(1)
At HT-PS of 3% and 7%, the heat treatment process has a minimal effect on the mechanical properties of the AA6016 aluminum alloy. At HT-PS of 15%, the mechanical strength of the AA6016 sheet improved with an increasing heat treatment temperature and time. A further increase in HT-PS from 15% to 18% could reduce the elongation significantly.
(2)
Micron-scale second phases (iron-rich phases) underwent quantitative analysis using SEM-BSE. The results revealed that these micron-scale second phases exhibited no significant impact on the mechanical properties of the AA6016 sheets. The DSC results indicated that as the HT-PS increased from 3% to 15%, the precipitation peak of the β phase decreased. This suggests that HT-PS can promote the precipitation of the β phase and enhance the strength of the AA6016 sheet.
(3)
Through analysis of the nucleation rate formula and the Gibbs free energy formula in the KWN model, it can be concluded that with an increase in HT-PS, the precipitated phase will obtain a higher volume fraction and a smaller mean radius, and AA6016 sheets will obtain a higher strength.
(4)
Comparing the fitting and prediction results of the BP neural network model and the GA-BP neural network model, it is evident that the GA-BP neural network model outperforms the other in terms of fitting and prediction accuracy.
A comprehensive assessment was conducted on the influence of the HFQ process and heat treatment techniques on the mechanical properties of AA6016 sheets. This provided a process design guideline for using HFQ and heat treatment processes on AA6016 in the automotive industry.

Author Contributions

Conceptualization, S.H.; methodology, B.L. and Y.Y.; software, Z.Z.; formal analysis, X.L.; investigation, B.L. and Y.Y.; resources, Q.L.; data curation, X.L.; writing—original draft preparation, J.L.; writing—review and editing, J.L. and Z.B.; visualization, Z.B.; supervision, S.H. and Z.Z.; funding acquisition, Q.L.; project administration, Q.L. All authors have read and agreed to the published version of the manuscript.

Funding

This research received no external funding. And The APC was funded by Nanjing Tech University.

Data Availability Statement

The original contributions presented in the study are included in the article, further inquiries can be directed to the corresponding authors.

Conflicts of Interest

The authors declare no conflict of interest.

References

  1. Zhang, R.; Wang, W.; Lin, J.; Dean, T.A. An indirect hot form and Quench (HFQ) for manufacturing components of aluminum alloy sheets and comparison with direct HFQ. Int. J. Mach. Tools Manuf. 2023, 192, 104073. [Google Scholar] [CrossRef]
  2. El Fakir, O.; Wang, L.; Balint, D.; Dear, J.P.; Lin, J.; Dean, T.A. Numerical study of the solution heat treatment, forming, and in-die quenching (HFQ) process on AA5754. Int. J. Mach. Tools Manuf. 2014, 87, 39–48. [Google Scholar] [CrossRef]
  3. Zheng, K.; Dong, Y.; Zheng, J.-H.; Foster, A.; Lin, J.; Dong, H.; Dean, T.A. The effect of hot form quench (HFQ®) conditions on precipitation and mechanical properties of aluminium alloys. Mater. Sci. Eng. A 2019, 761, 138017. [Google Scholar] [CrossRef]
  4. Masuda, T.; Takaki, Y.; Sakurai, T.; Hirosawa, S. Combined effect of pre-straining and pre-aging on bake-hardening behavior of an Al-0.6 mass% Mg-1.0 mass% Si alloy. Mater. Trans. 2010, 51, 325–332. [Google Scholar] [CrossRef]
  5. Li, S.-S.; Chen, J.-S.; Chen, J.; Xia, C.; Zeng, D. Influence of pre-strain on the mechanical properties of A6111-T4P sheet with bake hardening. Acta Metall. Sin. (Engl. Lett.) 2015, 28, 678–683. [Google Scholar] [CrossRef]
  6. Engler, O.; Schäfer, C.; Myhr, O.R. Effect of natural ageing and pre-straining on strength and anisotropy in aluminium alloy AA 6016. Mater. Sci. Eng. A 2015, 639, 65–74. [Google Scholar] [CrossRef]
  7. Serizawa, A.; Sato, T.; Miller, M. Effect of cold rolling on the formation and distribution of nanoclusters during pre-aging in an Al–Mg–Si alloy. Mater. Sci. Eng. A 2013, 561, 492–497. [Google Scholar] [CrossRef]
  8. Birol, Y.; Karlik, M. The interaction of natural ageing with straining in a twin-roll cast AlMgSi automotive sheet. Scr. Mater. 2006, 55, 625–628. [Google Scholar] [CrossRef]
  9. Kolar, M.; Pedersen, K.O.; Gulbrandsen-Dahl, S.; Marthinsen, K. Combined effect of deformation and artificial aging on mechanical properties of Al–Mg–Si Alloy. Trans. Nonferrous Met. Soc. China 2012, 22, 1824–1830. [Google Scholar] [CrossRef]
  10. Gupta, A.; Lloyd, D.; Court, S. Precipitation hardening in Al–Mg–Si alloys with and without excess Si. Mater. Sci. Eng. A 2001, 316, 11–17. [Google Scholar] [CrossRef]
  11. Pogatscher, S.; Antrekowitsch, H.; Leitner, H.; Ebner, T.; Uggowitzer, P.J. Mechanisms controlling the artificial aging of Al–Mg–Si Alloys. Acta Mater. 2011, 59, 3352–3363. [Google Scholar] [CrossRef]
  12. Jia, Z.-h.; Ding, L.-p.; Weng, Y.-y.; Zhang, W.; Qing, L. Effects of high temperature pre-straining on natural aging and bake hardening response of Al–Mg–Si alloys. Trans. Nonferrous Met. Soc. China 2016, 26, 924–929. [Google Scholar] [CrossRef]
  13. Falahati, A.; Jun, W.; Peter, L.; Ahmadi, M.R.; Povoden-Karadeniz, E.; Kozeschnik, E. Assessment of parameters for precipitation simulation of heat treatable aluminum alloys using differential scanning calorimetry. Trans. Nonferrous Met. Soc. China 2014, 24, 2157–2167. [Google Scholar] [CrossRef]
  14. Zandbergen, M.; Xu, Q.; Cerezo, A.; Smith, G. Study of precipitation in Al–Mg–Si alloys by Atom Probe Tomography I. Microstructural changes as a function of ageing temperature. Acta Mater. 2015, 101, 136–148. [Google Scholar] [CrossRef]
  15. Wang, G.; Zhang, J.; Yan, W.; Xu, H. Constitutive modelling of plastic deformation behaviour for AA7075-H18 alloy based on hot forming and in-die quenching (HFQ®) process. Int. J. Mater. Form. 2022, 15, 62. [Google Scholar] [CrossRef]
  16. Tan, J.Q.; Zhan, M.; Liu, S.; Huang, T.; Guo, J.; Yang, H. A modified Johnson–Cook model for tensile flow behaviors of 7050-T7451 aluminum alloy at high strain rates. Mater. Sci. Eng. A 2015, 631, 214–219. [Google Scholar] [CrossRef]
  17. Vural, M.; Caro, J. Experimental analysis and constitutive modeling for the newly developed 2139-T8 alloy. Mater. Sci. Eng. A 2009, 520, 56–65. [Google Scholar] [CrossRef]
  18. Yang, X.-w.; Zhu, J.-c.; Nong, Z.-s.; Dong, H.; Lai, Z.-h.; Ying, L.; Liu, F.-w. Prediction of mechanical properties of A357 alloy using artificial neural network. Trans. Nonferrous Met. Soc. China 2013, 23, 788–795. [Google Scholar] [CrossRef]
  19. Li, B.; Du, Y.; Zheng, Z.; Ye, X.; Fang, D.; Si, X.; Wang, Y. Manipulation of mechanical properties of 7xxx aluminum alloy via a hybrid approach of machine learning and key experiments. J. Mater. Res. Technol. 2022, 19, 2483–2496. [Google Scholar] [CrossRef]
  20. Rumelhart, D.E.; Hinton, G.E.; Williams, R.J. Learning representations by back-propagating errors. Nature 1986, 323, 533–536. [Google Scholar] [CrossRef]
  21. Kannaiyan, M.; Raghuvaran, J.G.T. Prediction of specific wear rate for LM25/ZrO2 composites using Levenberg–Marquardt backpropagation algorithm. J. Mater. Res. Technol. 2020, 9, 530–538. [Google Scholar] [CrossRef]
  22. Mohanty, I.; Bhattacharjee, D.; Datta, S. Designing cold rolled IF steel sheets with optimized tensile properties using ANN and GA. Comput. Mater. Sci. 2011, 50, 2331–2337. [Google Scholar] [CrossRef]
  23. Dewan, M.W.; Huggett, D.J.; Liao, T.W.; Wahab, M.A.; Okeil, A.M. Prediction of tensile strength of friction stir weld joints with adaptive neuro-fuzzy inference system (ANFIS) and neural network. Mater. Des. 2016, 92, 288–299. [Google Scholar] [CrossRef]
  24. Nwobi-Okoye, C.C.; Ochieze, B.Q. Age hardening process modeling and optimization of aluminum alloy A356/Cow horn particulate composite for brake drum application using RSM, ANN and simulated annealing. Def. Technol. 2018, 14, 336–345. [Google Scholar] [CrossRef]
  25. De Geuser, F.; Lefebvre, W.; Blavette, D. 3D atom probe study of solute atoms clustering during natural ageing and pre-ageing of an Al-Mg-Si alloy. Philos. Mag. Lett. 2006, 86, 227–234. [Google Scholar] [CrossRef]
  26. Birol, Y. Restoration of the bake hardening response in a naturally aged twin-roll cast AlMgSi automotive sheet. Scr. Mater. 2006, 54, 2003–2008. [Google Scholar] [CrossRef]
  27. Birol, Y. Pre-straining to improve the bake hardening response of a twin-roll cast Al–Mg–Si alloy. Scr. Mater. 2005, 52, 169–173. [Google Scholar] [CrossRef]
  28. Russell, K.C. Nucleation in solids: The induction and steady state effects. Adv. Colloid Interface Sci. 1980, 13, 205–318. [Google Scholar] [CrossRef]
  29. Gomez-Ramirez, R.; Pound, G. Nucleation of a second solid phase along dislocations. Metall. Trans. 1973, 4, 1563–1570. [Google Scholar] [CrossRef]
  30. Dutta, B.; Valdes, E.; Sellars, C. Mechanism and kinetics of strain induced precipitation of Nb (C, N) in austenite. Acta Metall. Et Mater. 1992, 40, 653–662. [Google Scholar] [CrossRef]
  31. Myhr, O.; Grong, Ø.; Andersen, S. Modelling of the age hardening behaviour of Al–Mg–Si alloys. Acta Mater. 2001, 49, 65–75. [Google Scholar] [CrossRef]
  32. Cui, L.; Guo, M.; Peng, X.; Zhang, Y.; Zhang, J.; Zhuang, L. Inffuence of pre-deformation on the precipitation behaviors of Al-Mg-Si-Cu alloy for automotive application. Acta Metall. Sin 2015, 51, 289–297. [Google Scholar] [CrossRef]
  33. Serizawa, A.; Hirosawa, S.; Sato, T. Three-dimensional atom probe characterization of nanoclusters responsible for multistep aging behavior of an Al-Mg-Si alloy. Metall. Mater. Transactions. A 2008, 39, 243–251. [Google Scholar] [CrossRef]
  34. Andersen, S.; Zandbergen, H.; Jansen, J.; TrÆholt, C.; Tundal, U.; Reiso, O. The crystal structure of the β phase in Al–Mg–Si alloys. Acta Mater. 1998, 46, 3283–3298. [Google Scholar] [CrossRef]
  35. Marioara, C.; Andersen, S.; Jansen, J.; Zandbergen, H. Atomic model for GP-zones in a 6082 Al–Mg–Si system. Acta Mater. 2001, 49, 321–328. [Google Scholar] [CrossRef]
Figure 1. Hot tensile specimen geometry (mm).
Metals 14 00599 g001
Figure 2. Schematic representation of heat treatment procedures for AA6016 alloy.
Metals 14 00599 g002
Figure 3. Structure of a BP neural network.
Metals 14 00599 g003
Figure 4. Structure of GA-BP neural network.
Metals 14 00599 g004
Figure 5. Stress–strain curve with (a) HT-PS 3%, (b) HT-PS 7%, (c) HT-PS 15% and 18%.
Metals 14 00599 g005
Figure 6. The relationship graph under different HT-PS conditions: (a) YS and UTS; (b) EI.
Metals 14 00599 g006
Figure 7. Ductile fractures under different variables: (a) 3-170-10, (b) 3-200-20, (c) 15-170-20, (d) 15-200-30.
Metals 14 00599 g007
Figure 8. SEM-BDS images under different conditions for the second phase: (a) original sheet (no HT-PS and no heat treatment), (b) 3-170-10, (c) 3-200-20, (d) 15-170-20, (e) 15-170-30, (f) 15-200-30.
Metals 14 00599 g008
Figure 9. DSC curves of samples under different pre-straining conditions.
Metals 14 00599 g009
Figure 10. Flowchart illustrating the influence of manufacturing processes on material microstructure.
Metals 14 00599 g010
Figure 11. BP neural network and GA-BP neural network fitting results: (a) 3-170-10, (b) 3-185-20, (c) 3-200-20, (d) 7-170-20, (e) 7-185-30, (f) 7-200-20, (g) 15-170-30, (h) 15-185-30, (i) 15-200-30.
Metals 14 00599 g011
Figure 12. Statistical values for both models (BP and GA-BP models).
Metals 14 00599 g012
Figure 13. BP model and GA-BP model prediction results: (a) 15-170-20, (b) 18-200-30.
Metals 14 00599 g013
Figure 14. Mechanical predictions of BP and GA-BP models: (a) 15-170-20, (b) 18-200-20.
Metals 14 00599 g014
Table 1. AA6016 chemical composition (wt.%).
SiFeCuMnMgCrZnTiVAl
0.5–1.50.350.250.200.25–0.80.150.10.10.1Balance
Table 2. HT-PS and heat treatment process.
ExperimentHT-PS (%)Heat Treatment Temperature (°C)Holding Time (Min)
1317010
2318520
3320020
4717020
5718530
6720020
71517020
81517030
91518530
101520030
111820030
Table 3. Mechanical properties under different experimental conditions.
ConditionElastic Modulus (GPa)YS (MPa)UST (MPa)EI (%)
3-170-1062 ± 1154 ± 1230 ± 224 ± 1
3-185-2063 ± 2153 ± 1232 ± 123 ± 1
3-200-2064 ± 2149 ± 2226 ± 126 ± 1
7-170-2067 ± 1155 ± 1230 ± 124 ± 1
7-185-3069 ± 2164 ± 5238 ± 824 ± 1
7-200-2067 ± 1158 ± 3230 ± 123 ± 1
15-170-2070 ± 2179 ± 2238 ± 322 ± 1
15-170-3061 ± 1185 ± 1239 ± 119 ± 1
15-185-3066 ± 2229 ± 1261 ± 216 ± 1
15-200-3056 ± 1229 ± 2269 ± 219 ± 1
18-200-3058 ± 1257 ± 1269 ± 39 ± 1
Table 4. Effect of heat treatment process on HT-PS3% and HT-PS15%.
VariantYS (MPa)YS-Heat Treatment Effects (MPa)UTS (MPa)UTS-Heat Treatment Effects (MPa)EI (%)Heat Treatment Effects (%)
3, without heat treatment144 ± 1/209 ± 1/23 ± 1/
3-170-10154 ± 110 ± 1230 ± 221 ± 324 ± 11 ± 2
3-185-20153 ± 19 ± 2232 ± 123 ± 223 ± 10 ± 2
3-200-20149 ± 25 ± 3226 ± 117 ± 226 ± 13 ± 2
15, without heat treatment175 ± 1/206 ± 2/16 ± 2/
15-170-20179 ± 24 ± 3238 ± 332 ± 522 ± 16 ± 3
15-170-30185 ± 110 ± 2239 ± 133 ± 319 ± 13 ± 3
15-185-30229 ± 154 ± 2261 ± 255 ± 416 ± 10 ± 3
15-200-30229 ± 254 ± 3269 ± 263 ± 419 ± 13 ± 3
Table 5. SEM-EDX analysis results.
ElementAtomic Percentage (%)
Point 1Point 2Point 3Point 4Point 5Point 6
Al90.093.487.990.090.692.0
Si4.62.85.24.74.13.8
Cu0.20.20.10.20.10.1
Mg0.50.70.40.50.60.5
Mn0.90.51.00.70.80.6
Fe3.82.45.43.93.83.0
Table 6. Effect of heat treatment process on the second phase of HT-PS 3% and HT-PS 15%.
VariantSecond Phase Ratio in Central Region (%)Number Density of the Second Phase in Central RegionAverage Area of Second Phase in Central Region (um2)Second Phase Ratio on Both Sides (%)Number Density of the Second Phase on Both SidesAverage Area of Second Phase on Both Sides (um2)
3-200-200.7 ± 0.111.5 ± 0.26.7 ± 0.20.7 ± 0.311.5 ± 0.16.5 ± 0.2
15-200-300.7 ± 0.113.8 ± 0.36.7 ± 0.10.7 ± 0.413.5 ± 0.26.7 ± 0.1
Table 7. Fitted values for both models (BP and GA-BP models).
ConditionYS (MPa)UST (MPa)EI (%)
EXGA-BPBPEXGA-BPBPEXGA-BPBP
3-170-10154.2154.8163.1230.4231.8233.025.8725.8626.70
3-185-20153.3148.3154.0232.1229.6231.223.6025.5123.68
3-200-20152.4153.7151.4229.6230.1229.127.1025.5625.22
7-170-20154.6155.4170.5230.4231.1237.123.9422.6823.58
7-185-30164.2166.1170.8238.3235.5239.624.1023.3924.30
7-200-20158155.8180.8230.4231.6239.823.1324.8921.57
15-170-30185.3184.3197.0238.6239.2248.519.2719.6421.51
15-185-30228.8225.0245.1261.4260.3267.316.1116.8617.60
15-200-30229.1234.0236.0268.6265.5264.118.8616.2919.40
Table 8. Predictive statistics for both models (BP and GA-BP models).
R2MAERMSE
15-170-20GA-BP0.9487.0278.762
BP0.9227.10110.962
18-200-20GA-BP0.9397.0849.019
BP0.9279.35115.021
Disclaimer/Publisher’s Note: The statements, opinions and data contained in all publications are solely those of the individual author(s) and contributor(s) and not of MDPI and/or the editor(s). MDPI and/or the editor(s) disclaim responsibility for any injury to people or property resulting from any ideas, methods, instructions or products referred to in the content.

