Article

Experimental Investigation of Phase Equilibria in the Ti-Cr-V System at 1000–1200 °C

1
Materials Genome Institute, Shanghai University, Shanghai 200444, China
2
Ansteel Beijing Research Institute Co., Ltd., Beijing 102209, China
3
State Key Laboratory of Advanced Special Steels, School of Materials Science and Engineering, Shanghai University, Shanghai 200444, China
*
Author to whom correspondence should be addressed.
Metals 2024, 14(5), 498; https://doi.org/10.3390/met14050498
Submission received: 13 March 2024 / Revised: 21 April 2024 / Accepted: 22 April 2024 / Published: 25 April 2024
(This article belongs to the Special Issue Thermodynamic Assessment of Alloy Systems)

Abstract

:
Ti-Cr-V-based alloys have been utilized across various domains, including aerospace structural and functional materials and hydrogen storage materials. Investigating the phase relations in the Ti-Cr-V system is significant in supporting the material design for these applications. In the present work, the isothermal sections at 1000, 1100, and 1200 °C for the Ti-Cr-V system were precisely determined through a systematic investigation using scanning electron microscopy (SEM), energy-dispersive X-ray spectroscopy (EDS), and X-ray diffraction (XRD). The phase region of Cr2Ti was entirely elucidated for the first time. As the temperature decreased from 1200 to 1000 °C, the V solubility range of Cr2Ti increased from 5.3 wt.% to 10.0 wt.%, while the Ti solubility range essentially remained constant at approximately 31.0–33.9 wt.%. In addition, it was suggested that the stable structure of Cr2Ti was C36 at 1200 °C and C15 at 1000 and 1100 °C. The present work will support thermodynamic re-assessment research.

1. Introduction

Ti-Cr-V alloys have been investigated for a variety of applications, including aerospace structural and functional materials, hydrogen storage materials, fusion reactor construction materials, and high-temperature alloys. The recently promising high-entropy alloys (HEAs) and refractory high-entropy alloys (RHEAs) also include Ti-Cr-V-based alloys [1,2,3,4,5,6].
These alloys are designed and investigated to prevent titanium fires in present-day developing aero-engines because they are burn-resistant and have superior performance under strict pressure, temperature, and air flow conditions [7,8,9,10]. They are also attractive for hydrogen storage [11,12,13] because both Ti-V and Ti-V-Cr alloys exhibit notable hydrogen capabilities [11]. Ti-Cr-V-based HEA also has excellent hydrogen capacity [1,2,3,4]. As for nuclear energy applications, V-(3-9)Cr-(3-10)Ti alloys are the leading candidate materials for the first-wall and blanket structures of fusion reactors [14]. These alloys display promising safety and environmental characteristics, as well as good fabricability and high temperature and heat load capacity. V-4Cr-4Ti appears to have a near-optimum composition [14] and has attracted the interest of many researchers [15,16,17]. RHEAs have been created to replace conventional Ni-based alloys in high-temperature applications [18]. For instance, Ti-V-Cr-based RHEAs preserve excellent yield strength from room temperature to high temperatures [5].
In these alloys, the bcc and Laves phases are prevalent. Researching these phases is important in improving the material properties. For instance, Liu et al. [6] suggested that introducing the Laves phases can increase the irradiation resistance of Ti-Cr-V-based alloys, as precipitates are essential for nuclear energy structural materials [19], which serve as efficient sinks for radiation flaws, reduce radiation-induced swelling, preserve grain boundaries, and improve creep strength [20]. Currently, ambiguities related to phase equilibria involving the bcc and Laves phases in the Ti-Cr-V system have not been solved, especially at high temperatures. The composition ranges of bcc and the stable structure type of the Laves phase vary widely in the literature.
In the present work, we experimentally investigated phase equilibria in the Ti-Cr-V and Ti-Cr systems. We accurately constructed the isothermal sections at 1000, 1100, and 1200 °C; eliminated the ambiguous phase regions; and identified the stability of the important Laves phases. The present work will support thermodynamic re-assessment studies, improve the material design, and contribute to a better understanding of the phase relationships.

2. Literature Review

Thermodynamic assessments of the Ti-Cr-V system have been reported in the literature [21,22,23]. The crystal structures of the phases in the ternary systems are listed in Table 1. In 1992, Enomoto [21] compiled almost all the experimental data for the ternary system. The ternary phase diagrams were experimentally investigated by Samsonova and Budberg [24,25,26] and Farrar and Margolin [27], using metallography, X-ray diffraction (XRD), and thermal analysis.
Samsonova and Budberg [24] reported two isothermal sections at 1200 and 900 °C. Homogenization annealing was performed at 1200 °C for 100 h. The chromium-rich and vanadium-rich alloys underwent an extra annealing procedure at 1400 °C for 350 h before homogenization at 1200 °C. The annealing durations were 10 h at 1200 °C and 350 h at 900 °C, respectively. The pure metals used were 99.99 wt.% Cr, 99.74 wt.% V, and Ti sponge (TG-118).
Farrar and Margolin [27] constructed the isothermal sections at 1200, 1000, 700, 650, and 500 °C. All the specimens were hot-rolled at 850 °C at first. Then, a homogenization heat treatment of 24 h at 1000 °C was employed before the specimens were heat-treated at lower temperatures. At 1200 and 1000 °C, the isothermal annealing durations were 36 and 48 h, respectively. The pure metals used had a purity of 99.99 wt.% for iodide titanium and 99.7 wt.% for V. The purities of Cr were 99.9 wt.%, 99.4 wt.%, and 99.995 wt.%.
The results of the phase diagram obtained from the literature contained certain inconsistencies. The Laves phases C15 and C36 were both observed by Farrar and Margolin [27] at 1200 °C. However, only C15 was detected at this particular temperature, according to the findings of Samsonova and Budberg [24]. Enomoto [21] contested the isothermal section determined by Farrar and Margolin [27] at this temperature with the questionable two- and three-phase fields containing the Laves phases. And he supposed the isothermal section at 1200 °C might be similar to the one at 1000 °C. In addition, the phase boundary of bcc + Cr2Ti/bcc in the isothermal section at 1200 °C in [27] was significantly closer to the vanadium corner than that reported in [24]. The isothermal section at 900 °C determined in [24] and the TiCr2-V vertical section presented in [25] suggested that a similar discrepancy in the phase region boundary also arose at 1000 °C.
Between 1000 and 1200 °C, the Ti-V and Cr-V binary boundaries of the Ti-Cr-V isothermal sections solely consist of the bcc phase. The Ti-Cr binary boundary is slightly complex, including the bcc and Laves phases. The Ti-Cr system was assessed extensively [23,28,29,30,31]. The invariant temperatures of C14 → bcc + C36 and C14 + bcc → C36 are similar (1269 and 1271 °C [30]). However, the invariant temperatures of C36 → bcc + C15 and C36 + bcc → C15 differ greatly (803 and 1220 °C [30]). The C36–C15 transformation temperature increases dramatically with the Ti content in C36 rising from 31.6 to 34.0 wt.%. Ranging from 1000 to 1200 °C, there is a large discrepancy (about 15 wt.%) in the composition range of bcc experimentally obtained in the literature [32,33,34,35,36,37,38]. The experimental information for the Laves phase regions is limited and was mainly detected by Chen [39].
In 1996, Chen [39] investigated the Laves phases in both the Ti-Cr binary system and the Ti-Cr-V ternary system. The study provided new information on the Laves phase regions using XRD and electron probe microanalysis (EPMA) techniques. Homogenization heat treatments at 1380 and 1395 °C were performed to obtain a single-phase alloy of bcc. At 1200 and 1000 °C, the annealing durations for the Ti-Cr specimens were 6 and 48 h, respectively, and the durations for the Ti-Cr-V specimens were 45 and 48 h, respectively. The pure metals employed were high-purity titanium (EL60) and electrochemically reduced chromium. The use of pure vanadium and the precise purities of all three metals were not explicitly addressed.
The Laves phase in the Ti-Cr specimens was detected as C36 at 1200 °C and C15/C36 at 1000 °C. After performing a prolonged annealing treatment of 500 h at 1000 °C, C36 changed to C15 in some specimens. Therefore, C36 → C15 was regarded as a sluggish phase transformation by Chen [39]. Additionally, the stable phase C15 obtained at 1000 °C reverted back to C36 after a second heat treatment at 1200 °C. This finding provided compelling evidence that C36 was stable at 1200 °C. The XRD results of the ternary Laves phase were questionable. For instance, the phase in alloy 32Ti-7V-61Cr was detected as C15 at 1300 °C and C15 + bcc at 1000 °C, but as C15/C36 + bcc at 1200 °C. The introduction of C36 was considered not explainable by the researcher [39].
In 2020, Xu et al. [40] investigated Ti-Cr equilibria using a diffusion multiple sample annealed at 1000 °C for 1356 h using SEM and EPMA. The results agreed with the previous research.

3. Materials and Methods
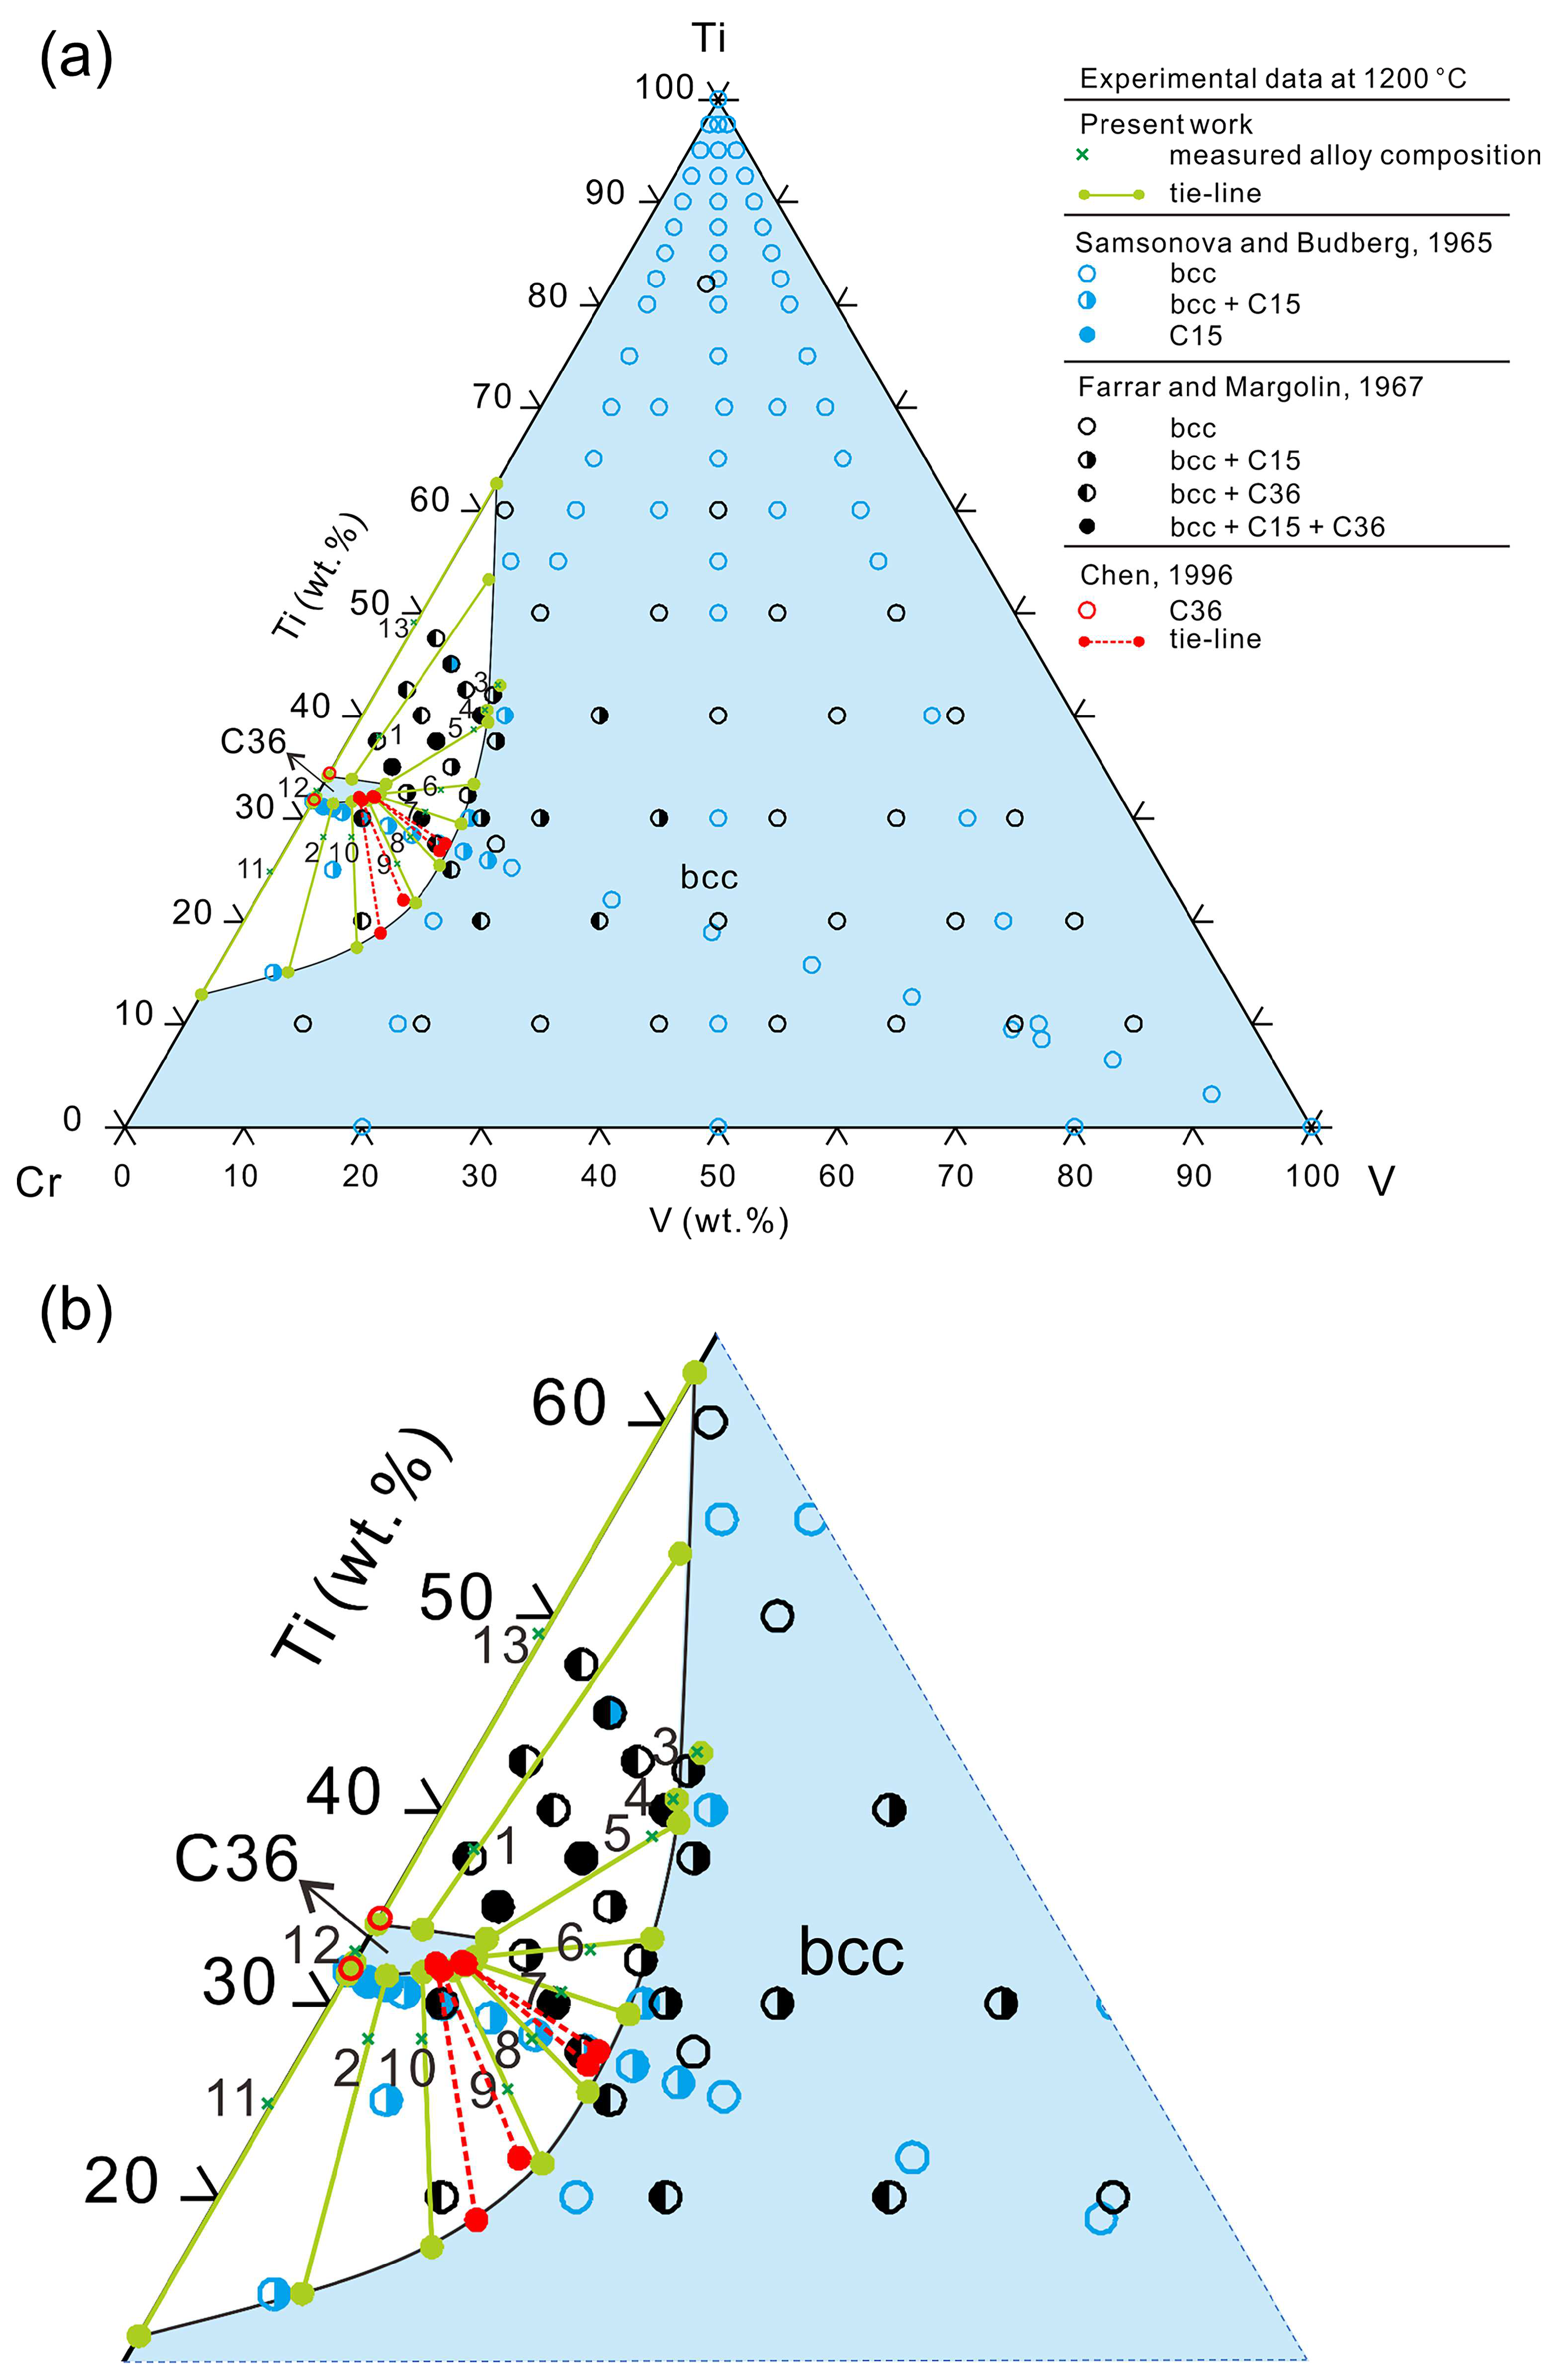
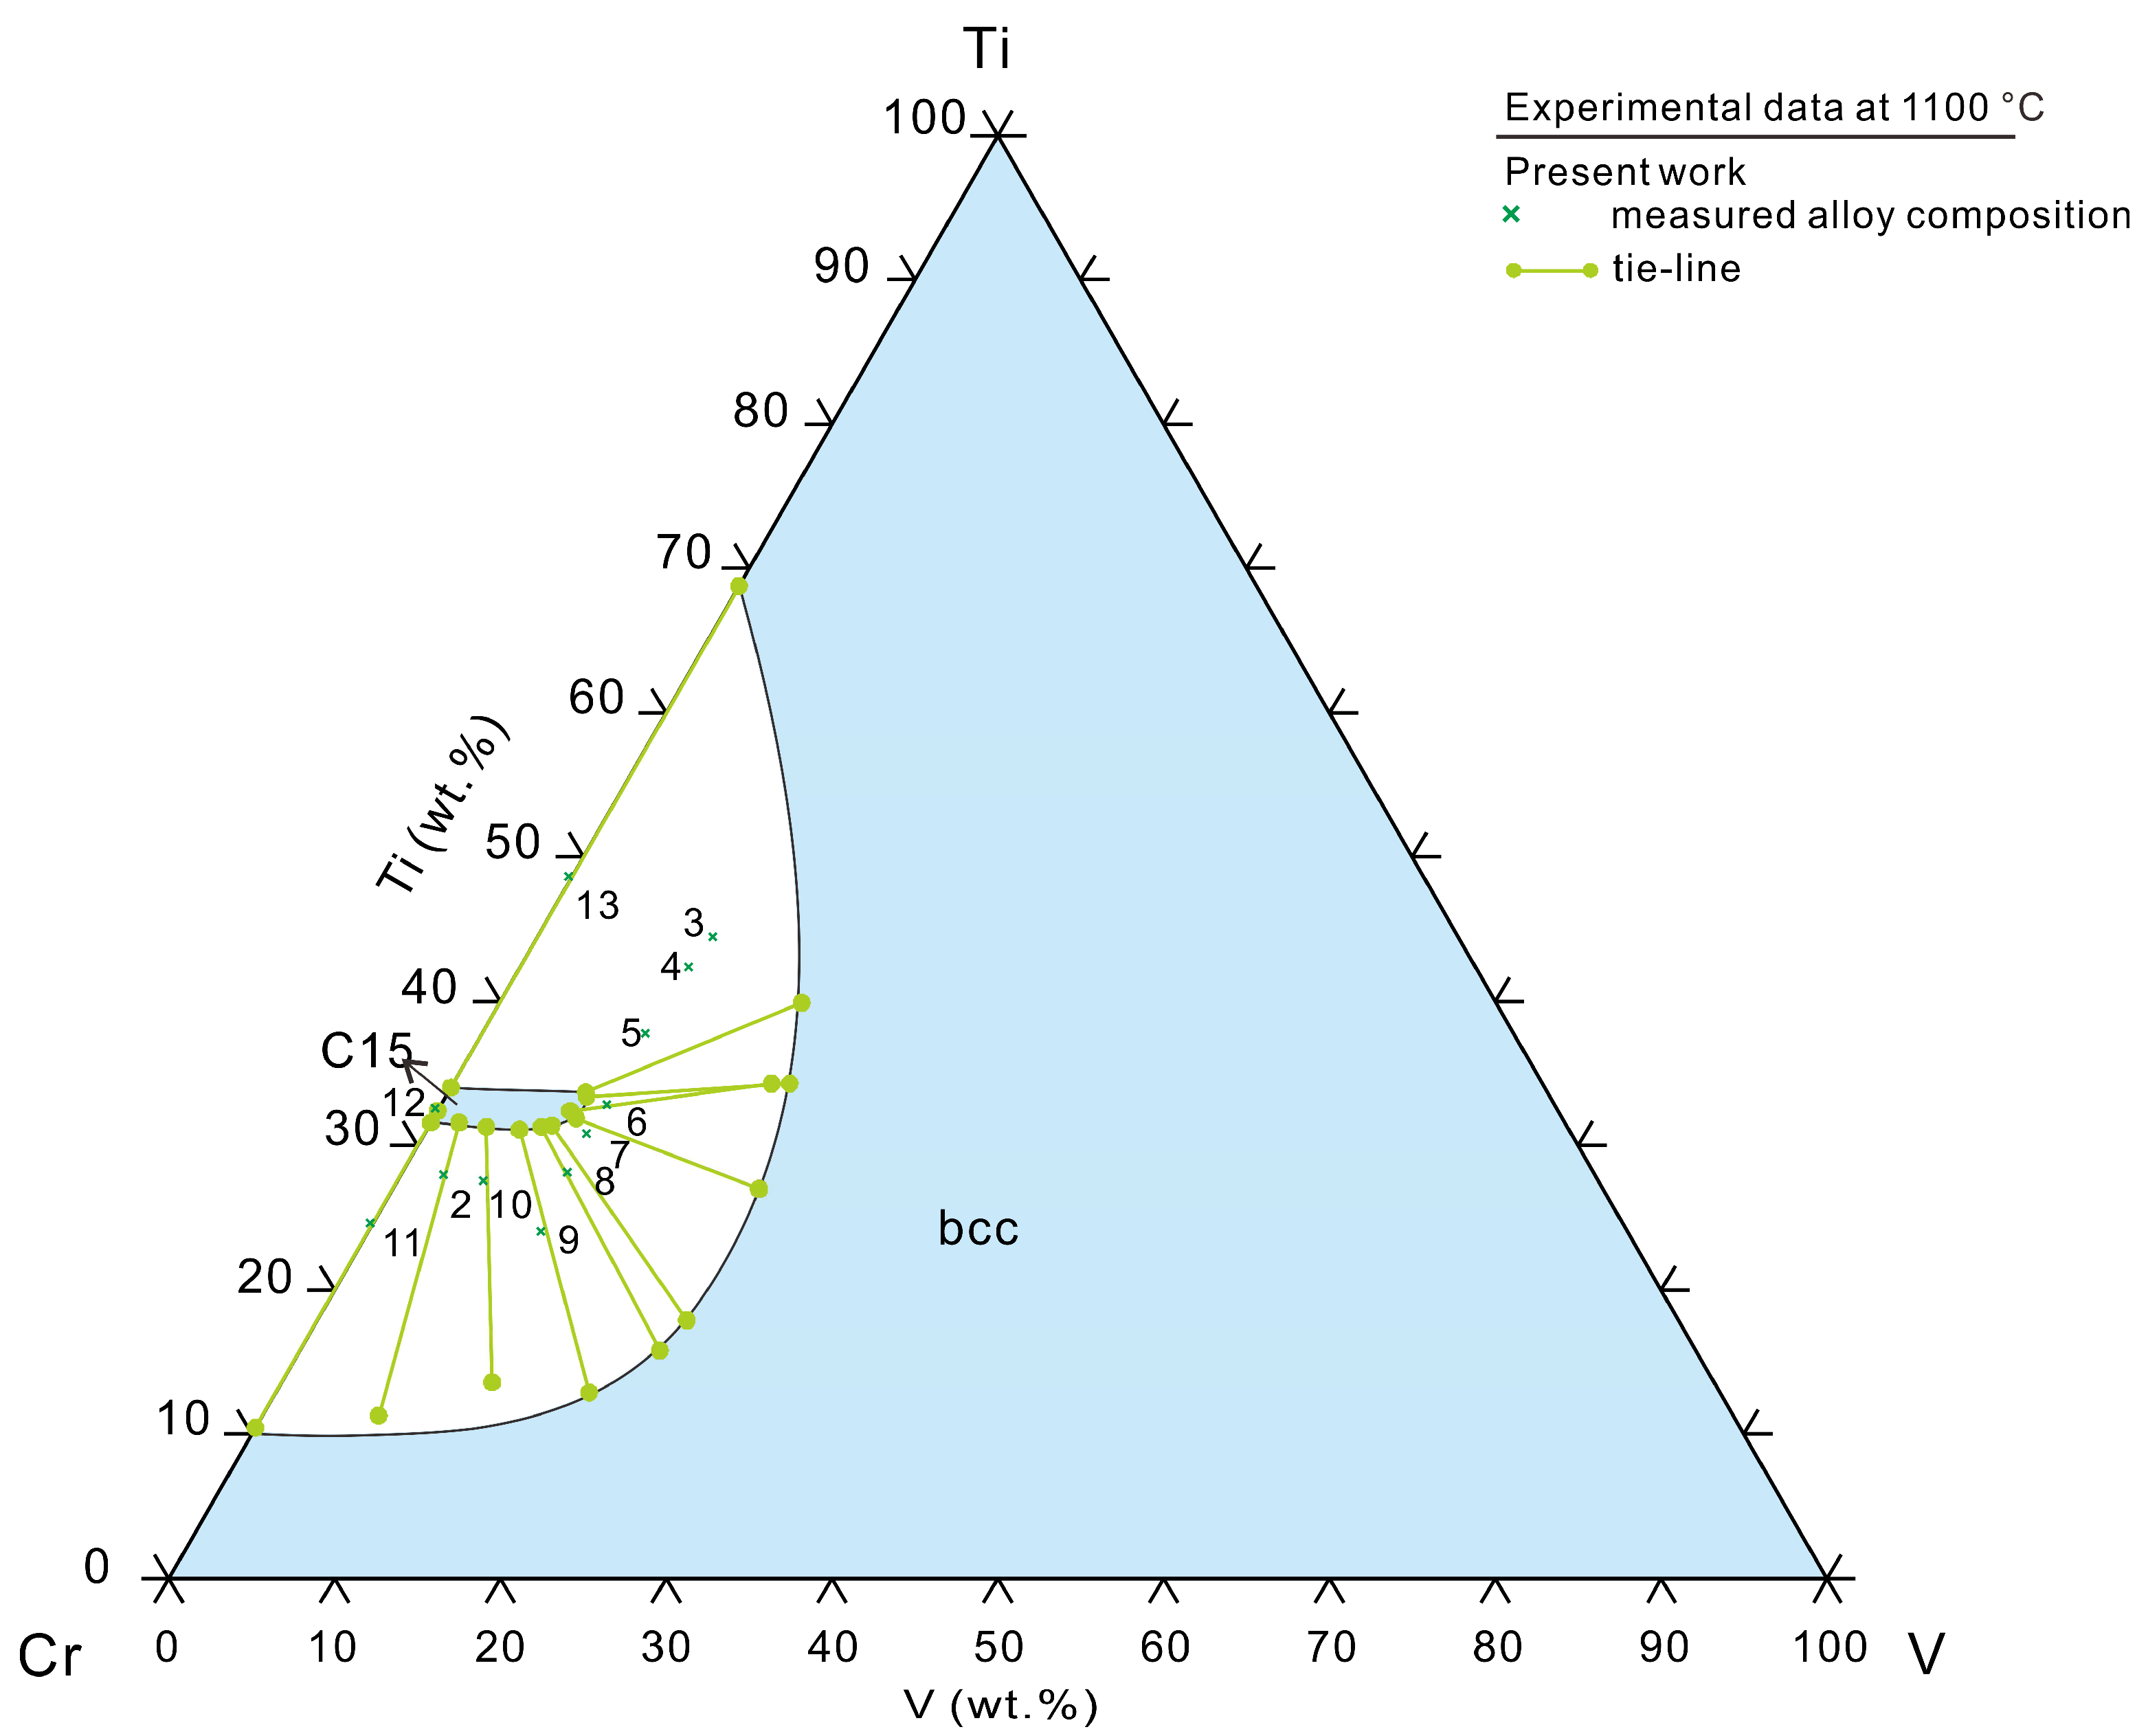
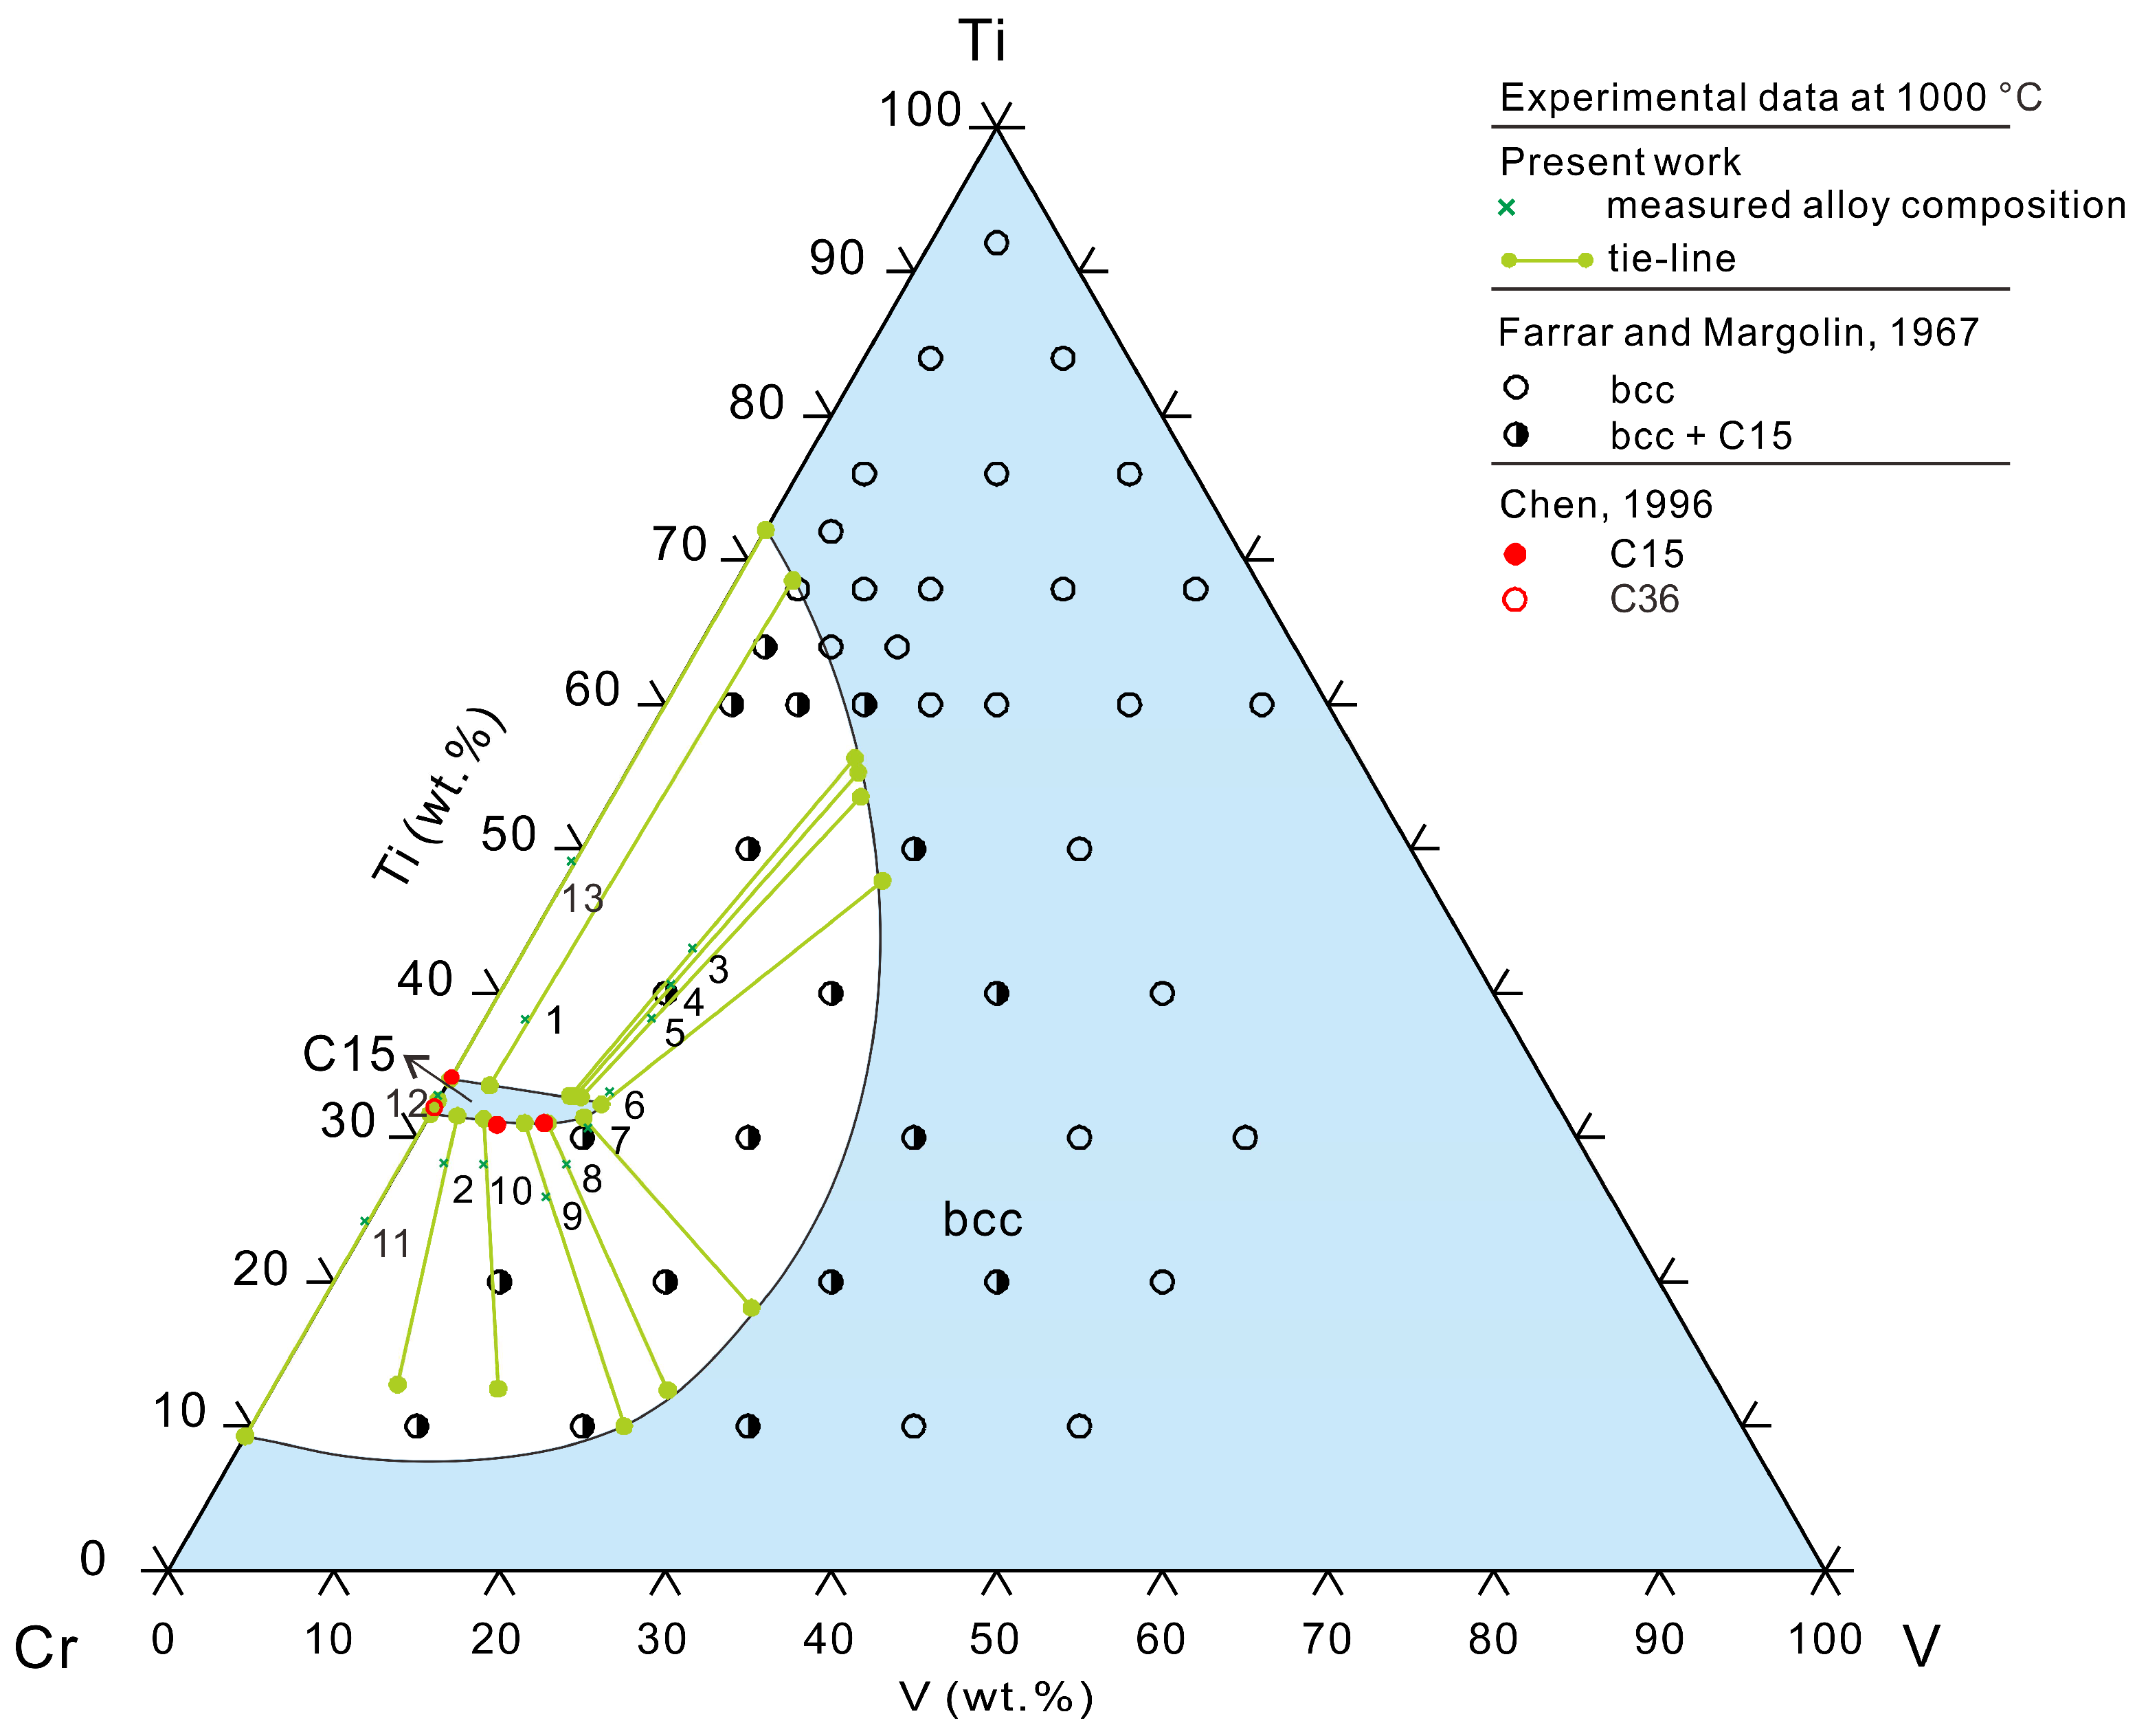
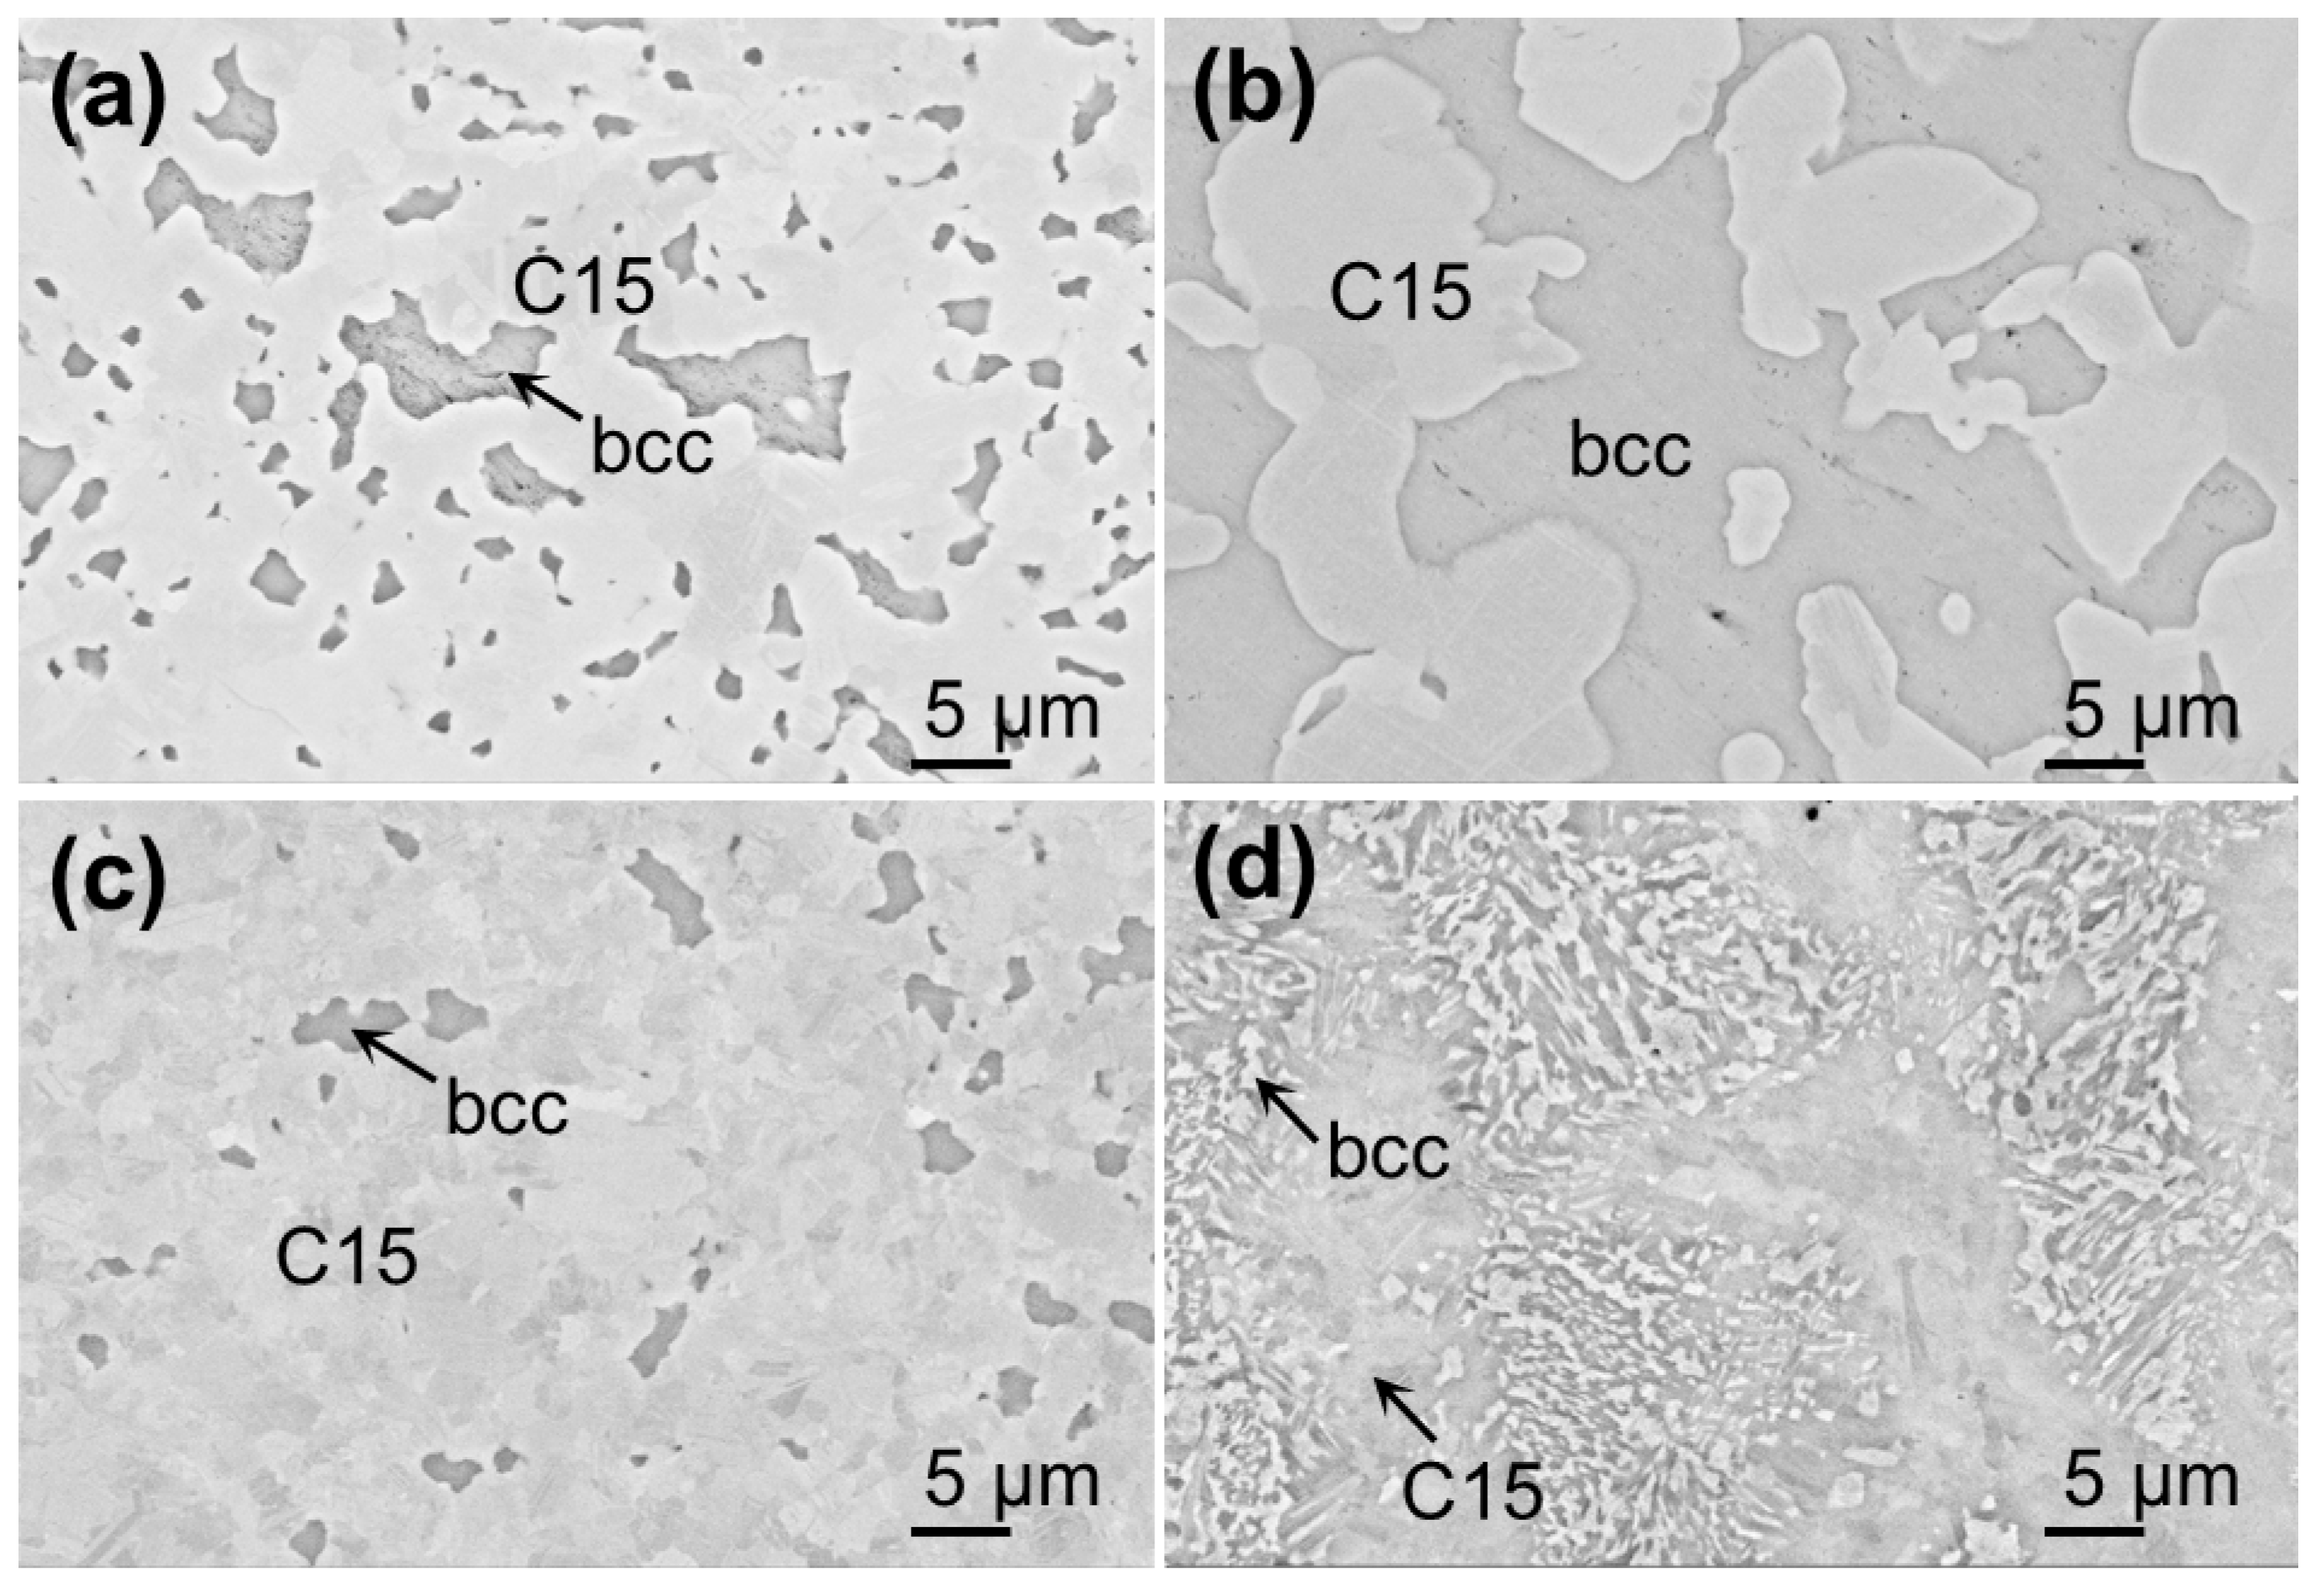
Ten ternary and three binary alloy compositions (as listed in Table 2) were designed to clarify the phase boundaries based on the previous research [24,27,39]. The alloys were synthesized by arc melting in a high-purity argon-backfilled atmosphere (99.999%, N2 ≤ 5 ppm, Shanghai Chunyu Specialty Gases Co., Ltd., Shanghai, China). Pure metals with high levels of purity were used, including 99.99 wt.% for chromium, 99.995 wt.% for titanium, and 99.9 wt.% for vanadium (Suzhou Dry Gold Electronic Material Co., Ltd., Suzhou, China). An ingot of pure titanium was melted before the initial melting for further deoxidation. Each alloy ingot was flipped and re-melted five times. The ingots of ternary and binary alloys were around 15 and 25 g in weight, respectively. The weight loss during the melting process was less than 0.5 wt.%. Subsequently, the ingots were cut into pieces and encapsulated in quartz tubes. The tubes were evacuated and backfilled with high-purity argon. Ternary alloys were annealed at 1200, 1100, and 1000 °C for 120, 240, and 360 h in muffle furnaces, respectively. Binary alloys were annealed at 1200, 1100, and 1000 °C for 360, 480, and 720 h, respectively. The binary specimens were designed based on the ternary results, with prolonged annealing times for confirming the phase boundaries and the Laves phase structures. All the annealed specimens were quenched in ice water. In addition, for further investigation of the stable structure of the Laves phase at 1200 °C, specimen A6 was re-annealed for an additional 720 h and detected using XRD.
The annealed alloys were examined using scanning electron microscopy (SEM), energy-dispersive X-ray spectroscopy (EDS), and X-ray diffraction (XRD). The specimens for SEM analysis were prepared by hot mounting, wet grinding, polishing, and no etching. SEM was conducted using a ZEISS Sigma 500 VP microscope (Carl Zeiss AG, Oberkochen, Germany). An X-MaxN 80T detector (Oxford Instruments PLC, Abingdon, UK) was used to conduct EDS with an acceleration voltage of 20 kV. The chemical composition of each phase was determined by averaging the EDS point-scan results obtained from at least six points in different areas. The centers of large grains were selected for point scanning to minimize adjacent phases’ influence. The alloy composition of each specimen was measured using the EDS point-scan technique in count acquisition mode, with a maximum of  3.0 × 10 6  counts. The scanning region encompassed the whole image of the alloy at a low magnification of 100×. XRD was carried out by a Rigaku SmartLab 9 kW X-ray diffractometer (Rigaku Corporation, Tokyo, Japan). The XRD measurements were conducted using CuKα-filtered radiation, employing a scan speed of 5°/min and an increment of 0.02°. The fine powder samples were prepared through the process of grinding using an agate mortar.

4. Results

The binary and ternary equilibria in the Ti-Cr-V system were investigated at 1000, 1100, and 1200 °C. The compositions of all annealed specimens and the equilibrium phases measured using EDS, as well as the phases identified by XRD, are listed in Table 3. The specimen numbering consists of two parts: the number indicates alloys 1–13 listed in Table 2; A, B, and C indicate specimens annealed at 1200, 1100, and 1000 °C, respectively. There were no additional ternary phases identified in this system. The isothermal sections were precisely constructed, as illustrated in Figure 1, Figure 2 and Figure 3. Additionally, the binary boundaries of Ti-Cr were ascertained. Figure 4 displays the microstructures of the Ti-Cr specimens. Figure 5 and Figure 6 show the microstructures of the Ti-Cr-V ternary specimens. Figure 7, Figure 8 and Figure 9 present the powder XRD results of the representative specimens.
As shown in Figure 1, the isothermal section at 1200 °C is characterized by a tiny C36 single-phase region, a fan-shaped bcc + C36 two-phase region, and a wide bcc single-phase region. The C36 phase can dissolve up to ~5.3 wt.% of V (in specimens A5–A7) and 31.5–33.9 wt.% of Ti. The two-phase region bcc + C36 extends towards the V corner until the V content reaches 13.8 wt.% (specimen A8). The C15 phase was not detected using XRD in either the ternary or binary specimens. Specimens A3 and A4 were identified as bcc single-phase alloys by the utilization of SEM and XRD. The other specimens all consisted of bcc and C36. Notably, C36 represented a distinctive needle-like morphology in specimen A5 (Figure 5c) in addition to the common granular morphology (like in specimen A7, Figure 5d). In the literature [24], a similar microstructure was observed in the alloy Ti-50Cr-5V after annealing at 1200 °C. However, the researchers did not give a reason for the needle-like Laves phase’s formation. According to the determined isothermal sections in the present work, this morphology may result from the minor phase fraction of C36. But in the alloy Ti-48Cr-12.5V in ref. [24], with the phase fraction of C36 decreasing further, the morphology turned to a fine granular shape.
The isothermal sections at 1100 and 1000 °C are similar, as depicted in Figure 2 and Figure 3. Each contains a tiny and narrow C15 single-phase region, a wide fan-shaped bcc + C15 two-phase region, and a wide bcc single-phase region. The C15 phase can dissolve up to ~8.6 wt.% of V, 31.1–33.7 wt.% of Ti at 1100 °C, and ~10.0 wt.% of V, 31.0–33.6 wt.% of Ti at 1000 °C. The maximum solubility of V in the bcc + C15 domain is at least 22.3 wt.% and 26.1 wt.% at 1100 and 1000 °C, respectively. The C36 phase was not found in all binary and ternary specimens. Therefore, it was determined not to be stable at this temperature range and was removed from the isothermal sections in Figure 2 and Figure 3. The size of the bcc phase was too small in specimens B2, B10, C2, and C10. As a consequence, the acquired EDS data might have been impacted by the neighboring C15 phase. The real tie-lines might extend towards the Cr-V binary boundary along with the present directions. Therefore, the data obtained from alloys 9 and 11 were given precedence over those obtained from alloys 2 and 10 when determining the boundaries of the two-phase region here.
In addition, the composition range of bcc in the Ti-Cr phase diagram was revised in light of the present work (see Figure 10). And the transformation temperature of C15 → C36 should be between 1100 °C and 1200 °C (blue dashed line in Figure 10). As mentioned above, a large discrepancy in the bcc boundary exists in the Ti-Cr literature. Furthermore, the ternary results in this study were in considerable disagreement with the previously determined Ti-Cr boundary as well. So, the Ti-Cr equilibria were further investigated in the present work. Compared to the ternary alloys 1–10, the binary alloys 11–13 experienced longer annealing times and presented more suitable phase fractions, aiming to obtain phases with larger sizes and obtain more reliable phase compositions. It was found that the binary and ternary results exhibited excellent consistency in terms of both composition range and phase structure.

5. Discussion

As the temperature decreased from 1200 to 1000 °C, the solubility range of Ti varied slightly in the binary Cr2Ti phase, at approximately 31.6–34.0 wt.% (33.4–36.0 at.%) in the present work. This range is generally consistent with the binary experimental results reported by Chen [39], which suggested 31.9–34.5 wt.% Ti at 1200 °C and 32.1–34.2 wt.% Ti at 1000 °C, respectively. The result reported by Xu et al. [40] was similar: 31.2–33.7 wt.% Ti at 1000 °C. It indicates that temperature and crystal structure (C36/C15) have little effect on the solubility range of Ti in binary Cr2Ti. In addition, the present work supports Chen’s conclusion that the stoichiometric compositions are not manifested in any of the phase fields of the Laves phases, which indicates that the stability of all structures of Cr2Ti is contingent upon an excess of Ti atoms [39].
As the temperature fell, the ternary extension of the Laves phase in the isothermal sections exhibited a progressive expansion. Specifically, the V solubility range increased from 5.3 wt.% to 10.0 wt.%, while the Ti solubility range essentially remained constant at approximately 31.0–33.9 wt.%. According to the solubilities, the formulation for the ternary Laves phases is (Cr, V)2(Ti, V). The nearly constant Ti solubility range demonstrates that the alloying element V primarily replaces Cr in Cr2Ti. It can be explained in terms of Pauling electronegativity and atomic radius, as V is significantly closer to Cr than to Ti. In contrast to the Ti-Cr system, the Ti content in the ternary Ti-Cr-V C15 can be less than 31.5 wt.% (33.3 at.%). Consequently, the conclusion regarding the excess of Ti should be modified so that the stability of Cr2Ti and (Cr, V)2(Ti, V) requires a deficiency of Cr atoms.
In addition, the Laves phase structure exhibited consistency in both the Ti-Cr and Ti-Cr-V systems in the present work. The structure of C36 exhibited stability at 1200 °C, whereas C15 achieved stabilization at 1100 and 1000 °C. It appears that temperature is the primary determinant of the Cr2Ti’s crystal structure change from C36 to C15. In contrast, the solid solubility of the elements V, Ti, and Cr does not appear to have a notable effect on this phase transition.
In comparison to the literature, both the composition ranges of the phase regions and the crystal structures of the Laves phases were revised in the isothermal sections determined in the present work. It is worth mentioning that the ternary extensions of the Laves phases were elucidated in the present work, benefiting from the phase composition measurement technique of SEM-EDS, which were roughly and tentatively determined through metallography and XRD in previous research [24,27].
The revised isothermal section at 1200 °C is generally consistent with that determined by Samsonova and Budberg [24] regarding solubilities. The two-phase field (bcc + C36) in the present work has a maximum V content of 13.8 wt.%, lower than that in the literature [24] (about 17.6 wt.%). The Laves phase in the present work has a maximum V content of 5.3 wt.%, higher than the previously determined value (between 2.0 and 3.0 wt.% [24]). The discrepancies may have resulted from the lower purity of V (99.74%) used in the literature. In addition, there were only two kinds of Laves phases (C14 and C15) in all the isothermal and vertical sections of the Ti-Cr-V system reported by Samsonova and Budberg [24,25,26]. However, at least in the Ti-Cr system, C36 was detected and determined to be a stable phase by Chen [39] later in 1996. Due to this, C36 and C15 were considered to possibly be the same phase by Samsonova and Budberg in their early research (in the 1960s).
Farrar and Margolin [27] observed two Laves phases at 1200 °C. Their isothermal section was special, including one (bcc + C15) region, two (bcc + C36) regions, two (bcc + C15 + C36) regions, and other phase regions. In the present work, specimens A3–9 were designed to be located in the three-phase regions determined in the research [27]. However, C15 was not observed in any of the specimens. The tie-lines of (bcc + C36) obtained from specimens A1–10 were across the entire phase region, basically ruling out the existence of C15. In addition, the XRD results showed that specimen A6 remained an alloy of (bcc + C36) even after annealing for 840 h (see Figure 9), which confirmed the stability of the C36 phase. Moreover, the (bcc + Cr2Ti) regions constructed by Farrar and Margolin [27] at 1200 and 1000 °C were considerably larger than those in the present work, with maximum V contents of approximately 30 and 40 wt.%, respectively. The values obtained in the present work were about 13.8 and 26.1 wt.%. These different results should be due to the insufficient annealing time (1200 °C, 36 h; 1000 °C, 48 h), as well as the low purity of V (99.7%) and Cr (Cr II: 99.4%) used in the previous research [27]. The hot-rolling process at 850 °C before annealing may have been a contributing factor as well.
According to the present work, the composition ranges are in perfect agreement with Chen’s data [39]. The Laves structure is the main source of the discrepancy. Chen observed in the Ti-Cr system that certain alloys experienced an increase in or formation of the C15 phase after prolonged annealing at 1000 °C, while other Cr-rich alloys retained the microstructures of (bcc + C36). Based on the results of the present work, these (bcc + C36) alloys in the literature did not reach equilibrium. The Laves phase transformation likely required a significantly longer annealing time (>500 h) than in this study (360 h). It may have resulted from the homogenization to a single-bcc alloy before annealing in Chen’s study. Regarding the ternary alloys, Chen’s specimens annealed at 1200 °C exhibited microstructures of (C15/C36 + bcc). The potential origin of the low-temperature stable-phase C15 could be attributed to the short-term annealing (45 h) and the comparatively slow cooling rate that occurred during the oil quenching process. C15 and C36 were reported by Xu et al. [40] at 1000 °C as well. However, there was no obvious contrast in the SEM-BSE images and no gap in the EPMA concentration–penetration curves between C15 and C36. In addition, the Laves phases were not identified using the XRD technique. Therefore, the findings from Xu et al. [40] were insufficient to substantiate the existence of C36 at 1000 °C.
In conclusion, the stable structure of Cr2Ti was determined to be C36 at 1200 °C and C15 at 1000 and 1100 °C in the present work. As reviewed by Stein et al. [41], plenty of systems include such a temperature-dependent structure change. Usually, C15 is the low-temperature phase, C14 is the high-temperature phase, and C36 is possibly the medium-temperature phase. This implies, thermodynamically, that their Gibbs free energy is the lowest at the corresponding temperatures. The following is supporting evidence. In the literature [31], the enthalpies of formation for Cr2Ti at 0 K were determined using ab initio calculations. The values show that C15 < C36 < C14, which aligns with the experimental finding that C15 is the stable phase at low temperatures. Additionally, according to the formula G = H − TS, G is more affected by H at low temperatures, and is more affected by TS at high temperatures. In general, the close-packed structure is more stable at low temperatures, whereas the less efficient packing structure is more stable at high temperatures. And the atomic packing efficiency (C15 > C36 > C14) explains the experimental phenomenon well: that the stable structure becomes C15, C36, and then C14, in order, as the temperature increases.

6. Conclusions

The phase equilibria in the Ti-Cr and Ti-Cr-V systems were experimentally investigated using SEM, EDS, and XRD techniques. The phase diagrams constructed in the present work will support modifying the thermodynamic description for both the binary and ternary systems and facilitate material design for multiple applications. The main conclusions are summarized as follows:
  • The isothermal sections of the Ti-Cr-V system were determined at 1000, 1100, and 1200 °C. The ambiguous phase regions at 1000 and 1200 °C in the previous studies were discussed and clarified, and the isothermal section at 1100 °C was constructed for the first time.
  • The ternary extensions of Cr2Ti were fully elucidated in the present work. As the temperature decreases from 1200 to 1000 °C, the V solubility range of Cr2Ti increases from 5.3 wt.% to 10.0 wt.%, while the Ti solubility range essentially remains constant at approximately 31.0–33.9 wt.%.
  • The formulation for the ternary Laves phases was modified to (Cr, V)2(Ti, V), while V primarily replaces Cr. The stability of both Cr2Ti and (Cr, V)2(Ti, V) requires a deficiency of Cr atoms.
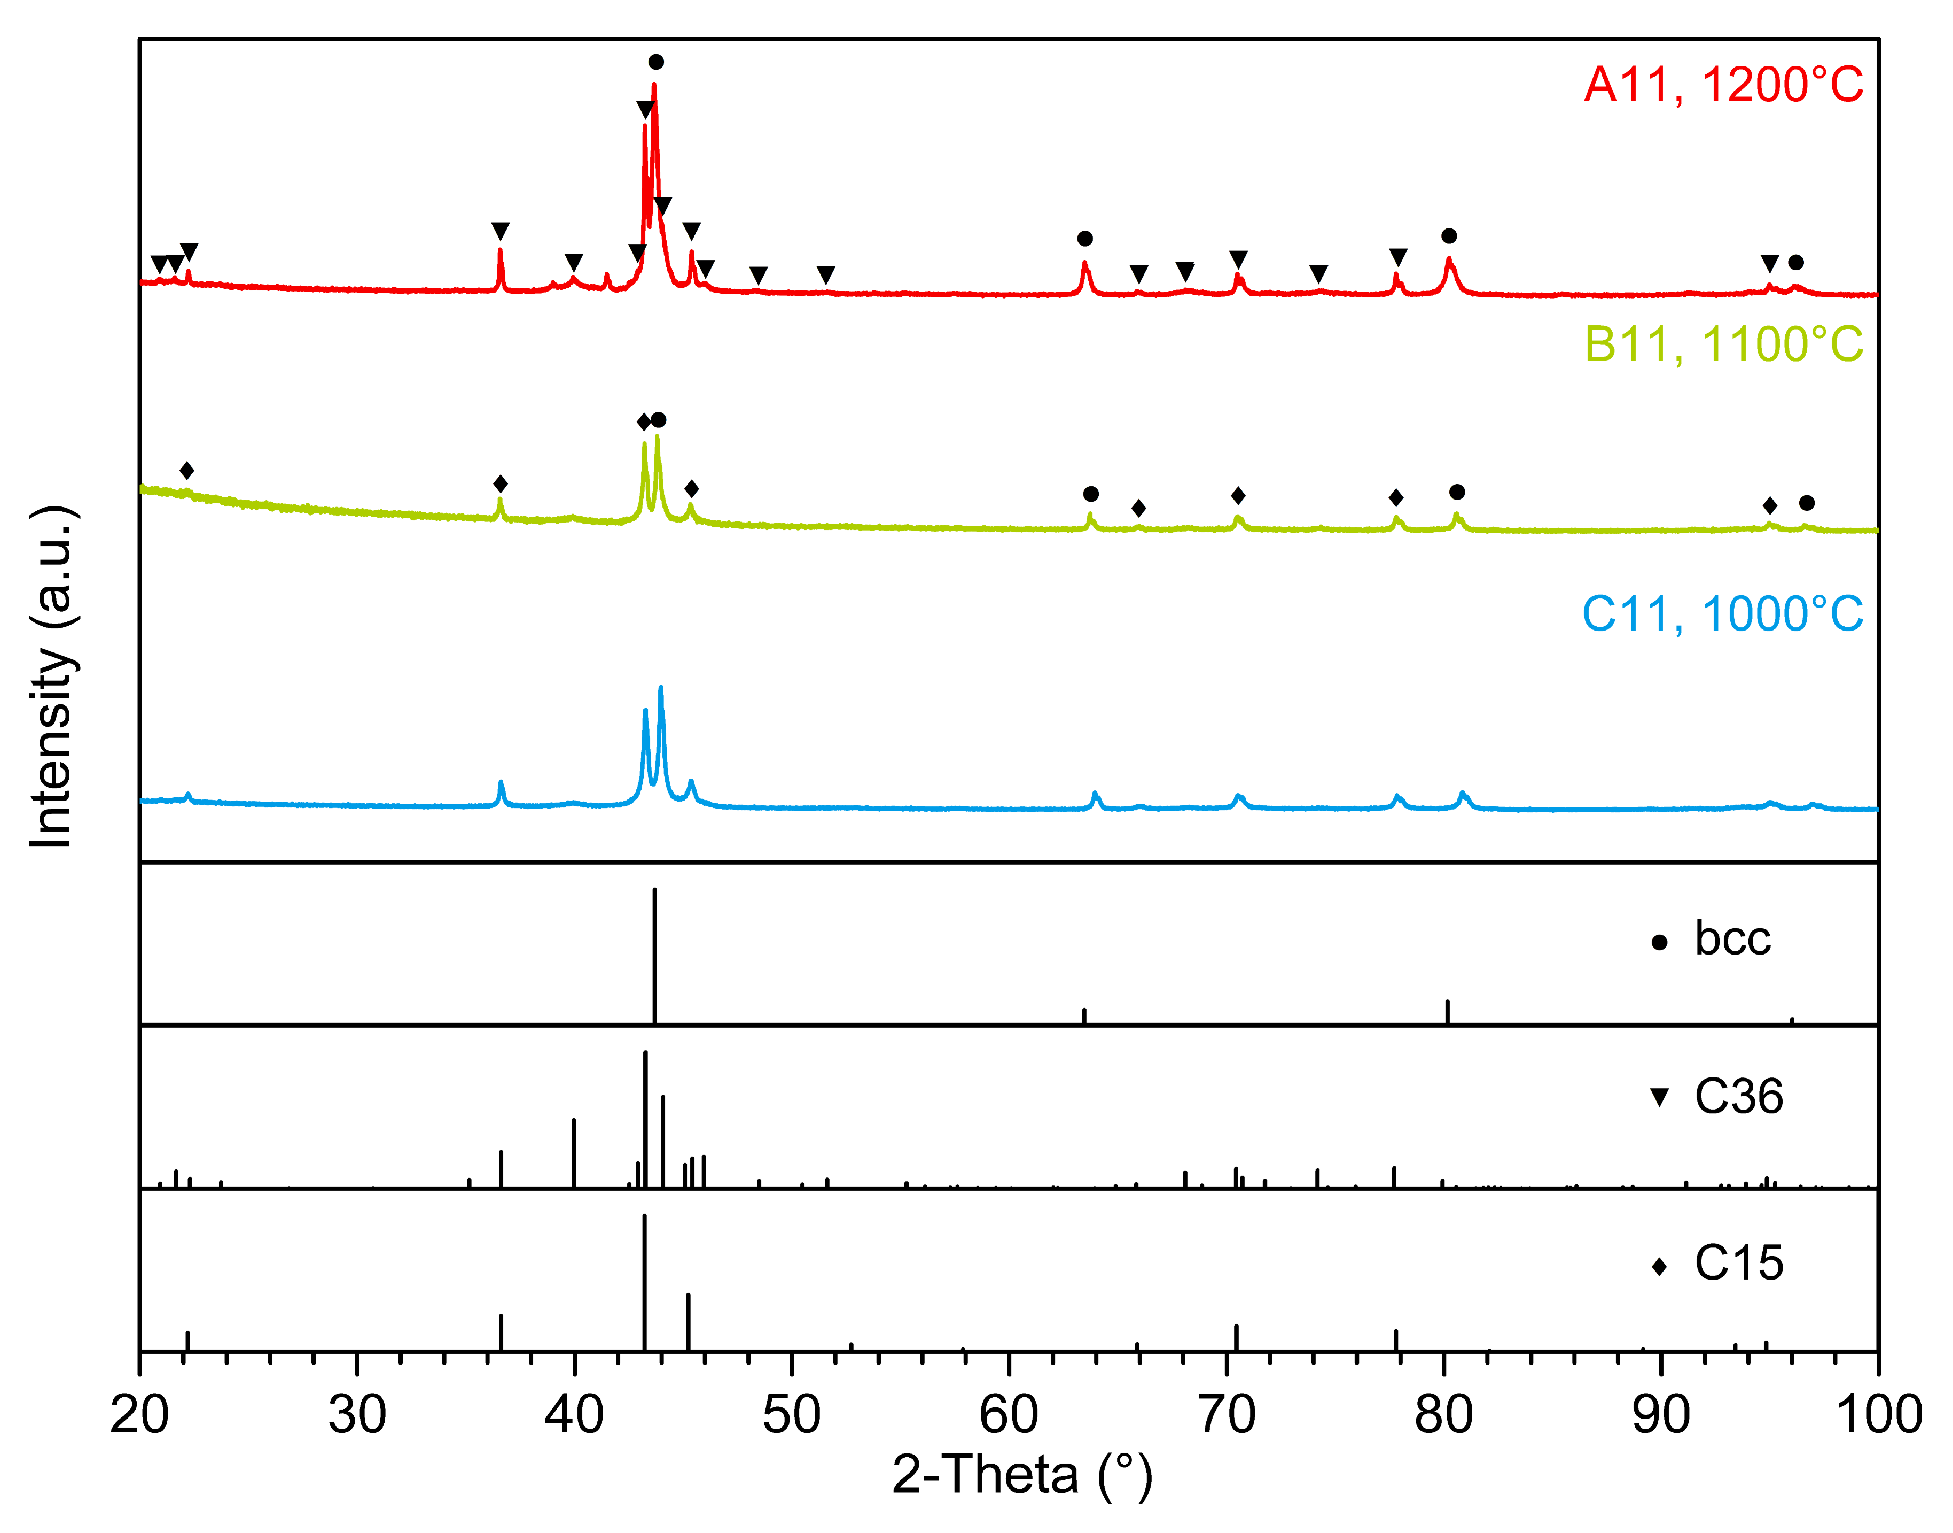
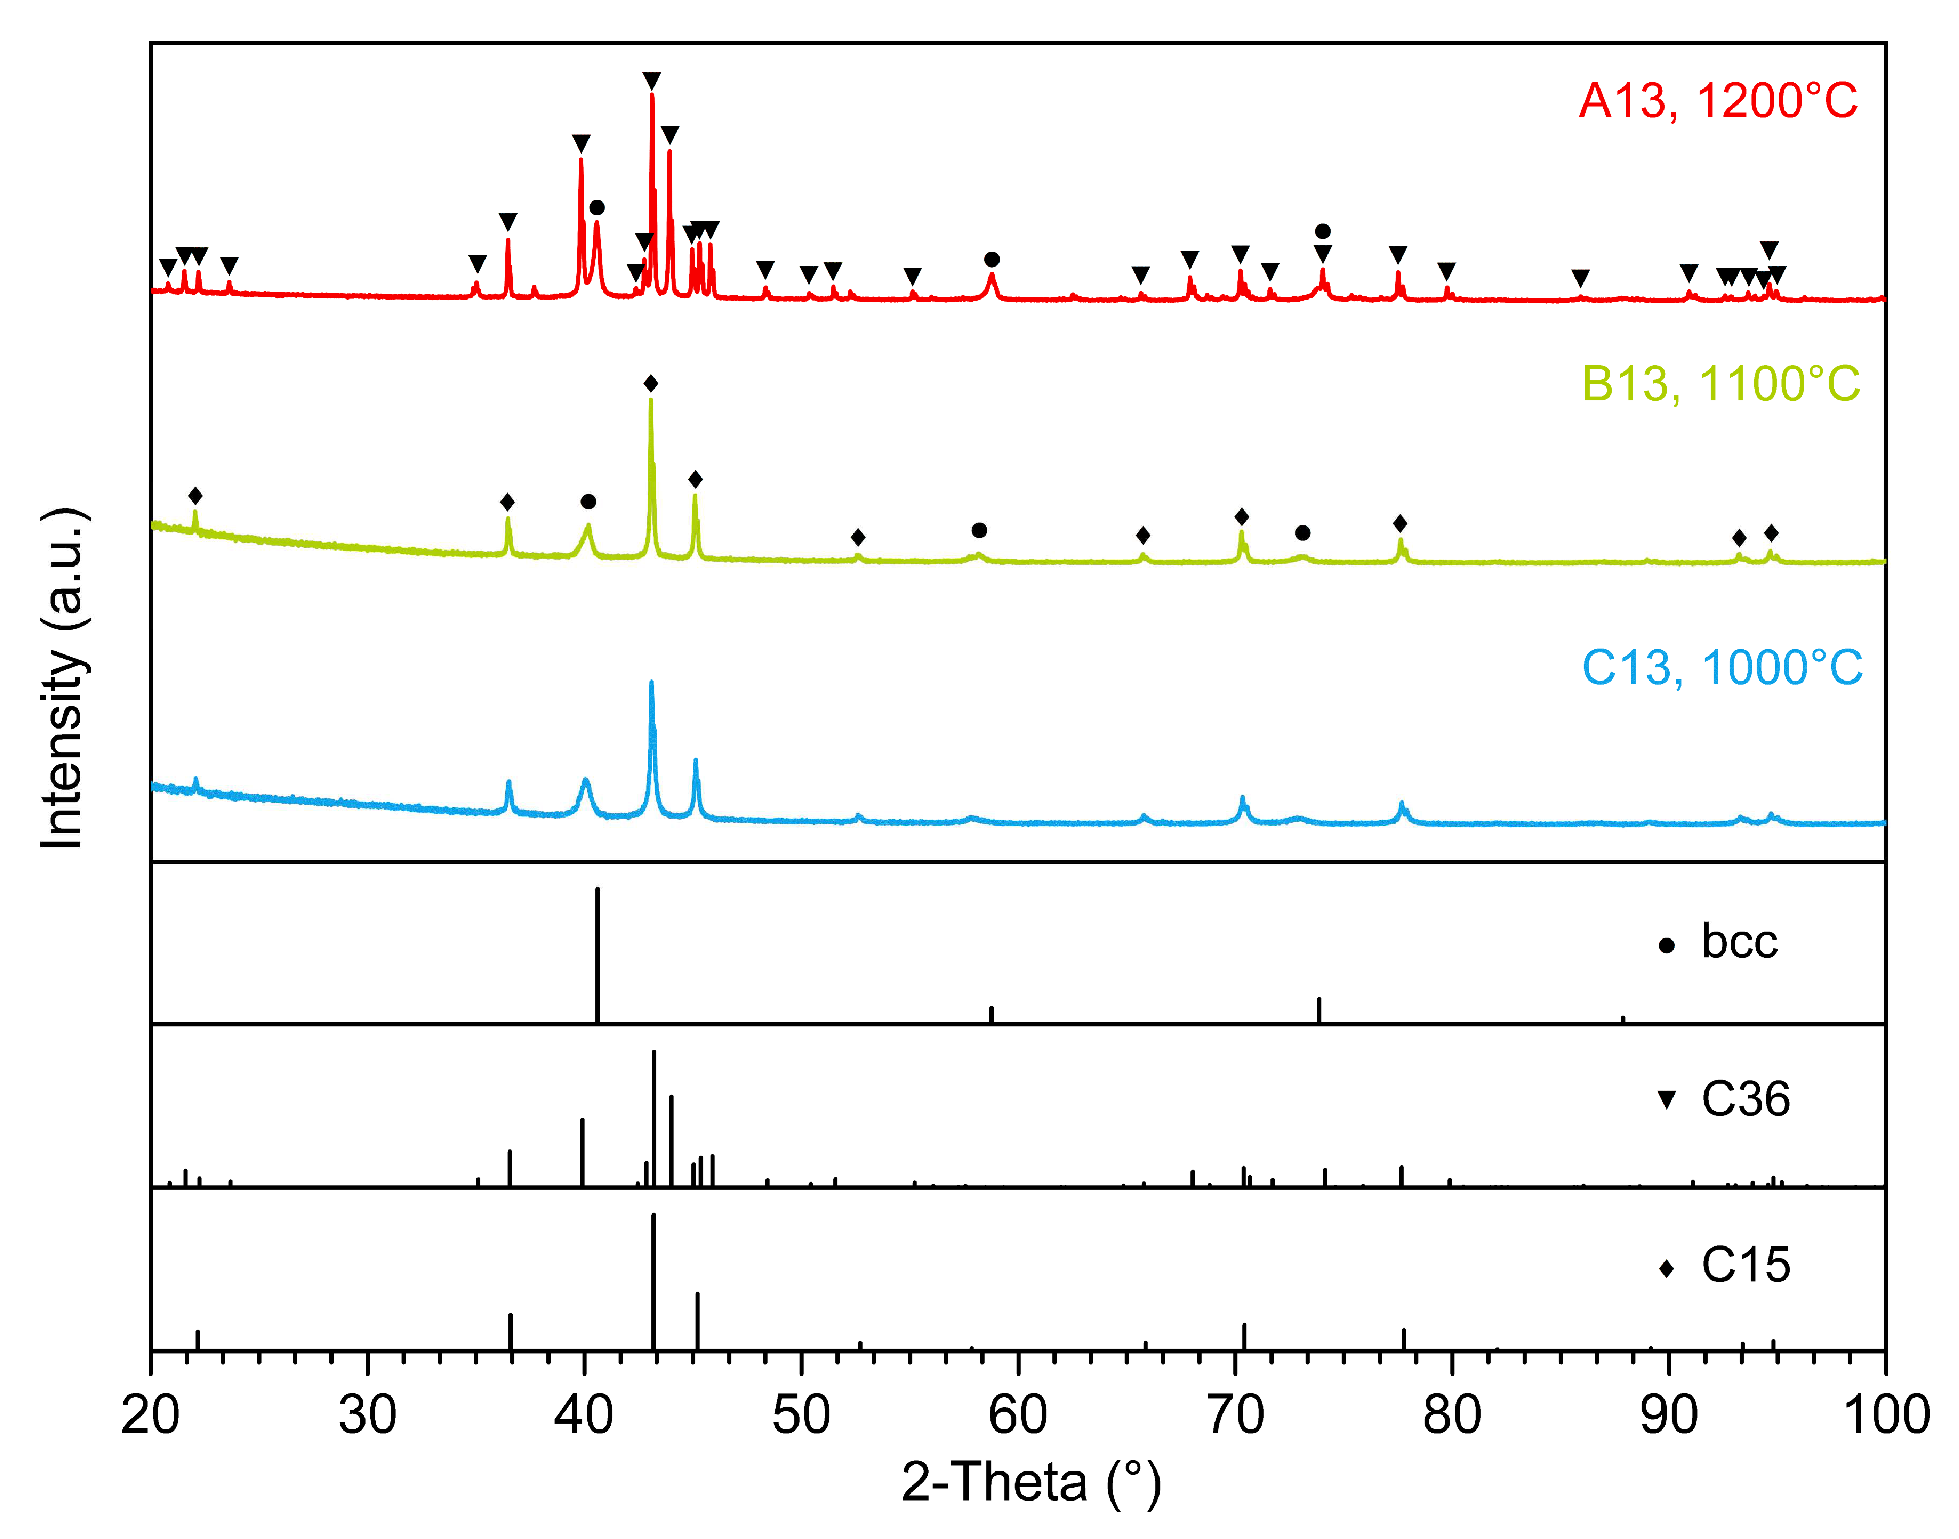
  • The stable structure of Cr2Ti was C36 at 1200 °C and C15 at 1000 and 1100 °C. It suggests that temperature is the primary determinant of the Cr2Ti crystal structure change from C36 to C15. In contrast, the solid solubility of elements V, Ti, and Cr does not appear to have a notable effect on the stable structure type of Cr2Ti.

Author Contributions

Conceptualization, S.F. and X.-G.L.; methodology, S.F. and J.W.; validation, S.F.; formal analysis, S.F.; investigation, S.F.; resources, X.-G.L.; data curation, S.F.; writing—original draft preparation, S.F.; writing—review and editing, S.F., J.W. and X.-G.L.; visualization, S.F.; supervision, X.-G.L. All authors have read and agreed to the published version of the manuscript.

Funding

This research received no external funding.

Data Availability Statement

The raw data supporting the conclusions of this article will be made available by the authors on request.

Acknowledgments

Shiyu Fu gratefully acknowledges the financial support from the China Scholarship Council.

Conflicts of Interest

Author Jingjing Wang was employed by the company Ansteel Beijing Research Institute Co., Ltd. The remaining authors declare that the research was conducted in the absence of any commercial or financial relationships that could be construed as a potential conflict of interest.

References

  1. Bouzidi, A.; Laversenne, L.; Nassif, V.; Elkaim, E.; Zlotea, C. Hydrogen Storage Properties of a New Ti-V-Cr-Zr-Nb High Entropy Alloy. Hydrogen 2022, 3, 270–284. [Google Scholar] [CrossRef]
  2. Kumar, A.; Yadav, T.P.; Mukhopadhyay, N.K. Notable Hydrogen Storage in Ti–Zr–V–Cr–Ni High Entropy Alloy. Int. J. Hydrogen Energy 2022, 47, 22893–22900. [Google Scholar] [CrossRef]
  3. Liu, J.; Xu, J.; Sleiman, S.; Chen, X.; Zhu, S.; Cheng, H.; Huot, J. Microstructure and Hydrogen Storage Properties of Ti–V–Cr Based BCC-Type High Entropy Alloys. Int. J. Hydrogen Energy 2021, 46, 28709–28718. [Google Scholar] [CrossRef]
  4. Liu, J.; Xu, J.; Sleiman, S.; Ravalison, F.; Zhu, W.; Liu, H.; Cheng, H.; Huot, J. Hydrogen Storage Properties of V0.3Ti0.3Cr0.25Mn0.1Nb0.05 High Entropy Alloy. Int. J. Hydrogen Energy 2022, 47, 25724–25732. [Google Scholar] [CrossRef]
  5. Tukac, O.U.; Ozalp, A.; Aydogan, E. Development and Thermal Stability of Cr10Mo25Ta25Ti15V25 Refractory High Entropy Alloys. J. Alloys Compd. 2023, 930, 167386. [Google Scholar] [CrossRef]
  6. Liu, J.; Scales, R.J.; Li, B.-S.; Goode, M.; Young, B.A.; Hu, J.; Wilkinson, A.J.; Armstrong, D.E.J. Controlling Microstructure and Mechanical Properties of Ti-V-Cr-Nb-Ta Refractory High Entropy Alloys through Heat Treatments. J. Alloys Compd. 2023, 932, 167651. [Google Scholar] [CrossRef]
  7. Li, Y.G.; Loretto, M.H.; Rugg, D.; Voice, W. Effect of Heat Treatment and Exposure on Microstructure and Mechanical Properties of Ti–25V–15Cr–2Al–0.2C (wt%). Acta Mater. 2001, 49, 3011–3017. [Google Scholar] [CrossRef]
  8. Cao, J.; Huang, X.; Mi, G.; Sha, A.; Wang, B. Research Progress on Application Technique of Ti-V-Cr Burn Resistant Titanium Alloys. J. Aeronaut. Mater. 2014, 34, 92–97. [Google Scholar] [CrossRef]
  9. Huang, Q.; Liu, F.; Huang, C.; Lin, X.; Xia, C.; Wang, Z.; You, Q.; Liu, L. Achieving Superior Burn Resistant and Mechanical Properties of Ti40 Alloy by Laser Solid Forming. J. Manuf. Process. 2023, 102, 406–415. [Google Scholar] [CrossRef]
  10. Shao, L.; Li, W.; Li, D.; Xie, G.; Zhang, C.; Zhang, C.; Huang, J. A Review on Combustion Behavior and Mechanism of Ti Alloys for Advanced Aero-Engine. J. Alloys Compd. 2023, 960, 170584. [Google Scholar] [CrossRef]
  11. Medvedeva, N.A.; Mironova, A.A.; Skryabina, N.E.; Fruchart, D. Effect of Hydrogenation on Metal Distribution in Ti-V-Cr Alloys. Int. J. Hydrogen Energy 2020, 45, 7892–7900. [Google Scholar] [CrossRef]
  12. Hu, H.; Ma, C.; Chen, Q. Improved Hydrogen Storage Properties of Ti2CrV Alloy by Mo Substitutional Doping. Int. J. Hydrogen Energy 2022, 47, 11929–11937. [Google Scholar] [CrossRef]
  13. Zhu, Y.; Li, X.; Yang, X.S.; Chen, P.; Tsui, G.C.P.; Xu, Z.L.; Tang, R.; Xiao, F.; Chan, K. Compositionally Complex Doping for Low-V Ti-Cr-V Hydrogen Storage Alloys. Chem. Eng. J. 2023, 477, 146970. [Google Scholar] [CrossRef]
  14. Smith, D.L.; Billone, M.C.; Natesan, K. Vanadium-Base Alloys for Fusion First-Wall/Blanket Applications. Int. J. Refract. Met. Hard Mater. 2000, 18, 213–224. [Google Scholar] [CrossRef]
  15. Miyazawa, T.; Saito, H.; Hishinuma, Y.; Nagasaka, T.; Muroga, T.; Shen, J.; Okuno, Y.; Yu, H.; Kasada, R.; Hasegawa, A. Effect on Impact Properties of Adding Tantalum to V-4Cr-4Ti Ternary Vanadium Alloy. Nucl. Mater. Energy 2022, 31, 101198. [Google Scholar] [CrossRef]
  16. Sparks, T.; Nguyen-Manh, D.; Zheng, P.; Wróbel, J.S.; Sobieraj, D.; Gorley, M.; Connolley, T.; Reinhard, C.; Wang, Y.; Cai, B. Mechanical Characterisation of V-4Cr-4Ti Alloy: Tensile Tests under High Energy Synchrotron Diffraction. J. Nucl. Mater. 2022, 569, 153911. [Google Scholar] [CrossRef]
  17. Zou, Y.; Fukumoto, K.I.; Ishigami, R.; Nagasaka, T. Microstructural Changes in He-Irradiated V-Cr-Ti Alloys with Low Ti Addition at 700 °C. Nucl. Mater. Energy 2024, 38, 101605. [Google Scholar] [CrossRef]
  18. Senkov, O.N.; Miracle, D.B.; Chaput, K.J. Development and Exploration of Refractory High Entropy Alloys-A Review. J. Mater. Res. 2018, 33, 3092–3128. [Google Scholar] [CrossRef]
  19. Pickering, E.J.; Carruthers, A.W.; Barron, P.J.; Middleburgh, S.C.; Armstrong, D.E.J.; Gandy, A.S. High-Entropy Alloys for Advanced Nuclear Applications. Entropy 2021, 23, 98. [Google Scholar] [CrossRef] [PubMed]
  20. Odette, G.R.; Alinger, M.J.; Wirth, B.D. Recent Developments in Irradiation-Resistant Steels. Annu. Rev. Mater. Res. 2008, 38, 471–503. [Google Scholar] [CrossRef]
  21. Enomoto, M. The Cr-Ti-V System (Chromium-Titanium-Vanadium). J. Phase Equilibria 1992, 13, 195–200. [Google Scholar] [CrossRef]
  22. Lee, J.Y.; Kim, J.H.; Park, S.I.; Lee, H.M. Phase Equilibrium of the Ti-Cr-V Ternary System in the Non-Burning β-Ti Alloy Region. J. Alloys Compd. 1999, 291, 229–238. [Google Scholar] [CrossRef]
  23. Ghosh, G. Thermodynamic and Kinetic Modeling of the Cr-Ti-V System. J. Phase Equilibria 2002, 23, 310–328. [Google Scholar] [CrossRef]
  24. Samsonova, N.N.; Budberg, P.B. Investigation of Alloys of the Titanium-Vanadium-Chromium System. Izv. Akad. Nauk SSSR Neorg. Mater. 1965, 1, 1558–1563. [Google Scholar]
  25. Samsonova, N.N.; Budberg, P.B. Effect of Vanadium and Molybdenum on the Properties and Phase Transformations of the Intermetallic Compound TiCr2. Poroshkovaya Metall. 1966, 8, 49–64. [Google Scholar] [CrossRef]
  26. Samsonova, N.N.; Budberg, P.B. Phase Equilibria in Alloys of the Ti-V-Cr System. Izv. Akad. Nauk SSSR Neorg. Mater. 1967, 3, 817–823. [Google Scholar]
  27. Farrar, P.A.; Margolin, H. Titanium-Chromium-Vanadium System. Trans. ASM 1967, 60, 57–66. [Google Scholar]
  28. Murray, J.L. The Cr-Ti (Chromium-Titanium) System. Bull. Alloy Phase Diagr. 1981, 2, 174–181. [Google Scholar] [CrossRef]
  29. Pavlů, J.; Vřešt’ál, J.; Šob, M. Thermodynamic Modeling of Laves Phases in the Cr–Hf and Cr–Ti Systems: Reassessment Using First-Principles Results. Calphad Comput. Coupling Phase Diagr. Thermochem. 2010, 34, 215–221. [Google Scholar] [CrossRef]
  30. Cupid, D.M.; Kriegel, M.J.; Fabrichnaya, O.; Ebrahimi, F.; Seifert, H.J. Thermodynamic Assessment of the Cr-Ti and First Assessment of the Al-Cr-Ti Systems. Intermetallics 2011, 19, 1222–1235. [Google Scholar] [CrossRef]
  31. Sun, H.; Zhang, Y.; Pan, Q.; Liu, Y.; Zheng, W.; Lu, X. Calphad Thermodynamic Modeling of the Ni-Ti-Cr System and the B2/B19′ Martensitic Transformation. Calphad Comput. Coupling Phase Diagr. Thermochem. 2022, 79, 102505. [Google Scholar] [CrossRef]
  32. McQuillan, M.K. A Provisional Constitutional Diagram of the Chromium-Titanium System. J. Inst. Met. 1951, 79, 379. [Google Scholar]
  33. Cuff, F.B.; Grant, N.J.; Floe, C.F. Titanium-Chromium Phase Diagram. J. Met. 1952, 4, 848–853. [Google Scholar] [CrossRef]
  34. VanThyne, R.J.; Kessler, H.D.; Hansen, M. The Systems Titanium-Chromium and Titanium-Iron. Trans. Am. Soc. Met. 1952, 44, 974–989. [Google Scholar]
  35. Ermanis, F.; Farrar, P.A.; Margolin, H. A Reinvestigation of the Systems Ti-Cr and Ti-V. Trans. Metall. Soc. AIME 1961, 221, 904–908. [Google Scholar]
  36. Mikheev, V.S.; Alekasashin, V.S. Electrical Volume Resistivity of Alloys of the Titanium-Chromium System up to Temperatures of 1100 °C. Fiz. Met. Met. 1962, 14, 62. [Google Scholar]
  37. Svechnikov, V.N.; Kocherzhinsky, Y.A.; Latysheva, V.I. Constitution Diagram of Chromium-Titanium. Probl. Phys. Met. Met. 1962, 16, 132–135. [Google Scholar]
  38. Farrar, P.A.; Margolin, H. A Reinvestigation of the Chromium-Rich Region of the Titanium-Chromium System. Trans. AIME 1963, 227, 1342. [Google Scholar]
  39. Chen, K.C. Compositional Influences on the Microstructures, Phase Stability, and Mechanical Properties of TiCr2 Laves Phase Alloys. Ph.D. Thesis, Massachusetts Institute of Technology, Cambridge, MA, USA, 1996. [Google Scholar]
  40. Xu, S.; Zhang, H.; Yang, G.; Liang, Y.; Xu, X.; He, J.; Lin, J. Phase Equilibria in the Ti–Al–Cr System at 1000 °C. J. Alloys Compd. 2020, 826, 154236. [Google Scholar] [CrossRef]
  41. Stein, F.; Palm, M.; Sauthoff, G. Structure and Stability of Laves Phases Part II—Structure Type Variations in Binary and Ternary Systems. Intermetallics 2005, 13, 1056–1074. [Google Scholar] [CrossRef]
Figure 1. (a) The isothermal section of Ti-Cr-V at 1200 °C determined based on the experimental results in the present work and adapted from Refs. [24,27,39], and (b) the magnified region around the C36 phase. Blue and white areas are single- and two-phase regions, respectively. The numbers 1–13 correspond to specimens A1–13.
Metals 14 00498 g001
Figure 2. The isothermal section of Ti-Cr-V at 1100 °C determined based on the experimental results in the present work. Blue and white areas are single- and two-phase regions, respectively. The numbers 2–13 correspond to specimens B2–13.
Metals 14 00498 g002
Figure 3. The isothermal section of Ti-Cr-V at 1000 °C determined based on the experimental results in the present work and adapted from Refs. [27,39]. Blue and white areas are single- and two-phase regions, respectively. The numbers 1–13 correspond to specimens C1–13.
Metals 14 00498 g003
Figure 4. SEM-BSE images of the microstructures of Ti-Cr specimens annealed at 1200 °C: (a) A11 and (b) A13; at 1100 °C: (c) B11 and (d) B13; and at 1000 °C: (e) C11 and (f) C13.
Metals 14 00498 g004
Figure 5. SEM-BSE images of the microstructures of Ti-Cr-V specimens annealed at 1200 °C: (a) A1 (b) A3, (c) A5, (d) A7.
Metals 14 00498 g005
Figure 6. SEM-BSE images of the microstructures of Ti-Cr-V specimens annealed at 1000 °C: (a) C1, (b) C3, (c) C6, (d) C9.
Metals 14 00498 g006
Figure 7. Experimental powder X-ray diffraction patterns of alloy 11 annealed at 1200 °C (bcc + C36), and 1100 and 1000 °C (bcc + C15), respectively.
Metals 14 00498 g007
Figure 8. Experimental powder X-ray diffraction patterns of alloy 13 annealed at 1200 °C (bcc + C36), and 1100 and 1000 °C (bcc + C15), respectively.
Metals 14 00498 g008
Figure 9. Experimental powder X-ray diffraction patterns of alloy 6 annealed at 1200 °C for 840 h (bcc + C36) and 1100 °C (bcc + C15), respectively. The XRD result obtained from A6 annealed for 840 h was the same as for 120 h, which confirms the stability of C36 at 1200 °C.
Metals 14 00498 g009
Figure 10. The calculated Ti-Cr phase diagram using the parameters adapted from Ref. [31] by Thermo-Calc Educational 2024a Software compared with the experimental data in the present work. The red lines are the calculated invariant reactions [31], and the blue dashed lines are the tentatively determined invariant reactions based on the present work; the vertical arrows connecting them indicate that they are the corresponding reactions.
Metals 14 00498 g010
Table 1. Crystallographic information for the solid phases in the Ti-Cr-V system.
PhasePearson SymbolSpace GroupPrototype
(αTi), hcp_A3hP2 P 6 3 /mmcMg
(βTi, Cr, V), bcc_A2cI2 I m 3 ¯ mW
α-Cr2Ti, C15cF24 F d 3 ¯ mCu2Mg
β-Cr2Ti, C36hP24 P 6 3 /mmcMgNi2
γ-Cr2Ti, C14hP12 P 6 3 /mmcMgZn2
Table 2. Designed compositions of alloys.
No.Alloy Composition, wt.%
VTiCr
12.537.560.0
22.527.570.0
310.042.547.5
410.040.050.0
510.037.552.5
610.032.557.5
710.030.060.0
810.027.562.5
910.025.065.0
105.027.567.5
11-23.576.5
12-32.267.8
13-47.952.1
Table 3. Phase compositions of alloy specimens after heat treatments at 1000, 1100, and 1200 °C.
No.Measured Alloy Composition, wt.%PhaseMeasured Phase Composition, wt.%
VTiCrVTiCr
1200 °C, 120 h
A12.638.159.3C362.233.963.9
bcc4.053.342.7
A22.828.368.9C361.831.566.7
bcc6.215.178.7
A310.143.146.8bcc10.143.047.0
A410.240.749.1bcc10.240.649.2
A510.338.751.0C365.333.461.3
bcc10.939.449.7
A610.432.956.7C365.332.562.3
bcc12.733.454.0
A710.230.759.2C365.332.262.4
bcc13.629.556.9
A810.128.361.7C365.032.063.0
bcc13.825.560.7
A910.325.764.0C364.631.863.6
bcc13.621.864.6
A105.228.366.5C363.331.765.0
bcc10.817.571.7
1200 °C, 360 h
A11-24.975.1bcc-12.987.1
C36-31.668.4
A12-32.867.2C36-32.267.8
A13-49.250.8C36-34.265.8
bcc-62.637.4
1100 °C, 240 h
B22.828.069.2C151.731.666.7
bcc7.011.381.8
B310.844.544.7C158.333.757.9
bcc18.239.941.9
B410.442.447.3C158.533.458.1
bcc20.334.345.4
B510.137.852.1C158.032.459.6
bcc19.234.346.5
B610.232.956.9C158.631.959.5
bcc22.127.050.9
B710.030.959.1C157.431.461.2
bcc22.317.959.8
B810.228.261.6C156.831.361.9
bcc21.715.862.5
B910.624.165.3C155.631.163.3
bcc18.912.968.2
B105.427.667.1C153.531.365.2
bcc12.713.673.7
1100 °C, 480 h
B11-24.775.3bcc-10.589.5
C15-31.668.4
B12-32.767.3C15-32.467.6
B13-48.751.3C15-34.066.0
bcc-68.831.2
1000 °C, 360 h
C12.738.259.1C152.633.663.9
bcc3.468.627.9
C22.728.369.0C151.731.566.9
bcc7.412.979.7
C310.343.246.6C157.832.959.3
bcc13.356.330.4
C410.240.749.1C158.132.959.0
bcc14.055.330.7
C510.338.351.4C158.532.858.7
bcc15.053.631.4
C610.333.256.5C1510.032.357.7
bcc19.247.833.0
C710.230.759.2C159.431.459.3
bcc26.118.255.7
C810.228.261.6C157.431.061.5
bcc23.912.563.6
C910.125.964.0C156.031.063.0
bcc22.510.067.5
C105.228.266.5C153.431.365.4
bcc13.612.673.9
1000 °C, 720 h
C11-24.275.8bcc-9.390.7
C15-31.668.4
C12-33.067.0C15-32.667.4
C13-49.250.8C15-34.066.0
bcc-72.127.9
Disclaimer/Publisher’s Note: The statements, opinions and data contained in all publications are solely those of the individual author(s) and contributor(s) and not of MDPI and/or the editor(s). MDPI and/or the editor(s) disclaim responsibility for any injury to people or property resulting from any ideas, methods, instructions or products referred to in the content.

