Author Contributions
Conceptualization, J.L. and D.S.; methodology, J.L. and D.S.; investigation, J.L., D.S. and D.G.; resources, D.S. and M.M.; data curation, J.L. and D.S.; writing—original draft preparation, J.L.; writing—review and editing, D.S., D.G., M.M. and R.S.; visualization, J.L. and D.S.; supervision, D.S. and M.M.; project administration, M.M. and R.S.; funding acquisition, M.M. and R.S. All authors have read and agreed to the published version of the manuscript.
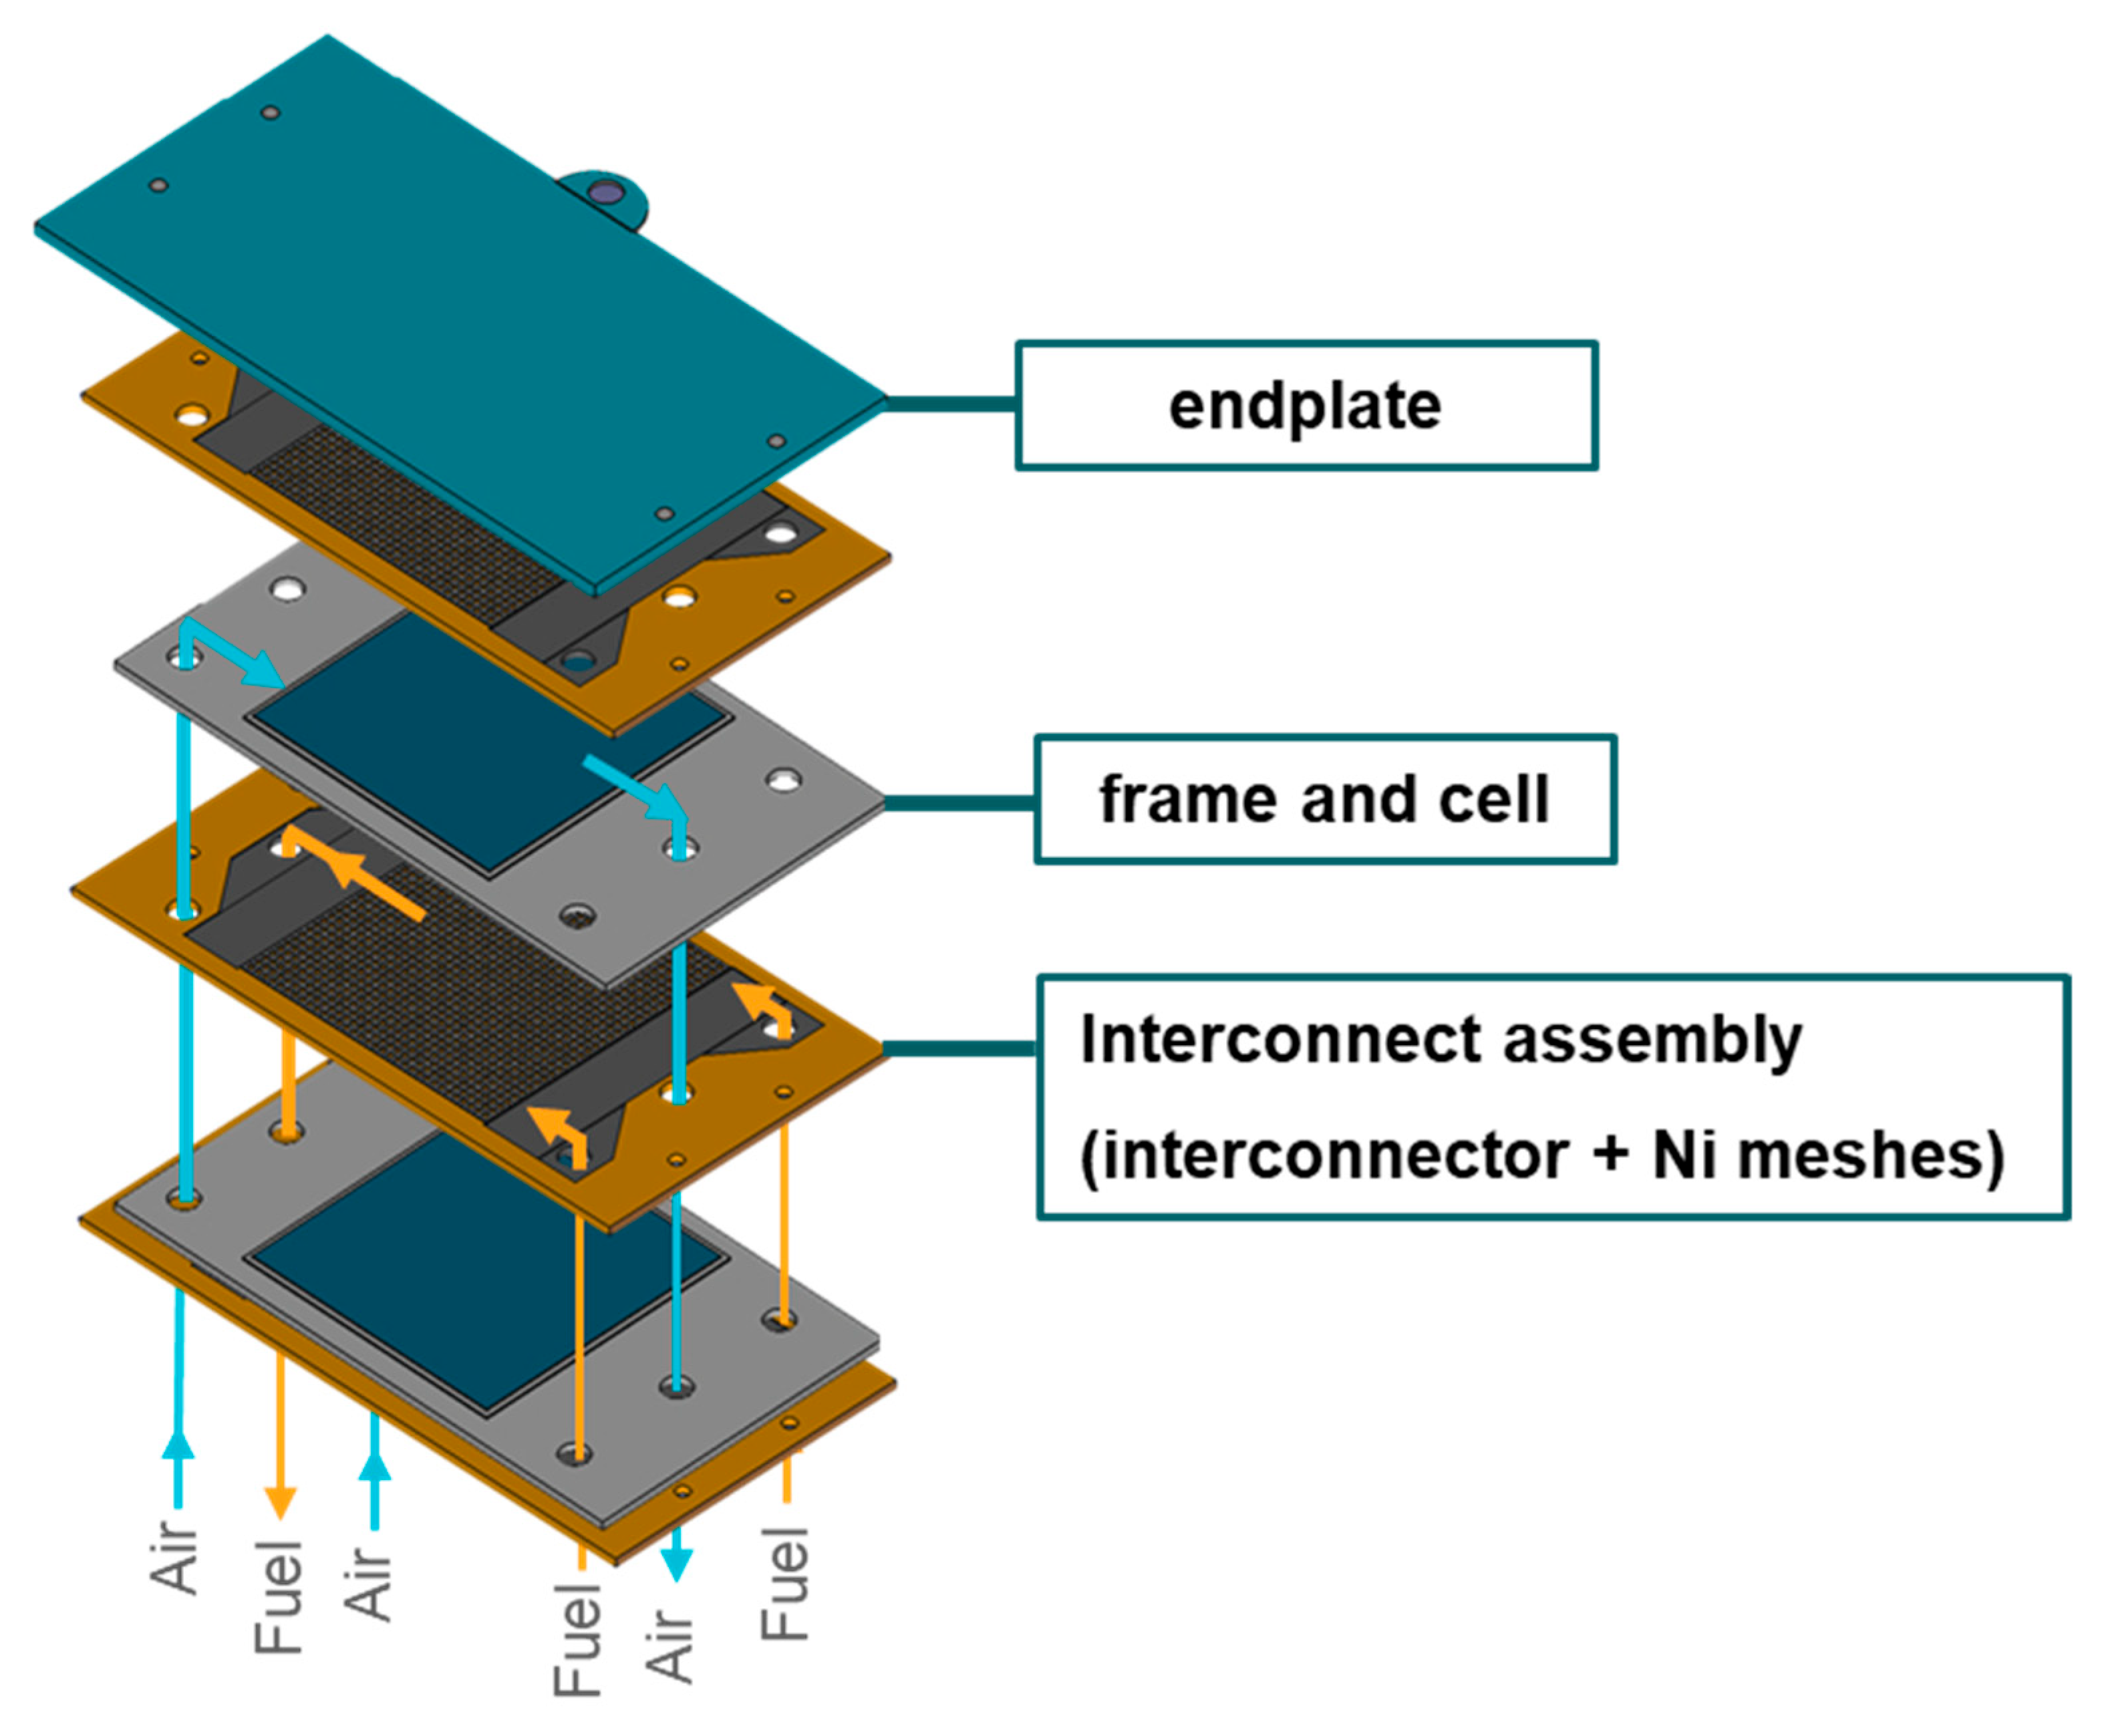
Figure 1.
JÜLICH SOC F10 stack in fuel cell mode.
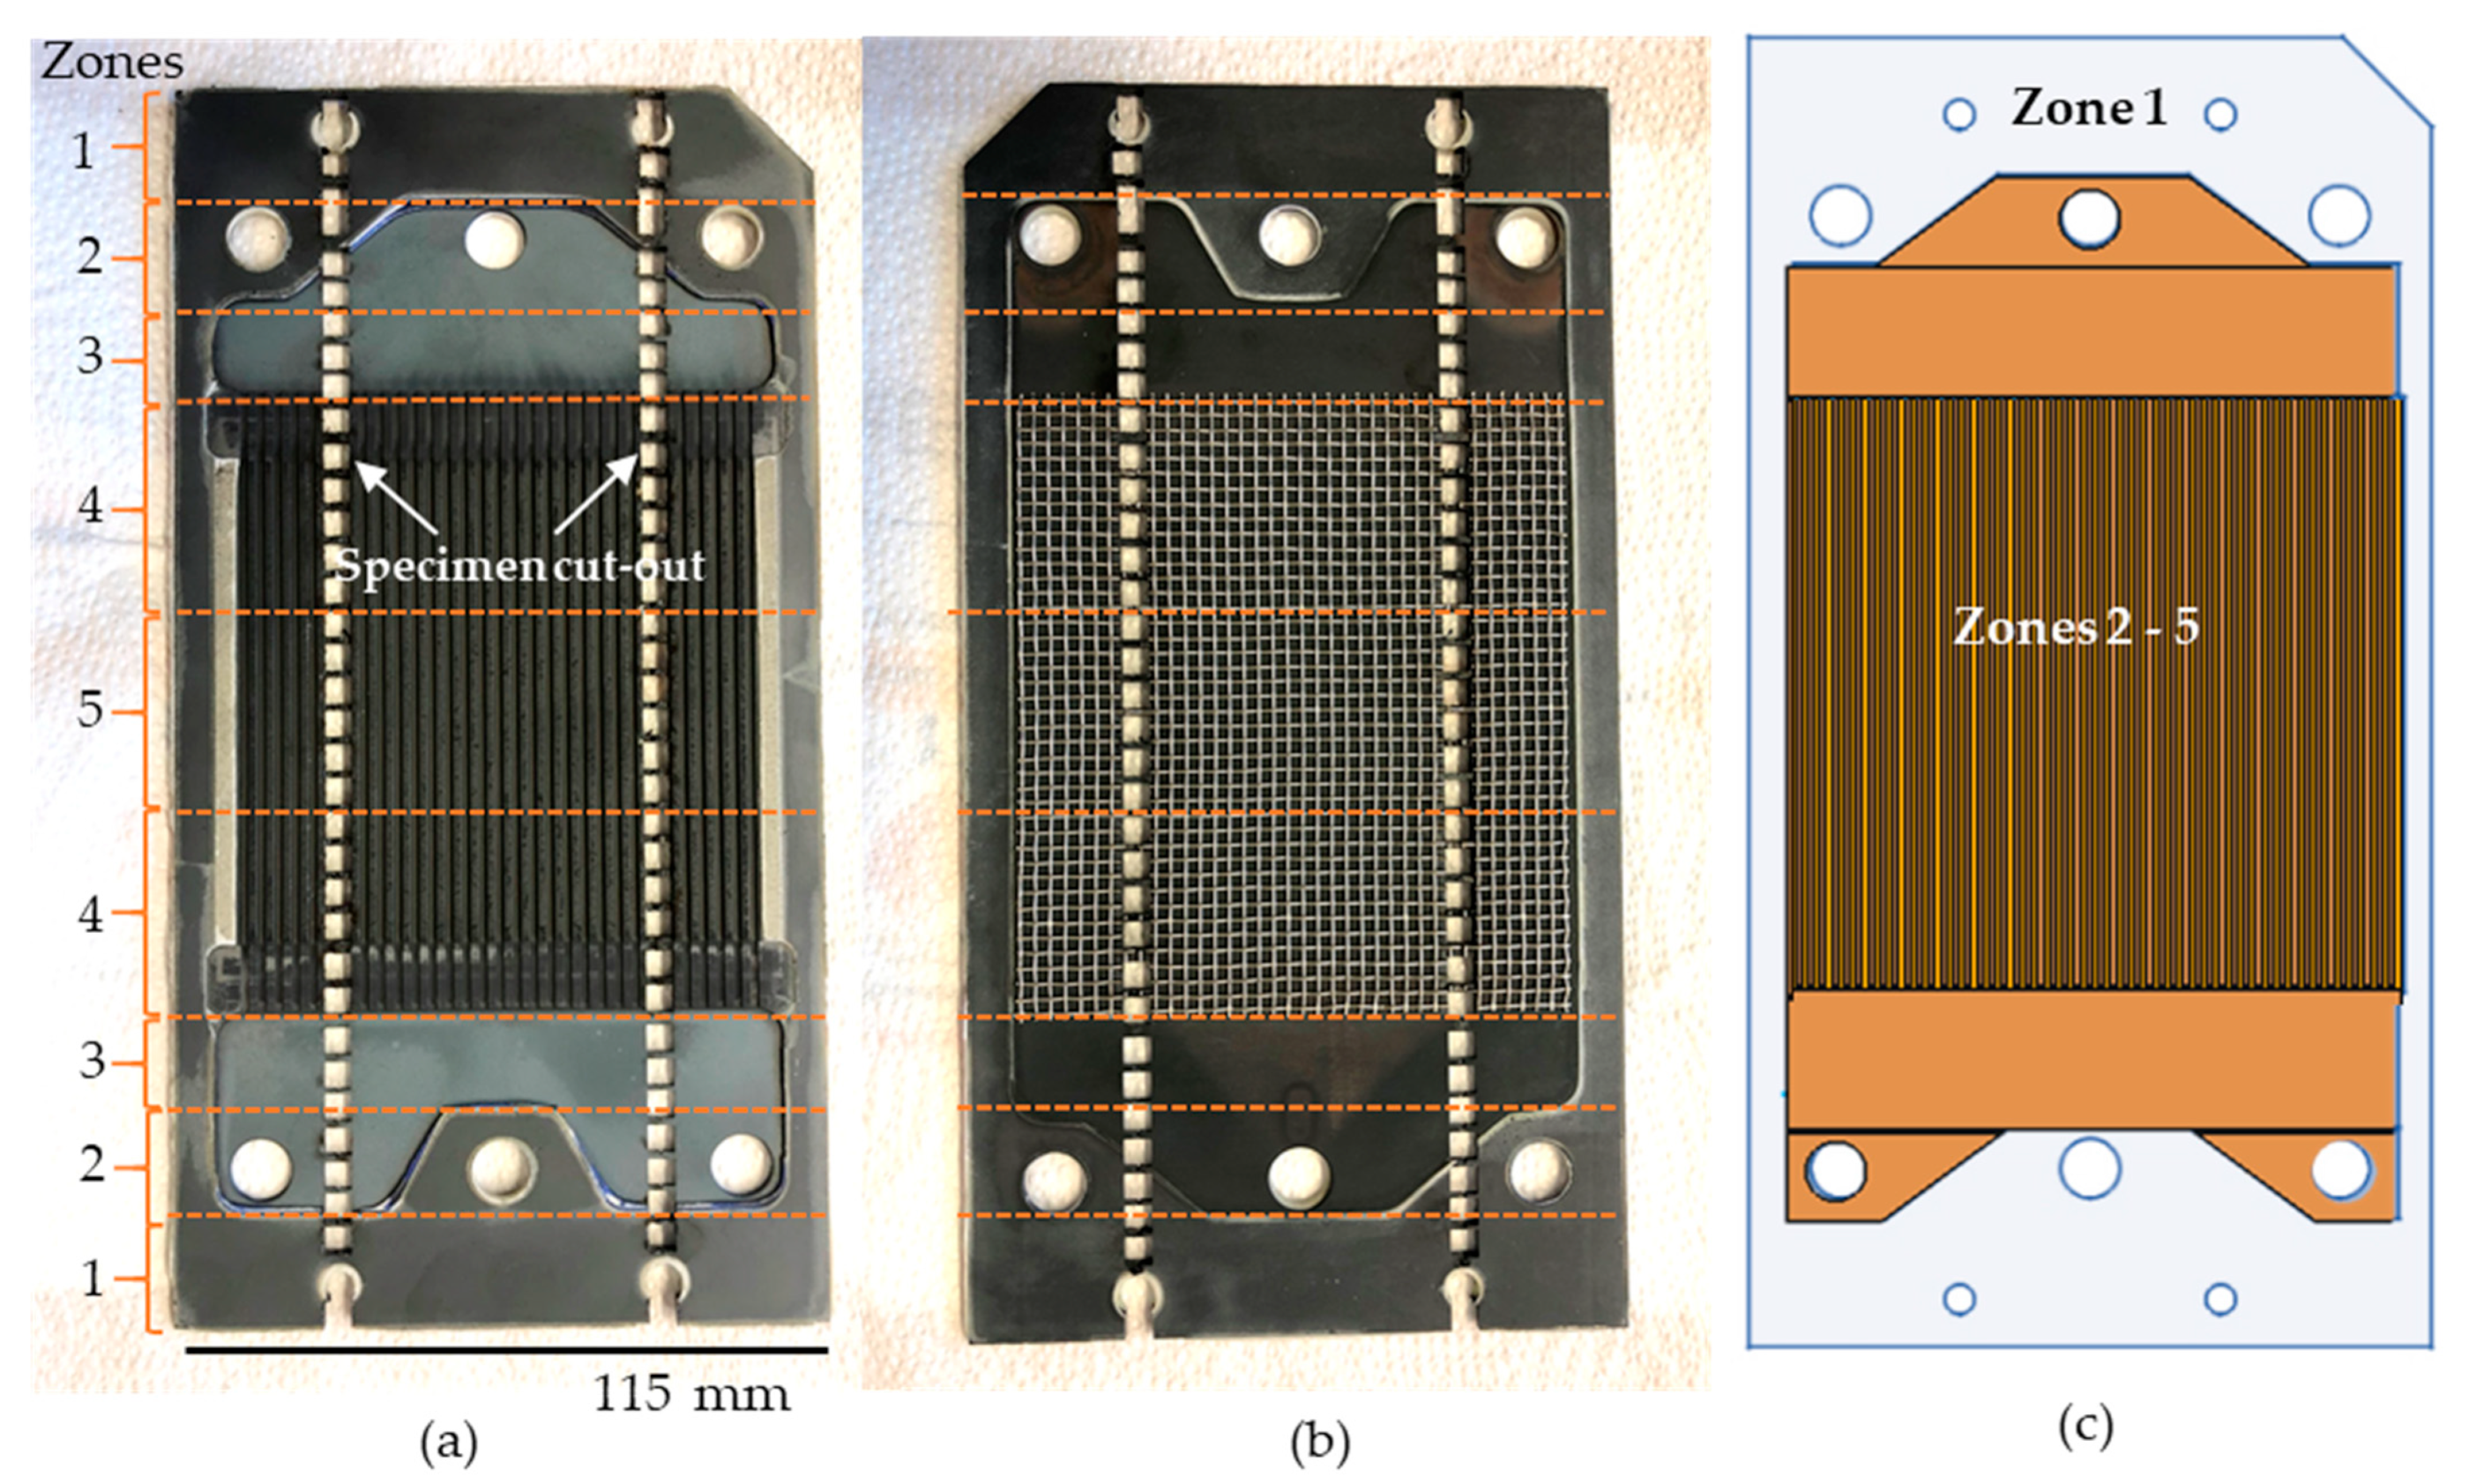
Figure 2.
Photographical top view of interconnector 1 from JÜLICH SOC F10 stack on the (a) air side and (b) fuel side. Specimens are removed along its longitudinal length and divided into designated zones; (c) schematic illustration highlighting the compositional coverage of zone 1 in blue and zones 2 to 5 in orange.
Figure 3.
(a) Schematic of the used NETZSCH STA device; sample holder layout for (b) DTA and (c) remelting and smelting experiments.
Figure 4.
(a) Cross-sectional BSE images of zone 4 specimen. Spliced region is denoted by broken lines; (b) BSE image of the LCC10-MCF interface. The actual stoichiometric formulas showed little variation compared to the reference formulas (LCC10: LaMn0.45Co0.35Cu0.2O3; MCF: MnCo1.9Fe0.1O4); (c) BSE and phase images (derived from EDS data) of the MCF–alloy interface; (d) a glass composite on the fuel side of a specimen from zone 1; (e) welded Ni mesh on the fuel side in a specimen from zone 5.
Figure 5.
DTA signals of zonal samples and Ni mesh 2. Onset values of major endothermic peaks correspond to melting points while smaller peaks highlighted by star symbols (*) may indicate solid state transitions.
Figure 6.
(a) Fe-Cr equilibrium phase diagram calculated with FactSage 8.1; (b) zoomed-in region with plotted experimental melting points of zonal specimens.
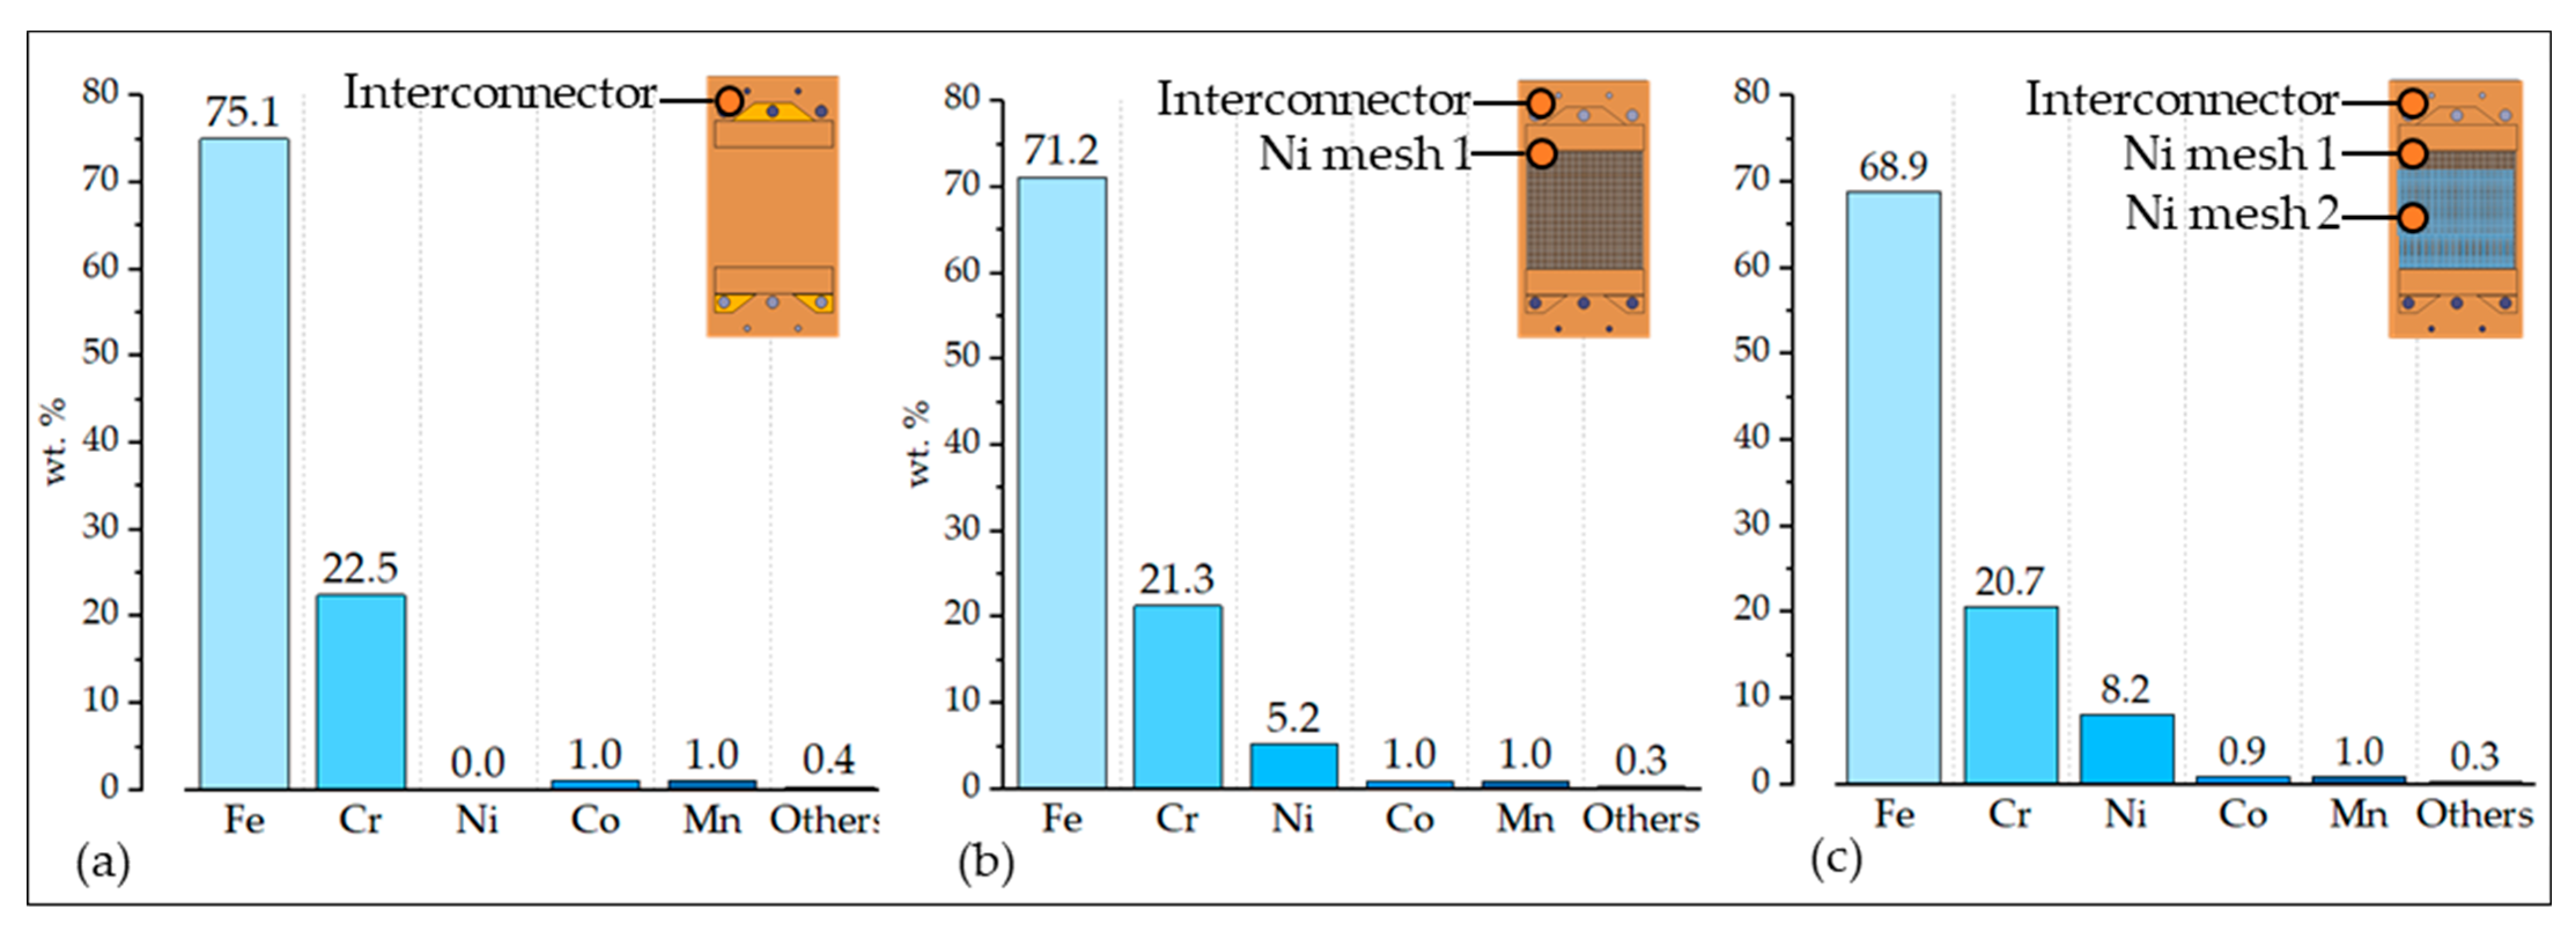
Figure 7.
Composition of the interconnect assembly (a) without Ni meshes, (b) with Ni mesh 1, and (c) with Ni meshes 1 and 2.
Figure 8.
Weight change (%) in remelted and smelted samples as a function of P(O2). Initial weights correspond to sample weight for remelting and sample and flux total weights for smelting experiments, respectively.
Figure 9.
TGA profiles for remelted and smelted samples at 1600 °C as a function of P(O2): (a,d) P(O2) = 0.08 bar, (b,e) P(O2) = 0.17 bar, and (c,f) P(O2) = 0.33 bar, respectively. Weight changes (%) are indicated by blue solid lines, while temperature–time profiles are depicted by red solid lines. Vertical red dotted lines mark the approximate start and end temperatures for oxidation reactions. Sample weights exhibited a dramatic increase with increasing P(O2) from specific start temperatures and slowed down upon cooling from the maximum temperature. Notably, smelted samples showed an earlier weight increase compared to remelted samples. Finally, vertical black dotted lines indicate the temperatures at which residual Ca(OH)2 presumably decomposed.
Figure 10.
Calculated equilibrium oxide phase distribution as a function of temperature under atmospheric air for (a) remelted and (b) smelted samples. Curves in the plots correspond to specific phases with the following color scheme: red for Fe2O3, green for spinel, black for Cr2O3, blue for slag and orange for wollastonite. Minor phases less than 2 wt.% fractions are excluded.
Figure 11.
BSE images of microstructures of the oxide phases in remelted samples and smelted samples under (
a,
e) P(O
2) = 0 bar, (
b,
f) 0.08 bar, (
c,
g) 0.17 bar, and (
d,
h) 0.33 bar, respectively. Mechanically entrained metallic phases were observed on oxide regions in R2 and S2. Short notations of the phase names are defined in
Table 7.
Figure 12.
Microstructural BSE images of the alloy of smelted samples with sample codes (a) S0 and (b) S1; (c) BSE image, (d) delta-ferrite, and (e) matrix phase maps derived from EDS mapping of the alloy region in S0.
Figure 13.
Phase fractions for all remelted and smelted samples, where F stands for ferrite, and M stands for the matrix (largely comprised of martensite with a minor amount of retained austenite).
Figure 14.
Elemental composition of remelted and smelted alloys at increasing P(O2).
Figure 15.
Logarithmic Loxide/metal values of main elements as a function of P(O2).
Figure 16.
Normalized weight percent distribution of (a) calculated equilibrium phases at 1600 °C and the elements (b) Cr, (c) Fe, (d) Ni, (e) Co, and (f) Mn to such phases. Minor phases less than 2 wt.% are excluded.
Figure 17.
XRD patterns reveal the presence of spinel phases with cubic symmetry, denoted by filled diamonds, within the oxide regions of smelted samples with sample codes (a) S3, (b) S2, and (c) S1, respectively. The identified hibonite phases, represented by empty circles, are likely transformation products resulting from the crystallization of liquid slag.
Table 1.
Nomenclature of acronyms.
| Acronym | Description |
|---|
| SEM | Scanning electron microscope |
| EDS | Energy-dispersive X-ray spectroscopy |
| ICP-OES | Inductively coupled plasma–optical emission spectroscopy |
| DTA | Differential thermal analysis |
| DSC | Differential scanning calorimetry |
| CAD | Computer-aided design |
| XRD | X-ray diffraction |
| BSE | Backscattered electrons |
| TGA | Thermogravimetric analysis |
| EBSD | Electron backscatter diffraction |
Table 2.
Experimental conditions.
| Experiment | Sample Code | Ar/O2 Gas Mixture (mL/min) | Calculated P(O2) (Bar) |
|---|
| Remelting | R0 | 60/0 | 0 |
| R1 | 55/5 | 0.08 |
| R2 | 50/10 | 0.17 |
| R3 | 40/20 | 0.33 |
| Smelting | S0 | 60/0 | 0 |
| S1 | 55/5 | 0.08 |
| S2 | 50/10 | 0.17 |
| S3 | 40/20 | 0.33 |
Table 3.
Elemental composition and standard deviation (wt.%) values of zonal specimens.
| Element | Zone 1 | Zone 2 | Zone 3 | Zone 4 | Zone 5 | Mean (Zones 2–5) |
|---|
| Fe | 76.3 ± 0.03 | 74.3 ± 0.60 | 73.76 ± 0.60 | 74.4 ± 0.60 | 73.7 ± 0.90 | 74.2 ± 0.63 |
| Cr | 22.9 ± 0.11 | 22.2 ± 0.10 | 22.0 ± 0.30 | 22.3 ± 0.30 | 22.2 ± 0.30 | 22.2 ± 0.24 |
| Co | 0.00 ± 0.002 | 1.83 ± 0.030 | 2.32 ± 0.040 | 1.21 ± 0.040 | 1.60 ± 0.040 | 1.74 ± 0.034 |
| Mn | 0.52 ± 0.005 | 1.45 ± 0.050 | 1.77 ± 0.050 | 1.15 ± 0.050 | 1.31 ± 0.050 | 1.42 ± 0.045 |
| La | 0.09 ± 0.003 | 0.09 ± 0.003 | 0.09 ± 0.003 | 0.81 ± 0.007 | 0.58 ± 0.019 | 0.39 ± 0.009 |
| Ni | 0.02 ± 0.001 | 0.02 ± 0.001 | 0.02 ± 0.001 | 0.06 ± 0.002 | 0.09 ± 0.001 | 0.05 ± 0.001 |
| Traces | 0.13 ± 0.005 | 0.08 ± 0.008 | 0.05 ± 0.003 | 0.05 ± 0.003 | 0.05 ± 0.002 | 0.06 ± 0.005 |
Table 4.
Component volumes and masses.
| Component | Volume (mm3) | Mass (g) |
|---|
| Interconnector * (Zone 1) | 21,564.60 | 166.0 |
| Interconnector (Zones 2–5) | 29,694.51 | 228.6 |
| Ni mesh 1 ** | 2424.10 | 21.6 |
| Ni mesh 2 | - | 13.6 |
Table 5.
Elemental composition (wt.%) of selected steel products from AISI 4xx, 2xx, and 3xx series.
| AISI Series | Grade | EN No. | Fe | C | Cr | Ni | Mn | Si | Others | Others | Ref. |
|---|
| 4xx | Crofer 22 APU | 1.4760 | Bal | ≤0.030 | 20.0/24.0 | - | 0.50 | ≤0.50 | ≤0.050 P | ≤0.020 S | [24] |
| 2xx | 2304 | 1.4362 | Bal | ≤0.030 | 22.0/24.0 | 3.5/5.5 | ≤2.00 | ≤1.00 | ≤0.035 P | ≤0.015 S | [26] |
| 3xx | 304 | 1.4301 | Bal | ≤0.07 | 17.5/19.5 | 8.0/10.0 | ≤2.00 | ≤1.00 | ≤0.045 P | ≤0.015 S | [26] |
Table 6.
Mean and standard deviation (wt.%) values of predicted elemental composition of representative samples.
| Element | Composition (wt.%) |
|---|
| Fe | 68.4 ± 0.43 |
| Cr | 20.2 ± 0.61 |
| Ni | 8.5 ± 0.25 |
| Co | 1.3 ± 0.01 |
| Mn | 1.0 ± 0.35 |
| La | 0.3 ± 0.15 |
| Traces | 0.1 ± 0.02 |
Table 7.
Oxide phases observed on the alloy–oxide interfaces in remelted and smelted samples. Chemical compositions of slags exclude minor phases constituting less than 2 wt.%.
| Sample Code | Phase | Stoichiometric Formula/
Chemical Composition | Short Notation |
|---|
| R0 | Spinel | Cr2.4(Mn, Al)0.8O4 | Spin |
| Lanthanum chromium oxide | CrLaO3 | CrLa |
| R1 | Spinel | (Cr)2(Fe, Mn, Ni)O4 | Spin |
| Chromia | Cr2O3 | Chro |
| R2 | Spinel | Cr2FeO4 | Spin |
| Wüstite | FeO | Wus |
| R3 | Spinel | (Cr, Fe)2(Ni, Co, Fe)O4 | Spin |
| Hematite | Fe1.5(Cr, Ba, La)0.5O3 | Hem |
| S0 | Hibonite | (Ca)(Al0.9Cr0.1)12O19 | Hib |
| Calcium aluminosilicate | Ca2Al2SiO7 | CAS |
| Anorthite | CaAl2Si2O8 | Ano |
| S1 | Spinel | (Cr0.9Al0.1)2(Fe0.7Ni0.10Mn0.20)O4 | Spin |
| Chromia | Cr1.8Al0.2O3 | Chro |
| Slag | 26CaO-46SiO2-25Al2O3-3FeO (wt.%) | Slag |
| S2 | Spinel | (Cr0.9Al0.1)2(Fe0.8Mn0.20)O4 | Spin |
| Slag | 13CaO-66SiO2-12Al2O3-9FeO (wt.%) | Slag |
| S3 | Spinel | Cr2FeO4 | Spin |
| Slag | 11CaO-61SiO2-11Al2O3-17FeO (wt.%) | Slag |
Table 8.
List of resulting equilibrium phases. Sublattice constituents with site fractions below 10−3 are excluded in the reference formula.
| Phase | Reference Formula |
|---|
| Liquid metal | (Fe, Cr, Ni, Mn, Co) |
| Silicate | (Ca+2, Mn+2)2(Si+4)(O−2)4 |
| Chromia | (Cr+3)2(O−2)3 |
| Wüstite | (Fe+2)(O−2) |
| Spineltetragonal | (Cr+3, Mn+2)2(Cr+3)(O−2)4 |
| Spinelcubic | (Cr+3, Fe+2, Fe+3, Co+2, Ni+2)2(Fe+2, Fe+3, Cr+3, Co+2, Ni+2)(O−2)4 |
| Liquid slag | (Fe+2, Fe+3, Cr+2, Cr+3, Ni+2, Co+2, Mn+2, Mn+3, Si+4, Ca+2)x(O−2)y |


 ,
, 


