Article

Molecular Dynamics Research on Fe Precipitation Behavior of Cu95Fe5 Alloys during Rapid Cooling

College of Metallurgy and Energy, North China University of Science and Technology, Tangshan 063210, China
*
Author to whom correspondence should be addressed.
Metals 2024, 14(2), 228; https://doi.org/10.3390/met14020228
Submission received: 15 January 2024 / Revised: 27 January 2024 / Accepted: 9 February 2024 / Published: 13 February 2024

Abstract

:
To investigate structural changes, the Cu95Fe5 alloy system was subjected to cooling rates of 1 × 10¹³ K/s, 2 × 10¹² K/s, 2 × 10¹¹ K/s, and 2 × 10¹⁰ K/s using the molecular dynamics simulation method. The results revealed that decreasing the cooling rate caused an increase in the phase transition temperature. Further, the structure of the alloy system exhibited a tendency towards increased stability following cooling at lower cooling rates. The Fe precipitation behavior of the Cu95Fe5 alloys during cooling at the rate of 2 × 10¹⁰ K/s was further explored, with the results suggesting that the formation and growth of the Fe cluster is a continuous process governed by the nucleation and growth mechanism. The size and number of Fe clusters formed at different stages were found to be affected by three factors, namely, the interaction force between the Fe atoms, the diffusion ability of the Fe atoms, and the interfacial energy between the Fe cluster and Cu matrix. When the alloy temperature exceeded 1400 K, the accumulation of the Fe atoms was facilitated by their strong interaction. However, the high temperatures and the large diffusion coefficient of the Fe atoms acted as inhibitors to the growth of Fe clusters, despite the intense thermal activities. As the temperature was reduced from 1400 K to 1050 K, the Fe atoms moved with a reduced intensity in a narrower area, and both the number of Fe atoms in the largest cluster and the number of clusters increased due to the action of the interaction force between the Fe atoms. Upon lowering the temperature from 1050 K to 887 K, the size of the largest Fe cluster increased rapidly, while the number of clusters decreased gradually. The growth of the largest Fe cluster could be partly attributed to the diffusion of single Fe atoms into the cluster under the action of the interaction force between the Fe atoms, in addition to the gathering and combination of multiple clusters. When the temperature was lowered from 967 K to 887 K, the diffusion coefficient of the Fe atoms approached 0, indicating that the non-diffusive local structure rearrangements of atoms dominated in the system structure change process. The interface energy governed the combination of the Fe clusters in this stage. At a temperature below 887 K, the alloy crystallized, the activities of the Fe atoms were reduced due to a low temperature, and the movement range of the Fe atoms was small at a fast cooling rate. As such, both the size and number of Fe clusters showed no obvious changes.

1. Introduction

Cu-Fe alloys have been extensively applied in the aviation, automotive, and electronics industries owing to their low cost, abundant raw materials, and significant magnetoresistance effect [1,2]. Due to increasing demand for high-quality raw materials across various industries, the performance of Cu-Fe alloys has become increasingly vital. Cu-Fe alloys are typical precipitation-strengthened immiscible alloys. Fe exhibits a high solid solubility in the Cu matrix at high temperatures. In the conventional casting process, Fe atoms slowly precipitate from the Cu-Fe solid solution and accumulate to incur segregation, severely impairing the mechanical properties and electrical conductivity of alloys [3,4,5]. Research has shown that the distribution and shape of Fe within alloys can considerably affect their mechanical properties and electrical conductivity [6,7]. Thus, scholars are generally concerned with removing as many Fe atoms as possible from the Cu matrix and achieving a uniform distribution of Fe atoms without experiencing segregation.
One commonly employed method for producing Cu-Fe alloys is rapid cooling. Such a process significantly increases the solid solubility of Fe in Cu, reduces the residual Fe content in the Cu matrix, and mitigates chemical microsegregation. Subsequent aging treatment promotes the separation of Fe from the solid solution and enhances the dispersion of α-Fe phases, leading to substantial improvements in tensile strength, wear resistance, and corrosion resistance while maintaining the good electrical conductivity of the alloy [8,9,10]. Chen et al. [11] prepared Cu-Fe alloys via the rapid cooling process and found that with the increase in the cooling rate, the number of Fe-rich spheres in the microstructure increased. However, the size of the spheres was reduced, and the alloy microhardness was strengthened. The focus of the vast majority of experimental research has been on analyzing the microstructure, morphology, and mechanical properties of high Fe-content alloys cooled at different rates (achieved by different experimental methods). Meanwhile, there has been a scarcity of research on the precipitation mechanism of Fe clusters. The molecular dynamics (MD) method allows researchers to directly and distinctly observe the macroscopic deformation of crystalline materials, and can reveal the micro-mechanisms underlying the deformation. Syarif [12] used the MD simulation method to simulate the severe plastic deformation of single crystal Cu, and to examine the evolution of dislocation structures (for example, dislocation proliferation, dislocation pile-ups, and grain boundary movement) in the deformation mechanism of face-centered cubic nano-crystalline metals. The impact on the macroscopic properties was also explored. Yi Xuehua [13,14,15] employed the MD method to investigate the dynamic behavior of liquid Cu clusters during rapid cooling. Findings were made that in the presence of small cluster sizes, local structural modifications of atoms were predominantly characterized by atom diffusion. With the growth of the cluster, there was nucleation that could be ascribed to non-diffusive rearrangements of atoms. Cui Wenchao [16,17] explored the phase separation of Fe-Cu alloys. The results suggested that in undercooled Fe50Cu50 alloys, grid structures formed and coarsened, and then droplets migrated and mixed together. Using the MD approach, Zhang Haichao [18] investigated the precipitation pattern of Cu in steel and its effects on the microstructure and properties of steel. Findings were made that both the vacancies and the increase in Cu content in steel promoted the diffusion of Cu atoms, and the growth of Cu precipitates accelerated with the increase in Cu content.
In consideration of the current research status, the aim of the present study was to use the MD method to analyze the Fe precipitation behavior of and structural changes in Cu95Fe5 alloys during rapid cooling, as well as the formation and precipitation mechanism of Fe clusters, simulate the solidification process of the alloy at higher cooling rates, and compare or predict the results of an experiment. The structural changes in Cu95Fe5 alloys were explored by calculating the variations in the average potential energy, radial distribution function, coordination number, and mean square displacement with the alloy temperature. Moreover, the changes in the size and number of Fe clusters formed were visualized based on the atomic structure, so as to identify the mechanism underlying the effect of the 2 × 10¹⁰ K/s cooling rate on the Fe precipitation behavior of Cu95Fe5 alloys.

2. Simulation Method

Based on existing research, the Cu95Fe5 alloy model was established using Atomsk (Pierre Hirel 2010-Version 0.11) (The Swiss-army knife of atomic simulations) [19] software. Specifically, the unit cell of a Cu single crystal was constructed first, and then copied to generate a 30 × 30 × 12 supercell. There were 43,200 Cu atoms in total in the simulation box, of which 2160 were replaced randomly by Fe atoms to create the alloy model needed for simulation. Subsequently, MD simulation analysis was conducted using the large-scale atomic/molecular massively parallel simulator (LAMMPS) designed and developed by Sandia National Laboratory, USA [20]. During the simulation process, the separation of Fe atoms from Cu-Fe alloys was modeled using the interaction potential function introduced by Bonny et al. [21], which has been commonly applied to investigate the phase separation phenomenon in Fe-Cu alloys over the past several years [22]. The NPT ensemble was implemented in all the MD simulation steps, and a time step of 2 fs was selected as the periodic boundary condition. The system pressure was fixed at 0 bar and the Nose–Hoover algorithm was employed to regulate both the pressure and temperature of the system. The simulation was conducted in the periodic boundary conditions. The model firstly ran 300,000 time steps at 2200 K, so as to allow for the atoms to diffuse fully and the alloy system to reach the equilibrium state. The alloy was then cooled to 300 K at the rate of 2 × 10¹⁰ K/s. The rapid cooling process was achieved through the specification of a total number of time steps for the simulation, which was set to 4.75 × 10⁷ in this study. The structural information, kinetic, and thermodynamic parameters of the alloy system were recorded in the simulated cooling process. Finally, OVITO (OVITO is 3.8.3) [23] software was used to visualize the simulation results, and common neighbor analysis and cluster analysis were performed to examine the crystal microstructure, formation, and growth patterns of the Fe clusters in the simulation process.

3. Results and Discussion

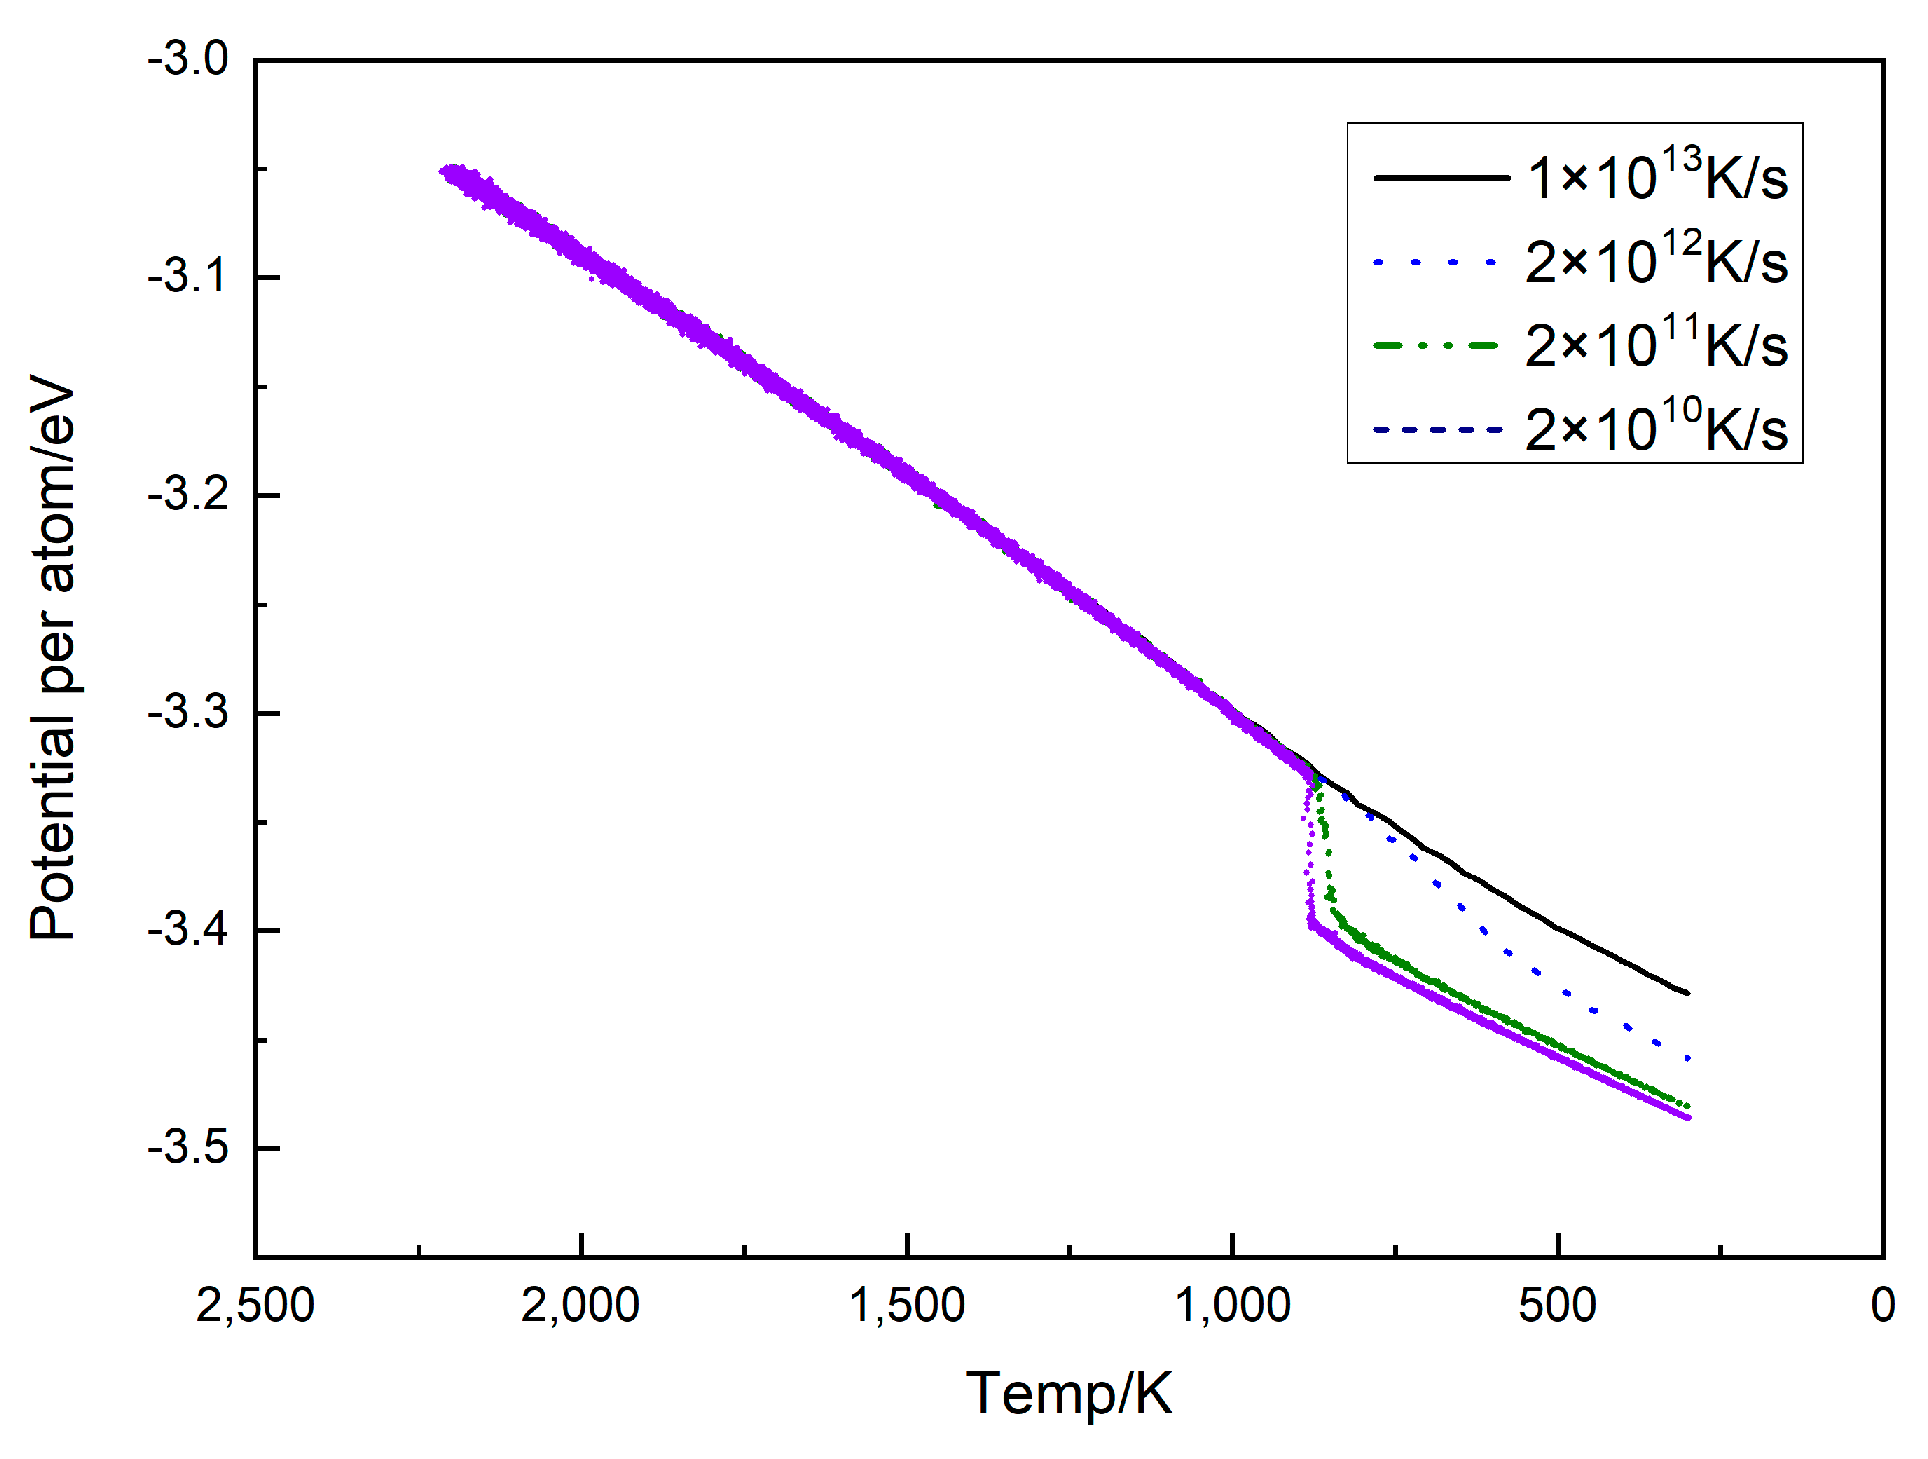
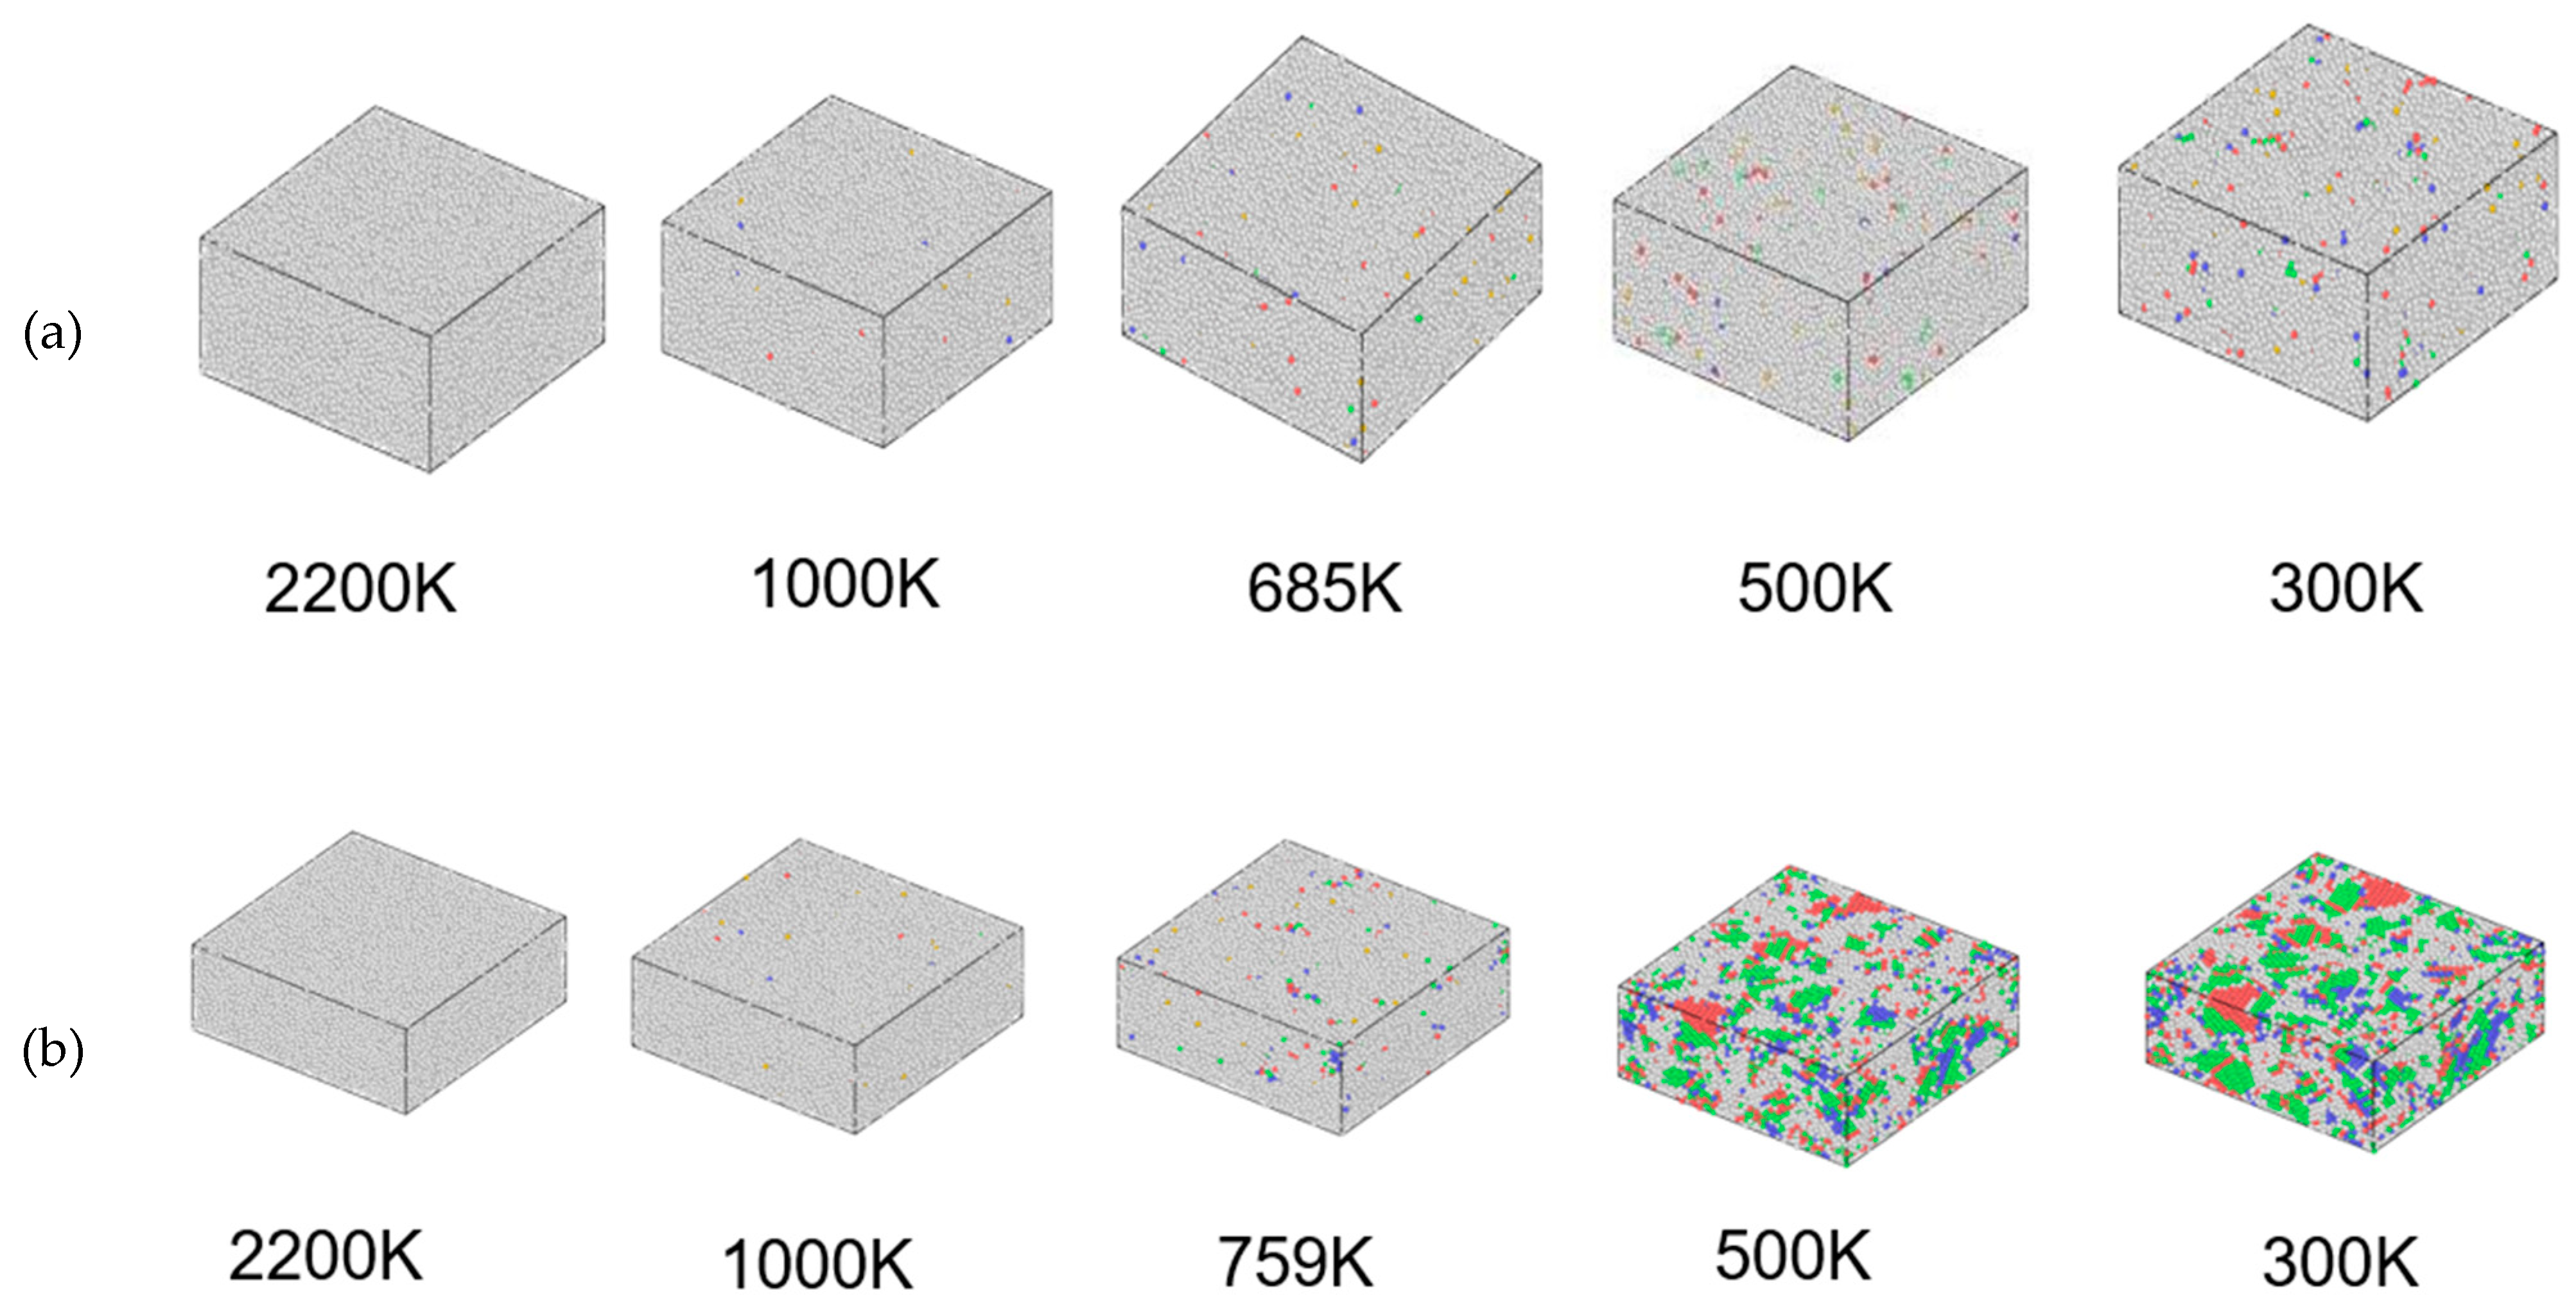
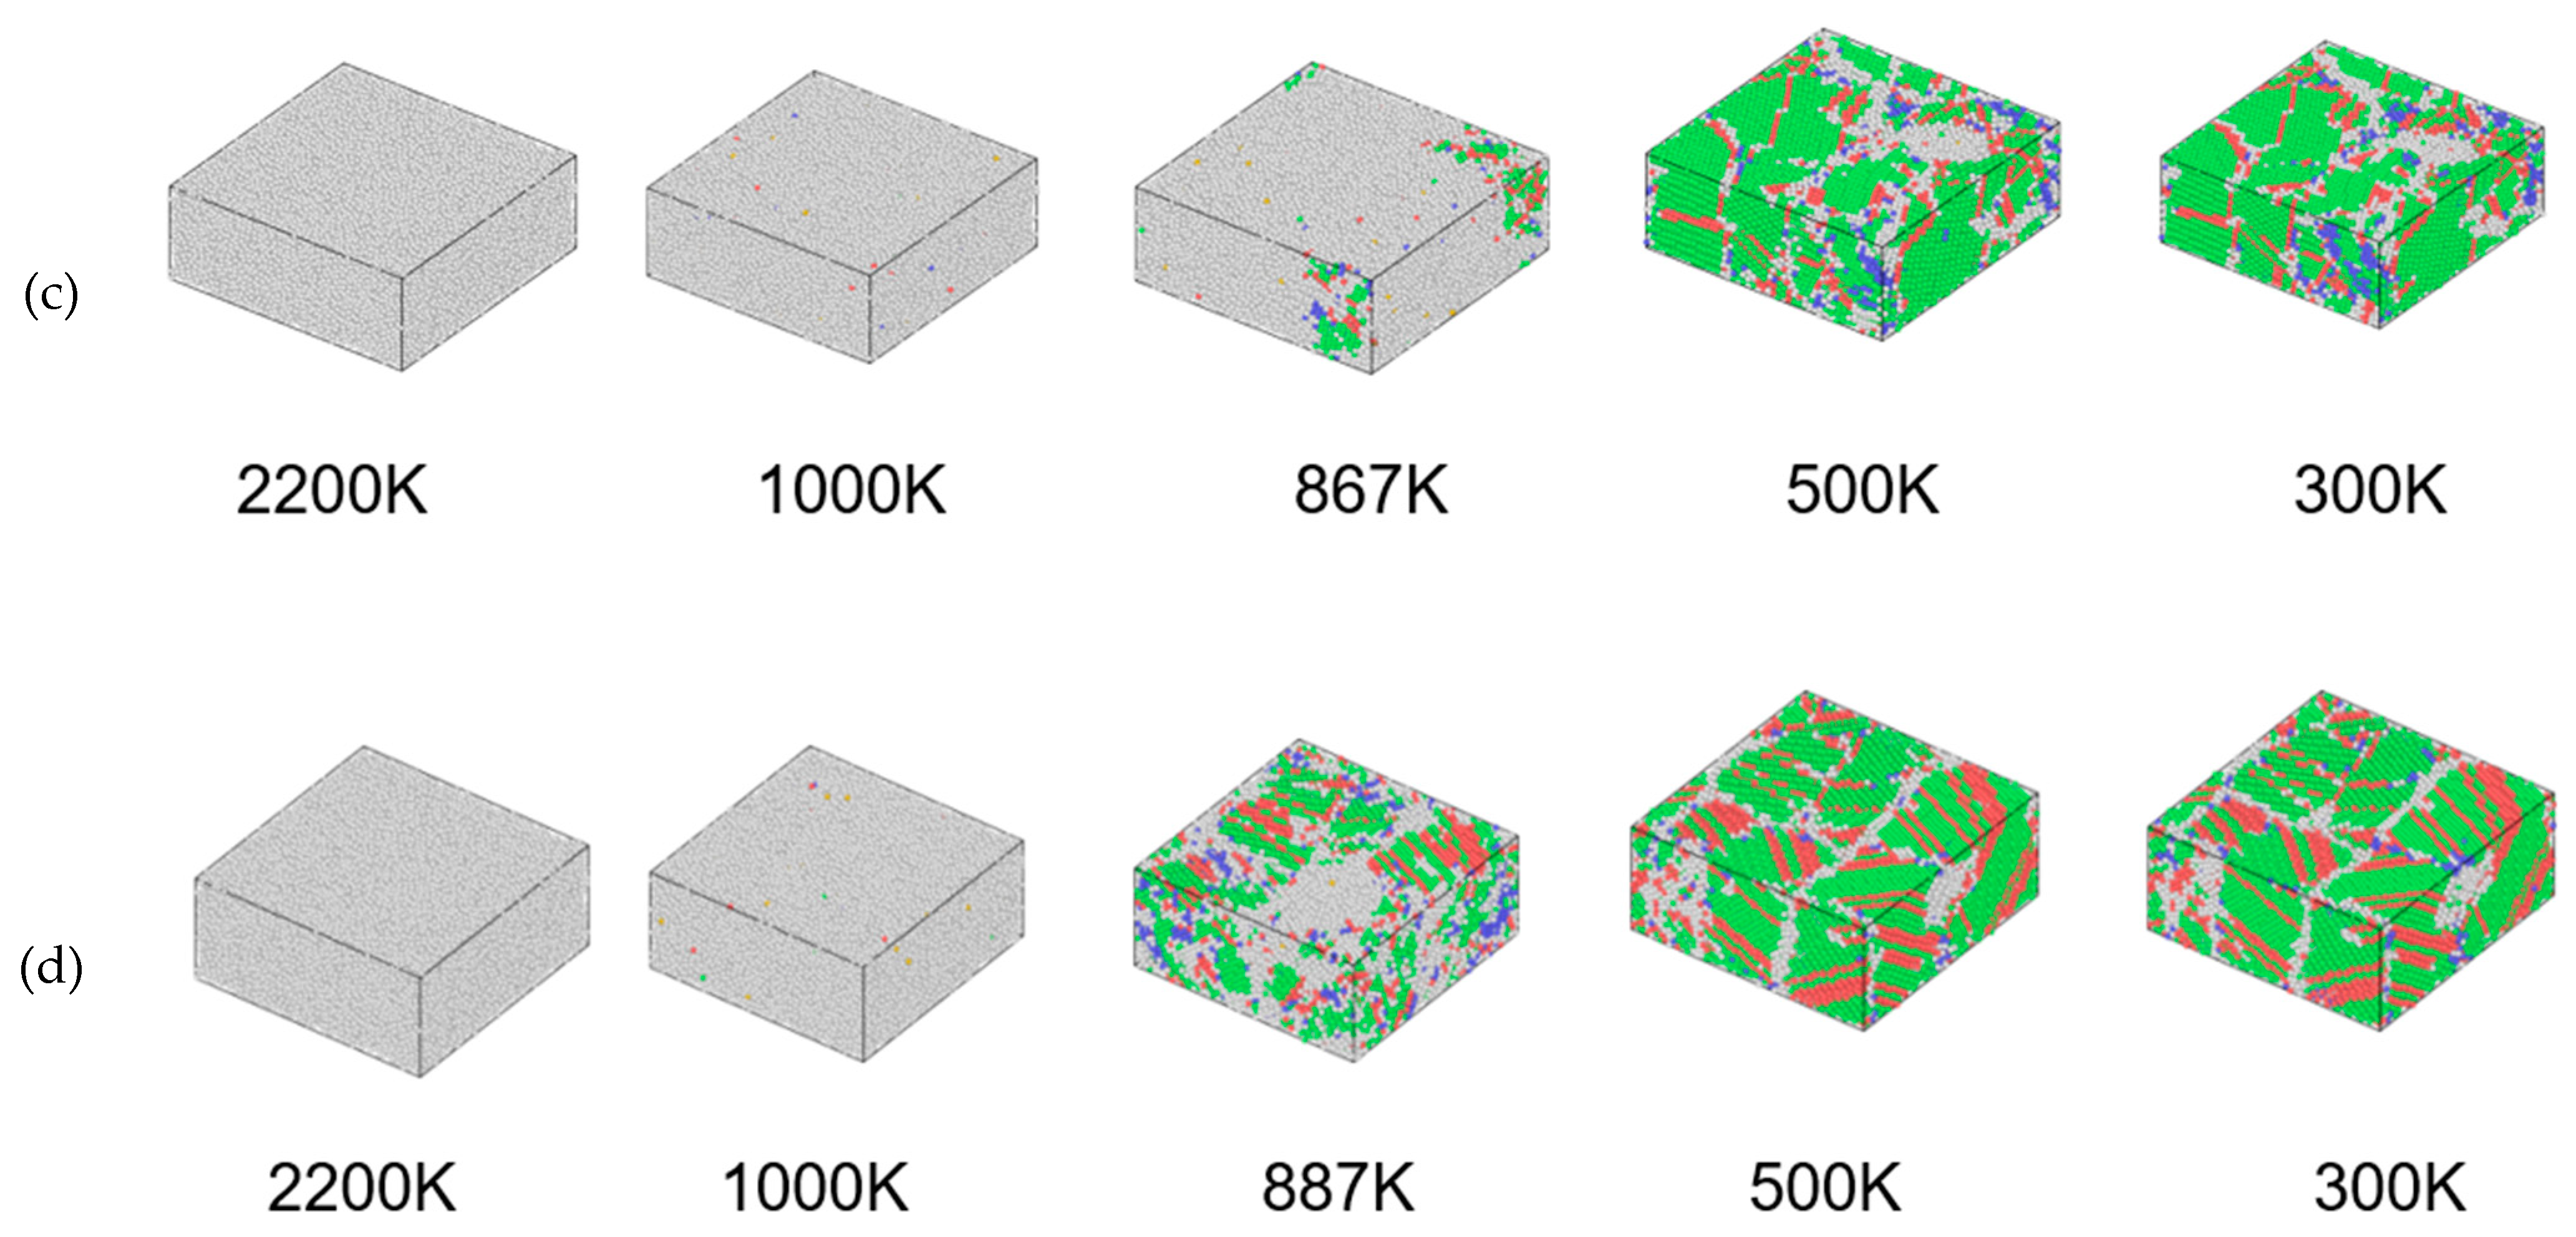
3.1. The Influence of the Cooling Rate on the Cu95Fe5 Alloy Structure

The variation curve of the average atomic potential energy with the temperature is an accurate and objective indication of the microstructural changes in the alloy system during rapid cooling. The curve enables a simple and direct analysis of the phase transition process of the system. In general, when the curve is a straight line, it indicates the absence of a phase transition in the system. If the curve deviates from the straight line and changes gradually, but not abruptly, a phase transition occurs, and amorphous structures are formed. If the curve deviates significantly from the straight line and changes suddenly, crystals are generated in the system [24,25,26]. The change curves of the average atomic potential energy with the temperature for cooling rates of 1 × 10¹³ K/s, 2 × 10¹² K/s, 2 × 10¹¹ K/s, and 2 × 10¹⁰ K/s are shown in Figure 1.
With the decline in the temperature, the thermal activity of the atoms in the system was gradually abated and the atom movement speed gradually slowed down in the simulation process. Such changes allowed for the atoms to more easily combine and form ordered structures, thereby reducing the system volume. The volume shrinkage and altered atomic position led to the reduction in the system energy. When the system volume dwindled to a certain degree, local clusters that were already formed in the alloy were broken quickly and the atoms reunited to produce more stable structures. Such a process is referred to as crystallization, where there is a sudden reduction in the system energy, corresponding to a sudden change in the curve of the average atomic potential energy and temperature.
At the cooling rate of 1 × 10¹³ K/s, the average atomic potential energy reduced continuously with the gradually lowering alloy temperature. An observation can be made that the APE-Temp curve is not linear, and there is a subtle breakpoint that appears around 685 K. Such findings indicate that the system underwent phase transformation and amorphous structures formed at 685 K. At the cooling rate of 2 × 10¹² K/s, the APE-Temp curve is continuous without sudden changes, but both the bending degree of the curve and the breakpoint temperature are higher than those at 1 × 10¹³ K/s. The APE-Temp curves at cooling rates of 2 × 10¹¹ K/s and 2 × 10¹⁰ K/s show abrupt changes at 867 K and 887 K, respectively, suggesting that crystals were generated in the system. The APE-Temp curves indicate an increase in the phase transition temperature with decreasing cooling rates. Lower cooling rates correspond to a decrease in the average atomic potential energy and increased structural stability of the system following phase transition. To facilitate the observation of the crystallization process of alloys at different cooling rates, visualization software was used to further analyze the crystal configuration. In Figure 2, the color gray represents crystal classes that are classified as “other” (not belonging to any of the common crystal classes), green indicates the crystal type as FCC, blue signifies the crystal type as BCC, and red denotes the crystal type as HCP.
According to Figure 2 and Table 1, at a temperature of 300 K and a cooling rate of 1 × 10¹³ K/S, there were few crystal structures in the alloy, and the sum of atoms in the FCC, HCP, and BCC crystal structures accounted for 4.8% of the total number of atoms. As the cooling rate decreased, more crystal structures formed in the alloy system, and the crystallization process was continuous. When the cooling rate was reduced to 2 × 10¹⁰ K/s, the sum of the atoms in the FCC, HCP, and BCC crystal structures occupied 82% of the total number of atoms at 300 K. The sum of atoms in the crystal structures to the total number of atoms at the cooling rate of 2 × 10¹¹ K/s was slightly different from that at 2 × 10¹⁰ K/s. Compared with that at 2 × 10¹¹ K/s, the alloy crystallized more thoroughly after cooling at 2 × 10¹⁰ K/s. As such, to obtain a more representative understanding of Fe precipitation behavior in Cu95Fe5 alloys, investigation into their cooling process at a rate of 2 × 10¹⁰ K/s would be more appropriate. Further analysis of such a condition was subsequently conducted.

3.2. Structural Changes in the Cu95Fe5 Alloy System during Cooling

To analyze the variation in the crystal type with the temperature, the proportions of different crystal types at different temperatures were extracted using visualization software (Figure 3). At the cooling rate of 2 × 10¹⁰ K/s, the atoms were irregularly distributed liquid in the alloy temperature range of 2200–887 K. At 887 K, the alloy began to crystallize. In the temperature range of 500 K and 300 K, the alloy appeared in the form of crystals. Such findings are consistent with the aforementioned results.
According to Figure 3, the system remained in a liquid state between 2000 K and 887 K, and no crystal formation was observed during such a temperature range. The other feature observed in the figure does not correspond to any known crystal type, but is instead believed to be a vacancy defect in the lattice. As the temperature was decreased from 887 K, the number of BCC, HCP, and FCC crystal structures increased significantly in the alloy. More specifically, the proportions of FCC and HCP crystal structures increased swiftly in the range of 887–850 K but slowly in the range of 850–300 K. Different from that of the FCC and HCP crystal structures, the proportion of BCC crystal structures surged in the early crystallization stage (887 K) but decreased after reaching the peak. The smallest proportion was achieved at around 800 K, and subsequently, the proportion exhibited slow growth. Based on the formation process of Fe clusters, the reason for the sudden decline in the quantity of BCC crystal structures in the early crystallization stage could be deduced as follows. Because the Fe cluster formation is a continuous process, there were already large or small Fe clusters in the system before the alloy crystallization. Once the crystallization temperature was reached, the Fe clusters quickly turned into BCC crystals. However, the proportion of Fe atoms in the system was 5%, far less than that of Cu atoms (95%). As the temperature of the alloy decreased, some of the small clusters fragmented into individual atoms or merged to form densely packed Cu-based FCC and HCP crystal structures. Ultimately, the Fe-embedded Cu matrix was found to predominantly consist of FCC and HCP crystal structures. The proportion of BCC crystals increased slowly at low temperatures because few Fe atoms moved towards Fe clusters and were incorporated into a larger cluster. As such, the alloy was liquid above 887 K in the simulation process, and began to crystallize at 887 K. The proportions of FCC and HCP crystals increased dramatically in the range of 887–850 K, and the growth rate decelerated below 850 K. The proportion of BCC crystals increased first, before decompensation into FCC and HCP crystals. Finally, Cu-Fe alloys mainly containing FCC and HCP crystals and a small number of BCC crystals were formed.
The radial distribution function is expressed with g ( r ) , a statistical parameter representing the distribution characteristics of atoms in a system. g α β ( r ) is physically defined as the ratio of the probability for the α atom to have a neighbor of the β atom at a given distance r to the conditional probability [27,28].
g α β ( r ) = L 3 N α N β i = 1 N α N i β ( r ) / ( 4 π r 2 r )
The categories of atoms are denoted by α and β, while L represents the side length of the simulation system box. Nα and Nβ indicate the respective numbers of α and β atoms. N i β ( r ) denotes the number of β atoms in the spherical shell from the i-th α atom r to r + r , and r represents the thickness of this shell.
The radial distribution function provides valuable structural information, such as the atomic radius, atomic spacing, and coordination number, which enables differentiation between the liquid, crystalline, and amorphous phases. Moreover, the interaction intensity between atoms and the short- and medium-range order can be determined based on the change pattern of the peak in the radial distribution function curve [29,30,31,32]. The radial distribution function curves of Cu95Fe5 alloys in the temperature range of 2000–300 K at the 2 × 10¹⁰ K/s cooling rate are depicted in Figure 4.
In the temperature range of 2000–887 K, the first peak in the radial distribution function curve is not sharp and has an obvious symmetric peak, suggesting that the alloy was liquid. In the temperature range of 887–300 K, the first peak is sharp and greatly higher than other peaks, indicating that the system was in a crystal state. Such findings are consistent with the aforementioned analysis results.
The first peak value of g F e F e ( r ) was greater than that of g C u F e ( r ) and g C u C u ( r ) , and the difference gradually increased with the decrease in the system temperature. Such findings show that the system was more inclined to form Fe-Fe pairs than Cu-Fe and Cu-Cu pairs, and the attractive force between the Fe atoms was larger than that between the Cu and Fe atoms and between the Cu atoms. At high temperatures, g C u F e ( r ) and g C u C u ( r ) almost overlapped. When the temperature was below the phase transition temperature, g C u C u ( r ) was located above g C u C u ( r ) . According to the definition of g ( r ) , the ratio of the probability of a Cu atom having a neighboring Cu atom to the conditional probability is equivalent to the ratio of the probability of a Cu atom having a neighboring Fe atom to the conditional probability at high temperatures, which is related to a small quantity of Fe atoms. With the decrease in the system temperature, the first peak value for the Fe-Fe pairs increased, indicating that the Fe atom was more likely to have a neighboring Fe atom and the bond between the Fe atoms was tighter at low temperatures. The second peak in the radial distribution function curve is closely related to the medium-range structures in the system. A conclusion could be drawn from the definition of the radial distribution function curve that g α β ( r ) 1 , implying there was no connection between the atoms. Although the content of the Fe atoms is low in the Cu95Fe5 system, the second peak value of g F e F e ( r ) increased with the decrease in the temperature. At 300 K, the overall g F e F e ( r ) curve is located above 1, suggesting that the nearest and second-nearest neighbors of the Fe atoms were all Fe atoms. However, the second peak values of g C u F e ( r ) and g C u C u ( r ) decreased with the lowering temperature, being smaller than 1 at 300 K. Such results show that the probability for a Cu atom to have a neighbor of Fe or Cu is the same as the conditional probability, and there is no relevance between atoms. Due to the low content of Fe atoms, the Fe clusters formed were small in number, compared with the Cu atoms. Thus, the neighboring sites of the Cu atoms were inevitably occupied by Fe atoms, and the first peak value of the Cu-Fe pairs was greater than 1. Thus, a conclusion could be drawn that in the simulation process of the Cu95Fe5 system, the interaction force between the Fe atoms was stronger than that between the other atoms, acting as a driving force for the formation of Fe clusters. During the formation of Fe clusters, Fe atoms are more likely to combine with Fe atoms at low temperatures, and a larger proportion of Fe atoms tend to have Fe atoms as the nearest and second-nearest neighbors, thereby facilitating the formation of Fe clusters.
The coordination number (CN) is an indicator of the local combination of atoms in alloys and the short-range order of the atom arrangement. Such an indicator can be used to describe how closely the atoms are arranged [33,34]. The coordination number method is a statistical approach that involves investigating the arrangement law of the nearest neighbors of atoms. A rise in the coordination number suggests that the local packing density of atoms increases [35,36,37]. Figure 5 describes the variation in the coordination number with the temperature in simulated conditions. The coordination number was obtained from the radial distribution functions.
At 2000 K, the coordination number of the Cu-Cu pairs was 11.8078, far greater than 0.88302 of the Fe-Fe pairs and 0.58139 of the Cu-Fe pairs. As the temperature decreased, the coordination number of the Cu-Cu pairs increased, attaining the largest value at 887 K. Subsequently, the coordination number decreased, and the alloy began to crystallize. At 800 K, the crystallizing process was almost complete, and the coordination number of the Cu-Cu pairs remained basically unchanged as the temperature continued to drop. The coordination number was 11.4232 at 300 K. Different from the variation curve of the coordination number of the Cu-Cu pairs with the temperature, the coordination number of the Fe-Fe pairs exhibited evident changes. The coordination number of the Fe-Fe pairs was 0.88302 at 2000 K and increased with the decline in the temperature. The growth rate of the coordination number of the Fe-Fe pairs accelerated greatly as the temperature dropped to below 1400 K, indicating that the Fe atoms were surrounded by an increasing number of Fe atoms, and the Fe atoms were arranged more closely. At a temperature of 887 K, the coordination number of the Fe-Fe pairs attained its maximum value of 3.52145. Subsequently, as the temperature decreased, the coordination number showed a slight decrease. There was a minimal change in terms of the coordination number of the Cu-Fe pairs, but there was evidence to suggest a decrease with the decline in the temperature. Such results demonstrate that the binding force between the Cu and Fe atoms was weak and there was a repulsive force between them. Based on the variation in the coordination number with the temperature, a conclusion could be drawn that Fe atoms are more likely to be the nearest neighbor of atoms. As the temperature decreased, the arrangement of the Fe-Fe pairs became more compact. The Fe atoms demonstrated a proclivity to actively combine with each other, which is evidenced by the continuous change in the coordination number with the temperature. Such findings indicate that the formation of Fe clusters is an ongoing process.
The atom diffusion process is a significant factor in the analysis of the atom precipitation mechanism, and thus, the diffusion coefficient of Fe atoms in the system needs to be calculated [38,39,40]. During the MD simulation of the alloy system, the diffusion coefficient of atoms is typically calculated by measuring the mean square displacement (MSD) [41,42] of atoms.
D * = lim t 1 2 N t < r t r ( 0 ) 2 >
where N is the dimension of the simulation system; N = 3 for the present system; t denotes the simulation time in ps; and r(t) and r(0) are the position of the atom at time t and its initial position, respectively.
M S D = < r 2 ( t ) > = 1 N i = 1 N < r t r ( 0 ) 2 >
where MSD is the mean square displacement;
Combining Formulas (1) and (2), the following can be obtained
D * = M S D 6 t M S D = 6 D * t
The diffusion coefficient of the Fe atoms was 1/6 of the slope of the relationship curve between the MSD and time t.
Figure 6 summarizes the MSD values of the Fe atoms along the X, Y, and Z directions at the cooling rate of 2 × 10¹⁰ K/S.
Between 0 and 61,404 ps (T = 967 K), the slope of the MSD and time curve decreased over time, indicating that the diffusion rate of the Fe atoms in the system decreased with the passing time. Such results could be attributed to the system temperature becoming increasingly lower over time, and at large undercooling, the thermal activities of the atoms were weakened and the atom movement range shrank. In the temperature range of 967–887 K, the slope of the curve is almost 0, suggesting that the diffusion rate of the Fe atoms decreased to 0, and the structural changes within the system were mainly non-diffusive local structural rearrangements of atoms. Non-diffusive local structural rearrangement refers to when a moving atom is still bound by its surrounding atoms, namely, there is no change in the local structure formed by the atom and its surrounding atoms. In contrast, diffusion movement pertains to a scenario in which the atom is released from the constraints of its neighboring atoms, leading to a modification in the local structure created by the atom and its surrounding atoms. As evidenced, the Fe atoms exhibited predominant diffusion behavior during the time interval of 0–61,404 ps, and the intensity of the diffusion activity declined gradually over time. At 65,510 ps, there is a break in the curve, indicating that crystallization took place. Subsequently, the curve shows minimal change, which could be mainly attributed to the narrowed movement range of the atoms caused by the low system temperature and fast cooling rate.

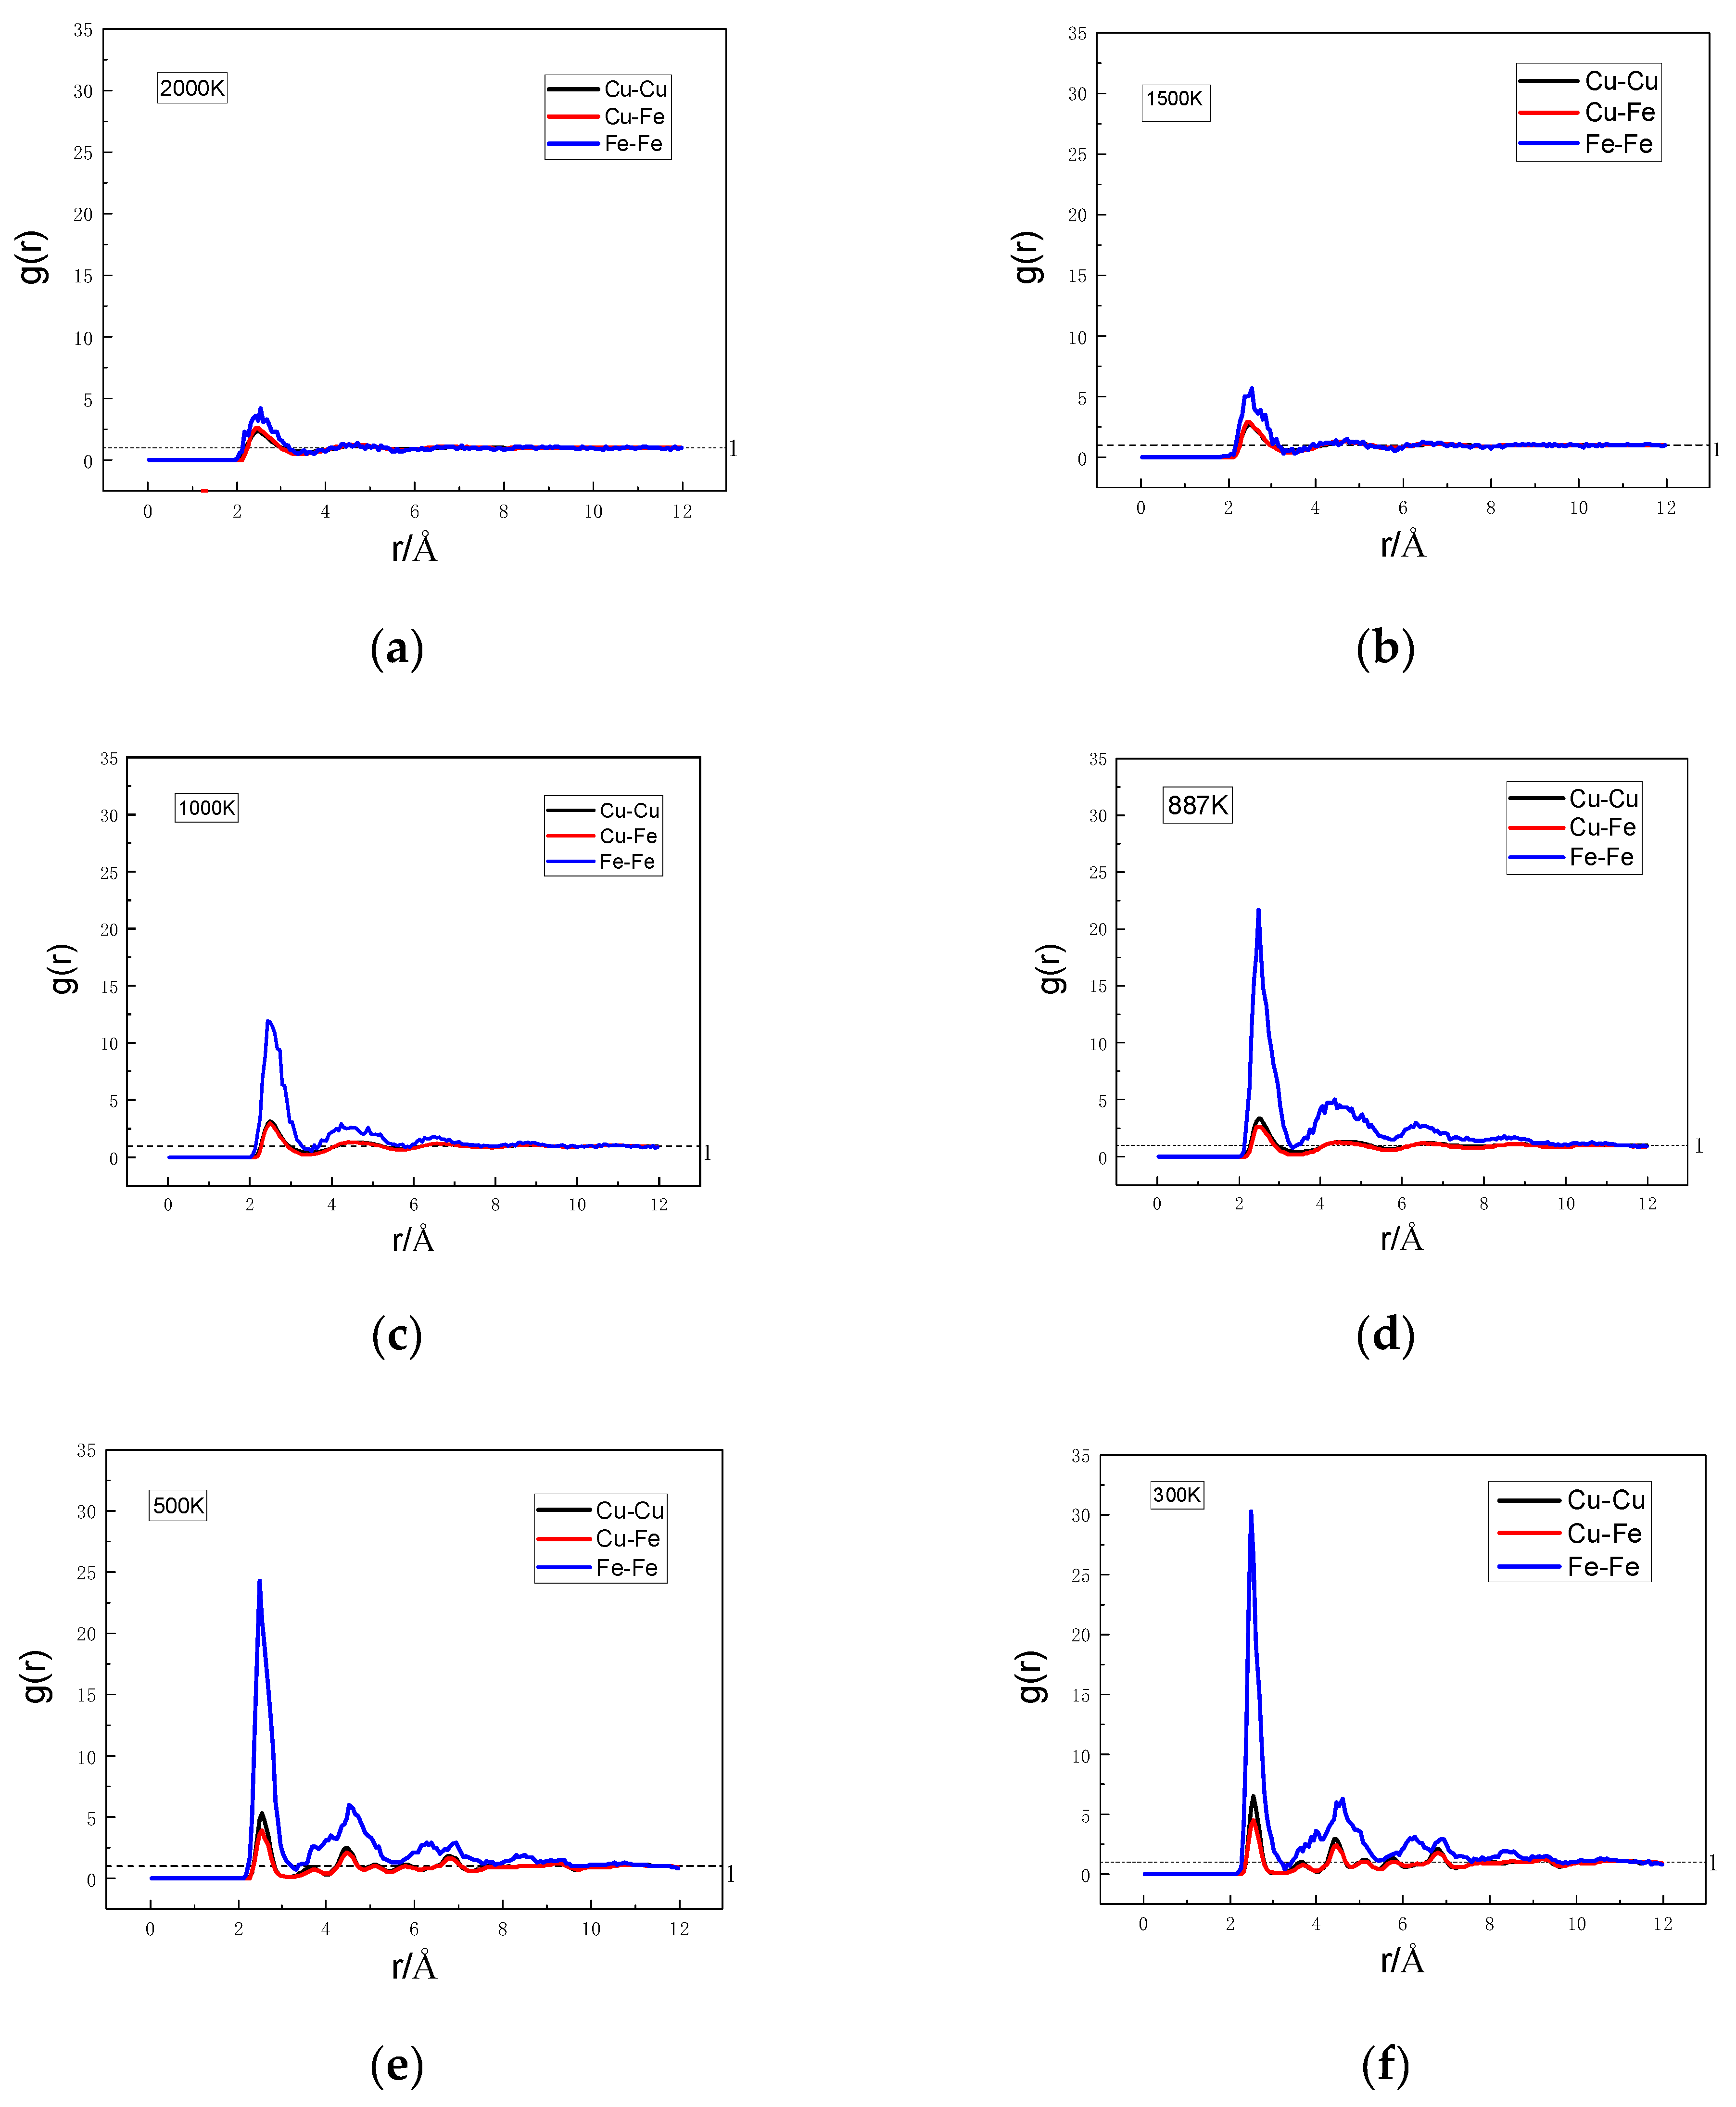
3.3. Formation Mechanism of Fe Clusters in Cu95Fe5 Alloys during Rapid Cooling

Figure 7 illustrates the distribution of the Fe atoms at different temperatures in the Cu95Fe5 alloy system cooled at 2 × 10¹⁰ K/S. At 2000 K, the Fe atoms were uniformly distributed in the system, and showed no structural heterogeneity. The distinct color categories depicted in Figure 7 and Figure 8 represent iron clusters comprising varying numbers of atoms. Each individual cluster is assigned a unique and non-repetitive random color label. With the decrease in the temperature, the Fe atoms gathered, and in the temperature range of 2000–887 K, small clusters were generated, which continuously grew to form non-uniformly distributed large clusters. The crystallization transition temperature of the system was 887 K. The size of the Fe clusters remained almost unchanged in the temperature range of 887–300 K, and the system structure was relatively stable. To facilitate the investigation into the formation and growth of the clusters, the largest cluster at 300 K was selected for analysis. Notably, the largest cluster at 300 K remained the largest in the range of 887–300 K (Figure 8).
At the temperature of 2000 K, the Fe atoms were uniformly distributed in the system, which exhibited uniformity and consistency. In the temperature range of 2000–1100 K, several small clusters were formed, but disappeared over time. In this stage, the Fe atoms gathered through diffusion, and the small clusters formed were unstable. The cluster formation–separation–formation process in this stage was governed by atom diffusion, which was affected by changes in the undercooling degree. At 1050 K, small Fe clusters were generated in the system, which continued to exist as the temperature dropped. The Fe atoms around the small clusters kept diffusing due to the strong interaction force between the Fe atoms, and the small clusters gradually increased in size. Under the action of the interface energy, the area of the interface between the clusters decreased, and the Fe atoms at the edge of the clusters tended to move towards the cluster center. The cluster demonstrated a proclivity to assume a spherical shape (Figure 8e,f). The growth of the cluster could be ascribed to the incorporation of surrounding individual Fe atoms into the cluster by the aforementioned means of diffusion, and to the aggregation and combination of two clusters. Figure 8f–h show the combination of two clusters in the temperature range of 950–915 K. A developing cluster underwent diffusion towards another cluster as a cohesive unit, driven by the mutual attraction between them, resulting in their merger and the formation of a larger cluster. In the temperature range of 915–887 K, the droplet size increasingly enlarged, leading to a greater decrease in both the interfacial energy and the interfacial area. The process of minimizing the interfacial area facilitated a faster transformation of clusters into spherical shapes (Figure 8h,i). At a temperature below 887 K, the system crystallization and high cooling rates resulted in a marked decrease in the diffusion rate of the atoms, and the morphology and size of the Fe clusters remained basically unchanged. As such, the formation of Fe clusters appeared to be controlled by the nucleation and growth mechanism. Under the action of the strong interaction between Fe atoms, the Fe atoms gathered and grew via diffusion. During rapid cooling, small clusters were formed in the range of 2000–1100 K but were unstable and easy to decompose. When the temperature was below 1050 K, the clusters were more stable, which could be mainly attributed to the reduced thermal activities and the significantly lowered diffusion property of the Fe atoms with the decrease in the temperature. The increase in Fe atoms in the cluster could be ascribed to the integration of surrounding single Fe atoms into the cluster via diffusion, and to the attraction, migration, and combination of two clusters to produce a large cluster. Since the interaction between the Fe atoms was stronger than that between the Fe and Cu atoms, the interfacial energy between the Fe clusters and Cu matrix was high. The presence of a high interfacial energy drove the minimization of the interfacial area, inducing a spherical shape preference in the clusters, consequently expediting the formation and growth of Fe clusters. Such a phenomenon shares similarities with oil droplets in water.
To further explore the relationship between the growth of Fe clusters and nucleation rate during rapid cooling, a graph was drawn (Figure 9), which shows the variations in the number of atoms in the largest cluster and the number of clusters containing more than five atoms with the temperature at different times. Since clusters containing fewer than five atoms exhibit instability, only those clusters containing more than five atoms were considered for counting purposes, thereby facilitating the subsequent analysis and discussion of the research outcomes.
The changes in the number of atoms in the largest cluster and the number of clusters with the temperature underwent four stages. The temperature range of the first stage was 2000–1400 K, when the number of atoms in the largest cluster was approximately 15, and remained basically unchanged as the temperature scaled down. Despite a slight change in the number of atoms in the largest cluster, the number of clusters in the system increased with the decrease in the temperature. In other words, the nucleation rate of the Fe clusters in such a temperature range increased steadily. The Fe atoms gathered to form small clusters under the action of the strong interaction between the Fe atoms. The slight variation in the quantity of atoms within the most extensive cluster could be ascribed to the heightened thermal agitation and substantial atomic diffusion rate at elevated temperatures. In such circumstances, the nearest-neighbor position of a Fe atom was occupied by another Fe atom, but the attraction force was not strong enough for other Fe atoms to hold the second- and third-nearest-neighbor positions. The second stage took place in the temperature range of 1400–1050 K. In this stage, the number of atoms in the largest cluster increased while the nucleation rate increased, and the number of atoms in the largest cluster steadily increased from 15 to 21. As the temperature decreased, both the thermal activities and diffusion rate of the atoms decreased. The nucleation rate increased, and the Fe clusters increased simultaneously under the joint action of the strong interaction between the Fe atoms and atom diffusion in the system. The third stage occurred in the temperature range of 1050–887 K, when the number of atoms in the largest cluster surged. Based on the described analysis results, the rapid growth of the clusters was mainly a result of the combination of small clusters. However, the number of clusters was reduced with the sharp increase in the atoms in the largest cluster. Such findings could be attributed to the system structure changing mainly in the form of the non-diffusive local structural rearrangements of the atoms in this stage. Due to the lowered nucleation rate of the system, the number of newly formed clusters could not compensate for the number of clusters that combined, resulting in the gradual growth of large clusters and a decrease in small clusters. The fourth stage was between 887 and 300 K, when the system crystallized. As the temperature dropped, the diffusion rate of the atoms decreased. Due to the rapid cooling rate, there was insufficient time for atomic diffusion to occur. Consequently, the magnitude of the principal cluster and the number of secondary clusters underwent minimal modification. Based on the aforementioned analysis, a conclusion could be drawn that Fe clusters nucleate throughout the cooling process due to the interaction between Fe atoms, and atom diffusion affects the size and nucleation rate of Fe clusters. Therefore, the formation of clusters at different stages is the result of the joint action of the interaction force between the Fe atoms and atom diffusion.

4. Conclusions

(1)
The phase transition temperature of the alloys varied with the changing cooling rate. As the cooling rate decreased, the phase transition temperature increased. At a lower cooling rate, the average atomic potential energy after phase transition was lower, the system structure was more stable, and the proportion of atoms in the crystal structure was larger. At the cooling rate of 2 × 10¹⁰ K/s, the alloy was liquid above 887 K. When the temperature reached about 887 K, the alloy began to crystallize. In the temperature range of 887–850 K, the proportion of FCC and HCP crystals rapidly increased at first, and then the growth rate decreased. The content of BCC crystals first increased, before decomposition into FCC and HCP crystals. Finally, a Cu-Fe alloy was generated, primarily comprising FCC and HCP crystals, accompanied by a limited quantity of BCC crystals.
(2)
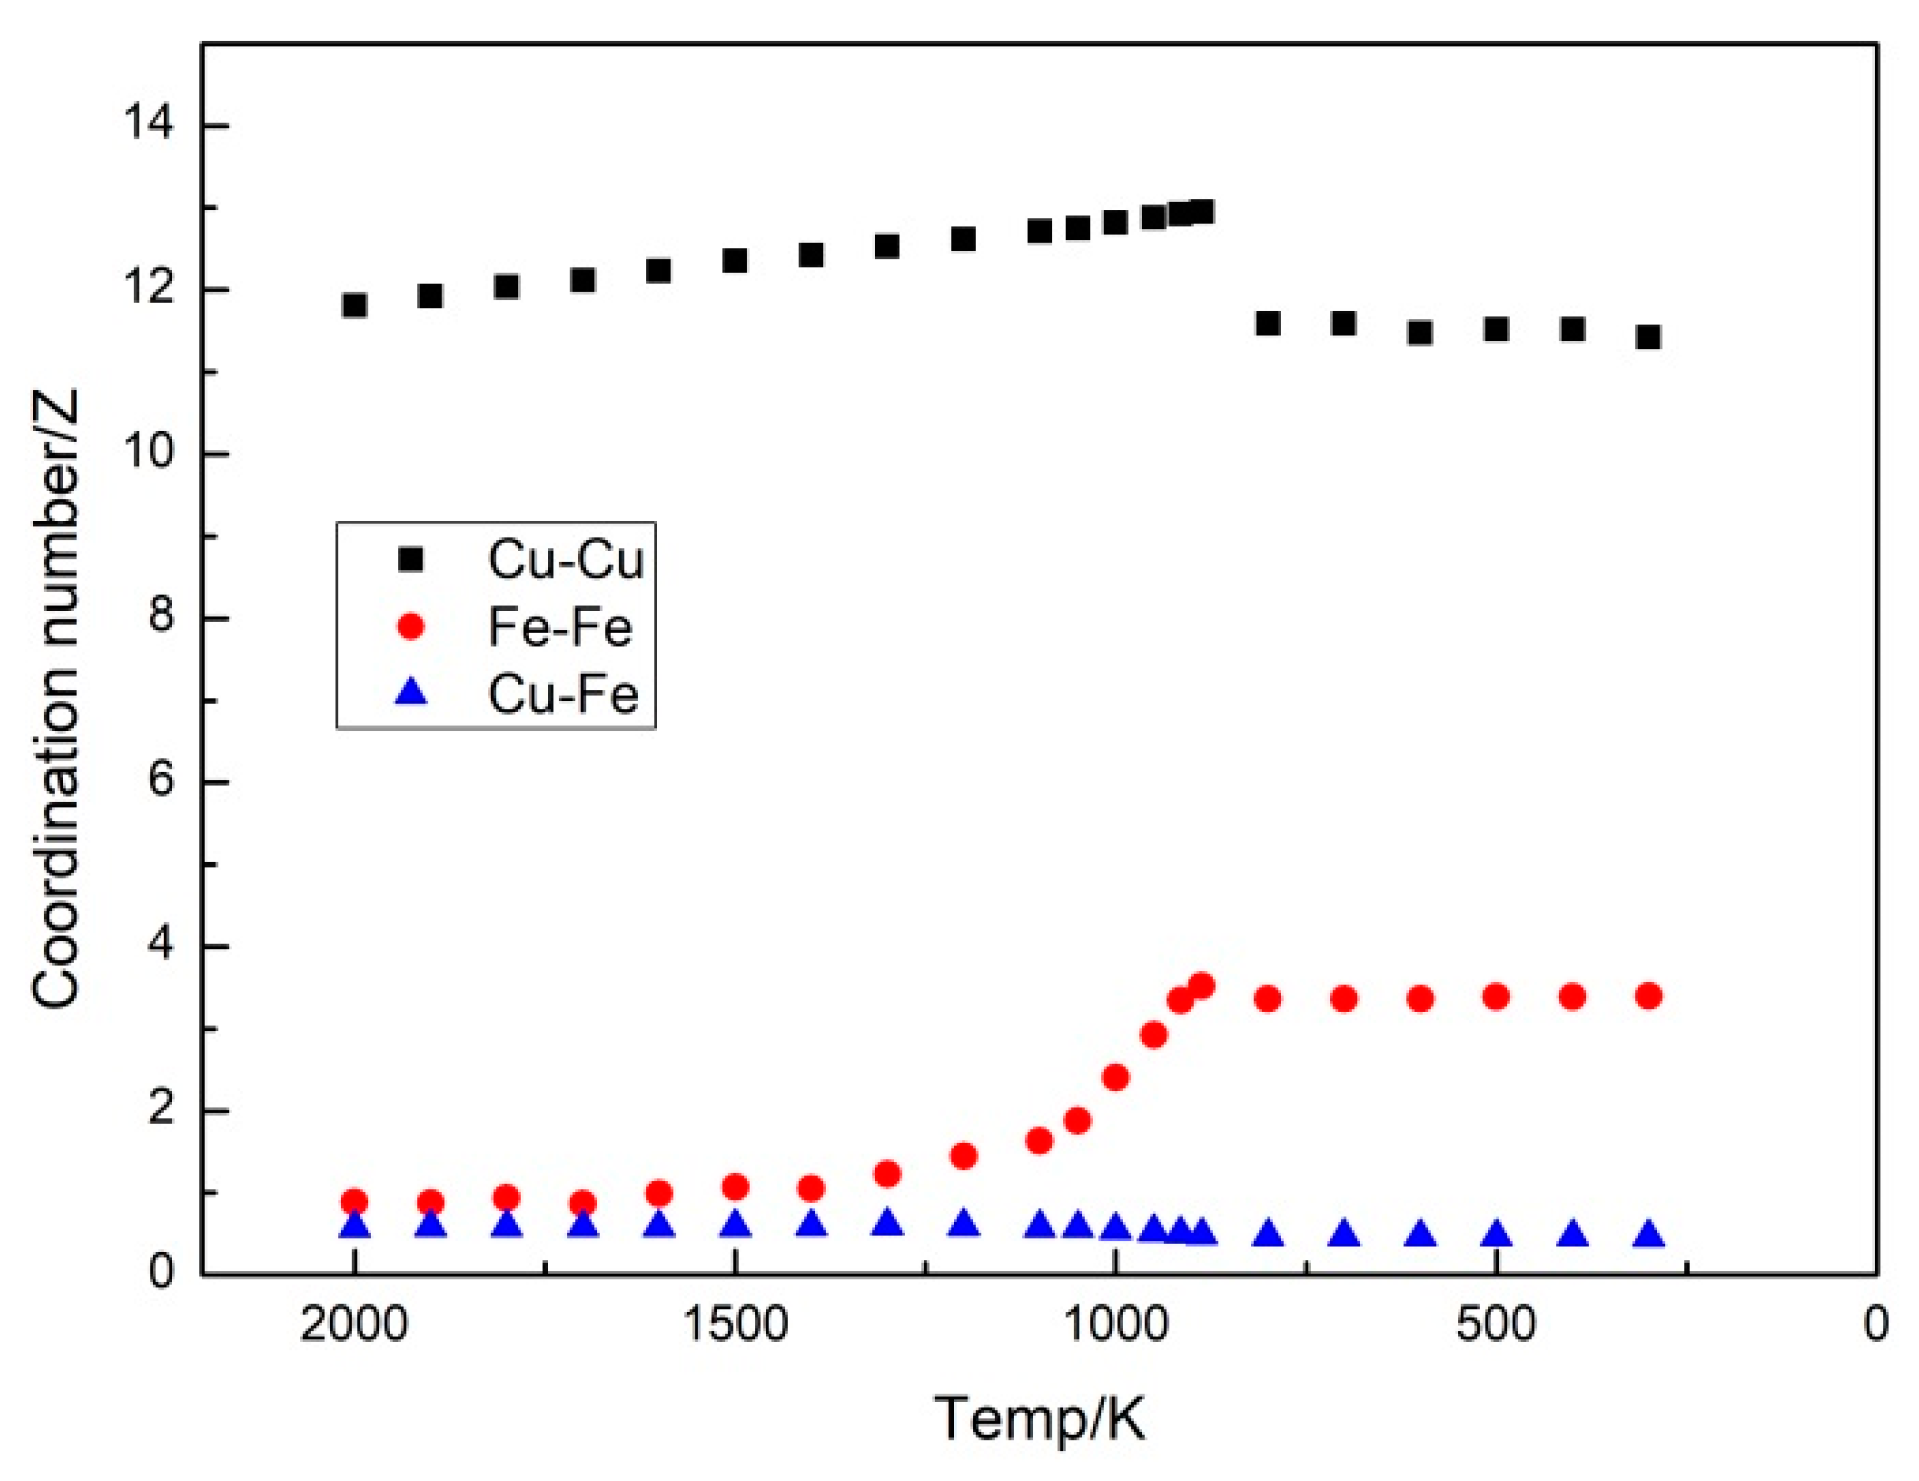
The interaction between the Fe atoms served as the driving force for the formation of the Fe clusters. The radial distribution function and coordination number of the simulation system structure parameters were analyzed. The results reveal that with the lowering temperature, the difference between the first peak value of g F e F e ( r ) and that of g C u F e ( r ) and g C u C u ( r ) enlarged, the coordination number of the Fe-Fe pairs increased steadily, and the coordination number of the Cu-Fe pairs decreased gradually. Such results indicate that the interaction between the Fe atoms was stronger than that between the Cu atoms and between the Cu and Fe atoms, and there was a repulsion force between the Cu and Fe atoms. With the decrease in the temperature, the second peak value of g F e F e ( r ) increased, but that of g C u F e ( r ) and g C u C u ( r ) decreased. At 300 K, all parts of the g F e F e r curve were located above 1, while the second peak values of g C u F e ( r ) and g C u C u ( r ) reduced below 1. Such findings suggest that the nearest and second-nearest neighbors of the Fe atoms were mostly occupied by Fe atoms, and the Fe atoms were more prone to form nearest-neighbor structures with Fe atoms.
(3)
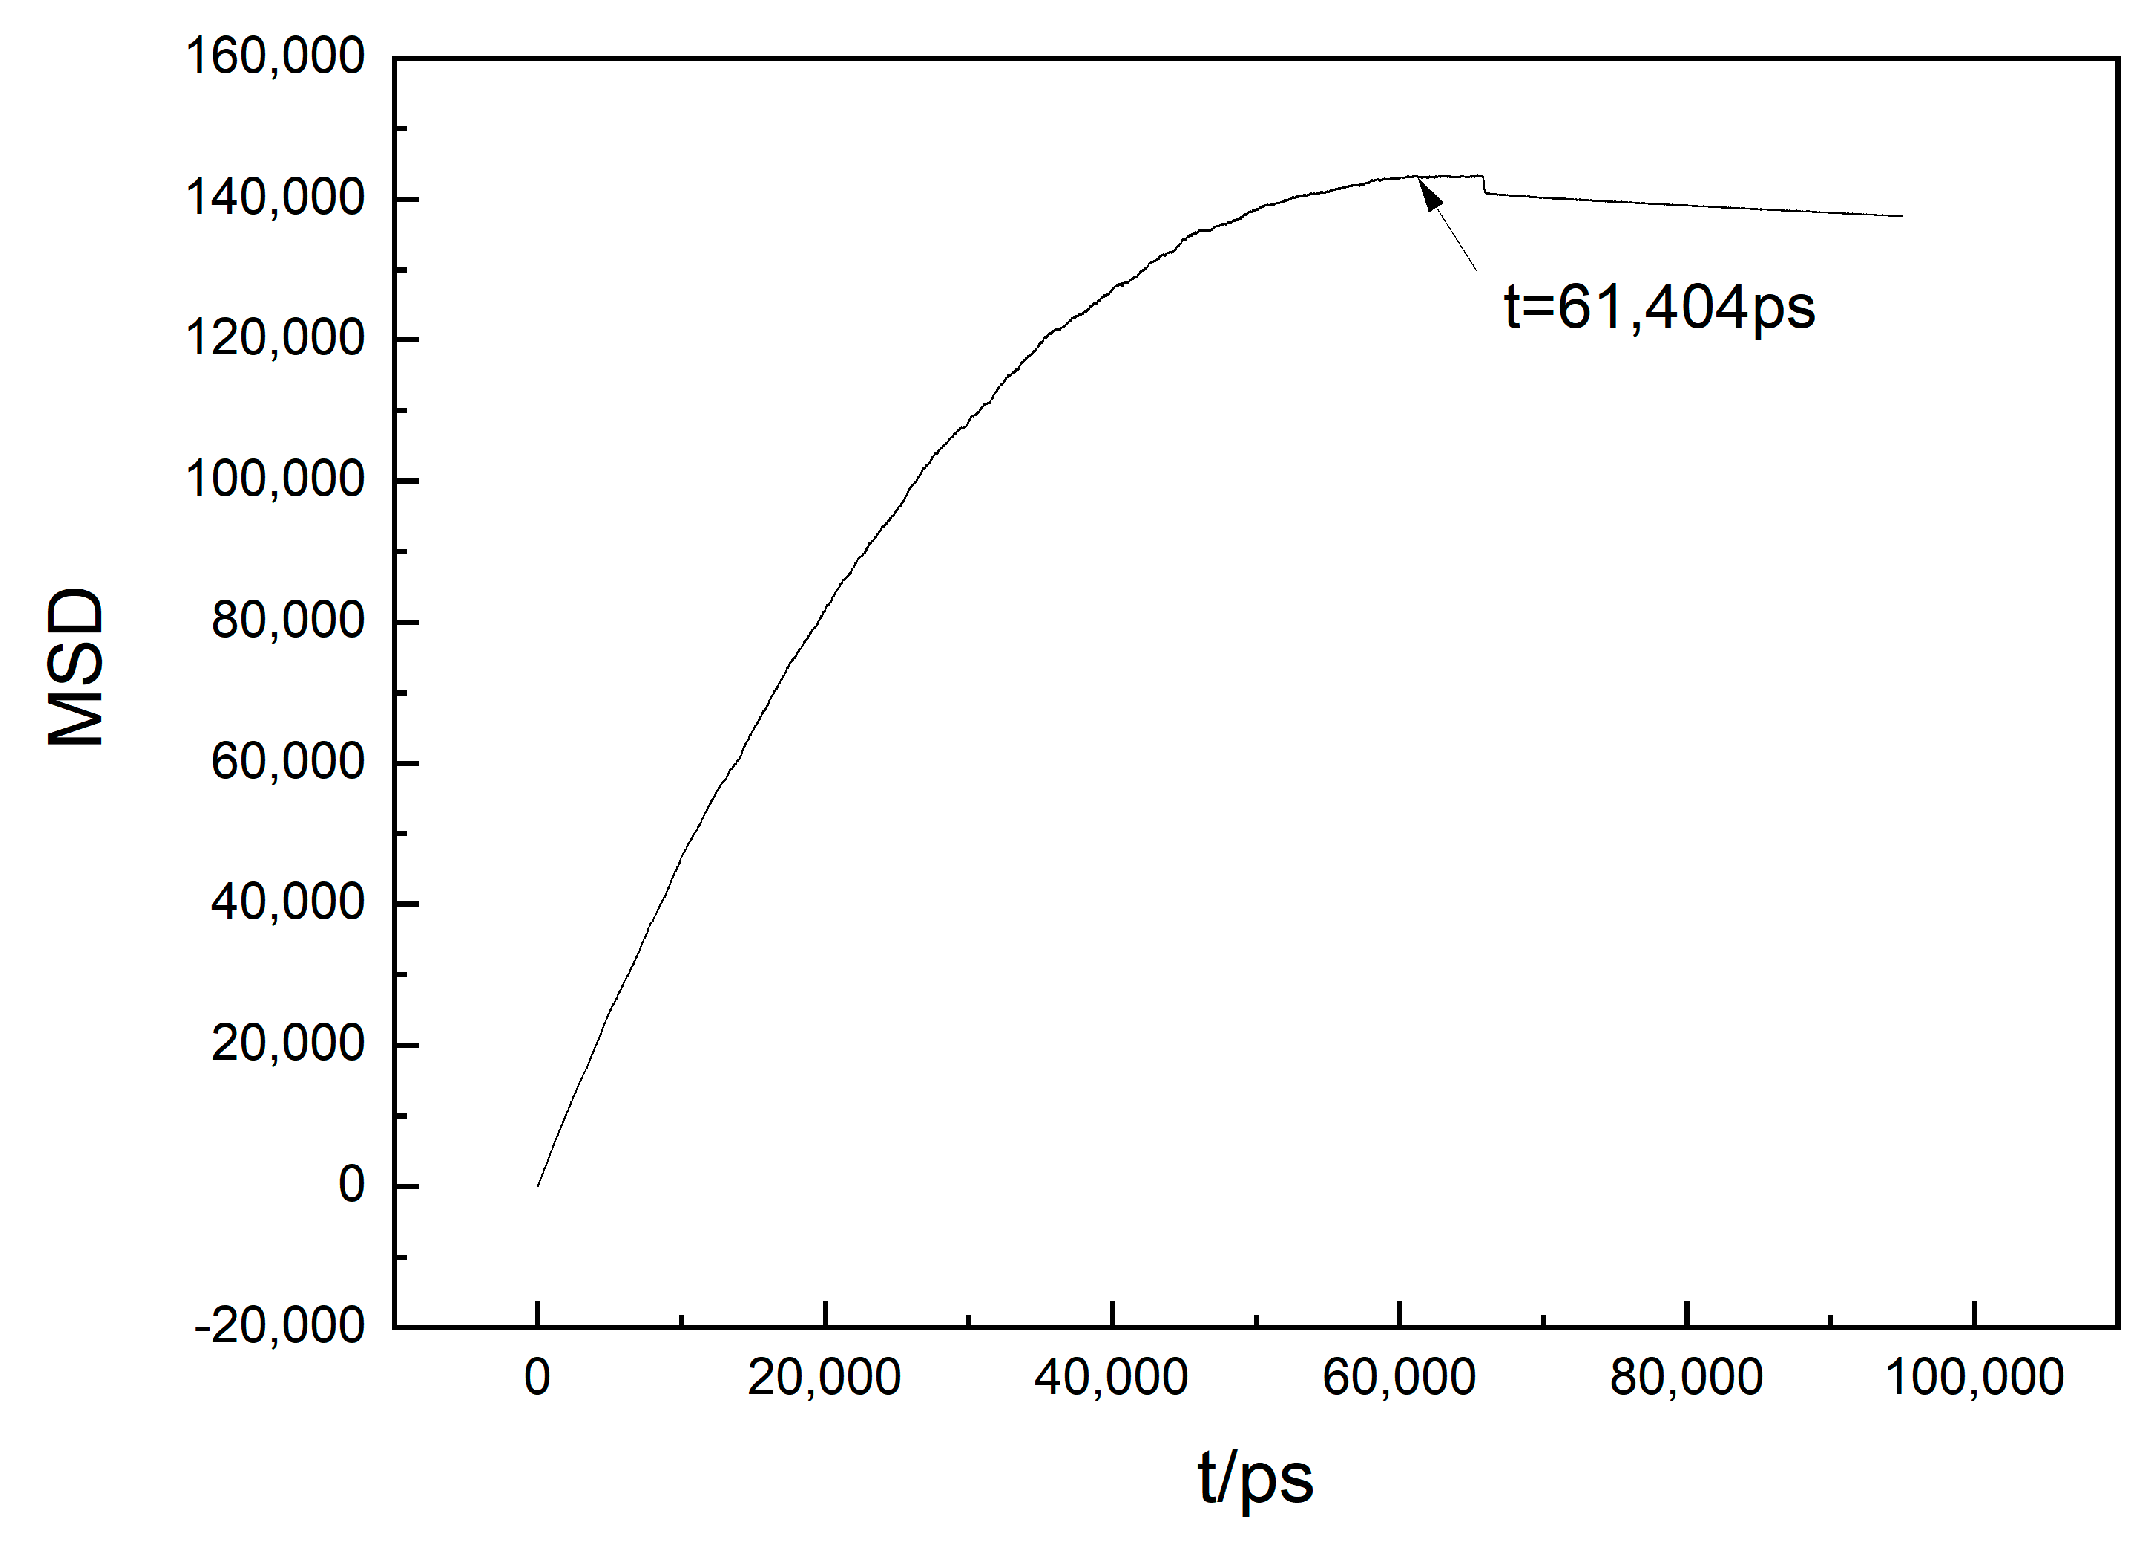
Temperate changes affected the thermal activities of the atoms. The diffusion coefficient of the atoms influenced the growth of the Fe clusters. A smaller diffusion coefficient indicated a stronger bond between the atoms and a more stable cluster. When the temperature dropped but still remained above 967 K, the diffusion coefficient of the Fe atoms decreased. The diffusion coefficient of the Fe atoms approached 0 within the temperature range of 967–887 K. During this period, the principal structural modification within the system was attributable to the localized rearrangements of the atoms, rather than diffusion-driven processes. This stage represents a crucial period for cluster expansion.
(4)
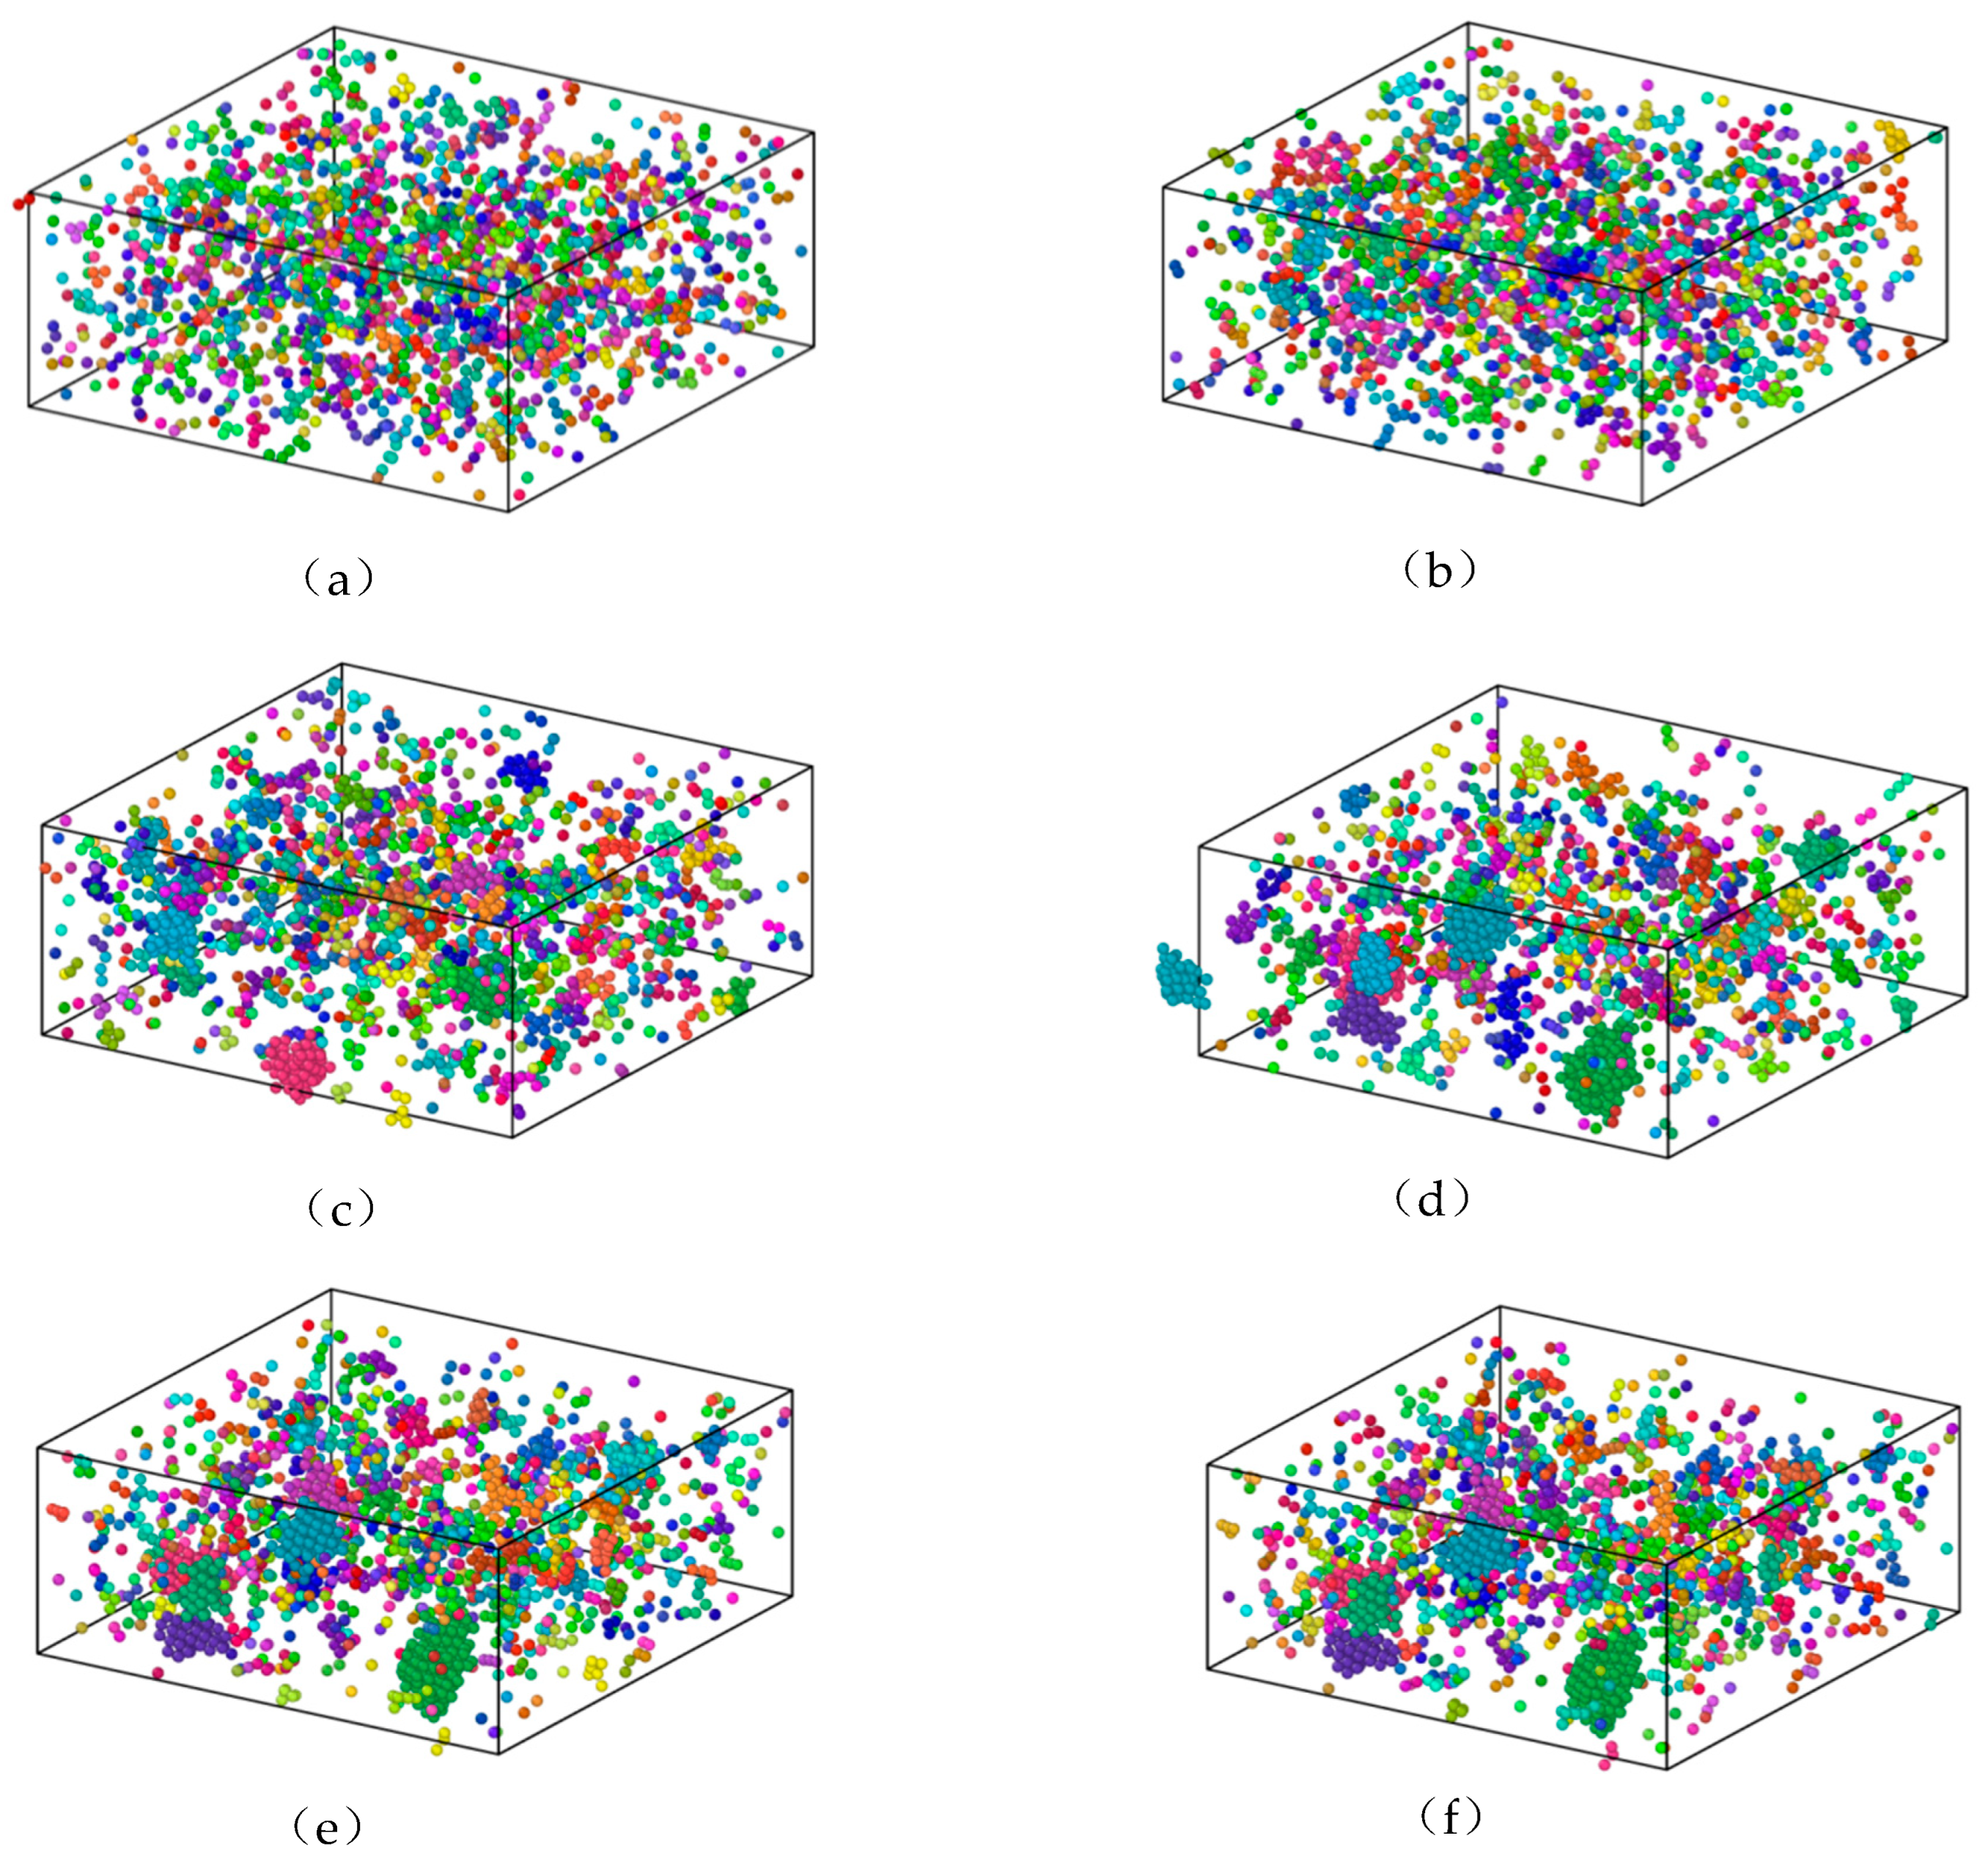
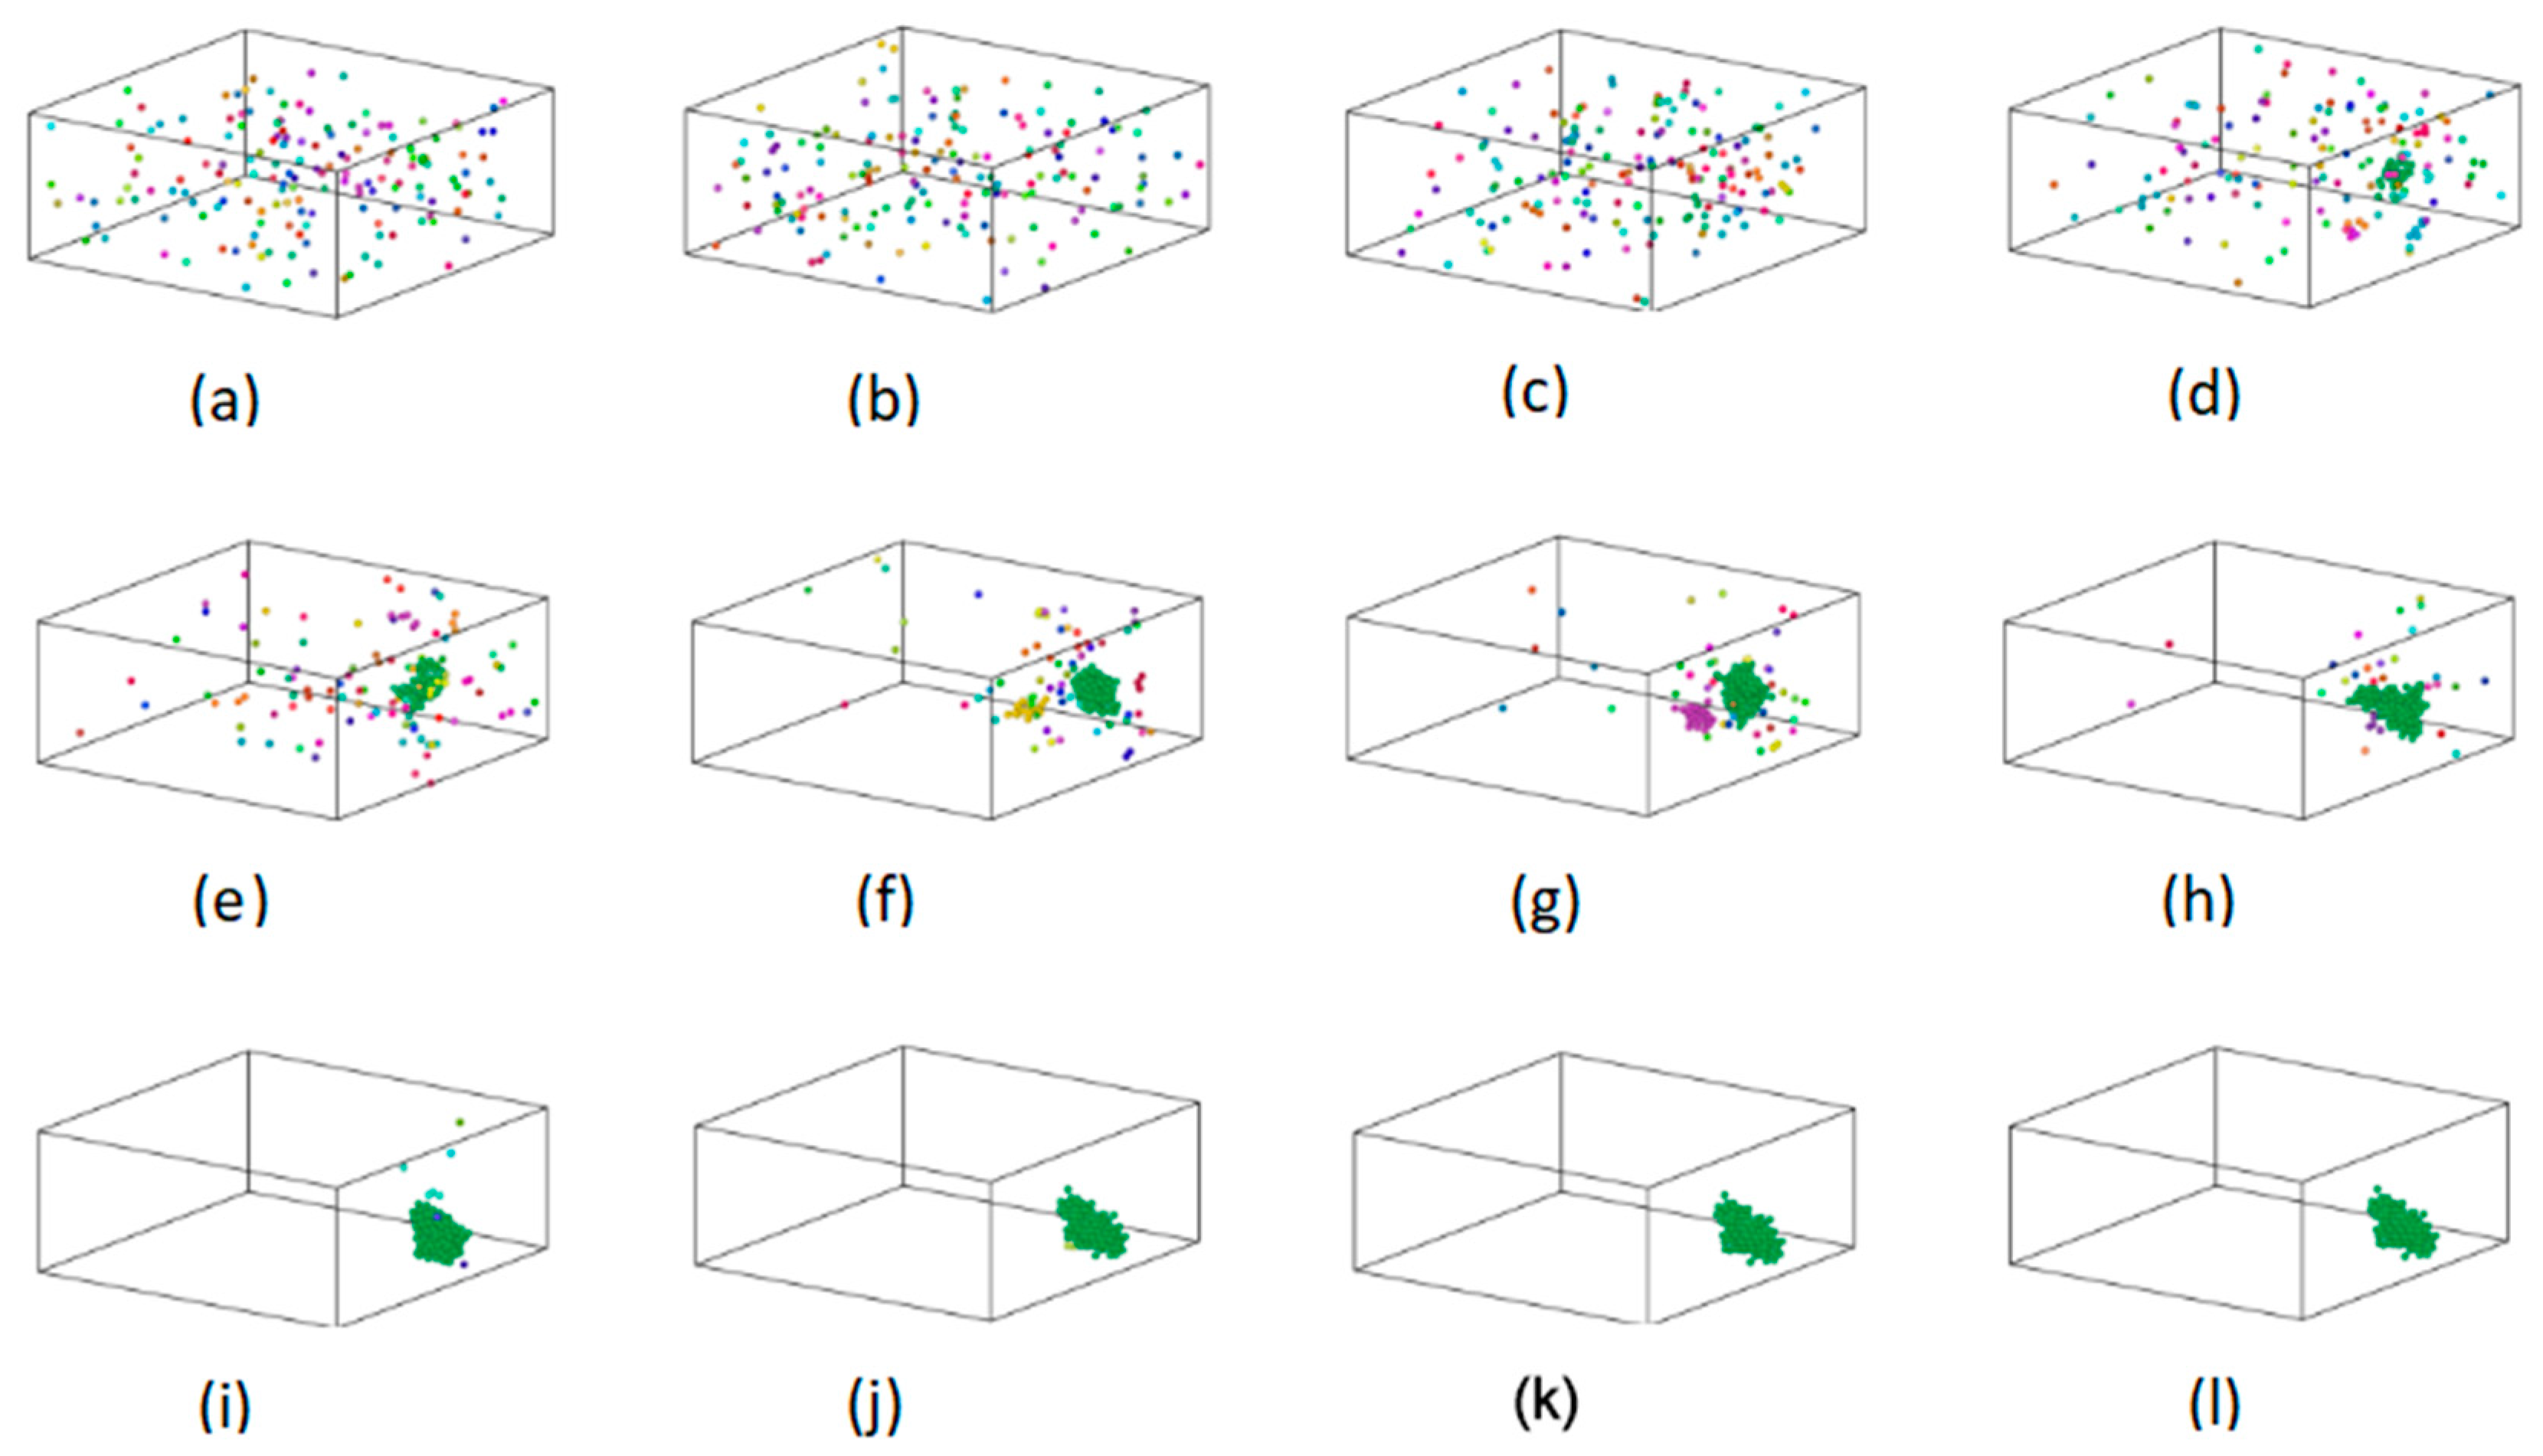
The formation and growth of the Fe clusters were governed by the nucleation and growth mechanism. When the alloy temperature was above 1400 K, more Fe clusters were formed due to the strong interaction between the Fe atoms, and the large diffusion coefficient of the Fe atoms inhibited the growth of Fe clusters. In the temperature range of 1400–1050 K, both the number of atoms in the largest cluster and the number of clusters increased due to the interaction between the Fe atoms. In the temperature range of 1050–887 K, there were two reasons for the growth of Fe clusters. One reason for such a phenomenon is that the interaction among the Fe atoms facilitated the aggregation of individual Fe atoms into Fe clusters. Another contributing factor is the coalescence and fusion of pre-existing clusters. The minimization of the surface area energy promoted the formation and expansion of Fe clusters. When the temperature fell below 887 K, the alloy underwent crystallization, and subsequent alterations in the magnitude and quantity of Fe clusters were minimal.

Author Contributions

X.W.: Writing—original draft, wrote the manuscript, discussed and commented on the manuscript, X.G.: Writing—original draft, analyzed the data, discussed and commented on the manuscript, Z.L.: Writing—original draft, revised the manuscript, discussed and commented on the manuscript, Z.H.: conceived the research, formal analysis, writing—original draft, performed the simulation and analyzed the data, wrote the manuscript, discussed and commented on the manuscript, Y.L.: conceived the research, discussed and commented on the manuscript. All authors have read and agreed to the published version of the manuscript.

Funding

The authors are grateful for the financial support provided by the National Natural Science Foundation of China (Grant Number 51974129) and the Tangshan Technical Innovation Team Training Plan Project (Grant Number 21130207D). Hebei Province Higher Education Science and Technology Research Project (QN2022003); Hebei Province Graduate Innovation Funding Project (CXZZBS2021100).

Data Availability Statement

The original contributions presented in the study are included in the article, further inquiries can be directed to the corresponding author.

Conflicts of Interest

The authors declare no conflicts of interest.

References

  1. Yang, H.Y.; Ma, Z.C.; Lei, C.H.; Meng, L.; Fang, Y.T.; Liu, J.B.; Wang, H.T. High strength and high conductivity Cu alloys: A review. Sci. China (Technol. Sci.) 2020, 63, 2505–2517. [Google Scholar] [CrossRef]
  2. Liu, Y.; Zhang, J.; Sun, Q.; Li, M.; Yan, M.; Cheng, X.; Li, M.; Zhang, M.-X. Laser powder bed fusion of copper matrix iron particle reinforced nanocomposite with high strength and high conductivity. J. Mater. Sci. Technol. 2023, 134, 50–59. [Google Scholar] [CrossRef]
  3. Huang, Y.; Du, J.L.; Wang, Z.M. Progress in Research on the Alloying of Binary Immiscible Metals. Acta Metall. Sin. 2020, 56, 801–820. [Google Scholar]
  4. Wang, M.; Yang, Q.-R.; Jiang, Y.-B.; Li, Z.; Xiao, Z.; Gong, S.; Wang, Y.-R.; Guo, C.-L.; Wei, H.-G. Effects of Fe content on microstructure and properties of Cu-Fe alloy. Trans. Nonferrous Met. Soc. China 2021, 31, 3039–3049. [Google Scholar] [CrossRef]
  5. Tian, Y.Z.; Yang, Y.; Peng, S.Y.; Pang, X.Y.; Li, S.; Jiang, M.; Li, H.X.; Wang, J.W.; Qin, G.W. Managing mechanical and electrical properties of nanostructured Cu-Fe composite by aging treatment. Mater. Charact. 2023, 196, 112600. [Google Scholar] [CrossRef]
  6. Bao, H.; Xu, H.; Li, Y.; Bai, H.; Ma, F. The interaction mechanisms between dislocations and nano-precipitates in CuFe alloys: A molecular dynamic simulation. Int. J. Plast. 2022, 155, 103317. [Google Scholar] [CrossRef]
  7. Sunbul, S.E.; Akyol, S.; Onal, S.; Ozturk, S.; Sozeri, H.; Icin, K. Effect of Co, Cu, and Mo alloying metals on electrochemical and magnetic properties of Fe-B alloy. J. Alloys Compd. 2023, 947, 169652. [Google Scholar] [CrossRef]
  8. Pennell, S.M.; Mack, J.B.; Dunand, D.C. Evolution of lamellar architecture and microstructure during redox cycling of Fe-Co and Fe-Cu foams. J. Alloys Compd. 2022, 918, 165606. [Google Scholar] [CrossRef]
  9. Ma, H.; Liu, Z.; Li, J.; Liu, Q.; Zhang, J.; Wei, T. Optimization design of environmental-friendly Cu-Fe laser cladding coating for self-grown microchannel in a marine corrosive environment. J. Alloys Compd. 2023, 940, 168820. [Google Scholar] [CrossRef]
  10. Sahoo, D.; Paliwal, M.; Srivastava, A.; Mishra, S. Study on the composition effect upon the microstructure development in Cu-Fe alloys prepared using Aerodynamic Levitation. Mater. Today Commun. 2023, 37, 107288. [Google Scholar] [CrossRef]
  11. Chen, K.X.; Li, Z.X.; Wang, Z.D. Morphological Evolution of Fe-Rich Precipitates in a Cu-2.0Fe Alloy during Isothermal Treat ment. Acta Metall. Sin. 2023, 59, 1665–1674. [Google Scholar]
  12. Syarif, J.; Gillette, V.; Hussien, H.A.; Badawy, K.; Jisrawi, N. Molecular dynamics simulation of the amorphization and alloying of a mechanically milled Fe-Cu system. J. Non-Cryst. Solids 2022, 580, 121410. [Google Scholar] [CrossRef]
  13. Chatterjee, A.; Popov, D.; Velisavljevic, N.; Misra, A. Phase Transitions of Cu and Fe at Multiscales in an Additively Manufactured Cu-Fe Alloy under High-Pressure. Nanomaterials 2022, 12, 1514. [Google Scholar] [CrossRef] [PubMed]
  14. Kumar, S. Structural Evolution of Iron-Copper (Fe-Cu) Bimetallic Janus Nanoparticles during Solidification: An Atomistic Investigation. J. Phys. Chem. C 2020, 124, 1053–1063. [Google Scholar] [CrossRef]
  15. Wu, C.-D.; Liao, C.-F. Molecular dynamics simulation of the direct bonding of (111)-oriented nanotwinned Cu and its related mechanical behavior. J. Phys. Chem. Solids 2024, 187, 111872. [Google Scholar] [CrossRef]
  16. Su, L.; Yao, M.; Tao, H.; Yang, J.; Zhang, E.; Han, X. Tribological behavior of copper-iron particles as third body additives on copper matrix composites: Experiment link third body morphology to accommodation mechanism. Tribol. Int. 2024, 191, 109118. [Google Scholar] [CrossRef]
  17. Adam, O.; Jan, V.; Spotz, Z.; Cupera, J.; Pouchly, V. Ultrafine-grained Cu50(FeCo)50 immiscible alloy with excellent thermal stability. Mater. Charact. 2021, 182, 111532. [Google Scholar] [CrossRef]
  18. Zhang, H.C.; Wang, X.F.; Li, H.R.; Li, C.Q.; Li, Y.G. Molecular Dynamics Study on the Impact of Cu Clusters at the BCC-Fe Grain Boundary on the Tensile Properties of Crystal. Metals 2020, 10, 1533. [Google Scholar] [CrossRef]
  19. Hirel, P. Atomsk: A tool for manipulating and converting atomic data files. Comput. Phys. Commun. 2015, 197, 212–219. [Google Scholar] [CrossRef]
  20. Thompson, A.P.; Aktulga, H.M.; Berger, R.; Bolintineanu, D.S.; Brown, W.M.; Crozier, P.S.; In’t Veld, P.J.; Kohlmeyer, A.; Moore, S.G.; Nguyen, T.D.; et al. LAMMPS—A flexible simulation tool for particle-based materials modeling at the atomic, meso, and continuum scales. Comput. Phys. Commun. 2022, 271, 108171. [Google Scholar] [CrossRef]
  21. Bonny, G.; Pasianot, R.C.; Castin, N.; Malerba, L. Ternary Fe-Cu-Ni many-body potential to model reactor pressure vessel steels: First validation by simulated thermal annealing. Philos. Mag. 2009, 89, 3531–3546. [Google Scholar] [CrossRef]
  22. Bonny, G.; Bakaev, A.; Terentyev, D. The combined effect of carbon and chromium enrichment on (100) loop absorption in iron. Comput. Mater. Sci. 2022, 211, 111533. [Google Scholar] [CrossRef]
  23. Mitsui, Y.; Onoue, M.; Kobayashi, R.; Sato, K.; Kuzuhara, S.; Ito, W.; Takahashi, K.; Koyama, K. High Magnetic Field Effects on Cu-precipitation Behavior of Fe-1mass%Cu at 773 K. ISIJ Int. 2022, 62, 413–417. [Google Scholar] [CrossRef]
  24. Jiang, J.Z.; Zhang, X.X.; Ma, F.; Dong, S.S.; Yang, W.; Wu, M.H. Molecular dynamics simulation of the crystal structure evolution of titanium under different Tdamp values and heating/cooling rates. Chem. Phys. Lett. 2021, 763, 138187. [Google Scholar] [CrossRef]
  25. Wang, M.J.; Huang, X.X.; Wu, S.P.; Dai, G.X. Molecular dynamics simulations of tensile mechanical properties and microstructures of Al-4.5Cu alloy: The role of temperature and strain rate. Model. Simul. Mater. Sci. Eng. 2022, 30, 045004. [Google Scholar] [CrossRef]
  26. Jiao, Y.; Dan, W.J.; Zhang, W.G. Effects of hydrogen on the deformation mechanism of face-centred cubic Fe-C single crystal with nanovoid: A molecular dynamics simulation. J. Alloys Compd. 2021, 870, 159330. [Google Scholar] [CrossRef]
  27. Yu, B.Y.; Liang, Y.C.; Tian, Z.A.; Liu, R.S.; Gao, T.H.; Xie, Q.; Mo, Y.F. MD simulation on crystallization mechanisms of rapidly supercooled Fe-Ni alloys. J. Cryst. Growth 2020, 535, 125533. [Google Scholar] [CrossRef]
  28. Tang, J.B.; Ahmadi, A.; Alizadeh, A.; Abedinzadeh, R.; Abed, A.M.; Smaisim, G.F.; Hadrawi, S.K.; Nasajpour-Esfahani, N.; Toghraie, D. Investigation of the mechanical properties of different amorphous composites using the molecular dynamics simulation. J. Mater. Res. Technol.-JMRT 2023, 24, 1390–1400. [Google Scholar] [CrossRef]
  29. Xu, H.D.; Bao, H.W.; Li, Y.; Bai, H.Z.; Ma, F. Atomic scale insights into the rapid crystallization and precipitation behaviors in FeCu binary alloys. J. Alloys Compd. 2021, 882, 160725. [Google Scholar] [CrossRef]
  30. Celtek, M.; Domekeli, U.; Sengul, S.; Canan, C. Effects of Ag or Al addition to CuZr-based metallic alloys on glass formation and structural evolution: A molecular dynamics simulation study. Intermetallics 2021, 128, 107023. [Google Scholar] [CrossRef]
  31. Zhou, Y.; Liang, Y.C.; Zhou, L.L.; Mo, Y.F.; Wu, R.L.; Tian, Z.A. Effect of topologically close-packed clusters on the pair distribution function of amorphous Zr under different pressures. J. Non-Cryst. Solids 2023, 612, 122354. [Google Scholar] [CrossRef]
  32. Zhang, Y.L.; Zhao, T.X.; Yu, X.Q.; Huang, J.K. The Al-Fe Intermetallic Compounds and the Atomic Diffusion Behavior at the Interface of Aluminum-Steel Welded Joint. Metals 2023, 13, 334. [Google Scholar] [CrossRef]
  33. Polak, W.Z. Efficiency in identification of internal structure in simulated monoatomic clusters: Comparison between common neighbor analysis and coordination polyhedron method. Comput. Mater. Sci. 2022, 201, 110882. [Google Scholar] [CrossRef]
  34. Duan, L.J.; Liu, Y.C.; Duan, J.S. Calculation of radii and atom numbers of different coordination shells in cubic crystals. Mater. Today Commun. 2020, 22, 100768. [Google Scholar] [CrossRef]
  35. Ranaweera, S.A.; Donnadieu, B.; Henry, W.P.; White, M.G. Effects of electron-donating ability of binding sites on coordination number: The interactions of a cyclic Schiff base with copper ions. Acta Crystallogr. Sect. C Struct. Chem. 2023, 79, 142–148. [Google Scholar] [CrossRef] [PubMed]
  36. Nguyen-Trong, D.; Nguyen-Tri, P. Factors affecting the structure, phase transition and crystallization process of AlNi nanoparticles. J. Alloys Compd. 2020, 812, 152133. [Google Scholar] [CrossRef]
  37. Yang, Z.M.; Qiu, N.; Yang, H.M.; Wang, Y. Vacancies-mediated atomic diffusion controlled by the interfacial structure of FCC/BCC HEA multilayers. J. Alloys Compd. 2023, 947, 169512. [Google Scholar] [CrossRef]
  38. Simonnin, P.; Schreiber, D.K.; Uberuaga, B.P.; Rosso, K.M. Atomic diffusion, segregation, and grain boundary migration in nickel-based alloys from molecular dynamics simulations. Mater. Today Commun. 2023, 35, 105768. [Google Scholar] [CrossRef]
  39. Chen, Y.; Sun, Y.; Cheng, W.; Meng, A.; Zhang, S.; Wang, P. Tissue evolution of Al0.67Cu0.33 alloy during melting and solidification by molecular dynamics simulation. Chem. Phys. 2023, 575, 112049. [Google Scholar] [CrossRef]
  40. Zhang, H.; Zhao, J.; Pu, Z.; Li, Y.; Xu, B.Q.; Yang, B. Ab Initio Molecular Dynamic Simulation of Zn-Al-Fe ALLOYS. J. Min. Metall. Sect. B—Metall. 2019, 55, 79–84. [Google Scholar] [CrossRef]
  41. Wang, L.P.; Yang, W.; Ma, Z.B.; Zhu, J.H.; Li, Y.T. First-principles study of chromium diffusion in the ferritic Fe-Cr alloy. Comput. Mater. Sci. 2020, 181, 109733. [Google Scholar] [CrossRef]
  42. Syarif, J.; Badawy, K.; Hussien, H.A. Atomistic simulation of the diffusion behavior in Al-Fe. Nucl. Mater. Energy 2021, 29, 101073. [Google Scholar] [CrossRef]
Figure 1. Average atomic potential energy and temperature curves of Cu95Fe5 alloys (APE-Temp curves).
Metals 14 00228 g001
Figure 2. Atomic configuration diagram of Cu95Fe5 alloys at the cooling rates of (a) 1 × 10¹³ K/S, (b) 2 × 10¹² K/S, (c) 2 × 10¹¹ K/S, and (d) 2 × 10¹⁰ K/S.
Metals 14 00228 g002aMetals 14 00228 g002b
Figure 3. The change curves of the proportions of different crystal types in Cu95Fe5 alloys with temperature.
Metals 14 00228 g003
Figure 4. The radial distribution function curves of Cu95Fe5 alloys at the temperatures of (a) 2000 K, (b) 1500 K, (c) 1000 K, (d) 887 K, (e) 500 K, and (f) 300 K.
Metals 14 00228 g004
Figure 5. The variation curve of the coordination number with temperature in Cu95Fe5 alloys.
Metals 14 00228 g005
Figure 7. The distribution of Fe atoms in Cu95Fe5 alloys at (a) 2000 K, (b) 1500 K, (c) 1000 K, (d) 887 K, (e) 500 K, and (f) 300 K.
Metals 14 00228 g006
Figure 8. The distribution of Fe atoms in the largest cluster at (a) 2000 K, (b) 1500 K, (c) 1100 K, (d) 1050 K, (e) 1000 K, (f) 950 K, (g) 930 K, (h) 915 K, (i) 887 K, (j) 800 K, (k) 500 K, and (l) 300 K.
Metals 14 00228 g007
Figure 9. The variations in the number of atoms in the largest cluster and the number of clusters containing more than 5 atoms with temperature at 300 K.
Metals 14 00228 g008
Figure 6. The variation in MSD with time.
Metals 14 00228 g009
Table 1. The ratio of the sum of atoms in FCC, HCP, and BCC crystal structures to the total number of atoms in the alloy during cooling.
Temperature2200 K1000 KPhase Transition Temperature500 K300 K
Cooling Rates
1 × 10¹³ K/S00.5%1.5%3.3%4.8%
2 × 10¹² K/S00.5%3.4%43.1%54.1%
2 × 10¹¹ K/S00.5%6.4%75.5%78.9%
2 × 10¹⁰ K/S00.5%20.6%79.7%82%
Disclaimer/Publisher’s Note: The statements, opinions and data contained in all publications are solely those of the individual author(s) and contributor(s) and not of MDPI and/or the editor(s). MDPI and/or the editor(s) disclaim responsibility for any injury to people or property resulting from any ideas, methods, instructions or products referred to in the content.

