Abstract
Hydrogen embrittlement (HE) of 1.4614 and 1.4543 maraging stainless steels is characterized with fine structural TEM-ASTAR, hydrogen electrochemical permeation, thermodesorption and tensile testing (with slow strain rate during H cathodic charging) experiments. Both solutions annealed and 550 °C aged states are studied. When aged, 1.4614 grade contains nanometric hexagonal Ni3Ti precipitates whereas 1.4543 grade contains three families of nanometric precipitates, namely, hexagonal Ni3Ti, non fcc-rich Cu and G-phase rich in Si, Ti and Ni with cube-cube relations with martensite. From the permeation and thermodesorption results, it appears that austenite and nanometric precipitates seem to constitute deep traps for hydrogen in both grades. From tensile tests with in situ H charging, 1.4614 and 1.4543 maraging grades show a high susceptibility to HE with relative reduction of area (RRA) strictly superior to 80% for both metallurgical states. The presence of retained austenite does not seem to bring any HE resistance because of its transformation into martensite during deformation.
1. Introduction
Hydrogen embrittlement (HE) of alloys is currently a subject of interest more than ever because of the potential key role of hydrogen as an energy vector. Stainless steels are one of the materials of interest and until now AISI 316L austenitic stainless steel appears to be one of the most resistant to HE among stainless steels [1]. However, in some applications this austenitic stainless steel does not offer additional specific properties such as high mechanical or magnetic characteristics. That is why it is important to understand and to qualify hydrogen embrittlement of, for instance, maraging martensitic stainless steels that are well-known to be sensitive to this embrittlement phenomenon [2,3,4,5,6] but also have very interesting physical properties (namely mechanical and magnetic ones). These so-called maraging stainless steels contain a martensitic matrix (obtained from a Solution-Annealed SA heat treatment) strengthened by nanometric precipitates (obtained by a second aging heat treatment). The general high susceptibility to HE of such high-strength steels is commonly linked to their high ultimate tensile strength [1,3,5,6].
This paper is focused on 1.4614 and 1.4543 grade steels, that contain different types of nanoprecipitates (in terms of composition, shape, orientation relationships with the matrix). Grade 1.4614 is a precipitation-hardened martensitic stainless steel exhibiting a combination of high strength and high fracture toughness combined with a good corrosion resistance first developed by Carpenter [7]. Nanometric Ni3Ti precipitates formed after aging inside the martensitic Fe-Ni-Cr matrix are well-known to improve its mechanical properties. These precipitates present a hexagonal crystallographic structure with rod-like shapes [8,9,10,11]. H transport of 1.4614 has been investigated by Ifergane et al. either by electrochemical permeation and/or by thermal desorption [12,13]. This work suggests that semi-coherent Ni3Ti precipitates play a role in low energy hydrogen traps and would be responsible for a high hydrogen solubility and low diffusivity. Hydrogen embrittlement susceptibility of 1.4614 stainless steel was also evaluated by Yang et al. by tensile testing at a slow strain rate after electrochemical hydrogen charging [6]. It was particularly shown that reverted austenite played a key role in HE sensitivity. Reverted austenite was formed during the over-aging treatment where dissolution Ni3Ti precipitates occurred; the formation of this reversed austenite (with enhanced stability) improved the H resistance of 1.4614 grade. As far as we know, very little is known about HE susceptibility of 1.4543 grade, a maraging grade which contains both Ni3Ti and Cu precipitates. The role of both nano-precipitates in this grade is unknown. Based on trends in previous works on precipitation-hardened stainless steels [6,12,13], it might be thought that susceptibility to hydrogen embrittlement would be generally severe when precipitation occurs.
The general approach used in this paper is to finely analyze the microstructure of the 1.4614 and 1.4543 maraging steels that have been hardened both in solid solution and by precipitation (Section 3.1) and to characterize their interactions with hydrogen (Section 3.2) and their HE susceptibility (Section 3.3). Nanometric precipitates are characterized using TEM-ASTAR. Hydrogen interactions with microstructures are qualified in terms of transport, trapping and quantified thanks to electrochemical permeation and thermal desorption techniques. Finally, the susceptibility to HE is qualified by tensile testing with a slow strain rate during in situ electrochemical hydrogen charging.
2. Materials and Methods
Both stainless steels had been fabricated by Ugitech SA Swiss Steel Group, in Ugine, France and their chemical analyses are given in Table 1 and Table 2. All samples were first homogenized at 1030 °C for 1 h followed by air quenching (solution annealing, SA). Some of them were aged at 550 °C for 1 h followed by air cooling.

Table 1.
Chemical analysis (wt. %) of the studied 1.4614 stainless steel, Fe balance.
Table 2.
Chemical analysis (wt. %) of the studied 1.4543 stainless steel, Fe balance.
General microstructures had been characterized by optical microscopy (with Villela etching after mirror polishing) and by X-ray diffraction in Bragg–Brentano configuration. The quantitative phase analysis was performed using a SEIFERT® XRD3003 (General Electric Sensing & Inspection Technologies, Bogenstrasse 41, 22926 Ahrensburg, Germany) with Cr radiation (wavelength, λ = 0.2291 nm). The diffraction patterns were recorded for 2θ in the 40; 164° range and the content of fcc phase (vol.%) was determined according to ASTM E975-22 [14]. Dislocation densities have been also estimated from XRD measurements based on the Williamson–Hall method [15,16]. The full widths at half maximum (FWHM) were extracted by fitting experimental diffraction peaks using the Voigt function. The peak broadening due to instrumentation was measured using a LaB6 sample and then subtracted from the original measurement. The resulting corrected FWHM was related to the strain through the original Williamson–Hall (WH) equation, considering an isotropic material. Details of this classically used method are available elsewhere [15,16].
Maraging microstructures were determined thanks to TEM-EDS characterization and with the precession assisted crystal orientation mapping technique, ASTAR-TEM [17], recorded with a precession of 0.3, a probe size of 1 nm and a step size of 1.5 nm. For that, thin lamellas with a maximum thickness of about 50 nm were priory fabricated with a dual focused ion beam scanning electron microscope. ASTAR-TEM observations were conducted on a Transmission Electron Microscope at 200 keV (FEG-TEM, JEOL 2100F, JEOL Ltd., Tokyo, Japan).
Electrochemical permeation characterizations were conducted by means of a thermostatic (maintained at 23 °C) Devanathan and Stachurski cell. The experimental setup and the choice in the hypothesis used for extraction of apparent diffusion coefficient are extensively detailed elsewhere [18,19,20,21]. In brief, a constant cathodic current of −20 mA/cm2 had been applied for hydrogen charging in a deaerated 0.1 M NaOH solution, used on both entry and detection hemi-cells. These permeation membranes were 20 × 20 mm2 squares, whose average thickness ranged around 300 µm and it was systematically measured before the test. Apparent diffusion coefficients were estimated from the absorption transient current at the time-lag, assuming a kinetic step for desorption limited by H diffusion in the membrane, and with a constant hydrogen concentration on the entry side, while imposing a near zero concentration on the detection side.
Prior to thermal desorption spectrometry (TDS) characterization, samples of 10 × 10 × 1 mm3 were also charged with deuterium during 4 h in a 0.1 M NaOD (99% D) solution at 30 °C applying a constant cathodic current density of −20 mA/cm2. Deuterium charging generally avoids the detection of naturally occurring hydrogen and permits to improve the signal-to-noise ratio. Directly after charging, specimens were cleaned with distilled water, ethanol and air-dried. The specimens were then cut into two parts. One part was directly introduced in the TDS set-up. The second part of the sample was aged in air at room temperature for 120 h prior to its TDS characterization. Inside the TDS, the desorbing D2 molecules coming from the recombination of deuterium atoms on the specimen surface were detected with a mass spectrometer (Transpector H100M, Inficon, Syracuse, NY, USA) while samples were heated at a constant rate of 10 °C·min−1 in vacuum (10−5 Pa) from room temperature to 980 °C. The D2 molecular desorption flux had been quantified thanks to standardization of the mass spectrometer, carried out with D2 calibrated leaks provided by LacoTech™ (LACO Technologies, Salt Lake City, UT, USA).
The sensitivity to hydrogen embrittlement of the maraging grades was appreciated by testing the tensile properties of the materials either in absence or in presence of hydrogen with a Shimadzu® AGX 100 SSRT machine (Shimadzu, Kyoto, Japan). The round tensile specimens had a gage length of 25 mm with a diameter of 5 mm and were mechanically ground using 1200 SiC abrasive paper surface. The strain rate was fixed at 10−5·s−1. Samples were tested in air and under cathodic charging with a cathodic current density of −0.2 mA/cm2 (see extensive details elsewhere [21]). It should be added that measured hardness increases from 27 HRC (resp. 28 HRC) from solution-annealed state to 43 HRC (resp. 49 HRC) for 550 °C aged 1.4614 (resp. 1.4543) samples, indicating precipitation.
3. Results and Discussion
3.1. 1.4614. and 1.4543 Maraging Microstructure
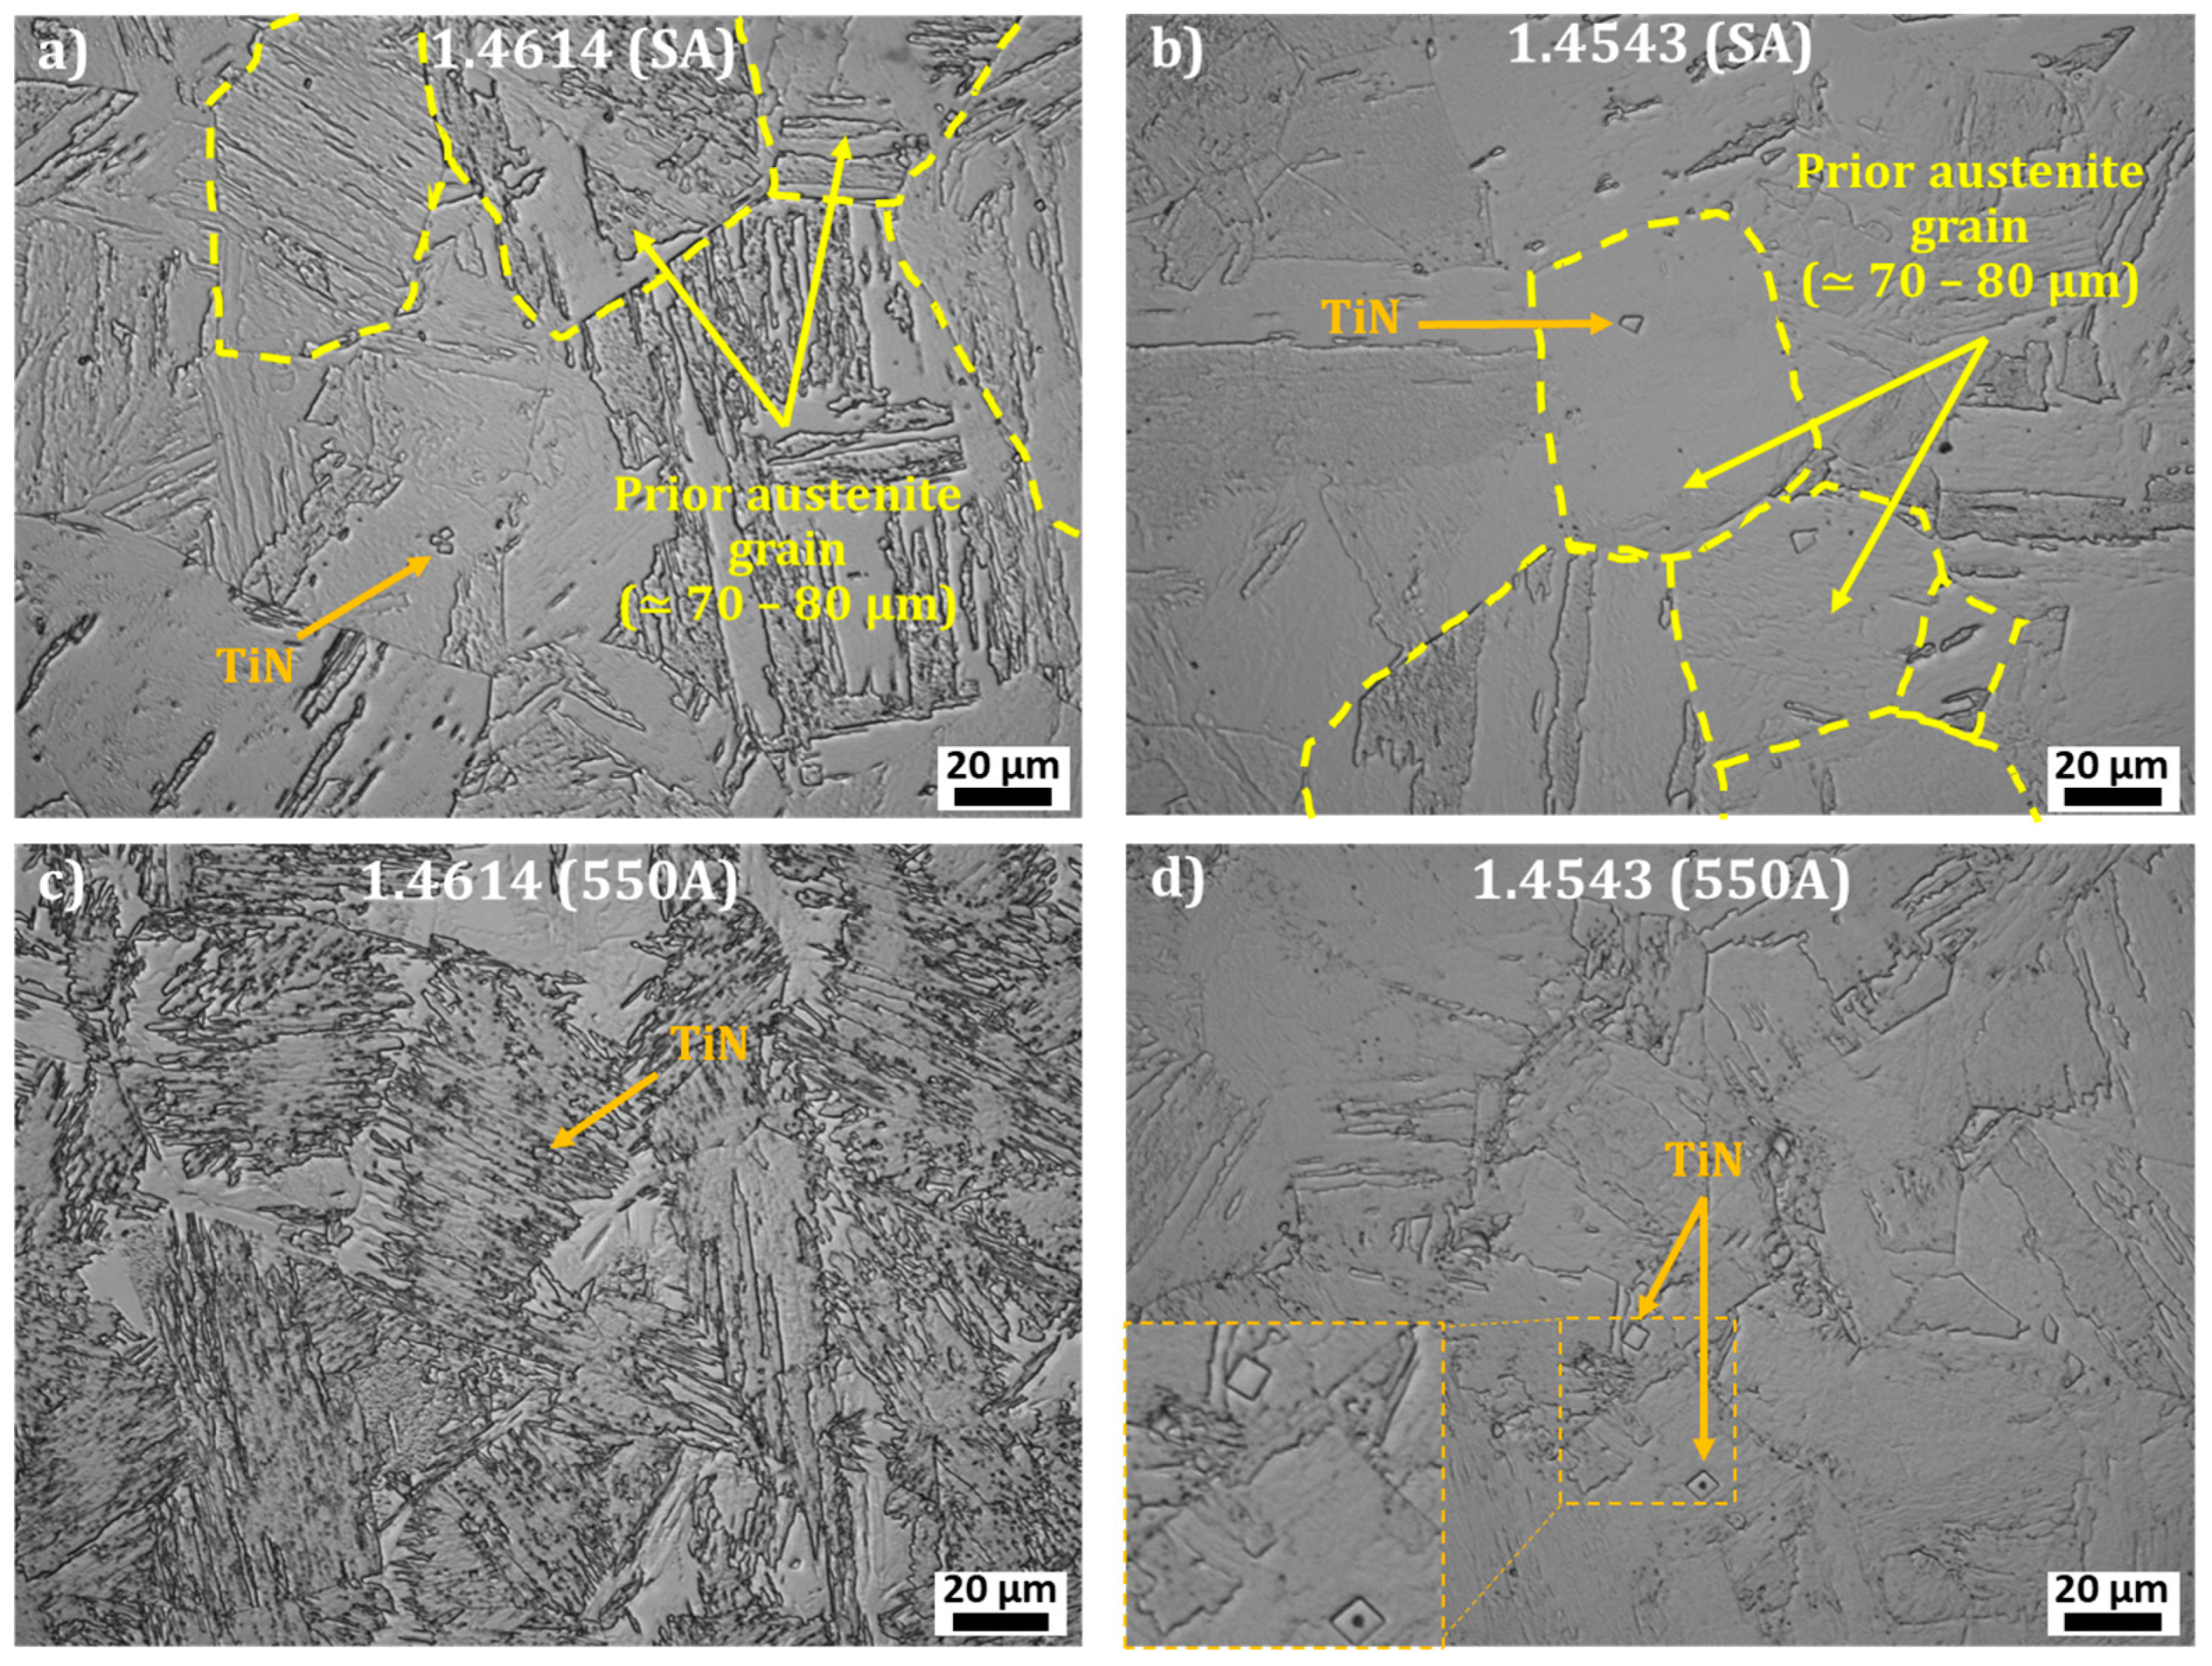
The general microstructure of the two studied maraging stainless steels is shown in Figure 1. The matrix is martensitic with some micrometric TiN precipitates. The prior austenitic grains can be recognized by the highlighted-yellow-dashed lines, with a size of about 75 µm for both grades whatever the undergone heat treatment.
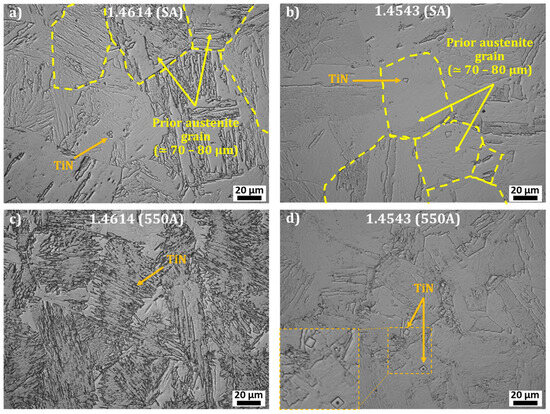
Figure 1.
Optical images (after Villela etching) of 1.4614 and 1.4543 maraging stainless steel after solution annealing “SA” and after aging at 550 °C “550A”. (a) SA 1.4614 (b) SA 1.4543 (c) 550A 1.4614 (d) 550A 1.4543.
X-ray diffraction permits the identification of only two phases, the martensitic matrix α′ and the fcc structure coming mainly or exclusively from (retained or reversed) austenite. Fcc proportions have been calculated and results with possible phase attribution are reported in Figure 2. One should add that EBSD has also been performed and it shows that austenite is present as micrometric islands. SA 1.4614 contains 15 vol.% of fcc that is to say retained austenite. After aging, 18 vol.% of fcc was found; about 3 vol.% reversed austenite was formed during aging. For its part, SA 1.4513 contains only about 2 vol.% of retained austenite. After aging, the fcc proportion reaches about 5 vol.%. This final fcc content is distributed between the contributions of retained austenite, possible reversed austenite, and potential fcc-Cu precipitation (which has a really close lattice parameter compared to austenite).
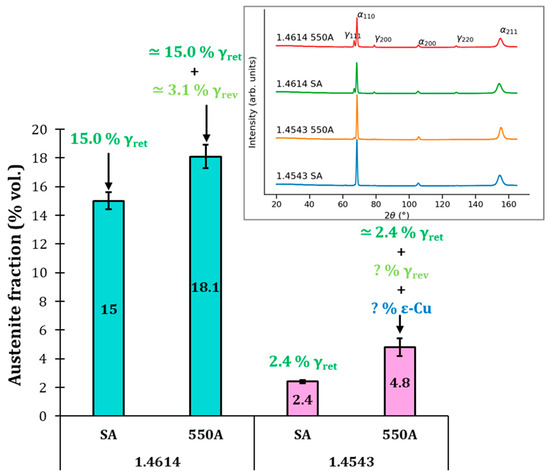
Figure 2.
Fcc proportions in the different grades estimated from X-ray diffraction measurements together with probable phases attribution. Diffractograms are shown in inset.
Dislocation densities based on X-ray diffraction measurements are gathered in Table 3. Dislocation density is high for the two grades, ranging at about 1015–1016 m−2, and for both, aging slightly reduced the dislocation density as could be expected. For 1.4614 sample (resp. 1.4543), dislocation density decreases from 1016 m−2 (resp. 8 × 10¹⁵ m−2) for the annealed solution to 6 × 10¹⁵ m−2 (resp. 3 × 10¹⁵ m−2) for the aged sample.
Table 3.
Dislocation densities based on X-ray diffraction measurements for 1.4614 and 1.4543 grades in both solution-annealed (SA) and aged (550A) states.
STEM-EDS characterization coupled with TEM-ASTAR technique allows us to determine the fine precipitation of aged maraging samples. It should be added that possible segregation at the sub-nanometric scale at precipitates/matric interfaces cannot be explored in the present case because spatial resolution is not sufficient with STEM-EDS on a thin lamella (the resolution is nanometric in the present case).
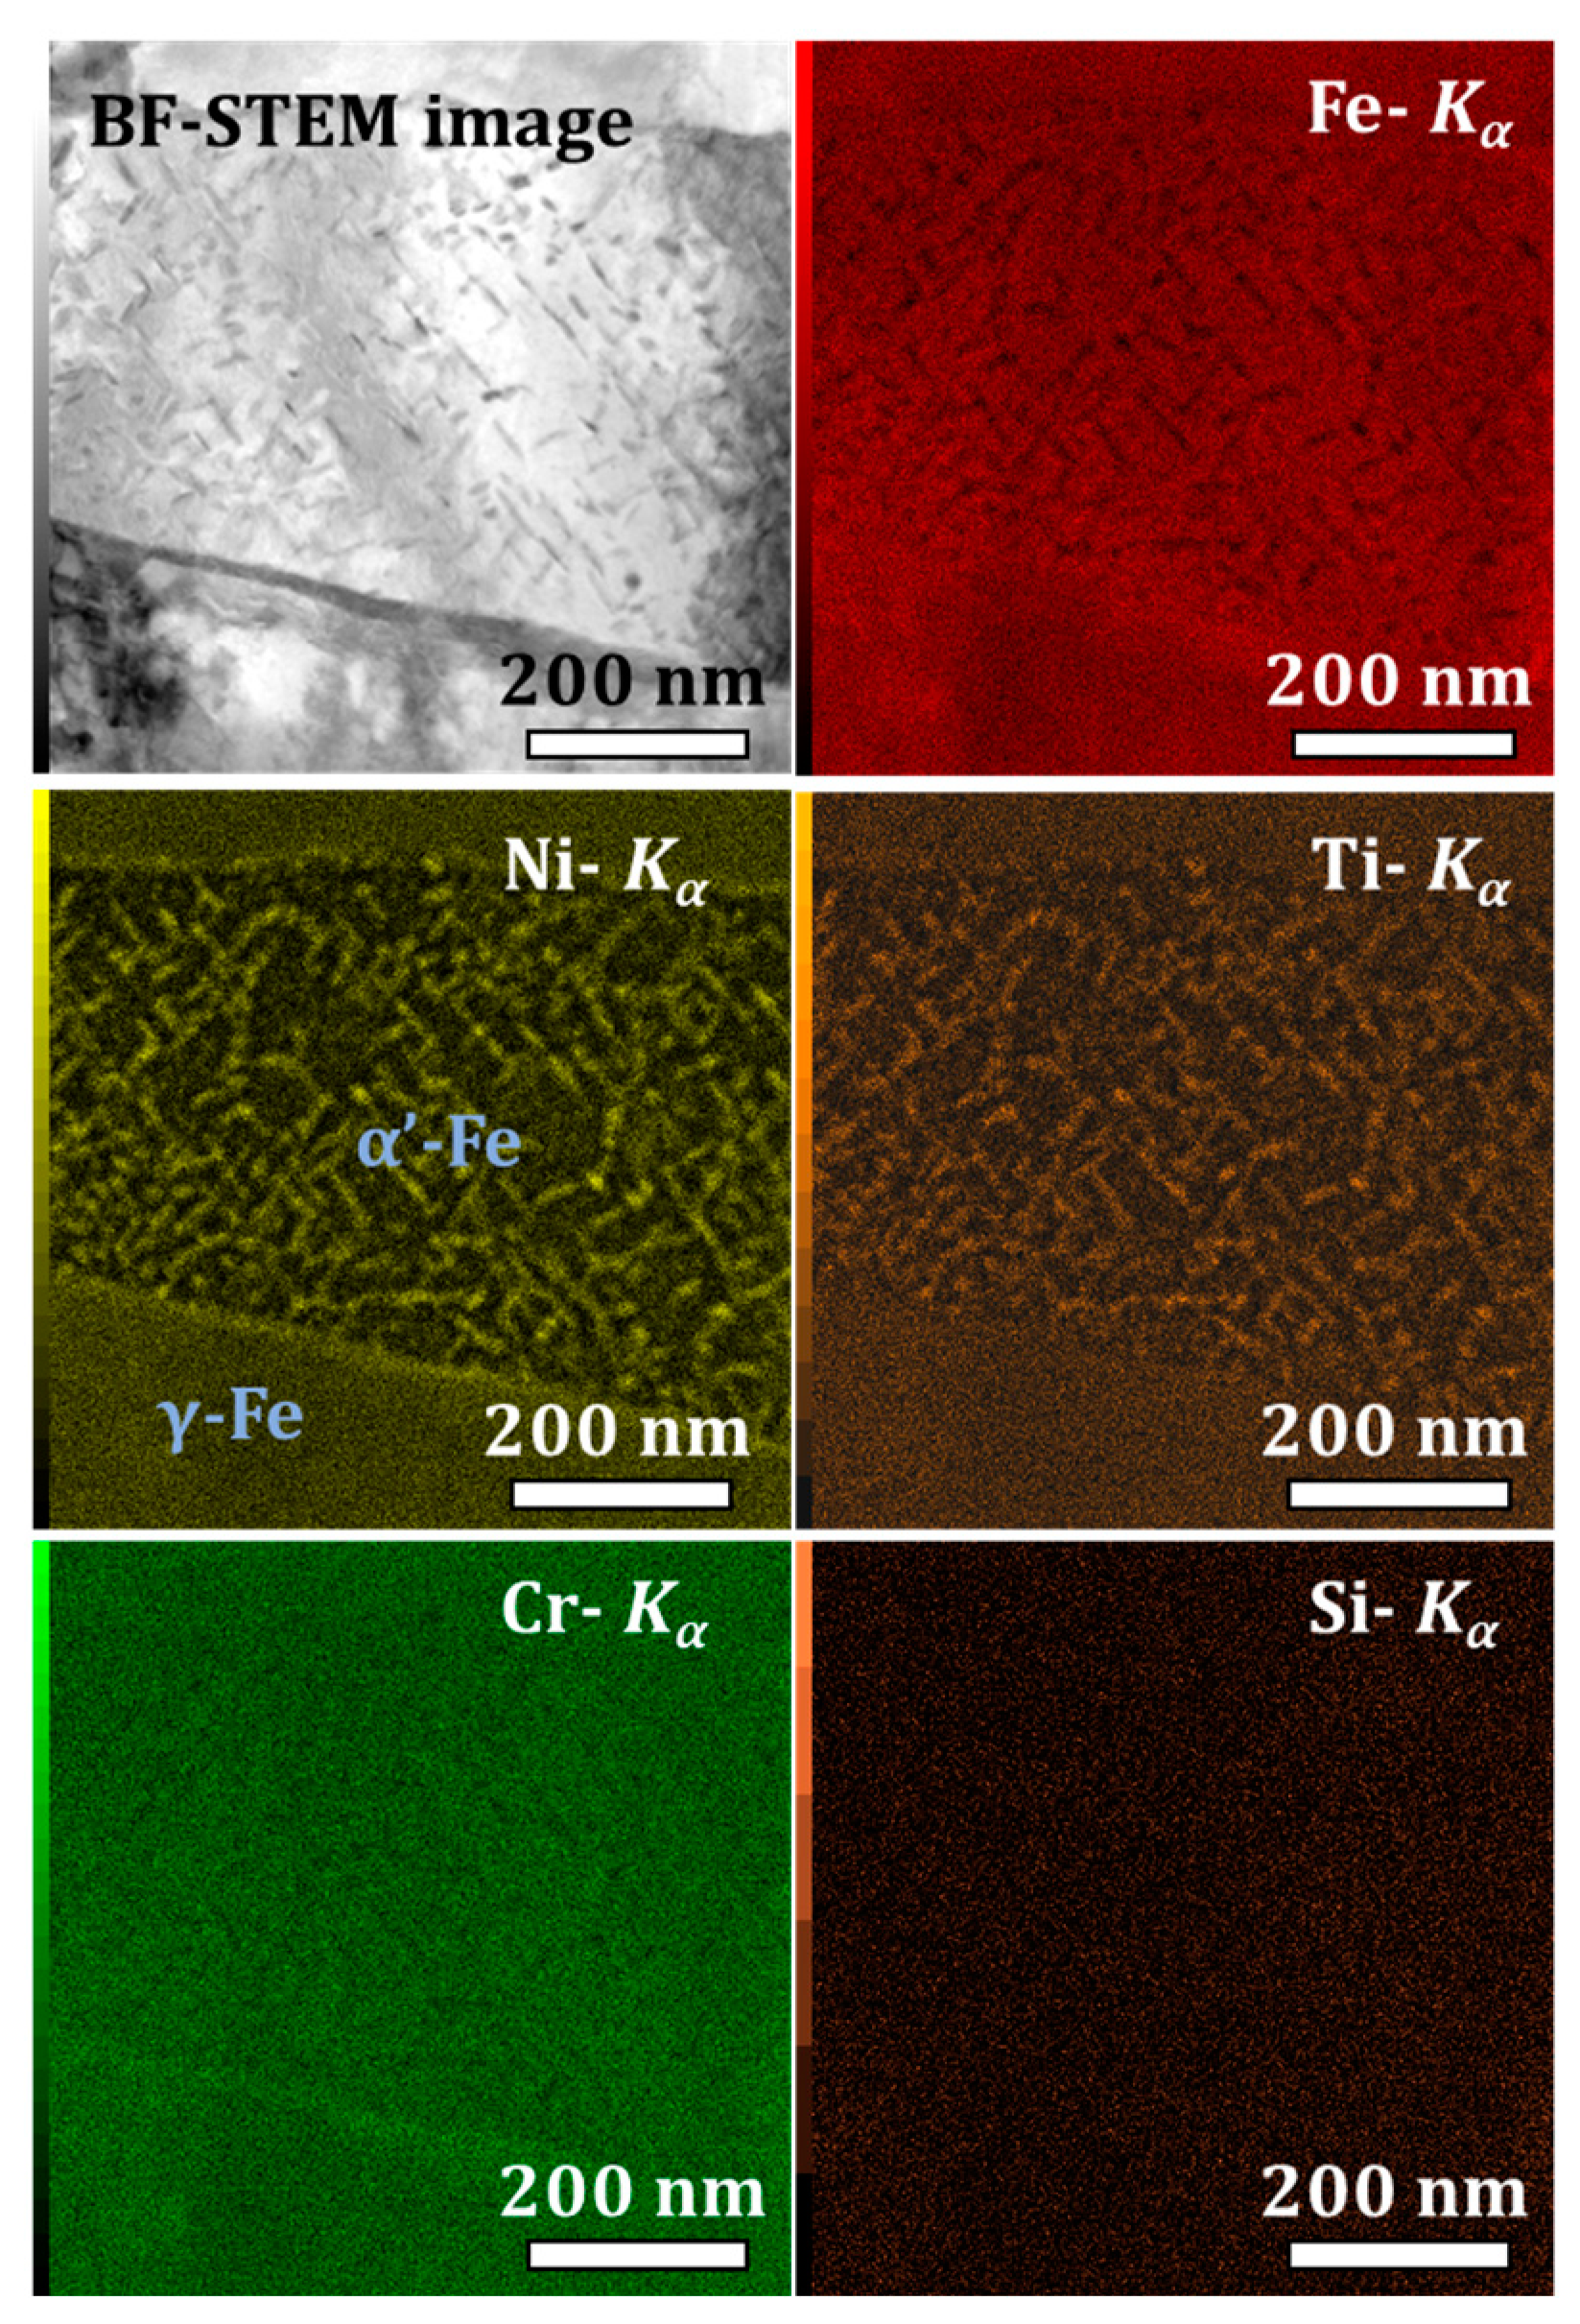
The 1.4614 grade aged at 550 °C presents only one kind of nanometric precipitate, namely hexagonal Ni3Ti (see STEM-EDS and TEM-ASTAR results) with classical rode-shape morphology. STEM-EDS maps (Figure 3) permit us to figure out that Ni3Ti are preferentially located inside the martensitic matrix rather than inside austenite (which corresponds to enriched Ni regions on Figure 3).
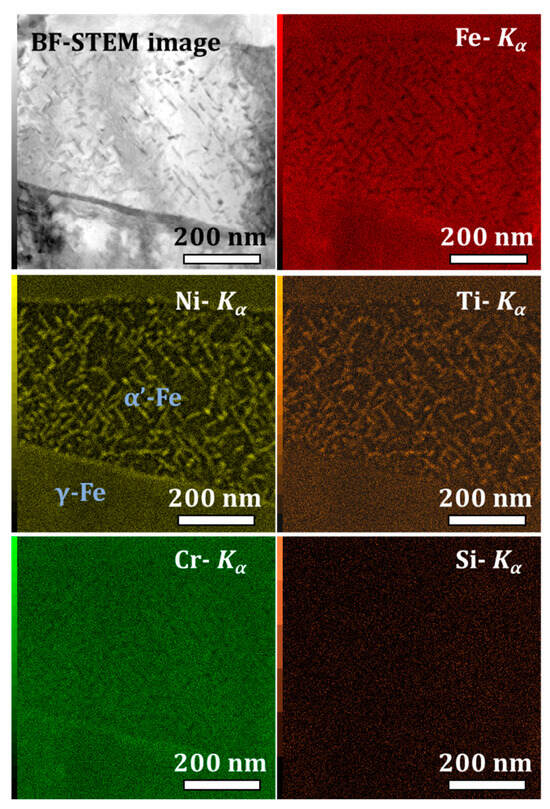
Figure 3.
Bright-Field (BF) STEM image and EDS maps (spot size 1 nm) of Fe, Ni, Ti, Cr, Si (Kα rays) of 1.4614 grade aged at 550 °C. The bottom of the image was identified as austenite, the top being martensite.
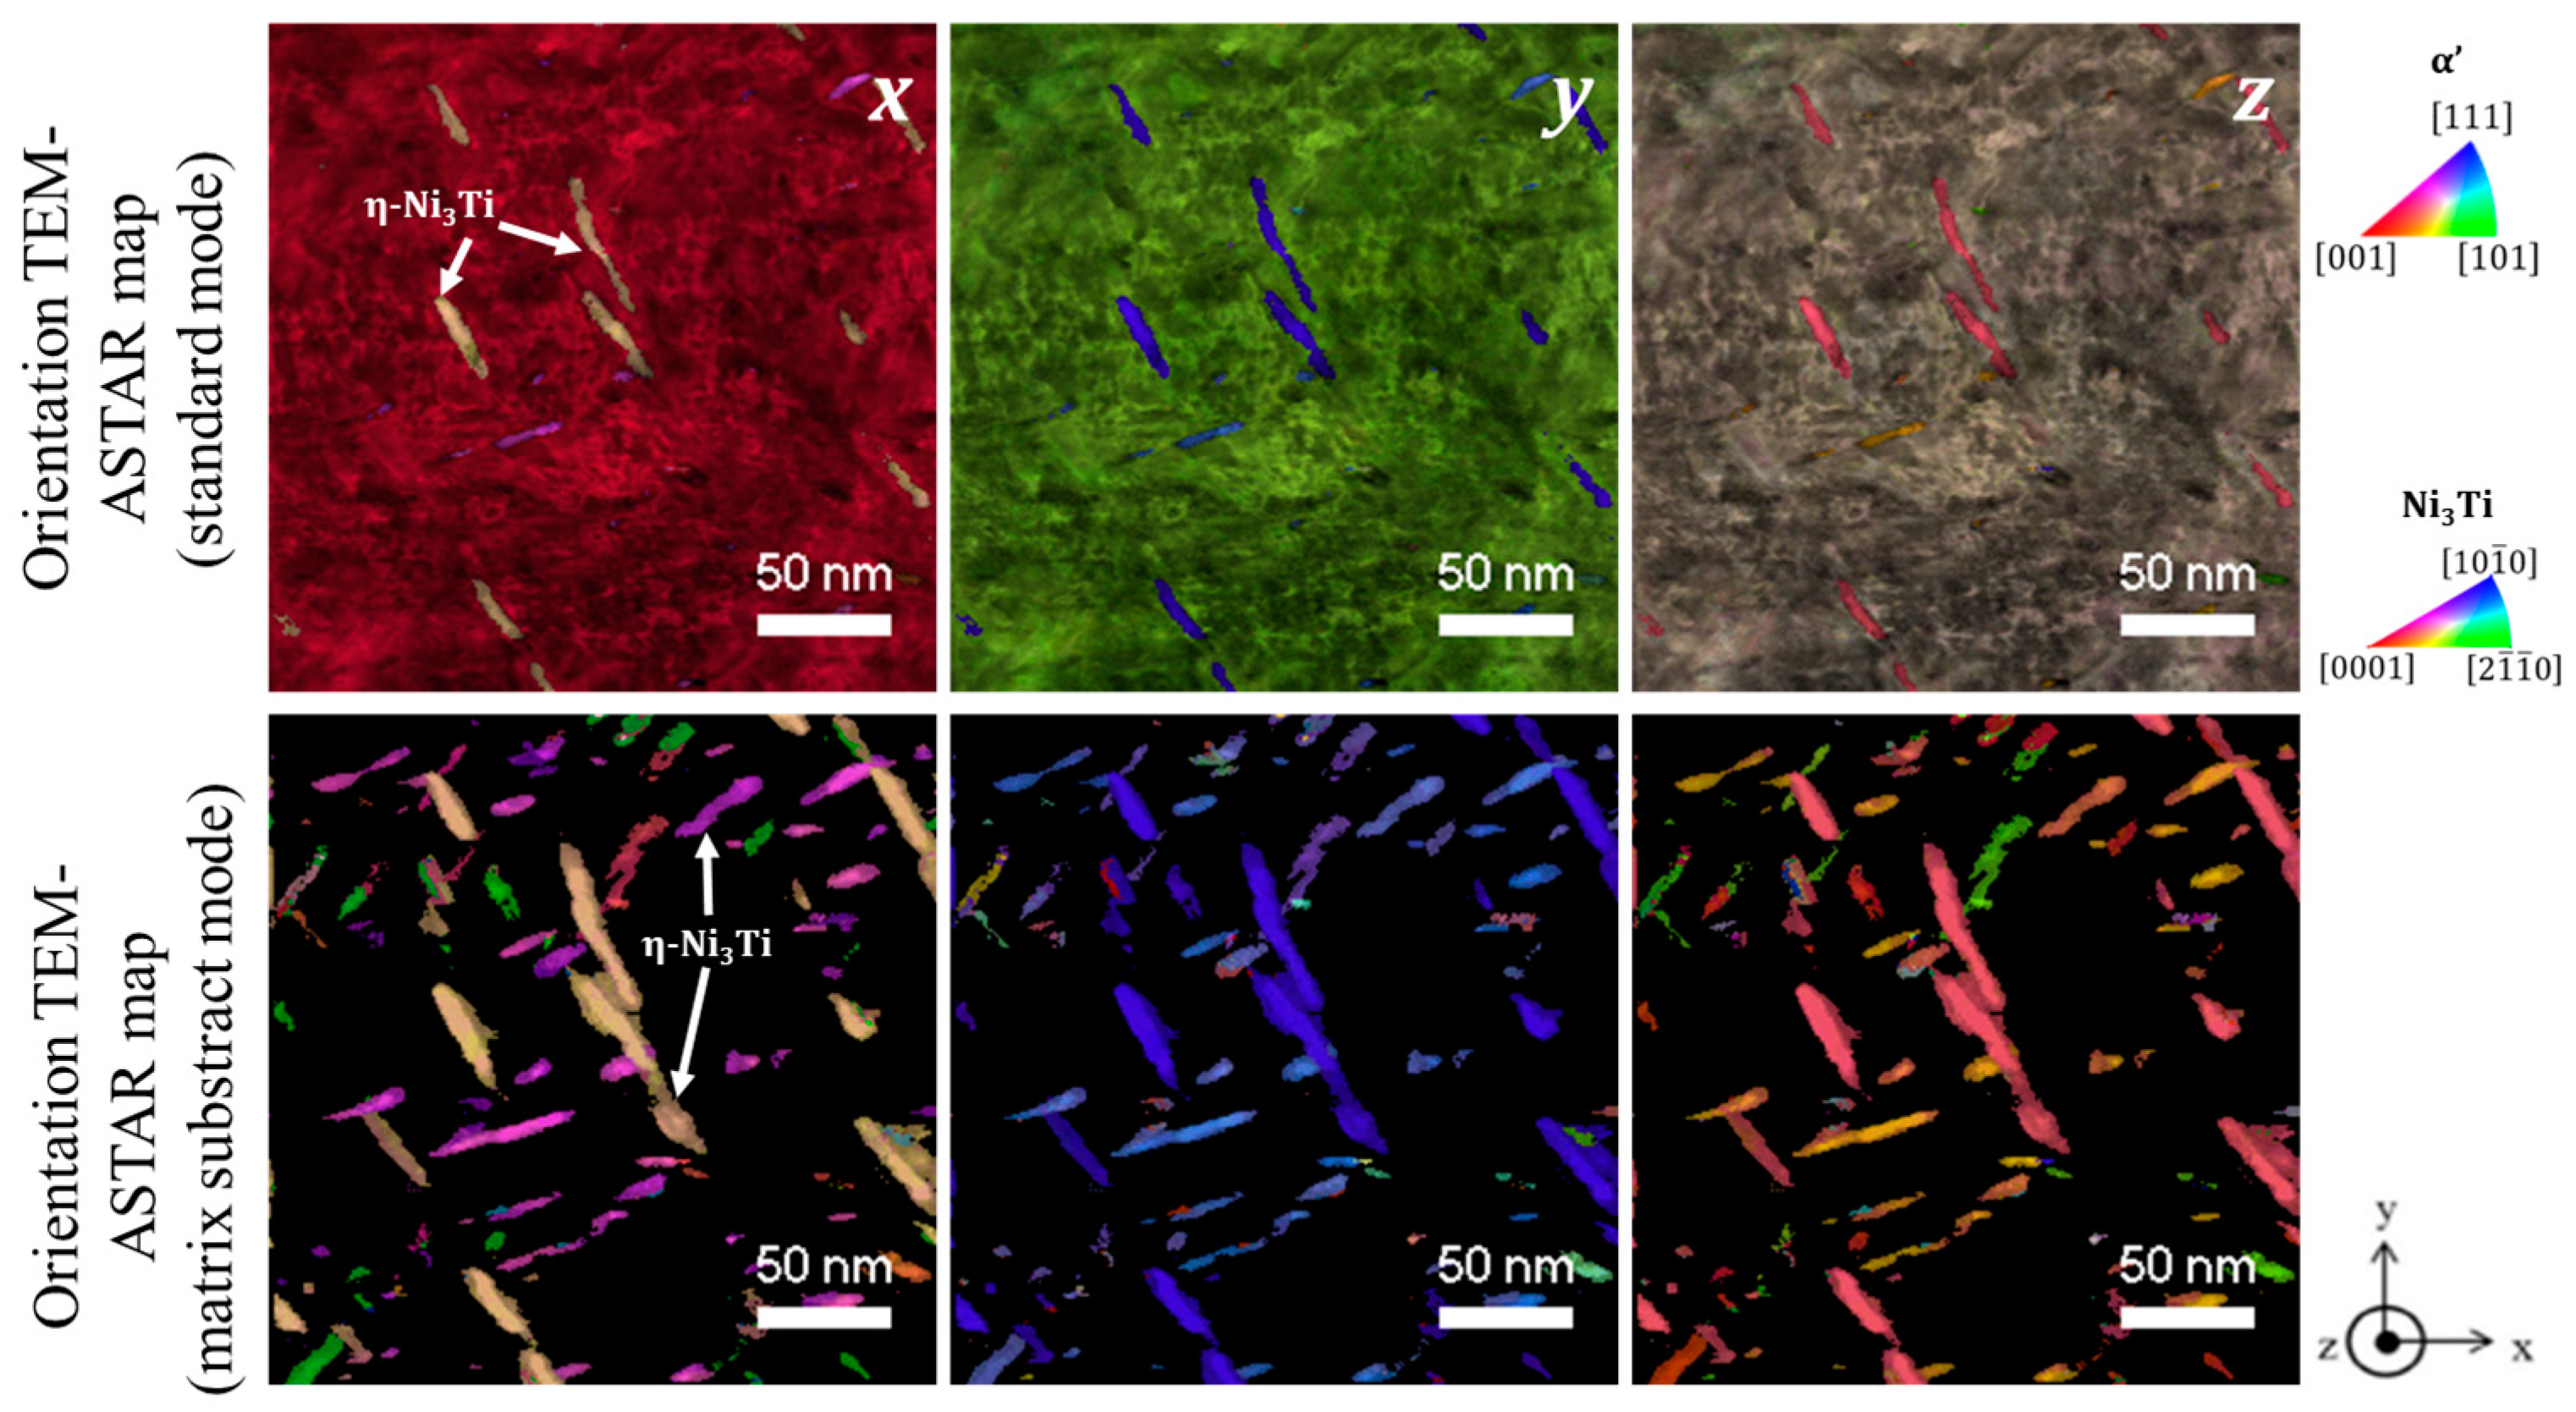
The reciprocal space is scanned on a thin area of interest during TEM-ASTAR acquisition, and calculations are then conducted with two modes. The first mode takes into account the whole diffraction pattern acquired point by point whereas the second mode subtracts the diffraction pattern from the (martensitic) metallic matrix to each diffraction pattern [11,18]. TEM-ASTAR orientation maps, conducted in the standard mode and after the matrix subtraction reveal all the precipitates in their fullness (Figure 4). It also permits us to demonstrate that these precipitates present preferential orientation relations with the martensitic matrix, with relations already reported in the literature [8,11], namely:
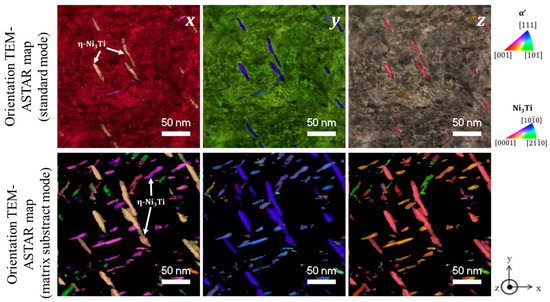
Figure 4.
TEM-ASTAR orientations maps (combined with the correlation index) in the standard (top) or matrix subtract (bottom) mode of 1.4614 grade aged at 550 °C.
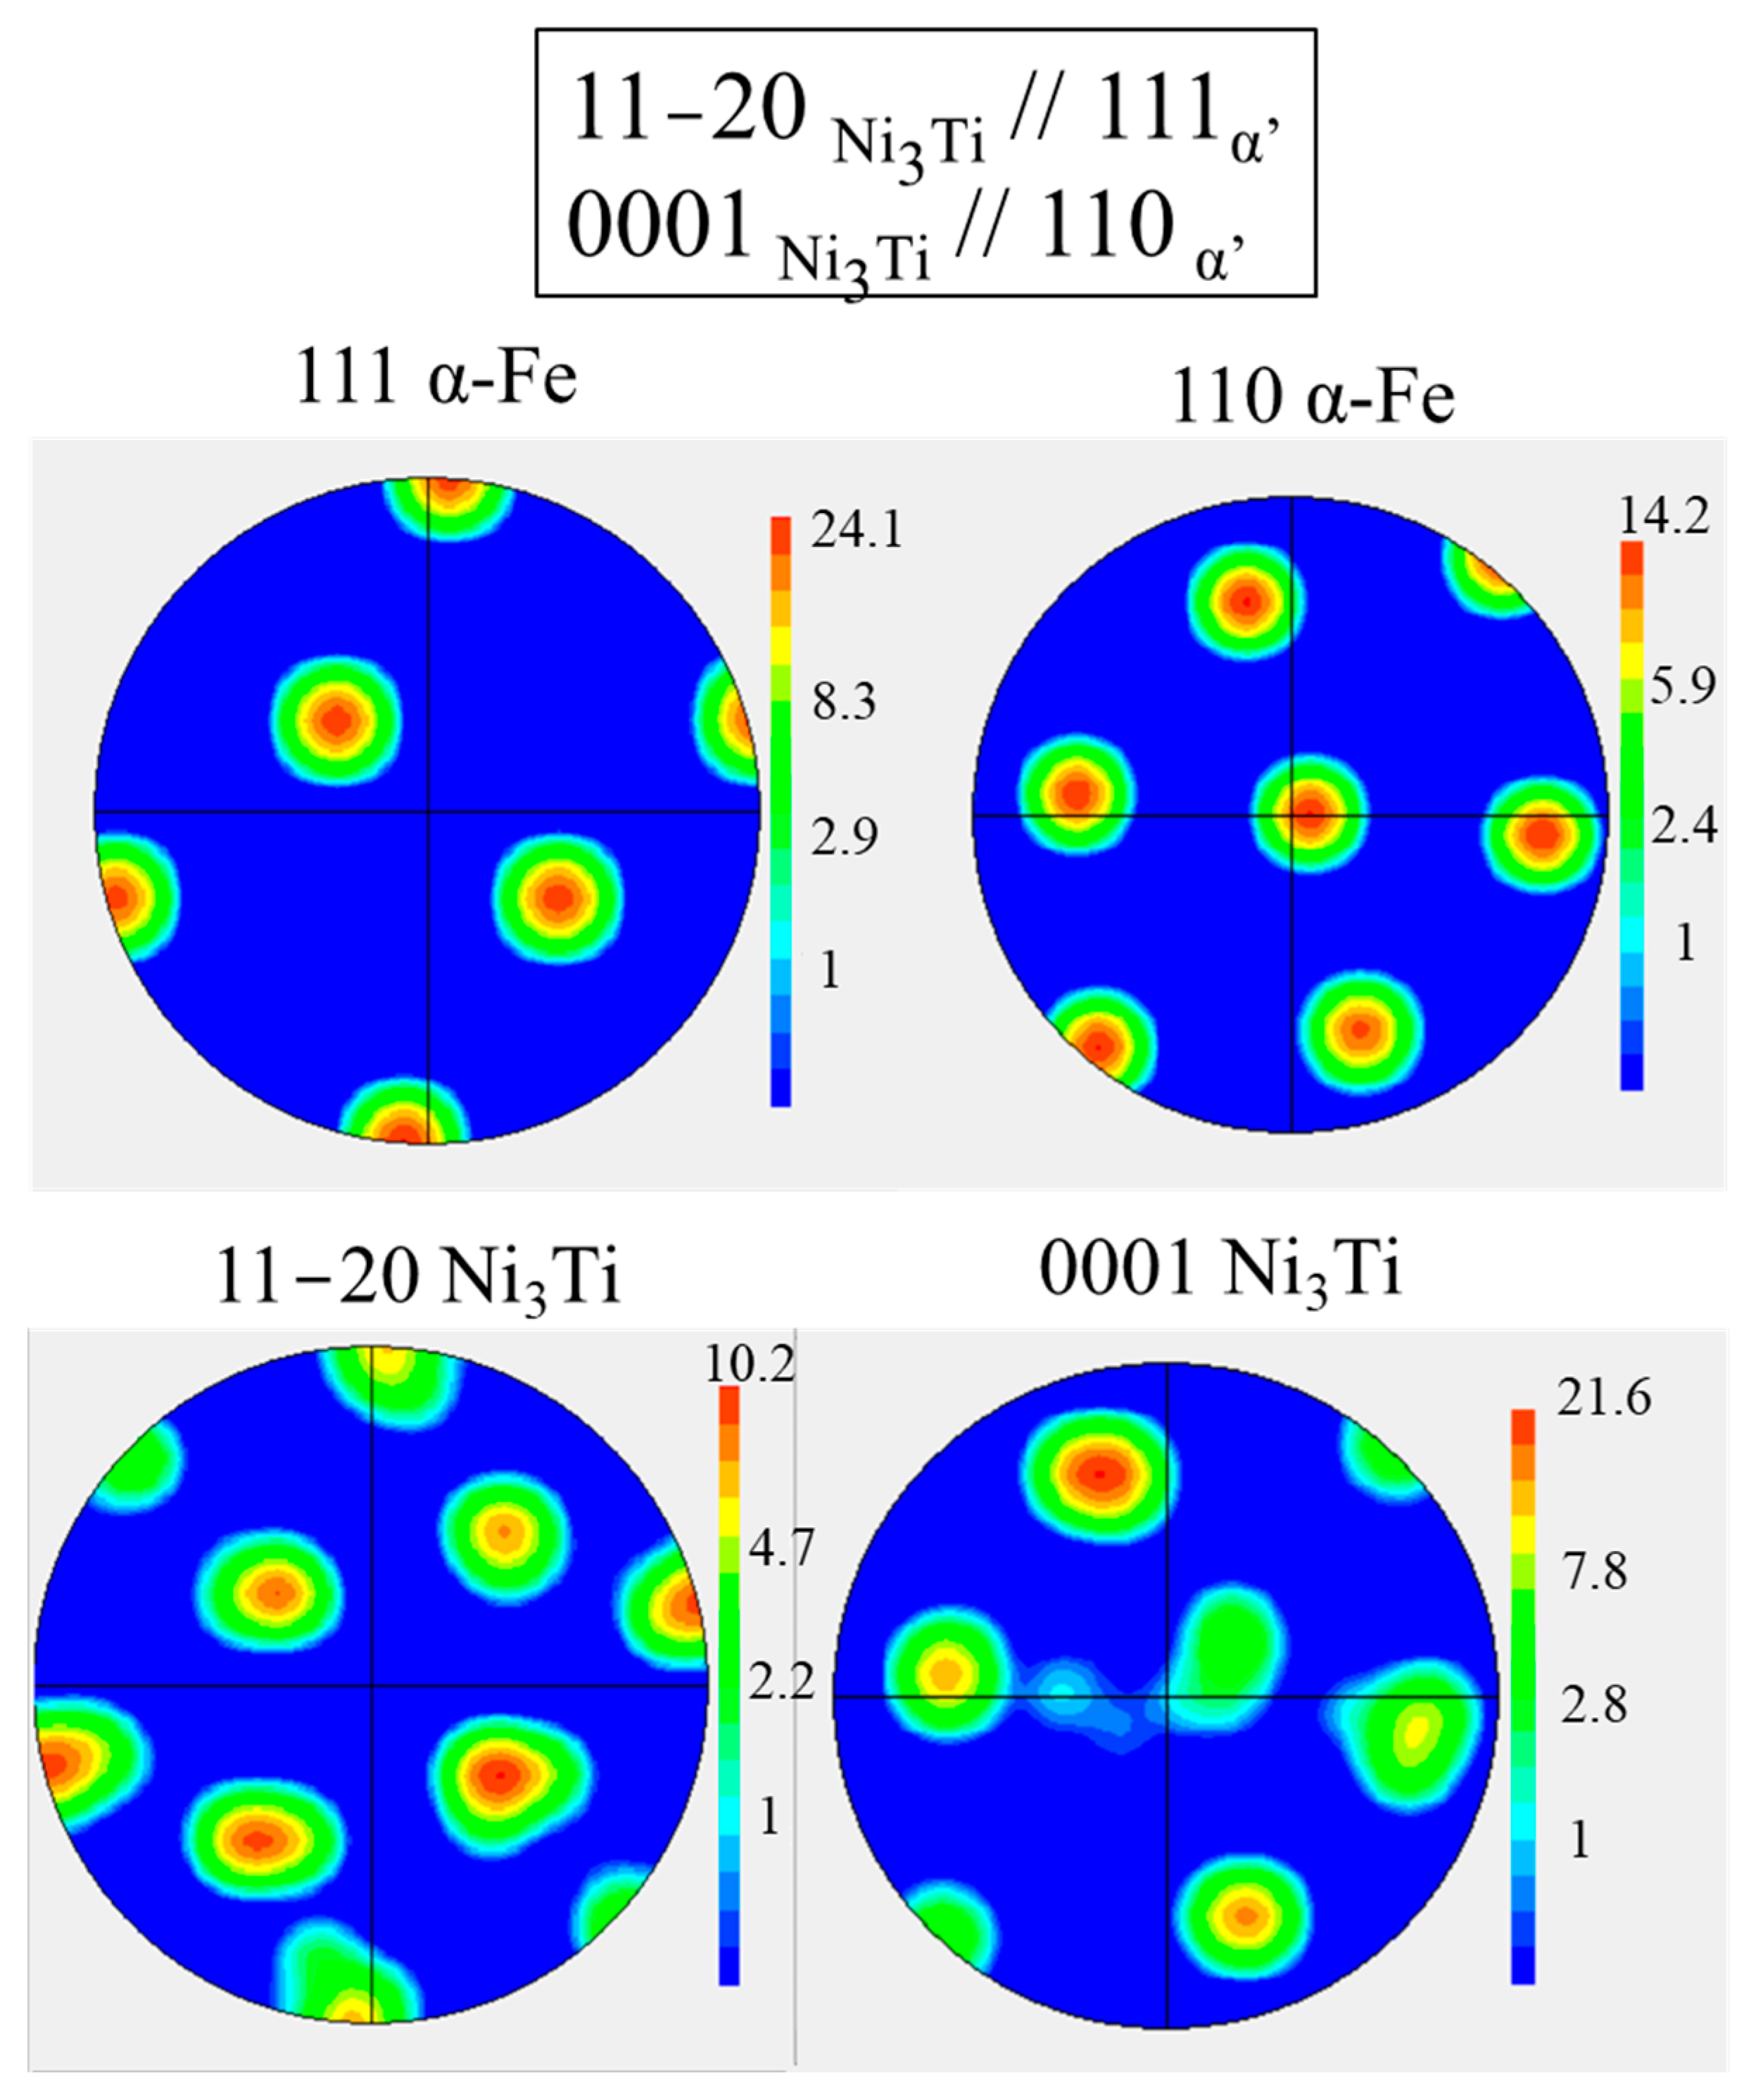
- {0001}Ni3Ti // {110}α′
- <11–20> Ni3Ti // <111>α′
The 1.4543 nanometric precipitation state after 550 °C aging is much more complex.
Scanning-TEM images coupled with EDS maps (Figure 5) provided evidence of three families of precipitates inside the metallic grains as follows:
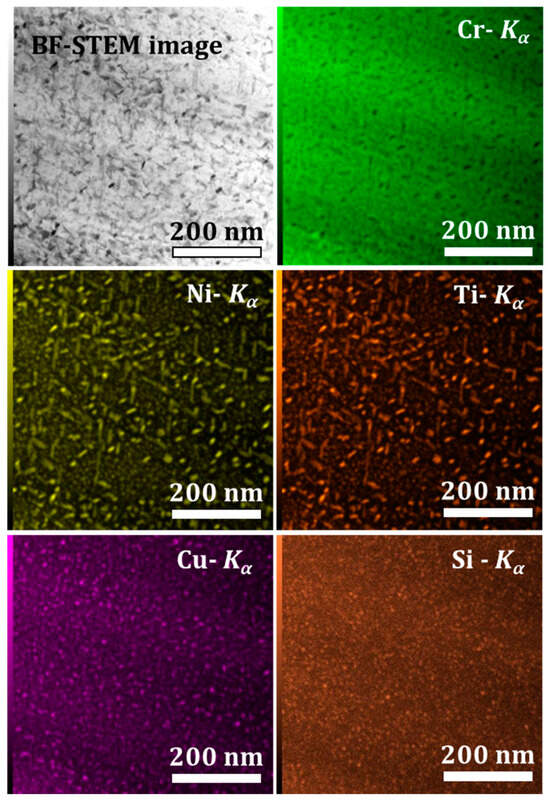
Figure 5.
Bright-Field (BF) STEM image and EDS maps (spot size 1 nm) of Fe, Ni, Ti, Cr, Si (Kα rays) of 1.4543 grade aged at 550 °C.
- -
- Ni and Ti rich precipitates, with rod shapes, that may be assigned to Ni3Ti as it will be confirmed with structural characterization;
- -
- Cu rich globular precipitates;
- -
- Si, Ni, and Ti rich globular precipitates that might be silicide Ni16Ti6Si7 G-phase as identified in the literature [22] and as it will be confirmed with structural characterization.
These precipitates in this 1.4543 550A steel are particularly tiny. The length of Ni3Ti precipitates is about 25 nm, whereas Cu precipitates have an estimated average diameter of about 5 nm and Ni-Ti-Si rich-phase precipitates are the smallest (<3 nm). Consequently, it is particularly tricky to be able to determine the structure of such nanometric precipitates embedded in a martensitic matrix (with lamellae thickness of about 50 nm). TEM-ASTAR characterizations look for the determination of the structure and orientations of these precipitates. TEM-ASTAR phases and orientations (Figure 6) maps (combined with the correlation index) are shown before and after martensitic matrix subtraction.
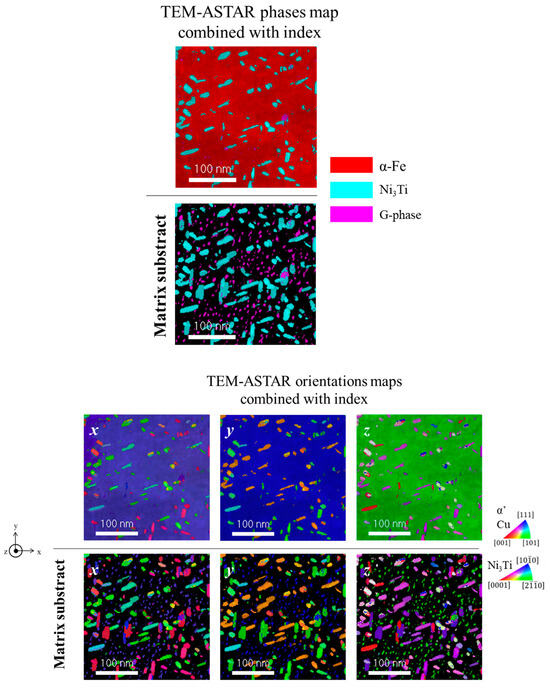
Figure 6.
(Top): 1.4543 aged at 550 °C TEM-ASTAR phases maps (before and after matrix subtraction) combined with the correlation index, of 1.4543 aged at 550 °C showing Ni3Ti (in blue) and G-phase (in pink) precipitates into the martensitic matrix (in red or in black). (Bottom): 1.4543 aged at 550 °C TEM-ASTAR orientations maps (before and after matrix subtraction) combined with the correlation index, of 1.4543 aged at 550 °C showing Ni3Ti and G-phase precipitates into the martensitic matrix. Cube-cube relations between G-phase precipitates and martensitic matrix is obvious: same colors of nanometric globular G-precipitates (maps on bottom after matrix subtraction) with martensitic matrix (maps on top) are shown on the three orientations maps shown along the three space directions.
Ni3Ti precipitates with hexagonal structure are clearly characterized into the martensitic matrix. These last ones are easily evidenced as on 1.4614 sample because the diffracting signal is dominant with respect to the matrix. The typical orientation relations between Ni3Ti precipitates and the martensitic matrix, already reported above and in the literature [8,11], are once again verified (see also Figure 7 with specific pole figures). With such two relations, 12 preferential families can exist [11]. Furthermore, it is also verified here that rod precipitates are oriented towards the <11–20> direction.
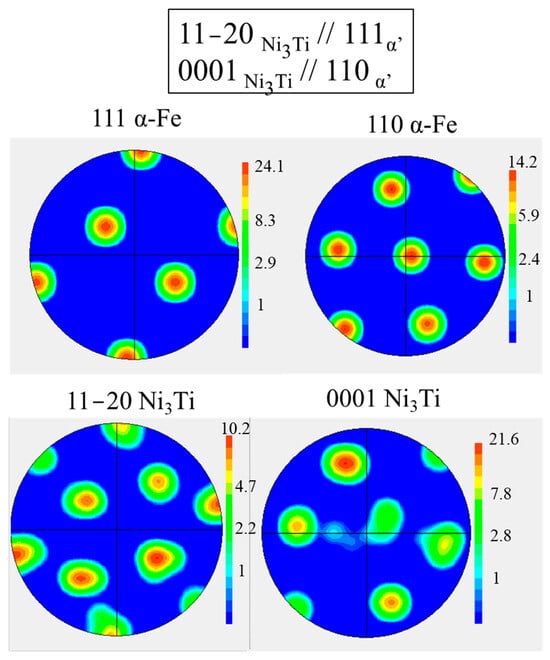
Figure 7.
Pole figures areas from TEM-ASTAR maps of martensite (111 and 110) and Ni3Ti precipitates (11–20 and 0001) showing orientation relations between both phases in 1.4543 sample aged at 550 °C.
Rich Si-Ti-Ni precipitates indeed adopt a G-phase and appear as nanometric globular precipitates. The G-phase is clearly highlighted after matrix subtract mode, and a cube-cube relation is shown between G-precipitate with the martensitic matrix (same colors on orientation maps) as seen in Figure 6. Such relations between G-phase and ferrite have already been found previously in the literature on larger G-phase silicide of about 20 to 50 nm [23,24].
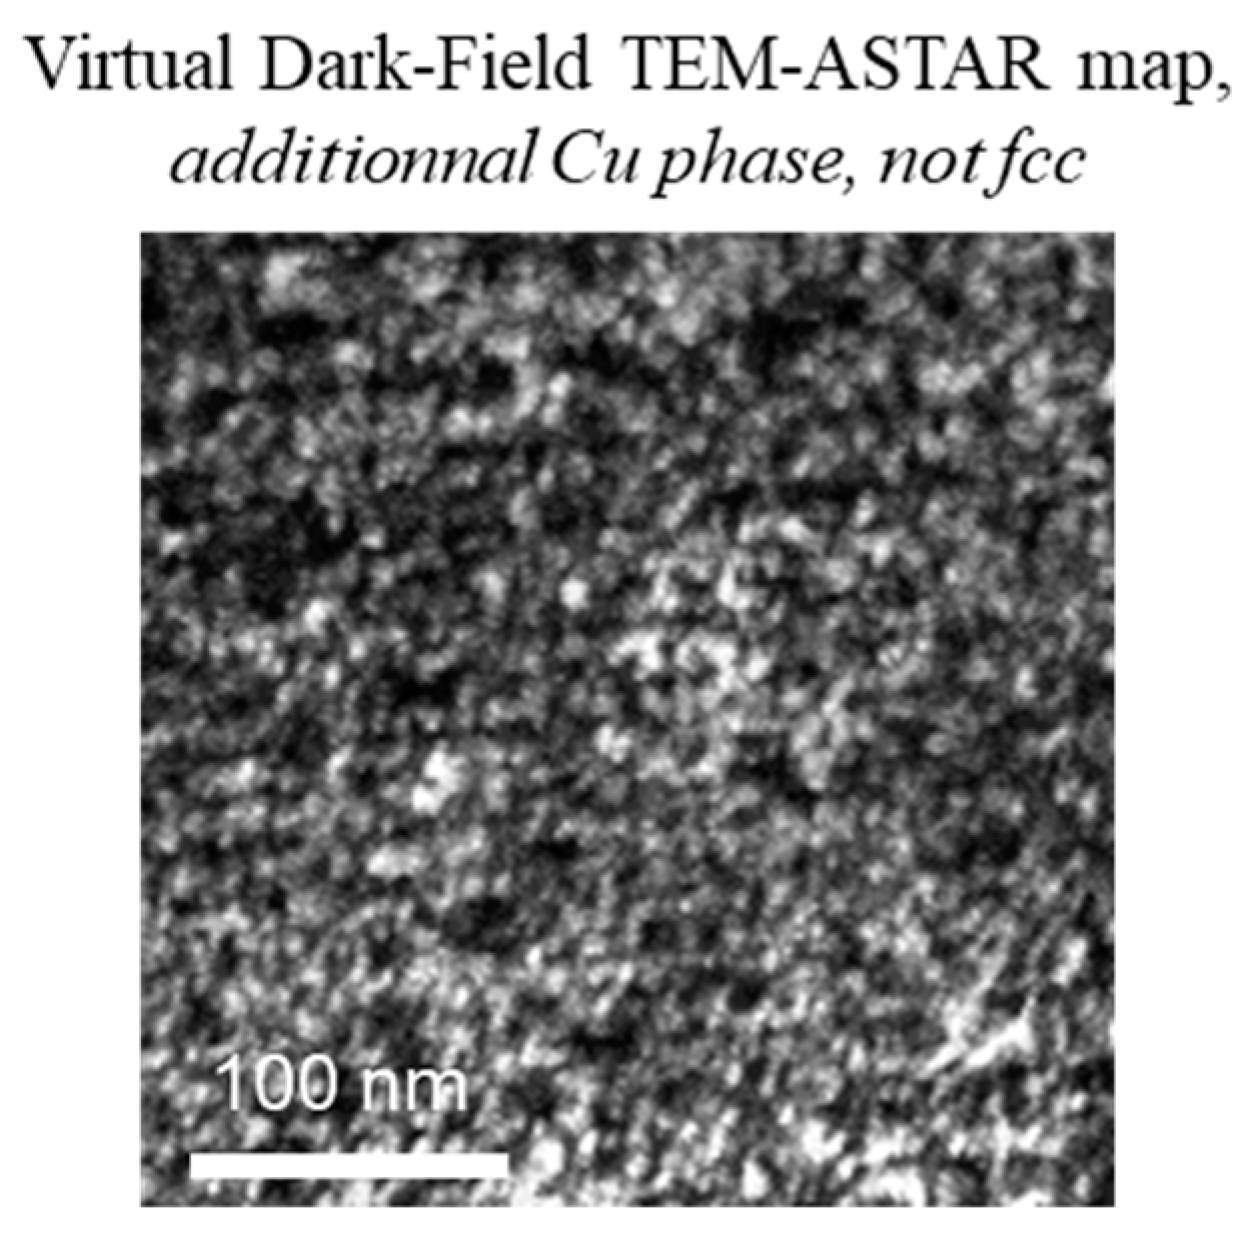
Firstly, Cu precipitates are not used as evidence from a structural point of view and these ones are clearly not face-centered-cubic (fcc). Virtual Dark Field TEM-ASTAR image from a diffraction spot, that does not belong to martensite or to hexagonal Ni3Ti or to G-phase, is believed to highlight non fcc Cu precipitates. With a single diffraction spot, it is obviously not possible to determine the crystalline structure. The spatial distribution looks like the one from the STEM-EDS map of copper, that is why Figure 8 is considered as a view of the Cu particles structural distribution. The complete illumination of a family of precipitate may suppose that preferential orientation relation with the matrix should exist. Finally, as Cu is not fcc, fcc proportion in Figure 2 clearly shows the austenite proportion.

Figure 8.
Virtual Dark-Field TEM-ASTAR image from probable Cu precipitates with unknown crystalline structure in 1.4543 sample aged at 550 °C.
3.2. Electrochemical Permeation Tests
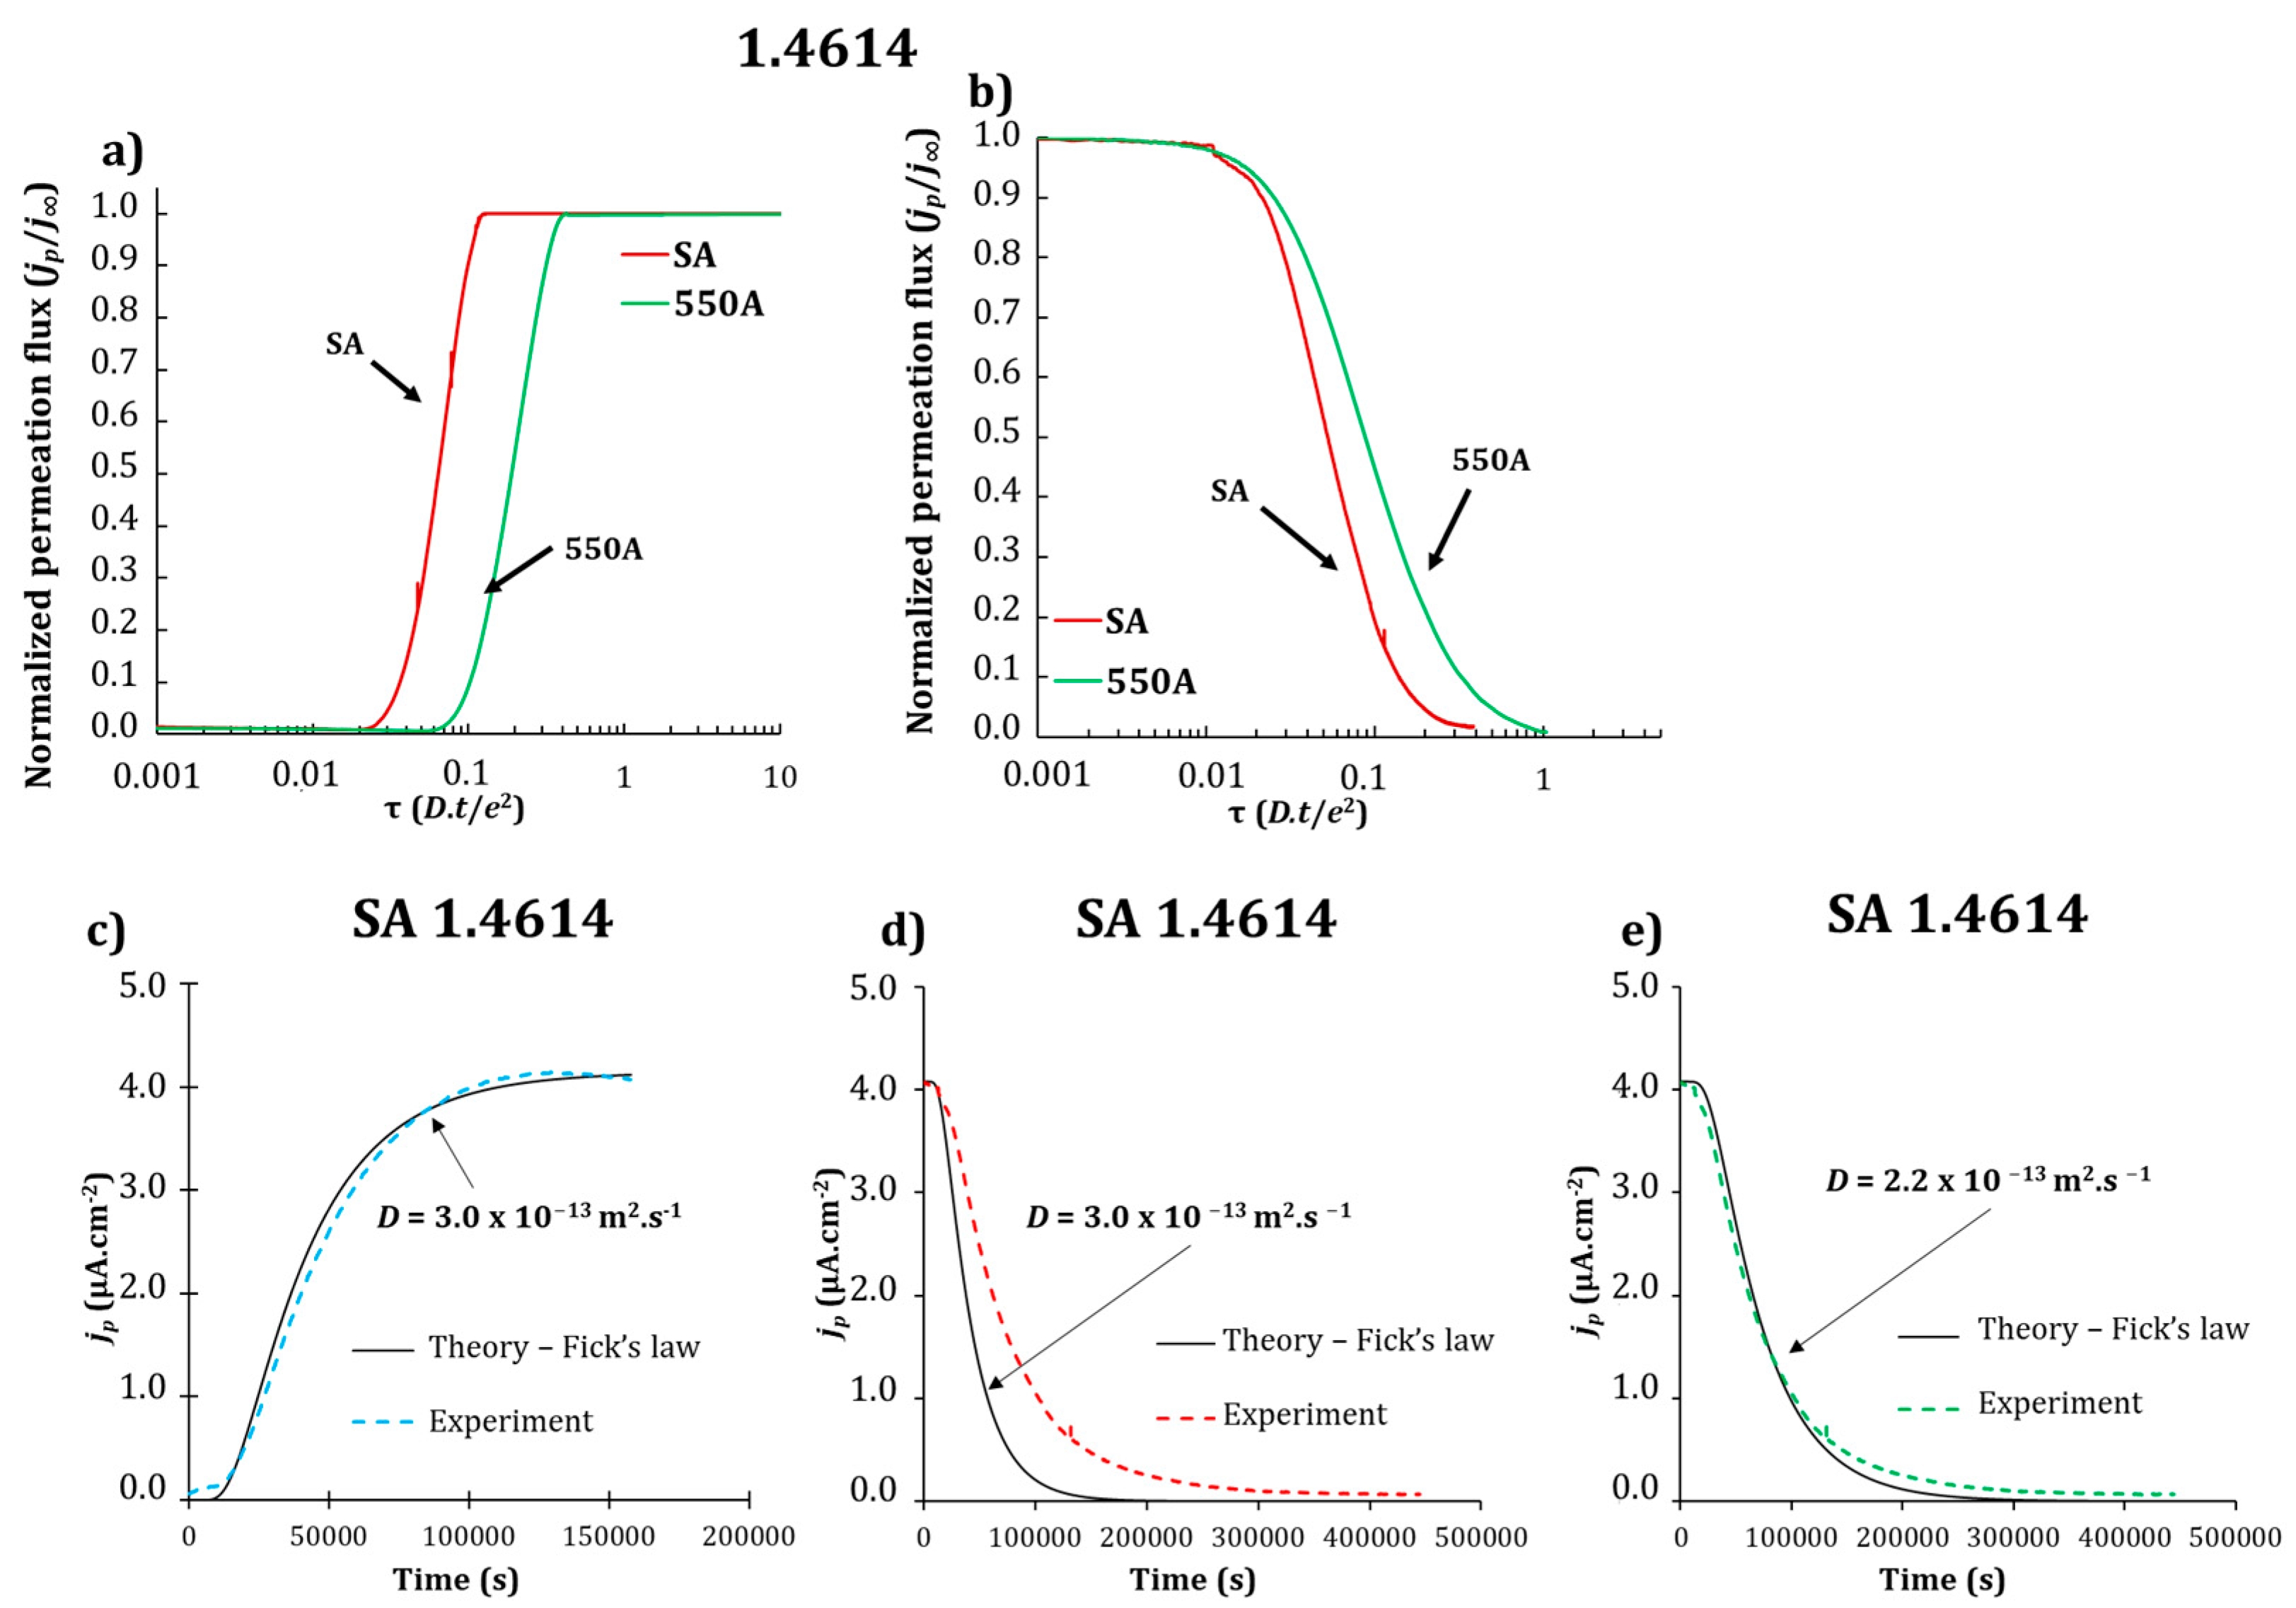
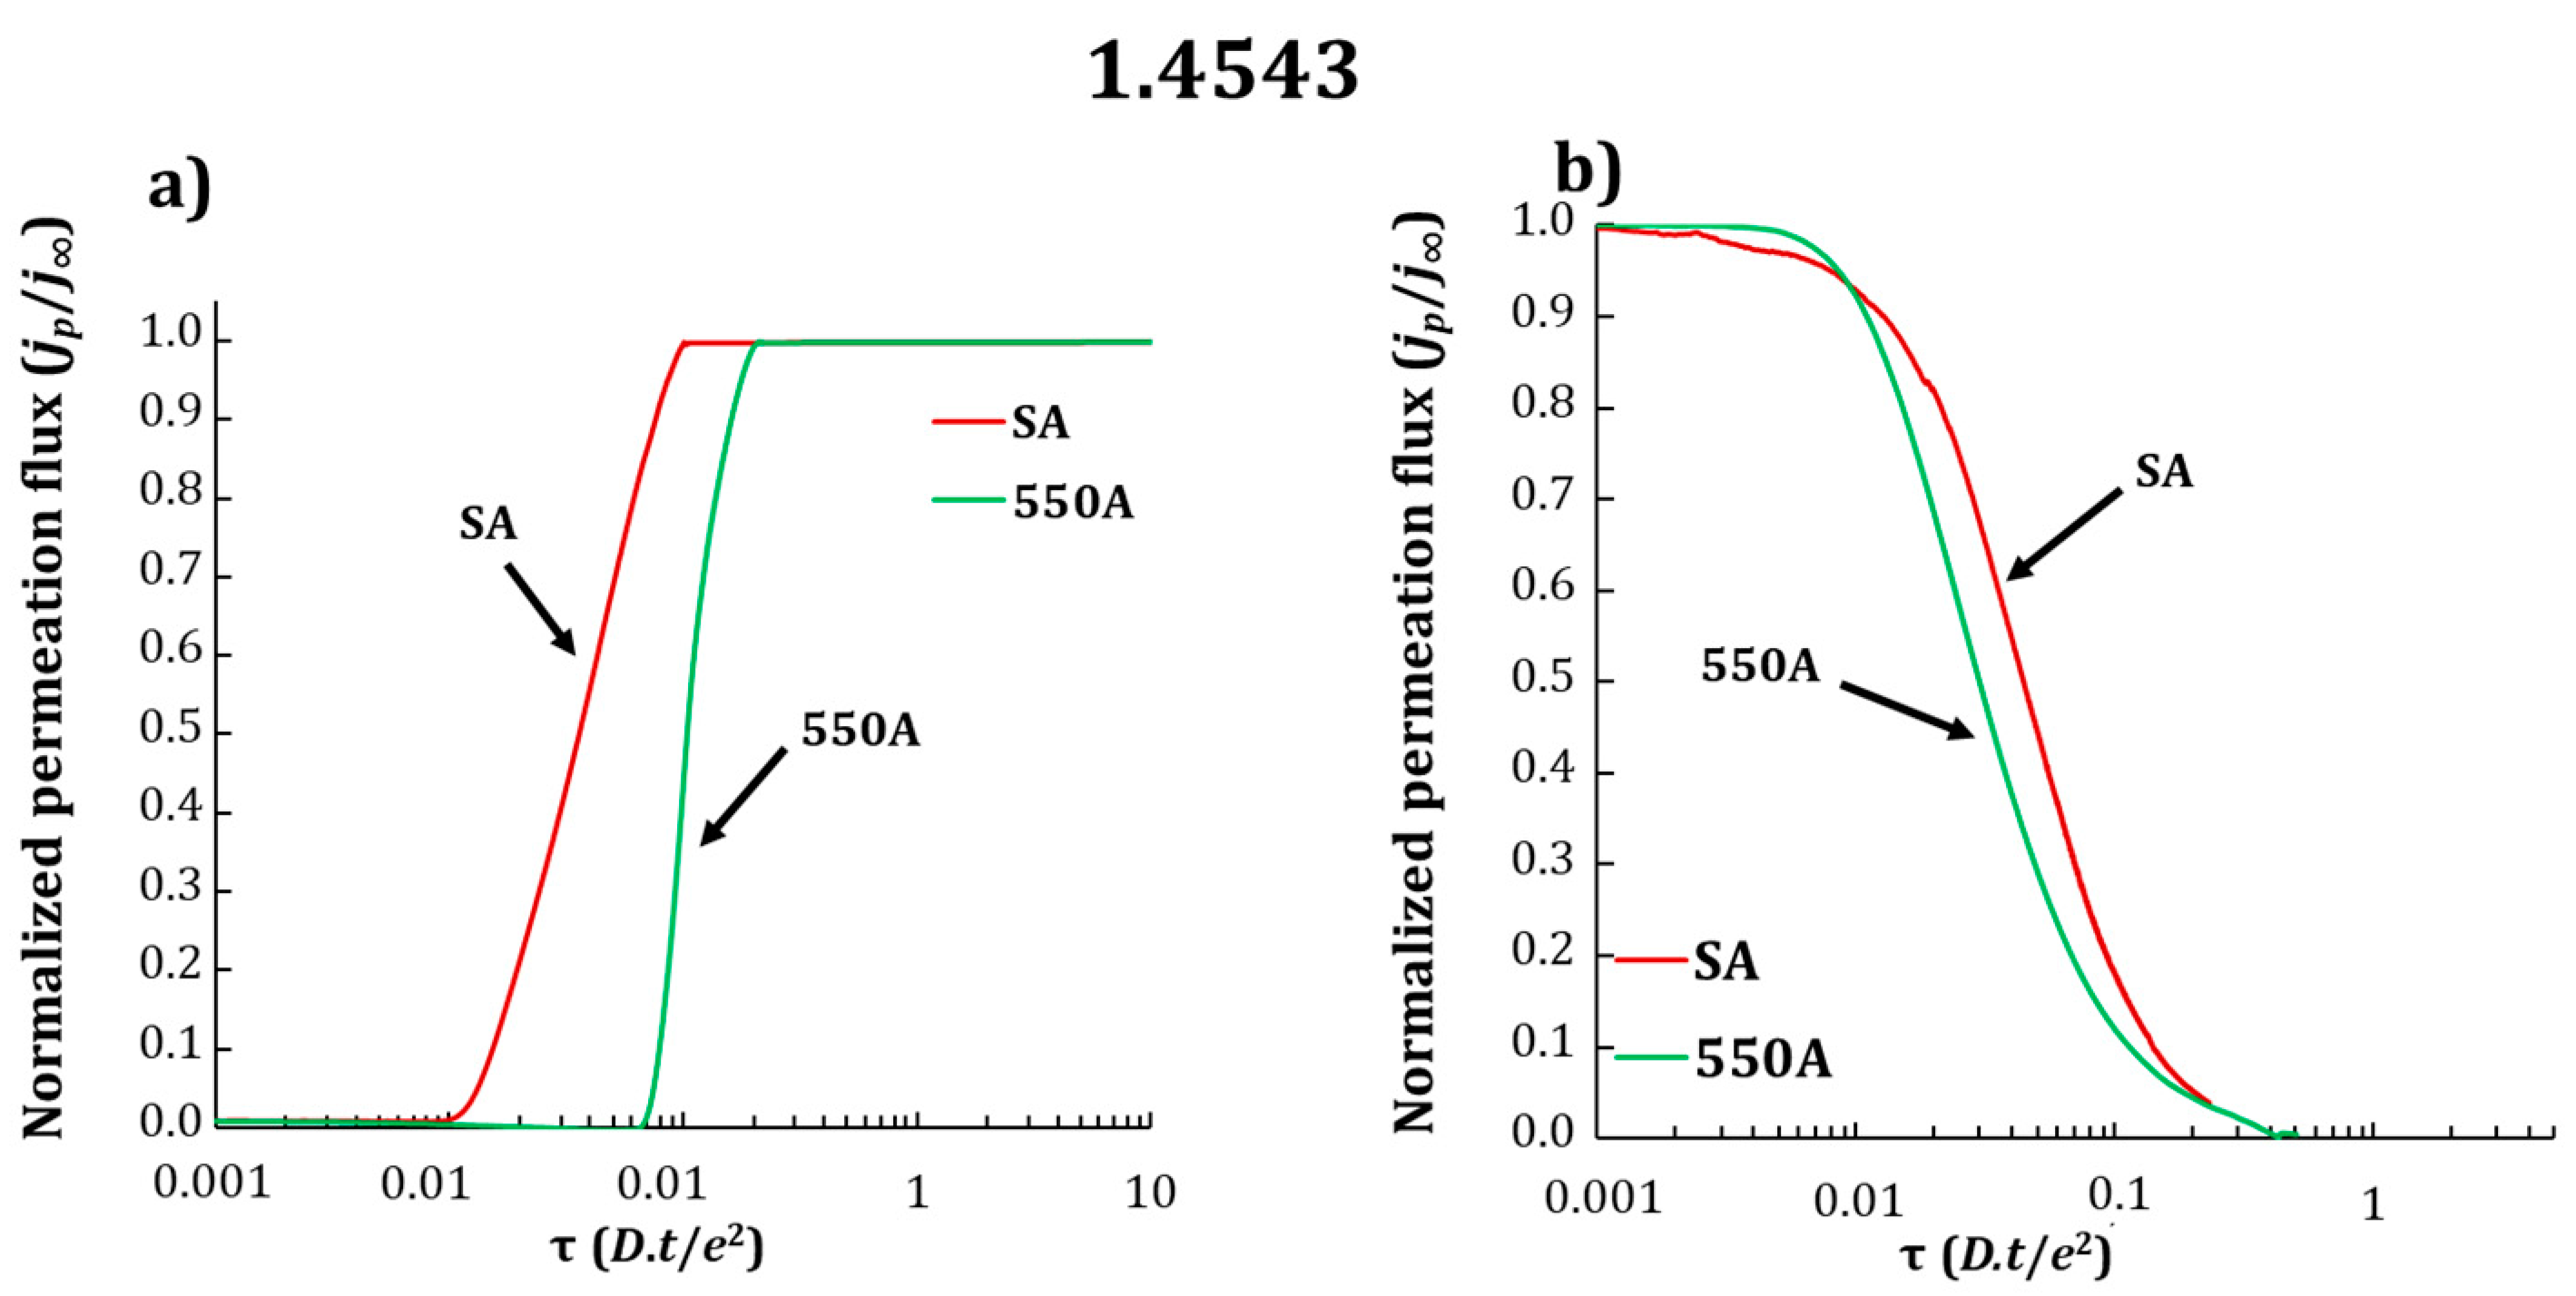
Electrochemical permeation tests have permitted us to characterize the transport of hydrogen in both grades for the two thermal treatments. Both absorption and desorption curves are presented in Figure 9 and Figure 10 for the two grades. For both 550A states, absorption current transient is delayed compared to the corresponding SA sample. This first observation suggests that both 550A samples present additional traps compared to solution-annealed samples. Apparent hydrogen diffusion coefficients determined at 23 °C are indicated in Table 4 and they ranged between 1 and 4 × 10⁻¹³ m2·s−1.
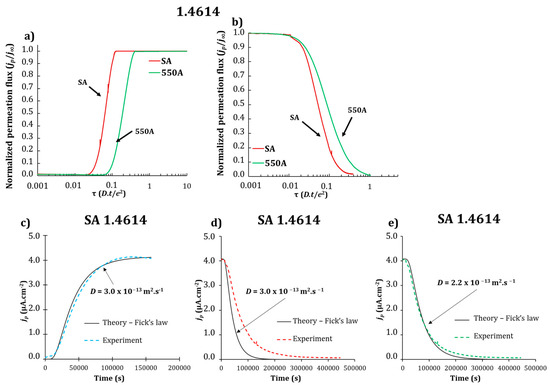
Figure 9.
Normalized permeation curves obtained at 23 °C of the absorption (a) and desorption (b) transient of 1.4614 grade in SA: solution-annealed and 550A: 550 °C aged state. The x-axis in (a) and (b) is the dimensionless time τ (D.t/L2), with L being the membrane thickness, t the time and D the diffusivity in pure iron. Experimental absorption (c) and desorption (d,e) transient curves of SA 1.4614 grade are shown with the calculated ones using Fick’s law with apparent hydrogen diffusion coefficient extracted from the absorption transient (d) or from the desorption transient (e). The x-axis in (c–e) is the time t.
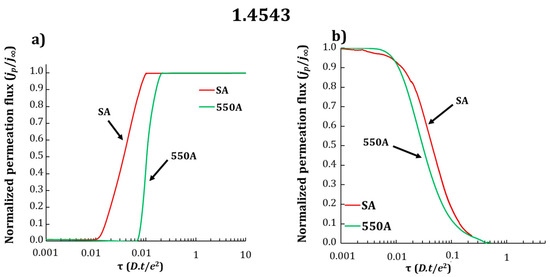
Figure 10.
Normalized permeation curves obtained at 23 °C of the absorption (a) and desorption (b) transient of 1.4543 grade in SA: solution-annealed and 550A: 550 °C aged state. The x-axis is the dimensionless time τ (D.t/L2), with L being the membrane thickness, t the time and D the diffusivity in pure iron.
Table 4.
Hydrogen apparent diffusion coefficients of SA and 550A states of 1.4614 and 1.4543 grades from electrochemical permeation tests in the absorption transient.
Apparent hydrogen diffusion coefficients (given at room temperature, 23 °C) of solution-annealed samples of both grades appear to be similar, even if retained austenite proportions in both samples are distinct, (3.0 +/− 0.8) × 10−13 m2·s−1 (resp. (3.8 +/− 0.1) × 10−13 m2·s−1) for 1.4614 sample (resp. 1.4543 sample). The same order of magnitude has been found in a previous work conducted on 17-4 PH grade [18] ((3.4 +/− 0.6) × 10−13 m2·s−1 for the solution-annealed state). This experimental observation shows that hydrogen diffusion in maraging stainless steel is primarily governed by the martensitic matrix which contains a high density of structural defects, namely a high density of dislocations and grain and lath boundaries.
It is experimentally observed that the apparent diffusion coefficients decrease from SA to 550A samples for both grades, and this decrease appears to be significant with respect to reproducible tests. This phenomenon is attributed to the effect of nanometric precipitates which tend to trap hydrogen in 1.4543 grade because no other major microstructure modification between SA and 550A states can be argued except for a slight decrease of dislocation density, while the nanometric precipitation is rich and complex for this grade. As for the 1.4614 sample, the interpretation cannot be immediate because, between two states (SA and 550A), precipitation of Ni3Ti has occurred but some additional reverted austenite has also been formed. The interpretation is much more complex when one has a look at the non-classical feature of desorption for the electrochemical curves of SA 1.4614 grade (see Figure 9c–e). It appears that the apparent diffusion coefficient of desorption seems to be different to the absorption one for the SA 1.4614 sample. In general, hydrogen absorption appears to be slower than hydrogen desorption-it is indeed here the case for SA 1.4543 grade or for the 550A state for both grades-. In the case of SA 1.4614 grade, the contrary is observed, hydrogen desorption appears to be slower than hydrogen absorption (see Figure 9c–e) and it obviously prevents in this case to extract any hydrogen concentrations [18,25]. In the literature though, the “usual” behavior of permeation transients, for which the diffusion coefficient seems to be higher at the desorption than at the absorption, was observed for a SA 1.4614 grade [12]. However, it should be noticed that in the reported case of reference [12], no retained austenite was present because of cryogenic treatment after annealing, which also explains why SA hydrogen apparent coefficient diffusion was higher for that 1.4614 grade compared to our present study. This ‘asymmetrical’ surprising behavior between absorption and desorption characteristic of SA 1.4614 grade will be discussed together with TDS results.
3.3. Thermodesorption
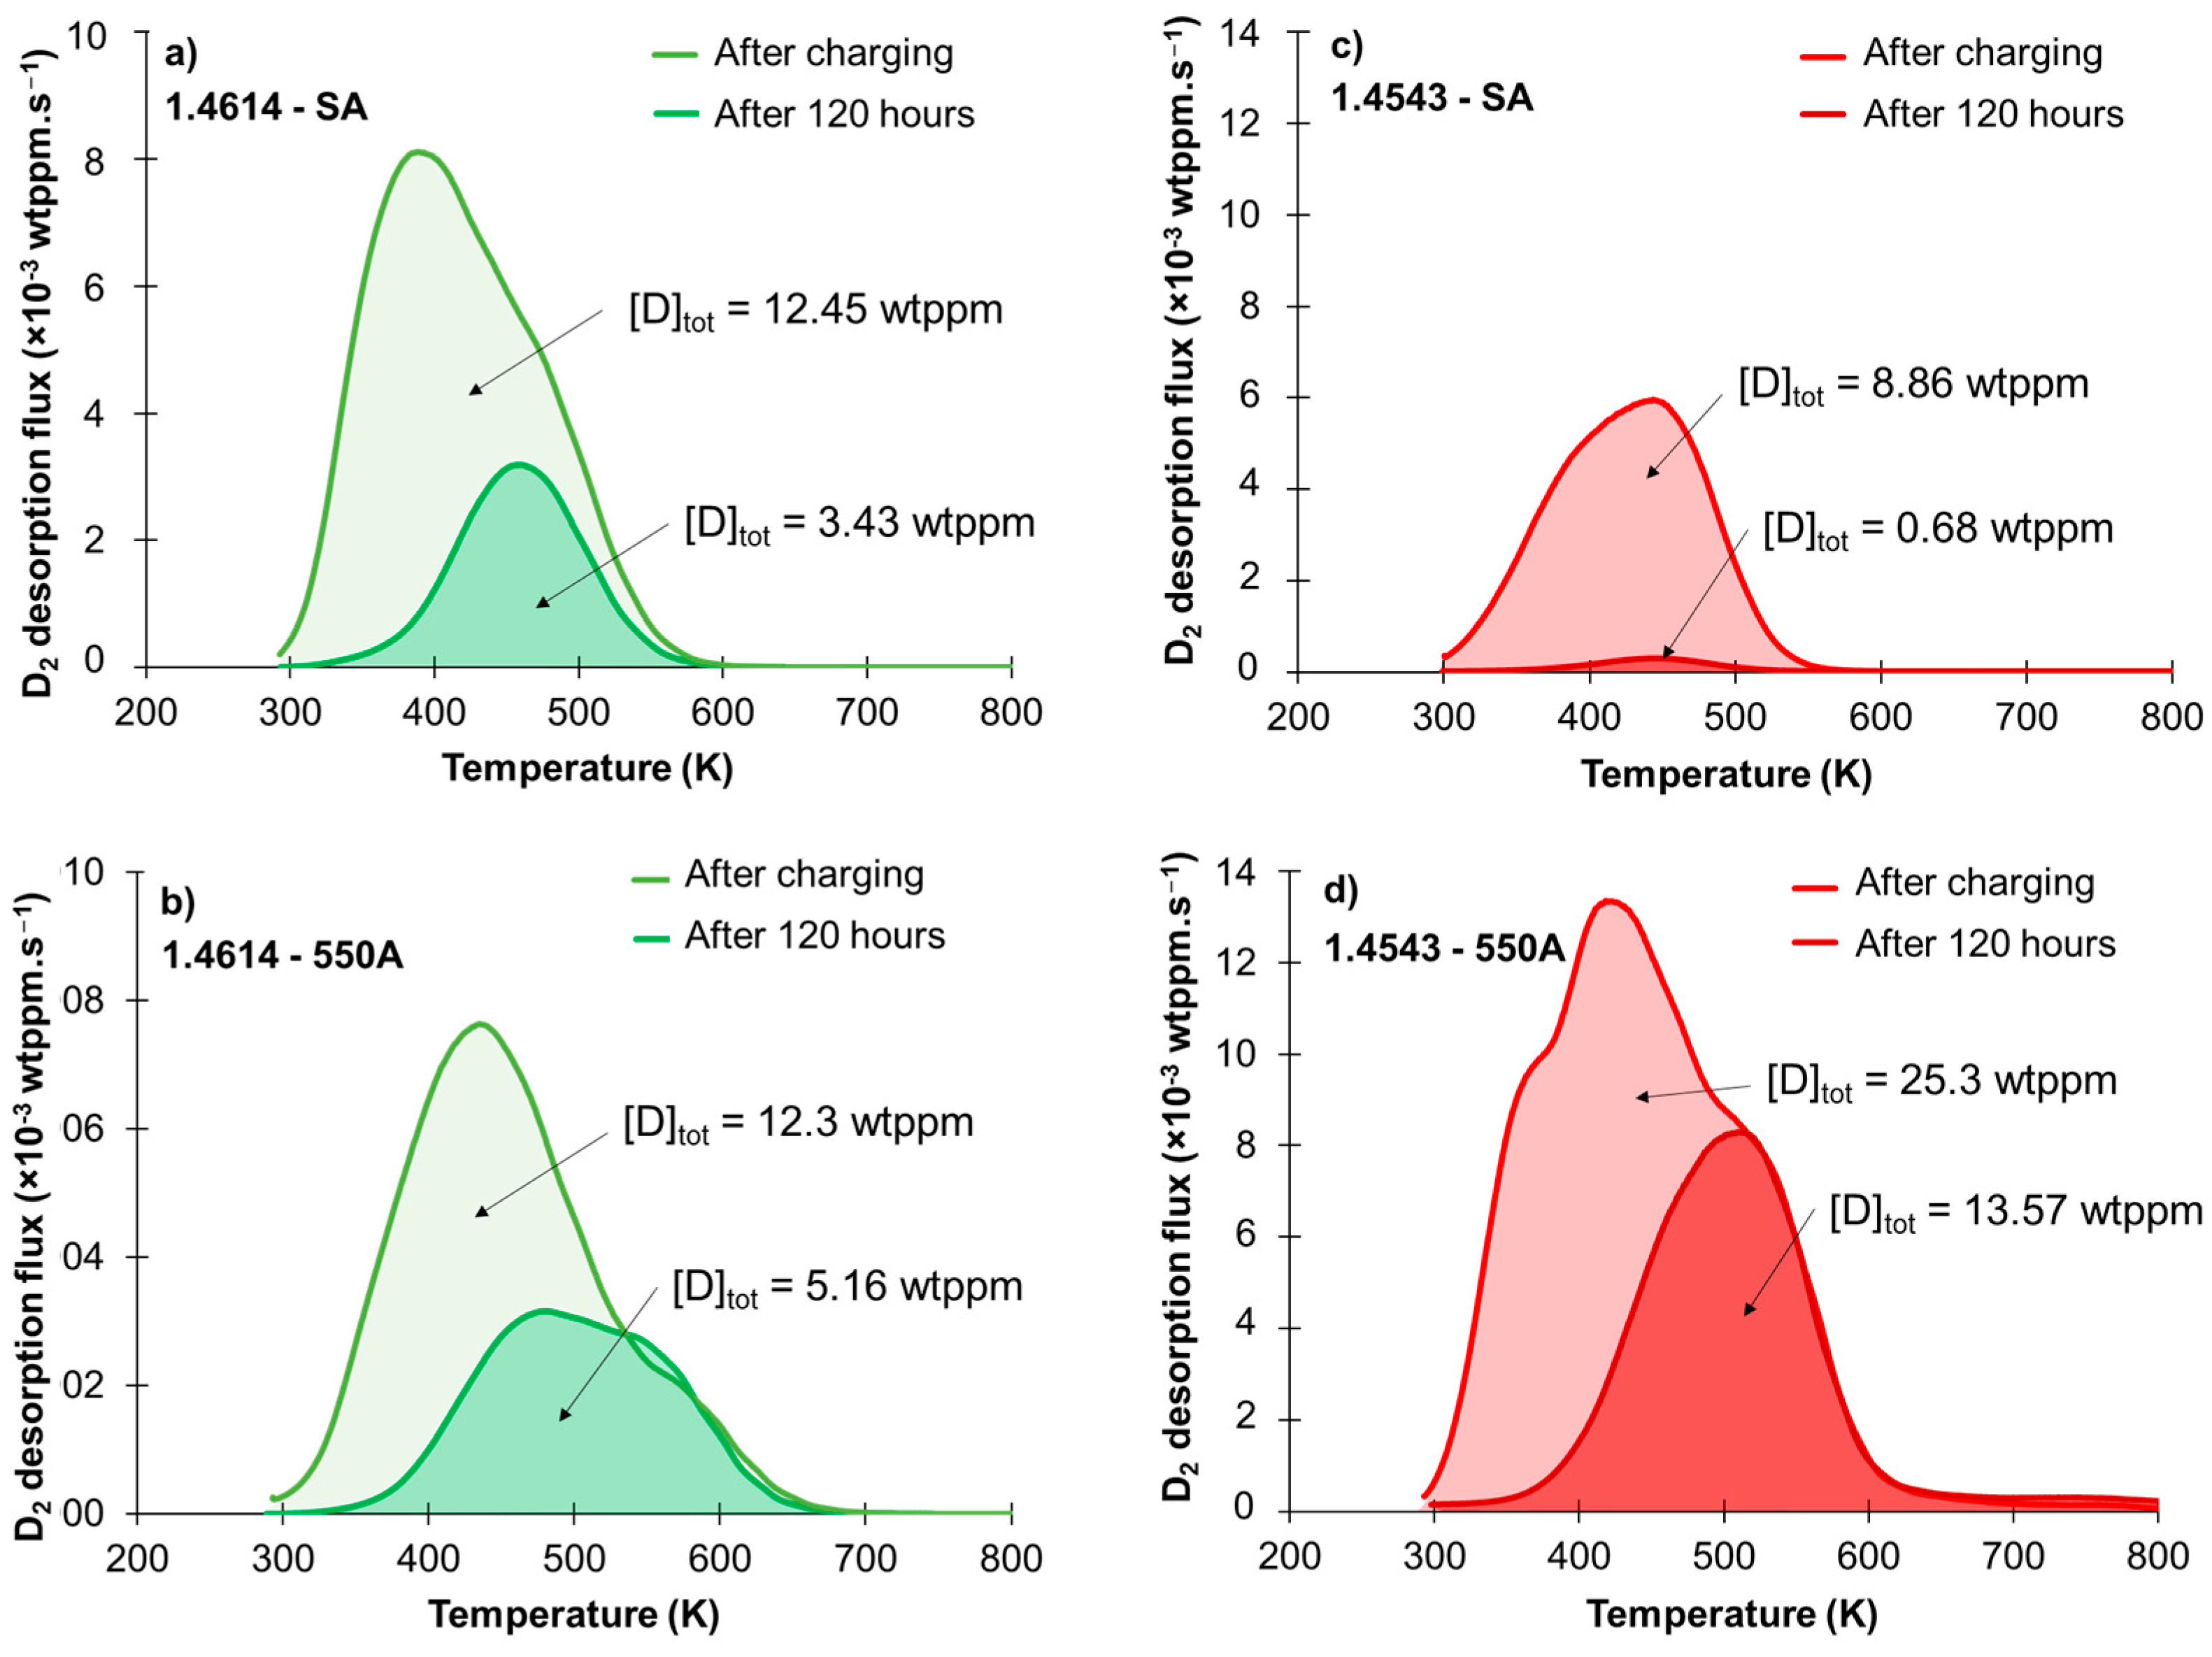
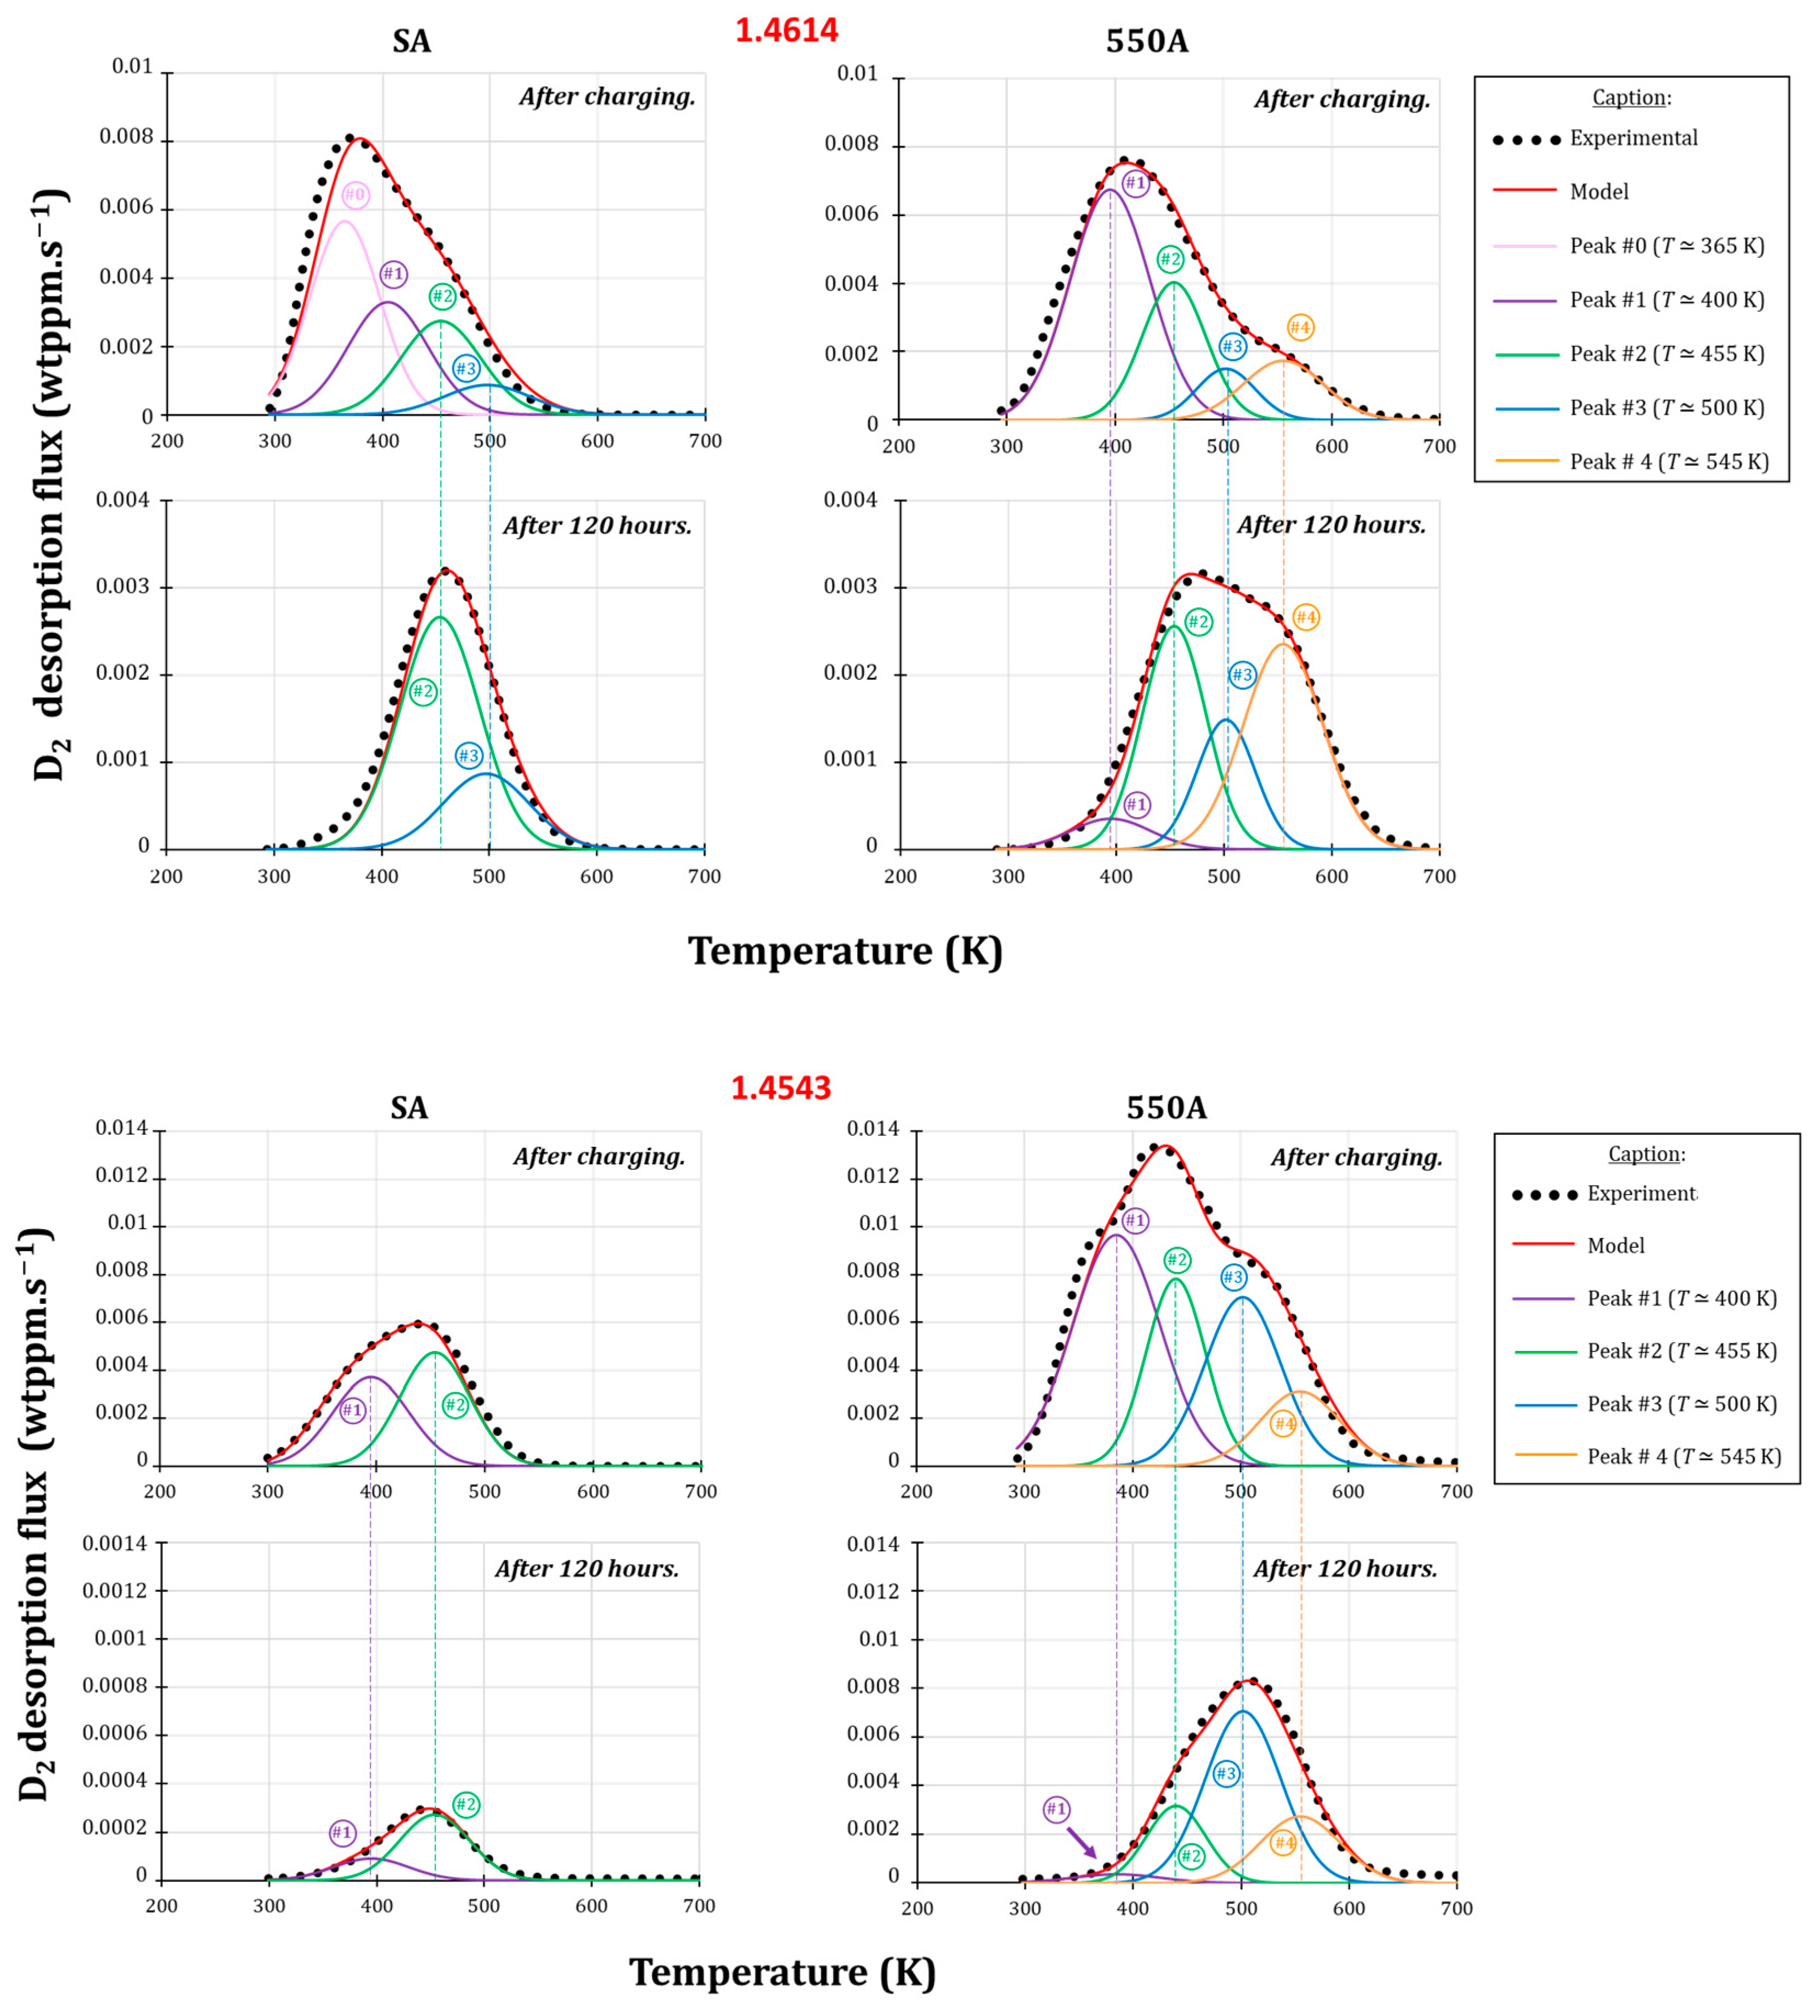
The TDS thermograms are presented for the two studied grades in both SA and 550A conditions, immediately after deuterium charging or after deuterium charging and 120 h aging at room temperature (Figure 11). A Gaussian deconvolution (Figure 12) was conducted for each case by applying two principles: (i) a minimum number of Gaussian contributions is chosen, and (ii) the contributions that have been found 120 h after charging are kept for thermograms which are recorded just after charging (maximum desorption temperature and FWHM parameters are kept, only the intensity can vary). With these principles in mind, it means that contributions that have been identified 120 h after the charging are necessarily also identified just after charging.

Figure 11.
Experimental TDS thermograms recorded directly after charging (light) or 120 h after charging (dark) at a heating rate of 10 K/min for 1.4614 (a,b) and 1.4543 (c,d) grades either SA: solution-annealed (a,c) or 550A: aged at 550 °C (b,d). The integration of the desorption flux over time provides the average concentration of deuterium.
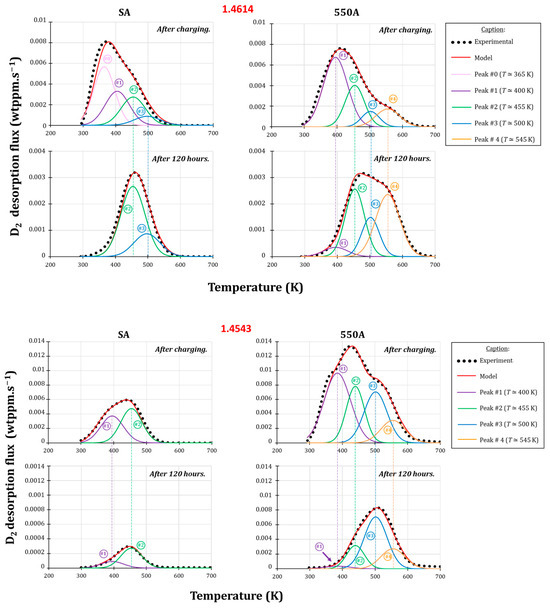
Figure 12.
TDS thermograms recorded directly after charging or 120 h after charging at a heating rate of 10 K/min for 1.4614 (top) and 1.4543 (bottom) grades in either SA: solution-annealed or 550A: aged at 550 °C states. Experimental thermograms (black dots) and deconvoluted experimental thermograms before/after 120 h ageing are shown. The model (red line) is the sum of all Gaussian contributions (peak #0, peak #1, peak #2, peak #3, peak #4).
Concerning the solution-annealed specimen of 1.4614 grade, the thermogram presents a maximum at about 400 K with a shoulder at 450 K just after charging. After 120 h aging at room temperature, the maximum of the thermogram is now around 460 K and 27% of deuterium initially present has remained in the SA material. As for the 550A 1.4614 sample, where nanoprecipitation has occurred, the thermogram presents a maximum at about 440 K with an important shoulder at 550–600 K just after charging. After 120 h, the maximum of the thermogram is around 470 K with a shoulder at 540 K and 42% of deuterium has remained.
For the solution-annealed sample, two common contributions peak#2 at 455 K and peak#3 at 500 K are found after 120 h of charging and just after charging from deconvolution. Two additional peaks are found at lower temperature just after charging, namely peak#0 at 365 K and peak#1 at 400 K. Knowing the constitution of the microstructure of the SA sample, the contribution at the highest temperature at 500 K, for the SA sample, may be attributed to the presence of retained (and reversed) austenite, well-known to deeply track hydrogen compared to martensite [26,27,28]. The one commonly found at 455 K might be attributed to grain boundaries traps whereas the contributions recorded just after charging, disappearing during aging at room temperature, are attributed to very low traps as dislocations (365 K) and lath boundaries (400 K) traps.
The only additional contribution named peak#4 is found at the highest temperature (545 K) for the 550A sample and this last one may naturally be attributed to the presence of nanometric precipitates. Therefore, these precipitates may act as relatively strong traps for hydrogen.
As for 1.4543 samples, at maximum four contributions are found (peak#1 to peak#4 with same characteristics as for 1.4614 sample) for the 550A sample. Concerning the solution-annealed grade, the thermogram presents a maximum at about 450 K with a shoulder at 400 K just after charging. After 120 h, the maximum of the thermogram is about 450 K and only 8% of deuterium has remained in the SA material. As for 550A, the thermogram presents a maximum at about 440 K with two shoulders at 380 and 510 K just after charging. After 120 h, the maximum of the thermogram is about 510 K and 54% of deuterium has remained. Once again, dislocations, lath boundaries appear to be low traps contrary to precipitates (or more precisely probably martensite/precipitates interfaces [18,26,29]) that may act as deep traps for hydrogen. At this step, it does not appear possible to deconvolute contributions coming eventually from the various natures of precipitates from the additional global contribution of peak#4 identified at 545 K.
These findings are in good accordance with electrochemical permeation results where the apparent hydrogen diffusion coefficient is systematically lower for 550A sample contrary to the SA ones. More deuterium (or by extension, more hydrogen) remains also after 120 h for the 1.4614 SA sample compared to the SA 1.4543 sample because of the higher proportion of austenite inside the 1.4614 SA sample compared to the 1.4543 one (15 vs. 2 vol.% of austenite, respectively).
This global tendency of hydrogen trapping increase in precipitate-rich steels (i.e., 550A state) is also in good agreement with previous studies, where aging with nanometric precipitation tended to decrease the apparent diffusion coefficient, as reported for 1.4614 grade by Ifergane et al. (where reverted austenite was also formed) or for 17-4 PH grade [3,12,26,29].
An asymmetrical behavior from hydrogen absorption to hydrogen desorption has also been evidenced by electrochemical permeation for SA 1.4614, where desorption seems slower than absorption. TDS spectra show an important contribution at 500 K linked to deeply trapped hydrogen and possibly attributed to (retained) austenite. This surprising behavior might finally be linked to the proportion of retained austenite that reaches about 15 vol.% in the SA 1.4614 grade. This retained austenite might act as a hydrogen reservoir where barrier energy for detrapping (release from austenite phase) might be higher than the one for absorption (trapping—entry in austenite phase); it could be the origin of this surprising asymmetric kinetics behavior observed thanks to electrochemical experiments.
3.4. Slow Strain Rate Tensile Testing (SSRT) under In Situ Cathodic Hydrogen Charging
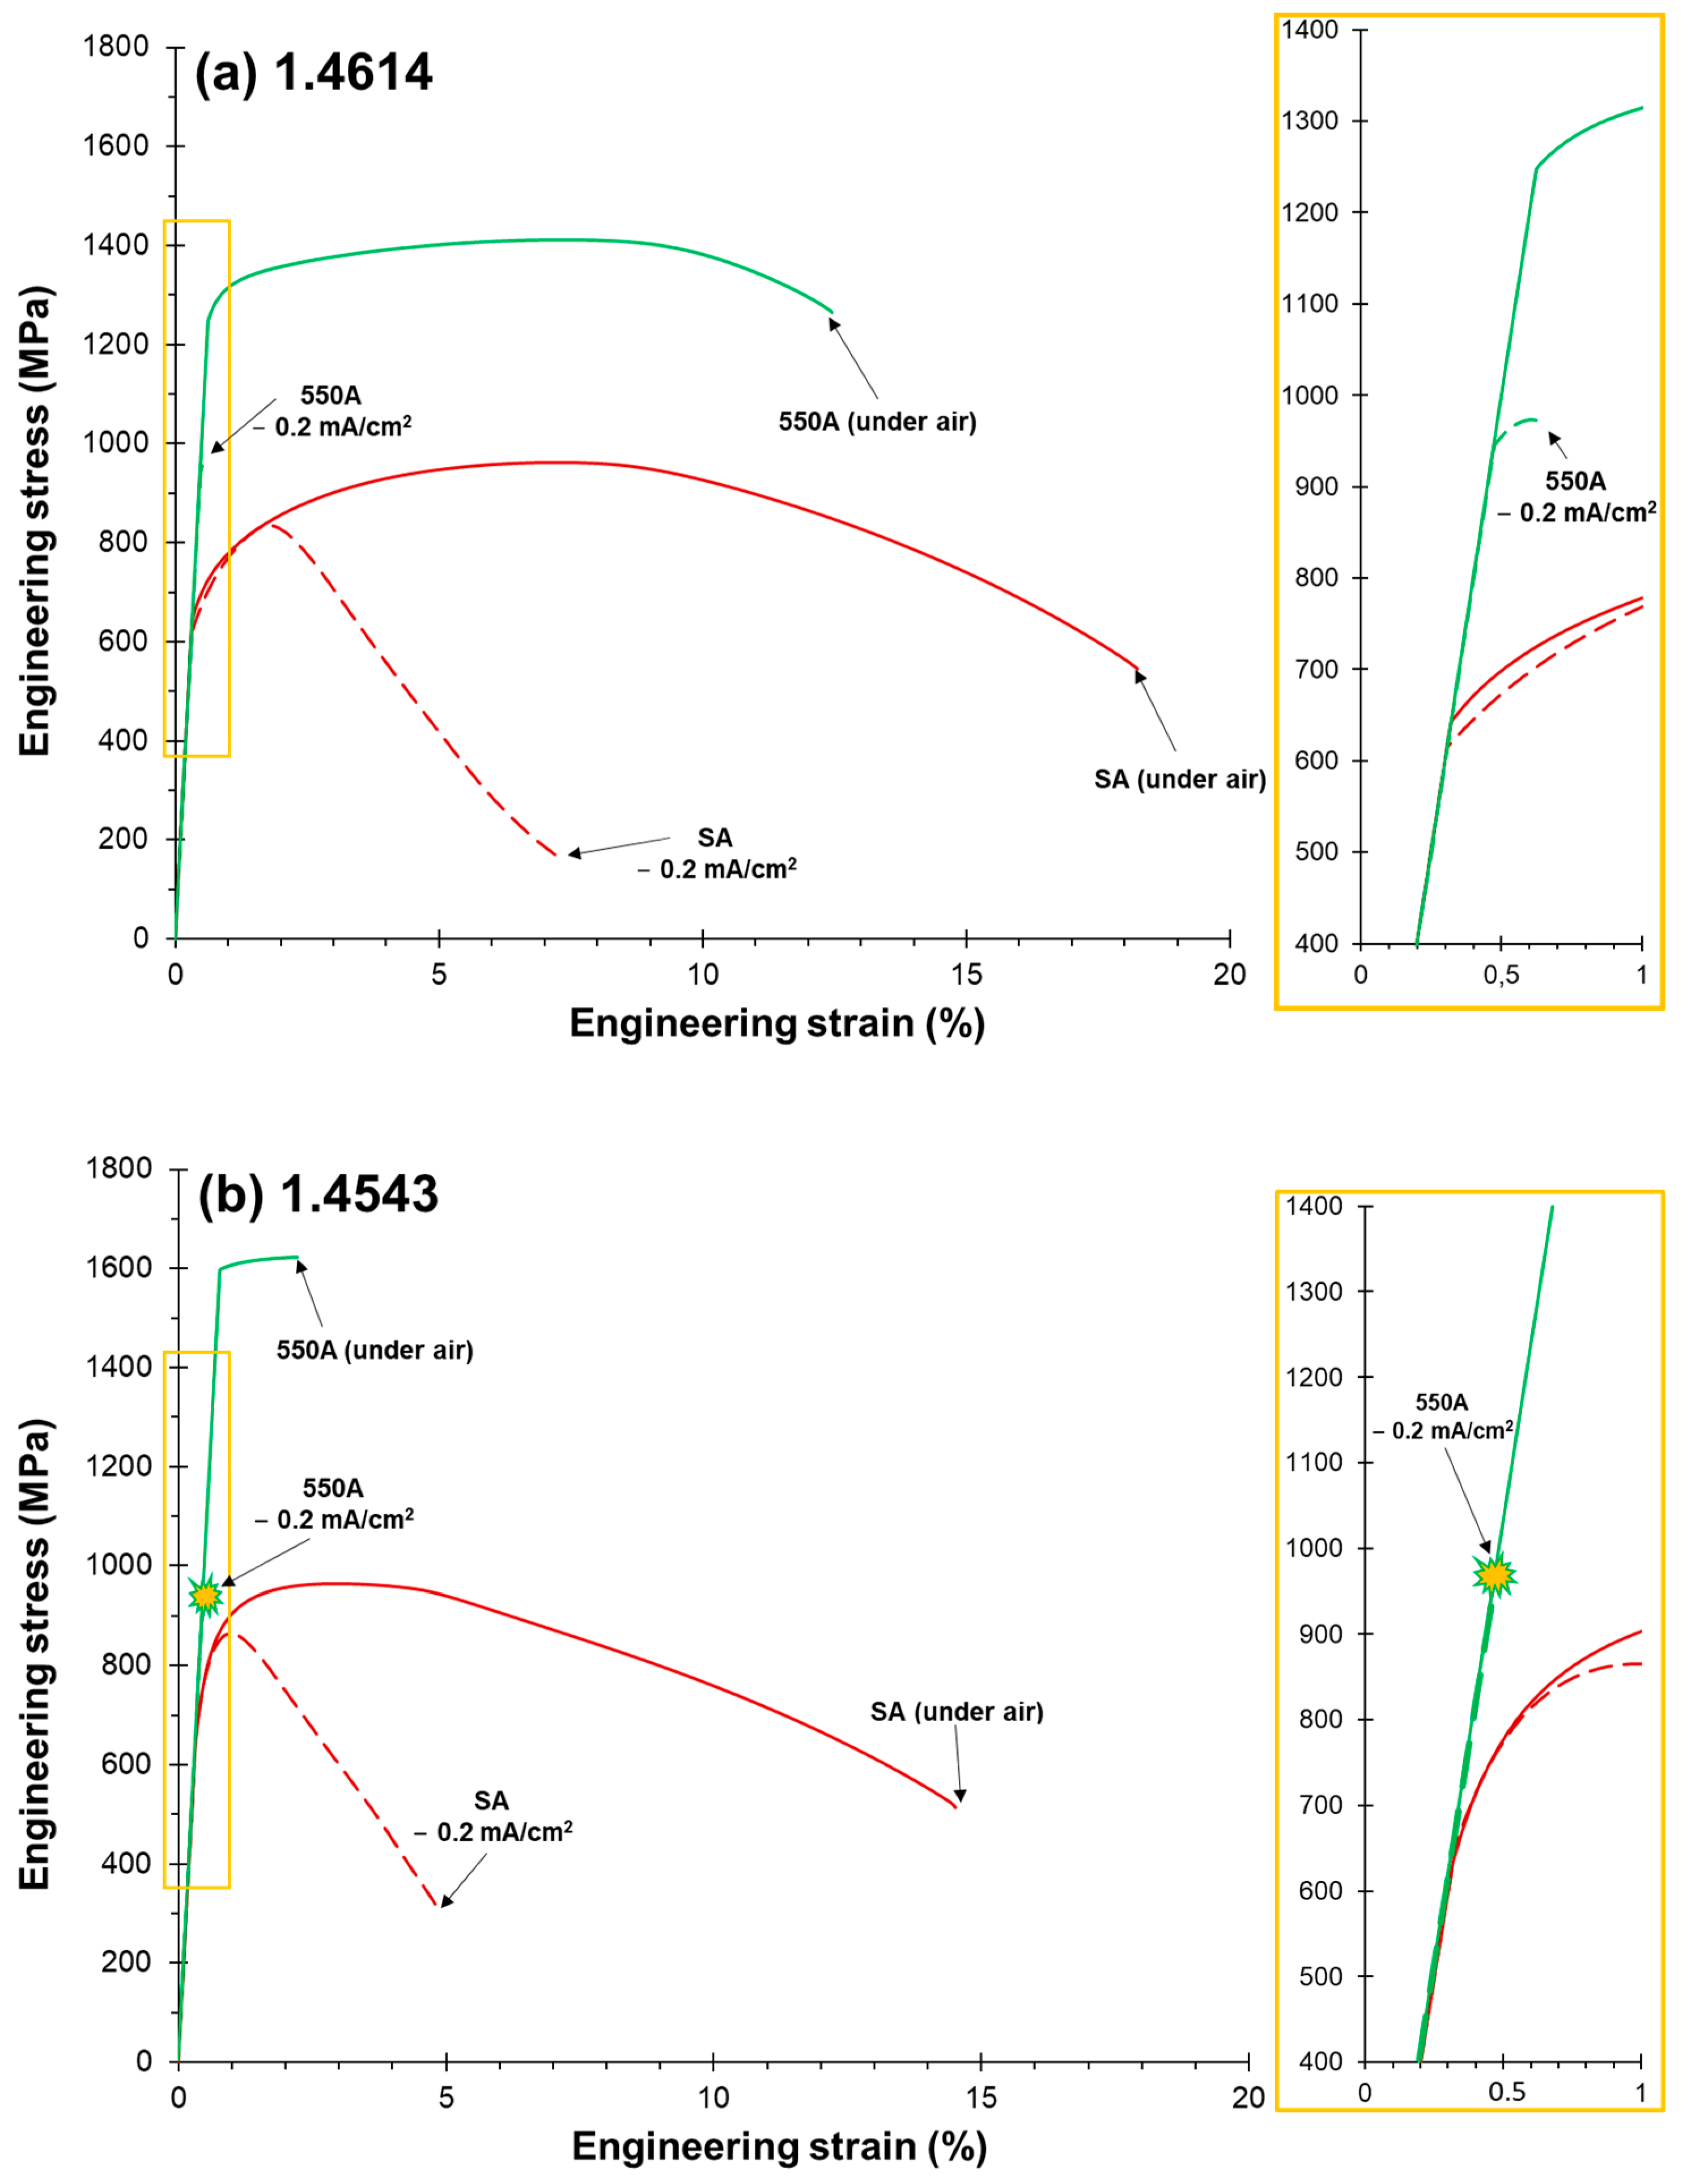
The susceptibility to hydrogen of the different materials was revealed by testing the tensile properties either in absence or in presence of hydrogen (under a cathodic current density of −0.2 mA/cm2). Corresponding stress–strain curves are found in Figure 13. Fracture surface of tensile specimens of 1.4614 and 1.4543 grades for both states are shown in Figure 14. Both grades appear, without surprise, to be very sensitive to hydrogen embrittlement (Figure 13 and Figure 14).
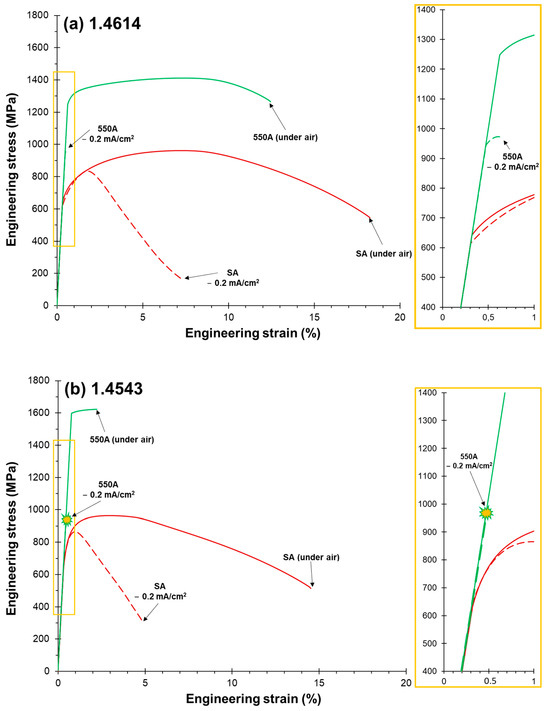
Figure 13.
Engineering stress–strain curves without continuous lines or with in situ hydrogen charging at a current density of −0.2 mA/cm2—dashed lines –for 1.4614 and 1.4543 grades in SA and 550A states. (SA: solution-annealed, 550A: 550 °C aged, strain rate: 10−5 s−1).
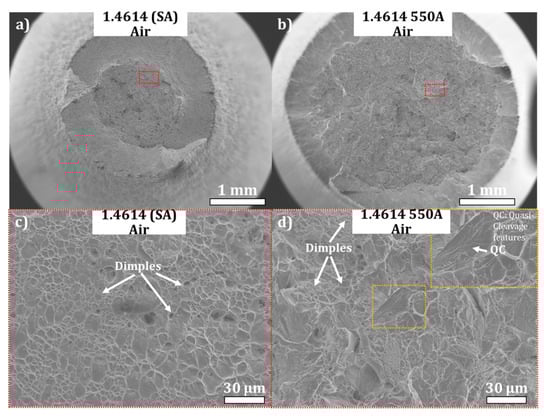
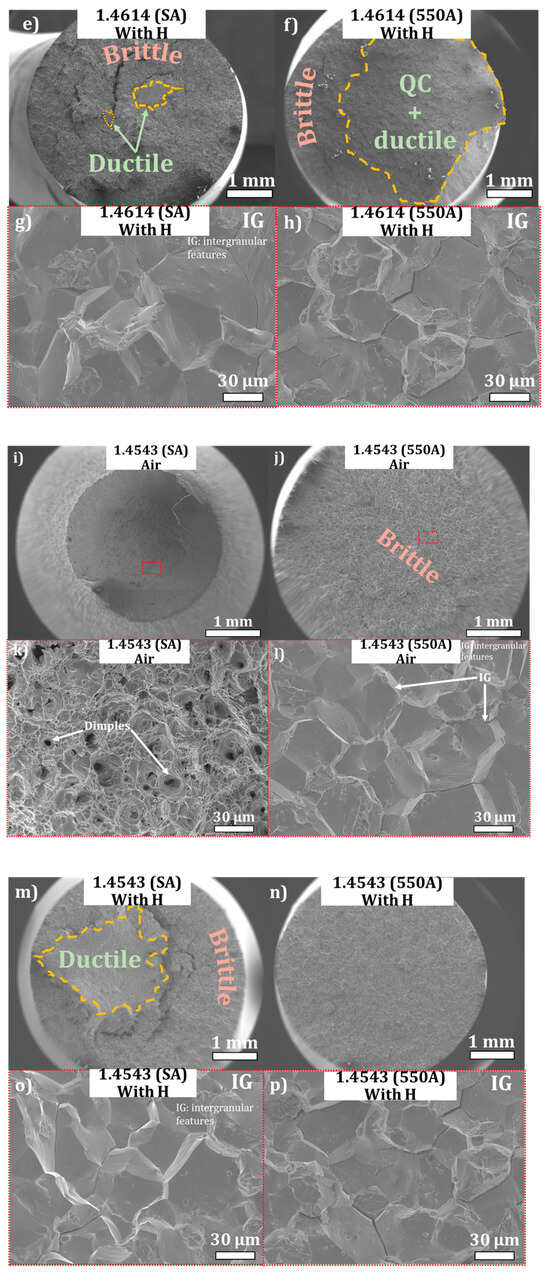
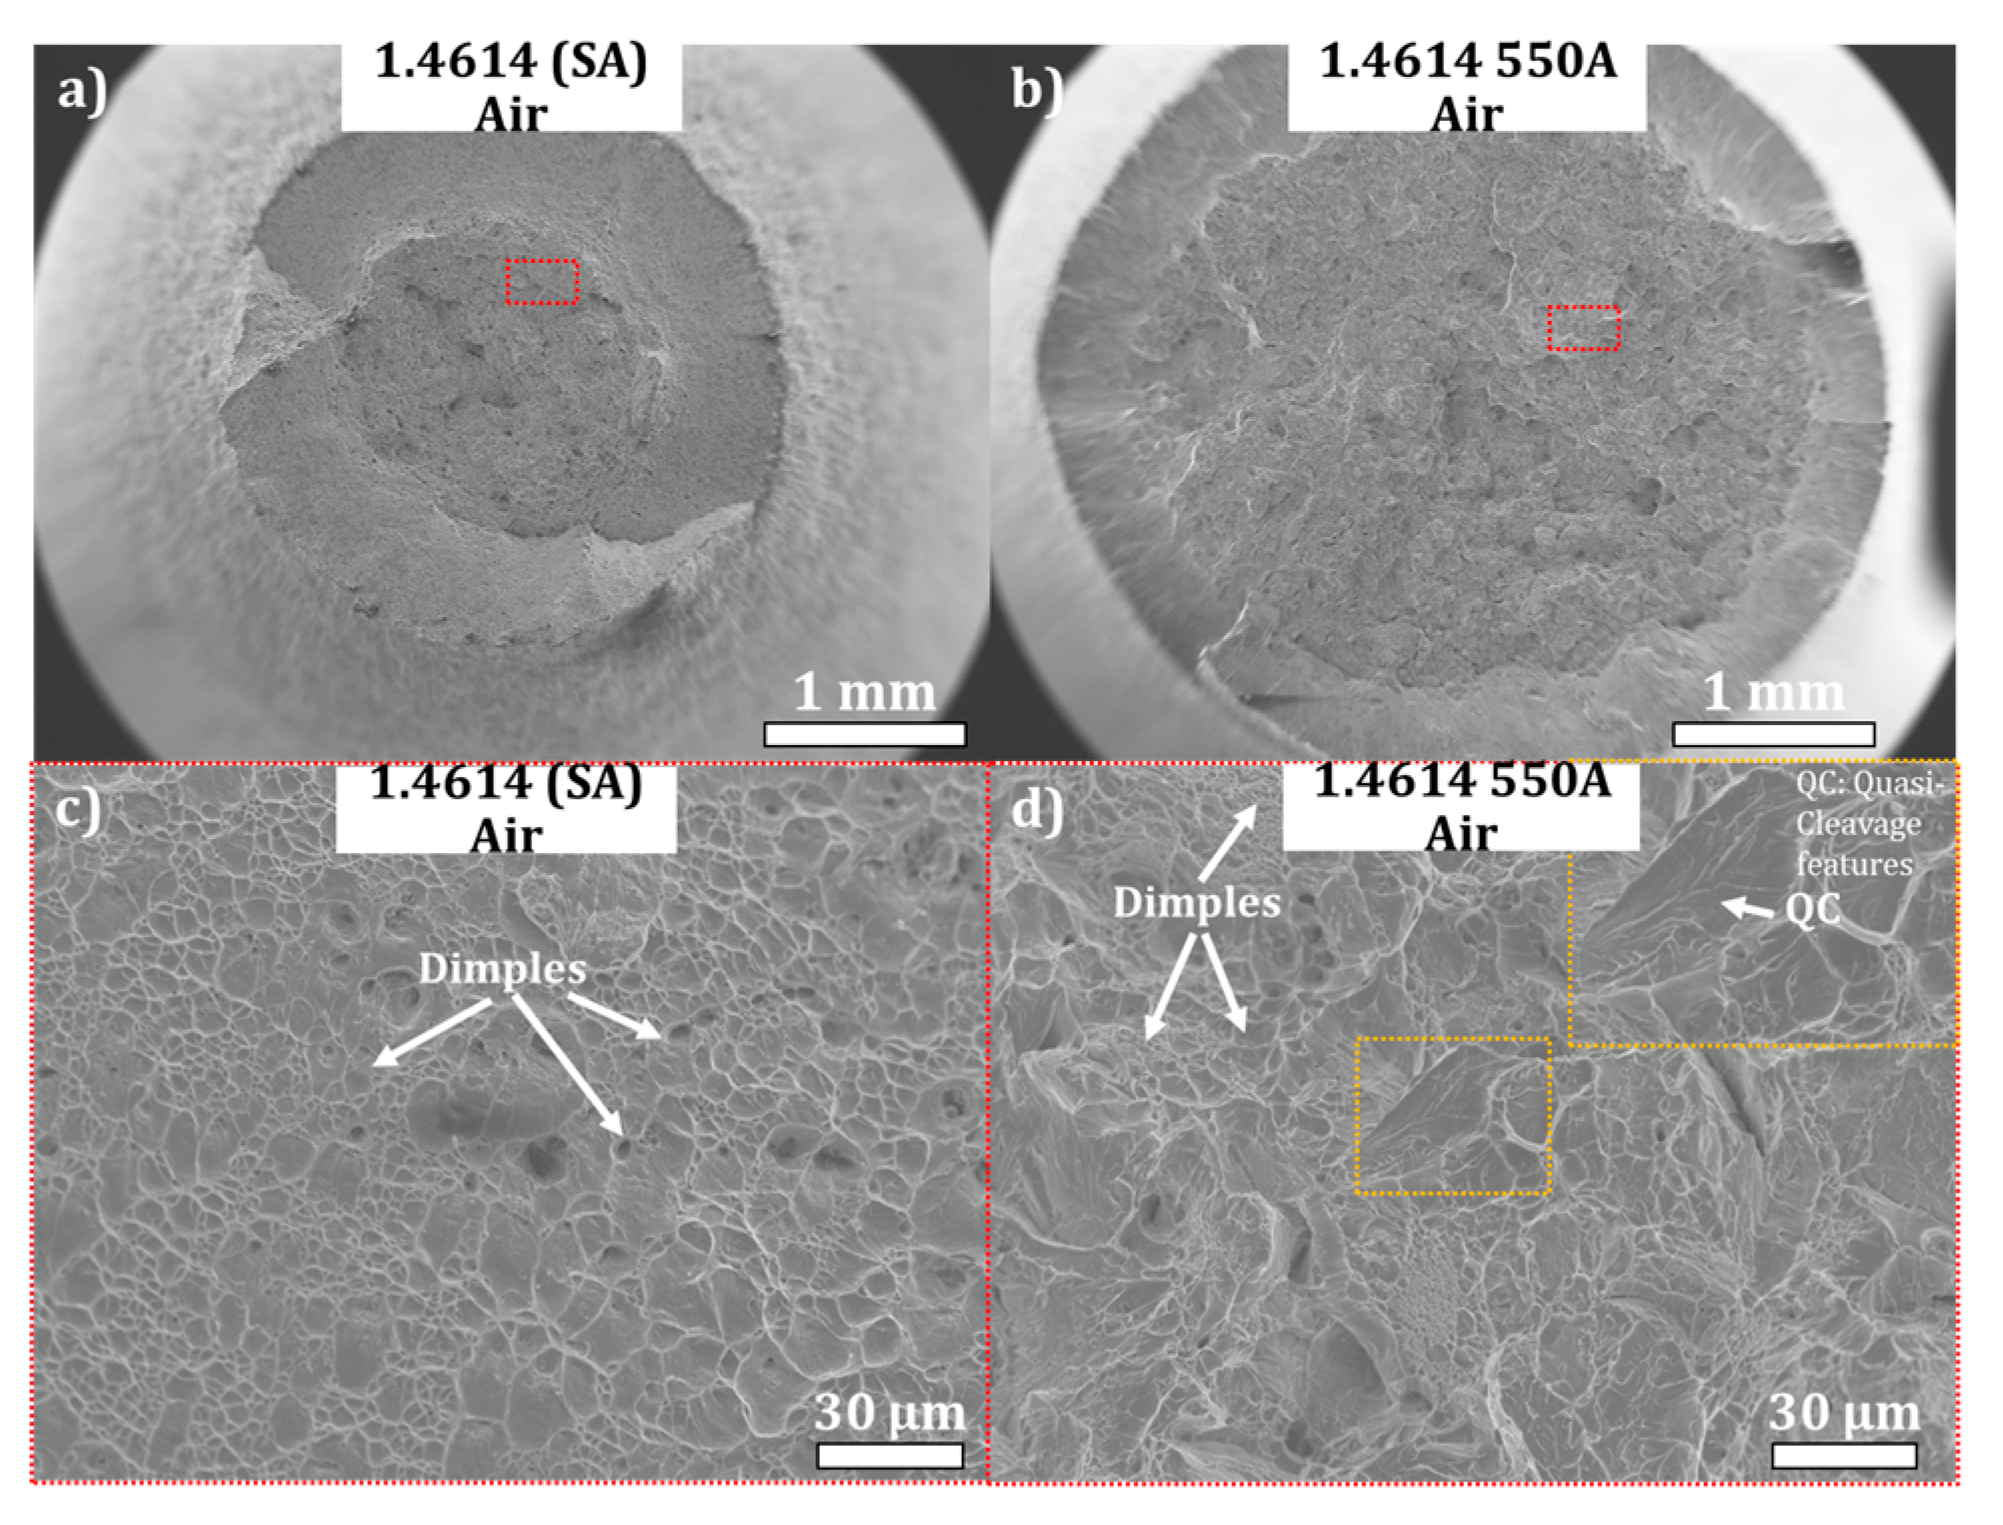
Figure 14.
SEM (secondary electrons detector) fracture surface of tensile specimens of 1.4614 and 1.4543 grades for both states (SA: solution-annealed, 550A: 550 °C aged) without or with in situ hydrogen charging at a current density of −0.2 mA/cm2. Yellow doted lines mark out the transition between brittle and ductile fracture zones. (IG: intergranular features; QC: Quasi-Cleavage features). (a,c) under air SA 1.4614 (b,d) under air 550A 1.4614 (e,g) with H SA 1.4614 (f,h) with H 550A 1.4614 (i,k) under air SA 1.4543 (j,l) under air 550A 1.4543 (m,o) with H SA 1.4543 (n,p) with H 550A 1.4543.
Table 5 and Table 6 gather hydrogen embrittlement indexes (RRA and REL described below) with mechanical characteristics of both grades.
Table 5.
Hydrogen embrittlement indexes calculated according to RRA (Relative Reduction of Area) and REL (Relative Elongation Loss) for current density of −0.2 mA/cm2 of 1.4614 grade in the solution-annealed (SA) state or aged at 550 °C (550A). UTSair (ultimate tensile strength), YSair (yield strength), RAair (reduction of area) and Aair (elongation to fracture) in air are also given.
Table 6.
Hydrogen embrittlement indexes calculated according to RRA and REL for current density of −0.2 mA/cm2 of 1.4543 grade in the solution-annealed (SA) state or aged at 550 °C (550A). UTSair (ultimate tensile strength), YSair (yield strength), RAair (reduction of area) and Aair (elongation to fracture) in air are also given.
One should be reminded that Relative Reduction of Area (RRA) and Relative Elongation Loss (REL) are defined as follows:
where RAair and RAH are the reductions of area at fracture in air and in hydrogen environments, and Aair and AH are the elongations at fracture in air and in hydrogen environments, respectively. The higher RRA and/or REL, the higher is the HE susceptibility.
SA (resp. 550A) 1.4614 grades present under air YS (Yield Strength) of about 720 MPa (resp. 1295 MPa) with an area reduction of 65% (resp. 32%). RRA reaches 83% (resp. 100%) for SA (resp. 550A) samples when in situ H charging is imposed under −0.2 mA/cm2 (Table 5).
SA (resp. 550A) 1.4543 grades present under air a YS of about 835 MPa (resp. 1610 MPa) with an area reduction of 14% (resp. 2%). RRA reaches 87% (resp. 100%) for SA (resp. 550A) samples when in situ H charging is imposed with −0.2 mA/cm2 (Table 6).
In air, the fracture (see Figure 14) appears to be ductile with typical cup and cone morphology and dimples covering the fracture surfaces for 1.4614 grades with SA and 550A states and for 1.4543 grade with SA state. The fracture of 1.4543 grade aged at 550 °C is already brittle in air with intergranular features.
With in situ hydrogen charging concomitant with tensile testing, fractured surfaces appear to be transgranular ductile at the center of the samples and intergranular brittle in the peripheral regions for SA conditions on the two grades. On the 1.4543 550A specimen tested with in situ hydrogen charging, the fracture surface was fully intergranular brittle, as expected from the result obtained in air that presented already that behavior. The fracture surface of the 1.4614 550A specimen tested with in situ hydrogen charging (Figure 14f,h) is intergranular brittle in the peripheral region and presents both quasi-cleavage and ductile features at the center of the sample. It can be noticed that the intergranular fracture observed in all hydrogen-charged tensile specimens can be linked to the large prior austenitic grains whose size approximates 75 µm.
3.5. General Discussion
Both studied maraging grades present a high susceptibility to HE (with a RRA strictly superior to 80%) and become brittle when submitted to hydrogen whatever metallurgical state, in line with their high mechanical properties [30]. It also explains partly why 550A states with hardening nanoprecipitates are more sensitive to HE compared to the solution-annealed state. The conducted tests are probably too severe in this case to be able to decorrelate the effect of precipitation with ruptures observed in the elastic domain, contrary for instance to the 17-4 PH (Precipitation Harding) case [26]. However, in the literature it is sometimes evocated that such maraging might be used in hydrogen-rich environments [12,31] and it must be underlined that the way of measuring the sensitivity to HE reveals the susceptibility to HE as this last one needs to be considered in terms of temperature, time, pressure, or stress state. Once this consideration has been underlined, some insights can be made. TDS and electrochemical permeation characterizations provide evidence that the nanometric precipitates play a major role in hydrogen trapping. Hydrogen apparent diffusivity has been reduced when precipitation occurs. Precipitates, and probably precisely precipitates/matrix interfaces, appear indeed to be relatively strong traps for hydrogen (with a corresponding desorption temperature of about 545 K). From TDS experiments it was not possible to deconvolute possible several contributions from the three families of precipitates in 1.4543 grade. This study reveals that Ni3Ti, and probably non fcc Cu and G-phase, precipitates may act as relatively strong traps for hydrogen. The potential beneficial effect of these rather strong traps cannot be evidenced from in situ ‘severe’ H charging SSRT experiments because of the corresponding higher mechanical properties brought by these precipitates; once stress appears superior to 900 MPa, rupture occurs in both grades with H charging.
Another point that needs to be discussed is the presence of austenite that does not seem to affect the final HE sensitivity; 15 vol.% (resp. 2 vol.%) of austenite is present in 1.4614 (resp. 1.4543) SA grade whereas RRA reaches about 85% in both cases. At first sight, this result might be surprising. That is why additional X-Ray diffraction characterization had been conducted on 1.4614 SA grade after tensile tests near the necking zone area for air or hydrogen conditions to investigate the austenite stability. The retained austenite proportion is about 15 vol.% before deformation. The austenite proportion reaches only 2 vol.%. under 2% of strain, which corresponds to the case of area reduction in the region of distributed elongation under hydrogen charging. Austenite proportion falls to zero under 7% of strain, which matches to the case of area reduction in the region of distributed elongation under air. These additional measurements demonstrate the non-stability of retained austenite which transforms into martensite (with or without hydrogen). The destabilization of the retained austenite by straining is very well documented in the literature [32,33] and this strain-induced transformation may explain why the presence of additional retained austenite does not provide any decrease in HE sensitivity. This is probably not the case of reverted austenite as shown in many papers and already demonstrated for maraging stainless steels as in 17-4 PH [26] or PH 13-8 Mo [28,34]. In this study, the proportion of reverted austenite (when formed) is very low. Austenite could also have brought a potential loss of sensitivity in HE thanks to its general softness and as a microstructural element that rather deeply trap hydrogen, as shown in this present study with TDS characterization, or as shown in other studies in the literature [26,28,34]. But because this austenite, which is retained, is non-stable in the two 1.4614 and 1.4543 grades, this last one cannot bring any potential loss of sensitivity in HE. Without any deformation or stress, hydrogen can diffuse preferentially through martensitic matrix and can be occasionally deeply trapped by nanometric precipitates and at austenite/martensite interfaces and/or inside austenite. When a tensile deformation or a stress is applied, retained austenite transforms into martensite and hydrogen is no longer trapped by austenite and can diffuse easily inside the PH grade, therefore promoting premature failure.
4. Conclusions
HE susceptibility of 1.4614 and 1.4543 grades have been characterized in solution-annealed and aged states. At 550 °C, the aged 1.4614 grades present nanometric hexagonal Ni3Ti precipitates preferentially oriented with the martensitic matrix [11–20Ni3Ti // 111α′ and 0001Ni3Ti // 110α′] whereas 550 °C-aged 1.4543 grades show three family of precipitates namely Ni3Ti, silicide and Cu-rich precipitates. Rod-shaped Ni3Ti (25 nm long) still adopt preferential orientations relations with martensite while nanometric G-phase precipitates (less than 3 nm in diameter) rich in Si, Ti and Ni adopt cube-cube relation with the martensitic matrix. Nanometric Cu precipitates (of about 5 nm in diameter) are not fcc. Further experiments would be needed with a large instrument such as Small-Angle X-ray Scattering performed on Synchrotron to know more about its crystalline structure; such precipitates rich in Cu may adopt a probable partial coherence [35]. Whatever the nature of these precipitates, these last ones play a role as deep traps for hydrogen in 1.4614 and 1.4543 grades. As these precipitates enable high mechanical properties, it is not possible to evidence any potential improvement of HE resistance (of those deep traps), using the quite severe SSRT tests (with in situ H charging with current density of −0.2 mA/cm2). Indeed, whatever the grade or the metallurgical state, RRA is still superior to 80%. Less severe SSRT tests should be undergone in the future to be able to measure the effect of nano-precipitates on HE. Retained austenite, unlike reverted austenite, does not seem to improve HE resistance because of its transformation into martensite during straining. From a general point of view, it should be added that HE susceptibility still needs to be studied in real use conditions.
Author Contributions
Conceptualization, L.L.-R. and Y.W.; Methodology, L.L.-R. and Q.A.; Formal analysis, Q.A.; Validation, F.M. and Y.W.; Investigation, P.S., F.M. and E.R.; Data curation, P.S., Q.A., E.R. and J.A.; Writing—original draft, L.L.-R.; Supervision, L.L.-R.; project administration, J.A. All authors have read and agreed to the published version of the manuscript.
Funding
This research was funded by French ANRT (Association Nationale de la Recherche et de la Technologie) grant number 2020/1275.
Data Availability Statement
The data presented in this study are available on request from the corresponding author. The data are not publicly available due to privacy reason.
Acknowledgments
The authors acknowledge Marie-Line Mantoux, Francis Perton and Hadija Sifer for their technical assistance.
Conflicts of Interest
Authors Laurence Latu-Romain, Pierre Schutz and Jamila Adem were employed by the company Swiss Steel Group at the Centre de Recherche d’Ugitech. The remaining authors declare that the research was conducted in the absence of any commercial or financial relationships that could be construed as a potential conflict of interest.
References
- Lee, J.A.; Woods, S. Hydrogen Embrittlement. 2016. Available online: https://ntrs.nasa.gov/citations/20160005654 (accessed on 7 February 2024).
- Bestautte, J.; Kalácska, S.; Béchet, D.; Obadia, Z.; Christien, F. Investigation of quasi-cleavage in a hydrogen charged maraging stainless steel. Corros. Sci. 2023, 218, 111163. [Google Scholar] [CrossRef]
- Chiang, W.C.; Pu, C.C.; Yu, B.L.; Wu, J.K. Hydrogen susceptibility of 17-4 PH stainless steel. Mater. Lett. 2003, 57, 2485–2488. [Google Scholar] [CrossRef]
- Yamabe, J.; Sezgin, J.-G.; Wada, K. Interpretation of complex, tensile-fracture phenomena in precipitation-hardened, martensitic stainless steels, 17-4PH, in presence of hydrogen. Mater. Sci. Eng. A 2021, 823, 141717. [Google Scholar] [CrossRef]
- Yan, Q.; Yan, L.; Pang, X.; Gao, K. Hydrogen trapping and hydrogen embrittlement in 15-5PH stainless steel. Corros. Sci. 2022, 205, 110416. [Google Scholar] [CrossRef]
- Yang, Z.; Liu, Z.; Liang, J.; Su, J.; Yang, Z.; Zhang, B.; Sheng, G. Correlation between the microstructure and hydrogen embrittlement resistance in a precipitation-hardened martensitic stainless steel. Corros. Sci. 2021, 182, 109260. [Google Scholar] [CrossRef]
- DiSabella, D.W.R. Custom 465® Advanced Stainless Flexible for Many Applications, n. d. 2014.
- Shmulevitsh, M.; Ifergane, S.; Eliaz, N.; Shneck, R.Z. Diffusion and trapping of hydrogen due to elastic interaction with η-Ni3Ti precipitates in Custom 465® stainless steel. Int. J. Hydrogen Energy 2019, 44, 31610–31620. [Google Scholar] [CrossRef]
- Zhang, H.; Sun, M.; Ma, D.; Xu, B.; Wang, T.; Li, D.; Li, Y. Effect of aging temperature on the heterogeneous microstructure and mechanical properties of a 12Cr–10Ni–Mo–Ti maraging steel for cryogenic applications. J. Mater. Sci. 2021, 56, 11469–11484. [Google Scholar] [CrossRef]
- Wang, L.; Dong, C.; Yao, J.; Dai, Z.; Man, C.; Yin, Y.; Xiao, K.; Li, X. The effect of η-Ni3Ti precipitates and reversed austenite on the passive film stability of nickel-rich Custom 465 steel. Corros. Sci. 2019, 154, 178–190. [Google Scholar] [CrossRef]
- Rauch, E.F.; Véron, M. Methods for orientation and phase identification of nano-sized embedded secondary phase particles by 4D scanning precession electron diffraction. Acta Crystallogr. Sect. B Struct. Sci. Cryst. Eng. Mater. 2019, 75, 505–511. [Google Scholar] [CrossRef] [PubMed]
- Ifergane, S.; David, R.B.; Sabatani, E.; Carmeli, B.; Beeri, O.; Eliaz, N. Hydrogen Diffusivity and Trapping in Custom 465 Stainless Steel. J. Electrochem. Soc. 2018, 165, C107–C115. [Google Scholar] [CrossRef]
- Ifergane, S.; Sabatani, E.; Carmeli, B.; Barkay, Z.; Ezersky, V.; Beeri, O.; Eliaz, N. Hydrogen diffusivity measurement and microstructural characterization of Custom 465 stainless steel. Electrochim. Acta 2015, 178, 494–503. [Google Scholar] [CrossRef]
- ASTM E975-22; Standard Test Method for X-ray Determination of Retained Austenite in Steel with Near Random Crystallographic Orientation. ASTM International (ASTM): West Conshohocken, PA, USA, 2013.
- Williamson, G.K.; Hall, W.H. X-ray line broadening from filed aluminium and wolfram. Acta Metall. 1953, 1, 22–31. [Google Scholar] [CrossRef]
- Williamson, G.K.; Smallman, R.E. Dislocation densities in some annealed and cold-worked metals from measurements on the X-ray debye-scherrer spectrum. Philos. Mag. 1956, 1, 34–46. [Google Scholar] [CrossRef]
- Rauch, E.F.; Véron, M. Automated crystal orientation and phase mapping in TEM. Mater. Charact. 2014, 98, 1–9. [Google Scholar] [CrossRef]
- Schutz, P.; Martin, F.; Auzoux, Q.; Adem, J.; Rauch, E.F.; Wouters, Y.; Latu-Romain, L. Hydrogen transport in 17−4 PH stainless steel: Influence of the metallurgical state on hydrogen diffusion and trapping. Mater. Charact. 2022, 192, 112239. [Google Scholar] [CrossRef]
- Devanathan, M.A.V.; Stachurski, Z.; Tompkins, F.C. The adsorption and diffusion of electrolytic hydrogen in palladium. Proc. R. Soc. Lond. Ser. A. Math. Phys. Sci. 1962, 270, 90–102. [Google Scholar] [CrossRef]
- Montella, C. Discussion on permeation transients in terms of insertion reaction mechanism and kinetics. J. Electroanal. Chem. 1999, 465, 37–50. [Google Scholar] [CrossRef]
- Moli-Sanchez, L.; Martin, F.; Leunis, E.; Chêne, J.; Wery, M. Hydrogen Transport in 34CrMo4 Martensitic Steel: Influence of Microstructural Defects on H Diffusion. Defect Diffus. Forum 2012, 323–325, 485–490. [Google Scholar] [CrossRef]
- Yang, M.; King, D.J.M.; Povstugar, I.; Wen, Y.; Luan, J.; Kuhn, B.; Jiao, Z.; Wang, C.; Wenman, M.R.; Liu, X. Precipitation behavior in G-phase strengthened ferritic stainless steels. Acta Mater. 2021, 205, 116542. [Google Scholar] [CrossRef]
- Mateo, A.; Llanes, L.; Anglada, M.; Redjaimia, A.; Metauer, G. Characterization of the intermetallic G-phase in an AISI 329 duplex stainless steel. J. Mater. Sci. 1997, 32, 4533–4540. [Google Scholar] [CrossRef]
- King, D.J.M.; Yang, M.; Whiting, T.M.; Liu, X.; Wenman, M.R. G-phase strengthened iron alloys by design. Acta Mater. 2020, 183, 350–361. [Google Scholar] [CrossRef]
- Frappart, S.; Oudriss, A.; Feaugas, X.; Creus, J.; Bouhattate, J.; Thébault, F.; Delattre, L.; Marchebois, H. Hydrogen trapping in martensitic steel investigated using electrochemical permeation and thermal desorption spectroscopy. Scr. Mater. 2011, 65, 859–862. [Google Scholar] [CrossRef]
- Schutz, P.; Latu-Romain, L.; Martin, F.; Auzoux, Q.; Adem, J.; Wouters, Y.; Ravat, B.; Menut, D. Onto the role of copper precipitates and reverted austenite on hydrogen embrittlement in 17-4 PH stainless steel. Mater. Charact. 2023, 202, 113044. [Google Scholar] [CrossRef]
- Tsay, L.W.; Chi, M.Y.; Chen, H.R.; Chen, C. Investigation of hydrogen sulfide stress corrosion cracking of PH 13-8 Mo stainless steel. Mater. Sci. Eng. A 2006, 416, 155–160. [Google Scholar] [CrossRef]
- Tan, L.; Li, D.; Yan, L.; Pang, X.; Gao, K. A novel heat treatment for improving the hydrogen embrittlement resistance of a precipitation-hardened martensitic stainless steel. Corros. Sci. 2022, 206, 110530. [Google Scholar] [CrossRef]
- Sun, H.; Lv, W.; Yang, Y.; Li, D.; Yan, L.; Pang, X.; He, Y.; Gao, K. Optimizing the hydrogen embrittlement resistance by tuning the structures of Cu-rich nanoprecipitates in high strength martensite stainless steels. Acta Mater. 2023, 246, 118722. [Google Scholar] [CrossRef]
- Cloué, J.; Foucault, M.; Andrieu, E. Hydrogen Embrittlement of Ph 13-08 Mo Stainless Steel in PWR Environment Effects of Microstructure. In Ninth International Symposium on Environmental Degradation of Materials in Nuclear Power Systems—Water Reactors; John Wiley & Sons, Ltd.: Hoboken, NJ, USA, 1999; pp. 149–156. [Google Scholar] [CrossRef]
- Dennies, D.P. Proposed Theory for the Hydrogen Embrittlement Resistance of Martensitic Precipitation Age-Hardening Stainless Steels such as Custom 455. J. Fail. Anal. Prev. 2013, 13, 433–436. [Google Scholar] [CrossRef]
- Thomas, G. Retained austenite and tempered martensite embrittlement. Metall. Mater. Trans. A 1978, 9, 439–450. [Google Scholar] [CrossRef]
- Ryu, J.H.; Kim, D.-I.; Kim, H.S.; Bhadeshia, H.K.D.H.; Suh, D.-W. Strain partitioning and mechanical stability of retained austenite. Scr. Mater. 2010, 63, 297–299. [Google Scholar] [CrossRef]
- Bestautte, J.; Oudriss, A.; Lenci, M.; Bechet, D.; Obadia, Z.; Feaugas, X.; Christien, F. A multi-method approach to the study of hydrogen trapping in a maraging stainless steel: The impact of B2-NiAl precipitates and austenite. Corros. Sci. 2023, 224, 111509. [Google Scholar] [CrossRef]
- Wang, W.; Zhou, B.; Xu, G.; Chu, D.; Peng, J. High-resolution electron microscopy characterization of 2H and 9R variant in the ferritic steels containing copper. Mater. Charact. 2011, 62, 438–441. [Google Scholar] [CrossRef]


Disclaimer/Publisher’s Note: The statements, opinions and data contained in all publications are solely those of the individual author(s) and contributor(s) and not of MDPI and/or the editor(s). MDPI and/or the editor(s) disclaim responsibility for any injury to people or property resulting from any ideas, methods, instructions or products referred to in the content. |
© 2024 by the authors. Licensee MDPI, Basel, Switzerland. This article is an open access article distributed under the terms and conditions of the Creative Commons Attribution (CC BY) license (https://creativecommons.org/licenses/by/4.0/).