Article

Hot Deformation Behavior and Microstructure Evolution of Al-7.92 Zn-1.64 Mg-2.00 Cu Alloy

1
Light Alloy Research Institute, Central South University, Changsha 410083, China
2
State Key Laboratory of Precision Manufacturing for Extreme Service Performance, Central South University, Changsha 410083, China
3
The First Aircraft of Institute of AVIC, Xi’an 710089, China
*
Authors to whom correspondence should be addressed.
Metals 2024, 14(2), 176; https://doi.org/10.3390/met14020176
Submission received: 23 December 2023 / Revised: 26 January 2024 / Accepted: 26 January 2024 / Published: 1 February 2024
(This article belongs to the Section Metal Casting, Forming and Heat Treatment)

Abstract

:
During the thermal deformation of aluminum alloy materials, the deformation conditions such as deformation volume, temperature and strain rate are important factors that influence the deformation mechanisms such as work hardening, dynamic recovery and dynamic recrystallization. Under the interaction of different deformation mechanisms, the properties of aluminum alloy materials will change significantly. In this study, isothermal hot compression experiments were conducted on the Al-7.92 Zn-1.64 Mg-2.00 Cu alloy to analyze its hot flow behavior (T = 250~450 °C, ɛ̇ = 0.001~1 s−1). The obtained flow behavior data were used to construct an Arrhenius-type constitutive equation and processing maps, investigating organizational evolution under diverse hot deformation conditions. The results show that the energy dissipation rate can reach 0.37 when the deformation temperature T = 380~450 °C and the strain rate ɛ̇ < 0.1 s−1, suggesting that the material is most suitable for thermal deformation processing at high temperatures and low strain rates. At a strain rate of 0.1 s−1 and a temperature of 450 °C, the percentage of recrystallized grains and substructures increased by 7.20% and 3.14%, respectively, compared to 300 °C, which is due to the severe dynamic recovery and dynamic recrystallization. At 350 °C and 0.1 s−1, there was a higher percentage of recrystallized grains and substructures, 5.44% and 5.87% higher, respectively, than at a strain rate of 1 s−1, indicating that the release of dislocation accumulation due to deformation storage energy will be more favored at low strain rates, which promotes the enhancement of the dynamic recrystallization mechanism.

1. Introduction

The Al-Zn-Mg-Cu series aluminum alloy is known as an ultra-high-strength alloy which are widely used in aviation and aerospace fields due to its ultra-high-strength properties, which are characterized by high strength, low density, and excellent plasticity [1,2,3]. In contrast to typical alloys like 7075 or 7050, the Al-7.92 Zn-1.64 Mg-2.00 Cu alloy, featuring high Zn content, exhibits outstanding strength, toughness, and quenching sensitivity [4]. This makes it particularly suited for critical aerospace structural components [5]. Hot deformation processing, involving forging and hot rolling, is a crucial method in material forming and control engineering. It enables the simultaneous structural forming and organizational modulation of metal parts to achieve the desired shape, size, and properties. During this process, the material experiences the combined effects of deformation temperature, amount, and rate, influencing its hot flow behavior, microstructure evolution, and mechanical properties. Aluminum alloy has high stacking fault energy, and during hot deformation processing, the organization usually exhibits softening characteristics such as dynamic recovery (DRV) and dynamic recrystallization (DRX) mechanisms, which will have a significant effect on the hot working properties of alloy [6,7]. Therefore, a comprehensive understanding of the hot flow behavior under various processing conditions is essential to produce hot-deformed structural components with excellent mechanical properties.
Isothermal hot compression experiments serve as a common method for investigating the hot flow behavior characteristics of material, which can obtain the stress–strain of hot flow behavior curves and microstructural evolution of hot deformed tissues under different deformation temperatures, deformations and strain rates. Utilizing these data, it is possible to establish a constitutive model that reflects the nonlinear relationship between stress–strain and process conditions parameters, employing a hyperbolic-sine Arrhenius-type equation model [8]. The Dynamic Material Model (DMM) is employed to construct Processing Maps (PMs), facilitating the prediction of deformation stability and microstructure evolution for different components of aluminum alloy. This aids in determining optimal hot working intervals, avoiding plastic deformation instability, and optimizing process parameters to prevent defects [9,10,11]. Previous studies have delved into the thermal deformation characteristics of high-strength Al alloys in the Al-Zn-Mg-Cu system. For instance, Rajamuthamilselvan et al. [12]. explored the thermal deformation behavior of 7075 aluminum alloy during high-temperature compression. They analyzed the material’s thermal deformation concerning processing parameters (T = 300~500 °C and ε ˙ = 0.001~1.0 s−1), characterizing dynamic recrystallization zones and unstable zone organization while also scrutinizing interfacial defects. Wang et al. [13] studied the hot deformation behavior of Al-7.82 Zn-1.96 Mg-2.35 Cu-0.11 Zr alloy after homogenization. The results indicate that the optimal strain rate is 0.001–0.1 s−1 and the optimal temperature is 400–450 °C. Similarly, Jin et al. [14]. investigated 7150 aluminum alloy under deformation conditions of T = 300~450 °C and ɛ̇ = 0.01~10 s−1. Their findings indicated a decrease in peak stress with an increase in deformation temperature and a decrease in strain rate. They concluded that grain refinement during the thermal deformation of 7150 aluminum alloy is primarily achieved through a continuous dynamic recrystallization (CDRX) mechanism. Hu et al. [6]. studied the softening characteristics of 7050 aluminum alloy under different deformation conditions during high-temperature deformation. Their investigation revealed that the main softening mechanism at T = 340 °C and ɛ̇ = 0.01 s−1 is a DRV mechanism. At T = 460 °C and ɛ̇ = 0.01 s−1, the DRX mechanism becomes the dominant softening mechanism. Meanwhile, at T = 460 °C and ɛ̇ = 0.1 s−1, both DRV and DRX mechanisms act simultaneously. Sun et al. [15]. delved into the thermal deformation behavior of 7075 aluminum alloy in the range of T = 300~450 °C and ɛ̇ = 0.01~10 s−1. Their observations indicated that below 350 °C, only a DRV mechanism occurred with typical substructure characteristics. Beyond 350 °C, a localized regional DRX mechanism took place, with the DRX grains increasing with temperature and decreasing with strain rate, exhibiting characteristics of a CDRX mechanism.
The Al-7.92 Zn-1.64 Mg-2.00 Cu alloy with high Zn content, belonging to the Al-Zn-Mg-Cu alloy system, shares similarities with commonly used alloys such as 7075 and 7050 aluminum. However, due to its unique composition, the hot working process parameters and hot flow behavior characteristics are expected to differ, especially concerning strain rate and deformation temperature. The impact of these differences on microstructure changes and resulting mechanical properties remains unclear. Consequently, this study employs isothermal hot compression experiments to investigate hot flow behavior characteristics (T = 250~450 °C and ɛ̇ = 0.001~1 s−1), as well as investigate the influence of thermal deformation conditions on the stress–strain of hot flow behavior, establishing a constitutive model and hot working diagram, examining microstructure evolution under various process conditions, and providing guidance for the high-performance fabrication of the Al-7.92 Zn-1.64 Mg-2.00 Cu alloy.

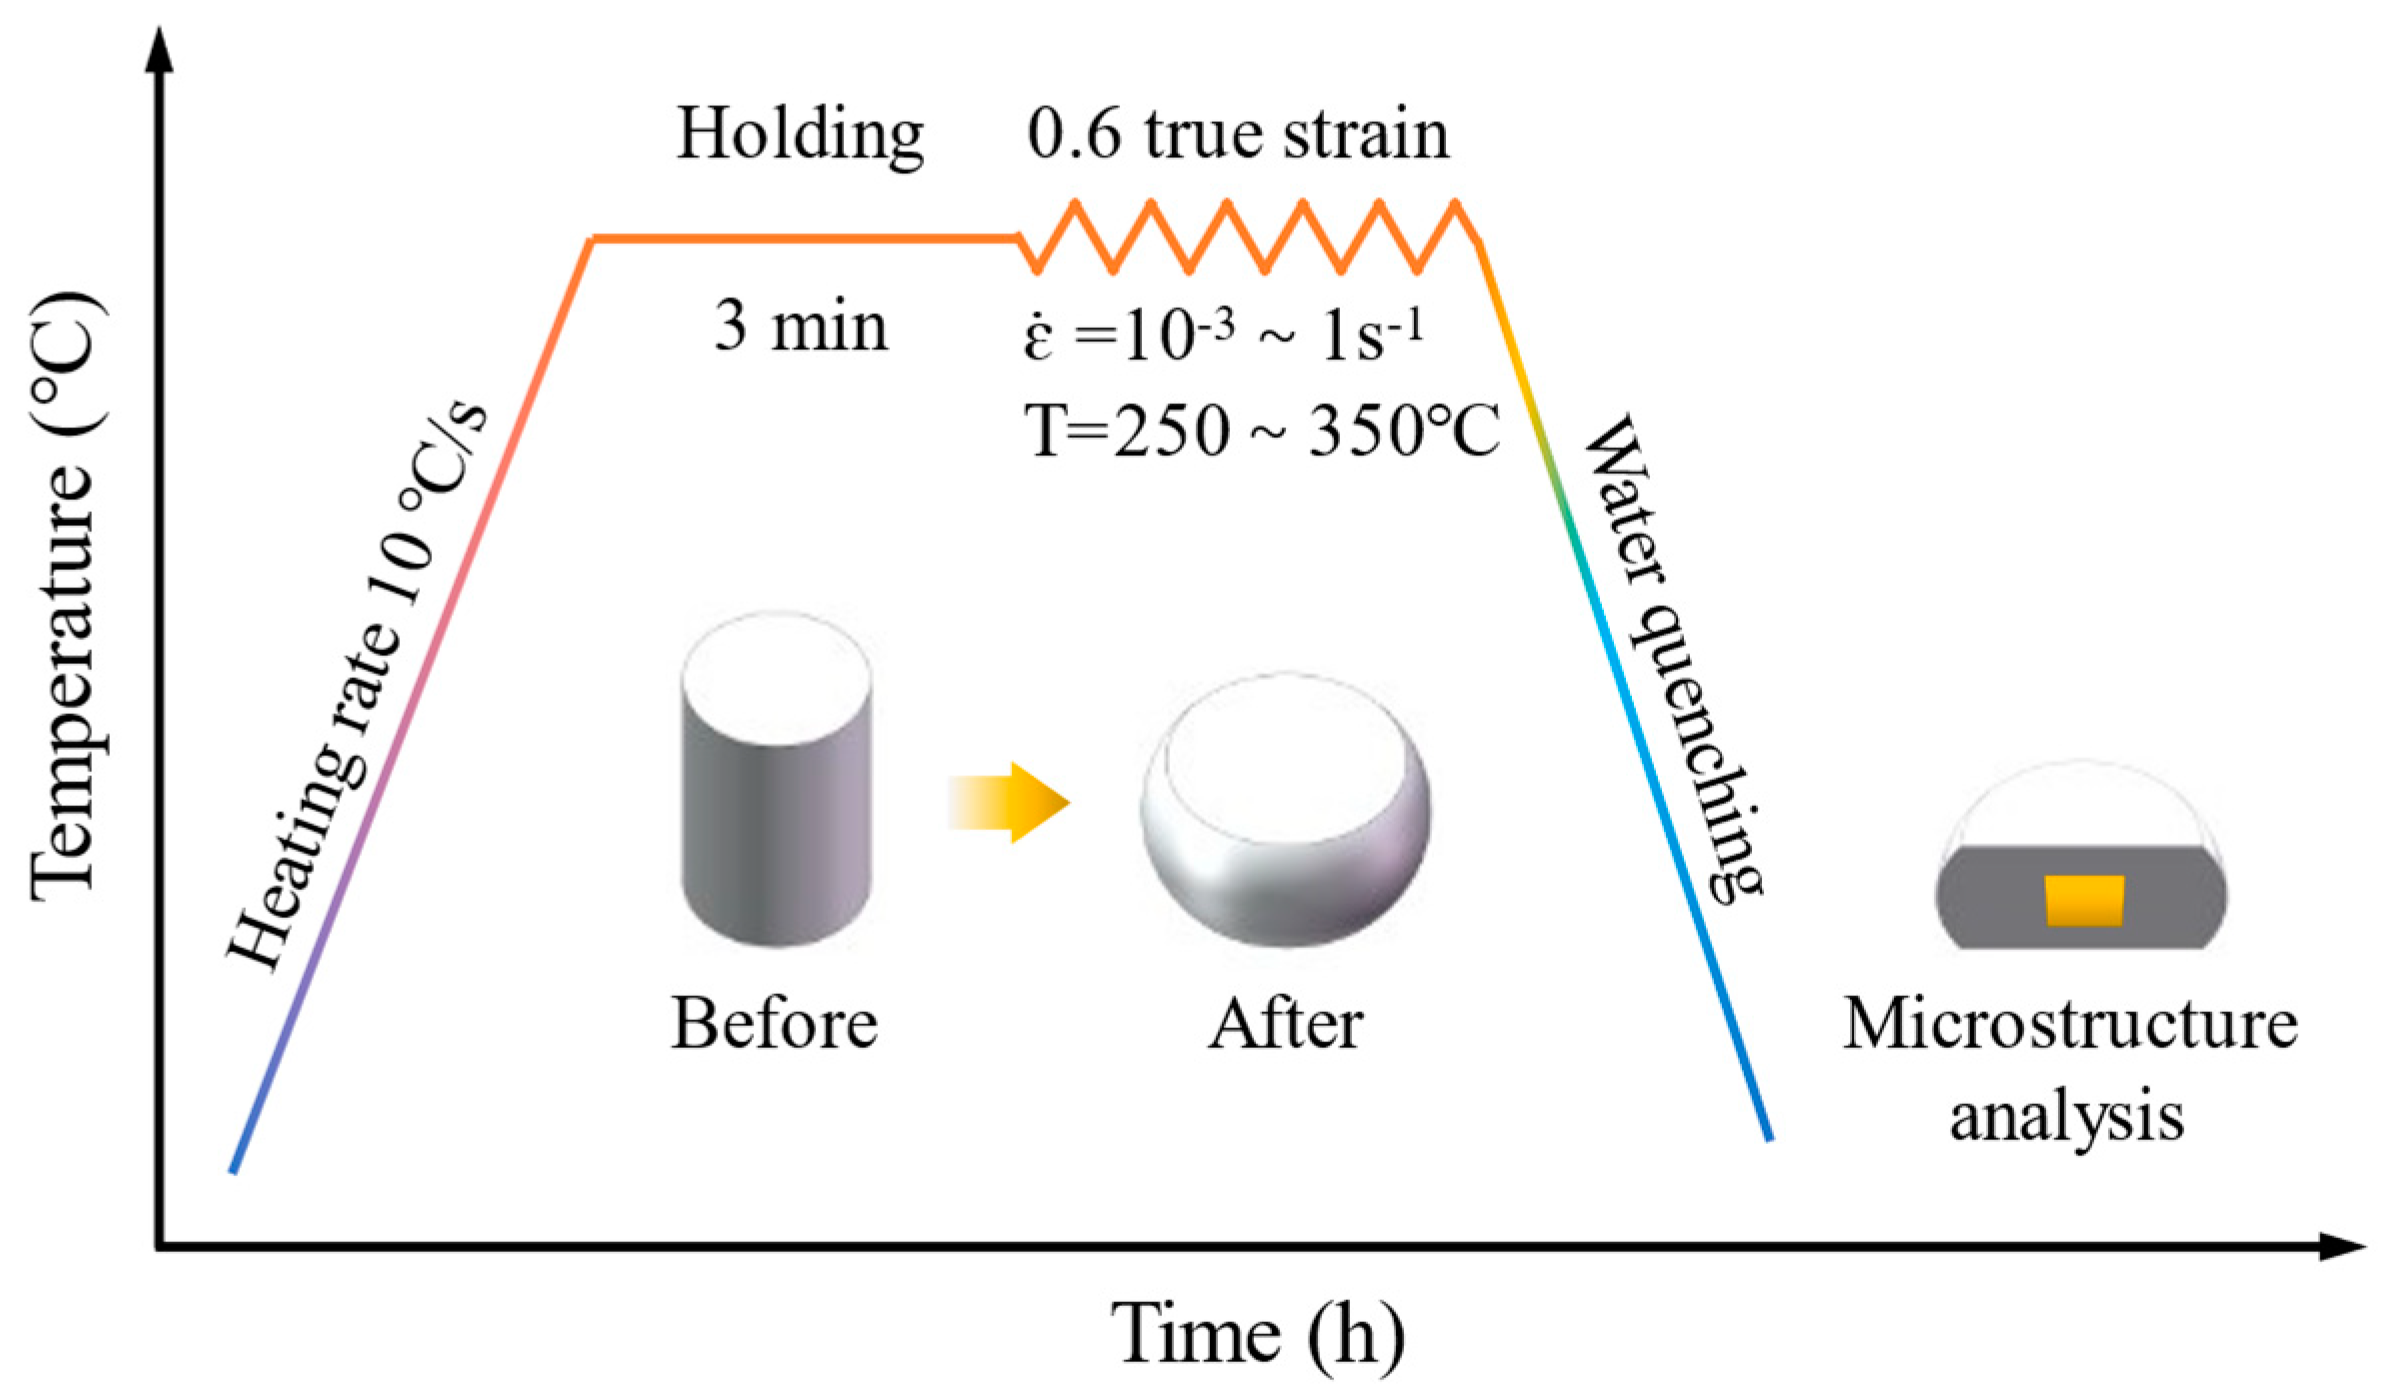
2. Materials and Experiments

The material for the experiments was sourced from the homogeneous ingot developed by Chinalco Southwest Aluminum. The initial microstructure and chemical composition of the alloy are detailed in Figure 1 and Table 1. Cylindrical specimens measuring Ø8 × 12 mm were cut from the ingots and utilized in thermal compression simulation experiments. The experiments were conducted using a Gleeble 3500 thermal simulation testing machine (DSI corporation) with experimental parameters set at T = 250~450 °C (50 °C interval) and ɛ̇ = 0.001~1 s−1 (10 times interval).
The experimental procedure, illustrated in Figure 2, began with heating the cylindrical specimen to the target temperature at a rate of 10 °C/s, which was followed by a 3-min hold at the target temperature to ensure uniformity between the surface and core temperatures. Subsequently, the sample was subjected to a true strain of 0.6 in the height direction at the target strain rate, which was followed by immediate quenching in water to maintain the deformed tissue. Throughout this period, the experimental system automatically collected real-time data values of pressure, displacement, and temperature, plotting the stress–strain curve.
After completing the experiments, samples were taken for observational analysis along the compression direction parallel to the profile axis. The microstructure analysis was performed using Electron Backscatter Diffraction (EBSD). The EBSD device model is TESCAN MIRA4 LMH. Initially, the samples for EBSD analysis were ground to 400 μm and then electrolytically polished to remove the deformed tissue. Electrolytic polishing was carried out at 20 V, −20~−30 °C, using a 25% nitric acid +75% methanol solution mixture. The EBSD analysis utilized a NordlysMax2 detector from Oxford Instruments with a step size of 2.5 μm.

3. Results and Discussion

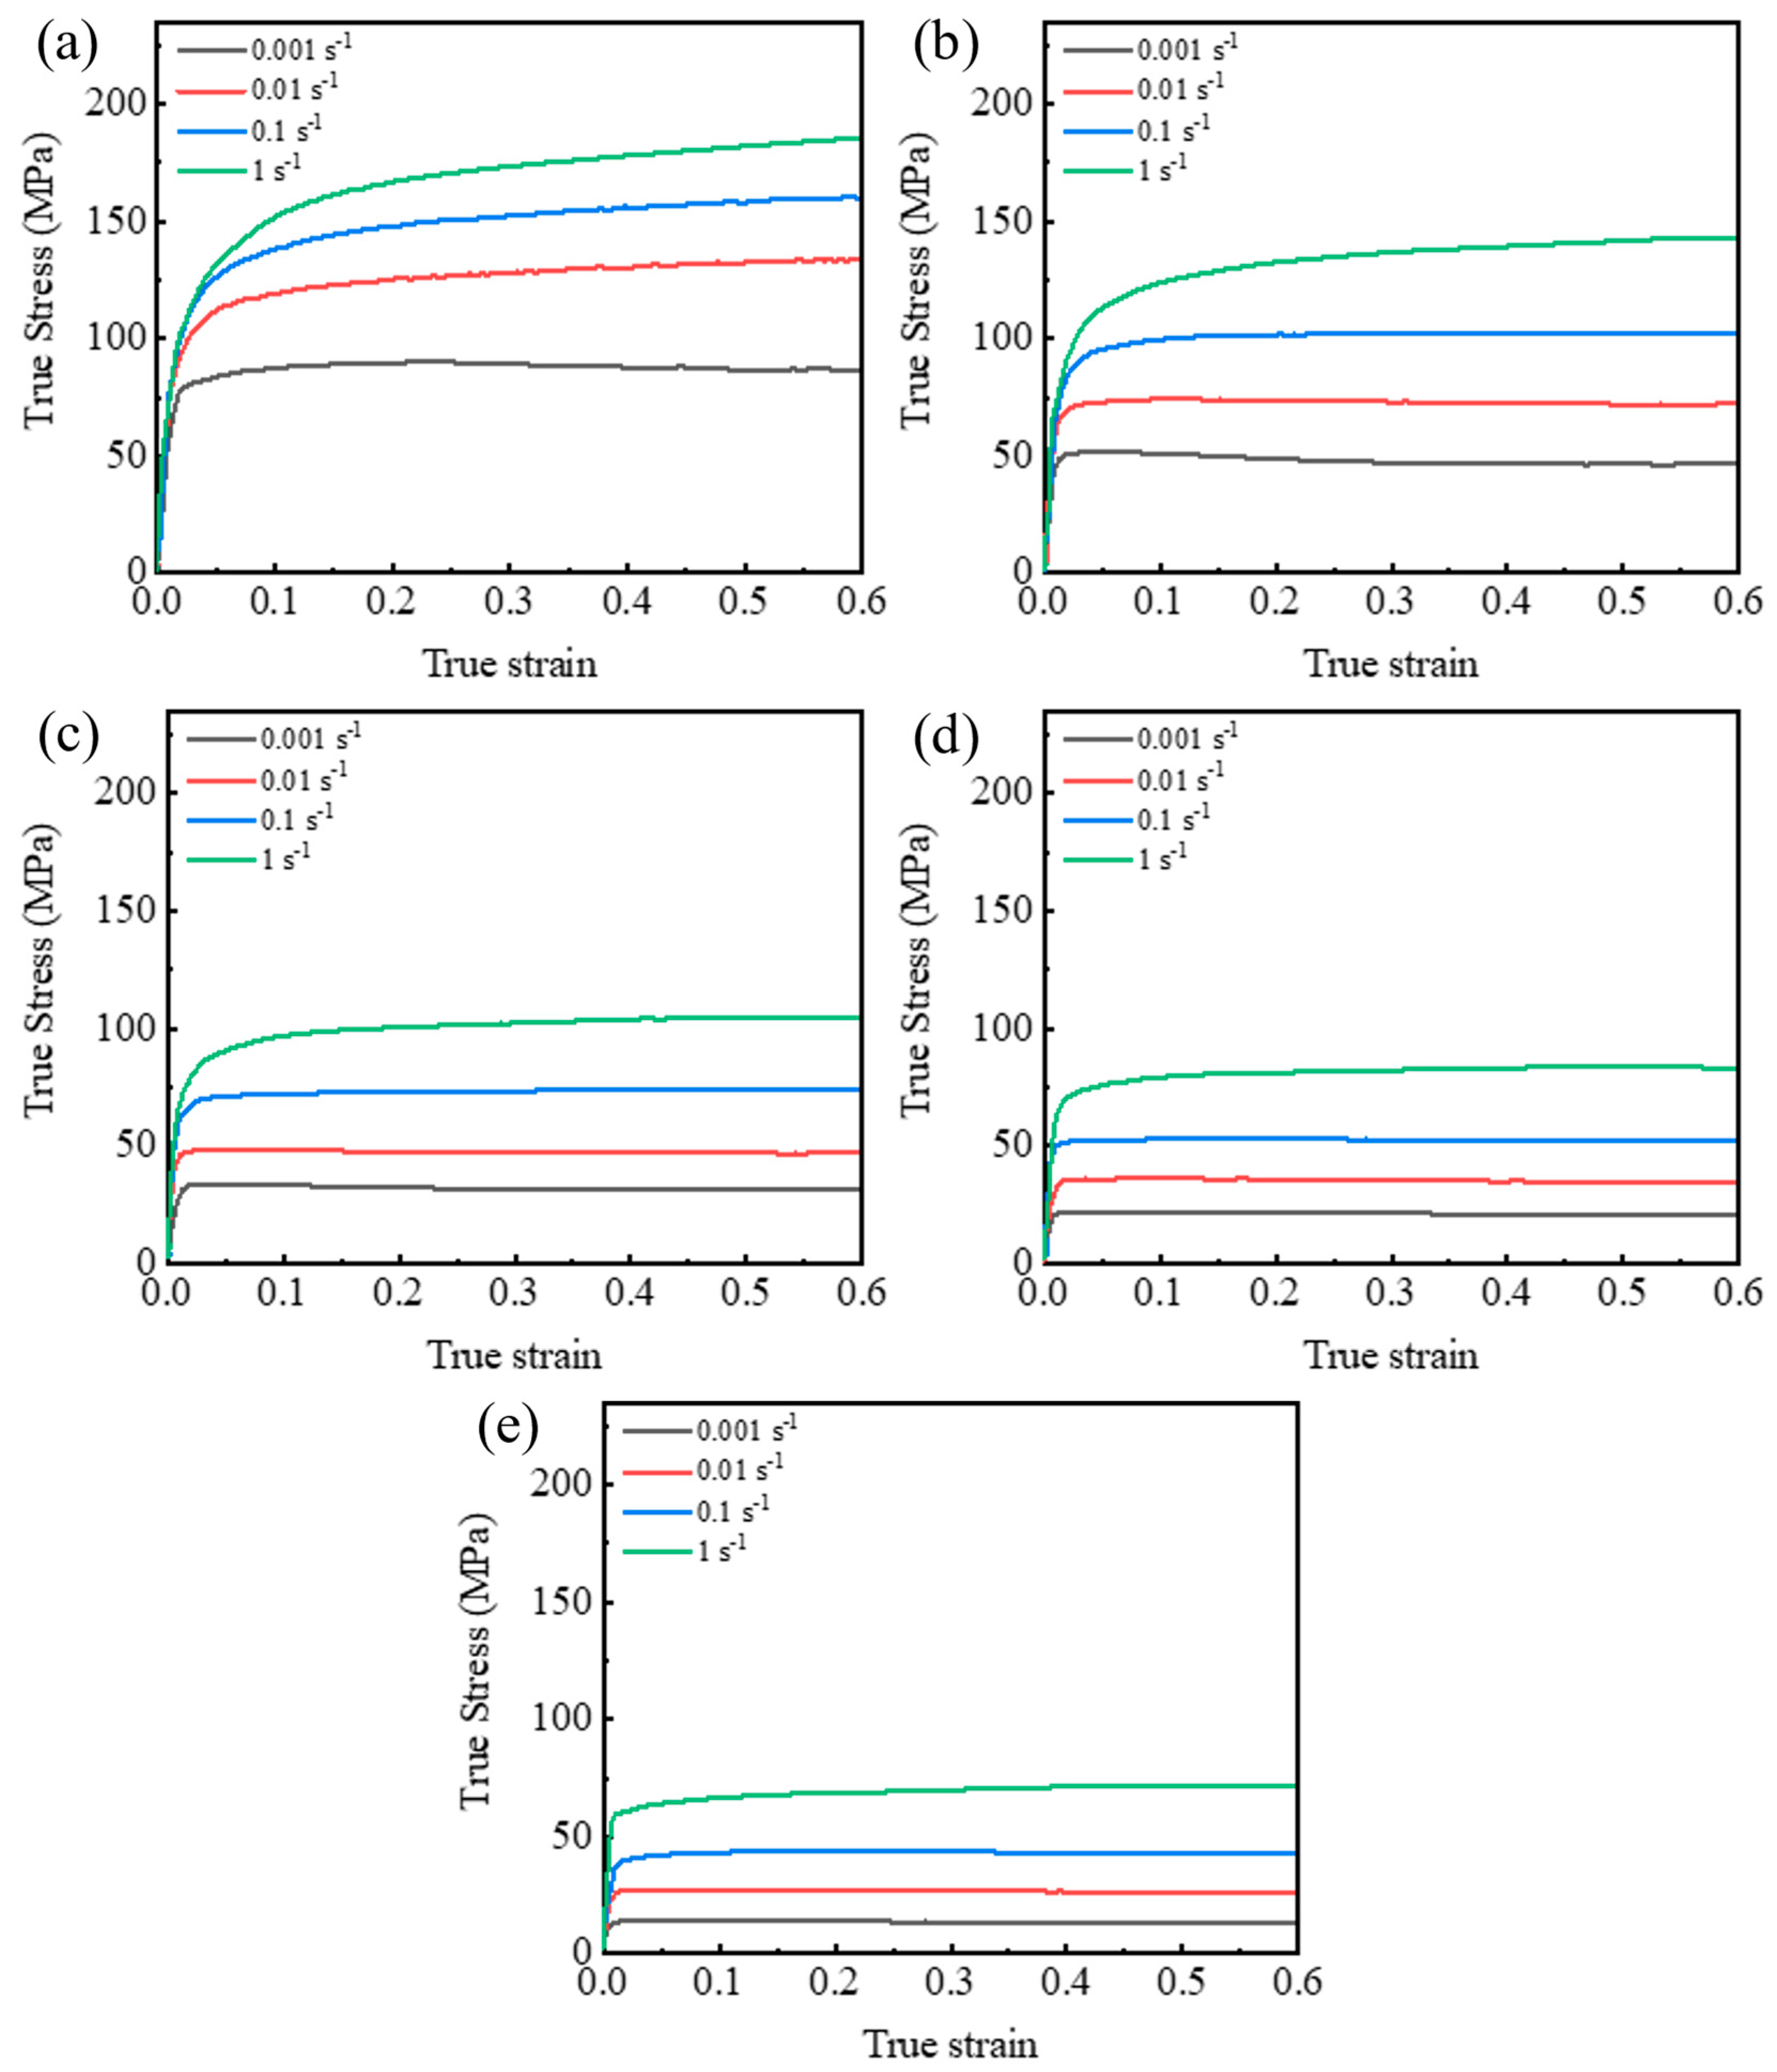
3.1. Flow Stress Behavior

Figure 3 displays the stress–strain curves for Al-7.92 Zn-1.64 Mg-2.00 Cu alloy at different deformation temperatures for a fixed deformation rate. The curves exhibit a consistent pattern with changing deformation temperature and reveal that at lower temperatures, the material experiences higher peak stress values. At smaller strain stages (ɛ̇ < 0.05 s−1), rapid stress increases occur due to increased work-hardening (deformation-induced dislocations) [16]. As the strain continues to increase, the increase in stress values slows down and remains in a state of dynamic equilibrium over a wide range of strains. This stage of work hardening cancels out with dynamic softening, which is affected by the DRV or DRX mechanism of the crystals during thermal deformation of Al alloy [14]. Comparative analysis shows that under low strain rate conditions (ɛ̇ = 0.001~0.01 s−1), stress values exhibit a decreasing trend after reaching the peak, suggesting possible DRX mechanism occurrence. Conversely, under high strain rate conditions (ɛ̇ = 0.1~1 s−1), stress values do not show a significant decreasing trend after the peak, indicating a DRV mechanism. Moreover, temperature significantly affects stress values during deformation with a 60% decrease in stress values as the temperature increases in the range of strain rates ɛ̇ = 0.001~1 s−1.
Figure 4 presents stress–strain curves for Al-7.92 Zn-1.64 Mg-2.00 Cu alloy at fixed deformation temperatures for different deformation rates. Consistently, higher deformation rates lead to higher peak stress values. Analyzing the curves, under high-temperature deformation conditions (T = 350~450 °C), a decreasing trend in stress values post-peak implies DRX softening. Conversely, under low-temperature deformation conditions (T = 250~300 °C), no obvious decreasing trend post-peak indicates DRX softening. In low-temperature conditions (T = 250~300 °C), the stress values do not exhibit a decreasing trend post-peak, showcasing the DRV mechanism.
In summary, the Al-7.92 Zn-1.64 Mg-2.00 Cu alloy displays a high sensitivity toward deformation conditions. As the temperature rises, the thermal activation energy of the material reduces, enhancing the driving force of atomic motion. This makes dislocation motion and annihilation easier, resulting in a marked dynamic softening effect and decreasing stress values. Additionally, the strain rate decreases, allowing for sufficient time for dislocations to migrate, and cross-slip. Enhanced dislocation pairing and rearrangement, decreased dislocation entanglement, and a significant dynamic softening effect are observed. Under specific conditions (T = 350~450 °C and ɛ̇ = 0.001~0.1 s−1), the DRV mechanism is enhanced, contributing to low deformation resistance and favoring thermoplastic processing.

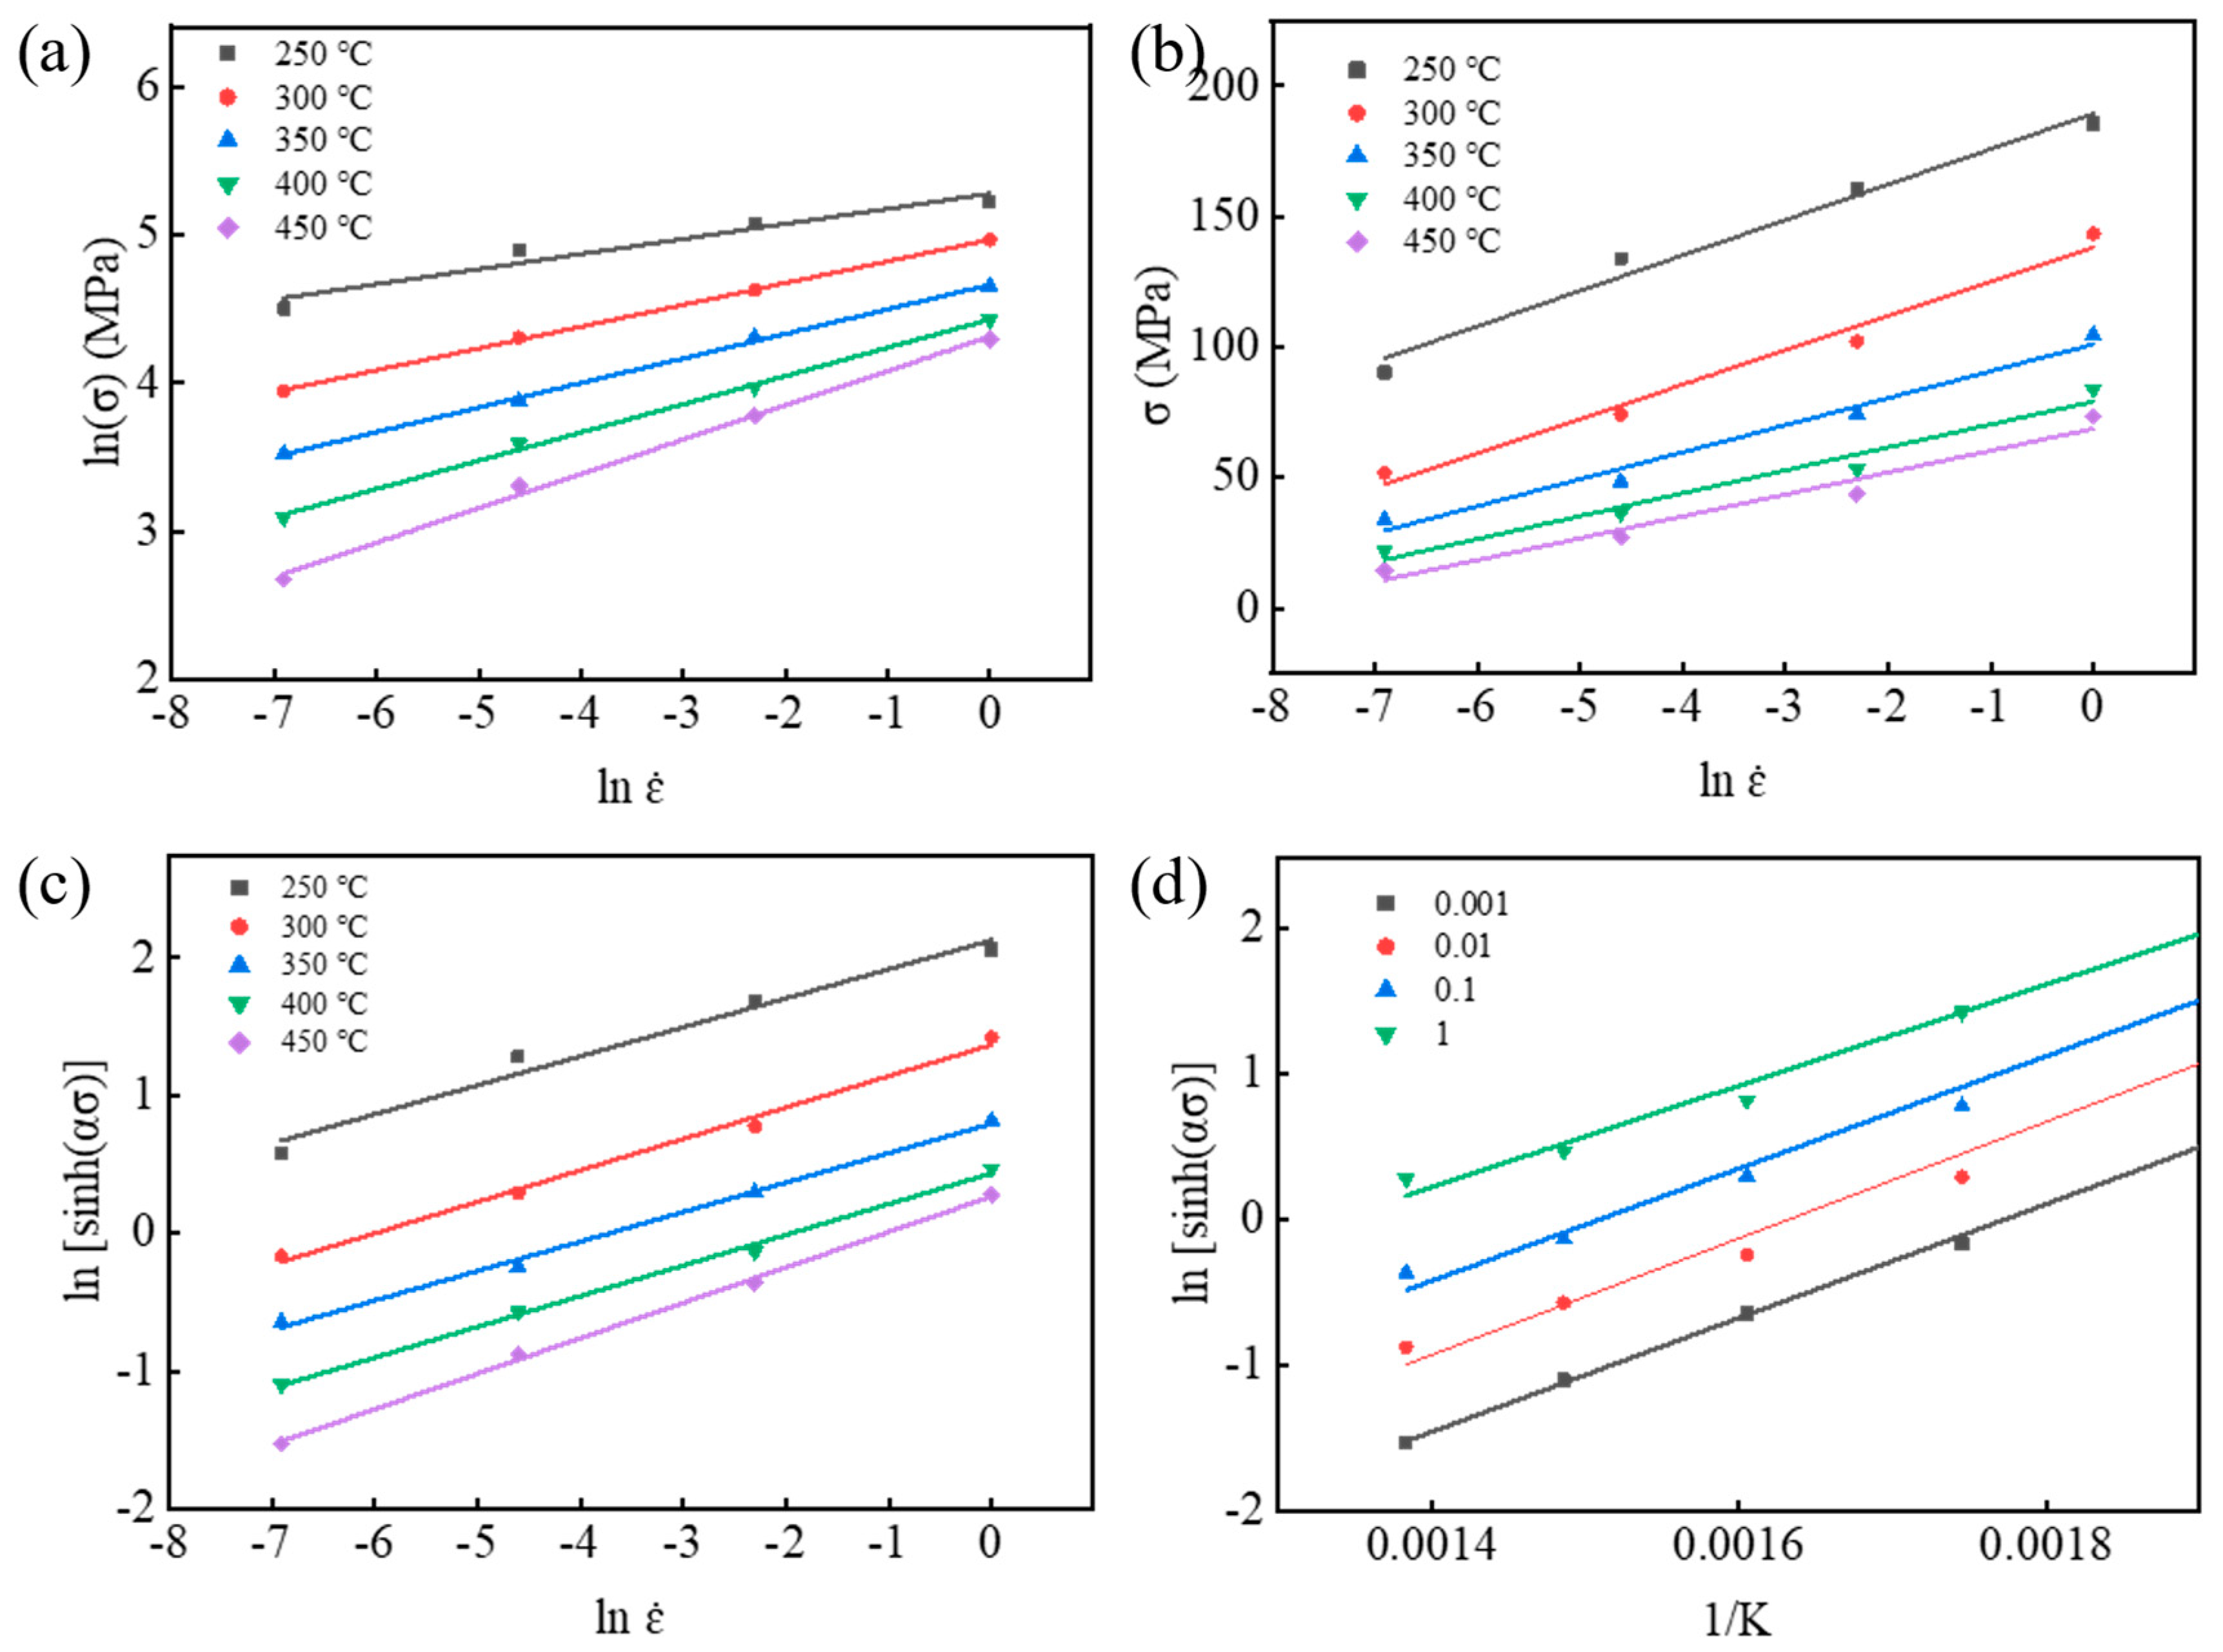
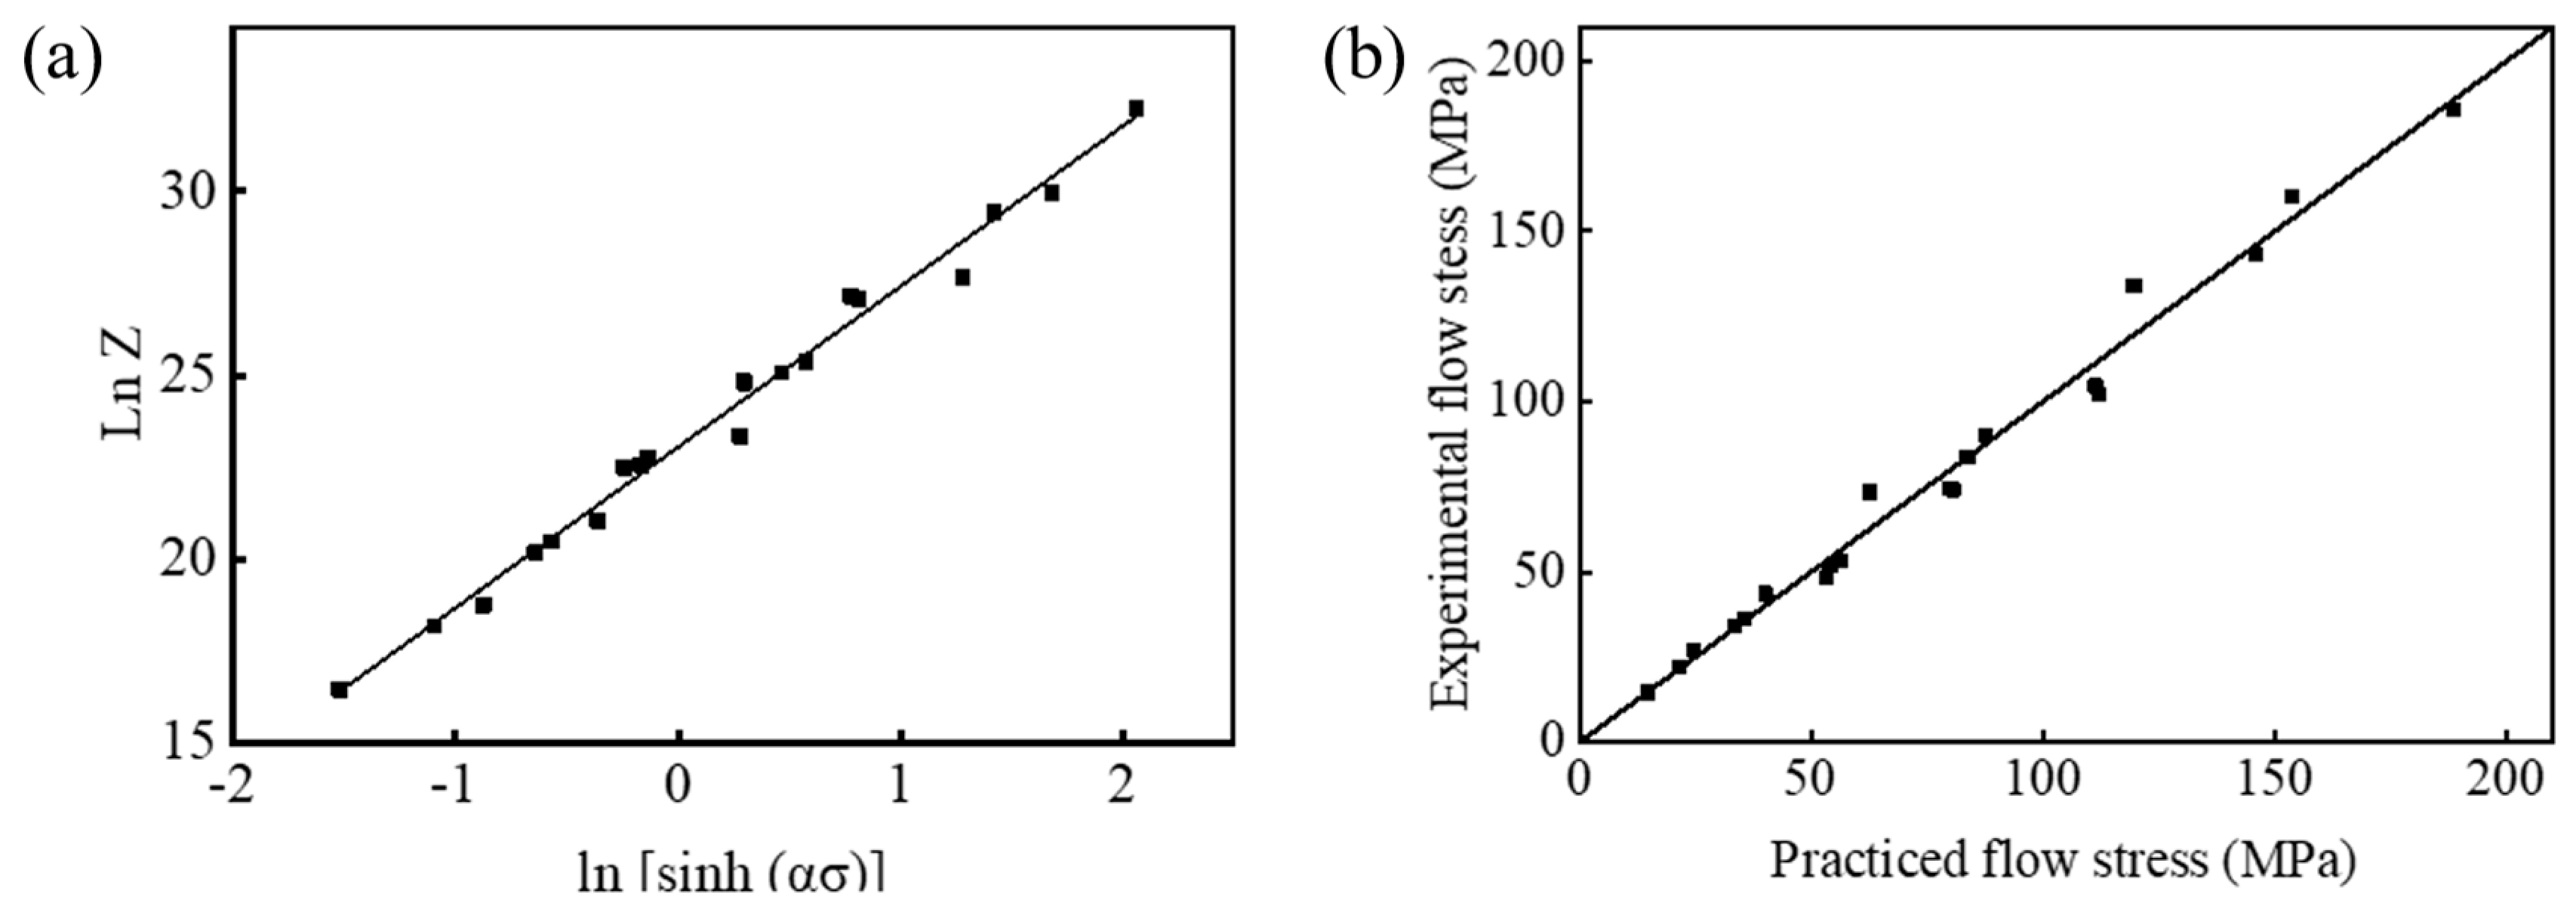
3.2. Constitutive Equations

The Al-7.92 Zn-1.64 Mg-2.00 Cu alloy exhibits a high sensitivity to deformation conditions, which are primarily influenced by temperature and strain rate. The relationship between these factors and the stress can be defined through building a constitutive model. The frequently used constitutive equations that are applied to this alloy are the hyperbolic sine Arrhenius-type equations, which were proposed by Sellars and Tegart [17]. The applicable equation is expressed as:
ε ˙ = A F σ exp Q R T
Here, ɛ̇ represents the strain rate (s−1), A is a material constant, σ is stress (MPa), Q corresponds to the deformation activation energy (KJ/mol), R is the ideal gas constant (8.31 J/(mol·K)), and T represents the absolute temperature (°C).
Meanwhile, F(σ) is a stress-dependent function, which adopts varied expressions under different conditions, as follows:
F σ = σ n 1                                                       ( α σ < 0.8 ) exp β σ                                   ( α σ > 0.8 ) s i n h ( α σ ) n                     ( f o r   a l l   σ )
where n1, α, and β are material constants, while α = β/n1 and n represents the stress constant.
Upon substituting F(σ) into Equation (1), an expression for ɛ̇ can be obtained.
ε ˙ = A 1 σ n 1 exp ( Q R T )                                                       ( α σ < 0.8 ) A 2 exp β σ exp ( Q R T )                                   ( α σ > 0.8 ) A s i n h ( α σ ) n exp ( Q R T )                           ( f o r   a l l   σ )
where A1, A2 and A are material constants. Taking the natural logarithm of Equation (3) yields:
l n ε ˙ = l n A 1 + n 1 l n σ Q R T                                                       ( α σ < 0.8 ) l n A 2 + β σ Q R T                                                                   ( α σ > 0.8 ) l n A + n l n s i n h ( α σ ) Q R T                       ( f o r   a l l   σ )
According to Equation (4), the relations ln (ɛ̇) − ln (σ), ln (ɛ̇) − σ and ln (ɛ̇) − ln [sinh (ασ)] are shown in Figure 5a–c. The slopes of these linear relations were determined by n1 = 6.453484797, β = 0.095969 and n = 4.438898, respectively. α = 0.014871 was obtained from the relation. The expression for the deformation activation energy of the alloy can be obtained by partial differentiation of the ln (ɛ̇) relation in Equation (4) for the following condition for all σ:
Q = R n b
where n and b can be obtained by linear fitting of the relations ln (ɛ̇) − ln [sinh (ασ)] and ln [sinh (ασ)] − 1/T, whose values are the slopes of the corresponding straight lines:
n = l n s i n h ( α σ ) ( 1 / T )
b = l n ε ˙ n s i n h ( α σ ) T
Calculation yields the n = 4.438898, b = 4.311655 and deformation activation energy Q = 276.565 kJ/mol.
Zener and Hollmon et al. [18] found a functional relationship between the deformation temperature and strain rate of the alloy during deformation, the Zener–Hollowon expression for:
Z = ε ˙ exp ( Q R T )
This can be obtained by substituting Equation (1) into Equation (6) and taking the logarithm:
l n Z = l n A + n l n sinh α σ
where ln A can be linearly fitted to ln Zln [sinh (ασ)], as shown in Figure 6a and obtained as ln A = 24.0986. Finally, the thermal deformation constitutive model of Al-7.92 Zn-1.64 Mg-2.00 Cu alloy at a true strain of 0.3 is obtained as:
ε ˙ = 1.014 × 10 10 sinh 0.014871 σ 4.37474 exp 140303 R T
In addition, the comparison between the experimental value of peak stress and the predicted value is shown in Figure 6b, which indicates that the established constitutive model of stress–strain of hot flow behavior has a better prediction accuracy and can be used for the simulation and analysis of the hot forming process of Al-7.92 Zn-1.64 Mg-2.00 Cu alloy.

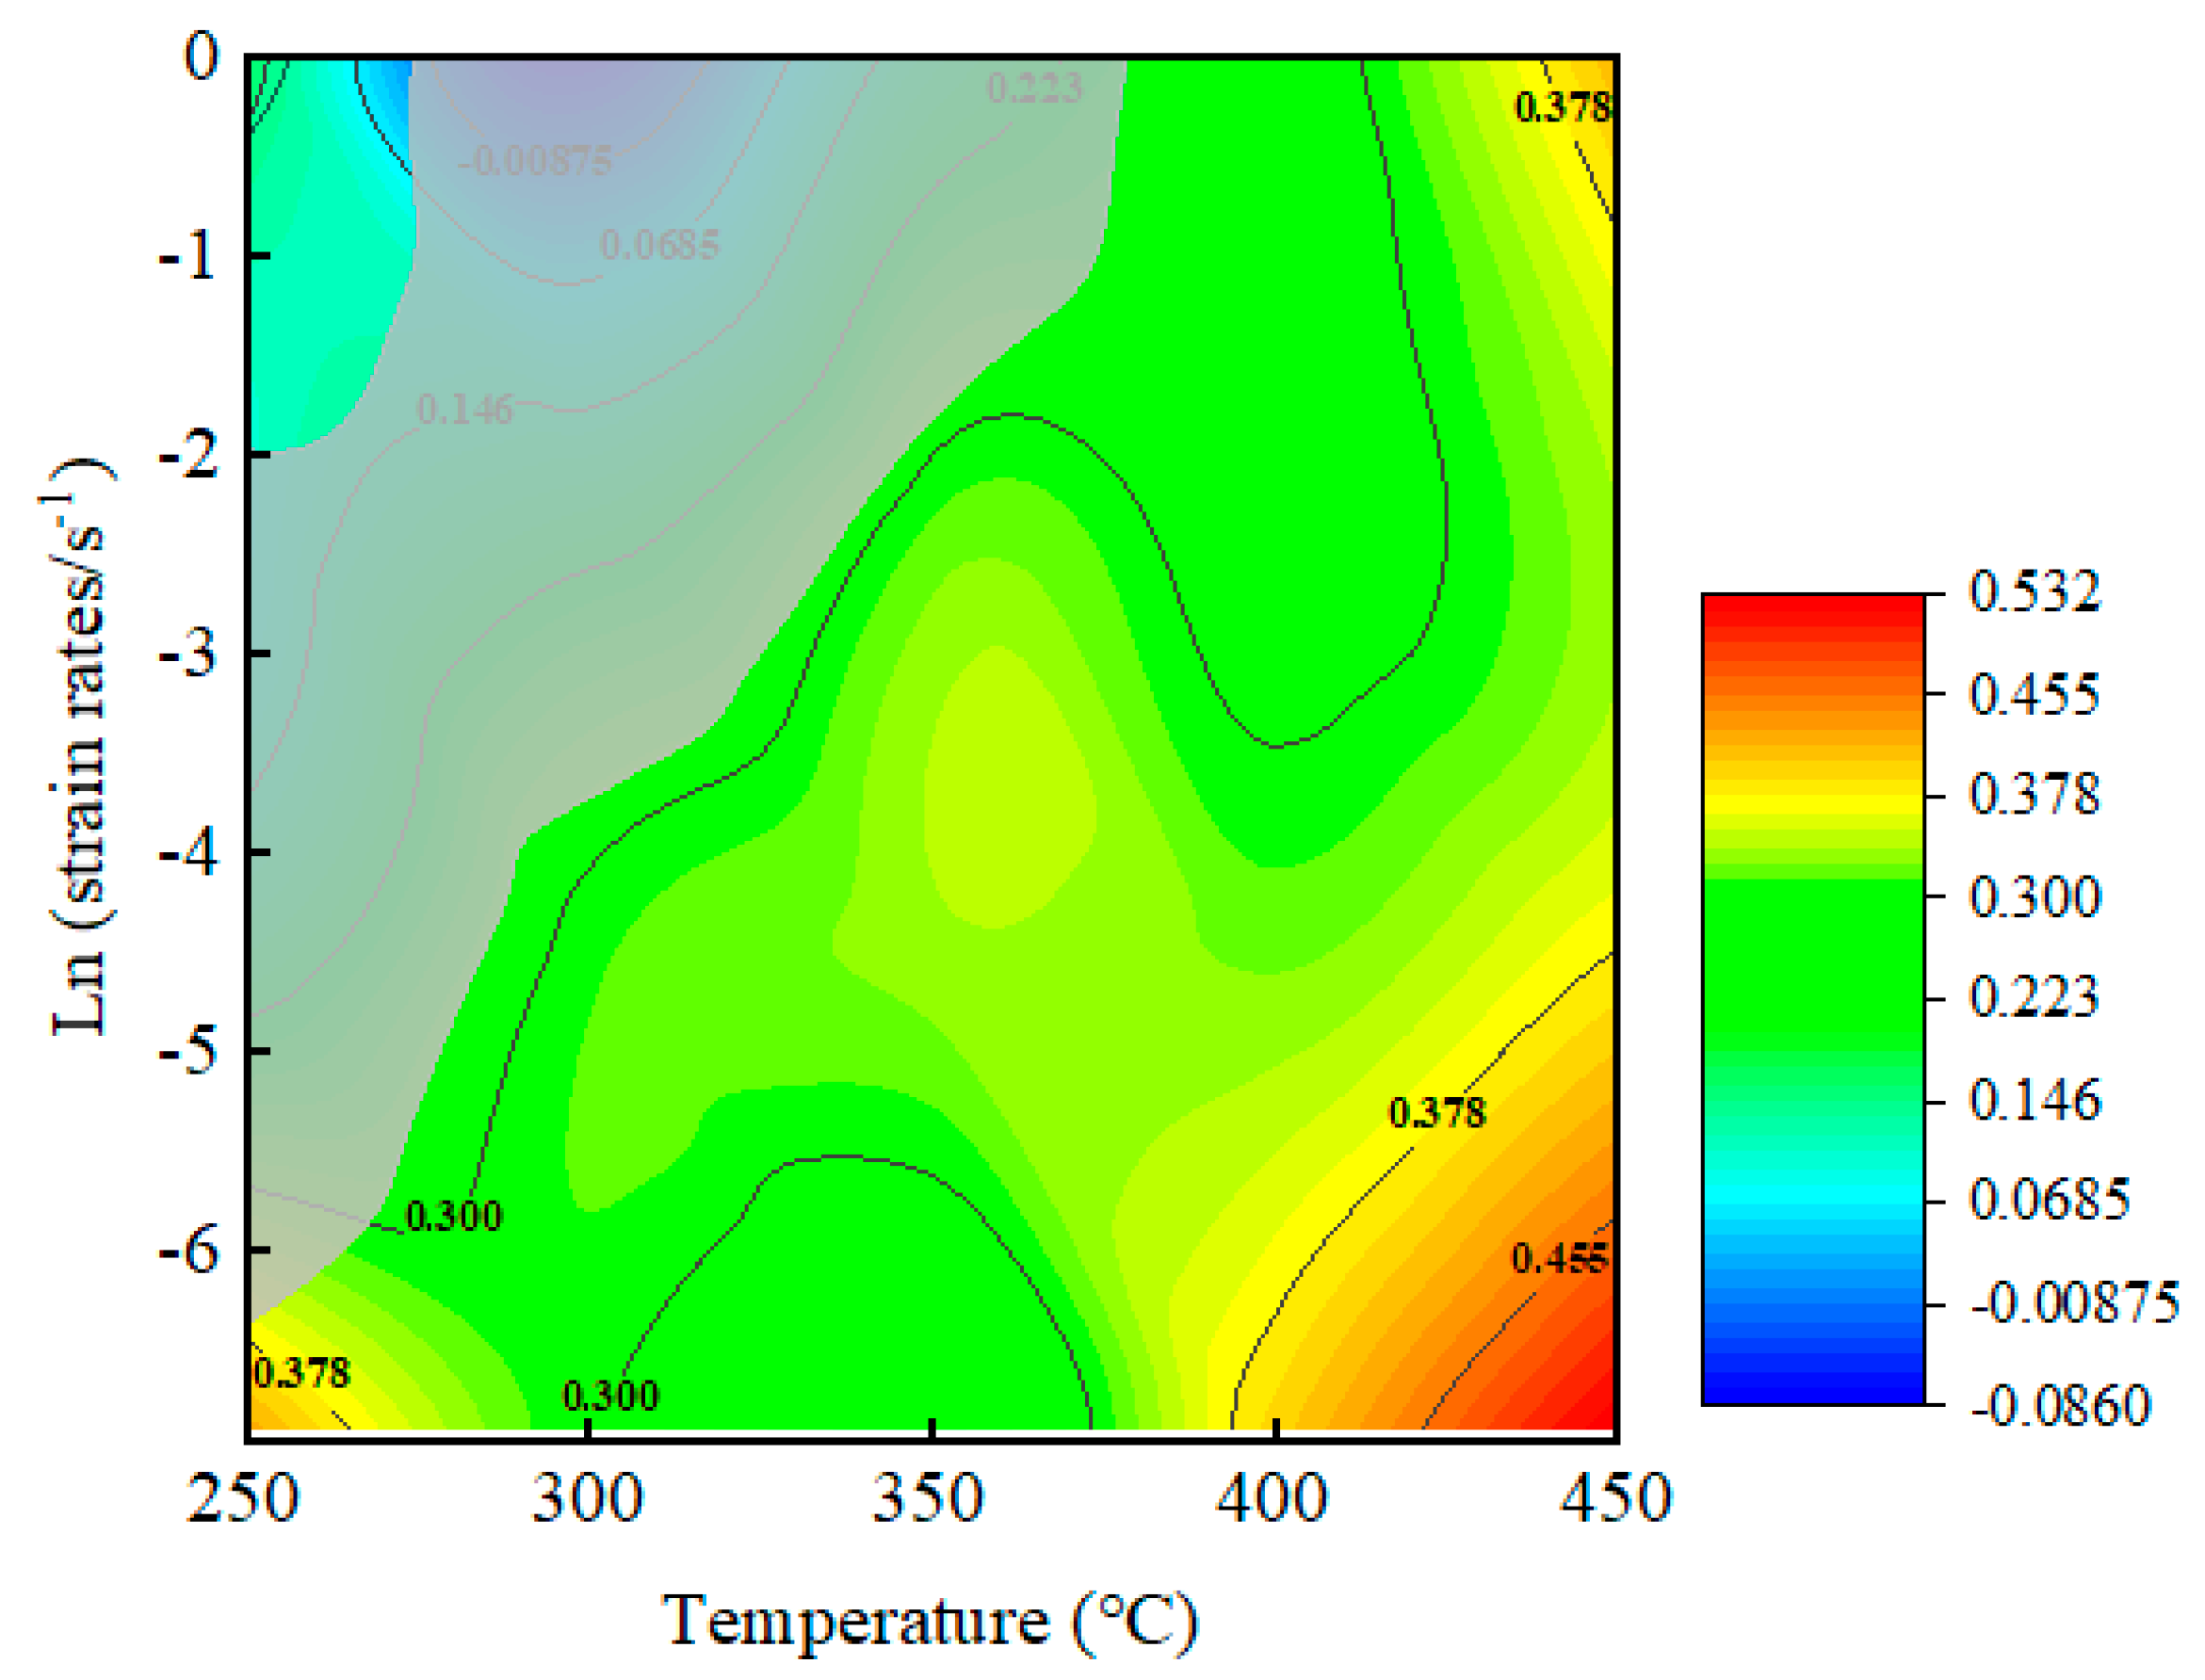
3.3. Hot Processing Map Establishment

A hot processing map can provide a useful representation of the connection between the constitutive model, organizational state, and deformation process of alloy materials. Prasad et al. [19] proposed a PM based on the Dynamic Materials Model (DMM). The DMM treats the plastic deformation process of metals and alloys as an energy-dissipating system. This includes power dissipation for plastic deformation (G) and power dissipation for structural transformation (J). The power input (P) of the deformed material is given by the equation P = G + J, which can be further simplified as follows:
P = G + J = 0 ε ˙ σ d ε ˙ + 0 σ ε ˙ d σ
where G and J represent the energy lost during material deformation and the energy used by the microstructure evolution of the material pre- and post-deformation. The relationship between G and J depends on the strain rate sensitivity index m [20], which can be determined via fitting the connection between ln σ and ln ɛ̇.
m = J G ε , T = P G J P = σ d ε ˙ ε ˙ d σ = ( l n σ ) l n ε ˙ ε , T
J co-content can be expressed as:
m = 0 σ ε ˙ d σ = m m + 1 σ ε ˙
For an ideal linear dissipative system, the J co-content reaches a maximum at m = 1, which is denoted as:
J m a x = σ ε ˙ 2
For nonlinear systems, the power consumption efficiency is represented by the dimensionless parameter η [21]:
η = J J m a x = 2 m m + 1
The coefficient η can elucidate the specific deformation mechanism. To assess the thermal processing performance of the material, the power dissipation efficiency map is created to derive η under various deformation conditions. Moreover, to account for defects during the deformation process, the criterion based on the maximum entropy generation rate principle is employed to detect the flow instability of the material. This is designated as:
ξ ε ˙ = lg m / m + 1 l g ε ˙ + m < 0
where ξ represents the instability factor; an instability map can be generated by calculating ξ under diverse deformation situations. Materials processed in the region of negative ξ have a tendency to display deformation instability, which can give rise to microstructural defects.
The hot processing map is generated through overlapping the power dissipation efficiency map and the instability map. Figure 7 illustrates the resulting hot processing map utilizing stress data at a 0.3 strain, revealing the hot processing properties of the Al-7.92 Zn-1.64 Mg-2.00 Cu alloy under steady-state conditions. The contour figures display the percentage of power consumption efficiency η. Larger values denote superior thermal processing properties of the material, whereas the shaded region signifies the area of deformation instability. Figure 7 demonstrates that the Al-7.92 Zn-1.64 Mg-2.00 Cu alloy is particularly responsive to deformation rate. Destabilization occurs as a result of deformation at high strain rates across all temperatures. The hot processing map displays a region characterized by high power dissipation (0.37) and stable deformation. This region corresponds to deformation temperatures of T = 380~450 °C. Additionally, the strain rate of the deformed alloy is 0.37 as well at 450 °C. The thermal processing performance is good when the strain rate ɛ̇ < 0.1 s−1.

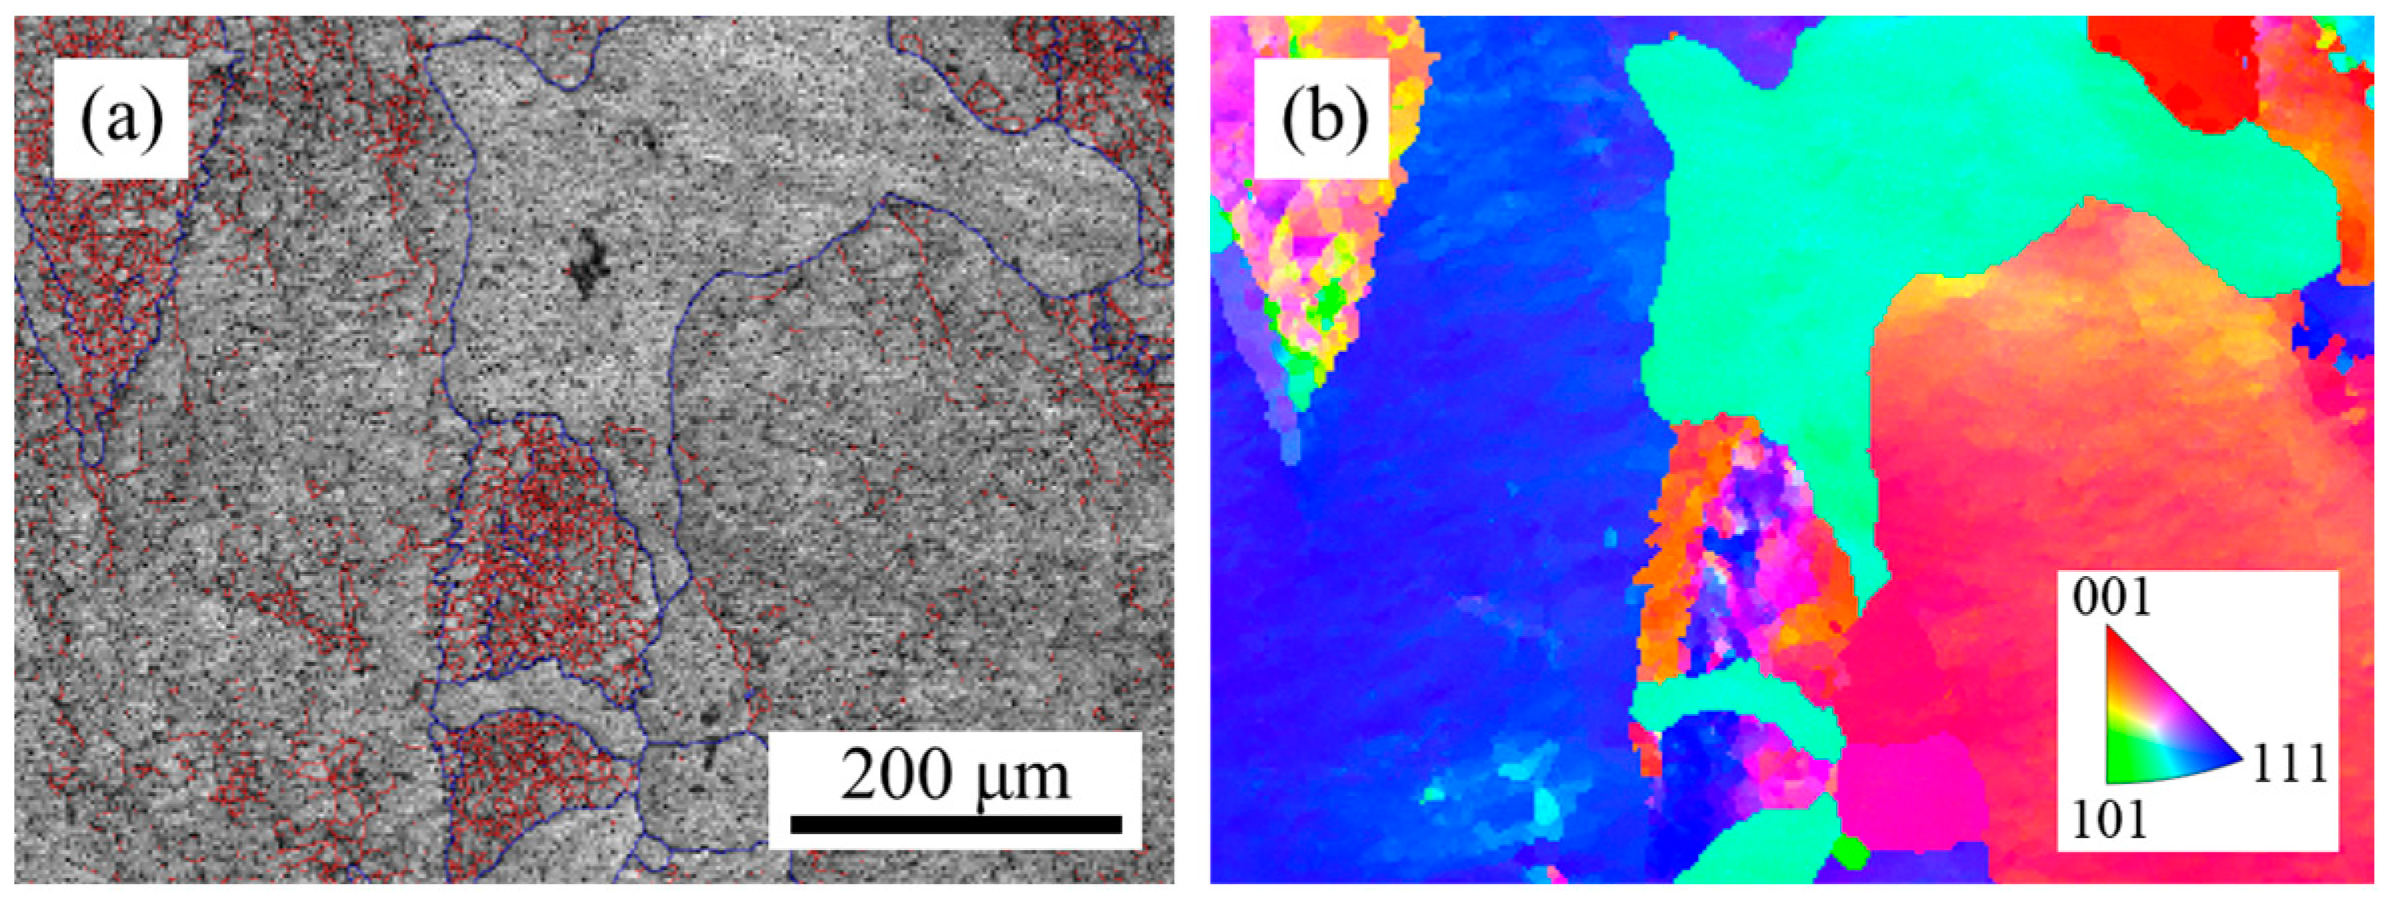
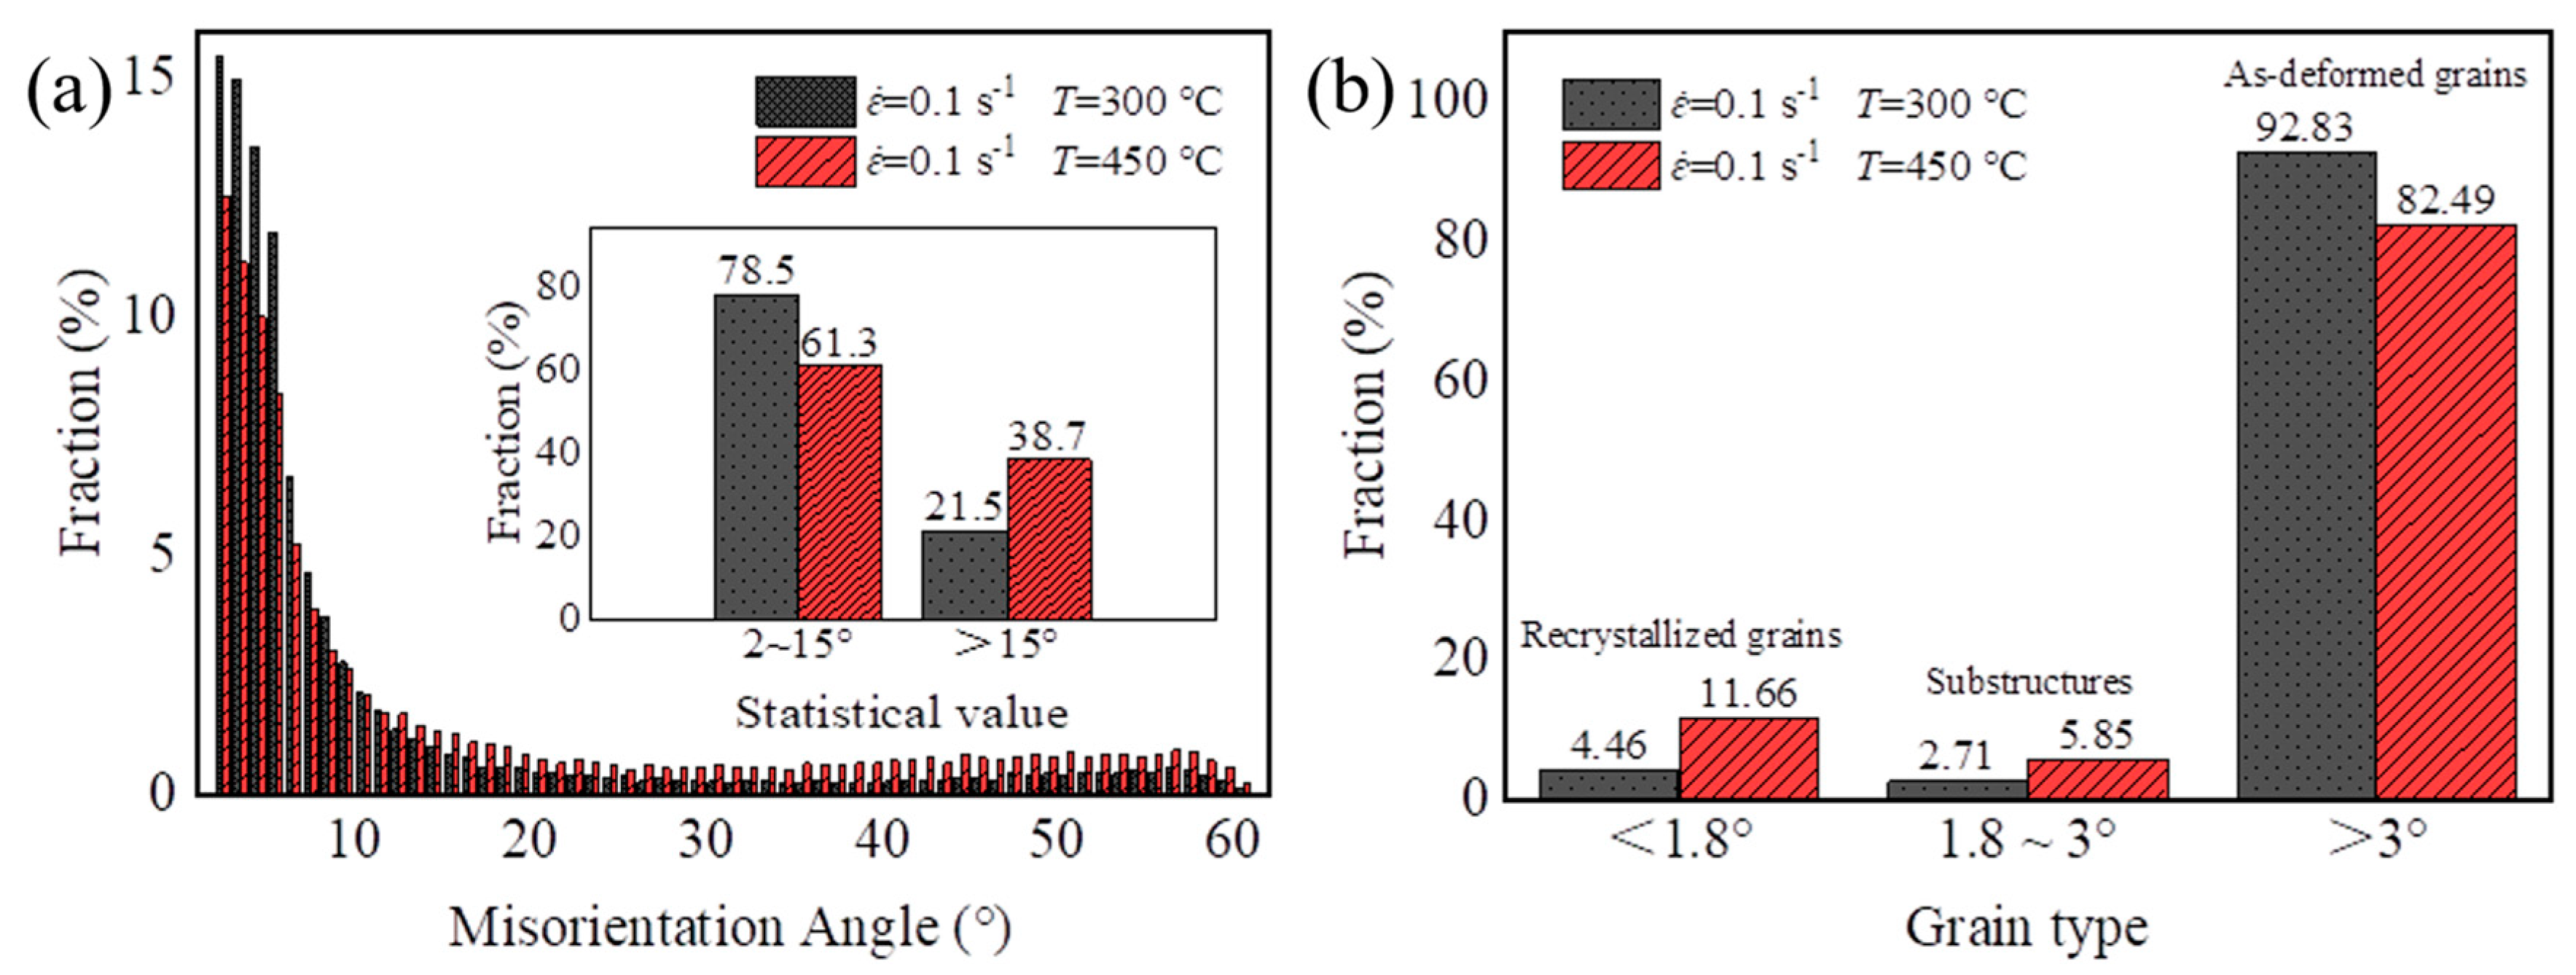
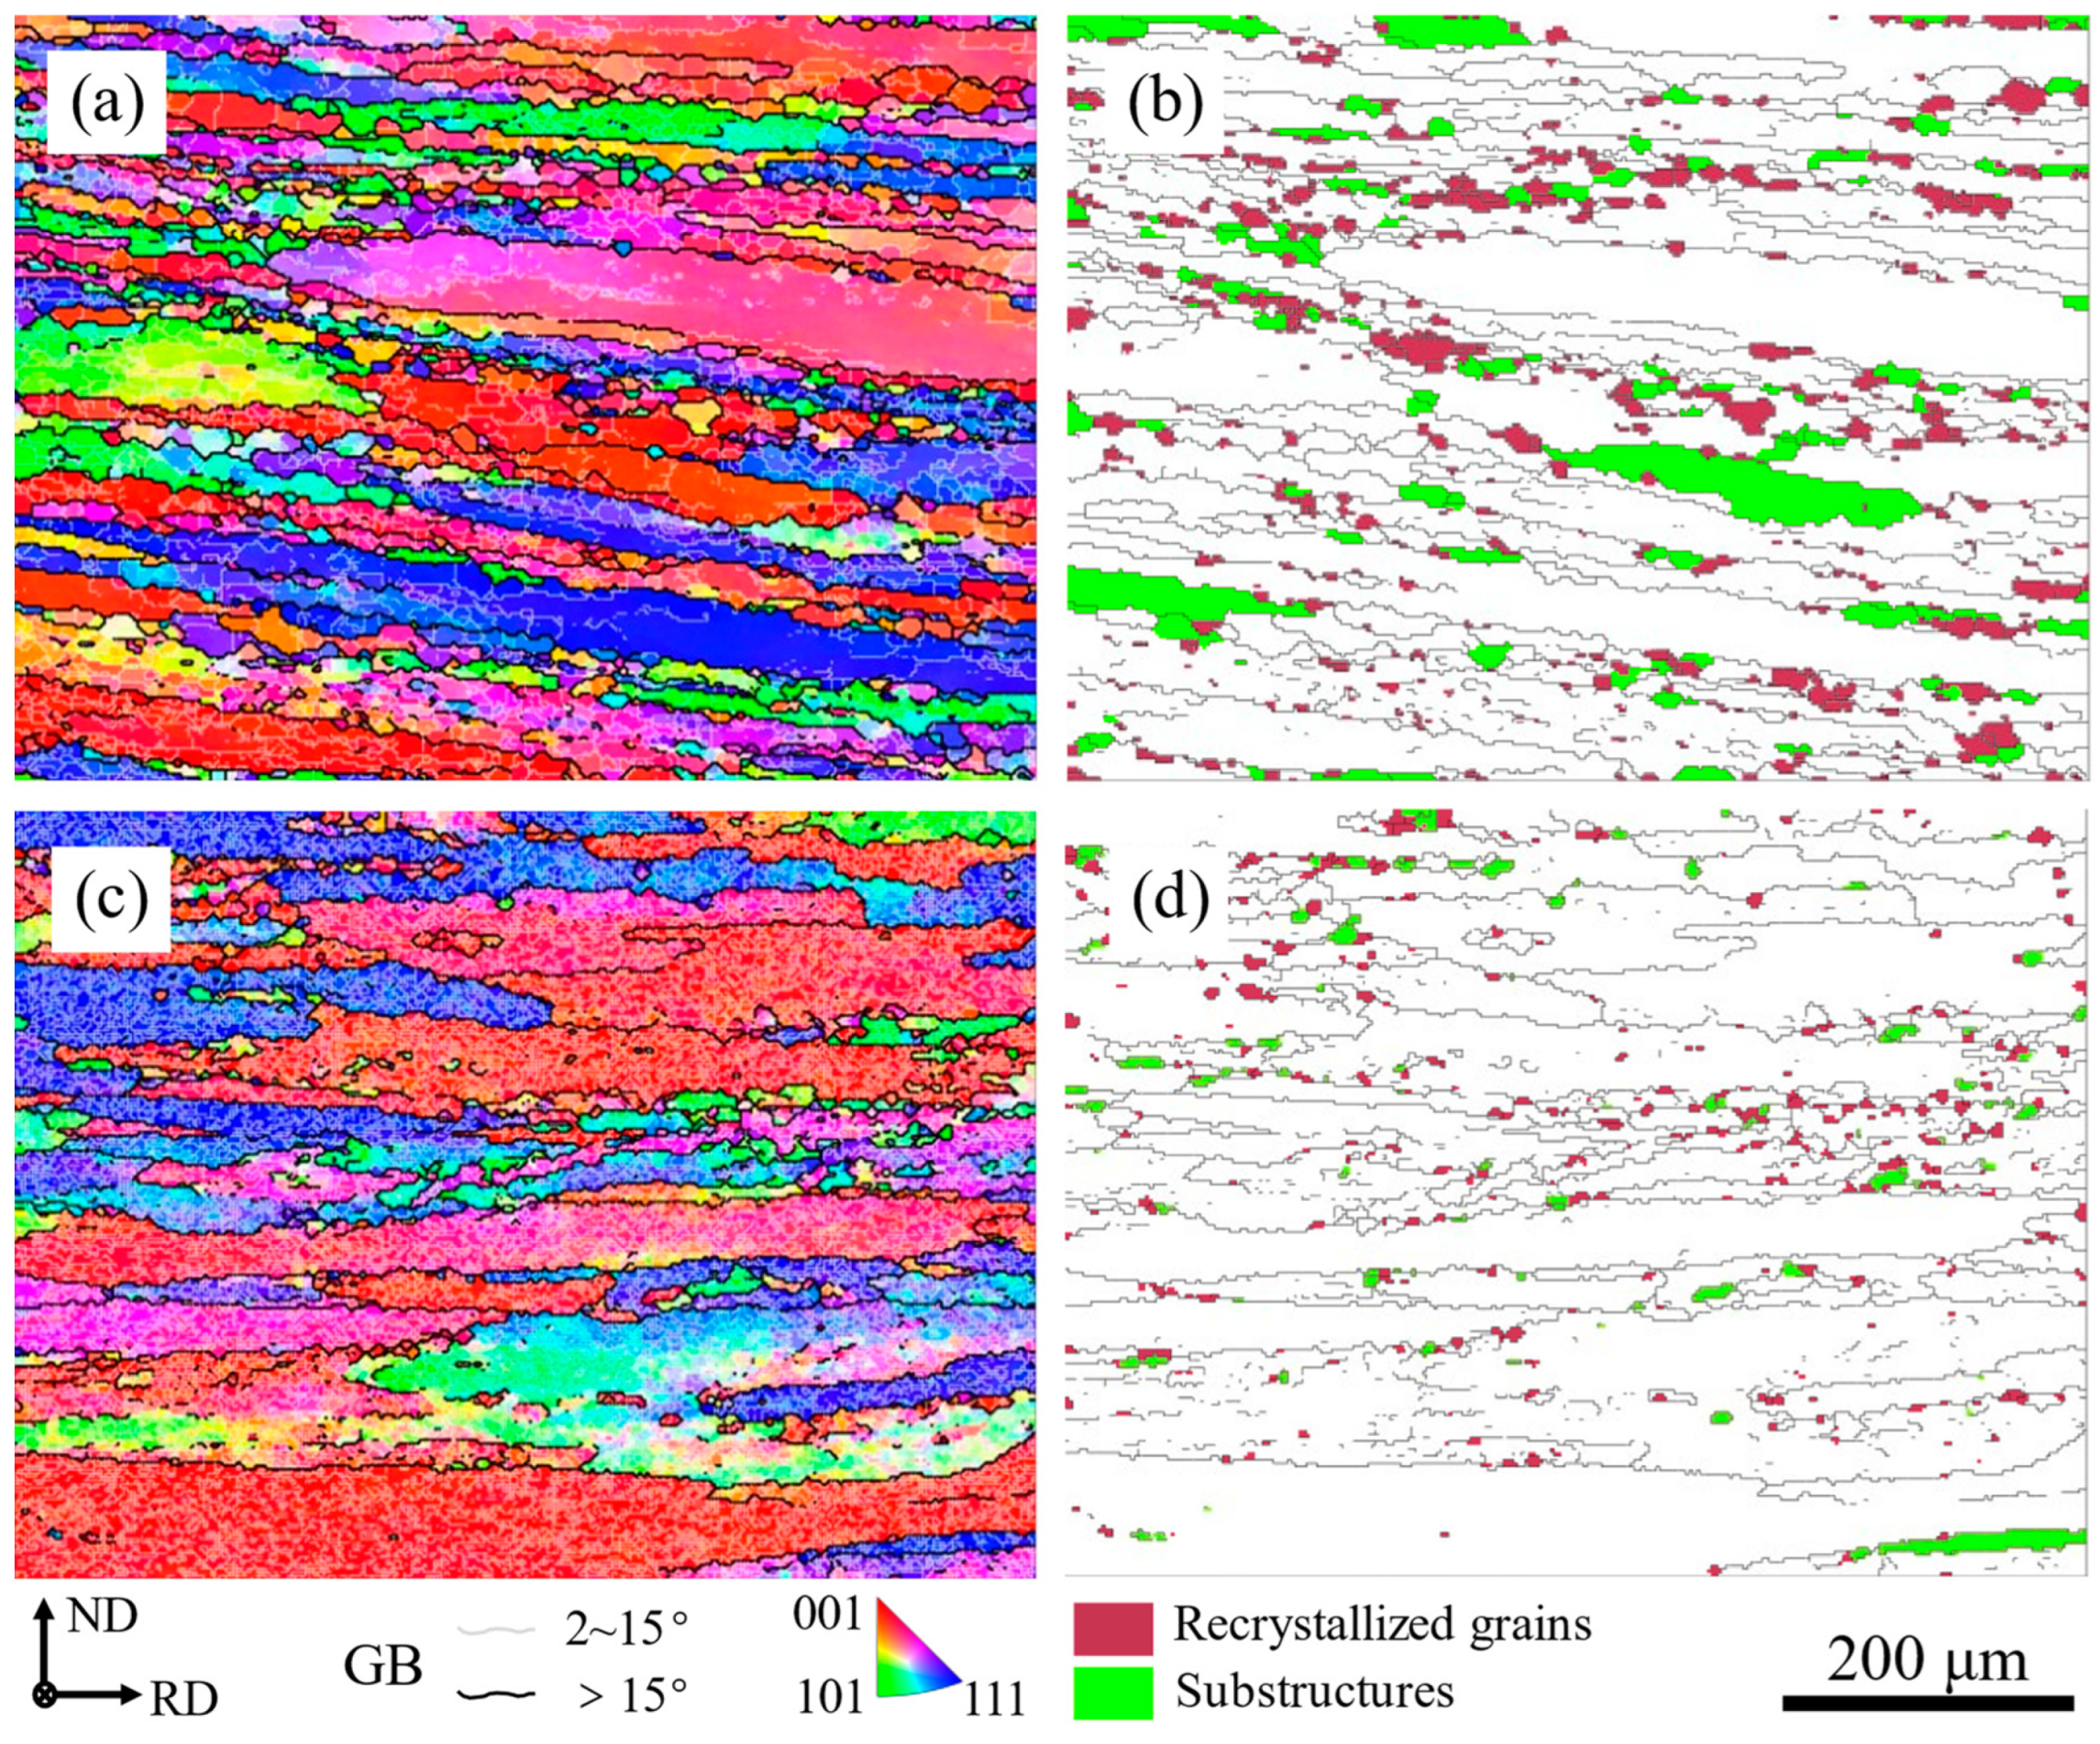
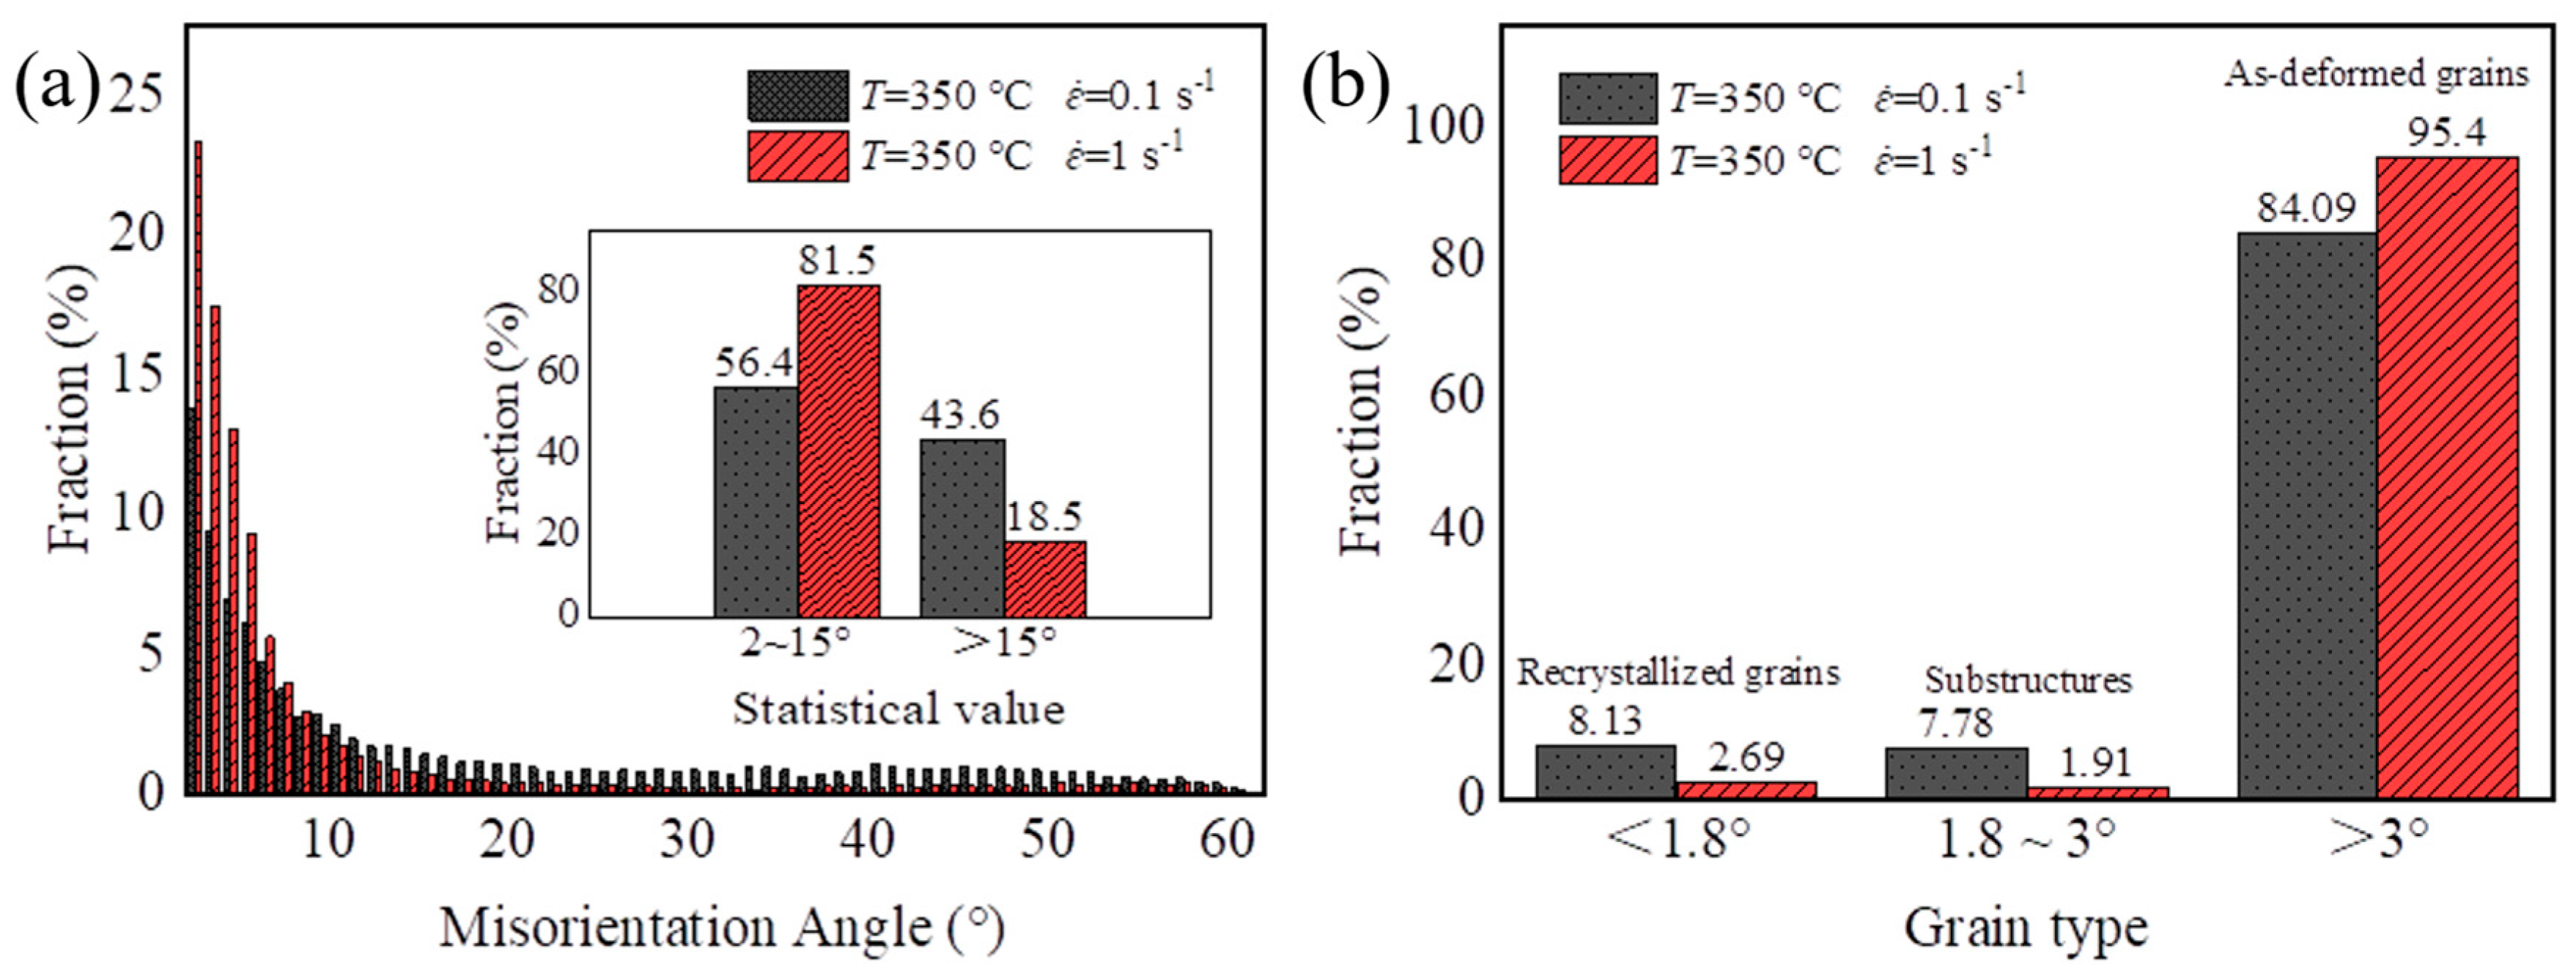
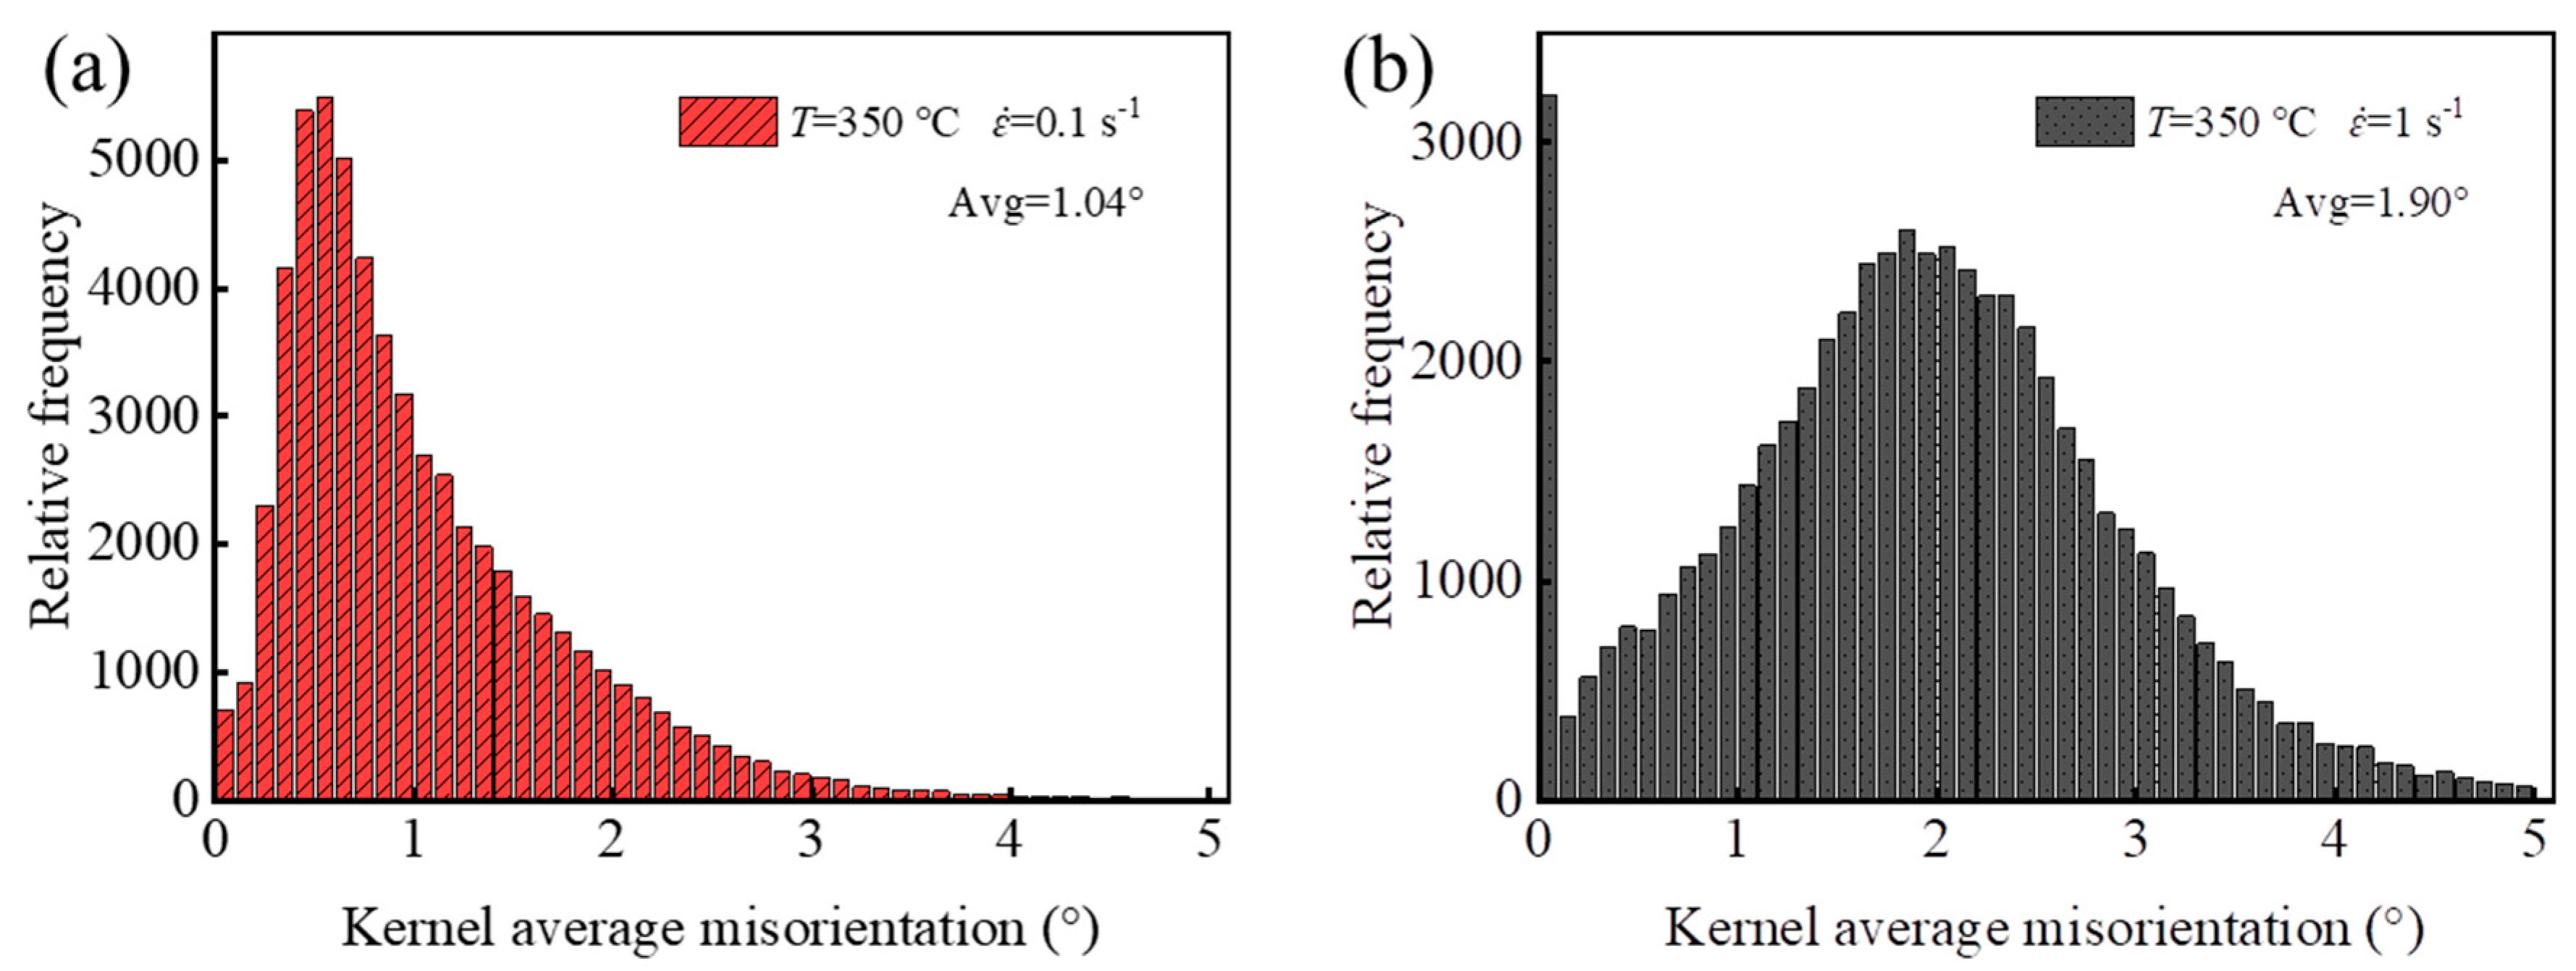
3.4. Effect of Processing Parameters on Grain Structure

In the high-temperature deformation of Al alloys, two mechanisms drive organizational changes: work hardening and dynamic softening, the latter encompassing both DRV and DRX mechanisms [22,23]. In particular, the DRX mechanism plays a crucial role in facilitating the formation of new grains and grain refinement, optimizing organizational properties. As a result of the evolution of dislocation accumulation and depletion during the thermal deformation process, the material organization exhibits characteristics such as recrystallized grains, substructures, and as-deformed grains under the influence of both DRV and DRX mechanisms. During thermal deformation, dislocation density increases and intertwines to form dislocation walls, which further develop into subgranular boundaries, which is a process known as the DRV mechanism. Subsequently, as the energy storage of dislocations reaches the critical value for recrystallization, subgranular boundaries continue to absorb dislocation energy, gradually transforming into high angular boundaries, leading to the occurrence of DRX mechanism. DRX grains are classified into two types. Discontinuous dynamic recrystallization (DDRX) grains are obtained through the nucleation and growth of as-deformed grains, typically exhibiting a chain-like distribution at grain boundaries. CDRX grains are obtained through changes in substructure grain boundary orientation due to DRV, forming low-angle substructures in the interior of as-deformed grains. The substructures continue to absorb dislocation density, causing low-angle grain boundaries to rotate into high-angle grain boundaries, which are usually distributed in the interior of as-deformed grains or near grain boundaries.
To verify organizational evolution characteristics under different temperatures and deformation conditions, EBSD analysis was performed on the samples after 60% thermal deformation. The inverse pole figures map (IPF map), grain boundary map (GB map) and grain orientation spread map (GOS map) were extracted for analyzing the grain orientation change and recrystallization of the samples after thermal deformation, and the regional statistics were carried out, as shown in Figure 8, Figure 9, Figure 10 and Figure 11 In the GB map, low-angle grain boundaries (LAGBs) are defined as 2~15°, indicated by gray lines, and high-angle grain boundaries (HAGBs) as >15°, indicated by black lines. In the GOS map, recrystallized grains are defined as <1.8°, marked by red, and substructures are defined as 1.8~3°, marked by green [8,24].
Figure 8 illustrates EBSD analysis plots showcasing the organizational characteristics of samples subjected to a strain rate ɛ̇ = 0.1 s−1 at deformation temperatures of 300 °C and 450 °C. In the thermally deformed samples at varying temperatures, initial coarse grains were retained, which are elongated along the direction perpendicular to the compression direction of the samples. Within the as-deformed grains, a substantial number of LAGBs were observed. Some as-deformed grains contained fine grains with smaller orientation differences from the surrounding grains, primarily formed by substructures absorbing dislocations, driving the rotation of small-angle grain boundaries into large-angle grain boundaries, which are identified as CDRX grains. Additionally, a small number of fine grains with chain-like distribution formed at the grain boundaries of some as-deformed grains, indicating DDRX grains formed by nucleation and migration at the grain boundaries due to dislocation energy storage differences.
Figure 9 reveals that with an increase in deformation temperature from 300 to 450 °C, the percentage of recrystallized grains rises from 4.46% to 11.66%, and substructures increase from 2.71% to 5.85%. Simultaneously, the percentage of HAGBs increases from 21.50% to 38.70%, and the percentage of LAGBs decreases from 78.50% to 61.30%. The higher deformation temperature enhances the activity of alloy atoms, providing energy for dislocation motion, grain boundary diffusion, and migration. This promotes the formation of more substructures, strengthening the DRV mechanism. Additionally, the increase in temperature provides more energy for the transformation of substructures to recrystallized grains, which is manifested as the transformation of LAGBs to transformed HAGBs and the formation of new grains. This aligns with the model of the CDRX mechanism proposed by Gourdet, where the DRV mechanism is considered a stage of the CDRX mechanism, and more extensive DRV promotes the formation of CDRX grains [25].
Figure 10 depicts EBSD analysis plots showcasing the organizational characteristics of samples at a deformation temperature T = 350 °C and strain rates of 0.1 and 1 s−1. Similar to the findings discussed earlier, the presence of primitive coarse grains elongated along the rolling direction (RD) and a large number of LAGBs inside the samples at different strain rates indicate an intense DRV mechanism process. Additionally, gradual color changes within the as-deformed grains and fine crystals distributed in chains at the grain boundaries in the IPF plots suggest the coexistence of both CDRX and DDRX mechanisms.
As illustrated in Figure 11, an increase in strain rate from 0.1 to 1 s−1 results in a decrease in the percentage of recrystallized grains from 8.13% to 2.69%, and substructures decrease from 7.78% to 1.91%. Correspondingly, the percentage of HAGBs decreases from 43.60% to 18.50%, while LAGBs increase from 56.40% to 81.50%. This suggests that at the deformation temperature of T = 350 °C, a lower strain rate allows for a more adequate consumption of dislocations, promoting the DRV mechanism and obtaining more substructures. Meanwhile, prolonging the time of thermal deformation will promote the rotation of the LAGBs of the grains to the HAGBs, resulting in a more adequate DRX and more recrystallized grains. However, similar to other 7 XXX aluminum alloys with higher Zr content, the Zr element can also make the DRX inadequate [26,27,28]. In addition, a larger strain rate will result in the dislocations that appeared during thermal deformation not being able to return in time, leading to insufficient DRV and DRX, accumulating a significant amount of deformation storage energy and dislocation accumulation.
As shown in Figure 12 and Figure 13, the corresponding average value of kernel average misorientation (KAM) in the two deformation parameter samples increases from 1.04° to 1.90° when the strain rate increases from 0.1 to 1 s−1. Geometrically necessary dislocations (GNDs) can be calculated from KAMAvg, and the relationship can be expressed by the following equation [29]:
ρ GND = 2 KAM Ave μ b
where μ is the step size for the EBSD test acquisition and b is the Burgers vector. It can be noticed that the ρGND value is positively correlated with KAMAve; i.e., when the strain rate ɛ̇ = 1 s−1, a greater dislocation density will occur and will be located mainly in the interior of as-deformed grains.

4. Conclusions

In this study, isothermal hot compression tests were conducted on Al-7.92 Zn-1.64 Mg-2.00 Cu alloy under varied deformation conditions. The stress–strain of hot flow behavior data served as the basis for establishing an Arrhenius-type constitutive equation and creating processing maps to investigate the organizational evolution under different hot deformation process conditions. The main findings are summarized as follows:
(1) The stress of hot flow behavior increases with rising deformation temperature and strain rate. Medium to high temperatures and lower rates of deformation parameters are conducive to reducing the deformation resistance to rolling loads. The established constitutive model for peak stress follows:
ε ˙ = 1.014 × 10 10 sinh 0.014871 σ 4.37474 exp 140303 R T
(2) The thermal processing map for an Al-7.92 Zn-1.64 Mg-2.00 Cu alloy has been established, and a stable and efficient range of process parameters has been obtained. The energy dissipation rate reaches up to 0.37 at deformation temperatures T = 380~450 °C and strain rates of ɛ̇ < 0.1 s−1. It is shown that the material is most suitable for thermal deformation processing at medium–high temperatures and lower strain rates.
(3) The impact of deformation temperature and strain rate on microstructure was investigated. The percentage of recrystallized grains and substructures was significantly enhanced at ɛ̇ = 0.1 s−1 and T = 450 °C, by 7.20% and 3.14%, respectively, as compared to T = 300 °C. The DRV and DRX mechanisms during thermal deformation were enhanced simultaneously. At a temperature of 350 °C and ɛ̇ = 0.1 s−1, the percentage of recrystallized grains and substructures is higher compared to that at ɛ̇ = 1 s−1, with increases of 5.44% and 5.87%, respectively, indicating that the release of dislocation accumulation due to deformation storage energy will be more favored at low strain rates, which promotes the enhancement of the DRX mechanism.

Author Contributions

C.L.: Investigation, Methodology, Writing, original draft. C.C.: Data curation. K.H.: Formal analysis, Data curation. S.H.: Methodology, Resource, Funding acquisition. Y.Y.: Investigation, Resource, Funding acquisition. All authors have read and agreed to the published version of the manuscript.

Funding

This work was supported by the Major Projects of Scientific and Technology Innovation of Hunan Province (Grant No. 2021GK1040).

Data Availability Statement

The original contributions presented in the study are included in the article, further inquiries can be directed to the corresponding authors.

Acknowledgments

The authors would like to acknowledge AVIC Xi’an Aircraft Industry Group Company Ltd. for its support.

Conflicts of Interest

Author Chen Li has received research grants from the First Aircraft of Institute of AVIC. The funder was not involved in the study design, collection, analysis, interpretation of data, the writing of this article or the decision to submit it for publication. The remaining authors declare that the research was conducted in the absence of any commercial or financial relationships that could be construed as a potential conflict of interest.

References

  1. Wang, H.; Jia, L.; Wang, W.; Ye, C.; Li, C.; Zhang, X.; Zhang, H. Effect of the Initial Texture, Recrystallization and Re-Dissolution Process on the Evolution of Texture during Solution Treatment of the 7A65 Hot Rolled Plate. Metals 2022, 12, 8. [Google Scholar] [CrossRef]
  2. Fan, X.; Li, Y.; Xu, C.; Wang, B.; Peng, R.; Chen, J. Improved mechanical anisotropy and texture optimization of a 3xx aluminum alloy by differential temperature rolling. Mater. Sci. Eng. A-Struct. Mater. Prop. Microstruct. Process. 2021, 799, 140278. [Google Scholar] [CrossRef]
  3. Czerwinski, F. Thermal Stability of Aluminum Alloys. Materials 2020, 13, 3441. [Google Scholar] [CrossRef]
  4. Qiu, L.L.; Gao, W.L.; Lu, Z.; Feng, Z.H. Flow Behavior and Microstructure of 7A85 Aluminum Alloy During Hot Compression. J. Mater. Eng. 2016, 44, 33–39. [Google Scholar]
  5. Sha, G.; Cerezo, A. Early-stage precipitation in Al–Zn–Mg–Cu alloy (7050). Acta Mater. 2004, 52, 4503–4516. [Google Scholar] [CrossRef]
  6. Hu, H.E.; Zhen, L.; Yang, L.; Shao, W.Z.; Zhang, B.Y. Deformation behavior and microstructure evolution of 7050 aluminum alloy during high temperature deformation. Mater. Sci. Eng. A 2008, 488, 64–71. [Google Scholar] [CrossRef]
  7. Raja, N.; Kumar, A.; Patel, S.K. Hot deformation and microstructural evolution of ultrasonically fabricated as-cast Al-7.3Zn-2.2Mg-2Cu alloy. Mater. Charact. 2023, 206, 113404. [Google Scholar] [CrossRef]
  8. Ling, K.; Mo, W.; Deng, P.; Chen, J.; Luo, B.; Bai, Z. Hot deformation behavior and dynamic softening mechanisms of hot-extruded Al-Cu-Mg-Ag-Mn-Zr-Ti alloy. Mater. Today Commun. 2023, 34, 105300. [Google Scholar] [CrossRef]
  9. Xiang, S.; Liu, D.-Y.; Zhu, R.-H.; Li, J.-F.; Chen, Y.-L.; Zhang, X.-H. Hot deformation behavior and microstructure evolution of 1460 Al–Li alloy. Trans. Nonferrous Met. Soc. China 2015, 25, 3855–3864. [Google Scholar] [CrossRef]
  10. Duan, Y.H. Hot Deformation and Processing Map of Pb-Mg-10Al-1B Alloy. J. Mater. Eng. Perform. 2013, 22, 3049–3054. [Google Scholar] [CrossRef]
  11. Wang, Y.; Zhao, G.; Xu, X.; Chen, X.; Zhang, C. Constitutive modeling, processing map establishment and microstructure analysis of spray deposited Al-Cu-Li alloy 2195. J. Alloys Compd. 2019, 779, 735–751. [Google Scholar] [CrossRef]
  12. Rajamuthamilselvan, M.; Ramanathan, S. Hot deformation behaviour of 7075 alloy. J. Alloys Compd. 2011, 509, 948–952. [Google Scholar] [CrossRef]
  13. Wang, W.; Pan, Q.; Sun, Y.; Wang, X.; Li, A.; Song, W. Study on hot compressive deformation behaviors and corresponding industrial extrusion of as-homogenized Al–7.82Zn–1.96Mg–2.35Cu–0.11Zr alloy. J. Mater. Sci. 2018, 53, 11728–11748. [Google Scholar] [CrossRef]
  14. Jin, N.; Zhang, H.; Han, Y.; Wu, W.; Chen, J. Hot deformation behavior of 7150 aluminum alloy during compression at elevated temperature. Mater. Charact. 2009, 60, 530–536. [Google Scholar] [CrossRef]
  15. Sun, Z.-C.; Zheng, L.-S.; Yang, H. Softening mechanism and microstructure evolution of as-extruded 7075 aluminum alloy during hot deformation. Mater. Charact. 2014, 90, 71–80. [Google Scholar] [CrossRef]
  16. Wen, D.-X.; Lin, Y.C.; Li, H.-B.; Chen, X.-M.; Deng, J.; Li, L.-T. Hot deformation behavior and processing map of a typical Ni-based superalloy. Mater. Sci. Eng. A 2014, 591, 183–192. [Google Scholar] [CrossRef]
  17. Suh, D.-W.; Lee, S.-Y.; Lee, K.-H.; Lim, S.-K.; Oh, K.H. Microstructural evolution of Al–Zn–Mg–Cu–(Sc) alloy during hot extrusion and heat treatments. J. Mater. Process. Technol. 2004, 155–156, 1330–1336. [Google Scholar] [CrossRef]
  18. Tang, J.; Yi, Y.; He, H.; Huang, S.; Zhang, J.; Dong, F. Hot deformation behavior and microstructural evolution of the Al-Cu-Li alloy: A study with processing map. J. Alloys Compd. 2023, 934, 167755. [Google Scholar] [CrossRef]
  19. Prasad, Y.V.R.K.; Rao, K.P.; Sasidhara, S. Hot Working Guide: Compendium of Processing Maps; ASM international: Detroit, MI, USA, 2015. [Google Scholar]
  20. Ke, B.; Ye, L.; Tang, J.; Zhang, Y.; Liu, S.; Lin, H.; Dong, Y.; Liu, X. Hot deformation behavior and 3D processing maps of AA7020 aluminum alloy. J. Alloys Compd. 2020, 845, 156113. [Google Scholar] [CrossRef]
  21. Prasad, Y.V.R.K.; Seshacharyulu, T. Modelling of hot deformation for microstructural control. Metall. Rev. 1998, 43, 243–258. [Google Scholar] [CrossRef]
  22. He, H.; Yi, Y.; Cui, J.; Huang, S. Hot deformation characteristics and processing parameter optimization of 2219 Al alloy using constitutive equation and processing map. Vacuum 2019, 160, 293–302. [Google Scholar] [CrossRef]
  23. Liu, L.; Zhao, G.; Wang, G.; Ma, X.; Yan, Z.; Cao, S. Hot deformation behavior and microstructure evolution model of 7055 aluminum alloy. J. Mater. Res. Technol. 2023, 27, 3191–3213. [Google Scholar] [CrossRef]
  24. Jiang, J.-F.; Wang, Y.; Liu, Y.-Z.; Xiao, G.-F.; Li, H. Microstructure and mechanical properties of 7005 aluminum alloy processed by one-pass equal channel reciprocating extrusion. Trans. Nonferrous Met. Soc. China 2021, 31, 609–625. [Google Scholar] [CrossRef]
  25. Gourdet, S.; Montheillet, F. A model of continuous dynamic recrystallization. Acta Mater. 2003, 51, 2685–2699. [Google Scholar] [CrossRef]
  26. Shi, C.; Chen, X.G. Effect of Zr addition on hot deformation behavior and microstructural evolution of AA7150 aluminum alloy. Mater. Sci. Eng. A 2014, 596, 183–193. [Google Scholar] [CrossRef]
  27. Huang, J.; Xiang, Z.; Tang, Y.; Li, J.; Shen, G.; Shi, G.; Ma, X.; Chen, Y.; Chen, Z. Interfacial precipitation of the in-situ TiB2-reinforced Al–Zn–Mg–Cu–Zr composite. Mater. Chem. Phys. 2023, 301, 127561. [Google Scholar] [CrossRef]
  28. Ghosh, A.; Elasheri, A.; Parson, N.; Chen, X.G. Microstructure and texture evolution during high-temperature compression of Al-Mg-Si-Zr-Mn alloy. Mater. Charact. 2023, 205, 113312. [Google Scholar] [CrossRef]
  29. Zhu, C.; Harrington, T.; Livescu, V.; Gray, G.T.; Vecchio, K.S. Determination of geometrically necessary dislocations in large shear strain localization in aluminum. Acta Mater. 2016, 118, 383–394. [Google Scholar] [CrossRef]
Figure 1. Initial microstructure of the l Al-7.92 Zn-1.64 Mg-2.00 Cu alloy. (a) grain structure; (b) inverse pole figure map.
Metals 14 00176 g001
Figure 2. Schematic diagram of hot compression experiment process.
Metals 14 00176 g002
Figure 3. True strain–true stress curves of Al-7.92 Zn-1.64 Mg-2.00 Cu alloy deformed at various temperatures with strain rates of (a) ɛ̇ = 0.001 s−1, (b) ɛ̇ = 0.01 s−1, (c) ɛ̇ = 0.1 s−1, and (d) ɛ̇ = 1 s−1.
Metals 14 00176 g003
Figure 4. True strain–true stress curves of Al-7.92 Zn-1.64 Mg-2.00 Cu alloy deformed at various strain rates with temperatures of (a) T = 250 °C, (b) T = 300 °C, (c) T = 350 °C, (d) T = 400 °C, and (e) T = 450 °C.
Metals 14 00176 g004
Figure 5. Linear relationship fitting. (a) ln (ɛ̇) − ln (σ), (b) ln (ɛ̇) − σ, (c) ln (ɛ̇) − ln [sinh (ασ)], and (d) ln [sinh (ασ)] − 1/T.
Metals 14 00176 g005
Figure 6. (a) Linear relationship between ln [sinh (ασ)] and the Z−parameter, ln Z; (b) correlation between experimental and predicted flow stress.
Metals 14 00176 g006
Figure 7. Hot processing map of the Al-7.92 Zn-1.64 Mg-2.00 Cu alloy.
Metals 14 00176 g007
Figure 8. EBSD images for typical microstructures of Al-7.92 Zn-1.64 Mg-2.00 Cu alloy deformed at strain rates ɛ̇ = 0.1 s−1 with temperatures of (a,b) T = 300 °C, (c,d) T = 450 °C.
Metals 14 00176 g008
Figure 9. Corresponding statistics of Figure 8: (a) misorientation angle distribution after deformation, (b) area fractions of recrystallized grains, substructures and as-deformed grains.
Metals 14 00176 g009
Figure 10. EBSD images for typical microstructures of Al-7.92 Zn-1.64 Mg-2.00 Cu alloy deformed at temperatures 350 °C with strain rates of (a,b) ɛ̇ = 0.1 s−1, (c,d) ɛ̇ = 1 s−1.
Metals 14 00176 g010
Figure 11. Corresponding statistics of Figure 10: (a) misorientation angle distribution after deformation, (b) area fractions of recrystallized grains, substructures and as-deformed grains.
Metals 14 00176 g011
Figure 12. Distribution of kernel average misorientation of Al-7.92 Zn-1.64 Mg-2.00 Cu alloy deformed at temperatures 350 °C with strain rates of (a) ɛ̇ = 0.1 s−1, (b) ɛ̇ = 1 s−1.
Metals 14 00176 g012
Figure 13. Corresponding statistics for distribution of kernel average in Figure 12: (a) ɛ̇ = 0.1 s−1, (b) ɛ̇ = 1 s−1.
Metals 14 00176 g013
Table 1. Chemical composition of Al-7.92 Zn-1.64 Mg-2.00 Cu alloy.
ElementsSiFeCuMnMgCrZnTiZrAl
Wt.%0.030.0520.011.640.017.940.030.11Bal.
Disclaimer/Publisher’s Note: The statements, opinions and data contained in all publications are solely those of the individual author(s) and contributor(s) and not of MDPI and/or the editor(s). MDPI and/or the editor(s) disclaim responsibility for any injury to people or property resulting from any ideas, methods, instructions or products referred to in the content.

