Article

A Quantitative and Optimization Model for Microstructure Uniformity of Sinter Based on Multiple Regression-NSGA2

1
College of Mining Engineering, North China University of Science and Technology, Tangshan 063210, China
2
Collaborative Innovation Center of Green Development and Ecological Restoration of Mineral Resources of Hebei Province, Tangshan 063210, China
3
Beijing Key Laboratory of Process Automation in Mining & Metallurgy, Beijing 102600, China
4
State Key Laboratory of Process Automation in Mining & Metallurgy, Beijing 102600, China
5
Jiangsu Geotechnical Engineering Company of China Chemical Geology, Jiangsu Geological Exploration Institute of China Chemical Geology and Mine Bureau, Xuzhou 221003, China
*
Authors to whom correspondence should be addressed.
Metals 2024, 14(2), 169; https://doi.org/10.3390/met14020169
Submission received: 8 December 2023 / Revised: 24 January 2024 / Accepted: 25 January 2024 / Published: 29 January 2024
(This article belongs to the Special Issue Computer Methods in Metallic Materials (Volume II))

Abstract

:
The degree of homogeneity of the sintered ore phase structure directly determines its quality index. A sinter ore quality evaluation method based on the quantification of the homogeneity of the mineral phase structure is proposed. First, the magnetite particle size characteristics in the ore phase structures with different degrees of homogeneity were summarized under a polarized light microscope, and a criterion for evaluating the uniformity of the sintered ore phase structure based on the magnetite content of different particle size grades was determined. Second, a multiple regression model was established for the raw material composition ratio of magnetite with varying particle size grades. Finally, the multiple regression model was optimized using the second-generation non-dominated sorting genetic algorithm (NSGA2). The results show that mineral phase structure analysis categorized the magnetite particle sizes into <30 μm, 30~60 μm, and >60 μm. The adjusted R2 of the multiple regression model of the chemical composition of raw materials and the proportion of magnetite of each particle size grade were all greater than 0.95, and the p values were all <0.05, indicating a high degree of model fitting. Using model analysis, the single factor and the interaction between the multiple factors that significantly influence the proportion of magnetite in the three particle size grades were determined. The multivariate regression model was optimized using the NSGA2 algorithm to determine the ratios of Al2O3 mass% = 1.82, MgO mass% = 1.50, and R(CaO mass%/SiO2 mass%) = 1.84 for the highest degree of uniformity of the sintered ores. Under this sintering condition, the micro-mineral phase structure became more homogeneous, confirming the model’s reliability.

1. Introduction

Sinter is a process of using low-grade iron ore to create high-quality manufactured iron ore, which is widely used in blast furnace ironmaking, and its quality directly determines the cost and efficiency of blast furnace production [1,2,3,4]. Its quality is closely related to microscopic mineral composition and mineral phase structure characteristics [5,6,7]. Therefore, it is of practical significance to analyze the mineral composition and internal structure of sinter to improve its quality.
Many researchers have studied sintered ores in terms of their micro-mineral compositions and mineral phase structural characteristics. Honeyands et al. [8] quantitatively analyzed the change in the content of the main mineral phases in sintered ores with basicity, and the results show that low basicity sintered ores are dominated by cemented magnetite and glassy phases; with an increase in basicity, the hematite phase and the calcium ferrite phase increase. Moreover, high-basicity sintered ores are dominated by the calcium ferrite phase, which leads to elevating the yield and quality of the ore. Xin et al. [9] found that an increase in basicity and Al2O3 is detrimental to the formation of glassy phases in sintered ores. Wu et al. [10] investigated the effect of Mg2+ on the properties of single minerals in sintered ores. The results showed that the solid solution of Mg2+ in single minerals was in the order of magnetite, silico-ferrite of calcium and aluminum (SFCA), silicate, and hematite, and the solid solution of Mg2+ prevented the oxidation of magnetite to hematite, the coarsening of the grains of SFCA, and an increase in the content of silicate. The mineral species, content, and morphological pairs of sintered ores are closely related to the structural characteristics of the mineral phases [11]. Cheng et al. [12] classified the sintered ore phase into four mineral phase structures based on the microscopic mineral composition and mineral morphology and analyzed the causes of the different mineral phase structures and their effects on the mechanical strength of sintered ores. The results showed that the power of the sintered ores depended on the mineral phase structures present in the microscope and the distribution of these microscopic structures. Liu [13] et al. found that the addition of B2O3 to a mixture of vanadium–titanium magnetite and hematite ore powders resulted in an increase in the bonding phase, finer metal phase particles, and higher uniformity of mineral distribution, accompanied by improved metallurgical property indices such as the low-temperature reduction differentiation index and mechanical strength. Han et al. [14] improved the sintering basis properties of refractory and ultrafine-grained iron ore powders through pre-balling, which resulted in increased homogeneity of the mineral phase structure and closer bonding between the minerals compared to the sintered mineral phase structure without pre-balling.
In the past, scholars mainly judged the homogeneity of the sintered ore phase by analyzing the mineral content and the bonding morphology between the minerals. Still, there needs to be more reports on the quantitative analysis of the homogeneity of the ore phase. Therefore, this paper aims to propose a quantitative method for the structural homogeneity of the ore phase in the following process: first, using systematic mineral identification, mineral phase structure analysis, and the statistics of mineral content and the magnetite particle size of the sintered ore samples, the overall mineral content characteristics of the sintered samples as well as the magnetite particle size characteristics of the mineral phase structure were analyzed with different degrees of homogeneity. Based on the mineral phase analysis results, the magnetite particle size was graded, and a standard was established to evaluate the uniformity of the sintered ore phase structure in terms of the magnetite content of different particle size grades. Second, a multiple regression model was developed to investigate the effects of single factors of R(CaO mass%/SiO2 mass%), MgO mass%, Al2O3 mass%, and the interactions among the factors on the percentage of magnetite content of each particle size grade. Finally, the multiple regression model was optimized by establishing the NSGA2 model to obtain the R(CaO mass%/SiO2 mass%), MgO mass%, and Al2O3 mass% ratios of the sintered ores with the highest degree of homogeneity, which provides a theoretical basis for the allocation of sintered ores.

2. Materials and Methods

2.1. Sintered Sample Preparation

R(CaO mass%/SiO2 mass%), MgO mass%, and Al2O3 mass% were the three kinds of composition indicators selected as the examination factors. With reference to actual iron ore sintering as well as the R(CaO mass%/SiO2 mass%), MgO mass%, and Al2O3 mass% used in a large number of previous studies [15,16,17], the ranges of these parameters for this study were established. The experimental program was designed according to the rules of the uniform design method. The factor levels for the uniform design experiment are shown in Table 1.
The chemical reagents Fe2O3, CaO, SiO2, MgO, and Al2O3 (produced by the China National Pharmaceutical Group) used in uniform powder form were analytically pure, dried in a drying oven at 120 °C for 2 h, and sieved through a 200 mesh screen after cooling. The samples were placed into 10 mm × (10 ± 1) mm containers, and the obtained cake-like samples were loaded into a 50 mL corundum crucible and put into a controlled temperature box muffle furnace for micro-sintering at a rate of 10 °C/min to increase the temperature from room temperature to 1400 °C. A constant temperature was maintained for 30 min to ensure that the samples were fully reacted, and then cooled down to room temperature in a furnace at 20 °C/min to obtain the sintered ore samples. The samples were obtained by cooling the stove to room temperature at 20 °C/min. The obtained sintered ore samples were cut and polished to prepare optical thin sections. To reduce the error, three or more samples were prepared for each sinter, and the average magnetite particle size and content were determined from the average value of the measured data of the samples; the difference between the measured data was no greater than 3%.

2.2. Methods

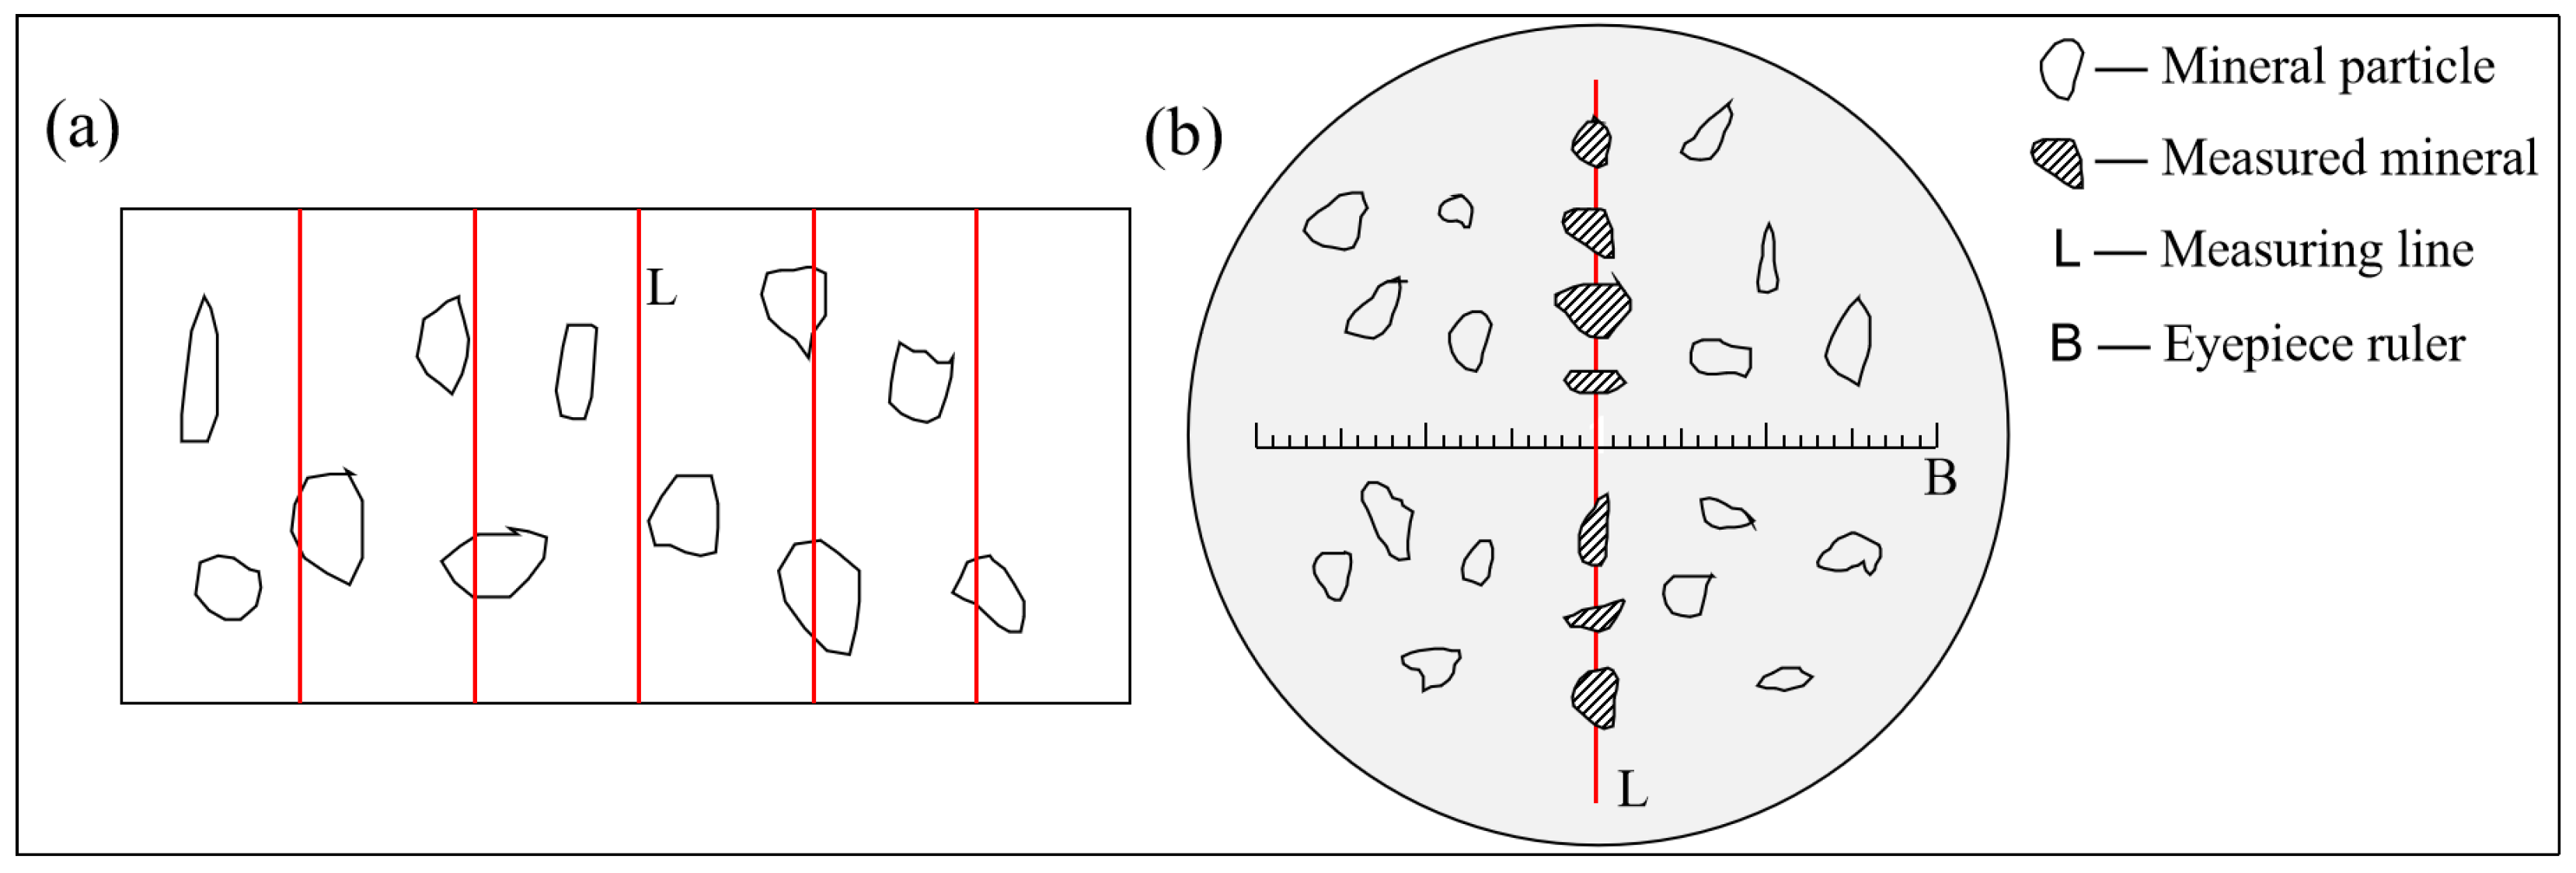
2.2.1. Mineralogical Analysis Methods

Mineralogical analysis is an important tool for the microscopic study of minerals [18,19]. In this experiment, a Zeiss Research Scope-A1 (ZEISS, Oberkochen, Germany) polarizing microscope was used to identify the minerals systematically, analyze the structure of the mineral phases, and statistically analyze the mineral content and the magnetite particle size of the eight experimentally prepared samples with different raw material compositions. The overall mineral content of the sample and the characteristics of magnetite particle size in the mineral phase structure were analyzed with varying degrees of homogeneity, the magnetite particle size grades were classified according to the mineral phase analysis, and a standard for quantifying the uniformity of the sintered ore phase structure was established based on the magnetite content of each particle size grade.
Line measurement is a common method for counting the mineral content and particle size under a microscope. The measurement method is as follows: first, the eyepiece micrometer scale value (W) is calibrated. In this experiment, the microscope magnification was fixed at 200, and the W value in the eyepiece micrometer was 5 μm. Second, five measurement routes are determined to evenly distribute the optical thin sections as shown in Figure 1a; the measurement starts from the first view at the upper end of the first measurement route on the left and continues to the last view at the bottom of the measurement route on the right. Finally, the eyepiece microscale is adjusted to horizontally, and the line perpendicular to the eyepiece microscale in the center of the visual field is selected as the reference line. From the first visual field, the number of scales of the eyepiece microscale occupied by the maximum horizontal intercept of all mineral particles on the reference line is calculated and recorded, as shown in Figure 1b, until the last visual field of the measurement route. The total number of scales accounted for by each mineral recorded divided by the total number of scales accounted for by the measured mineral is the content of each mineral, and the number of scales accounted for by each magnetite particle is multiplied by W.

2.2.2. Multiple Regression Method

Linear regression is a standard method to study the quantitative relationship between the independent variable and the dependent variable, which is called multiple linear regression when there is more than one independent variable, and is widely used in data analysis in a variety of scenarios [20,21,22]. Its general expression is as follows:
Y = β 0 + β 1 X 1 + β 2 X 2 + + β n X n + ε
In Equation (1), Y is the independent variable, X is the dependent variable, β is the model parameter, and ε is the error term. To investigate the impact of interactions between independent variables and the non-linear relationship between independent and dependent variables, we introduce cross and quadratic terms when fitting multiple regression models. The general expression is as follows:
Y = β 0 + i = 1 n β i X i + i = 1 j 1 j = 1 n β i j X i X j + i = 1 n β i i x i 2 + ε

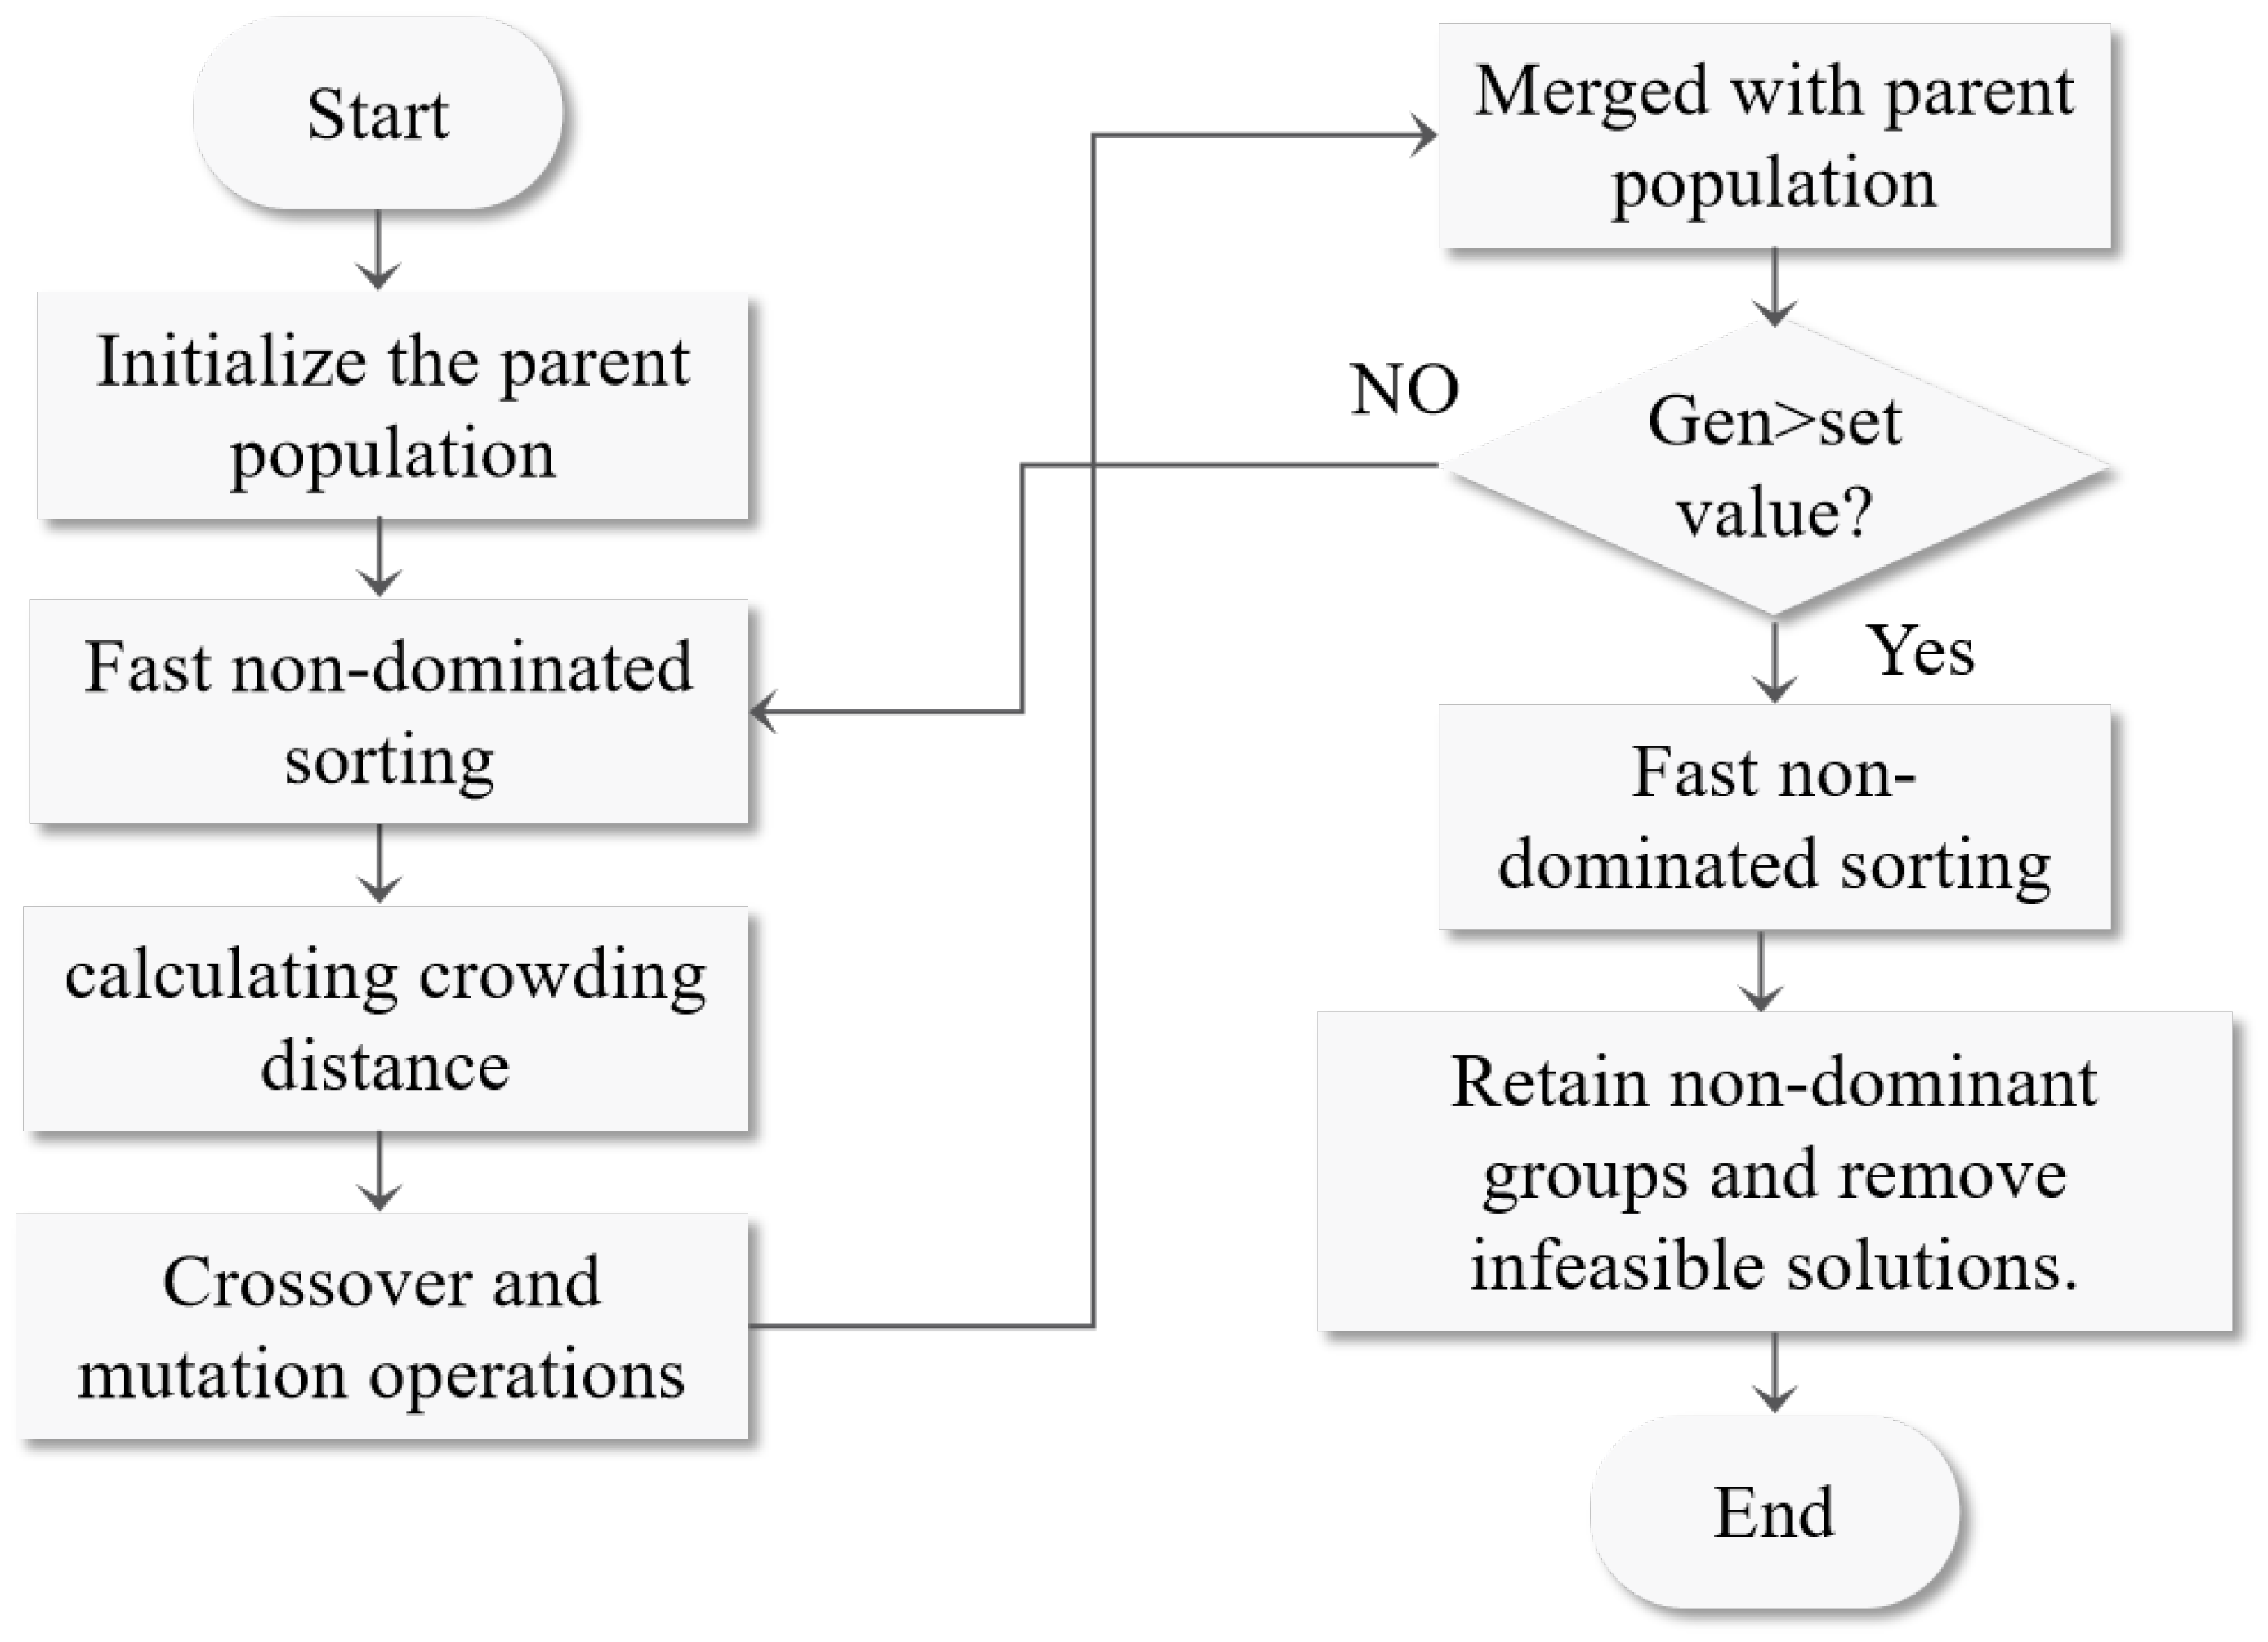
2.2.3. NSGA2 Algorithm Optimization Method

For multi-objective optimization problems with several conflicting or influential objective values, the objectives can only be optimal in a specific region. In this case, the solution of multi-objective optimization is usually a solution set, and there is no way to compare the advantages and disadvantages of these solutions. The answer is to make one objective better without making all other goals worse, and the mapping of all the optimal solution sets on the objective space obtained by this approach is called the Pareto front [23].
NSGA is a genetic algorithm based on Pareto front and non-dominated sorting, which Srinivas and Deb proposed in the early 1990s [24]. It can optimize multiple objective functions simultaneously. Deb further proposed the NSGA2 algorithm based on a fast, non-dominated sorting, and elite strategy in 2002 [25]. The NSGA2 algorithm has further improved the optimization effect and computing speed compared with NSGA and is widely used to solve various multi-objective optimization problems [26,27,28]. The general flow is shown in Figure 2.
The algorithm flow is as follows:
  • Assigning values to initialized parent populations using a random value approach.
  • For two individuals, p and q in the constraint interval of the optimized variable X, p is said to dominate q if both p’s mappings on the objective space are better than q. Individuals in S that do not dominate are at level 1. Individuals overwhelmed only by level 1 individuals are at level 2, and so on. Accordingly, the parent population S is sorted by fast non-dominance.
  • The individuals under the same rank are ranked based on the crowding distance, and the crowding distance of the individuals at the edge of the ranking is set to ∞; the crowding distance is calculated for the pairs of individuals under the same rank according to Equation (3).
    C g n = ( f n g + 1 f n g 1 ) ( f n m a x f n m i n ) ,   g = 2,3 , , ( l 1 )
    where C g n is the crowding distance and f n g + 1 is the nth objective function value for the (g + 1) generation population. f n g 1 is the NTH objective function value of the population of (g − 1) generations. f n m a x and f n m i n are the maximum and minimum values of the NTH objective function, respectively. l is the number of populations.
  • In the initial population S, a portion of individuals with a high dominance rank and significant crowding distance are selected for cross-mutation using the binary tournament method, and a portion of individuals in the initial population S are randomly selected for mutation to obtain a new population of size N.
  • Combining the new and previous generation populations into a new generation of size 2N populations avoids the loss of good individuals from the prior generation populations.
  • If the current evolutionary generation ≤ evolutionary generation preset value, the population obtained from 5 is repeated as the parent population ranges from 2 to 5. If the current generation exceeds the evolutionary generation preset value, only nondominated individuals from the population obtained in Step 4 are retained after being subjected to nondominated sorting. These non-dominated individuals constitute the optimal solution set, i.e., the Pareto front.

3. Results

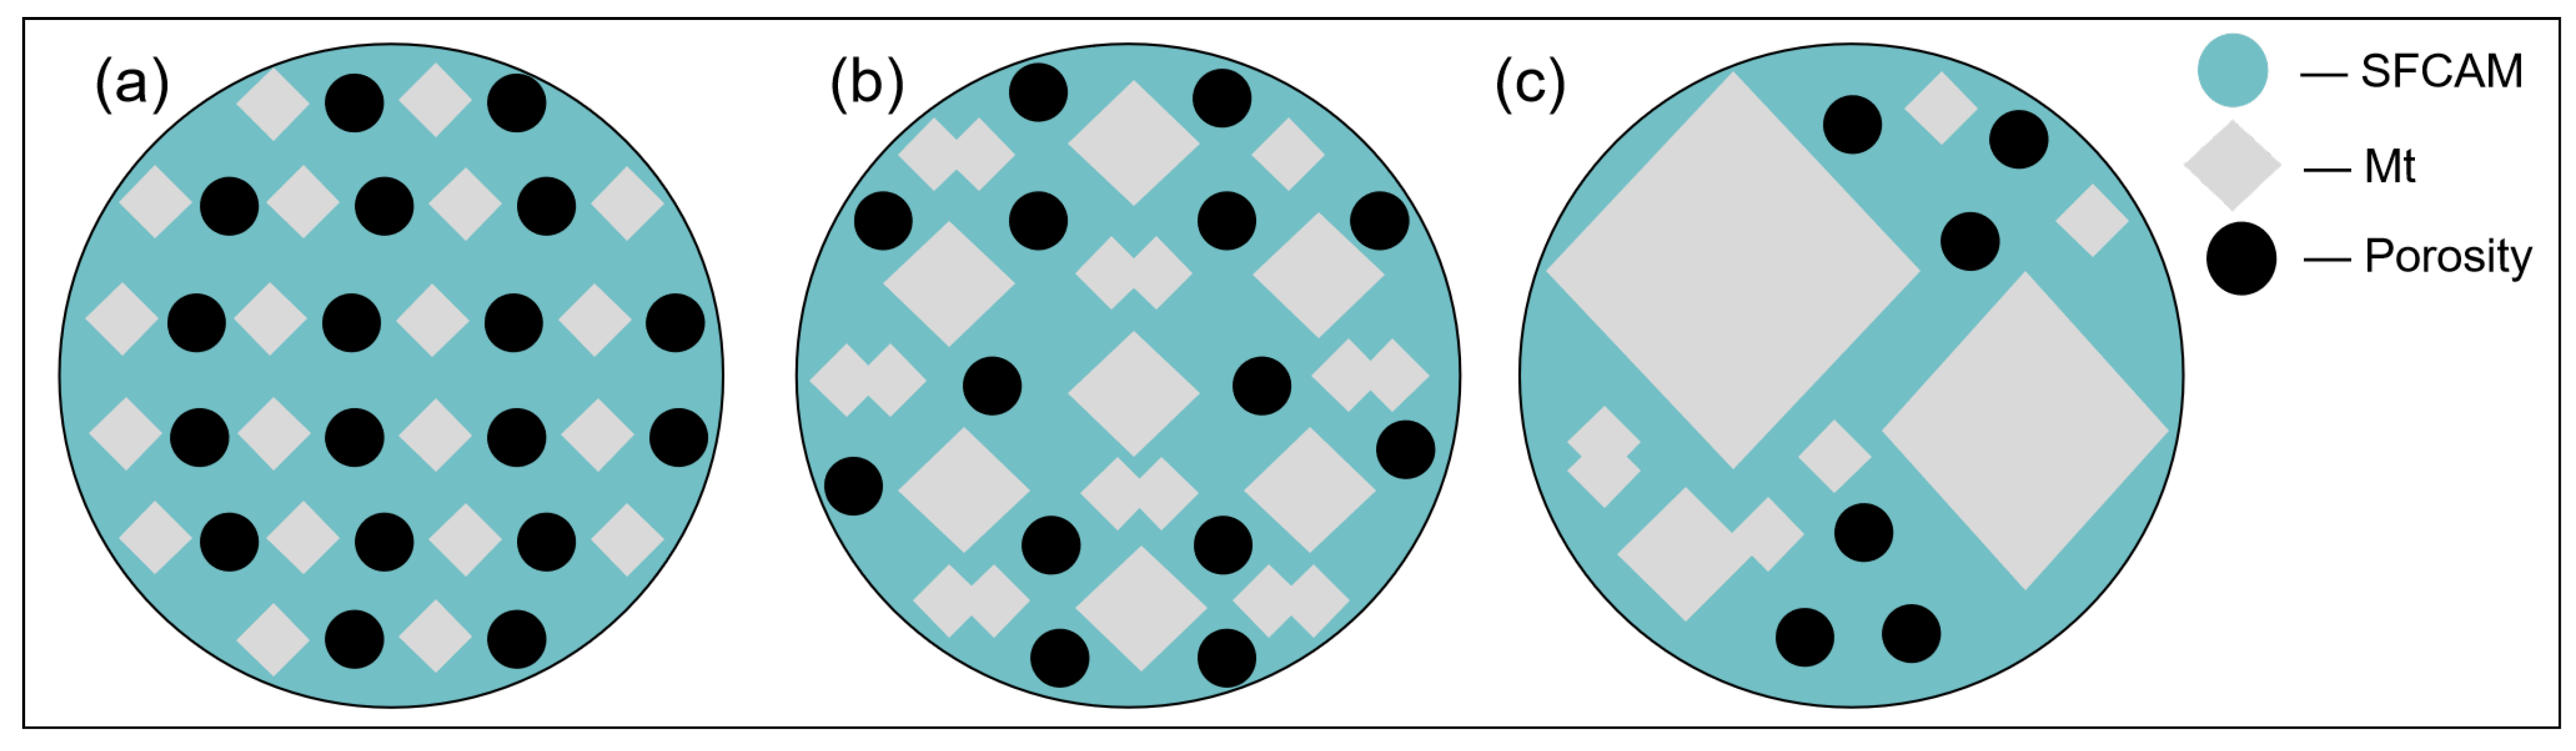
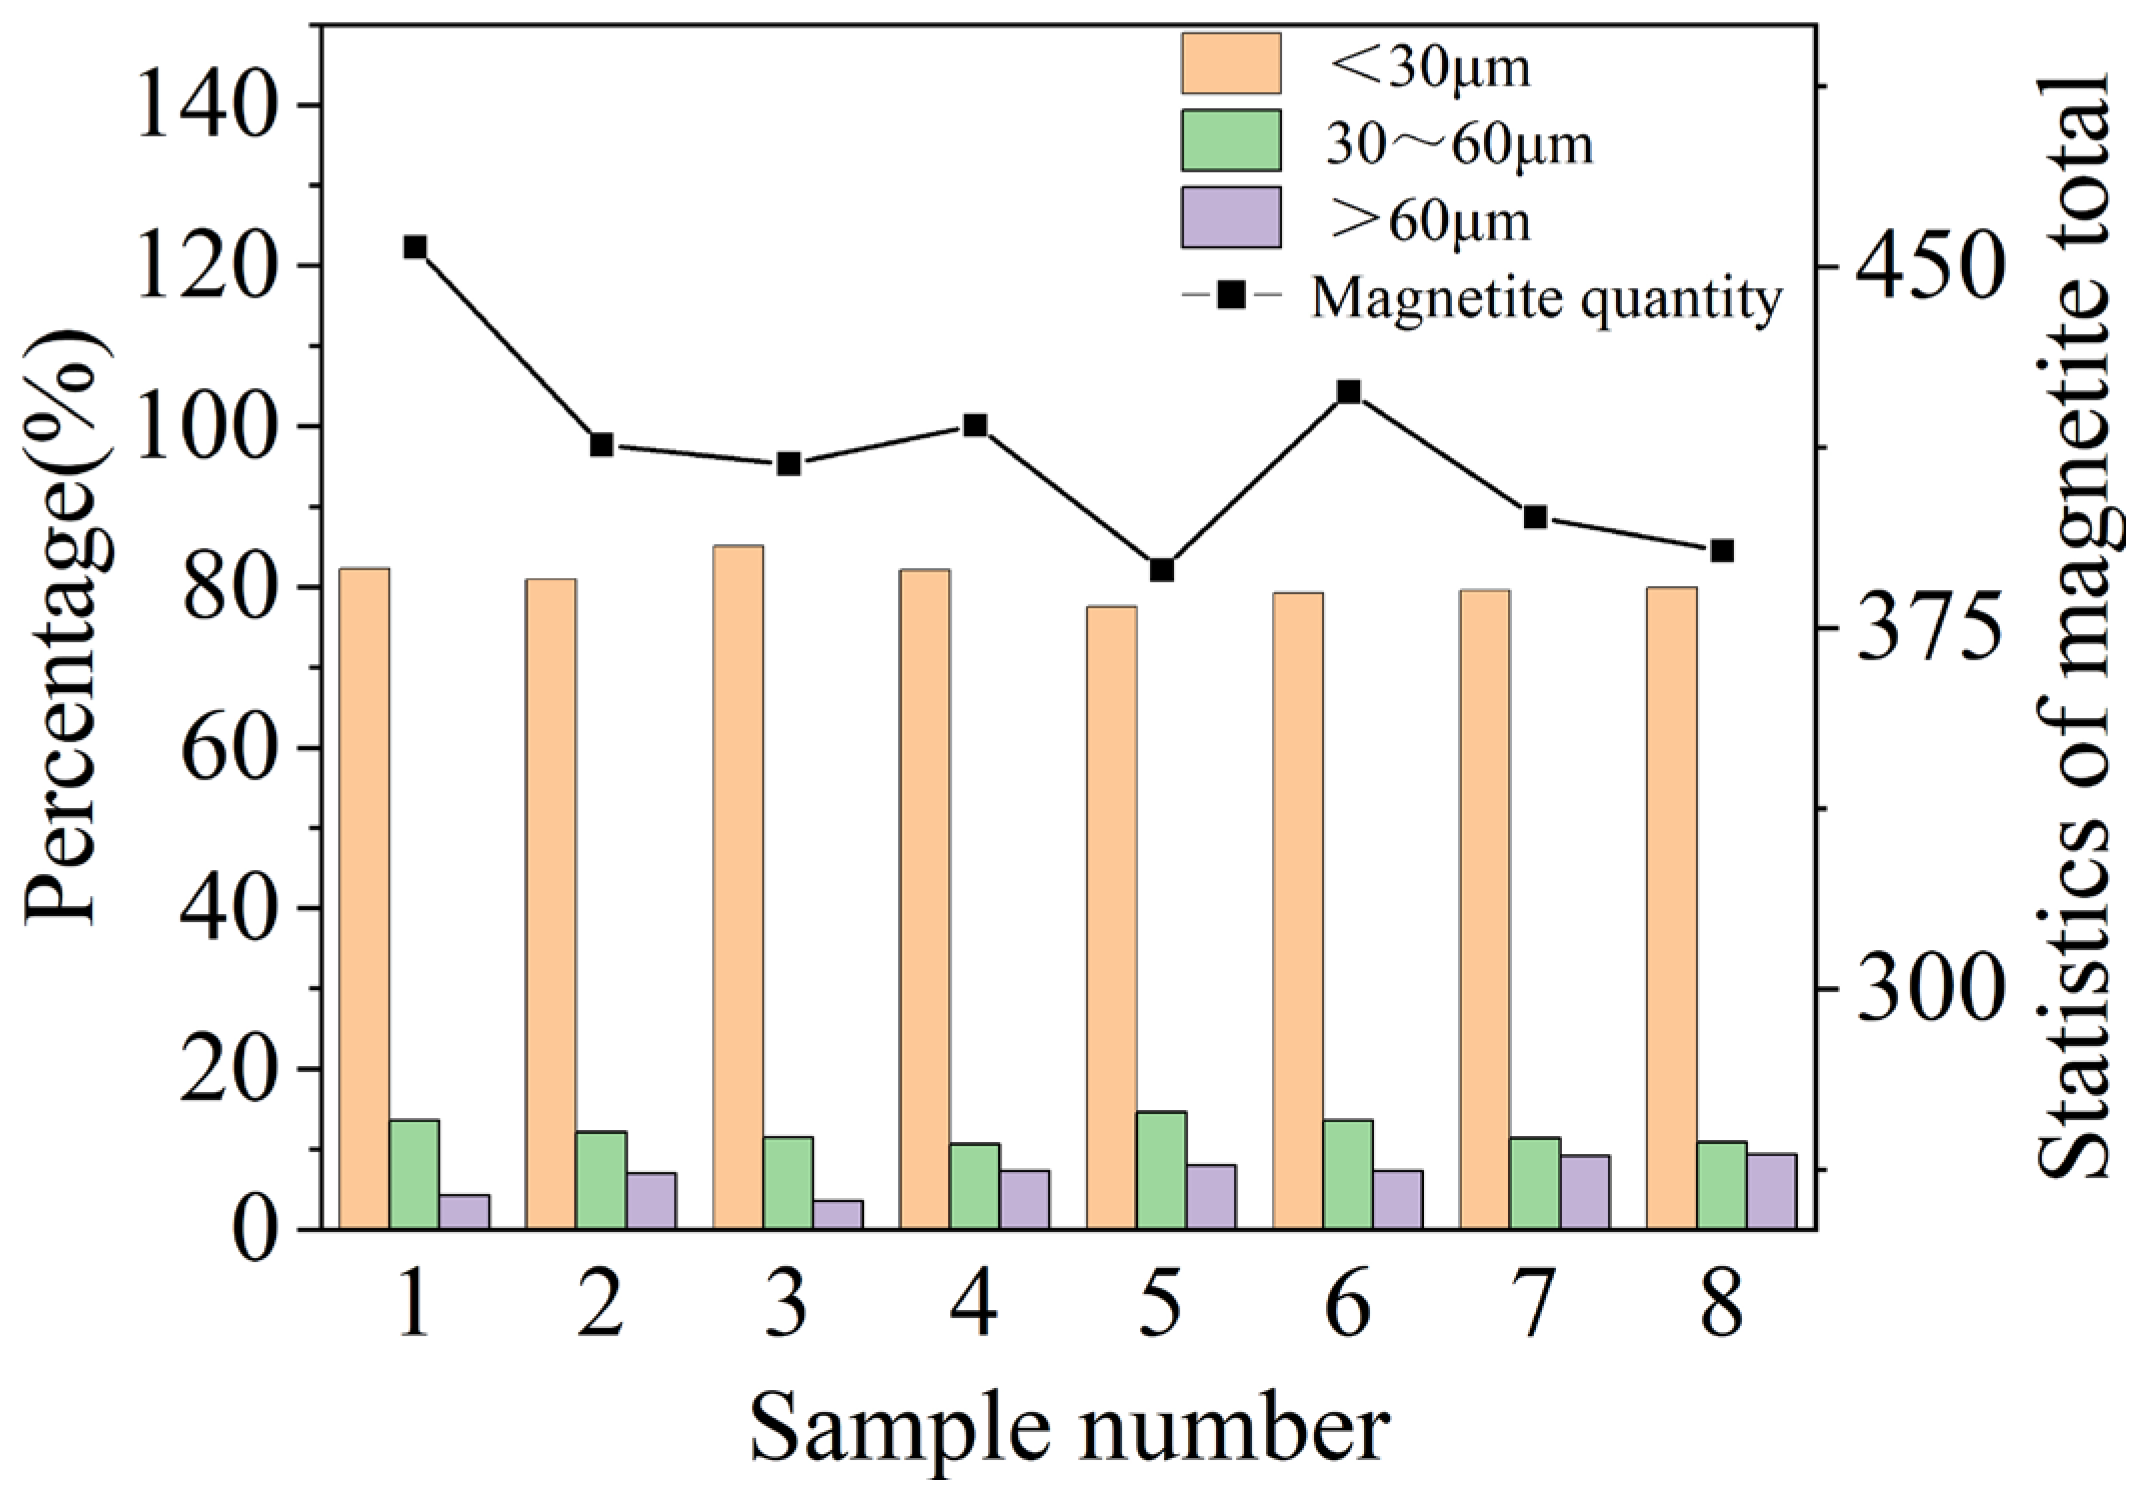
3.1. Micro-Mineralogical Analysis of Sintered Samples

The content of each mineral in the eight samples obtained by line measurement is shown in Table 2. It shows that the mineral composition of the sinter samples was mainly composed of magnetite and Mg-rich SFCA (SFCAM), and the magnetite content was about 30–40%. The MgO mass% in sample No. 1 belonged to a high level, while Al2O3 mass% and R(CaO mass%/SiO2 mass%) belonged to a low to medium level, which leads to a higher content of magnetite compared to the other samples.
In contrast, the content of hematite, dicalcium silicate (C2S), vitreous, and other minerals is less. The mineral content difference among the samples is slight, but the uniformity of the mineral phase structure is significant. Based on the homogeneity of the mineral phase structure, the structure can be classified into three categories, ranging from good to poor uniformity, as shown in Figure 3a–c. The disseminated grain size of magnetite in each sample was counted using the line-measurement method (all particle sizes mentioned later are the disseminated grain sizes). Particle size measurements of inhomogeneous, relatively homogeneous, and inhomogeneous magnetite mineral phase structures were carried out, and the results showed that most of the magnetite particle sizes in the homogeneous mineral phase structure were less than 30 μm, whereas those in the more homogeneous as well as the inhomogeneous mineral phase structures were roughly in the range of 30–60 μm and greater than 60 μm, respectively.
The homogeneous mineral phase characteristics were dominated by magnetite below 30 μm, with tiny grains of magnetite uniformly cemented with calcium ferrite with a high degree of fusion, as shown in Figure 4a. The less homogeneous mineral phase was characterized by 30–60 μm magnetite dominated by more considerable magnetite growth, with connecting development between small particles of magnetite and poorer fusion, which is described as shown in Figure 4b. The uneven mineral phase structure was dominated by magnetite above 60 μm, and magnetite appeared to have sizeable consecutive crystal growth, non-uniform structure, and poor fusion degree; its characteristics are shown in Figure 4c. Therefore, the particle size was categorized into three size classes: <30 μm, 30–60 μm, and >60 μm or more. The magnetite content of each particle size class obtained from the line measurements and the total amount of magnetite measured in each sample are shown in Figure 5.

3.2. Model Establishment of Magnetite Particle Size Proportion
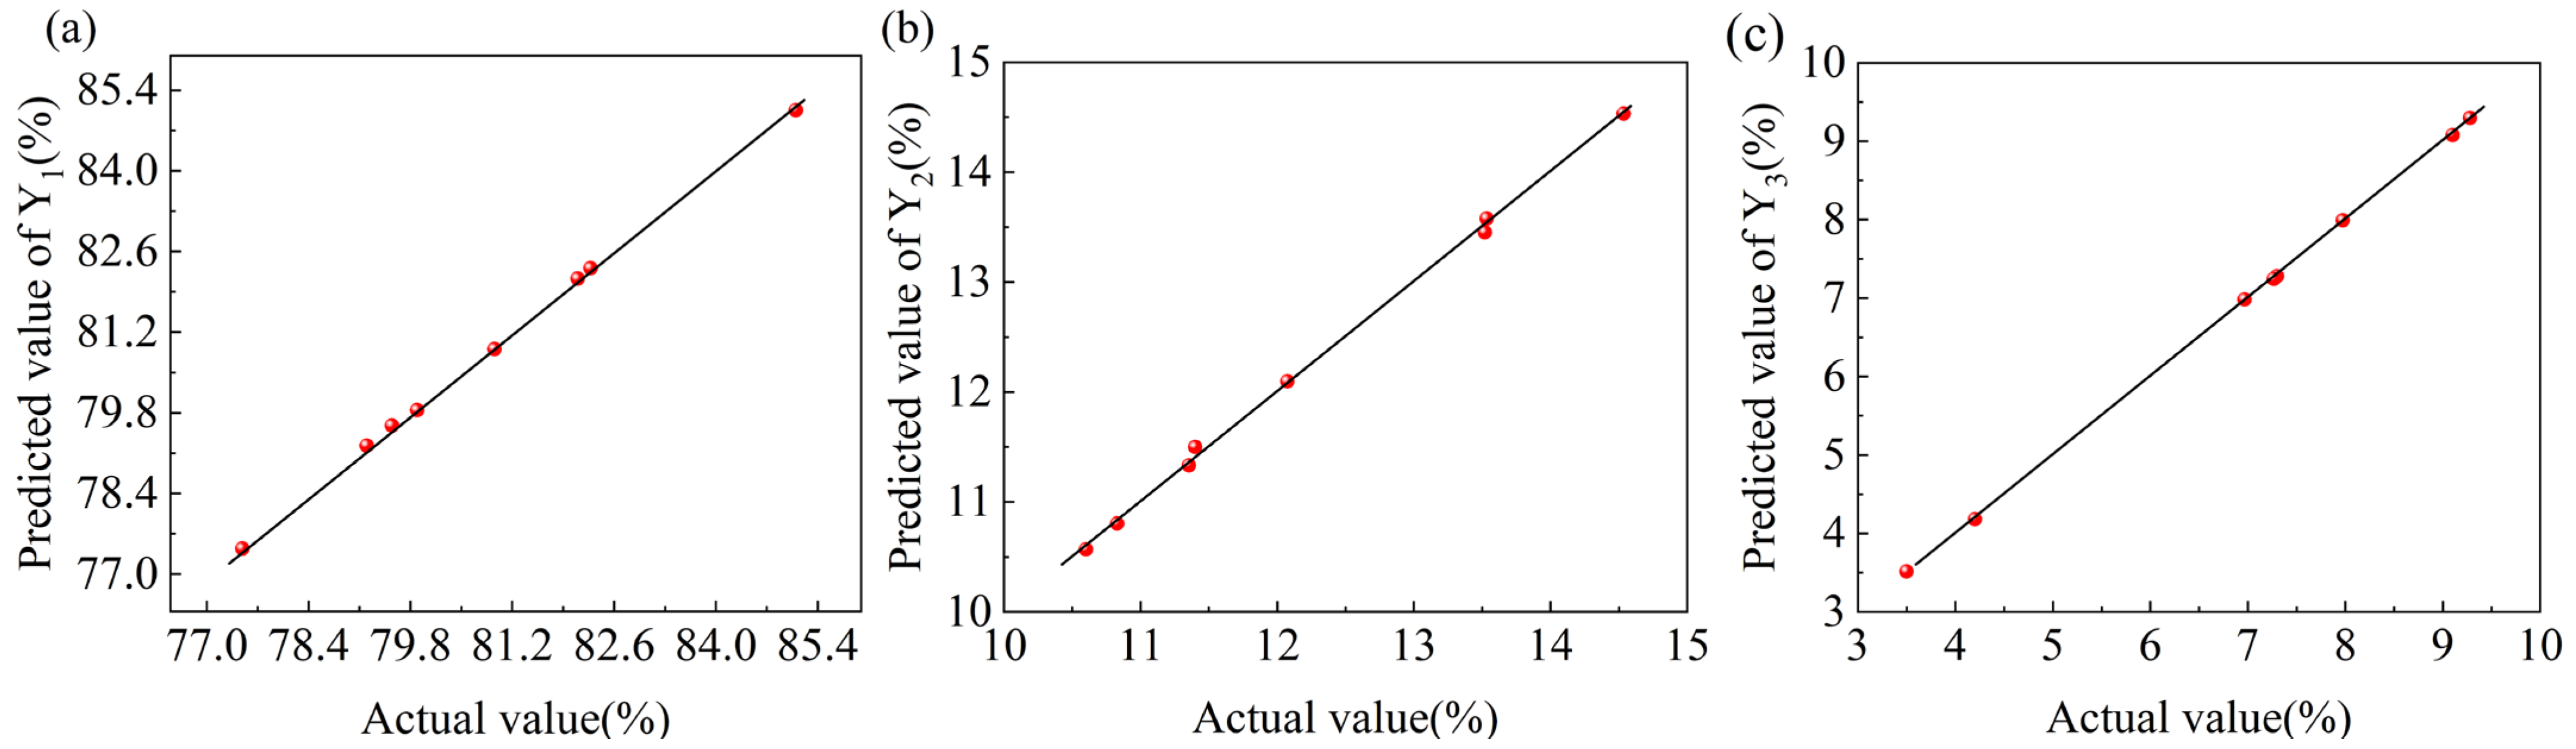
3.2.1. Model Fit

Based on the results of the mineral phase analysis, three particle size classes of magnetite content were used to quantify the homogeneity of the sintered ore phase structure, and the magnetite content of the three particle size classes of <30 μm, 30–60 μm, and >60 μm indicated the homogeneous, more homogeneous, and non-homogeneous content of the mineral phase structure, respectively, to evaluate the homogeneity of the overall mineral phase structure of the sintered ore samples. In this paper, a multiple regression model was fitted using Minitab 17. Multiple linear regression equations were fitted with Al2O3 mass%(X1), MgO mass%(X2), and R(CaO mass%/SiO2 mass%)(X3) as the independent variables, and the percentage share of magnetite of different grain size grades as the dependent variables.
The resulting fitted equations are Equations (4)–(6)
Y 1 = 0.678 + 0.436 X 1 0.196 X 2 + 0.035 X 1 X 2 0.051 X 1 X 3 + 0.032 X 2 X 3 0.091 X 1 2
Y 2 = 0.145 + 0.215 X 1 0.008 X 1 X 2 0.018 X 1 X 3 + 0.019 X 2 X 3 0.034 X 1 2
Y 3 = 0.162 0.132 X 1 + 0.092 X 2 0.114 X 3 0.038 X 1 X 2 + 0.052 X 1 2 + 0.031 X 3 2

3.2.2. Model Significance Analysis

The parameters for evaluating the effectiveness of model fitting for the quantitative relationship between the raw material composition and the percentage of magnetite in each grain size are shown in Table 3. R2 is the coefficient of determination, which represents the fit effect between the test observations and the fitted values. It can be seen from Table 3 that the R2 and the adjusted R2 of each model are all greater than 0.95, indicating that the independent variables in the model can explain more than 95% of the changes in the dependent variable. F tests the degree of the total contribution of each variable in the model to the dependent variable, P is the test of the model’s significance, and the p values of the three models in Table 3 are all less than 0.05, which indicates that the model can pass the significance test and has statistical significance, and the model fits well.
The comparison between the predicted and experimental values of the magnetite percentage of each grain size grade calculated by the multiple regression model is shown in Figure 6, and the actual and expected values are close to a straight line, indicating that the predicted values of the model are consistent with the true values. The regression equations Y1, Y2, and Y3 for the quantitative relationship between the chemical composition and the percentage of magnetite in each grain size were obtained by fitting equations, and the evaluation of the relevant parameters is shown in Table 4, where the p value is the parameter significance test, a p value less than 0.05 indicates that the independent variable has a significant effect on the dependent variable Y, and a smaller p value represents more significance. As shown in Table 4, the one-factor results for Al2O3 mass% and MgO mass% were substantial in Y1, the one-factor effect of Al2O3 mass% was significant in Y2, and the one-factor results for Al2O3 mass%, MgO mass%, and R(CaO mass%/SiO2 mass%) were all significant in Y3.

3.3. Regression Model Analysis of Magnetite Grade Proportion

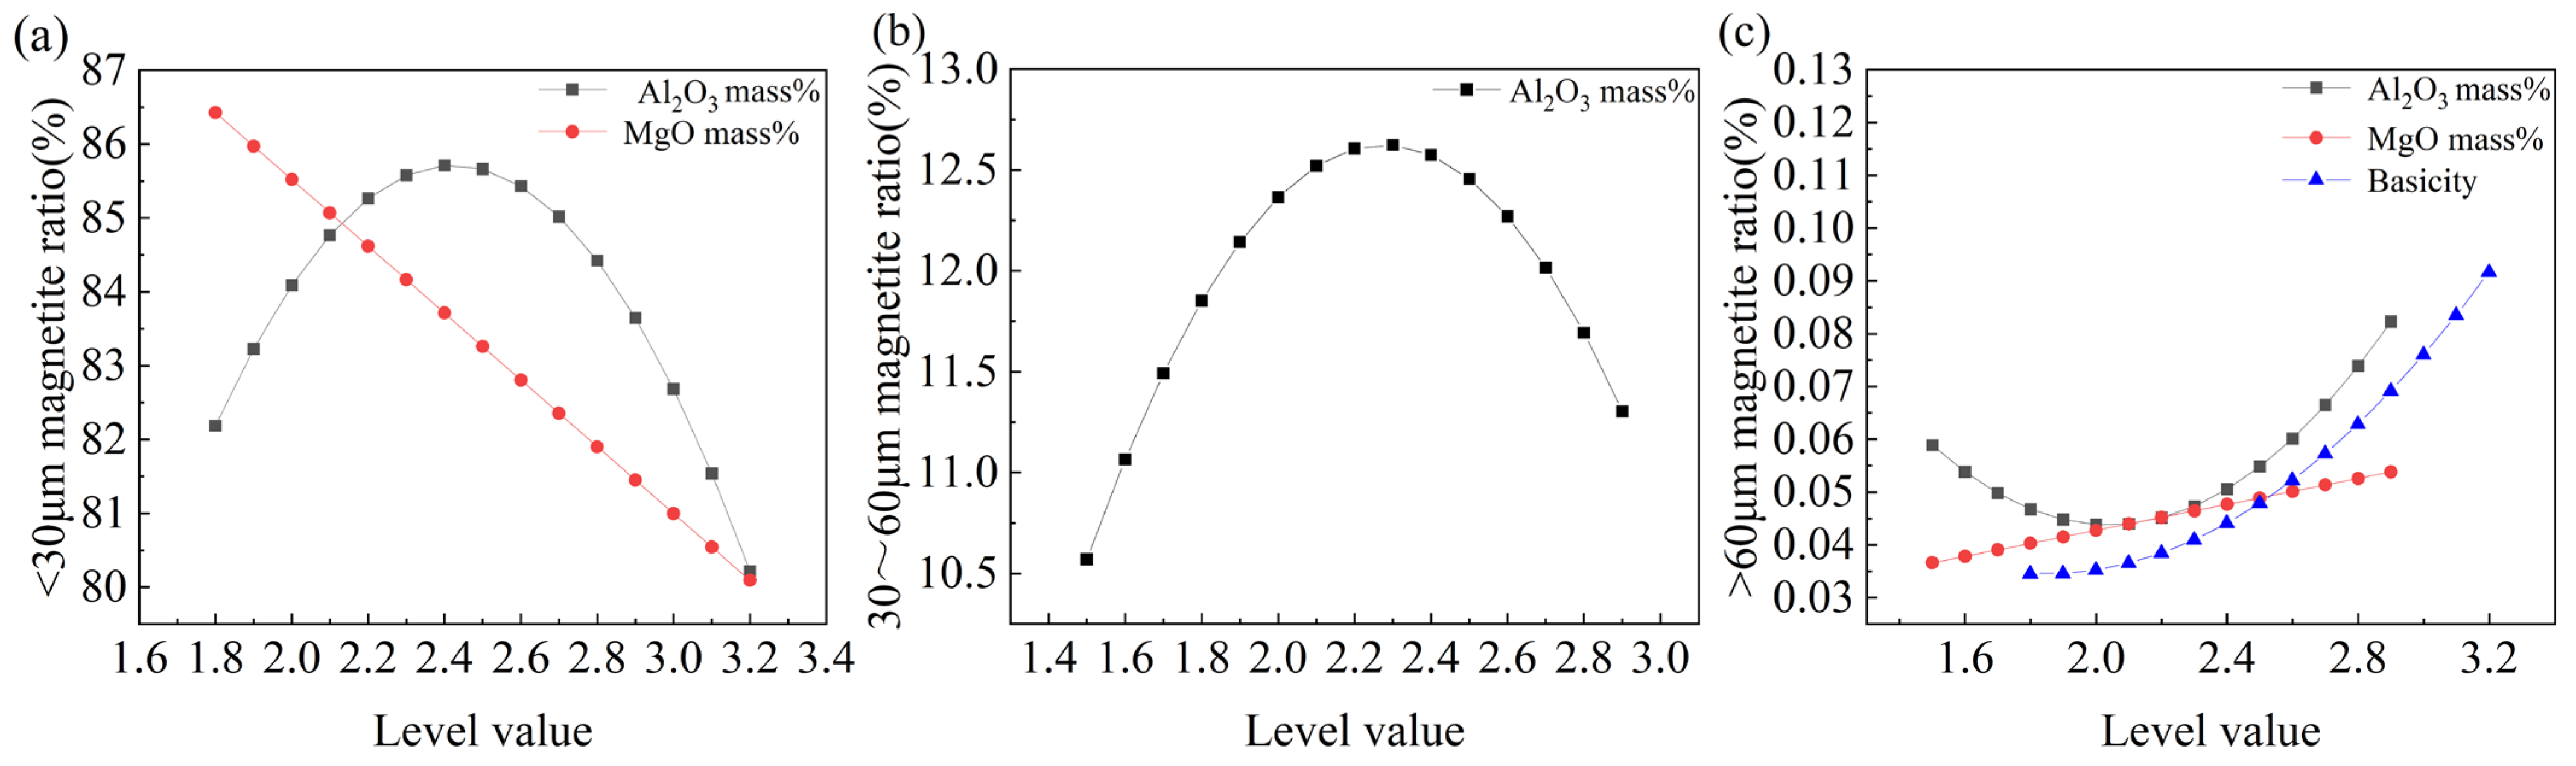
3.3.1. Single Factor Analysis

Fixing the values of its two factors (selecting MgO mass% as 2.1, Al2O3 mass% as 2.1, or R(CaO mass%/SiO2 mass%) as 2.4, from now on), the effect of a single factor on the magnetite content of each particle size grade was investigated. With an increase in Al2O3 mass%, the magnetite content below 30 μm increased and then decreased, and the percentage of magnetite below 30 μm decreased with an increase in MgO mass%, as shown in Figure 7a. The magnetite content increased from 30 to 60 μm and then decreased with an increase in Al2O3 mass%, as shown in Figure 7b. With an increase in Al2O3 mass%, the magnetite content above 60 μm decreased and then increased, and the magnetite content above 60 μm increased with the height of the MgO mass% and basicity, as shown in Figure 7c.
An increase in the Al2O3 mass% from 1.5 to about 2.0 resulted in more liquid phase generation and higher liquid phase viscosity [29,30,31]. The rise in the liquid phase led to the formation of smaller magnetite crystal particles. It increased the likelihood of contiguous crystal growth. In contrast, the increase in the liquid phase led to more dispersed crystallization of magnetite, which was less prone to forming large bonding pieces. With an increase in Al2O3 mass% from 2.0 to 2.9, the proportions of <30 μm and 30~60 μm magnetite increased slowly or even decreased, which may be due to the high viscosity when Al2O3 mass% was too high, resulting in the growth of magnetite crystals into large pieces of magnetite. With an increase in MgO mass%, the viscosity increased, and the liquid phase generation decreased [32,33,34]. The increase in density led to smaller magnetite crystals, and the low liquid phase generation led to a smaller magnetite crystallization environment, which was prone to the growth of tiny particles of continuous crystals into large pieces of magnetite. With increasing basicity, the viscosity of the liquid phase decreased [35,36,37], which was more favorable for magnetite crystallization and could be responsible for the increase in the percentage of massive magnetite above 60 μm.

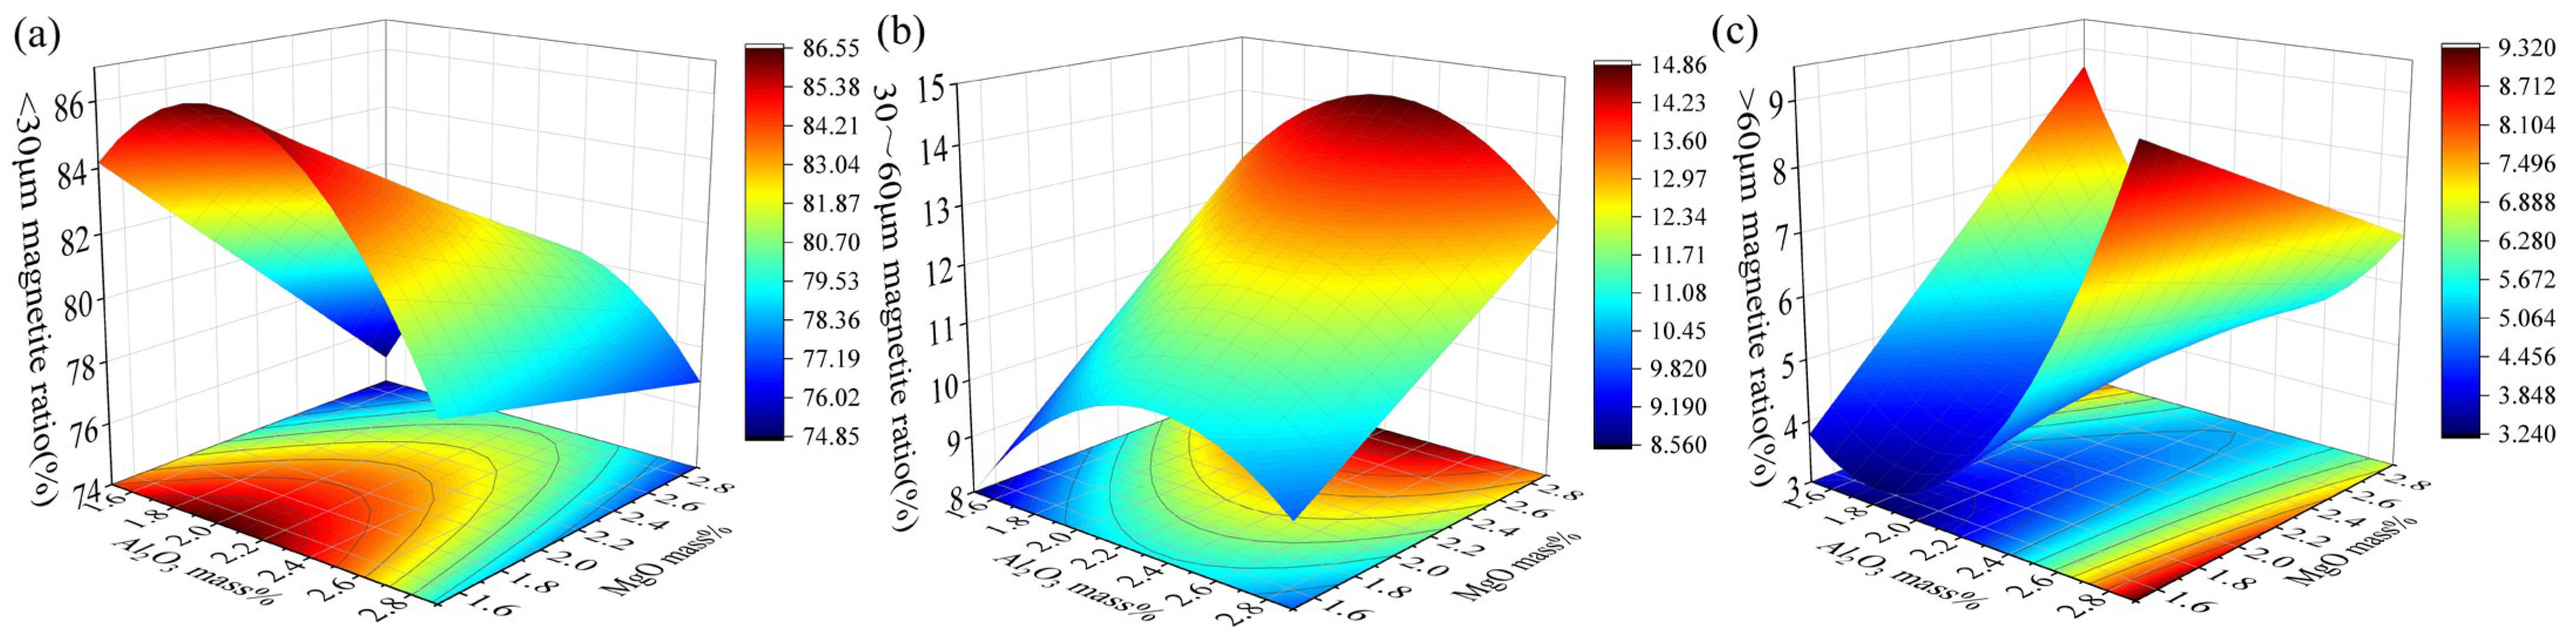
3.3.2. Interaction Analysis

According to the significant p values in Table 3, the interaction between Al2O3 mass% and MgO mass% has a substantial effect on the percentage of magnetite in all three particle size class grades. The influence of the interaction between Al2O3 mass% and MgO mass% on the proportion of magnetite at each particle size level when the basicity is 2.4 is shown in Figure 8a–c. The law of change in the proportion of magnetite of the three particle size levels with the difference in Al2O3 mass% is consistent with the single factor. When MgO mass% content is high, the proportion of magnetite below 30 μm decreases, and the ratio above 30~60 μm increases. The interaction of Al2O3 mass % and MgO mass % showed mutual inhibition effect on the magnetite percentage below 30 μm, and promoted effect on the magnetite percentage between 30 and 60μm. When the level of Al2O3 mass % or MgO mass % is too high, and the level of the other is too low, it will lead to a higher percentage of >60μm of magnetite.

3.4. Sinter Ore Uniformity Optimization Based on Multiple Regression-NSGA2

3.4.1. Multiple Regression-NSGA2 Model Design

In this section, we use the magnetite size class classification method from 1.4 to explore the dosing scheme that provides the highest degree of sinter uniformity. To achieve this, we optimized the established multiple regression model using the NSGA2 algorithm. The optimization model was developed using Python. Under the experimental design scheme described in Section 2.1, we used Al2O3 mass%, MgO mass%, and R(CaO mass%/SiO2 mass%) factor index X = (X1, X2, X3) as the optimization variables. The three particle size grades of magnetite grains Y = [Y2(X), Y3(X)] were used as optimization objectives, and we took the smallest of Y2 and Y3 as the optimal. Therefore, the model for the Y optimization problem of sinter phase uniformity can be described as follows:
Optimization variables:
X = ( X 1 , X 2 , X 3 )
Optimization objectives:
Y = ( Y 2 , Y 3 )
Variable constraints:
X 1.5 < X 1 < 2.9 1.5 < X 2 < 2.9 1.8 < X 3 < 3.2

3.4.2. Multiple Regression-NSGA2 Optimization Results

The NSGA2 multi-objective optimization algorithm was initialized with a population size of 100, a maximum number of genetic generations of 100, a crossover variance probability of 0.9, a variance probability of 0.1, and a crossover distribution index of 20. Both functions and constraints were implemented in PyCharm Community Edition 2023.2.5 software. NSGA2 was used to solve the multi-objective optimization for sinter uniformity, and the optimization procedure converged after about 50 iterations; the resulting Pareto front is shown in Figure 9. Taking the percentage of magnetite from 30 to 60 μm and the rate of magnetite above 60 μm as the optimization objectives, the Pareto optimal solution set was obtained, of which the last five optimal solutions are shown in Table 5.
The optimal raw material composition ratio for obtaining the Pareto front of sinter uniformity was Al2O3 mass% = 1.82, MgO mass% = 1.5, and basicity = 1.84 within the experimental level range. Under these conditions, the metal phase of the sinter mineral phase was dominated by <30 μm magnetite, and the mineral phase structure was the most uniform. The actual values (87.21%, 10.64%, and 2.13%) of <30 μm magnetite were close to the predicted values (88.80%, 10.22%, and 2.30%). Compared with the pre-optimization period, the large-grained magnetite-dominated mineral phase structure (shown in Figure 10a) was significantly reduced, and the small-grained magnetite-dominated homogeneous mineral phase structure of <30 μm increased considerably, as shown in Figure 10b, which verified the reliability of the multiple regression-NSGA2 model.

4. Conclusions

  • A multivariate regression model was established with Al2O3 mass%, MgO mass%, and R(CaO mass%/SiO2 mass%) as the independent variables, and the percentages of magnetite in the three particle size classes of <30 μm, 30–60 μm, and >60 μm were established as the dependent variables;d the adjusted R² values for the model parameters were 0.997, 0.995, and 0.999, respectively. The adjusted R² values for the parameters of the models were all close to 1, with p values less than 0.05. The model fitted well with high reliability.
  • The proportion of magnetite below 30 μm was significantly affected by the Al2O3 mass% and MgO mass% single factors, and the balance of 30~60 μm magnetite is influenced considerably by the Al2O3 mass% single factor. The proportion of magnetite above 60 μm was significantly affected by the single aspects of Al2O3 mass%, MgO mass%, and R(CaO mass%/SiO2 mass%). The interaction between Al2O3 mass% and MgO mass% had a significant effect on the proportion of magnetite in the three particle size grades.
  • The Pareto front of sinter uniformity was obtained, and the raw material composition ratio of Al2O3 mass% = 1.82, MgO mass% = 1.5, and R(CaO mass%/SiO2 mass%) = 1.84 when the uniformity of the sinter was optimal within the range of the experimental level was obtained. Under these conditions, the metal phase of the sinter mineral phase was dominated by <30 μm magnetite, and the mineral phase structure was the most uniform. The actual value of <30 μm magnetite was close to the predicted value, which verifies the reliability of the multiple regression- NSGA2 model.

Author Contributions

Conceptualization, S.F. and M.L.; methodology, formal analysis, S.F. and L.L.; investigation, resources, M.L. and B.D.; software, data curation, L.Q. and B.D.; writing—original draft preparation, S.F.; writing—review and editing, S.F. and M.L.; visualization, M.L. and B.D.; supervision, X.H.; project administration, L.L. and X.H. All authors have read and agreed to the published version of the manuscript.

Funding

This research was funded by the National Natural Science Foundation of China (No. 51774140 and No. 51574105), the Natural Science Foundation of Hebei Province (No. E2021209147), the Open Fund Project of the State Key Laboratory of Process Automation in Mining & Metallurgy and Beijing Key Laboratory of Process Automation in Mining and Metallurgy (No. BGRIMMKZSKL-2018-10), the Science and Technology Planning Project of Hebei Province (No. 23564101D), and the Key Research Project of North China University of Science and Technology (No. ZD-ST-202308).

Institutional Review Board Statement

Not applicable.

Informed Consent Statement

Not applicable.

Data Availability Statement

The raw data supporting the conclusions of this article will be made available by the authors on request.

Conflicts of Interest

The authors declare no conflicts of interest.

References

  1. Xu, X.; Zhou, X. Deep Learning Based Feature Selection and Ensemble Learning for Sintering State Recognition. Sensors 2023, 23, 9217. [Google Scholar] [CrossRef] [PubMed]
  2. Bao, G.; Liu, L.; Han, X.; Duan, B.; Qin, L.; Liu, Y. Optimization of Sintering Ore Blending by Response Surface-satisfaction Function Method. Iron Steel 2023, 58, 41–50. [Google Scholar] [CrossRef]
  3. Lv, W.; Gan, M.; Fan, X.; Sun, Z.; Zhang, R.; Ji, Z.; Chen, X. Reaction Behavior and Transformation Path of Zinc in the Heating-Up Zone during Sintering Process. Sustainability 2022, 14, 10147. [Google Scholar] [CrossRef]
  4. Gao, Q.; Wang, H.; Pan, X.; Jiang, X.; Zheng, H.; Shen, F. A forecast model of the sinter tumble strength in iron ore fines sintering process. Powder Technol. 2021, 390, 256–267. [Google Scholar] [CrossRef]
  5. Liu, C.; Zhang, Y.-Z.; Zhao, K.; Xing, H.-W.; Kang, Y. Modified biomass fuel instead of coke for iron ore sintering. Ironmak. Steelmak. 2020, 47, 188–194. [Google Scholar] [CrossRef]
  6. Park, J.; Kim, E.; Suh, I.-K.; Lee, J. A Short Review of the Effect of Iron Ore Selection on Mineral Phases of Iron Ore Sinter. Minerals 2022, 12, 35. [Google Scholar] [CrossRef]
  7. Han, X.; Si, T.; Liu, Y.; Li, M.; Liu, L.; Zhou, X. Relationship between Mineralogical Structure and RDI+3.15 mm of Sinter with Different Contents of Al2O3. China Metall. 2022, 32, 34–38, 59. [Google Scholar] [CrossRef]
  8. Honeyands, T.; Nguyen, T.B.T.; Pinson, D.; Connolly, P.R.J.; Pownceby, M.I.; Manuel, J.; Matthews, L.; Leedham, J.; Singh, T.; O’Dea, D.P. Variation in Iron Ore Sinter Mineralogy with Changes in Basicity. Minerals 2022, 12, 1249. [Google Scholar] [CrossRef]
  9. Xin, R.-F.; Guo, X.-M. A Study of the Crystallization Properties of CaO-SiO2-Al2O3 Glass Phase in Sinter. Metals 2022, 12, 915. [Google Scholar] [CrossRef]
  10. Wu, S.; Zhang, W.; Kou, M.; Zhou, H. The Macroscopic Flow direction and Microscopic Distribution of Mg in Sintered Products and Its Influence. Metals 2018, 8, 1008. [Google Scholar] [CrossRef]
  11. Han, X.; Si, T.; Li, M.; Zhou, X.; Liu, L.; Zhao, K. Influences of MgO and Al2O3 on the Mineralogical Properties of Calcium Ferrite in Iron Ore Sinter. Earth Sci. Front. 2020, 27, 280–290. [Google Scholar] [CrossRef]
  12. Cheng, S.; Hayes, P.C.; Jak, E. Iron Ore Sinter Macro- and Micro-Structures, and Their Relationships to Breakage Characteristics. Minerals 2022, 12, 631. [Google Scholar] [CrossRef]
  13. Liu, H.; Zhang, K.; Qin, Y.; Saxén, H.; Liu, W.; Xiang, X. Effect of B2O3 on the Sintering Process of Vanadium–Titanium Magnet Concentrates and Hematite. Metals 2020, 10, 1224. [Google Scholar] [CrossRef]
  14. Han, F.; Yang, Y.; Wang, L.; Tang, P.; Zhong, Q.; Li, Q.; Jiang, T. Strengthening Granulating and Sintering Performance of Refractory Iron Concentrate by Pre-Pelletizing. Metals 2023, 13, 679. [Google Scholar] [CrossRef]
  15. Bao, G.; Liu, L.; Han, X.; Duan, B.; Qin, L. Optimization of sintering raw material blending scheme based on RDl>3.15mm response surface methodology. Iron Steel 2023, 58, 31–38. [Google Scholar] [CrossRef]
  16. Yu, Z.; Li, G.; Jiang, T.; Zhang, Y.; Zhou, F.; Peng, Z. Effect of basicity on titanomagnetite concentrate sintering. ISIJ Int. 2015, 55, 907–909. [Google Scholar] [CrossRef]
  17. Li, Z.; Li, T.; Sun, C.; Yang, S.; Wang, Q. The Effects of MgO and Al2O3 Content in Sinter on the Softening–Melting Properties of Mixed Ferrous Burden. Materials 2023, 16, 5490. [Google Scholar] [CrossRef]
  18. Liu, L.; Han, X.; Li, M.; Zhang, D. Influence of Mineralogical Structure of Mold Flux Film on Heat Transfer in Mold during Continuous Casting of Peritectic Steel. Materials 2022, 15, 2980. [Google Scholar] [CrossRef]
  19. Liu, L.; Han, X.; Zhang, D.; Li, M.; Wang, Y. Effects of Mineral Raw Materials on Melting and Crystalline Properties of Mold Flux and Mineralogical Structures of Flux Film for Casting Peritectic Steel Slab. ISIJ Int. 2023, 63, 1697–1705. [Google Scholar] [CrossRef]
  20. Afrasiabian, B.; Eftekhari, M. Prediction of mode I fracture toughness of rock using linear multiple regression and gene expression programming. J. Rock Mech. Geotech. Eng. 2022, 14, 1421–1432. [Google Scholar] [CrossRef]
  21. Thejasree, P.; Manikandan, N.; Binoj, J.; Krishnamachary, P.; Arulkirubakaran, D.; Reddy, J.J.; Reddy, V.I.K.; Saikiran, K.; Vardhan, C.V. Application of multiple regression analysis for wire electrical discharge machining of stainless steel 304. In Recent Advances in Materials and Modern Manufacturing: Select Proceedings of ICAMMM 2021; Springer: Singapore, 2022; pp. 175–183. [Google Scholar] [CrossRef]
  22. Muchhadiya, P.D.; Pitroda, J.; Gujar, R.; Soni, J. Multiple regression models for compressive and flexural strength of recycled printed circuit board concrete. Mater. Today Proc. 2022, 62, 6992–6997. [Google Scholar] [CrossRef]
  23. Ma, X.; Liu, S.; Hong, W. Enhancing Multi-Objective Optimization with Automatic Construction of Parallel Algorithm Portfolios. Electronics 2023, 12, 4639. [Google Scholar] [CrossRef]
  24. Srinivas, N.; Deb, K. Muiltiobjective optimization using nondominated sorting in genetic algorithms. Evol. Comput. 1994, 2, 221–248. [Google Scholar] [CrossRef]
  25. Deb, K.; Pratap, A.; Agarwal, S.; Meyarivan, T. A fast and elitist multi-objective genetic algorithm: NSGA-II. IEEE Trans. Evol. Comput. 2002, 6, 182–197. [Google Scholar] [CrossRef]
  26. Verma, S.; Pant, M.; Snasel, V. A comprehensive review on NSGA-II for multi-objective combinatorial optimization problems. IEEE Access 2021, 9, 57757–57791. [Google Scholar] [CrossRef]
  27. Yuan, M.; Li, Y.; Zhang, L.; Pei, F. Research on intelligent workshop resource scheduling method based on improved NSGA-II algorithm. Robot. Comput.-Integr. Manuf. 2021, 71, 102141. [Google Scholar] [CrossRef]
  28. Vukadinović, A.; Radosavljević, J.; Đorđević, A.; Protić, M.; Petrović, N. Multi-objective optimization of energy performance for a detached residential building with a sunspace using the NSGA-II genetic algorithm. Sol. Energy 2021, 224, 1426–1444. [Google Scholar] [CrossRef]
  29. Zhu, D.; Xue, Y.; Pan, J.; Yang, C.; Guo, Z.; Tian, H.; Wang, D.; Shi, Y. An investigation into aluminum occurrence impact on SFCA formation and sinter matrix strength. J. Mater. Res. Technol. 2020, 9, 10223–10234. [Google Scholar] [CrossRef]
  30. Xin, R.-F.; Du, Y.; Guo, X.-M. Effect of Alumina on Crystallization Behavior of Calcium Ferrite in Fe2O3-CaO-SiO2-Al2O3 System. Materials 2022, 15, 5257. [Google Scholar] [CrossRef] [PubMed]
  31. Xue, Y.; Pan, J.; Zhu, D.; Guo, Z.; Yang, C.; Lu, L.; Tian, H. Improving High-Alumina Iron Ores Processing via the Investigation of the Influence of Alumina Concentration and Type on High-Temperature Characteristics. Minerals 2020, 10, 802. [Google Scholar] [CrossRef]
  32. Cheng, G.; Li, L.; Xue, X.; Yang, H.; Zhang, W.; Bai, R. Effects of extracted-vanadium residue and MgO on the basic sintering characteristics of high-chromium vanadium–titanium magnetite. J. Mater. Res. Technol. 2022, 17, 2657–2669. [Google Scholar] [CrossRef]
  33. Webster, N.A.; Pownceby, M.I.; Manuel, J.R.; Pattel, R.; Kimpton, J.A. Fundamentals of silico-ferrite of calcium and aluminum (SFCA) and SFCA-I iron ore sinter bonding phase formation: Effects of MgO on phase formation during heating. JOM 2021, 73, 299–305. [Google Scholar] [CrossRef]
  34. Li, T.; Sun, C.; Liu, X.; Song, S.; Wang, Q. The effects of MgO and Al2O3 behaviours on softening–melting properties of high basicity sinter. Ironmak. Steelmak. 2018, 45, 755–763. [Google Scholar] [CrossRef]
  35. Han, H.; Lu, L.; Hapugoda, S. Effect of ore types on high temperature sintering characteristics of iron ore fines and concentrate. Miner. Eng. 2023, 197, 108062. [Google Scholar] [CrossRef]
  36. Zhang, L.; Gao, Z.; Yang, S.; Tang, W.; Xue, X. Effect of Basicity on Sintering Behavior and Metallurgical Properties of High-Chromium Vanadium-Titanium Magnetite. Metals 2020, 10, 569. [Google Scholar] [CrossRef]
  37. Chen, C.; Lu, L.; Jiao, K. Thermodynamic Modelling of Iron Ore Sintering Reactions. Minerals 2019, 9, 361. [Google Scholar] [CrossRef]
Figure 1. Schematic diagram of the principle of the line measurement method: (a) arrangement of measurement lines on an optical thin film; (b) microscopic mineral particle size measurement methods.
Metals 14 00169 g001
Figure 2. NSGA2 algorithm flowchart.
Metals 14 00169 g002
Figure 3. Mineral phase structure with varying degrees of homogeneity: (a) homogeneous mineral phase structure; (b) less homogeneous mineral phase structure; (c) inhomogeneous mineral phase structure. Mt: magnetite particles; SFCAM: Mg-rich calcium ferrite.
Metals 14 00169 g003
Figure 4. The main characteristics of magnetite in the ore phase for each grain size: (a) <30 μm magnetite-dominated mineral phase structure; (b) 30~60 μm magnetite-dominated mineral phase structure; (c) >60 μm magnetite-dominated mineral phase structure.
Metals 14 00169 g004
Figure 5. Schematic diagram of magnetite content of each grain grade.
Metals 14 00169 g005
Figure 6. Comparison of actual and predicted percentages of magnetite based on particle size grade: (a) Prediction effect of Y1 on <30 μm magnetite content; (b) Prediction effect of Y2 on 30~60 μm magnetite content; (c) Prediction effect of Y3 on >60 μm magnetite content.
Metals 14 00169 g006
Figure 7. Effect of a single factor on magnetite content at various particle size grades: (a) influence of a single factor on the proportion of <30 μm magnetite; (b) influence of a single factor on the proportion of 30~60 μm magnetite; (c) influence of a single factor on the proportion of >60 μm magnetite.
Metals 14 00169 g007
Figure 8. Effect of interactions on the percentage of magnetite in each particle size class: (a) influence of interactions on the proportion of <30 μm magnetite; (b) influence of interactions on the proportion of 30~60 μm magnetite; (c) influence of interactions on the proportion of >60 μm magnetite.
Metals 14 00169 g008
Figure 9. Pareto front for sinter ore phase homogeneity.
Metals 14 00169 g009
Figure 10. Comparison of mineral phase structures before and after optimization: (a) pre-optimization mineral phase structure; (b) optimized mineral phase structure. Mt: magnetite particle; SFCAM: Mg-rich calcium ferrite.
Metals 14 00169 g010
Table 1. Factors and levels of the uniform design experiment.
CompositionsLevel 1Level 2Level 3Level 4Level 5Level 6Level 7Level 8
R(CaO mass%/SiO2 mass%)1.82.02.22.42.62.83.03.2
Al2O3 mass%1.51.71.92.12.32.52.72.9
MgO mass%1.51.71.92.12.32.52.72.9
Table 2. Mineral content of sintered samples (wt. %).
Sample No.MagnetiteHematiteSFCAMC2SGlass
141.581.2555.671.5-
233.292.459.712.32.3
332.034.756.32.774.2
432.063.8858.881.833.35
533.912.8156.991.125.17
633.291.1659.91.283.77
733.524.0157.562.162.75
834.542.0759.081.163.15
Table 3. Results of the model significance analysis.
ModelR2Adjusted R2FP
Y10.9990.997510.930.034
Y20.9980.995311.110.003
Y30.9990.9991959.130.017
Table 4. Regression equation fitting evaluation parameters.
Y1Y2Y3
BTPBTPBTP
constant0.67828.260.023−0.145−7.760.0160.16217.280.037
X10.43615.200.0420.21512.360.006−0.132−27.120.023
X2−0.196−19.710.032---0.09236.650.017
X3------−0.114−20.310.031
X1X20.03515.650.041−0.008−4.790.041−0.038−33.810.019
X1X3−0.051−15.430.041−0.018−12.020.007---
X2X30.0329.720.0650.01913.010.006---
X12−0.091−19.080.033−0.034−12.990.0060.05249.790.013
X32------0.03127.620.023
Table 5. Selected results from NSGA2 model runs.
No.Al2O3 Mass%MgO Mass%R(CaO Mass%/SiO2 Mass%)30~60 μm Magnetite Ratio/%>60 μm Magnetite Ratio/%
11.821.501.8410.2942.291
21.811.501.8410.2472.292
31.781.501.8410.1212.298
41.781.501.8710.1052.301
51.771.501.8410.0502.305
Disclaimer/Publisher’s Note: The statements, opinions and data contained in all publications are solely those of the individual author(s) and contributor(s) and not of MDPI and/or the editor(s). MDPI and/or the editor(s) disclaim responsibility for any injury to people or property resulting from any ideas, methods, instructions or products referred to in the content.

