Abstract
For large ships and offshore vessels, structural safety is verified through whole-ship analysis using commercial software. In the case of general oil tankers, classification rules for structural strength evaluation are uniformly applied. Structural strength evaluation is mainly divided into the cargo hold, fore-end, and aft-end parts. For the structural design of a cargo ship, it is important to calculate the design load and determine the thickness and size of the structural member. Structural FEA (Finite Element Analysis) is performed on only the cargo hold range as recommended by the CSR (Common Structure Rule). There is no FE analysis recommendation for either the aft- or the fore-end area. Therefore, structural safety is carried out based on existing design experience and engineer judgment. With previous approaches, it is difficult to clarify the safety of the aft-end part according to external loads such as hull girder load and local pressure. Recently, local buckling damage cases have investigated the aft-end of the shuttle tanker. Although this is a good example, it can be recognized that it is necessary to improve the accuracy of prediction when estimating the structural safety at the aft-end part. In this study, a novel FE-based evaluation methodology about buckling damage is proposed. In order to conduct a structural strength verification based on FE analysis modeling, reasonable solutions for load conditions, boundary conditions, modeling methods, and evaluation criteria are presented. This result is expected to be helpful in examining the structural strength of the aft-end part of similar carriers in the future.
1. Introduction
The International Association of Classification Societies (IACS) has been applying the Consolidated Rules (Harmonized Common Structural Rule, HCSR), which supplement the previously separate Common Rules for Bandit Cargo Ships and Crude Oil Carriers, to meet the International Maritime Organization’s (IMO) Goal-Based Standard (GBS) recommendations. Several items have been improved or supplemented, but the biggest issue is the verification of structural design results via direct analysis. However, since the evaluation scope of structural analysis is limited to the cargo hold, the design of the bow and stern has been based on the shipbuilder’s performance. In particular, there are many factors that need to be clearly determined for the structural analysis-based approach due to the specificity of the shape and the discontinuity of the structure. In this study, a structural analysis modeling-based evaluation was conducted to identify the causes of buckling cases that occurred in the stern section during the operation of an oil tanker, and the verification of the process and results are also discussed. The previous studies related to this research are summarized as follows.
Cho and Song [1] fabricated a total of 21 stiffed-plate specimens and performed compressive strength tests to accurately determine the behavior after ultimate strength is achieved. The stiffeners had two cross-sectional properties: flat bar and angle bar. The experimental specimens had a minimum thickness of 1.86 mm to 2.13 mm; the initial deflection due to welding was measured by separating the plate and the stiffener and was applied to the numerical analysis. Several empirical coefficients were derived from the theoretical formula to predict the ultimate strength using regression analysis. In their study, an empirical formula that can calculate the ultimate strength of stiffened plates with angle bar stiffeners was proposed, and it was confirmed that it was in good agreement with the experimental results.
Oh et al. [2] performed a parametric nonlinear series analysis of buckling and ultimate strength under combined loading (hydrostatic and compressive loading) on curved plate structures, which are commonly used in carriers and offshore platforms. In order to consider the effect of initial deflection caused by welding or cutting, the Smith equation as a function of the slenderness ratio was applied. As the main result, the ultimate strength decreased as the slenderness ratio of the curved plate increased, and the increase in curvature was similar. However, at a certain curvature (60°), the ultimate strength tended to decrease due to secondary buckling in some conditions, but only in the case of small thickness. Throughout the study, the characteristics of the buckling and ultimate strength behavior of the curved plate were well explained.
Park et al. [3] analyzed the difference in buckling and ultimate strength behavior according to the numerical modeling method of hull reinforcement plates. The specifications used for modeling idealized the double bottom structure of a capesize-class bulk carrier. The initial deflection was applied to the plate and the stiffener, respectively, and the residual stress was not considered. The modeling methods were the plate stiffener combination (PSC) considering the effective width of the stiffener and the stiffener panel model (SPM), which is a combination of several stiffeners and panels, and nonlinear ultimate strength calculation was performed with the model range as a variable. The PSC modeling method tended to evaluate the final strength highly, and the behavior after the final strength changed rapidly. As a result of using SPM, the final strength distribution was constant even without considering the transverse frame effect, and the final strength decreased as the analysis range was increased. From the viewpoint of evaluating reasonable buckling and ultimate strength, it was argued that the SPM model method is appropriate, and that when using PSC, at least two transverse frames must be considered in the model to prevent overestimation of ultimate strength.
Jang and Cho [4] performed a sensitivity analysis according to three evaluation criteria provided by the Norwegian classification society in evaluating the buckling and ultimate strength of plates and stiffened plates. The evaluation criteria used are shipbuilding buckling criteria, offshore buckling criteria, and ultimate strength-based buckling evaluation criteria. In order to determine the structural dimensions of the stiffened plate, the design of experiments (DOEs) and the analysis of variance (ANOVA) were used, and the hull criterion and ultimate strength criterion were dominated by the thickness of the stiffened plate in determining the buckling load value regardless of the load condition. The evaluation result of the ultimate strength standard confirmed that the thickness can be optimized up to 2 mm compared to the hull standard.
Alashti and Ahmadi [5] developed a differential equation to calculate the buckling stress of a thin curved plate with a cylindrical shell structure or an arbitrary curve, and programmed it to calculate the stress change according to the variable change. The similarity of the result values was confirmed through comparative evaluation with the proposed theory and the existing empirical formula. In particular, the curve plate buckling stress evaluation formula of the Norwegian Register of Shipping (Det Norske Veritas, DNV) showed a lower buckling stress using a conservative safety factor compared to that of the American Register of Shipping (American Bureau of Shipping, ABS). For detailed verification of the theoretical solution, a comparison of thickness, length, and curvature was performed using the numerical analysis program, ANSYS, and it was found that the theoretical solution provided slightly higher results, but was in good overall agreement.
Radwan and Kovesdi [6] proposed a numerical design technique called the Geometric and Material Nonlinear Analysis (GMNIA) for designing steel buildings or bridges. This technique can be used to validate a reasonable numerical model for localized buckling in box section columns subjected to pure compression, and the aim of the study is to investigate the geometric deficiencies of Finite Element Analysis by applying the GMNIA computational approach and to compensate for them. In order to understand the influence of various variables, a numerical parametric study was conducted and an empirical formula to calculate the buckling resistance coefficient for box-shaped column structures was provided. The research results fully complement the improvements of the previously used winter empirical formula and the European Standard (EN) code, and can quickly derive a solution.
Jörg Rörup et al. [7] proposed the novel advanced whole-ship analysis (AWAS) system, which covers both traditional global Finite Element Analysis (FEA) and cargo hold analysis based on DNV requirement. In the case of AWAS, it is applied on the basis of an individual direct wave load analysis, instead of using accelerations and sea loads defined by rules. In terms of comparing mesh efficiency, AWAS significantly enhances both meshing time and quality compared to a standard coarse model, and this model shows a much better idealization of the structural member as well as an improved stress distribution. Consequently, with AWAS, it can be possible to reduce the modeling time compared to common global FEA software.
Rahman et al. [8] performed a numerical study using a simplistic whole-ship method with a hull measuring 80 m that is induced by a hull girder load. The wave crest is located in the midship of the hull, and loads are in hogging and sagging conditions in the ANSYS software. From the strength analysis results, the magnitude of stress and strain was obtained in the hogging condition. The ANSYS solutions indicate that for the first case, the load vs. stress moves linearly at the initial values but change direction at higher loads and finally becomes nonlinear. The stress developed due to hogging is much higher than that of sagging with the same loading of the vessel. Therefore, the designers are advised to be more careful in terms of handling the hogging analysis when designing a ship.
Hossein Nassiraei et al. [9] performed an FE analysis for steel collar plate-reinforced tubular T/Y joints. The FE results were verified by comparing with the experimental data. A total of 168 collar-plate FE models were analyzed against compressive load. Through parametric study, the authors thoroughly investigated the effect of plate size and joint geometry on the ultimate strength and failure mechanism of the joints. From the numerical results, collar plate-reinforced T/Y joints dramatically increase in ultimate strength by about 270% compared to when in an unreinforced condition. After the numerical test is completed, a new equation is proposed for determining the ultimate strength of collar plate-reinforced T/Y joints under axial compression.
Vahid Pourostad et al. [10] performed a detailed parametric study using a numerical model to assess the behavior of stiffened panels under transverse compression. It is a newly developed simplified procedure for determining the global reduction factor of plate buckling for transverse stresses. These findings offer significant insights into the design and safety evaluation of stiffened panels in structural engineering, particularly for modern bridge construction with large spans.
Bing Xu et al. [11] presented novel insights into the buckling behavior of steel tube side plates in rectangular concrete-filled steel tube (CSFT) columns under bi-axial loads. The study stands out for its comprehensive approach, encompassing theoretical analysis, experimental validation, and FEA. The findings include the influence of height/width ratios and nominal Poisson’s ratios on buckling forms and the distinctive bucking behavior under unidirectional and bidirectional stresses. This study contributes significantly to the understanding and design of CSFT columns in structural engineering.
Chen et al. [12] focused on analyzing the buckling behavior and strength of girders in passenger ships. Their study’s originality lies in its comprehensive approach, combining experimental and numerical methods to evaluate the performance of girders with different opening shapes, initial crack defects, and strengthening measures. The paper’s key contribution is the enhanced understanding of how these factors affect the structural integrity of plate girders in maritime applications, providing valuable insights for the design and safety of passenger ships.
Joynal Abedin et al. [13] presents an innovative approach to analyzing the structural strength of multi-cargo ships. It focuses on the impact of combined bending and torsional loads on a ship’s structure, using a detailed 3D FEA model. The originality lies in its comprehensive evaluation of hull girder stresses under various loading conditions, including the influence of torsion on open-deck and closed-deck ships. The study contributes to the field by providing new insights into the structural integrity and buckling behavior of ship components under complex loading scenarios, which is crucial for the safety and design of marine vessels.
In this study, the procedure for identifying the buckling phenomenon that tends to occur in the aft-end panel of an oil tanker via FEA is presented, and the verification of the result is mentioned. Existing studies have been analyzed with regard to the buckling and ultimate strength of a conventional longitudinal strength cargo hold structure. The differences from the previous studies are as follows:
- -
- Load combinations and analysis procedures were specified to determine the cause of buckling damage that occurred on ships in operation.
- -
- Due to the diversity of modeling, load conversion and correction work were emphasized, and essential processes were introduced.
- -
- An eigenvalue buckling analysis method that engineers can easily access was used, and the initial deflection effect was expressed as a deformation of the node in the determined mode.
- -
- Although the nonlinearity of the material was not considered, similarity in trend was confirmed when compared with the DNV analysis results.
2. Tanker Structural Design
2.1. Main Specification and GA (General Arrangement)
The main specifications of the vessels used in the study are shown in Table 1 and the three-dimensional analysis model is shown Figure 1.

Table 1.
Principal dimensions of the shuttle tanker.
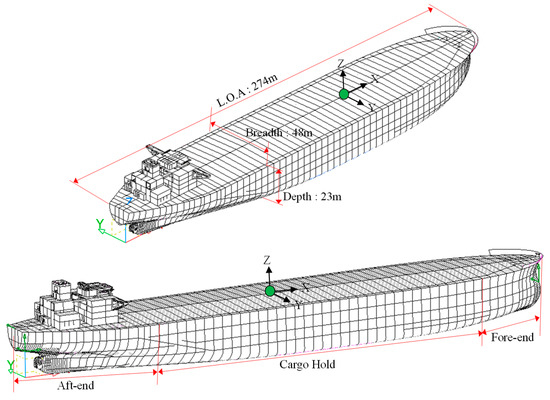
Figure 1.
Principal dimension and definition of structural category in the tanker.
The oil tanker, which is a research subject, can be divided into a cargo hold area that occupies more than 70% of the total length of the ship and a stern area, including the bow and engine room. It is expressed in Figure 1. The tanker is generally composed of 4 cargo holds, a pair of slop tanks and 8 ballast tanks. The center bulkhead is located in the center of the cargo hold, and except for some sections (No. 1 and No. 4), the size of the main structural members is determined and arranged similarly. The CSR is a rule developed by technical experts of the IACS; it is mandatory for bulk carriers of 90 m or more and crude oil carriers of 150 m or more to be built after 1 July 2015. The CSR improves the existing buckling strength evaluation method by adding the evaluation of stiffeners. This enables more accurate strength evaluation. Buckling behavior is a phenomenon in which a structure is damaged while lateral displacement occurs when a compressive load is applied. It is an important evaluation item in structural design. Each classification has developed and is using its own assessment program, enabling rule-based computational structural design to be accurate and to complete in a short time.
2.2. Characteristics of Structural Design for the Stern Part
The structural design of the cargo hold is typically optimized by arranging appropriate members using the minimum thickness, arrangement width, and minimum required section modulus of the stiffeners specified by the classification society. However, the stern part is difficult to apply standardized structural design due to the location of the main engine and major equipment as well as the specificity of the stern shape. In particular, the stern structure caution is needed because the arrangement of structural members is a combination of longitudinal and transverse members, and it is an area dominated by local loads.
3. Finite Element Analysis and Discussion
3.1. Modeling, Boundaries and Loading Conditions
In this study, a commercial engineering analysis software, MSC Patran/Nastran Version 2012 [14], was used based on the FEA. The modeling of the plate component was conducted using two-dimensional shell elements with four nodes, and the stiffener was modeled using one-dimensional beam elements with two nodes. To accurately simulate the buckling behavior under compressive load, the element division size was adjusted in the range of 20 mm to 40 mm. The analysis consisted of a total of 225,521 FEA elements and 518,698 nodes. To simulate the buckling phenomenon caused by compression loads, the buckling evaluation area was modeled only with shell elements. Table 2 indicates the mechanical properties of the structural member and the weld metal used for analysis modeling. Table 3 summarizes the nominal values of the chemical composition as defined by the mill certification of a steel provider.
Table 2.
Mechanical properties of the structural members and weld metal.
Table 3.
Chemical composition of weld metal (%).
All the main longitudinal and transverse structural elements are modeled, i.e., inner and outer shells, double bottom floor and girder system, transverse and vertical web frames and transverse and longitudinal bulkhead structures. All plates and stiffeners on the structures, including web stiffeners, are also modeled. Shell elements are used in the plates. All stiffeners are modeled with beam elements that have axial, torsional, bidirectional shear and bending stiffness. The eccentricity of the neutral axis is considered. The use of triangular shell elements is kept to a minimum. Where possible, the aspect ratio of shell elements in the area where there are likely to be high stresses or a high stress gradient is kept close to 1.0. Noncontinuous stiffeners are modeled as continuous stiffeners. Web stiffeners of primary supporting members are modeled. Where these stiffeners are not in line with the primary FE mesh, the line element is placed along the nearby nodal points following modeling requirements. Buckling stiffeners on large brackets, deck transverse and stringers parallel to the flange are modeled. The method of representing openings and manholes in the way of primary supporting members follows the modeling requirements in CSR (2021) [15]. Shell elements are used for all plating within the fine mesh area and the aspect ratio of the elements is kept at 1.0 as much as possible. Stiffeners inside the fine mesh area are modeled by using shell elements; note that stiffeners outside the fine mesh area are modeled as beam elements.
As shown in Figure 2, the boundary conditions of the analysis were set by fixing the bulkhead plane at the boundary point of the 4th cargo hold and the slop tank (x, y, and z: fix). The loads used are the two bending moments (hogging and sagging) calculated in CSR and the design sump pressure. S.W.B.M (still water bending moment) compares between the rule and trim and stability value, and applies the larger value. V.W.B.M (vertical wave bending moment) is calculated by applying various coefficients specified in the rules, and the total moment is calculated using these two values to automatically create a load in the analysis model as specified in Equation (1). Since this value may be smaller or larger than the target load, the moment value must be adjusted except for the distributed pressure acting on the shell plate.
where S.W.B.M is the still water bending moment and V.W.B.M is the vertical wave bending moment by the CSR.
where is the coefficient considering nonlinear effects applied to hogging, to be taken as 1.0 for strength and fatigue assessment; is the coefficient considering nonlinear effects applied to sagging, to be taken as 0.58; is the coefficient to be taken as ; is the distribution factor for vertical wave bending moment along the ship’s length, to be taken as ; and is the coefficient for strength assessment, which is dependent on the applicable design load scenario specified in the CSR, where for extreme sea loads design load scenario, 0.8 for the ballast water exchange design load, and 0.4 for the harbor/sheltered water design load.
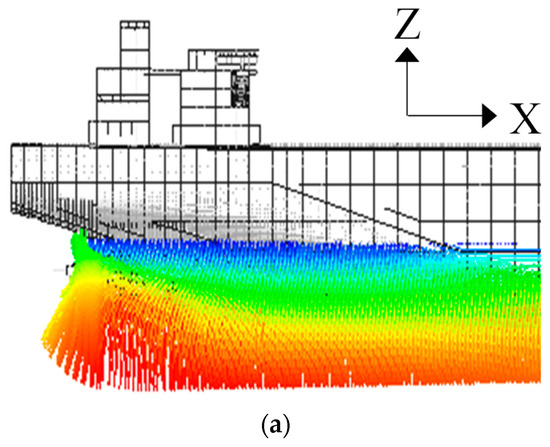
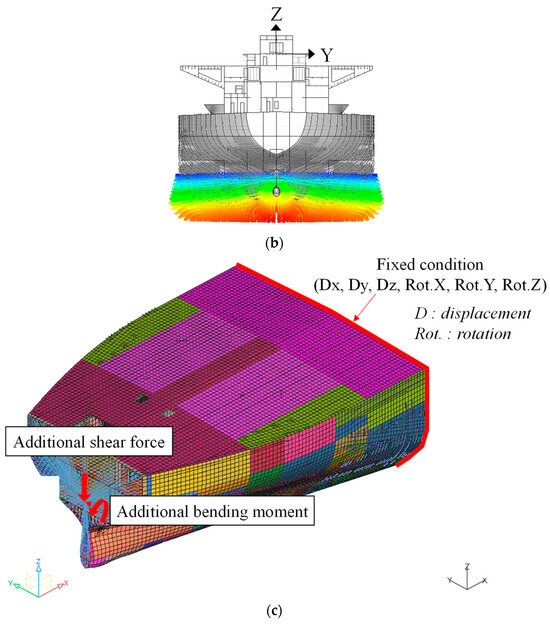
Figure 2.
Analysis modeling, boundary condition and load (pressure and moment): (a) sea pressure distribution (elevation view), (b) sea pressure distribution (front view), (c) additional load and boundary condition.
The bending moments should be applied in the section where the stiffness of the structural member is secured. If the load is applied at the weakest structural stiffness, such as the end of void tank, only localized stress concentrations occur without any continuous behavior. As there is no internal ballast tank in the FWD section, internal pressure was not considered. The basic draft of an operating ship is determined according to the ship’s loading conditions, and the dynamic draft is automatically calculated according to classification regulations. Figure 2a shows the sea pressure distribution on the side shell to the ship length, and Figure 2b is the same pressure gradient from the front view based on the aft-end. Although the influence of this load is minimal, it is essential to be considered in order to depict real situations. Among the calculated load values, the bending moment may be applied larger or smaller than the actual value to be applied during analysis modeling-based evaluation. This difference is due to the model stiffness implemented in modeling. In this study, the correction of the bending moment was performed to accurately reflect this difference, as shown Figure 2c. From the beam theory, it was programmed to automatically correct at the desired location. A fixed condition was imposed at the point where the cargo hold bulkhead is in the FWD section, as shown Figure 2c. It was a well-implemented global deformation induced by waves.
Due to differences in the weight and buoyancy, shear load and bending moment distribution occur in the FEA model. The envelope is selected based on the maximum value of the longitudinal strength calculation used in structural design, and that value is determined as the target value. In order to meet the target value of the analysis model, the shear load is applied to the vertical direction of the model’s bulkhead and the shear force diagram is adjusted. Second, an additional bending moment is applied to the aft-end bulkhead to adjust the slope of the bending moment diagram. It is automatically calculated until the value most similar to the target value is found and compared to the stress of the main structure identified, compared to the longitudinal strength calculation, as shown Figure 3.
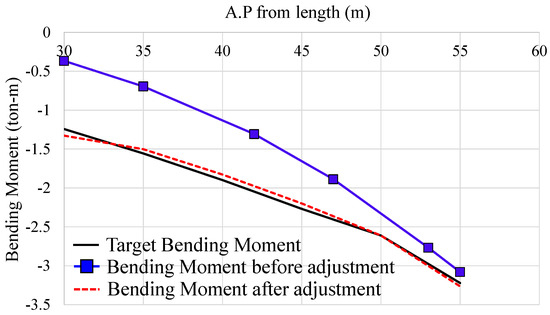
Figure 3.
Load adjustment of the hull girder bending.
3.2. Process of Buckling Evaluation
Numerical FE simulation was used to identify the root causes of the buckling damage at the aft-end area. The eigen buckling analysis predicts the theoretical buckling strength of a plate based on elastic foundation. After the boundary and load conditions are defined, eigen values are calculated. The structural safety review of the aft-end must evaluate the yield strength and follow the procedure indicated in Figure 4a. When the FE modeling is finished, the boundary and load conditions suggested by the CSR are applied. At this time, the task of matching the target load value mentioned above is performed, and if the difference is within 5%, the analysis result is accepted. Second, the procedure for reviewing buckling safety is shown in Figure 4b. The review can be conducted through linear buckling analysis. In general, the collapse behavior according to load changes is confirmed through ultimate strength analysis reflected by the nonlinearity of the material. However, it is difficult to assume the combination and magnitude of loads under actual damaged conditions during a ship’s operation. Therefore, this study proposed a procedure that allows for a quick and accurate evaluation at the eigenvalue analysis stage. The problem with this analysis method is in defining the buckling mode and in considering the nonlinearity of the material. Since the aft-end part uses relatively thin plates, it was judged that geometric nonlinearity could be given more important than material nonlinearity.
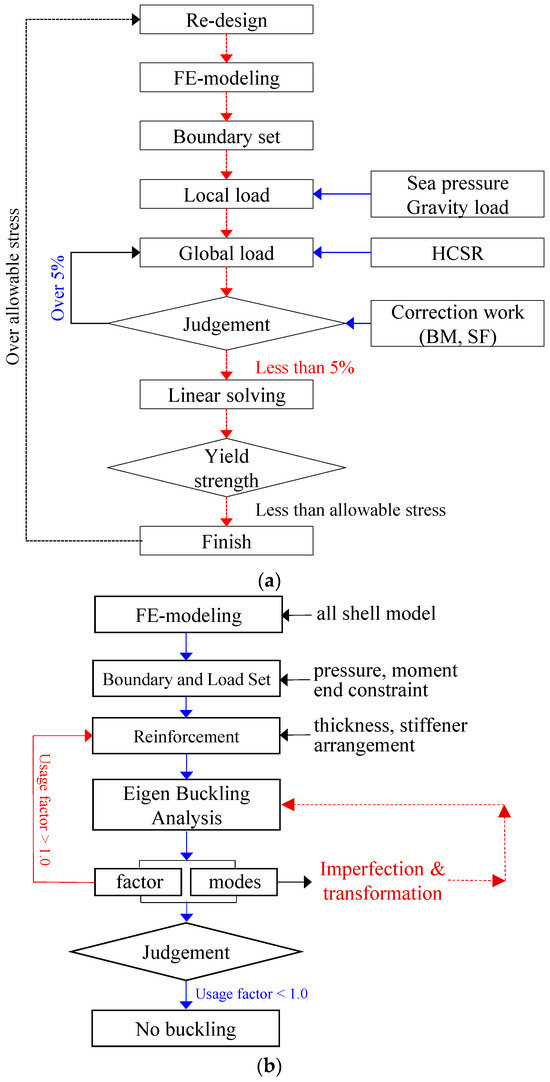
Figure 4.
Analysis flowchart of between yielding and buckling analysis: (a) yielding check, (b) buckling analysis.
When performing buckling analysis, buckling coefficients and modes are generated. In this study, 25 buckling modes were examined to find the shape most similar to actual damage. Once the most similar mode is determined, the size of the initial deflection is entered into the shape to change the model shape itself, and when an additional load is applied, it is recognized as the initial deflection and shows a response, as indicated Figure 4b. This method is differentiated from the method of viewing the initial deflection effect implemented in existing eigenvalue buckling analysis.
3.3. Buckling Evaluation and Strength Analysis of Stern
In order to ensure sufficient safety in the design against various external and internal forces that occur during the operation of a ship, classification societies provide complex load combinations. However, cases of local buckling damage and weld cracking continue to be reported. In this study, the location and shape of the buckling damage which occurred in the web panel of the stern part are shown in Figure 5a, and the cause of the buckling damage is analyzed via numerical analysis. The length of the panel is 4000 mm, the width is 815 mm, the plate thickness is 9 mm, and the buckled panel contains three longitudinal stiffeners. The location where severe buckling was observed corresponds to the stiffened plate located between frames 36 and 41, as shown Figure 5a. The longitudinal stiffeners did not buckle due to the transverse compressive load. However, the effective plate between the stiffeners buckled in the width direction of the plate, as indicated in Figure 5b. Generally, this type of damage is observed when the buckling stiffness of the plate is weaker than that of the stiffener.
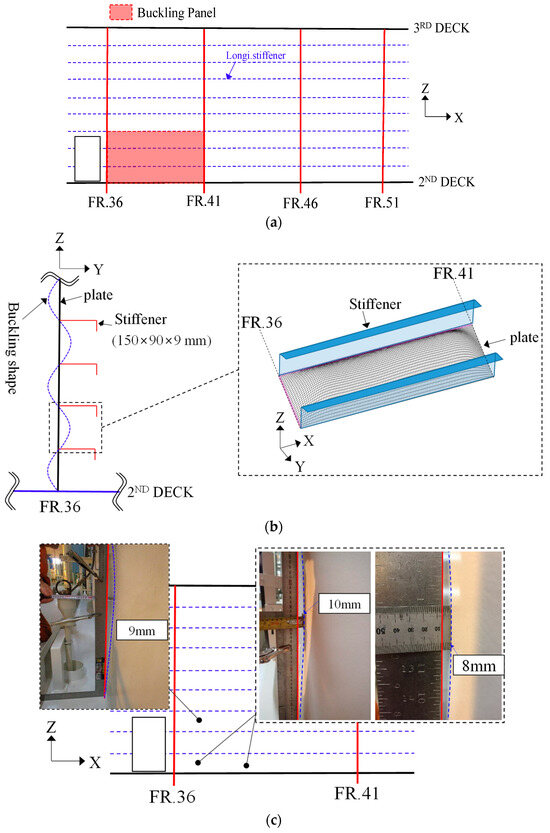
Figure 5.
Example of the buckling damage at the panel around the aft-end: (a) actual location of buckling damage, (b) buckling shape, and (c) actual measurement at buckling location.
Figure 5c shows a measured photograph of the location where the maximum deflection occurred in the plate with actual buckling damage. There was a lot of buckling damage and large deflection in the plate that met 2ND DECK. The reason is that 2ND DECK, which has relatively high buckling rigidity due to the transverse compressive load, exhibited a boundary condition effect.
As designed, the longitudinal stiffener has a web height of 150 mm, a flange width of 90 mm, and a thickness of 9 mm, and all steel materials are high tensile steel (Yield stress 355 MPa). As for the dimensionless slenderness ratio of the angle bar, it is 16.6 in ratio for both height and thickness of web. The study adopts the element size of 50 mm, as suggested by the HCSR [15], and this standard is used as a standard for numerical modeling when evaluating the structural strength of ships and offshore projects. Only the panels between FR. 36 and 41 investigated buckling damage, but the large opening on the left side of FR. 36 may have contributed to the relatively weak buckling stiffness when subjected to compressive loads in the width direction. The verification area for buckling damage is between FR. 36 and 41. Therefore, the mesh size is large except for this area. The actual location of buckling in the aft-end panel was measured. Buckling deformation of up to 10 mm occurred in the panel between the first layered stiffener on the upper part of the second deck, and the buckling shape was equal to one sine half-wave number. When analyzing the buckling shape, it can be expected that the compressive load was applied in the vertical direction and was significantly greater than other load components such as transverse compression and in-plane shear load. Among the load combinations as mentioned before, the bending moment generates the highest compressive stress under hogging conditions, and the von Mises stress under this condition is shown in Figure 6. The stress distribution of the panel from FR. 36 to 41 where damage occurred due to buckling is shown in Figure 6. If evaluated only by the von Mises stress, it satisfies the allowable stress (301 MPa). The allowable stress is the yield strength multiplied by a safety factor of 0.85.
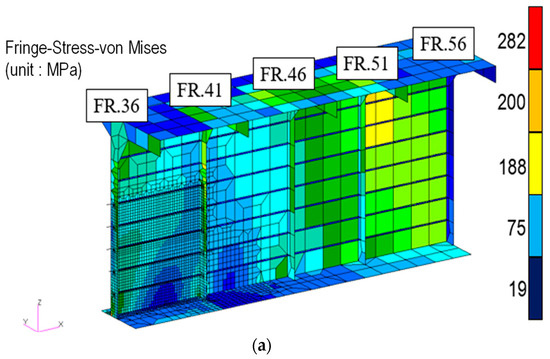
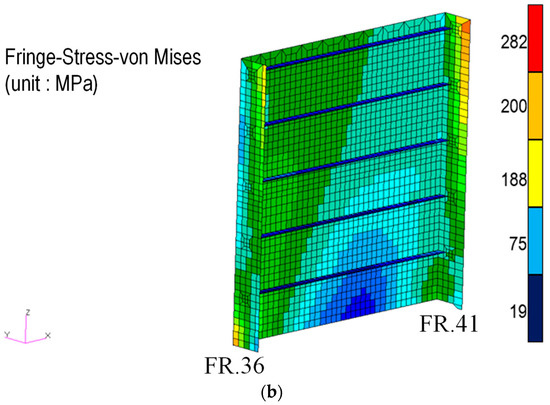
Figure 6.
The von Mises stress at the critical panel in the aft-end structure: (a) stress contour from FR. 36 to FR. 51; (b) stress contour from FR. 36 to FR. 41.
Figure 7 shows the results of performing eigenvalue buckling analysis through a detailed modeling of the panel where buckling occurred. Figure 7 shows the results of the two modes most similar to actual buckling damage through eigenvalue analysis. Figure 7a shows a sine half-wave number shape in the width direction of the plate, and mode number 52 is the result of local buckling occurring in a part of the bottom plate. The reasonable buckling mode was judged to be mode number 25, and it was basically used in the subsequent analysis. The buckling shape occurred in the panel’s width direction, where compression load acted and buckling occurred in the plate between the stiffeners. The location where buckling can occur is similar to the actual phenomenon. The buckling coefficient is 0.84, which is less than the permissible value of 1.00, so no buckling occurs under the considered load.
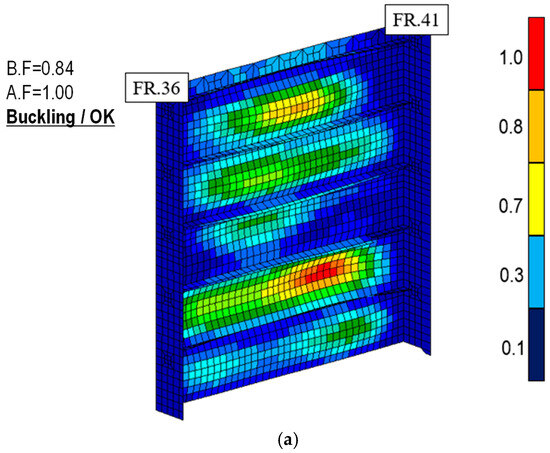
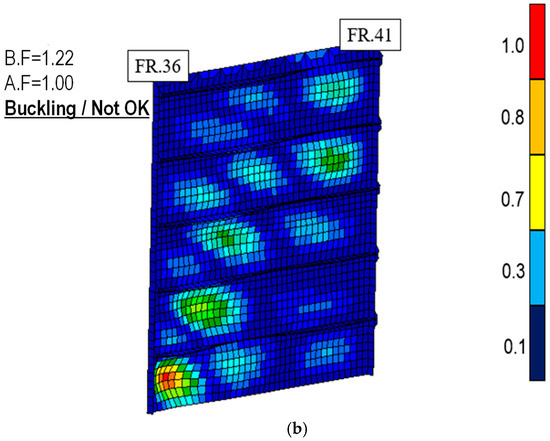
Figure 7.
Results of the buckling factor as well as buckled shape around the critical panel: (a) buckling mode number 25; (b) buckling mode number 52.
When calculating the buckling strength of panels according to the CSR, the evaluation considers the prescribed safety factors for each load condition. However, it does not consider the influence of initial deflection of the plate due to welding or cutting during block assembly work. Especially in thin plates, the actual buckling strength and ultimate strength may be significantly reduced due to initial deformation and residual stresses caused by thermal loads (Paik and Thayamballi [16]). The steel material that makes up the stiffeners is welded so that minimal initial deformation remains during the production process of assembly and mounting. The allowable initial deflection in the stiffening plate (IACS [17]) is 4 mm, and it is adopted by most ship yards. Table 4 shows the change in the buckling factor if the stern thin panel was subjected to an initial deflection of 4 mm, the maximum allowable deflection.
Table 4.
Summary of buckling factor’s varying magnitude of the imperfection calculated using MSC Nastran 2018 (Adapted from Ref. [18]).
Assuming an initial deflection of 4.0 mm, the buckling coefficient was 16% greater than the acceptance criteria, indicating the need for reinforcement. To increase the vertical load sharing ratio while minimizing weight, carling stiffeners were added to four sections with two lines of reinforcement. The reinforcement result secured a 16% margin from the initial design condition, even considering the initial deflection of 4.0 mm, and the results can be seen in Figure 8. As a result of the reinforcement, the buckling area was reduced locally and the probability of occurrence decreased.
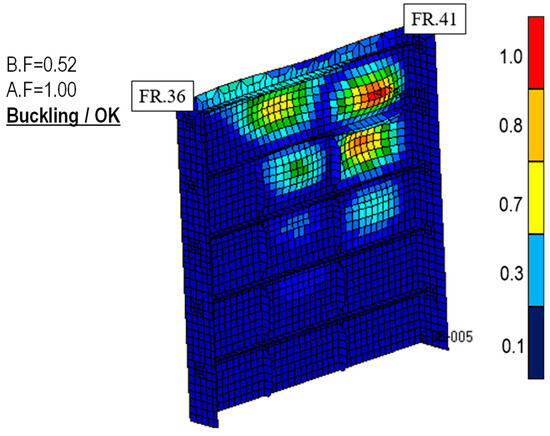
Figure 8.
Results of buckling factor and shape with carling reinforcement.
The DNV PULS (Panel Ultimate Limit State) is a computational buckling that allows users to easily calculate the buckling strength and ultimate strength of a plate using a fit condition expression based on the fourth-order differential equation of the plate. In particular, it is possible to evaluate the buckling strength by considering the initial deflection inevitably caused by welding, and the effect of various load combinations can be evaluated in a short time. A panel consisting of three potentially buckling stiffeners and a plate, with a length of 4000 mm, was analyzed using the DNV PULS. Without considering the initial deflection, the buckling factor was 0.8, and the buckling deformation shape is shown in Figure 9.
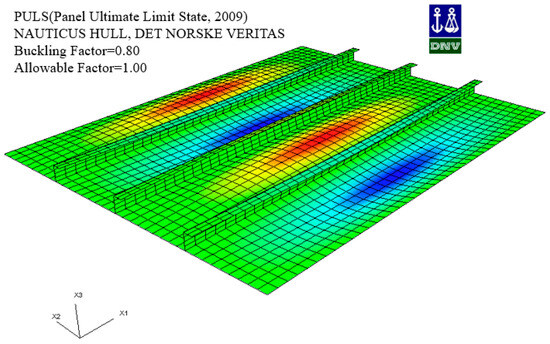
Figure 9.
Results of the buckling shape of the initial panel by DNV PULS (Det Norske Veritas, Adapted from Ref. [19]).
The result of the analysis, considering an initial deflection of 4 mm, is 1.03, which is evaluated to be 3% higher than the allowable standard, and the buckling mode is shown in Figure 10. If the same reinforcement is applied, even if the amount of initial deflection is considered up to 5.5 mm, the buckling strength is satisfied. The change of buckling coefficient according to the condition is shown in Table 5 and Figure 11.
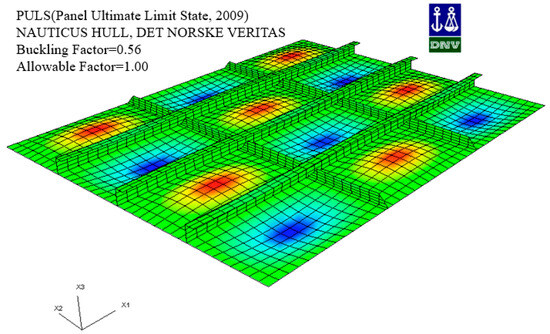
Figure 10.
Results of the buckling shape with carling reinforcement by DNV PULS (Det Norske Veritas, Adapted from Ref. [19]).
Table 5.
Summary of buckling factor’s varying magnitude of the imperfection calculated by DNV PULS.
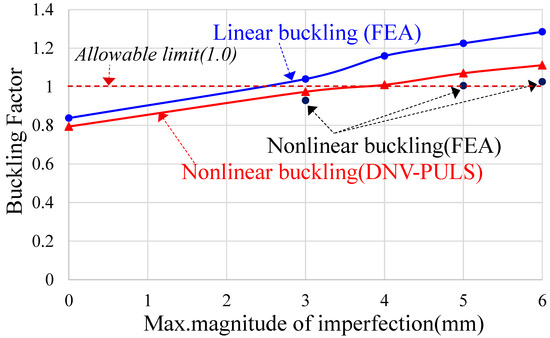
Figure 11.
A comparison of the buckling factor’s varying magnitude of the imperfection for original panel.
Compared to the linear-based buckling factor evaluation method, the limit state design method predicted more conservative results as the initial deflection increased, but the difference was not significant. The DNV PULS is not an analytical modeling-based evaluation program; it has the advantage of calculating the buckling and ultimate strength and the optimal reinforcement effect, so it can be applied to the situation to make quick decisions.
Figure 11 shows the buckling factor results according to magnitude of the initial imperfection at the critical panel where buckling occurred. The numerical analysis results show a tendency to evaluate larger values than the DNV PULS, and the buckling strength is not satisfied over the initial imperfection of 3 mm. DNV PULS allows users to add initial imperfection and residual stress to take into account for nonlinear effects. Nonlinear buckling analysis was performed using constrained force on the effective plate model between stiffeners, and the maximum values of initial imperfection of 3 mm, 5 mm, and 6 mm were compared, as indicated Figure 12. This analysis result shows the lowest buckling factor, and is believed to be influenced by differences in the initial buckling mode. As the size of the initial deflection increases, the deflection at both ends increases while the central part decreases, and the difference is not large, as shown Figure 12.
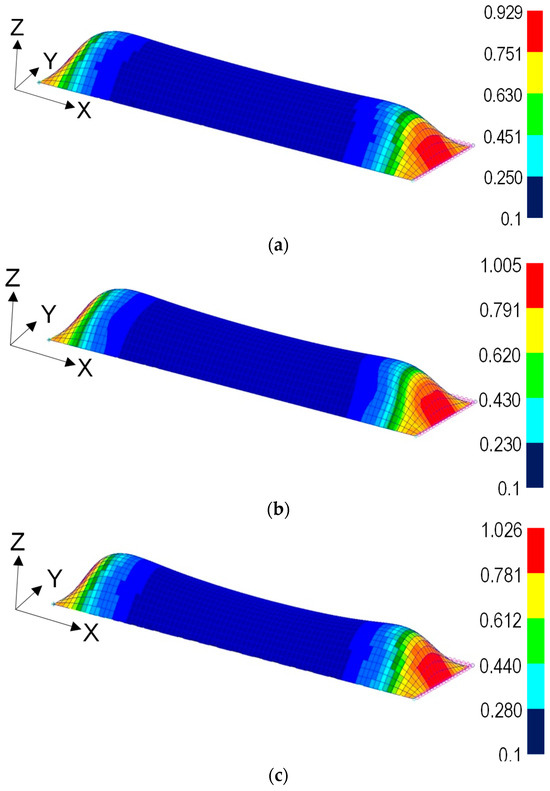
Figure 12.
Collapse mode of the single-plate varying magnitude of imperfection under transverse compression: (a) initial imperfection = 3 mm; (b) initial imperfection = 5 mm; (c) initial imperfection = 6 mm.
The buckling factor results for the case of carling reinforcement are shown in Figure 13. The FE analysis results show lower values than DNV PULS, and the difference is smaller than that in Figure 11. The buckling factor can be lowered by reinforcing the reinforcement without changing the plate thickness, and it has been proven to be safe, even when considering an initial deflection of 6.0 mm.
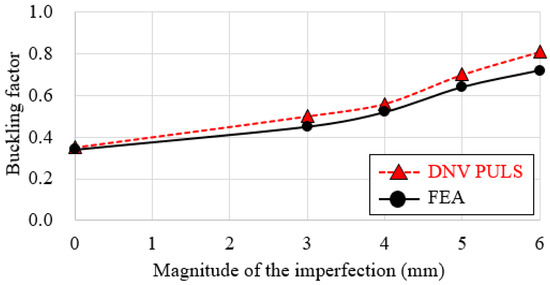
Figure 13.
A comparison of the buckling factor’s varying magnitude of the imperfection for reinforced carling stiffener.
4. Concluding Remarks
The specialization of structural design standards and evaluation methods has led to the development and application of the Common Structural Rule (CSR). However, the detailed regulations are limited to the cargo hold area, which is subject to significant longitudinal loads. There are no specific FE evaluation guidelines for the fore-end and aft-end structures. The structural design of the mentioned areas relies on the design experience of the engineer, and the lack of clear standards from the classification society makes it difficult to identify the underlying cause of structural damage. This study presents an engineering-based solution to identify the root cause of buckling damage, which mainly occurs in the aft-end structure. In order to verify the structural strength based on FEA modeling, a rational solution for loading conditions, boundary conditions, modeling methods and evaluation criteria is presented. The conclusions drawn from the study are as follows:
- (1)
- When evaluating the buckling strength of a panel, even if the allowable criteria are met, there may be cases where buckling occurs during ship operation. One factor that can cause such damage is the initial deflection generated from welding.
- (2)
- As the magnitude of the initial deflection increases, it results in a higher evaluation of the hogging coefficient, which decreases the safety factor.
- (3)
- The initial deflection effect can be possible to develop as a deformation of the node based on determined buckling mode. The determined buckling mode has the probability most similar to the collapsed shape.
- (4)
- In the FEA of the structure of the bow section, careful consideration should be given when determining boundary conditions and load application points, especially at locations with bulkheads. This is an important issue for implementing continuous behavior when the bow section experiences bending moments.
- (5)
- Due to the response patterns of the analysis, modeling-based FEA and the limit state design-based PULS were similar, but the results of FEA showed a more conservative tendency under carling reinforcement.
- (6)
- In the case of analyzing using FE analysis modeling, load adjustments must be made to implement the maximum value identified in the longitudinal strength calculation, and this process plays an important role in determining the reliability of the analysis results.
- (7)
- The carling stiffener was added to change the buckling aspect ratio because the compressive load acts greatly in the width direction of the panel. This method is an efficient method to increase buckling safety without increasing the plate thickness.
- (8)
- As the magnitude of the initial imperfection increases, the buckling factor also increases. When conducting the buckling design of thin plates, it is necessary to secure a sufficient factor of safety under the assumption with imperfection by welding.
As a future research direction, it is necessary to establish a database of analysis-based data considering various types of structures, positions and loading patterns to provide engineers with reliable criteria for decision making, including the effect of reinforcing structures. This study proposes a fundamental investigation into the cause of panel buckling damage and suggests relevant engineering procedures.
Author Contributions
Conceptualization, J.-S.P.; methodology, J.-S.P. and M.-S.Y.; data curation, M.-S.Y.; writing—original draft preparation, J.-S.P.; writing—review and editing, M.-S.Y. All authors have read and agreed to the published version of the manuscript.
Funding
This research was supported by “Regional Innovation Strategy (RIS)” through the National Research Foundation of Korea (NRF) funded by the Ministry of Education (MOE) (2021RIS-002).
Data Availability Statement
The raw data supporting the conclusions of this article will be made available by the authors on request.
Conflicts of Interest
Author Joo-Shin Park was employed by the company Ship & Offshore Research Institute, Samsung Heavy Industries Co., Ltd. The remaining authors declare that the research was conducted in the absence of any commercial or financial relationships that could be construed as a potential conflict of interest.
References
- Cho, S.R.; Song, I.C. Experimental Investigation on the Ultimate and Post-Ultimate Strength of Stiffened Plates under Axial Compression. J. Ship Ocean Technol. 2003, 7, 1–12. [Google Scholar]
- Oh, Y.C.; Ko, J.Y.; Lee, K.W. A Study on the Buckling and Ultimate Strength for Cylindrically Curved Plate subjected to Combined Load. In Proceedings of the Korean Institute of Navigation and Port Research Conference, Busan, Republic of Korea, 5–6 December 2007; Korean Institute of Navigation and Port Research: Busan, Republic of Korea; pp. 25–26. [Google Scholar]
- Park, J.S.; Ko, J.Y.; Oh, Y.C. Estimation of Buckling and Plastic Behaviour according to the Analysis Model of the Stiffened Plate. J. Korean Navig. Port Res. 2007, 31, 271–279. [Google Scholar]
- Jang, B.S.; Cho, H.Y. Comparison of Buckling Check Formulas and Optimal Design. J. Ocean Eng. Technol. 2009, 23, 71–78. [Google Scholar]
- Alashti, R.A.; Ahmadi, S.A. Buckling Analysis of Panels and Comparative Study on ABS and DNV Rules. Int. J. Marit. Technol. 2014, 2, 67–74. [Google Scholar]
- Radwan, M.; Kovesdi, B. Equivalent Geometric Imperfections for Local Buckling of Slender Box-section Columns. Period. Polytech. Civ. Eng. 2021, 65, 1279–1287. [Google Scholar] [CrossRef]
- Rörup, J.; Maciolowski, B.; Darie, I. FE-Based Strength Analysis of Ship Structures for a more Advanced Class Approval. In Proceedings of the PRADS2016, Copenhagen, Denmark, 4–8 September 2016; pp. 12–20. [Google Scholar]
- Rahman, M.M.; Kamol, R.S.; Islam, R. Structural Analysis of a Ship on Global Aspect using ANSYS. In Proceedings of the AIP Conference Proceedings; AIP Publishing: Long Island, NY, USA, 2017; pp. 1–9. [Google Scholar]
- Nassiraei, H.; Lotfollahi-Yaghin, M.A.; Ahmadi, H. Static strength of collar plate reinforced tubular T/Y-joints under brace compressive loading. J. Constr. Steel Res. 2016, 119, 39–49. [Google Scholar] [CrossRef]
- Pourostad, V.; Kuhlmann, U. Buckling resistance of stiffened panels subjected to constant transverse compression stresses. Proc. Civ. Eng. 2023, 6, 1799–1804. [Google Scholar] [CrossRef]
- Xu, B.; Wang, L.; Xiang, C.; Hand, Z. Analysis of Buckling Deformation for the Side Plate of Rectangular CSFT Column Based on Plate Theory with Bi-Axial Loads. Buildings 2022, 12, 626. [Google Scholar] [CrossRef]
- Chen, C.; Zhou, H.; Lv, Z.; Ge, X.; Xu, X. Experimental and Numerical Investigation of the Buckling Behaviour and Strength of Combined Opening Plate Girders in Passenger Ships. Metals 2023, 13, 1256. [Google Scholar] [CrossRef]
- Abedin, J.; Franklin, F.; Mahmud, S.I. Linear Longitudinal Strength Analysis of a Multipurpose Cargo Ship under Combined Bending and Torsional Load. J. Mar. Sci. Eng. 2024, 12, 59. [Google Scholar] [CrossRef]
- MSC Software. Patran 2012 User’s Guide; Chapter 6; Material Modeling: San Bruno, CA, USA, 2012; pp. 125–136. [Google Scholar]
- Common Structural Rules (CSR BC & OT). Section 3-Local Strength Analysis; Part 1, General Hull Requirement, Mesh Size; ICAS Req.: Hamburg, Germany, 2021; pp. 444–454. [Google Scholar]
- Paik, J.K.; Thayamballi, A.K. Ultimate Limit State Design of Steel-Plated Structures, 1st ed.; John Wiley & Sons, Ltd.: Hoboken, NJ, USA, 2003. [Google Scholar]
- International Association of Classification Societies (IACS). Shipbuilding and Remedial Quality Standard for New Construction; No.47 Ship Building and Repair Quality Standard; IACS Req.: Hamburg, Germany, 2012; pp. 6–14. [Google Scholar]
- HEXAGON. MSC Nastran 2018-Nonlinear (SOL 400) User’s Guide, Sec. 3, Nonlinear Option and Application; HEXAGON: Stockholm, Sweden, 2018; pp. 35–38. [Google Scholar]
- Det Norske Veritas (DNV). Nauticus Hull User Manual-Puls; Sec.3-Stiffened Plate Element; DNV: Oslo, Norway, 2006; pp. 23–41. [Google Scholar]
Disclaimer/Publisher’s Note: The statements, opinions and data contained in all publications are solely those of the individual author(s) and contributor(s) and not of MDPI and/or the editor(s). MDPI and/or the editor(s) disclaim responsibility for any injury to people or property resulting from any ideas, methods, instructions or products referred to in the content. |
© 2024 by the authors. Licensee MDPI, Basel, Switzerland. This article is an open access article distributed under the terms and conditions of the Creative Commons Attribution (CC BY) license (https://creativecommons.org/licenses/by/4.0/).