Abstract
The electrolytic refining of crude tin is generally carried out in the fluorosilicic acid (H2SiF6) system with the assistance of bone glue and β-naphthol. However, the high saturated vapor pressure and low stability of H2SiF6 present environmental concerns and do not align with sustainable development goals. In this paper, the electrochemical behavior of tin on a glassy carbon (GC) electrode was studied in a relatively green and environmentally friendly methanesulfonic acid (MSA) system. Bone glue, sodium lignosulfonate, and β-naphthol were used as additives to make the deposit morphology smooth and to ensure grain refinement. The electrochemical reduction process of Sn2+ in an MSA system is a quasi-reversible process controlled by diffusion. The apparent activation energy = 14.189 kJ/mol for the ion diffusion of Sn2+ was further calculated. The results of chronoamperometry showed that the electrocrystallization of Sn2+ on the GC electrode gradually tended to three-dimensional instantaneous nucleation with the increase in applied potential. The morphology and phase of the deposits were analyzed using scanning electron microscopy (SEM) and X-ray diffraction (XRD). The results showed that the deposits were uniform and dense pure tin. This work elucidates the electrochemical behavior of tin in a methanesulfonic acid system.
1. Introduction
Tin plays a significant role in daily life and is a key component of the materials and chemical industries because of its merits associated with being a ductile, low-melting-point, and corrosion-resistant metal [1,2,3,4]. In addition, pure tin and its alloys have a wide range of applications in metal coating, tin plating, piping, tin nanowires, and tin nano solder [5,6,7]. Additionally, tin has received significantly increasing attention as an anode material for lithium-ion and sodium-ion batteries due to its high specific capacity and energy density [8]. Tin also plays an important role in catalysis. Recently, electrochemically deposited 3D metal tin has been used as a catalyst in green hydrogen production [9] and CO2 reduction [10,11,12,13]. Generally speaking, tin is an indispensable element in production and daily life. As the technological development trend of green, energy-saving, and sustainable metallurgical construction is becoming more and more obvious, there is an urgent need to develop a method of green production of tin and put it into practical usage [14].
Electrodeposition is the basis of the metal electrolytic refining process, and the electrolyte system of tin electrodeposition can be alkaline or acidic. Compared with alkaline media, an acidic bath can provide a faster deposition rate at ambient temperature to achieve the operating parameters and some of the physical properties required for deposition. The acidic electrolytes include sulfate, fluoroborate, fluorosilicate, and methanesulfonate aqueous solutions. A sulfate electrolyte is usually used as the first choice for electroplating electrolytes due to its low cost. Fluoroborate is used when high current density is required. Fluorosilicate is widely used in industrial applications. However, due to the high volatility and low stability of fluorosilicic acid (H2SiF6), it decomposes easily and results in significant corrosion of the equipment, which causes an increase in cell voltage. Additionally, the electrolytic refining of the H2SiF6 system is prone to producing toxic gases, which have a certain burden on the environment and create a poor working environment. To the best of our knowledge, methanesulfonic acid (MSA) is an effective organic acid known for its low toxicity, low volatility, high stability, conductivity, and convenient waste liquid management [15,16]. Compared with other electrolytes, MSA is an ideal medium in hydrometallurgy [17]. Under normal conditions, MSA aqueous solutions do not release dangerous volatile chemicals, which is beneficial to their storage, transportation, and treatment in laboratory and industrial process environments [18]. Therefore, the electrolyte of methanesulfonate usually attracts more researchers due to its relatively green environmental protection [19].
Recently, MSA electrolyte has been widely used in metal electrodeposition processes, including those using bismuth, lead, and cobalt. Chang et al. [20] used MSA as a bismuth hydrometallurgical system, and proposed a membrane electrochemical deposition method to extract metal bismuth from bismuth-containing solutions. The effects of different process parameters such as calcium lignosulfonate, tetrabutylammonium chloride, β-naphthol, and lugalvan NES on the morphology and power consumption of bismuth coatings were investigated. In addition, the electrochemical behavior of bismuth deposition in an additive-assisted MSA medium was revealed using cyclic voltammetry and chronoamperometry. Kong et al. [21] studied the effects of pH and cobalt concentration in an MSA system on the nucleation and growth of cobalt on a glassy carbon (GC) electrode via cyclic voltammetry and chronoamperometry, and clarified the electrocrystallization mechanism of cobalt on the GC electrode. Xiang et al. [22] employed electrochemical analysis techniques such as cyclic voltammetry and chronoamperometry to investigate and understand the deposition behavior of lead, revealing the deposition mechanism of Pb and the nucleation and growth mode of deposition. The concept validation operation proves that the addition of β-naphthol ethoxylate to the MSA system is an effective and stable operation for Pb electrorefining, which has great advantages over H2SiF6. Electrochemical techniques are commonly employed to study the mechanism of metal ion reduction and to evaluate the process variables that influence the reaction kinetics [23]. The MSA system has high chemical stability and low saturated vapor pressure. Compared with other systems, it is green and environmentally friendly, and has a good production effect. However, the electrochemical behavior of tin deposition in an MSA system has rarely been systematically reported.
In this work, we conducted a study of the electrochemical process of tin electrodeposition in the MSA system. The results of this study may improve the application of tin in existing or future technologies, and have certain guiding significance for the green electrolytic refining of tin in the future. The electrochemical characterization revealed that the electrochemical reduction of Sn2+ in MSA is a quasi-reversible process, and diffusion is the controlling step. The apparent activation energy = 14.189 kJ/mol for the ion diffusion of Sn2+ was further calculated. The results of chronoamperometry showed that the electrocrystallization of Sn2+ on the GC electrode gradually tended to three-dimensional instantaneous nucleation with the increase in applied potential. The morphology and phase of the deposits were analyzed using scanning electron microscopy (SEM) and X-ray diffraction (XRD), which showed that the deposits were uniform and dense pure tin. This work clarifies the electrochemical behavior of tin in an MSA system.
2. Materials and Methods
2.1. Materials and Reagents
The reagents used in the present work were methanesulfonic acid (CH3SO2OH), tin methanesulfonate (CH3SO3)2Sn, β-naphthol (C10H8O), acetone (CH3COCH3), sodium lignosulfonate (C20H24Na2O10S2), and alumina (Al2O3) polishing powder. All reagents were purchased from Aladdin and were not further purified. Bone glue was purchased from Dalian Haixin Chemical Co., Ltd. (Dalian, China). In the experiment, the bone glue was dissolved in the solvent and then quantitatively added to the electrolyte. The β-naphthol was dissolved in boiling water, the bone glue was dissolved in hot water at 75 °C, and the sodium lignosulfonate was dissolved in water at room temperature.
2.2. Electrochemical Testing
All the electrochemical tests were performed using a CHI 760E electrochemical workstation with a three-electrode system. The experimental connection diagram is shown in Figure 1. An “L” type glassy carbon (GC) electrode (d = 5 mm) was adopted as the working electrode, a platinum sheet (2 × 2 cm2) was used as the counter electrode, and a saturated calomel electrode (SCE) was used as the reference electrode. It is worth noting that all the potentials in the present work are against the SCE. A salt bridge filled with saturated KCl solution was used to avoid mutual contamination. It should be noted that before each test, the working electrode was pretreated to ensure a clean surface. In detail, it was polished with ultra-fine Al2O3 slurry, and then washed with acetone and distilled water. In the cyclic voltammetry (CV) experiment, the scanning range was 0~−0.9 V, the scan rate was 20~100 mV/s, and the test temperature was 298~338 K. In the linear sweep voltammetry (LSV) experiment, the scanning range was −0.3~−0.8 V and the scan rate was 100 mV/s. In the chronoamperometry (CA) experiment, the test potential was −0.56~−0.64 V and the test time was 20 s. Unless otherwise specified, the basic conditions of electrochemical measurement were as follows: MSA: 100 g/L, Sn2+: 100 g/L, additives were bone glue (1.3 g/L), sodium lignosulfonate (0.21 g/L), and β-naphthol (0.4 g/L).
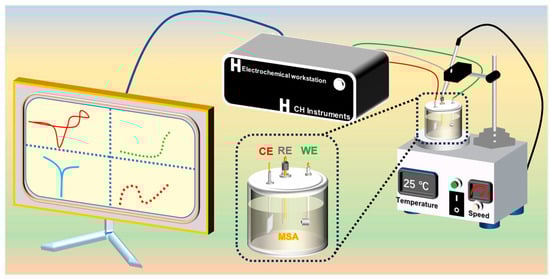
Figure 1.
Electrochemical experiment 3D schematic diagram.
3. Results and Discussion
3.1. Cyclic Voltammetry Experiments
Initially, the cyclic voltammetry technique was employed to investigate the electrochemical characteristics of Sn2+ on a GC electrode and the results are shown in Figure 2. Firstly, the CV curves were collected in a solution only containing 100 g/L MSA, for which no visible peak could be found. However, after the addition of Sn2+, a pair of obvious redox peaks appeared in the cyclic voltammogram. It was observed that the cathodic current density begins to increase at −0.51 V vs. SCE (point B) and reaches the limit −0.60 V vs. SCE (point C), which is related to the electroreduction of Sn2+. The anodic current density began to rise at −0.49 V vs. SCE (point E) and reached the oxidation peak −0.36 V vs. SCE (point F), corresponding to the oxidation of Sn. Additionally, a nucleation loop was observed at the cathode of the cyclic voltammogram, that is, the current of the reverse scan is higher than that of the forward scan at the same overpotential. The formation of the nucleation loop indicates that the initial deposition of Sn2+ undergoes a nucleation and growth process [24,25,26]. A similar phenomenon was reported in Sn2+ deposition [27].
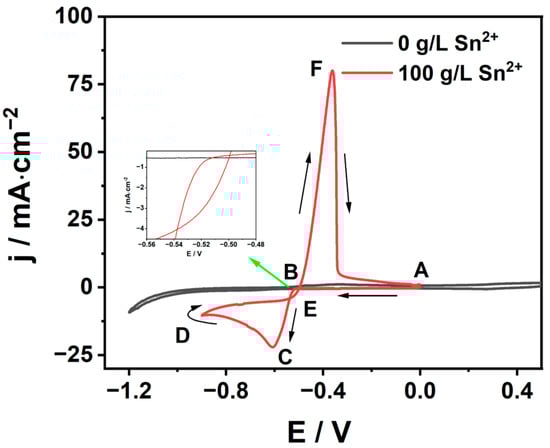
Figure 2.
Cyclic voltammogram curves of Sn electrodeposition in MSA system (black 0 g/L Sn2+ and red 100 g/L Sn2+).
To further understand the redox process of Sn2+, the CV curves at different scan rates were measured and the results are shown in Figure 3a. The relevant data are extracted from Figure 3a into Table 1. It can be seen from Figure 3a and Table 1 that the peak current in the cathode (ipc) and anode (ipc) increase with the growth in the scan rate. This is because the diffusion flux increases with the extension of the scanning rate. At the same time, the cathode peak potential Epc and the half peak potential Epc/2 negative shifts, while the anode peak potential shifts inversely. In addition, it can be seen from Figure 3b that the cathodic peak current density jpc has a good linear relationship with the square root of the scan rate (V1/2), indicating that the electrode reaction is controlled by diffusion. From Figure 3 and Table 1, it can be seen that at the same scan rate, ipc/ipa ≠ 1, the potential difference ΔE = |Epc − Epa| is much larger than the standard value of the reversible process 2.3RT/nF = 59/n mV (where n represents number of exchanged electrons). The above results show that the electrochemical reduction process of Sn2+ in MSA is a quasi-reversible process further controlled by diffusion. It can be seen from Figure 3b that jpc has a good linear relationship with V1/2, and that the straight line fitted by jpc and V1/2 passes through the origin. The relationship between the cathode peak current and the scanning rate in the irreversible process can be applied to the quasi-reversible process [28], and the relationship is [29]:
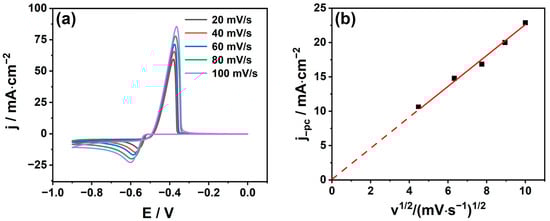
Figure 3.
(a) Cyclic voltammetry curves of 20~100 mV/s (298 K) for different sweep rates; (b) peak cathode current density (jpc) versus square root of sweep rate (V1/2).

Table 1.
Data related to cyclic voltammetry curves at different potential sweep rates.
In Equation (1), the following variables are defined: jpc represents the cathode peak current density, mA/cm2; n represents the number of exchanged electrons in an electrochemical process; F represents the Faraday constant, which is equal to 96,485 C/mol; represents the concentration of Sn2+ in, mol/L; D represents the diffusion coefficient in cm2/s; α represents the transfer coefficient; represents the number of electron transfers in the rate-determining step; V represents the scanning rate, V/s; R represents the gas constant, which is equal to 8.314 kJ/mol; and T represents the thermodynamic temperature, K.
α can be obtained by Equation (2) [30]:
Formulas (1) and (2) are transformed, and the relationship is as follows:
According to the relevant data of Equation (3) and Table 1, the transfer coefficient α = 0.82 at 298 K can be obtained.
In order to explore the effect of temperature on the diffusion coefficient, cyclic voltammetry tests at different temperatures were recorded and are depicted in Figure 4. At the same time, the peak current density jpc and peak potential Epc of the cathode and the relevant kinetic parameters were extracted from Figure 4 and are listed in Table 2. One can see from Figure 4 and Table 2 that as the temperature increases, the cathode peak potential Epc shifts positively, and the cathode peak current density jpc also increases significantly. This can be attributed to the fact that the viscosity of the electrolyte decreases at higher temperatures, resulting in increased kinetic energy and accelerated thermal motion of electroactivity [31]. It shows that the increase in temperature can accelerate the electrodeposition of metal tin. With the increase in temperature, the anodic peak current density jpa also increases significantly, and the anodic peak potential Epa also shifts positively. ΔEp = |Epc − Epa| is much larger than the standard value of the reversible process 2.3RT/(nF), which is consistent with the previous results. These results also indicate that the reduction of Sn2+ in MSA is a quasi-reversible process. The increase in temperature is beneficial to the acceleration of the electrodeposition of metal tin. However, when the temperature of the electrolyte is too high, it will lead to the evaporation loss of the electrolyte, which will increase the acidity in the electrolytic cell, affect the stability of the electrolyte composition, and result in adverse effects in production. Moreover, with the evaporation of the electrolyte, acid mist will be discharged into the air, which will deteriorate the working environment of the workshop and cause equipment corrosion.
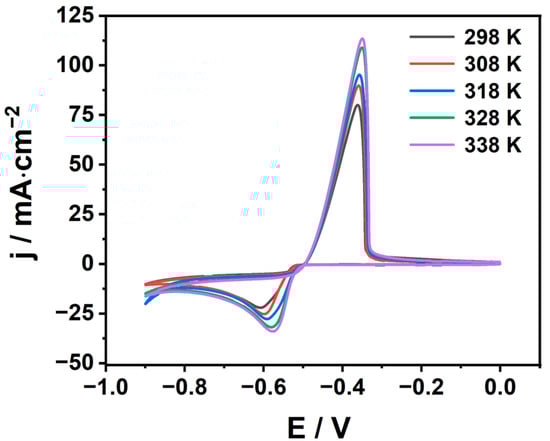
Figure 4.
Effect of temperature on the cyclic voltammetry curve 298~338 K (100 mV/s).
Table 2.
Data related to cyclic voltammetry curves at different temperatures.
As shown in Figure 5, the cyclic voltammetry curves of the system at different scan rates were determined in the temperature range of 308~338 K. We find that jpc ∝ V1/2 and all the correlation coefficients are above 0.98. The diffusion coefficients at different temperatures can be calculated according to Equation (3) and are listed in Table 2. From the table, it can be found that the diffusion coefficient increases with the increase in temperature; this is due to the decrease in solution viscosity with the growth in temperature, which thus increases the migration rate of Sn2+ in the solution [32,33]. The logarithm of the diffusion coefficient lnD at different temperatures is plotted against the reciprocal of temperature T−1, as shown in Figure 6b. It can be seen that lnD has a good linear relationship with T−1, which is confirmed from the Arrhenius formula [34]:
where is the reaction activation energy, kJ/mol; a is the pre-exponential factor; R is the proportional coefficient, 8.314 kJ/mol.
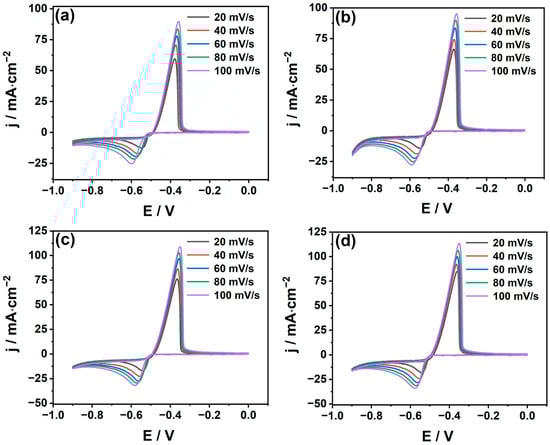
Figure 5.
Cyclic voltammetry curves at different scan rates on GC electrode (a) 308 K; (b) 318 K; (c) 328 K, and (d) 338 K.
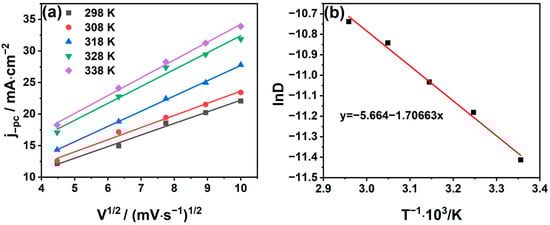
Figure 6.
(a) The relationship between the cathode peak current IPC and the square root of the scanning speed V1/2 at different temperatures; (b) the relationship between the logarithm of the diffusion coefficient lnD and the reciprocal of the absolute temperature 1/T.
According to Equation (4), the apparent activation energy diffusion is = 14.189 kJ/mol.
3.2. Linear Sweep Voltammetry Experiment
To reduce the thickness of the interface diffusion layer and reduce the cathodic concentration polarization, thus obtaining a uniform and dense deposition layer, linear cyclic voltammetry experiments were carried out at different rotational speeds. At the same time, stirring can also accelerate the overflow of bubbles on the electrode surface. The results are shown in Figure 7. With the growth in stirring speed, the cathodic current density increases while the deposition potential decreases. This may be due to the accelerated mass transfer process of ions to the electrode surface derived from the increase in rotational speed. Therefore, in the actual production, we can appropriately increase the stirring speed to reduce concentration polarization. It is worth noting that in the process of electroplating or electrolytic refining, the stirring speed is not as fast as possible. The fast stirring speed may accelerate the anodic dissolution, exceed the cathodic reaction rate, and cause an unstable Sn2+ concentration in the electrolyte.
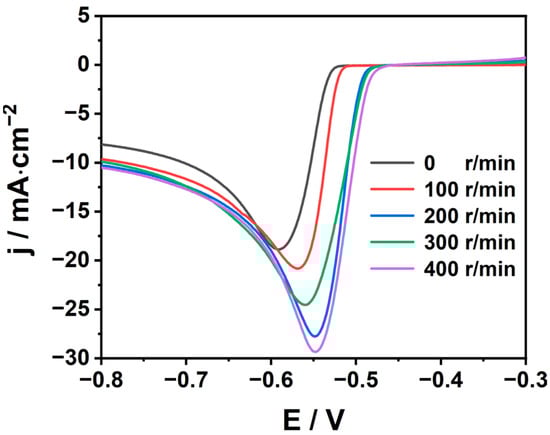
Figure 7.
Cathodic polarization curve of tin on glassy carbon electrode at different rotation rates (298 K,100 mV/s).
3.3. Chronoamperometric Experiments
The current transient technique, also known as chronoamperometry, is an important electrochemical diagnostic technique commonly used to determine the nucleation mechanism [35]. In order to further explore the nucleation mechanism of Sn2+ on the GC electrode and guide the actual production, a chronoamperometry experiment was carried out. The effect of different voltages on the nucleation kinetics of electrodeposition at a certain concentration was studied via chronoamperometry. As shown in Figure 8a, a typical current–time curve was obtained by testing in the potential range of −0.56~−0.64 V for 20 s. The nucleation of Sn2+ on the GC electrode can be divided into three stages. In the first stage, the current density decreases in a very short time, which is not related to the double-layer charging. The observed decrease in current at the beginning of the transient is a common phenomenon in various electrodeposition systems. It can be attributed to different processes, including multi-step charge transfer reactions, adsorption, and redox processes occurring at the surface state of the GC electrode [36]. The results indicate that the reduction reaction kinetics in the early stage of the electrodeposition process are primarily governed by the charge transfer reaction [37]. In the second stage, the current density rises rapidly to the maximum value, which is attributed to the increase in the number of crystal nuclei and the formation of new phases in the early stage of electrocrystallization. The area of the electroactive region, and the nucleation and growth of tin on the GC electrode, increase continuously [35]. As the electrodeposition potential becomes negative, the peak current increases, and the time to reach the maximum current decreases. In the third stage, the nucleus develops and diffuses around itself. The growth rate of tin ions into the nucleus decreases with the increase in the thickness of the diffusion layer and the overlap of the positions. When the growth centers overlap, the current density should decrease due to the linear diffusion of the electroactive ions to the electrode, so the current density decreases slowly from the peak to a stable state [38]. As the potential increases, the current peak becomes larger, and the maximum reduction current increases with the negative shift of the step potential in the early stage. These findings indicate that the observations align with the typical features of the classical three-dimensional growth nucleation process.
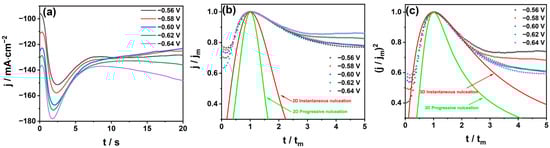
Figure 8.
Typical current–time transient curves (a) at different potentials; comparison of the dimensionless experimental current–time transients with theoretical 2D (b) and 3D (c) nucleation patterns.
Considerable work has been undertaken in simulating the nucleation and growth mechanism of crystal nuclei. In order to further understand the mechanism of the tin deposition process, potential theoretical transients were simulated at −0.60 V. The theoretical transients were first observed under the two-dimensional model. The two-dimensional instantaneous nucleation is represented by Equation (5) and the dimensional continuous nucleation is represented by Equation (6) [39].
Instantaneous nucleation:
Continuous nucleation:
where j and t represent the current intensity and time, respectively, and jm and tm represent the maximum values of the current transient. By plotting the normalized current (j/jm)2 versus time t/tm curve, all current transients can be converted into a dimensionless form.
The results are shown in Figure 8b. The experimental curves show that there is a great deviation from the theoretical 2D model. We introduced the popular SH theoretical model developed by Scharifker and Mostany for instantaneous nucleation and continuous nucleation. Instantaneous nucleation is represented by Equation (7) while continuous nucleation is represented by Equation (8) [40].
Instantaneous nucleation:
Continuous nucleation:
The results in Figure 8c show that the dimensionless curve of the experimental data is in good agreement with the theoretical instantaneous nucleation curve at different potentials. With the increase in potential, the dimensionless curve is more consistent with the three-dimensional instantaneous nucleation theoretical curve; that is, the three-dimensional nucleation model is applicable, and the deposition of tin on the GC electrode follows instantaneous nucleation.
3.4. Characterization of Sn
The morphology and elemental composition of cathode deposits were studied using scanning electron microscopy (SEM) and energy dispersive spectroscopy (EDS). The deposits were obtained using chronoamperometry with an applied potential of −0.6 V at an MSA concentration of 100 g/L and a Sn2+ concentration of 100 g/L. As shown in Figure 9a, in the absence of additives, the deposits have obvious dendrites and an uneven surface, and the grains are coarse. In the actual production process, this may lead to troubles such as high cell voltage, low current efficiency, high DC power consumption, and short circuits. However, as shown in Figure 9b, following the introduction of additives (bone glue 0.6 g/L, sodium lignosulfonate 0.1 g/L, β-naphthol 0.2 g/L), we obtained relatively uniform growth in the deposit, but the deposit particles were relatively coarse. The grain size depends on the relative speed of nucleation. We continued to increase the concentration of additives to bone glue 1.3 g/L, sodium lignosulfonate 0.21 g/L, and β-naphthol 0.4 g/L. As shown in Figure 9c, deposits with relatively uniform growth were obtained, and the deposit particles grew dense. The area of Figure 9c was scanned. The results are shown in Figure 9d, where it can be seen that the obtained deposits are basically tin, and a small part of oxygen, which may result from the inevitable oxidation effect in air.
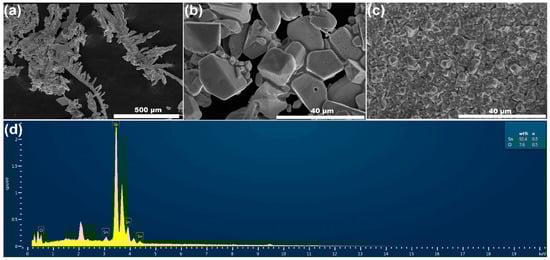
Figure 9.
Morphology of deposits with different additive concentrations: (a) no additives; (b) additives: bone glue 0.6 g/L, sodium lignosulfonate 0.1 g/L, β-naphthol 0.2 g/L; (c) additives: bone glue 1.3 g/L, sodium lignosulfonate 0.21 g/L, β-naphthol 0.4 g/L. (d) EDS spectra of zone in (c).
As shown in Figure 10, XRD analysis of the obtained deposits shows that the XRD diffraction peaks of the deposited tin are completely consistent with the standard PDF card (JCPDS: 86-2265, Sn), and no other peaks are observed. The results show that the deposit is pure tin. Combined with SEM results, the diffraction peak intensity of tin may be related to the smaller grain size [41], among which (200), (220), (101), and (211) diffraction peaks are stronger.
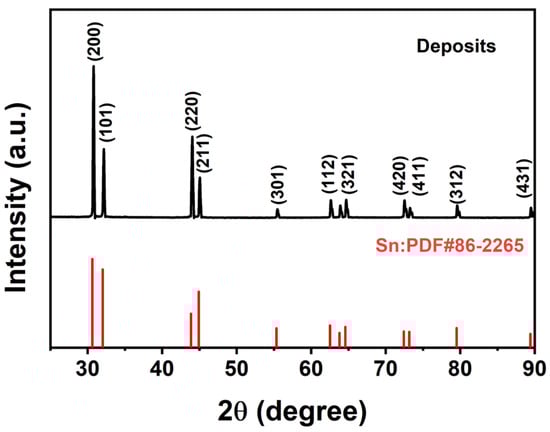
Figure 10.
XRD patterns of deposits.
A 267 mL Hull cell was used to test the coverage ability of the plating solution. The volume of the plating solution was 250 mL, the anode was a pure tin plate, and the cathode was a pretreated copper test piece. The electrodeposition was performed at a temperature of 35 °C and a current of 1 A for 5 min. It can be seen from Figure 11 that when the blank plating solution was used, a bright area did not appear on the Hall cell test piece, the high area was burned and tin dendrites appeared, and the low area indicated the no-deposit area. The additives were bone glue 1.3 g/L, sodium lignosulfonate 0.21 g/L, and β-naphthol 0.4 g/L. The bright area appeared on the plate, and the dendrites in the high area disappeared, indicating that the addition of additives in the plating solution can effectively improve the coverage ability of the plating solution.
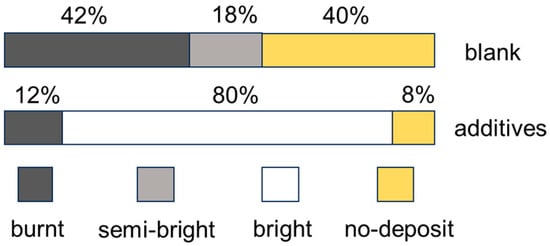
Figure 11.
The influence of additives on the Hull cell patterns of the tin deposits (MSA: 100 g/L, Sn2+: 100 g/L).
SEM was used to study the coating obtained at a temperature of 35 °C and a current of 1 A, with the following additives: bone glue 1.3 g/L, sodium lignosulfonate 0.21 g/L, and β-naphthol 0.4 g/L. As shown in Figure 12, the obtained tin deposits are tightly bonded and evenly distributed.
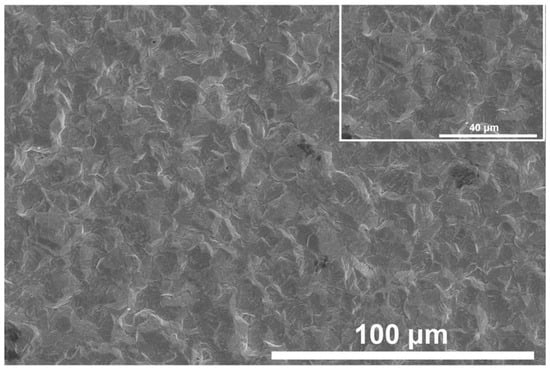
Figure 12.
SEM images of Sn deposit on a Cu support.
As an important technical and economic index, cell voltage is of great significance in the analysis of tin electrodeposition. In the process of the electrodeposition of tin, the system temperature was 35 °C, the test time was 300 min, and the time gradient was 10 min. The data were recorded once. The results are shown in Figure 13. The voltage decreased rapidly in the early stage of the test, which may be in the activation stage in the early stage, and finally tended to be stable. The cell voltage was maintained at 0.3 V.
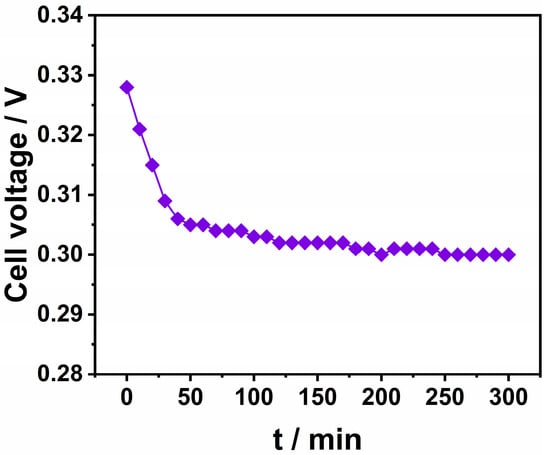
Figure 13.
The relationship between cell voltage and time.
4. Conclusions
(1) A single cathodic current peak is show in the cyclic voltammogram, which is related to the electroreduction of tin ions. The electrochemical reduction process of Sn2+ in the MSA system is a quasi-reversible process controlled by diffusion. The diffusion coefficient increases with the increase in temperature, and the apparent activation energy is 14.189 kJ/mol.
(2) The results of chronoamperometry show that the electrocrystallization of tin on a glassy carbon electrode gradually tended to three-dimensional instantaneous nucleation with the increase in applied potential.
(3) The SEM results show that the tin deposited on the glassy carbon electrode under the action of bone glue, sodium lignosulfonate, and β-naphthol is evenly distributed, the surface is neat and bright without dendrites, and a small amount of oxygen is caused by the oxidation of the deposited tin exposed to air. The XRD diffraction peak is completely consistent with the standard PDF card (JCPDS: 86-2265, Sn) and the electrodeposited deposit is pure tin.
Author Contributions
Y.Y.: Conceptualization, Methodology, Validation, Data collection, Formal analysis, Investigation, Writing—original draft, Visualization. J.W. (Junli Wang): Materials characterization and analysis. X.W. and J.W. (Jinlong Wei): Manuscript revision, Data analysis. X.T.: Manuscript review, Data analysis. R.X. and L.Y.: Discussion of ideas, Review, Project administration, Funding acquisition. All authors have read and agreed to the published version of the manuscript.
Funding
The authors gratefully acknowledge the Yunnan Provincial Science and Technology Department Science and Technology Plan Project (Grant no. 202202AC080008).
Institutional Review Board Statement
Not applicable.
Informed Consent Statement
Not applicable.
Data Availability Statement
The original contributions presented in the study are included in the article, further inquiries can be directed to the corresponding authors.
Conflicts of Interest
The authors declare no conflicts of interest.
References
- Walsh, F.C.; Low, C.T.J. A review of developments in the electrodeposition of tin. Surf. Coat. Technol. 2016, 288, 79–94. [Google Scholar] [CrossRef]
- Tarselli, M.A. Tin can. Nat. Chem. 2017, 9, 500. [Google Scholar] [CrossRef] [PubMed]
- Liu, P.; Sivakov, V. Tin/Tin Oxide Nanostructures: Formation, Application, and Atomic and Electronic Structure Peculiarities. Nanomaterials 2023, 13, 2391. [Google Scholar] [CrossRef] [PubMed]
- Wang, Z.; Cheng, M.; Bu, J.; Cheng, L.; Ru, J.; Hua, Y.; Wang, D. Understanding the electrochemical behavior of Sn(II) in choline chloride-ethylene glycol deep eutectic solvent for tin powders preparation. Adv. Powder Technol. 2022, 33, 103670. [Google Scholar] [CrossRef]
- Lodge, A.W.; Hasan, M.M.; Bartlett, P.N.; Beanland, R.; Hector, A.L.; Kashtiban, R.J.; Levason, W.; Reid, G.; Sloan, J.; Smith, D.C.; et al. Electrodeposition of tin nanowires from a dichloromethane based electrolyte. RSC Adv. 2018, 8, 24013–24020. [Google Scholar] [CrossRef]
- Meng, Z.-C.; Gao, L.-Y.; Liu, Z.-Q. Synthesis of Sn nanowire by template electrodeposition and its conversion into Sn nanosolder. Mater. Charact. 2020, 163, 110278. [Google Scholar] [CrossRef]
- Sajeev, A.; Krishnamoorthy, K.; Pazhamalai, P.; Bhunia, K.; Sathyaseelan, A.; Kim, S.-J. Methanol-assisted energy-saving green hydrogen production using electrodeposited 3D-metallic tin as an electrocatalyst. J. Mater. Chem. A 2023, 11, 22419–22429. [Google Scholar] [CrossRef]
- Luo, L.; Qiao, H.; Xu, W.; Li, D.; Zhu, J.; Chen, C.; Lu, Y.; Zhu, P.; Zhang, X.; Wei, Q. Tin nanoparticles embedded in ordered mesoporous carbon as high-performance anode for sodium-ion batteries. J. Solid State Electrochem. 2017, 21, 1385–1395. [Google Scholar] [CrossRef]
- Angadi, S.I.; Sreenivas, T.; Jeon, H.-S.; Baek, S.-H.; Mishra, B.K. A review of cassiterite beneficiation fundamentals and plant practices. Miner. Eng. 2015, 70, 178–200. [Google Scholar] [CrossRef]
- Van Daele, K.; De Mot, B.; Pupo, M.; Daems, N.; Pant, D.; Kortlever, R.; Breugelmans, T. Sn-Based Electrocatalyst Stability: A Crucial Piece to the Puzzle for the Electrochemical CO2 Reduction toward Formic Acid. ACS Energy Lett. 2021, 6, 4317–4327. [Google Scholar] [CrossRef]
- An, X.; Li, S.; Hao, X.; Xie, Z.; Du, X.; Wang, Z.; Hao, X.; Abudula, A.; Guan, G. Common strategies for improving the performances of tin and bismuth-based catalysts in the electrocatalytic reduction of CO2 to formic acid/formate. Renew. Sustain. Energy Rev. 2021, 143, 110952. [Google Scholar] [CrossRef]
- Nguyen-Phan, T.-D.; Ellis, J.E.; Nagarajan, A.V.; Howard, B.H.; Mpourmpakis, G.; Kauffman, D.R. Precisely doping the surface of tin-based electrocatalysts for improved CO2 conversion to liquid chemicals. Appl. Catal. B 2024, 340, 123250. [Google Scholar] [CrossRef]
- Shaikh, N.S.; Shaikh, J.S.; Márquez, V.; Pathan, S.C.; Mali, S.S.; Patil, J.V.; Hong, C.K.; Kanjanaboos, P.; Fontaine, O.; Tiwari, A.; et al. New perspectives, rational designs, and engineering of Tin (Sn)-based materials for electrochemical CO2 reduction. Mater. Today Sustain. 2023, 22, 100384. [Google Scholar] [CrossRef]
- Li, Y.-G.; Liu, S.-S.; Wang, C.-H.; Luo, T.; Xiang, C.-L.; Li, S.; Chang, C.; Yang, S.-H.; Wang, H.-H.; Chen, Y.-M. Electro-Deposition Behavior in Methanesulfonic-Acid-Based Lead Electro-Refining. J. Sustain. Metall. 2021, 7, 1910–1916. [Google Scholar] [CrossRef]
- Jin, B.; Dreisinger, D.B. A green electrorefining process for production of pure lead from methanesulfonic acid medium. Sep. Purif. Technol. 2016, 170, 199–207. [Google Scholar] [CrossRef]
- Balaji, R.; Pushpavanam, M. Methanesulphonic acid in electroplating related metal finishing industries. Trans. IMF 2003, 81, 154–158. [Google Scholar] [CrossRef]
- Low, C.T.J.; Walsh, F.C. The stability of an acidic tin methanesulfonate electrolyte in the presence of a hydroquinone antioxidant. Electrochim. Acta 2008, 53, 5280–5286. [Google Scholar] [CrossRef]
- Walsh, F.C.; de León, C.P. Versatile electrochemical coatings and surface layers from aqueous methanesulfonic acid. Surf. Coat. Technol. 2014, 259, 676–697. [Google Scholar] [CrossRef]
- Binnemans, K.; Jones, P.T. Methanesulfonic Acid (MSA) in Hydrometallurgy. J. Sustain. Metall. 2023, 9, 26–45. [Google Scholar] [CrossRef]
- Chang, C.; Yang, S.; Liu, S.; Wang, H.; Liu, H.; Qu, J.; Jin, W.; Wang, C.; Chen, Y. Energy-Efficient and Green Extraction of Bismuth Metal in Methanesulfonic Acid-Based Membrane Electrochemical Systems. ACS Sustain. Chem. Eng. 2023, 11, 7851–7862. [Google Scholar] [CrossRef]
- Kong, D.; Zheng, Z.; Meng, F.; Li, N.; Li, D. Electrochemical Nucleation and Growth of Cobalt from Methanesulfonic Acid Electrolyte. J. Electrochem. Soc. 2018, 165, D783. [Google Scholar] [CrossRef]
- Xiang, C.; Zhu, S.; Song, J.; Li, Y.; Luo, T.; Chang, C.; Qu, J.; Yang, S.; Wang, C.; Chen, Y. Green Electrorefining of Crude Lead with High-Quality Deposits in an Additive-Assisted Methanesulfonic Acid System. ACS Sustain. Chem. Eng. 2022, 10, 11223–11231. [Google Scholar] [CrossRef]
- Low, C.T.J.; Kerr, C.; Barker, B.D.; Smith, J.R.; Campbell, S.A.; Walsh, F.C. Electrochemistry of tin deposition from mixed sulphate and methanesulphonate electrolyte. Trans. IMF 2008, 86, 148–152. [Google Scholar] [CrossRef]
- Fletcher, S. Some new formulae applicable to electrochemical nucleation/growth/collision. Electrochim. Acta 1983, 28, 917–923. [Google Scholar] [CrossRef]
- Elgrishi, N.; Rountree, K.J.; McCarthy, B.D.; Rountree, E.S.; Eisenhart, T.T.; Dempsey, J.L. A Practical Beginner’s Guide to Cyclic Voltammetry. J. Chem. Educ. 2018, 95, 197–206. [Google Scholar] [CrossRef]
- Isaev, V.A.; Grishenkova, O.V.; Zaykov, Y.P. Theory of cyclic voltammetry for electrochemical nucleation and growth. J. Solid State Electrochem. 2018, 22, 2775–2778. [Google Scholar] [CrossRef]
- Cao, X.; Xu, L.; Wang, C.; Li, S.; Wu, D.; Shi, Y.; Liu, F.; Xue, X. Electrochemical Behavior and Electrodeposition of Sn Coating from Choline Chloride–Urea Deep Eutectic Solvents. Coatings 2020, 10, 1154. [Google Scholar] [CrossRef]
- Yang, H.; Reddy, R.G. Electrochemical deposition of zinc from zinc oxide in 2:1 urea/choline chloride ionic liquid. Electrochim. Acta 2014, 147, 513–519. [Google Scholar] [CrossRef]
- Hinatsu, J.; Foulkes, F. Electrochemical kinetic parameters for the cathodic deposition of copper from dilute aqueous acid sulfate solutions. Can. J. Chem. Eng. 1991, 69, 571–577. [Google Scholar] [CrossRef]
- Nagaishi, R.; Arisaka, M.; Kimura, T.; Kitatsuji, Y. Spectroscopic and electrochemical properties of europium(III) ion in hydrophobic ionic liquids under controlled condition of water content. J. Alloys Compd. 2007, 431, 221–225. [Google Scholar] [CrossRef]
- Al-Dawsari, J.N.; Bessadok-Jemai, A.; Wazeer, I.; Mokraoui, S.; AlMansour, M.A.; Hadj-Kali, M.K. Fitting of experimental viscosity to temperature data for deep eutectic solvents. J. Mol. Liq. 2020, 310, 113127. [Google Scholar] [CrossRef]
- Souayeh, B.; Reddy, M.G.; Sreenivasulu, P.; Poornima, T.; Rahimi-Gorji, M.; Alarifi, I.M. Comparative analysis on non-linear radiative heat transfer on MHD Casson nanofluid past a thin needle. J. Mol. Liq. 2019, 284, 163–174. [Google Scholar] [CrossRef]
- Ru, J.; Hua, Y.; Wang, D. Direct Electro-Deoxidation of Solid PbO to Porous Lead in Choline Chloride-Ethylene Glycol Deep Eutectic Solvent. J. Electrochem. Soc. 2017, 164, D143. [Google Scholar] [CrossRef]
- Bu, J.; Ru, J.; Wang, Z.; Hua, Y.; Xu, C.; Zhang, Y.; Wang, Y. Controllable preparation of antimony powders by electrodeposition in choline chloride-ethylene glycol. Adv. Powder Technol. 2019, 30, 2859–2867. [Google Scholar] [CrossRef]
- Khelladi, M.; Mentar, L.; Boubatra, M.; Azizi, A.; Kahoul, A. Early stages of cobalt electrodeposition on FTO and n-type Si substrates in sulfate medium. Mater. Chem. Phys. 2010, 122, 449–453. [Google Scholar] [CrossRef]
- Komsiyska, L.; Staikov, G. Electrocrystallization of Au nanoparticles on glassy carbon from HClO4 solution containing [AuCl4]−. Electrochim. Acta 2008, 54, 168–172. [Google Scholar] [CrossRef]
- Kahoul, A.; Azizi, F.; Bouaoud, M. Effect of citrate additive on the electrodeposition and corrosion behaviour of Zn–Co alloy. Trans. IMF 2017, 95, 106–113. [Google Scholar] [CrossRef]
- Gu, S.; Wang, X.; Wei, Y.; Fang, B. Mechanism for nucleation and growth of electrochemical deposition of palladium(II) on a platinum electrode in hydrochloric acid solution. Sci. China Chem. 2014, 57, 755–762. [Google Scholar] [CrossRef]
- Guo, M.W.; Sun, C.B.; Yang, W.Q.; Chen, L.; Lei, H.; Zhang, Q.B. Sulphur-induced electrochemical synthesis of manganese nanoflakes from choline chloride/ethylene glycol-based deep eutectic solvent. Electrochim. Acta 2020, 341, 136017. [Google Scholar] [CrossRef]
- Scharifker, B.; Hills, G. Theoretical and experimental studies of multiple nucleation. Electrochim. Acta 1983, 28, 879–889. [Google Scholar] [CrossRef]
- Cao, X.; Xu, L.; Shi, Y.; Wang, Y.; Xue, X. Electrochemical behavior and electrodeposition of cobalt from choline chloride-urea deep eutectic solvent. Electrochim. Acta 2019, 295, 550–557. [Google Scholar] [CrossRef]
Disclaimer/Publisher’s Note: The statements, opinions and data contained in all publications are solely those of the individual author(s) and contributor(s) and not of MDPI and/or the editor(s). MDPI and/or the editor(s) disclaim responsibility for any injury to people or property resulting from any ideas, methods, instructions or products referred to in the content. |
© 2024 by the authors. Licensee MDPI, Basel, Switzerland. This article is an open access article distributed under the terms and conditions of the Creative Commons Attribution (CC BY) license (https://creativecommons.org/licenses/by/4.0/).