Article

Effects of Mean Normal Stress on Strain-Hardening, Strain-Induced Martensite Transformation, and Void-Formation Behaviors in High-Strength TRIP-Aided Steels

1
Graduate School of Science and Technology, Shinshu University, Nagano 380-8553, Japan
2
Graduate School of Science and Engineering, Ibaraki University, Hitachi 316-8511, Japan
*
Author to whom correspondence should be addressed.
Metals 2024, 14(1), 61; https://doi.org/10.3390/met14010061
Submission received: 22 November 2023 / Revised: 20 December 2023 / Accepted: 31 December 2023 / Published: 3 January 2024
(This article belongs to the Section Metal Casting, Forming and Heat Treatment)

Abstract

:
To analyze various types of cold formability in TRIP-aided polygonal ferrite (TPF), annealed martensite (TAM), and bainitic ferrite (TBF) steels, the effects of the mean normal stress on the strain-hardening, strain-induced martensite transformation, and void-formation behaviors were investigated. The strain-hardening behavior was influenced by positive mean normal stress and was hardly influenced by zero and negative mean normal stresses in all steels. Positive mean normal stress promoted the strain-induced martensitic transformation behavior, especially in TBF steel due to the high mechanical stability of the retained austenite. The void-formation behavior was also promoted by positive mean normal stress, especially in TPF steel. These behaviors were also related to the microstructural properties, such as the matrix structure, retained austenite characteristics, and second phase.

1. Introduction

First-, second-, and third-generational advanced high-strength steels (AHSSs) have been applied to automobiles to reduce their weight and improve their crush safety performance [1,2,3,4] because of the various excellent types of cold formability [1,2,3]. As these types of formability are evaluated in different stress states or mean normal stress conditions, it is very important to quantify the effects of the mean normal stress on the strain-hardening, strain-induced martensitic transformation, and void-formation behaviors. These three kinds of behavior are also mainly influenced by (1) the microstructural properties, such as the type of matrix structure, grain size, and retained austenite characteristics, (2) micro-alloying elements, and (3) the deformation temperature and rate [5]. Regarding the effect of the microstructure, annealed martensite and bainitic ferrite matrix structures considerably improve the cold formability compared to a polygonal ferrite matrix structure, as shown in Figure 1 [6]. Also, a large amount of metastable retained austenite increases the formability by enhancing the strain-hardening rate and suppressing void/crack formation by relaxing the localized stress concentration [5,7].
According to Sugimoto et al. [5], Hiwatashi et al. [8], Takahashi [9], and Polatidis et al. [10], an equi-biaxial tension on stretch-forming promotes the strain-induced martensite transformation in transformation-induced plasticity (TRIP)-aided polygonal ferrite (TPF) [5,8,9,11,12,13,14] and TRIP-aided annealed martensite (TAM) [5] steels. However, no research has systematically investigated the effects of the mean normal stress on the strain-hardening, strain-induced martensite transformation, and void-formation behaviors in first-generation AHSSs, such as TPF and TAM steels [5,8], or in third-generation AHSSs, such as TRIP-aided bainitic ferrite (TBF) [6,7,10], carbide-free bainitic (CFB) [15,16,17], quenching and partitioning (Q&P) [10,12,18,19,20], and medium Mn steels [21,22,23]. The research is beneficial in analyzing the various types of cold formability.
This research investigates the effects of the mean normal stress on the strain-hardening, strain-induced martensite transformation, and void-formation behaviors in low-carbon TPF, TAM, and TBF steels. In addition, these behaviors are related to microstructural properties, such as the matrix structure, retained austenite characteristics, and second phase.

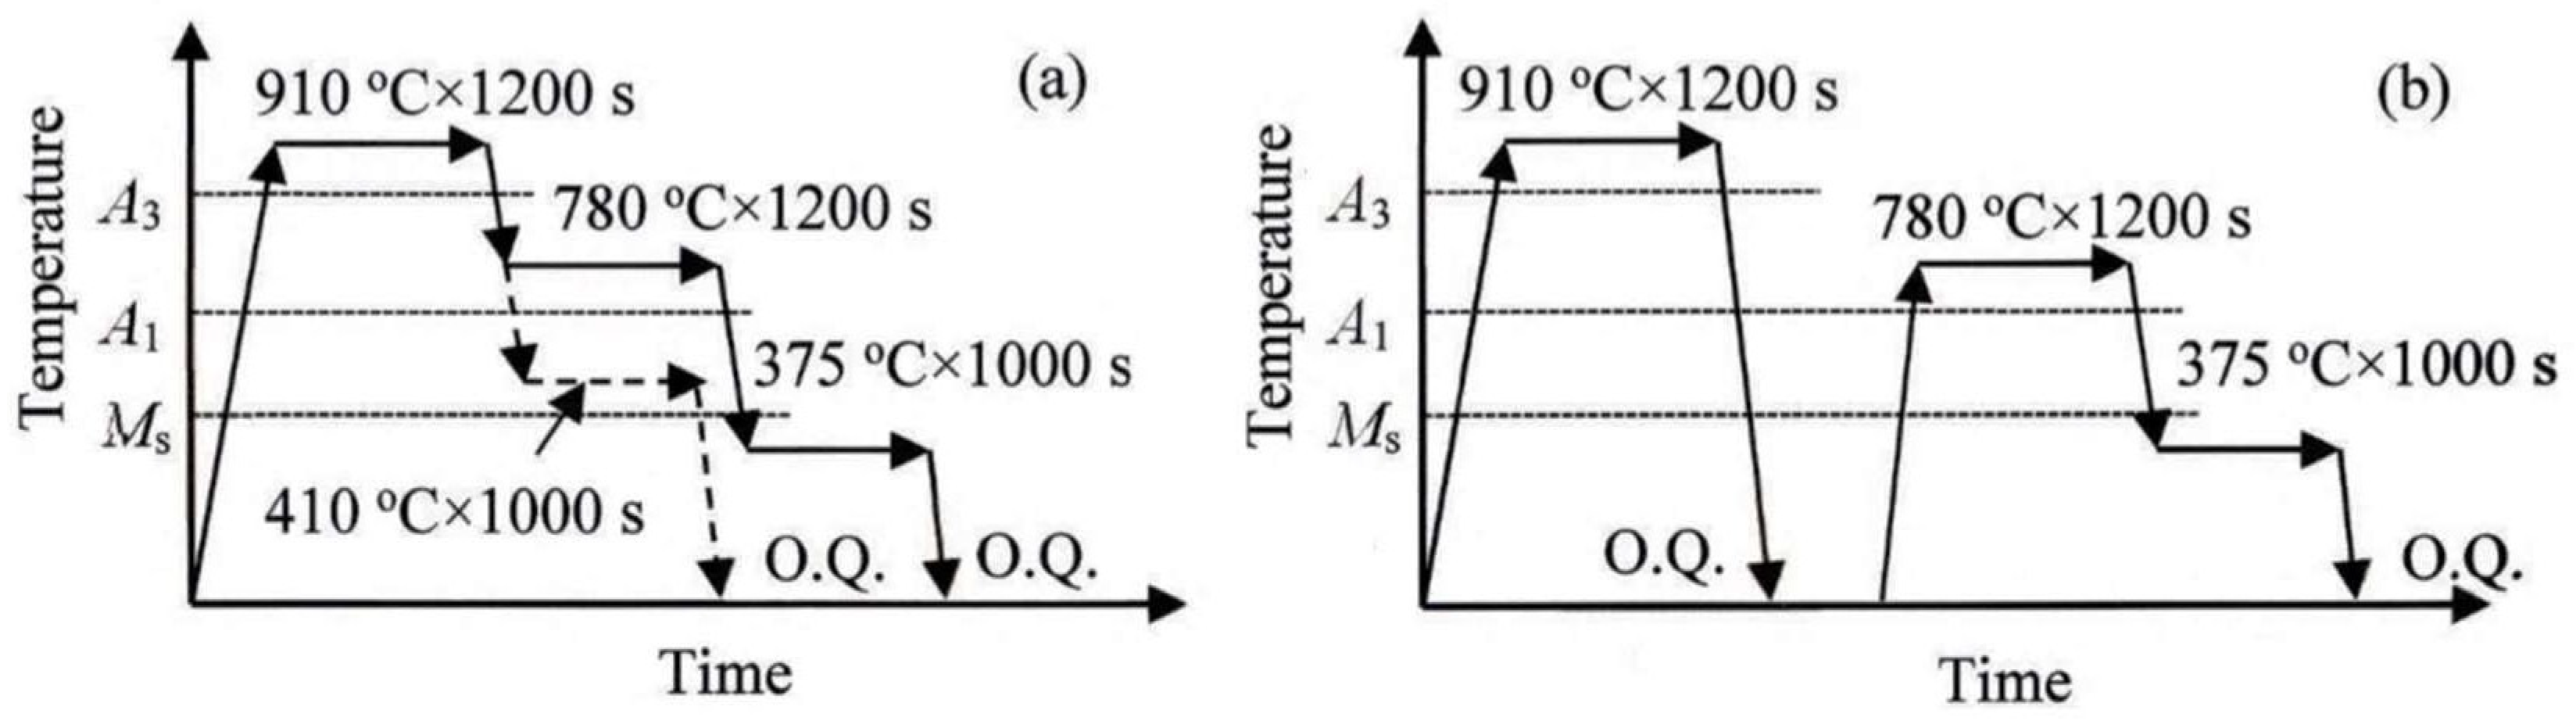
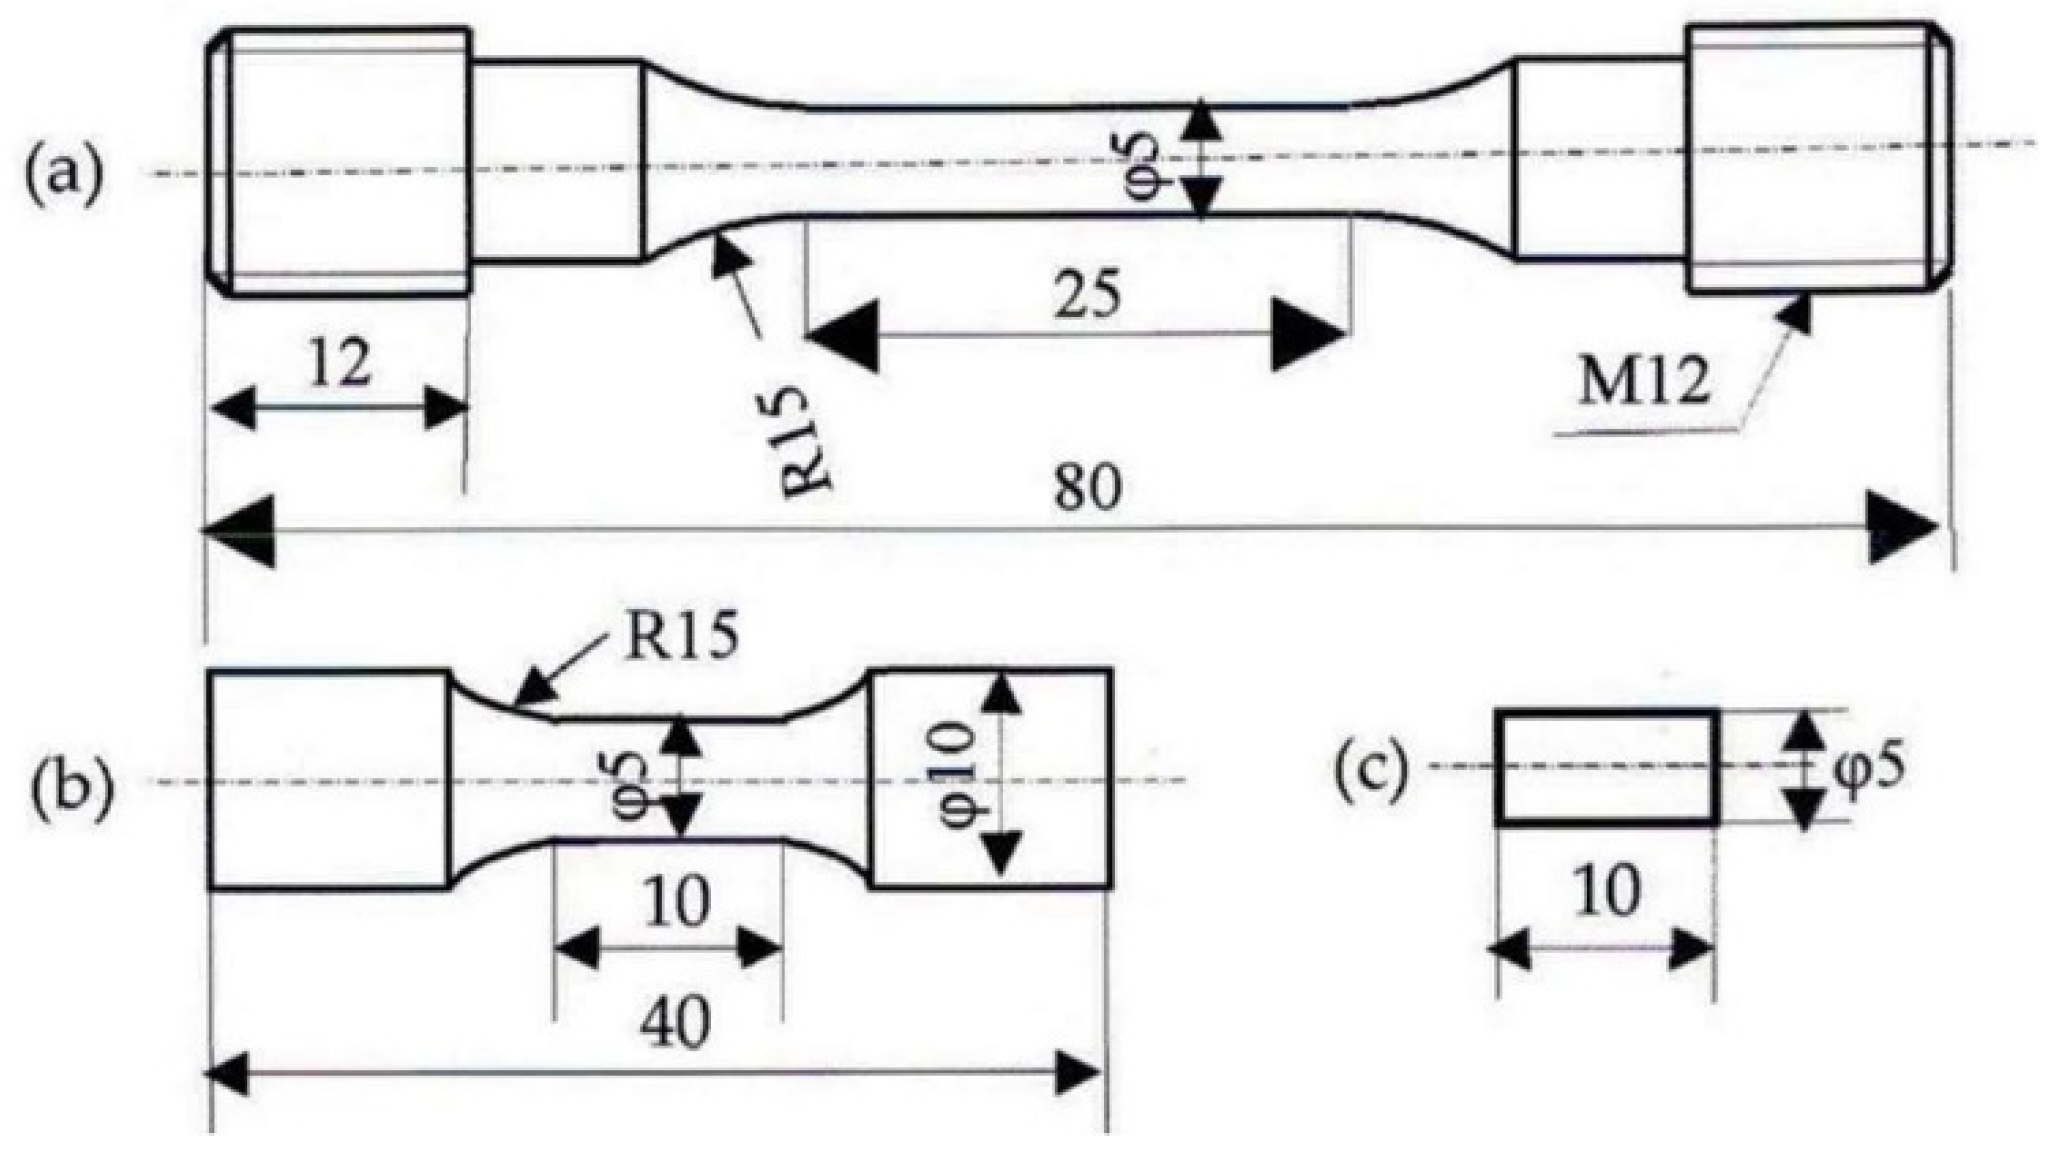
2. Materials and Methods

Low-carbon steel with the chemical composition shown in Table 1 was prepared as a 100 kg slab through vacuum melting. The slab was hot-rolled to a 13 mm diameter at a finishing temperature of 850 °C, followed by air cooling. Three kinds of heat treatment (shown in Figure 2) were carried out to produce TPF, TAM, and TBF steels. In this case, an austenitizing temperature of 910 °C, inter-critical annealing temperature of 780 °C (TPF and TAM steels), and isothermal transformation temperature of 375 °C (TPF and TAM steels) or 410 °C (>Ms, TBF steel) were adopted to obtain the maximum retained austenite fraction.
The microstructure of the steels was observed at a 3/4 radius through field-emission scanning electron microscopy (FE-SEM; JSM-6500F, JEOL Ltd., Akishima, Tokyo, Japan), which was performed using an instrument equipped with an electron backscatter diffraction system (EBSD; OIM system, TexSEM Laboratories, Inc., Prova, UT, USA). The FE-SEM-EBSD analysis was operated at an acceleration voltage of 25 kV and conducted in an area of 40 × 40 μm2 with a beam diameter of 1.0 μm and a beam step size of 0.15 μm. The specimens for FE-SEM-EBSD analysis were first ground with alumina powder and colloidal silica, and then ion-thinning was carried out.
The retained austenite characteristics of the steels were evaluated using an X-ray diffractometer (RINT2000, Rigaku Co., Akishima, Tokyo, Japan). The surfaces of the specimens were electropolished after being ground with emery paper (#1200). The volume fraction of the retained austenite phase (fγ, vol.%) was quantified from the integrated intensity of the (200)α, (211)α, (200)γ, (220)γ, and (311)γ peaks obtained through X-ray diffractometry using Mo–Kα radiation [24]. The carbon concentration in the retained austenite (Cγ, mass%) was estimated from the empirical equation proposed by Dyson and Holmes [25]. To accomplish this, the lattice constant of retained austenite was determined from the (200)γ, (220)γ, and (311)γ peaks of Cu–Kα radiation. The X-ray half-width (HW) of the (211)α peak of Cu–Kα radiation was measured to relate to the equilibrium plastic strain ( ε ¯ p ) that developed upon press-forming [26]. Takebayashi et al. [27] reported that the HW is also able to estimate the dislocation density.
To obtain various mean normal stress states, uniaxial tensile and compressive tests were conducted on a tensile testing machine (AD-10TD, Shimadzu Co., Kyoto, Japan) at 25 °C and a mean strain rate of 2.8 × 10⁻³ s−1 (crosshead speed: 10 mm/min). Torsional tests were conducted on a torsional testing machine (AG-300kNXplus, Shimadzu Co., Kyoto, Japan) at 25 °C and a torsional rate of 10 deg./min. Tensile specimens (JIS-14A, 26 mm gauge length, 5 mm diameter), torsional specimens (10 mm gauge length and 5 mm diameter), and compressive specimens (10 mm length and 5 mm diameter) were machined from the hot-rolled bars parallel to the rolling direction (Figure 3), followed by a heat treatment.
The mean normal stress was defined by
σm = (σ1 + σ2 + σ3)/3
where σ1, σ2, and σ3 are the principal stresses in directions 1, 2, and 3, respectively. The equivalent stress σ ¯ and equivalent strain ε ¯ were calculated using the von Mises criterion [28] as follows:
σ ¯ = 1 / 2 · σ x σ y 2 + σ y σ z 2 + σ z σ x 2 + 6 τ x y 2 + τ y z 2 + τ x z 2 1 / 2
ε ¯ = 2 / 3 · ε x ε y 2 + ε y ε z 2 + ε z ε x 2 + 3 / 2 · γ x y 2 + γ y z z 2 + γ z x 2 1 / 2
where σi, εi (i = x, y, z), τij, and γij (i, j = x, y, z) represent the normal stress, normal strain, shear stress, and shear strain in the X-Y-Z coordinate system, respectively. For the tensile tests, σ ¯ and ε ¯ of the necking region are calculated by
σ ¯ = P π d 2 ( 1 + 2 R d ) ln ( 1 + d 2 R )
ε ¯ = 2 ln d 0 d
where P, d, d0, and R are the applied load, the diameter of the neck cross-section, the initial diameter of the specimen, and the radius of the curvature of the neck profile, respectively [29].

3. Results

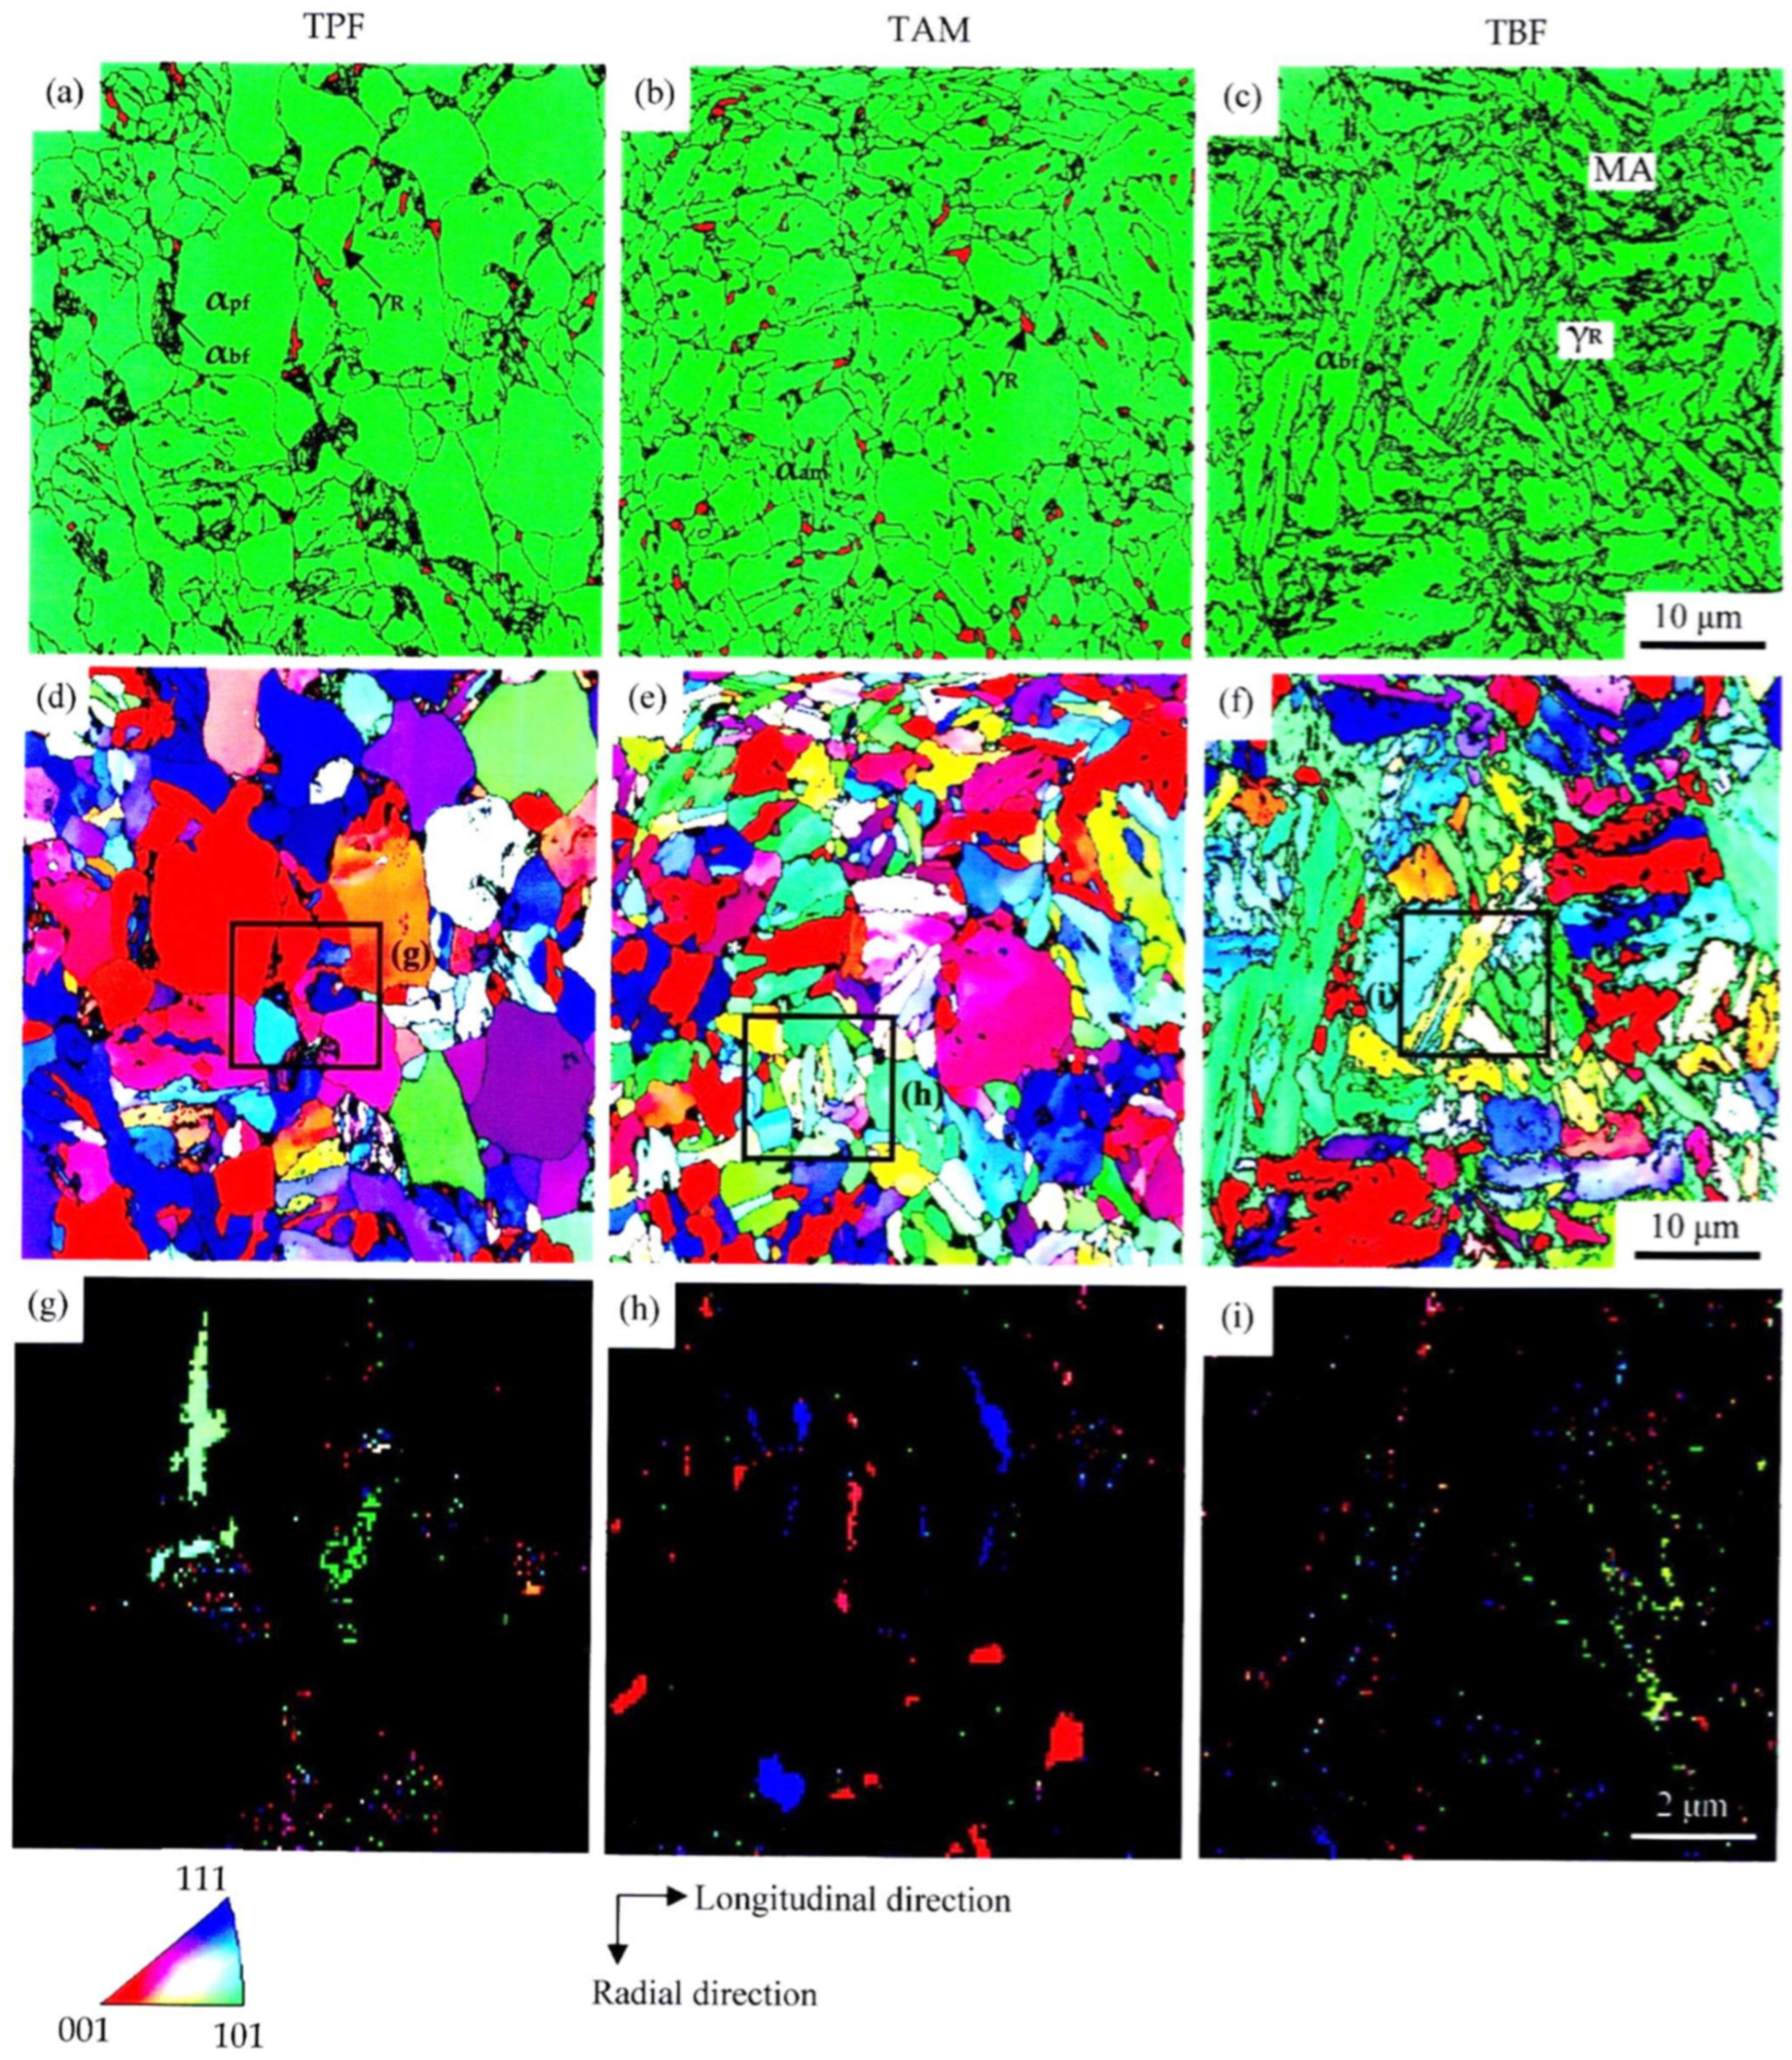
3.1. Microstructure and Retained Austenite Characteristics

Figure 4 shows the microstructures of the TPF, TAM, and TBF steels analyzed in terms of FE-SEM-EBSD. The microstructure of TPF steel consisted of polygonal ferrite, bainitic ferrite, and retained austenite (γR). The volume fraction and carbon concentration of the retained austenite were fγ0 = 8.0 vol.% and Cγ0 = 0.51 mass%, respectively (Table 2). Most of the retained austenite existed along the polygonal ferrite (αpf) grain boundary and in the bainitic ferrite (αbf) phase (Figure 4g). The carbon concentration of retained austenite in the present TPF steel was very low compared to that in TPF steels reported by other researchers [5,6,7]. The reason for this is under consideration.
The microstructure of the TAM steel was composed of annealed martensite (αam) (or tempered martensite) and retained austenite. Many retained austenite phases existed on the annealed martensite lath boundary (Figure 4h). The retained austenite seemed to be in a granular-like phase, differing from that in Ref. [7]. The volume fraction and carbon concentration were 12.4 vol.% and 0.84 mass%, respectively.
The microstructure of the TBF steel consisted of bainitic ferrite and retained austenite. Many retained austenite phases existed on the bainitic ferrite lath boundary (Figure 4i). Notably, the retained austenite was finer than that in the TPF and TAM steels (Figure 4g–i). The volume fraction and carbon concentration were 11.4 vol.% and 0.65 mass%, respectively. The volume fraction and carbon concentration were between those of the TPF and TAM steels. The TBF steel also contained a small amount of martensite–austenite (MA) phase (fMA = 2.0 vol.%).
Sugimoto et al. [7,30] reported that the dislocation density of the bainitic ferrite matrix structure was the highest in TBF steel, and the dislocation density of the annealed martensite matrix structure of TAM steel followed it. The dislocation density of the polygonal ferrite matrix structure was the lowest. It was necessary to be careful that the microstructure of the present bars after the heat treatment had a final coarse grain size and strong microstructure gradients compared to the microstructure of industrial cold-rolled sheets.

3.2. Strain-Hardening Behavior

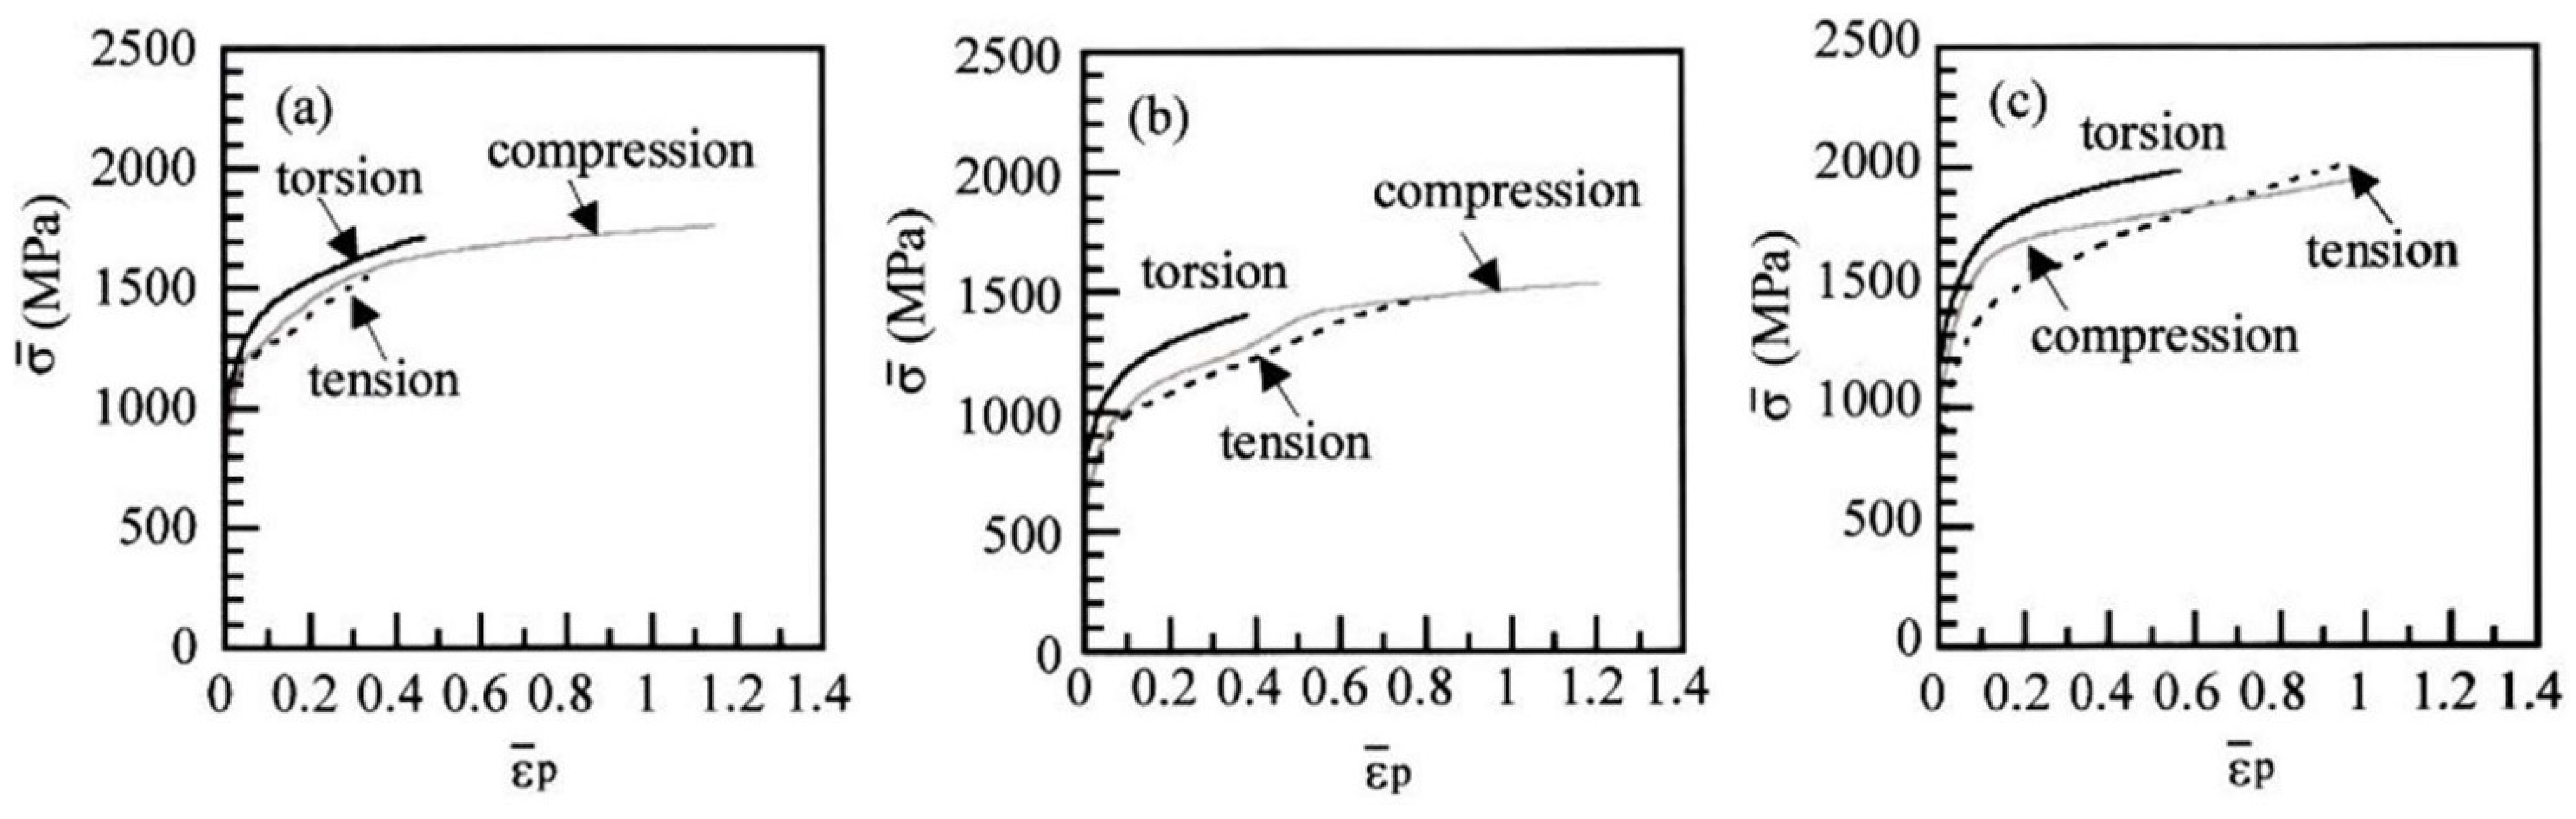
3.2.1. Flow Stress, Mechanical Properties, and Strain Hardening

Figure 5 shows the tensile, torsional, and compressive flow curves of TPF, TAM, and TBF steels. The flow stresses in the tension of the TBF steel were higher than those of the TPF and TAM steels. The TAM steel possessed the lowest flow stresses.
Table 3 shows the mechanical properties of the TPF, TAM, and TBF steels. The TAM steel exhibited the lowest yield stress (YS) and tensile strength (TS) in the tension test, as well as the lowest shear yield stress (τ0), maximum shear stress (τmax), and compressive yield stress (σ0). The tensile strength of the TBF steel was the highest, although the yield stress was between those of the TPF and TAM steels. It is noteworthy that the TAM steel had the largest uniform and total elongations (UEl and TEl) and reduction in area (RA). Also, the TBF steel had the second largest UEl, TEl, and RA after the TAM steel.
As shown in Figure 5a, the TAM steel exhibited a high strain-hardening rate in a large strain range. On the other hand, the TBF steel showed a high strain-hardening rate in an early strain range. In torsion and compression, the differences in the strain-hardening rate between the TPF, TAM, and TBF steeled tended to be relatively small compared to those in tension.
Figure 6 shows the equivalent stress–plastic strain ( σ ¯ ε ¯ p ) curves calculated from the flow curves in the tension, torsion, and compression from Figure 5. The equivalent stresses in torsion tended to be higher than those in tension and compression in all steels. The difference in the σ ¯ ε ¯ p curves for tension, torsion, and compression was smaller in the TPF steel. On the other hand, a large difference in the curves was shown in the TBF steel, with a large difference in the strain-hardening rate (Figure 6c).

3.2.2. X-ray Half-Width and Equivalent Plastic Strain Relation

Figure 7 shows the X-ray half-width and equivalent plastic strain (HW − ε ¯ p ) relations in the TPF, TAM, and TBF steels plastically deformed in tension, torsion, and compression. The HW linearly increased with increasing equivalent strain in all steels, regardless of the stress state or mean normal stress. When the HW characteristics were quantified with the HW at ε ¯ p = 0 (HW0) and the slope of the straight line (n-value), the TBF steel had a high HW0 (0.58 deg.) and a small n-value (0.133, Figure 8). In this case, the n-value of the TBF steel was measured in an equivalent strain range below ε ¯ p = 0.7. On the other hand, the TAM steel exhibited the lowest HW0 (0.44 deg.) and the largest n-value (0.187). The HW properties of the TPF steel were between those of the TBF and TAM steels. The linear relationships shown in Figure 7 were also reported by Polatidis et al. [10]. In addition, they agreed with a modified Williamson–Hall equation [27,31]. The relationships between the HW0 and n-value and the valuables in the modified Williamson–Hall equation will be investigated in the future.

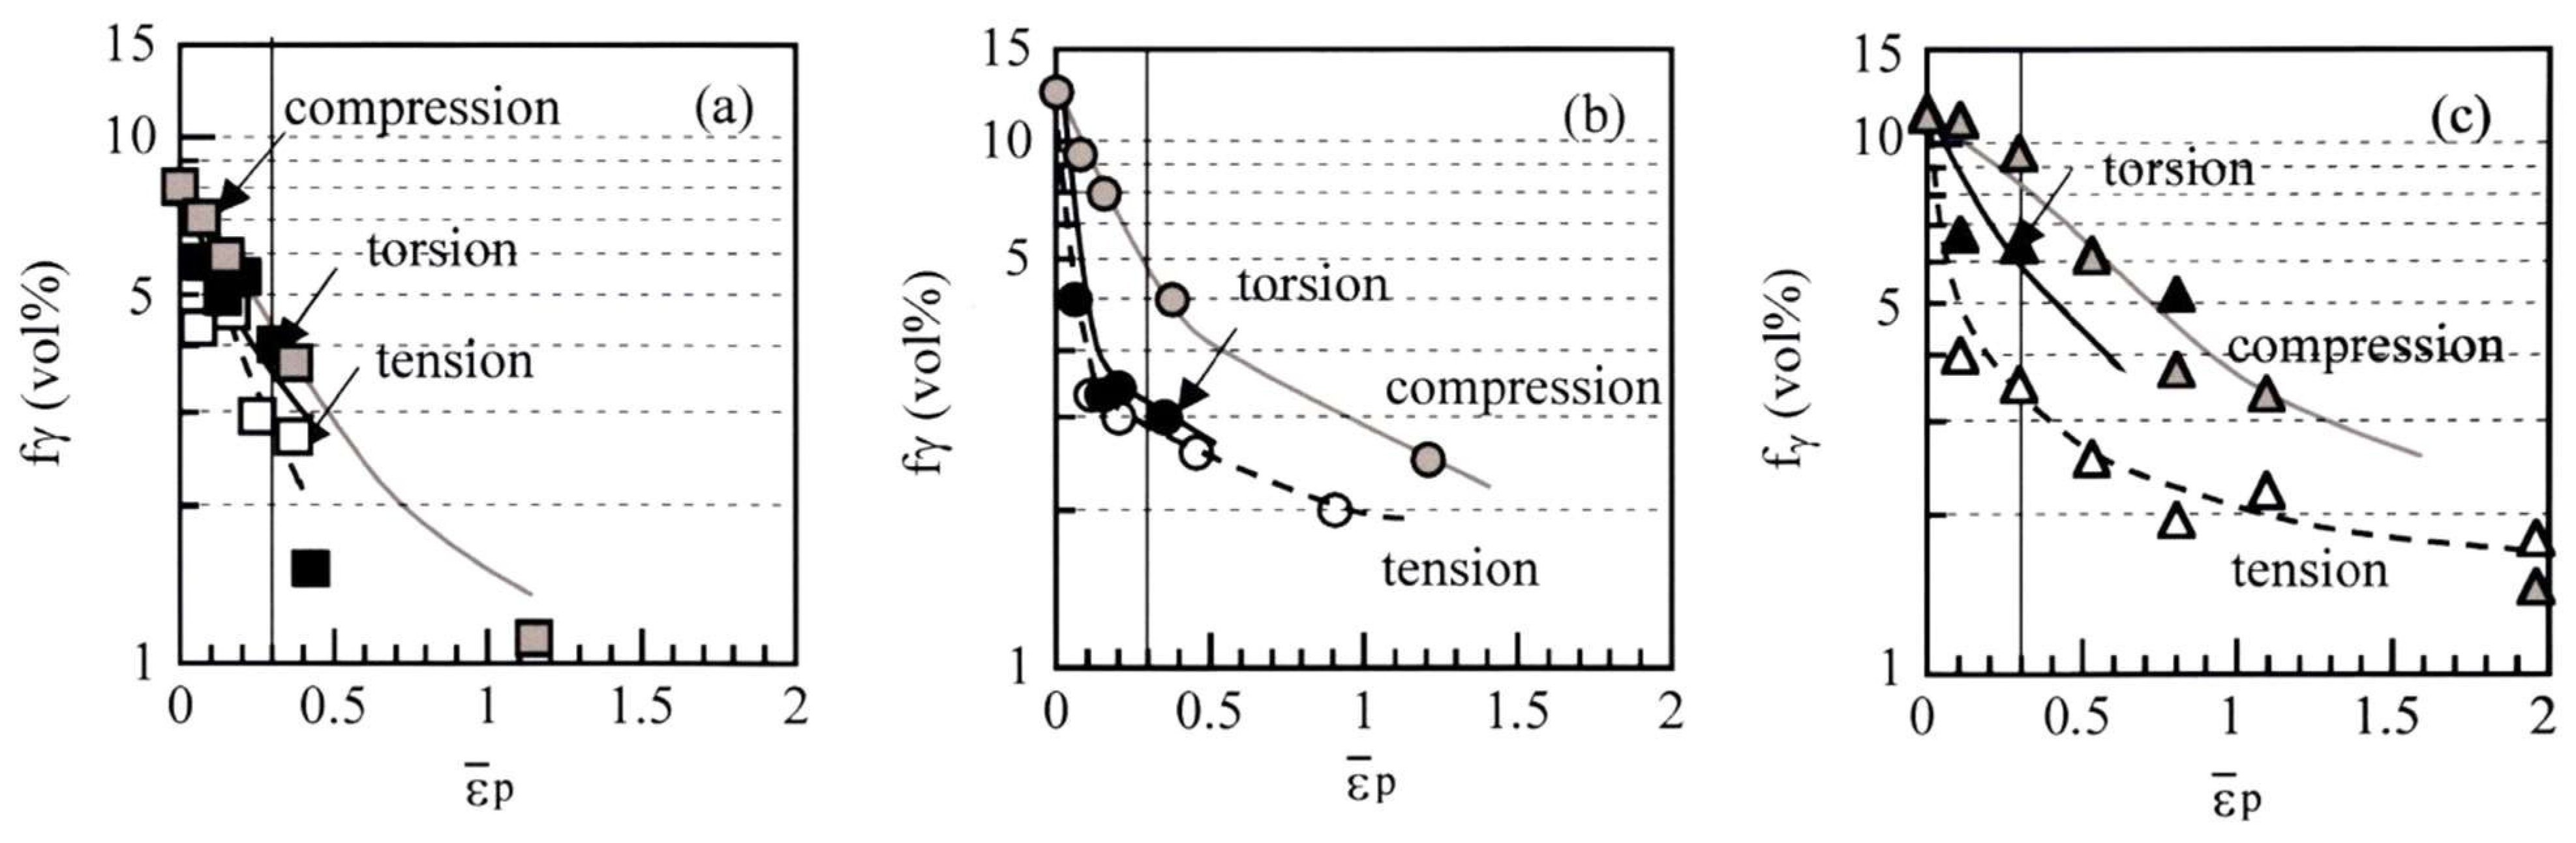
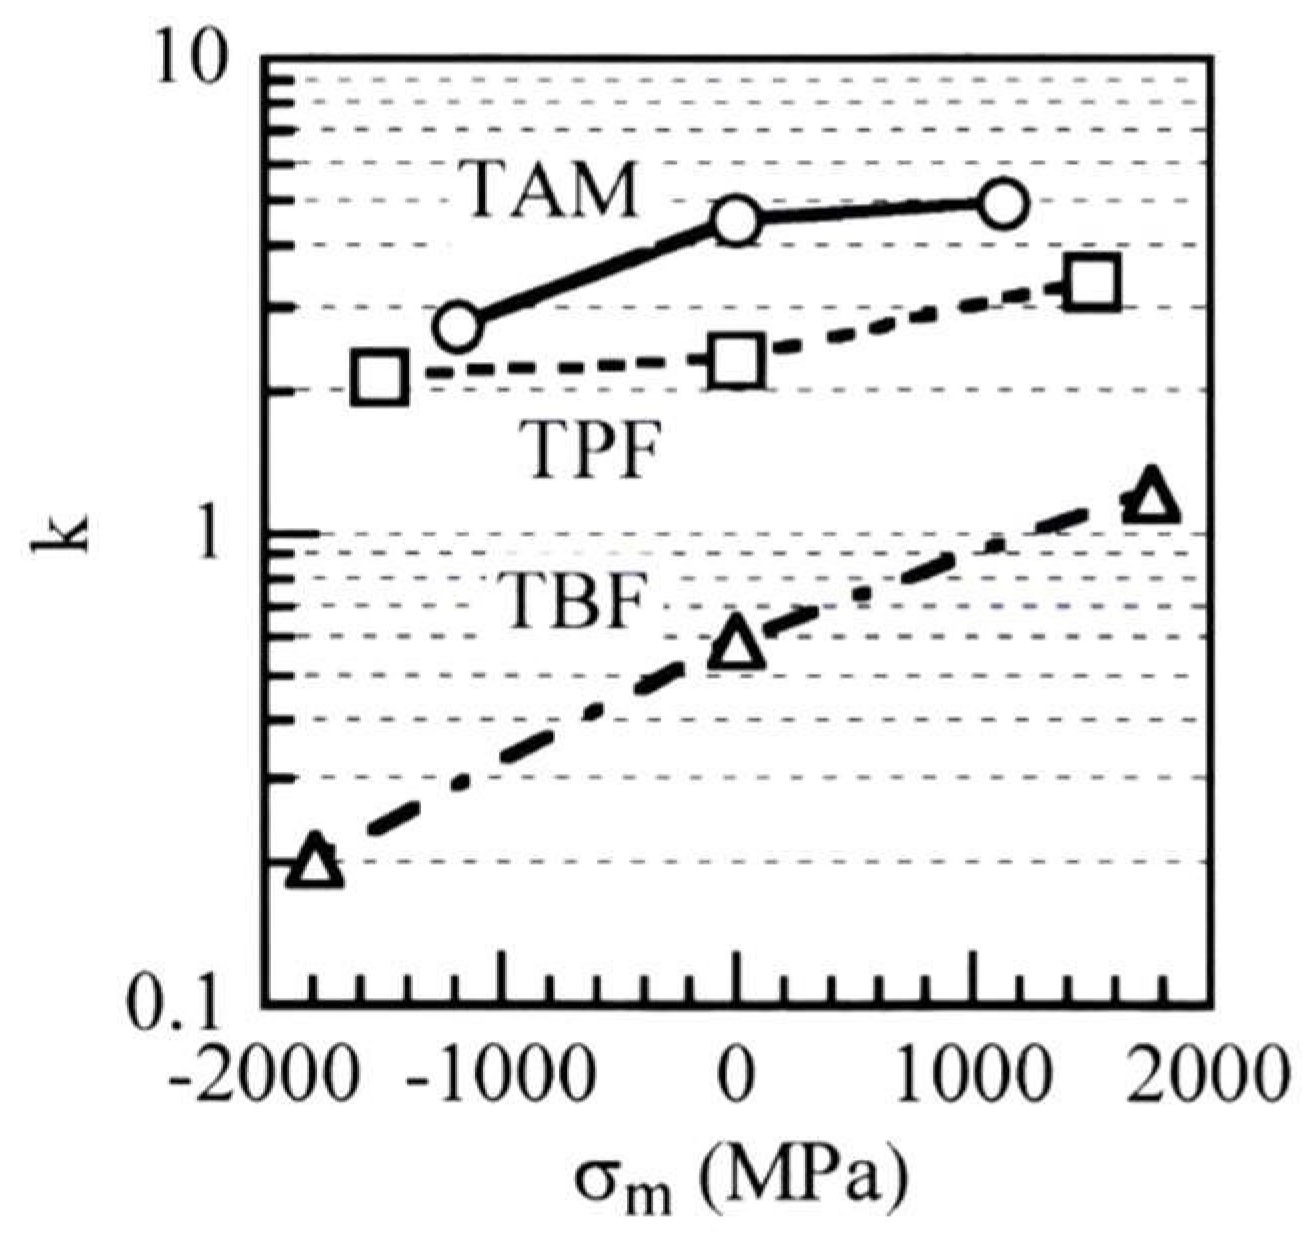
3.3. Strain-Induced Martensite Transformation Behavior

Figure 9 shows the variations in the untransformed retained austenite fraction (fγ) as a function of the equivalent strain in the TPF, TAM, and TBF steels when plastically deformed through tension, torsion, and compression. If the mechanical stability of the retained austenite was defined by the following strain-induced transformation factor (k) [5,7], the k-values in compression (a negative mean normal stress state) were the lowest in all steels (Table 2).
k = ( ln f γ 0 ln   f γ ) / ε ¯ p
In this case, the k-values were calculated in an equivalent plastic strain range of ε ¯ p = 0 and 0.3. A similar result was also reported by Kawata et al. [32].
The lowest k-value (the highest mechanical stability of retained austenite) was obtained in the TBF steel (Table 2). As shown in Figure 10, positive mean normal stress increased the k-value, especially in the TBF steel. The k-values of the TAM steel were slightly higher than those of the TPF steel.

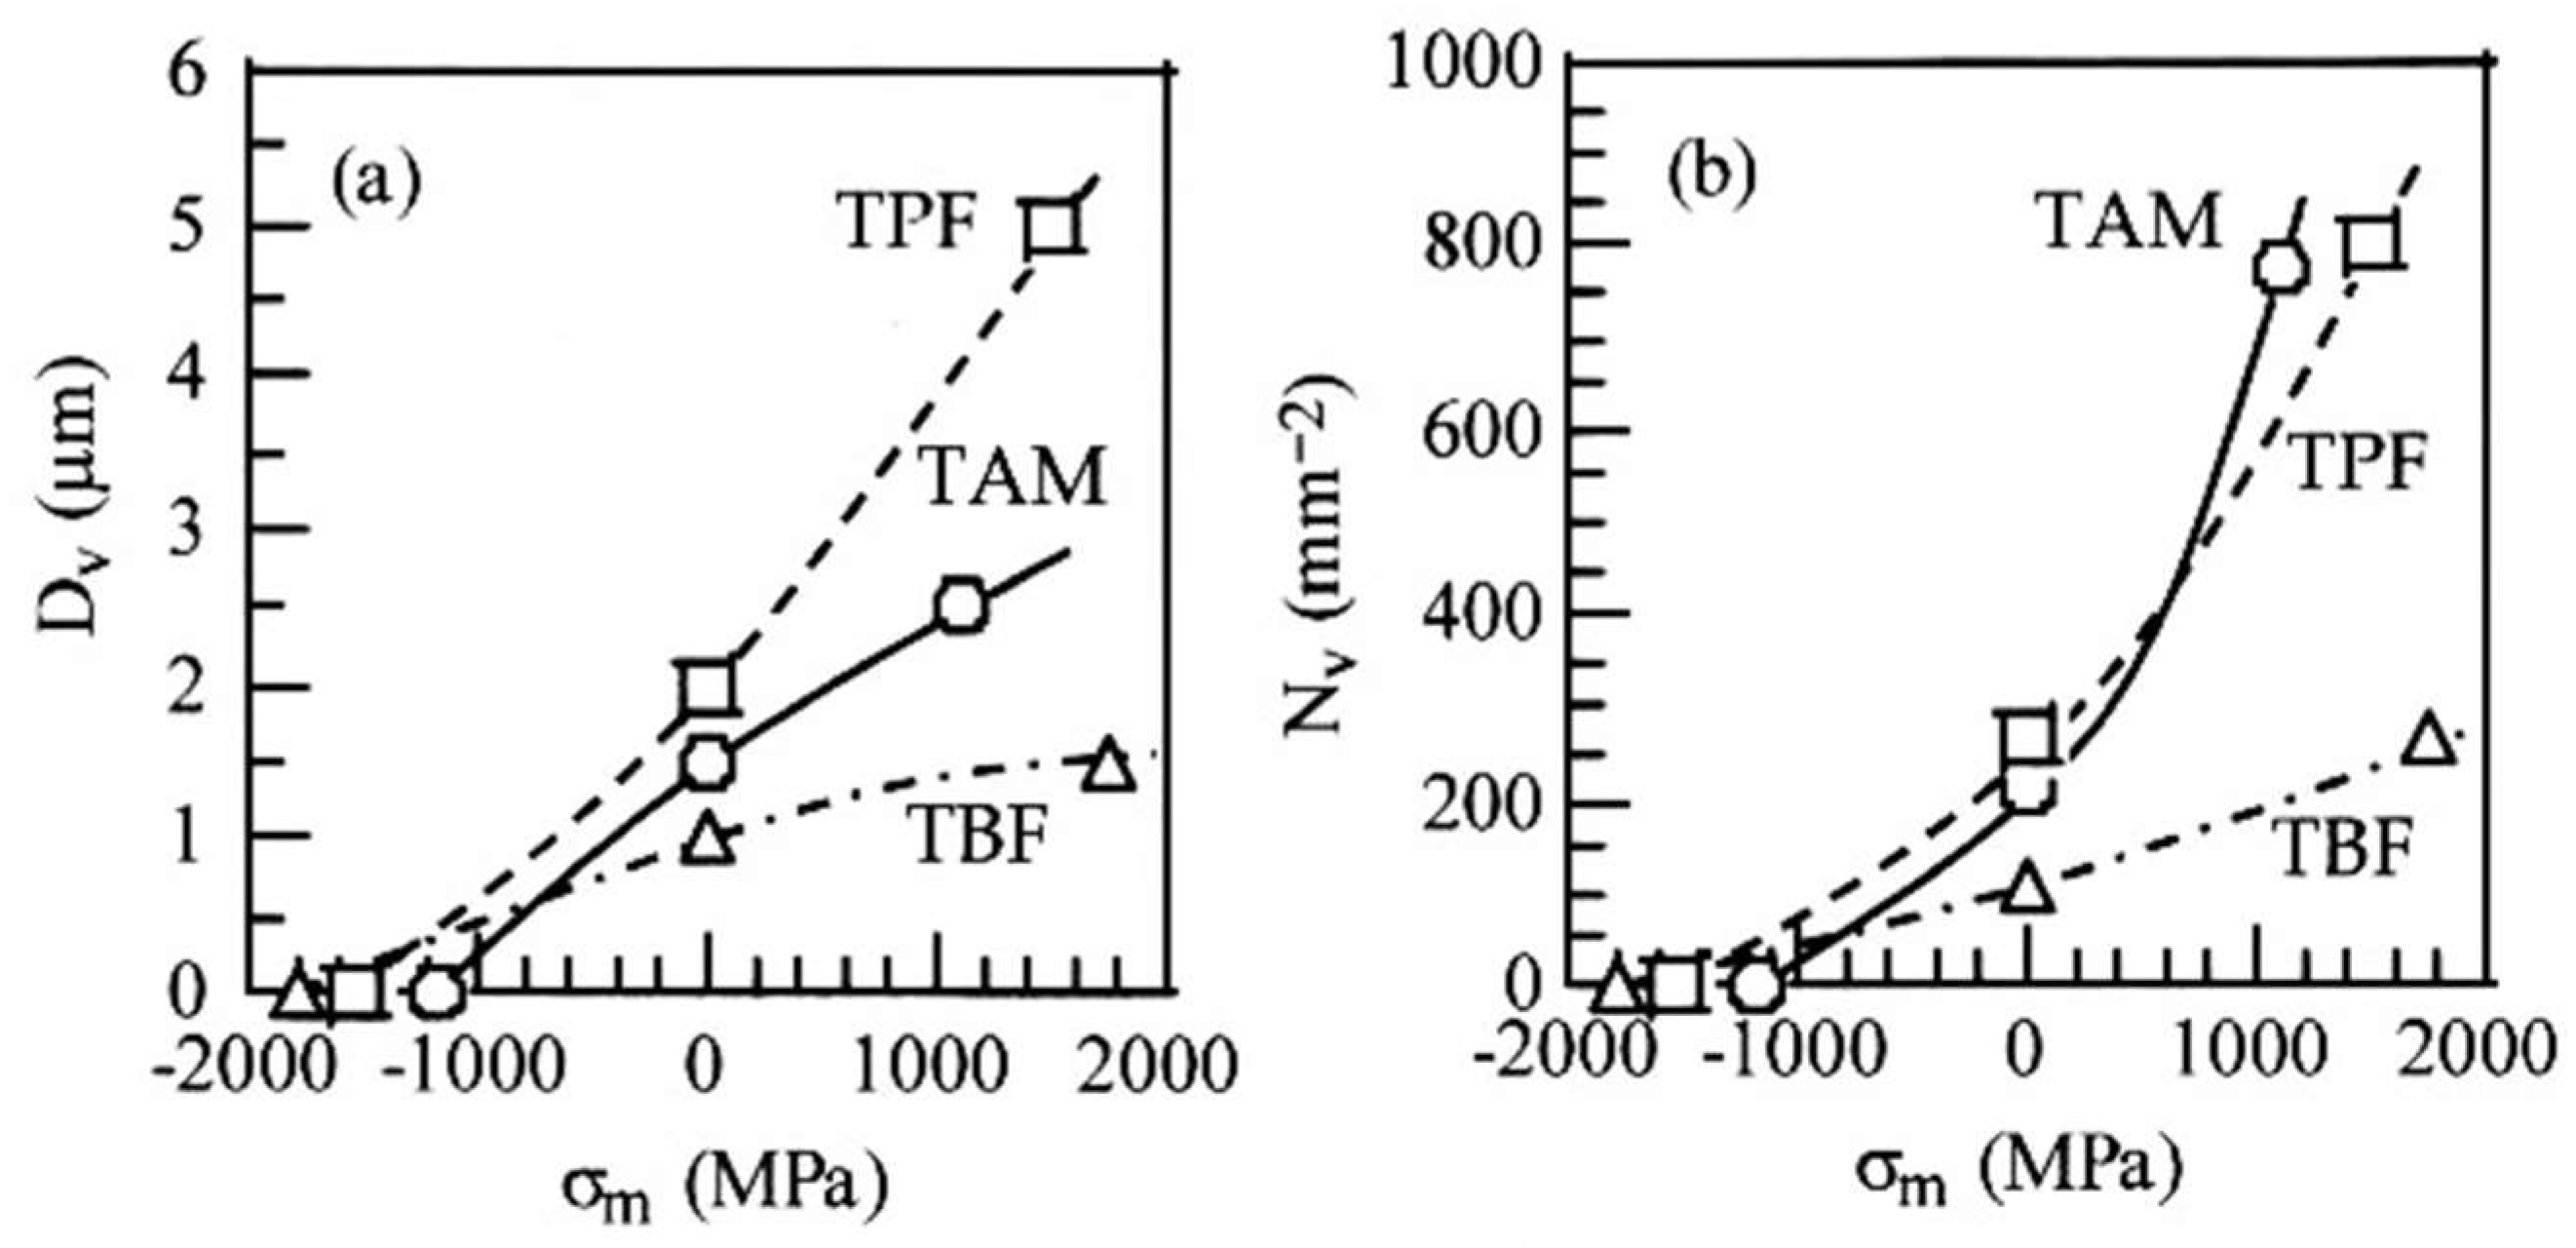
3.4. Void-Formation Behavior

Figure 11 shows FE-SEM images of voids initiated on the specimen surface in the TPF, TAM, and TBF steels when plastically deformed to ε ¯ p = 0.3 through tension, torsion, and compression. In the TPF steel, most of the voids were initiated at the interface of polygonal ferrite/bainite and polygonal ferrite/retained austenite (or strain-induced martensite). In the TAM steel, many voids seemed to be initiated at the interface of annealed martensite and retained austenite (or strain-induced martensite). Similarly, most of the voids seemed to form at the interface of bainitic ferrite and retained austenite (or strain-induced martensite) in the TBF steel. No voids were observed in any of the steels deformed through compression, except for the TAM steel (Figure 11f). These void initiation sites generally agreed with the results reported in Refs. [5,7,30,33].
Figure 12 shows the relations of the number of voids with the mean normal stress (Nvσm) and of the void size with the mean normal stress (Dvσm) in the TPF, TAM, and TBF steels when plastically deformed to ε ¯ p = 0.3. Figure 13 shows the relation between the mean number of voids and the mean size of voids in the TPF, TAM, and TBF steels subjected to different equivalent plastic strains. In all steels, positive mean normal stress considerably promoted void formation. A large number and a large size of voids were formed in the TPF steel. On the other hand, the void formation was considerably suppressed in the TBF steel. In the TAM steel, an intermediate void size was observed, although the number of voids was as high as that in the TPF steel.

4. Discussion

4.1. Effect of Mean Normal Stress on Strain-Hardening Behavior

As shown in Figure 5, the differences in the strain-hardening rate among the TPF, TAM, and TBF steels were large in the positive mean normal stress state and were relatively small in zero and negative mean normal stress states. This implied that the strain-hardening behavior was strongly controlled by positive mean normal stress compared to the zero and negative mean normal stress states. In the following, the differences in the strain-hardening behavior in the positive mean normal stress state in the TPF, TAM, and TBF steels are discussed.
In general, the flow stress of TPF, TAM, and TBF steels [5,6] is decided by the following ((i) to (iv)):
(i)
The flow stress of the matrix structure;
(ii)
Long-range internal stress hardening, which results from the difference in plastic strain between the matrix structure and the second phase (retained austenite, strain-induced martensite, MA phase, etc.) [34];
(iii)
Strain-induced transformation hardening, which results from an increase in the strain-induced martensite fraction. The transformation relaxes the localized stress concentration through an expansion strain [35];
(iv)
Forest dislocation hardening, which is estimated with the Ashby equation [36].
Points (ii) to (iv) exhibit the strain-hardening resulting from the second phase. Considering these hardenings, the high strain-hardening rate in an early strain range in TBF steel may reflect the characteristics of the bainitic ferrite matrix structure in point (i), as well as the strain-induced martensite hardening in point (iii) due to the large amount and high mechanical stability of retained austenite; in addition, the long-range internal stress hardening in point (ii) is reflected by a small amount of the MA phase. On the other hand, the high strain-hardening rate in a large strain range of TAM steel is considered to be mainly associated with the long-range internal stress hardening described in point (ii) and the strain-induced transformation hardening described in point (iii) due to the large amount of retained austenite, as well as the soft annealed martensite matrix structure.
As shown in Figure 6, the equivalent stresses in torsion were higher than those in tension and compression in all steels. This was because the von Mises criterion was applied to calculate σ ¯ and ε ¯ p . In addition, the differences in the equivalent stress and strain-hardening rate for tension, torsion, and compression were larger in TBF steel (Figure 6c). This may have been associated with high flow stress.

4.2. Effect of Mean Normal Stress on Strain-Induced Martensite Transformation Behavior

As shown Figure 9 and Figure 10, the k-values increased with increasing mean normal stress in the TPF, TAM, and TBF steels, although the k-values were different for each steel. According to Hiwatashi et al. [8], Takahashi [9], and Polatidis et al. [10], stretch-forming (equi-biaxial tension or positive mean normal stress) significantly enhanced the strain-induced martensite transformation in 0.11C-1.18Si-1.55Mn [8,9] and 0.20C-1.46Si-2.48Mn [10] TPF steels. In this case, the strain-induced transformation of the shrink-flanging (compression or negative mean normal stress) was considerably suppressed, and the strain-induced transformation of uniaxial tension was slightly suppressed compared to the stretch-forming. Sugimoto et al. [5] also reported a similar result in 0.2C-(1.0–2.5)Si-(1.0–2.0)Mn TPF and TAM steels subjected to stretch-forming and uniaxial tension. They explained these results as follows: A positive mean normal stress assists the strain-induced martensite transformation because it results in an expansion strain.
As shown in Figure 9 and Figure 10, the lowest k-values were obtained in the TBF steel when they were calculated in an equivalent strain range between 0 and 0.3. This may have been associated with the fine retained austenite because the carbon concentration of the retained austenite was not necessarily high (Table 2). In Figure 10, the k-values in the tension, torsion, and compression of the TAM steel were higher than those of the TPF steel. Sugimoto et al. [5] reported the opposite result. This was because the present TAM steel had a coarser matrix structure and more granular-like retained austenite than the TAM steel in Ref. [5], as shown in Figure 4b,e,h.

4.3. Effect of Mean Normal Stress on Void-Formation Behavior

As shown in Figure 11, Figure 12 and Figure 13, void formation was promoted by a positive mean normal stress in the TPF, TAM, and TBF steels. This was because the positive mean stress easily developed expansion stress/strain, which promoted void/crack initiation and growth.
The mean normal stress dependences of the size and number of voids were prominent in the TPF and TAM steels, although the TAM steel had a smaller void size than that of the TPF steel. On the other hand, in the TBF steel, the void formation was considerably suppressed compared to that in the TPF and TAM steels. According to Azuma et al. [37], Shoji et al. [38], Archie et al. [39], and Kikuzuki et al. [40], void formation was mainly influenced by the strain partitioning between ferrite (matrix structure) and martensite (second phase), strain localization, and the critical strain required for void formation in dual-phase ferrite–martensite steel. Reducing the difference in the hardness between martensite and ferrite or in the strength ratio of martensite to ferrite (the strength ratio) slowed the void/crack initiation on the martensite/ferrite interface by decreasing the localized stress concentration. The difference in the hardness was equivalent to the previously mentioned strength ratio. Matsuno et al. [41] suggested that the size and volume fraction of martensite controlled void formation in 0.036/0.067C-0.5Si-1.5Mn dual-phase ferrite–martensite steels. On the other hand, in 0.22C-0.27Si-1.89Mn-1.54Al TPF steel, the low k-value or high mechanical stability of retained austenite suppressed void formation through the effective relaxation of localized stress concentration at the matrix structure/second phase interface [6,7,32]. Sugimoto et al. [7] showed that many voids were initiated at the matrix/second phase interface in 0.20C-1.5Si-1.5Mn TAM and TBF steels. Tang et al. [19] reported that tiny micro-voids were observed in the fine bainite region with a film-like MA phase in 0.20C-1.40Si-1.70Mn-0.045Nb CFB steel.
In this research, the TPF steel was characterized by a high strength ratio, a coarse micro-structure, and a small amount of retained austenite, although the k-value was lower than that of the TAM steel (Figure 10). Therefore, the high strength ratio and coarse microstructure may have contributed to the easy void initiation and growth in the TPF steel. A smaller void size in TAM steel may be associated with a lower strength ratio than that of TPF steel. In the TBF steel, the flow stress of the bainitic ferrite matrix structure was nearly the same as that of retained austenite [11]. So, the strength ratio was very small. In addition, the TBF steel had a fine lath structure. Although the strain-induced martensite had a high flow stress, the retained austenite had smaller k-values and was much finer than that in the TPF and TAM steels (Figure 4i). Therefore, the low strength ratio, fine microstructure, and mechanically stable fine retained austenite are considered to bring difficulty in void initiation and growth. Alt hough the TBF steel contained a small amount of MA phase, the negative contribution to void initiation/growth behavior was estimated to be small.

5. Conclusions

The effects of the mean normal stress on the strain-hardening, strain-induced transformation, and void-formation behaviors of the TPF, TAM, and TBF steels were investigated to analyze various types of formability. In addition, these behaviors were related to the microstructural properties, such as the matrix structure, retained austenite characteristics, and second phase. The main results are summarized as follows.
(1)
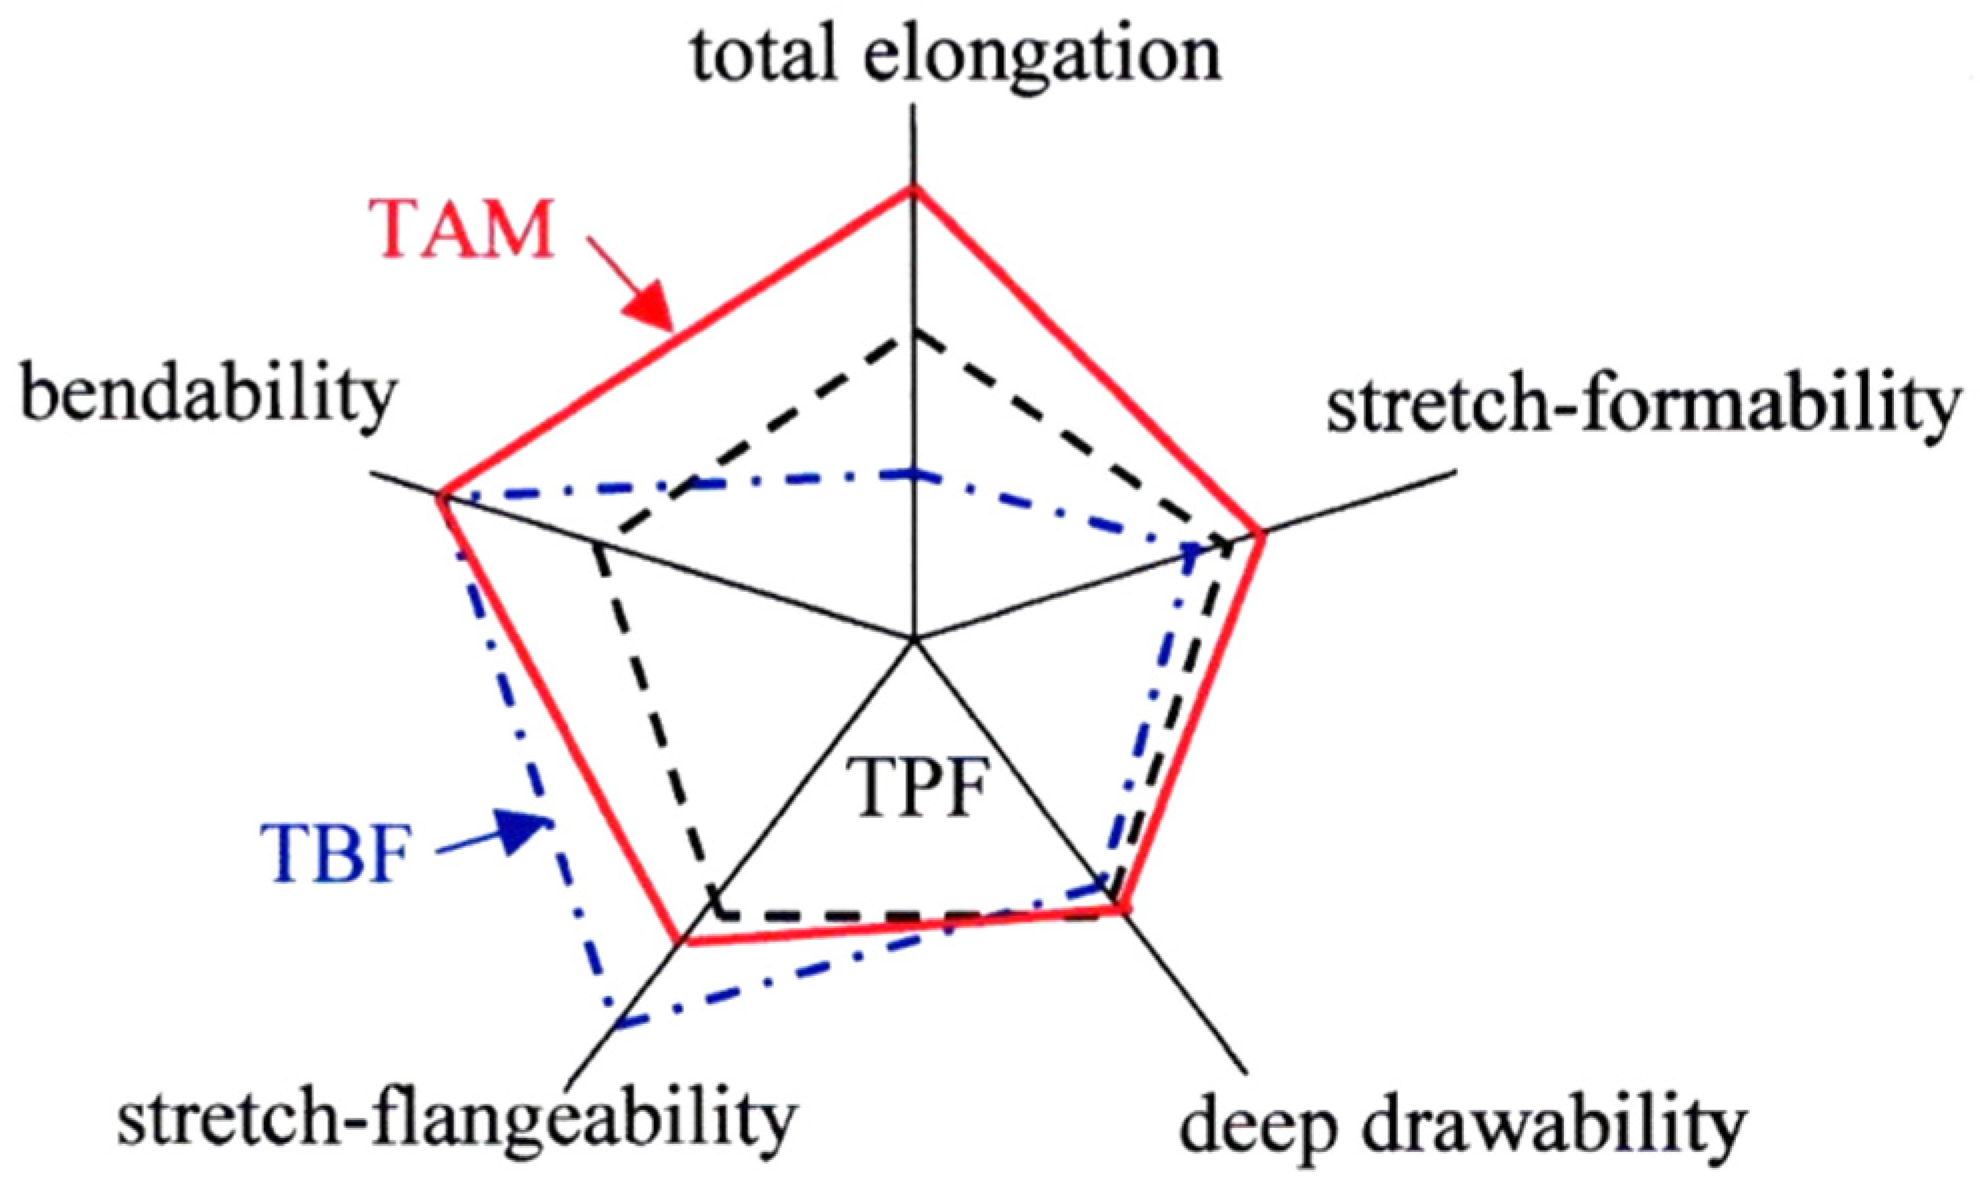
The highest volume fraction of retained austenite was achieved in the TAM steel, although the mechanical stability was the lowest. The TPF steel had the lowest retained austenite fraction. The mechanical stability of retained austenite was between that of the TAM and TBF steels. The TBF steel possessed a high retained austenite fraction second to that of the TAM steel, with high a mechanical stability due to the refined retained austenite.
(2)
A large difference in the σ ¯ ε ¯ p curves for tension, torsion, and compression was shown in the TBF steel, with a large difference in the strain-hardening rate. In the positive mean normal stress state, the TAM and TBF steels had high strain-hardening rates in an early strain range and a large strain range, respectively, which resulted from the large amounts of retained austenite and the matrix structure. The strain-hardening behavior was hardly influenced by zero and negative mean normal stresses in all steels.
(3)
The equivalent plastic strain was linearly related to the X-ray half-width in all mean normal stress states, which enabled the estimation of the equivalent stress in press-formed products. In this case, the TAM steel exhibited the lowest HV0 and the largest n-value. On the other hand, TBF showed the largest HV0.
(4)
The positive mean normal stress promoted the strain-induced martensitic transformation, especially in the TBF steel, with the high mechanical stability of retained austenite. This was because the positive mean normal stress promoted the expansion strain.
(5)
The positive mean normal stress considerably promoted void-formation behavior by developing the expansion stress/strain, especially in the TPF steel. The effect of the mean normal stress on the void formation behavior in the TBF steel was smaller than those in the TPF and TAM steels because of the low strength ratio, fine matrix structure, and high mechanical stability of retained austenite.

Author Contributions

Conceptualization, K.-i.S.; methodology, K.-i.S. and S.S.; formal analysis, K.-i.S., and S.S.; investigation, S.S. and J.K.; resources, K.-i.S.; data curation, K.-i.S., S.S., and J.K.; writing—original draft preparation, S.S.; writing—review and editing, K.-i.S.; visualization, S.S.; supervision, K.-i.S. and J.K. All authors have read and agreed to the published version of the manuscript.

Funding

This research received no external funding.

Institutional Review Board Statement

Not applicable.

Informed Consent Statement

Not applicable.

Data Availability Statement

Data is contained within the article.

Conflicts of Interest

The author declares no conflicts of interest.

References

  1. Senuma, T. Physical metallurgy of modern high strength steel sheets. ISIJ Int. 2001, 42, 520–532. [Google Scholar] [CrossRef]
  2. Rana, R.; Singh, S.B. Automotive Steels—Design, Metallurgy, Processing and Applications; Woodhead Publishing: Cambridge, UK, 2016; pp. 1–469. [Google Scholar]
  3. Bleck, W.; Guo, X.; Ma, Y. The TRIP effect and its application in cold formable sheet steel. Steel Res. Int. 2017, 88, 1700218. [Google Scholar] [CrossRef]
  4. Krizan, D.; Steineder, K.; Kaar, S.; Hebesberger, T. Development of third generation advanced high strength steels for automotive applications. In Proceedings of the 19th International Scientific Conference Transfer 2018, Trencin, Slovakia, 22–23 November 2018; pp. 1–15. [Google Scholar]
  5. Sugimoto, K.; Kobayashi, M.; Nagasaka, A.; Hashimoto, S. Warm stretch-formability of TRIP-aided dual-phase sheet steels. ISIJ Int. 1995, 35, 1407–1414. [Google Scholar] [CrossRef]
  6. Sugimoto, K. Fracture strength and toughness of ultra high strength TRIP aided steels. Mater. Sci. Technol. 2009, 25, 1108–1117. [Google Scholar] [CrossRef]
  7. Sugimoto, K.; Kanda, A.; Kikuchi, R.; Hashimoto, S.; Kashima, T.; Ikeda, S. Ductility and formability of newly developed high strength low alloy TRIP-aided sheet steels with annealed martensite matrix. ISIJ Int. 2002, 42, 910–915. [Google Scholar] [CrossRef]
  8. Hiwatashi, S.; Takahashi, M.; Katayama, T.; Usuda, M. Effect of deformation-induced transformation on deep drawability—Forming mechanism of TRIP type high-strength steel sheet. J. Jpn. Soc. Technol. Plast. 1994, 35, 1109–1114. [Google Scholar]
  9. Takahashi, M. Development of high strength steels for automobiles. Nippon. Steel Tech. Rep. 2003, 88, 2–7. [Google Scholar]
  10. Polatids, E.; Haidemenopoulos, G.N.; Krizan, D.; Aravas, N.; Panzner, T.; Šmíd, M.; Papadioti, I.; Casati, N.; Van Petegem, S. Experimental investigation and modelling the transformation kinetics. Mater. Sci. Eng. A 2021, 800, 140321. [Google Scholar] [CrossRef]
  11. Sugimoto, K.; Misu, M.; Kobayashi, M.; Shirasawa, H. Effects of second phase morphology on retained austenite morphology and tensile properties in a TRIP-aided dual-phase steel sheet. ISIJ Int. 1993, 33, 775–782. [Google Scholar] [CrossRef]
  12. Fan, D.; Fonstein, N.; Jun, H. Effect of microstructure on tensile properties and cut0edge formability of DP, TRIP, Q&T and Q&P steels. AIST Trans. 2016, 13, 180–186. [Google Scholar]
  13. Barnwal, V.K.; Lee, S.; Yoon, S.; Kim, J.; Barlat, F. Fracture characteristics of advanced high strength steels during hole expansion test. Int. J. Fract. 2020, 224, 217–233. [Google Scholar] [CrossRef]
  14. Matsumura, O.; Sakuma, Y.; Ishii, Y.; Zhao, J. Effect of retained austenite on formability of high strength sheet steels. ISIJ Int. 1992, 32, 1110–1116. [Google Scholar] [CrossRef]
  15. Rana, R.; Chen, S.; Haldar, A.; Das, S. Mechanical properties of a bainitic steel producible by hot rolling. Arch. Metall. Mater. 2017, 62, 2331–2338. [Google Scholar] [CrossRef]
  16. Toji, Y.; Nakagaito, T.; Matsuda, H.; Hasegawa, K.; Kaneko, S. Effect of microstructure on mechanical properties of quenching and portioning steel. ISIJ Int. 2023, 63, 758–765. [Google Scholar] [CrossRef]
  17. Kim, J.; Kwon, M.; Lee, J.; Lee, S.; Lee, K.; Suh, D. Influence of isothermal treatment prior to initial quenching of Q&P process on microstructure and mechanical properties of medium Mn steel. ISIJ Int. 2021, 61, 518–526. [Google Scholar]
  18. Weiβensteiner, I.; Suppan, C.; Hebesberger, T.; Winkelhofer, F.; Clemens, H.; Maier-Kiener, V. Effect of morphological differences on the cold formability of an isothermally heat-treated advance high-strength steel. JOM 2018, 70, 1567–1575. [Google Scholar] [CrossRef]
  19. Tang, S.; Lan, H.; Liu, Z.; Wang, G. Enhancement of balance in strength, ductility and stretch flangeability by two-step aus tempering in a 1000 MPa grade cold rolled bainitic steel. Metals 2021, 11, 96. [Google Scholar] [CrossRef]
  20. Huyghe, P.; Dépinoy, S.; Caruso, M.; Mercier, D.; Georges, C.; Malet, L.; Godet, S. On the effect of Q&P processing on the stretch-flange-formability of 0.2C ultra-high strength steel sheets. ISIJ Int. 2018, 58, 1341–1350. [Google Scholar]
  21. Im, Y.; Kim, E.; Song, T.; Lee, J.; Suh, D. Tensile properties and stretch-flangeability of TRIP steels produced by quenching and partitioning (Q&P) process with different fractions of constituent phases. ISIJ Int. 2021, 61, 572–581. [Google Scholar]
  22. Kim, J.; Seo, E.; Kwon, M.; Kang, S.; De Coomn, B.C. Effect of quenching temperature on stretch flangeability of a medium Mn steel processed by quenching and partitioning. Mater. Sci. Eng. A 2018, 729, 276–284. [Google Scholar] [CrossRef]
  23. Chang, Y.; Han, S.; Li, X.; Wang, C.; Zheng, G.; Dong, H. Effect of shearing clearance on formability of the third generation automotive medium-Mn steel with metastable austenite. J. Mater. Process. Technol. 2018, 259, 216–227. [Google Scholar] [CrossRef]
  24. Maruyama, H. X-ray measurement of retained austenite. Jpn. Soc. Heat Treat. 1977, 17, 198–204. [Google Scholar]
  25. Dyson, D.J.; Holmes, B. Effect of alloying additions on the lattice parameter of austenite. J. Iron Steel Inst. 1970, 208, 469–474. [Google Scholar]
  26. Cullity, B.D. Elements of X-ray Diffraction, 2nd ed.; Addison-Wesley Publishing Company, Inc.: Boston, MA, USA, 1978; p. 287. [Google Scholar]
  27. Takebayashi, S.; Kunieda, T.; Yoshinaga, N.; Ushioda, K.; Ogata, S. Comparison of the dislocation density in martensitic steels evaluated by some X-ray diffraction methods. ISIJ Int. 2010, 50, 875–882. [Google Scholar] [CrossRef]
  28. Hill, R. The Mathematical Theory of Plasticity; Oxford University Press: New York, NY, USA, 1985; p. 20. [Google Scholar]
  29. Bridgman, P.W. Studies in Large Plastic Flow and Fracture; McGraw Hill: New York, NY, USA, 1952; pp. 9–37. [Google Scholar]
  30. Sugimoto, K.; Sakaguchi, J.; Iida, T.; Kashima, T. Stretch-flangeability of a high-strength TRIP type bainitic steel. ISIJ Int. 2000, 40, 920–926. [Google Scholar] [CrossRef]
  31. Williamson, G.K.; Hall, W.H. X-ray line broadening from filed aluminum and wolfram. Acta Metall. 1953, 1, 22–31. [Google Scholar] [CrossRef]
  32. Kawata, H.; Yasutomi, T.; Shirakami, S.; Nakamura, K.; Sakurada, E. Deformation-induced martensite transformation behavior during tensile and compressive deformation in low-alloy TRIP steel sheets. ISIJ Int. 2021, 61, 527–536. [Google Scholar] [CrossRef]
  33. Castanheira, B.C.; Moreira, L.P.; do Nacimento, G.O.; Santos, R.O.; de Avila Santiago, G.A.; de Oliveira, I.S.; da Silva, F.R.F. Void formation and strain-induced martensite transformation in TRIP780 steel sheet submitted to uniaxial tensile loading. Mater. Res. 2019, 22 (Suppl. S1), e20190245. [Google Scholar] [CrossRef]
  34. Mura, T.; Mori, T. Micromechanics; Baifukan Co., Ltd.: Tokyo, Japan, 1976; p. 23. [Google Scholar]
  35. Sakaki, T.; Sugimoto, K.; Fukuzato, T. Role of internal stress for continuous yielding of dual-phase steels. Acta Metall. 1983, 31, 1737–1746. [Google Scholar] [CrossRef]
  36. Ashby, M.F. Work hardening of dispersion-hardened crystals. Philos. Mag. 1966, 14, 1157–1178. [Google Scholar] [CrossRef]
  37. Azuma, M.; Goutianos, S.; Hansen, N.; Winther, G.; Huang, X. Effect of hardness of martensite and ferrite on void formation in dual phase steel. Mater. Sci. Technol. 2012, 28, 1092–1100. [Google Scholar] [CrossRef]
  38. Shoji, H.; Hino, K.; Ohta, M.; Shinohara, Y.; Minami, F. Ductile fracture mechanism for dual phase steel with high strength second phase. Trans. Jpn. Weld. Soc. 2015, 33, 341–348. [Google Scholar] [CrossRef]
  39. Archie, F.; Li, X.; Zaefferer, S. Micro-damage initiation in ferrite-martensite microstructures: A statistical characterization of crystallographic and chemical parameters. Mater. Sci. Eng. A 2017, 701, 302–313. [Google Scholar] [CrossRef]
  40. Kikuzuki, M.; Hayashi, K.; Tsunemi, Y.; Yabu, S.; Matsuno, T. Analysis of microstructures and voids on ductile fracture of ferrite/martensite dual-phase steels through three-dimensional observation. Tetsu-to-Hagane 2020, 106, 244–253. [Google Scholar] [CrossRef]
  41. Matsuno, T.; Kinoshita, N.; Matsuda, T.; Honda, Y.; Yasutomi, T. Microvoid formation of ferrite-martensite dual-phase steel via tensile deformation after severe plastic shear-deformation. ISIJ Int. 2023, 63, 941–949. [Google Scholar] [CrossRef]
Figure 1. Comparison of various types of cold formability in TRIP-aided polygonal ferrite (TPF), annealed martensite (TAM), and bainitic ferrite (TBF) steels with a tensile strength of 780 to 980 MPa [6]. This figure is reprinted with permission from Taylor & Francis, copyright 2023.
Metals 14 00061 g001
Figure 2. Heat treatment diagrams of (a) TPF (solid lines), TBF (dotted lines), and (b) TAM steels. These heat treatments were carried out in salt and oil baths. O.Q.: Quenching in oil at 50 °C.
Metals 14 00061 g002
Figure 3. Dimensions of the specimens for (a) tensile, (b) torsional, and (c) compressive tests.
Metals 14 00061 g003
Figure 4. Phase maps (ac), orientation maps of BCC (df), and orientation maps of FCC (gi) in TPF, TAM, and TBF steels. αpf, αam, αbf, γR, and MA are polygonal ferrite, annealed martensite, bainitic ferrite, retained austenite, and the MA phase, respectively.
Metals 14 00061 g004
Figure 5. (a) Tensile stress–strain (σε) curves, (b) shear stress–strain (τγ) curves, and (c) compressive stress–strain curves (σε) of the TPF, TAM, and TBF steels.
Metals 14 00061 g005
Figure 6. Equivalent stress–plastic strain ( σ ¯ ε ¯ p ) curves of (a) TPF, (b) TAM, and (c) TBF steels deformed in tension, torsion, and compression.
Metals 14 00061 g006
Figure 7. Relationship between the half-width (HW) and equivalent plastic strain ( ε ¯ p ) in (a) TPF, (b) TAM, and (c) TBF steels. tension: open marks, torsion; solid black marks: torsion; solid gray marks: compression.
Metals 14 00061 g007
Figure 8. Comparison of the HW0 and n-values of TPF, TAM, and TBF steels.
Metals 14 00061 g008
Figure 9. Variations in the volume fraction of untransformed retained austenite (fγ) as a function of equivalent plastic strain ( ε ¯ p ) in (a) TPF, (b) TAM, and (c) TBF steels deformed through tension (open marks), torsion (solid black marks), and compression (solid gray marks).
Metals 14 00061 g009
Figure 10. Relationship between the k-value and mean normal stress (σm) in TPF, TAM, and TBF steels. The k-values are mean values in an equivalent plastic strain range between ε ¯ p = 0 and 0.3.
Metals 14 00061 g010
Figure 11. FE-SEM images of voids initiated on the specimen surface in (ac) TPF, (df) TAM, and (gi) TBF steels plastically deformed to ε ¯ p = 0.3 through (a,d,g) tension, (b,e,h) torsion, and (c,f,i) compression. Circles denote the voids.
Metals 14 00061 g011
Figure 12. (a) The void size–mean normal stress (Dvσm) relation and (b) the number of voids–mean normal stress (Nvσm) relation in TPF, TAM, and TBF steels plastically deformed to ε ¯ p = 0.3.
Metals 14 00061 g012
Figure 13. The relation between the mean number of voids (Nv) and mean size of voids (Dv) in (a) TPF, (b) TAM, and (c) TBF steels subjected to different equivalent plastic strains. Open and solid marks denote the data for tension and torsion, respectively.
Metals 14 00061 g013
Table 1. Chemical composition (mass%) and measured martensite starting and finishing temperatures (MS, Mf, °C) of the slab used.
CSiMnPSAlNbCrMoNMsMf
0.181.481.490.0040.0030.0430.051.020.200.001407292
Table 2. Microstructural properties and hardness of the various steels. k-values were calculated in a range of ε ¯ p = 0 to 0.3.
Steelfγ0
(vol.%)
Cγ0
(mass%)
kfMA
(vol.%)
HV0
TensionTorsionCompression
TPF8.0 ± 0.60.51 ± 0.083.382.312.140329
TAM12.4 ± 0.40.84 ± 0.064.964.522.710287
TBF11.4 ± 1.20.65 ± 0.141.210.590.202.0 ± 0.3350
fγ0: initial retained austenite fraction, Cγ0: initial carbon concentration of retained austenite, k: strain-induced transformation factor, fMA: volume fraction of MA phase, HV0: original Vickers hardness. k-values are mean values in an equivalent strain range between 0 and 0.3.
Table 3. Mechanical properties of the TPF, TAM, and TBF steels.
SteelYS (MPa)TS (MPa)UEl (%)TEl (%)RA (%)τ0
(MPa)
τmax
(MPa)
σ0
(MPa)
TPF76210987.311.626.6416990695
TAM60888511.319.052.9383827510
TBF70912769.017.749.56131144737
YS: tensile yield stress, TS: tensile strength, UEl: uniform elongation, TEl: total elongation, RA: reduction in area, τ0: shear yield stress, τmax: maximum shear stress, σ0: compressive yield stress.
Disclaimer/Publisher’s Note: The statements, opinions and data contained in all publications are solely those of the individual author(s) and contributor(s) and not of MDPI and/or the editor(s). MDPI and/or the editor(s) disclaim responsibility for any injury to people or property resulting from any ideas, methods, instructions or products referred to in the content.

