Article

On the Potential Correlation between Dynamic Strain Aging and Liquid Metal Embrittlement in T91/LBE System

1
Research Group Structural Materials, Nuclear Energy Technology Institute, Belgian Nuclear Research Center (SCK CEN), 2400 Mol, Belgium
2
Research Group Sustainable Materials Science, Department of Materials, Textiles and Chemical Engineering, Ghent University, 9000 Ghent, Belgium
*
Authors to whom correspondence should be addressed.
Metals 2024, 14(1), 44; https://doi.org/10.3390/met14010044
Submission received: 30 November 2023 / Revised: 21 December 2023 / Accepted: 26 December 2023 / Published: 29 December 2023
(This article belongs to the Special Issue Failure and Degradation of Metals)

Abstract

:
In the study of the liquid metal embrittlement (LME) of the T91/lead-bismuth eutectic (LBE) system, it is observed that LME occurs in a temperature interval which is similar to the temperature range where dynamic strain aging (DSA) is observed. However, the potential correlation between DSA and LME has not yet been satisfactorily investigated. This investigation for the T91/LBE system is exactly the topic of this work. For the evaluation of DSA and LME, slow strain rate tensile tests are conducted in the temperature range between 200 °C and 450 °C with strain rates of 5 × 10 5 s 1 and 5 × 10 6 s 1 in reference and a molten oxygen-depleted LBE environment. The resulting tensile properties, as well as the fracture surfaces and lateral surfaces of the failed samples, suggest a correlation between DSA and LME in the T91/LBE system. The maximum mechanical degradation of T91 is observed in the case where the effects of both DSA and LME on material properties are found to be at maximum. However, the observation of DSA was not identified as a prerequisite for LME to take place. Therefore, these results may indicate that DSA partly contributes to the ductility minimum observed in the T91/LBE system. In addition, the results of this work show that changes in the fracture surface and lateral surface are more sensitive features to claim for the potential occurrence of LME than the changes in total elongation.

1. Introduction

Modified 9% chromium-1% molybdenum creep-resistant steel, also known generally as grade T91, is one of the candidate materials for the new generation reactor parts, such as reactor vessels or pipes. The interest came from their excellent resistance to irradiation swelling, high thermal conductivity and low thermal expansion compared to austenitic stainless steel [1,2].
Despite its excellent mechanical properties, studies conducted in recent decades show that grade T91 is highly susceptible to liquid metal embrittlement (LME) when it interacts with liquid lead-bismuth eutectic (LBE), one of the candidate coolants for future generation nuclear reactor systems (Generation IV systems) [3]. LME susceptibility is generally evaluated by slow strain rate tensile tests (SSRTs) in a liquid LBE environment [4]. Due to LME, mechanical performance degrades as manifested by a loss in ductility and/or loss in ultimate tensile strength (but not yield strength) and loss in fatigue resistance, as well as loss in toughness upon testing in a liquid metal environment as compared to an inert environment [4]. Brittle failures in several types of environmentally assisted cracking (EAC), such as stress corrosion cracking (SCC), hydrogen embrittlement (HE) and LME, are reported to display flat or quasi-cleavage fracture surfaces with lateral surface cracks [5,6,7].
Generally, the changes in TEL due to LME are observed within a specific intermediate temperature range, while the effects become weaker or are absent at both lower and higher temperatures [8,9,10]. The corresponding temperature range is known as the ductility trough. Based on the SSRTs conducted at temperatures between 150 °C and 500 °C, Long et al. reported that the ductility trough of tempered T91 in liquid LBE is located between 300 °C and 450 °C [9]. Based on tensile tests, Nicaise et al. showed that the ductility trough of hardened T91/Pb is in the 350–450 °C range [11]. In this work, it is noted that the term “ductility trough” is used to represent the progressive recovery of ductility with increasing the test temperature, while the conventional representation of the ductility trough is the U-shaped TEL vs. temperature curve as shown in [8,9,10]. Thus, it can be said that in LME studies, the term “ductility trough” is used not only to highlight the U-shape TEL vs. temperature curve but also to show the strong dependence of the LME severity on temperature. The character of the ductility trough is reported to be dependent on the strain rate [12,13]. The strain rate at which deformation is applied defines when dislocations are generated, mobile, and/or immobilized [14]. An increase in the strain rate results in a shift of the ductility trough to a higher temperature regime [15].
Depending on the solid metal/liquid metal couple involved, the proposed mechanisms for reduction in ductility are different. For a steel/Pb(-Bi) couple, reports in general tend to suggest that adsorption-enhanced decohesion or adsorption-enhanced plasticity are responsible for LME [16]. Both proposed mechanisms are based on the idea that liquid–metal adsorption decreases the interatomic bond strength of the solid metal. Recent advances suggest that both adsorption-enhanced decohesion and plasticity are not necessarily different mechanisms but different manifestations of the same mechanism [16].
The dependency of LME on temperature and strain rate is comparable to the strain rate and temperature dependency of dynamic strain aging (DSA). DSA is associated with the ability of solute atoms to migrate towards dislocations and hinder their motion. The DSA regime is limited by two temperatures, one below which the diffusion of solute atoms is too slow to keep up with the dislocation’s motion, and an upper temperature limit at which the dislocation lines are permanently saturated with solute atoms and are immobilized when aiming for additional deformation [17]. The upper temperature limit is also explained by the increase in dislocation mobility without being affected by solute atoms [18]. With an increase in strain rate, the temperature range shifts to higher values since solute atoms need higher temperatures to migrate to and saturate the fast-moving dislocations [19,20]. Therefore, DSA generally occurs at intermediate strain rates and intermediate temperatures, where dislocation motion and the diffusion of solute atoms occur at equivalent rates [20,21,22].
DSA is identified by a reduction in TEL with increasing temperature, reaching minimum values at a certain temperature, and then increasing with a further increase in temperature [15,23,24]. As a result, a U-shaped TEL vs. temperature curve is obtained. Generally, in the corresponding temperature window, the reduction rate of UTS with an increase in temperature is delayed, and a strength plateau or even a strength peak at the intermediate temperature range can be obtained [15,23]. DSA can also be identified by the presence of serrations on the stress–strain curve and an increase in the strain hardening coefficient [15,23,24].
The influence of DSA on TEL is a result of dislocation pinning that occurred during DSA. As solute atoms keep locking the dislocations, the material needs to continuously generate dislocations to accommodate the applied strain level. Consequently, an increase in dislocation density is reported [25,26]. The increase in dislocation density finally enhances damage accumulation in the material which leads to an early onset of macro crack coalescence and results in a lowered TEL. The increase in dislocation density also results in a decrease in the mobility of dislocations, which generates a strength plateau or strength peak during DSA [26].
The pinning of dislocations results in serrations on the stress–strain curve [27]. Each abrupt rise on the stress–strain curve which appears during a constant strain rate test corresponds to the pinning of dislocations, while each load drop indicates that dislocations are finally able to break away from the pinning [28]. It should be mentioned that the increase in dislocation density occurs locally, and these localized strain zones are commonly categorized as a Portevin–Le Chatelier (PLC) bands. PLC bands move along the stressed specimen’s gauge length with increasing stress [27,28,29].
Based on the serration shape, orientation, and spatio-temporal organization of the deformation bands in the sample, serrations can be categorized into three types: A, B, and C [27,28,29,30,31]. In [27,28,29,30,31], A-type serrations are characterized by a sudden increase followed by a drop slightly below the general load level of the stress–strain curve. This type occurs in the low-temperature or high-strain part of the DSA regime [27,28,29,30,31]. Type B serrations are identified by oscillations around the general load level that occur in quick succession, and they often develop from type A serrations with increasing strain, or occur at high temperatures and low strain rates [27,28,29,30,31]. At higher temperatures and lower strain rates, type C serrations can be found. Type C serrations are detected by a load drop that occurs below the general level of the flow curve in which the size of the drop is larger than the load drop found in type B serrations [27,28,29,30,31].
The occurrence of DSA in T91 has already been reported in the literature. DSA in conventional 9Cr-1Mo is reported to be related to interactions between mobile dislocations and interstitial carbon atoms [32,33], while for modified 9Cr-1Mo (addition of niobium, vanadium, nitrogen and reduction in carbon), DSA is associated with interactions between dislocations and nitrogen [23,34]. Keller et al. [24] suggested that the occurrence of DSA in modified 9Cr–1Mo occurred due to interactions between mobile dislocations and Mo atoms.
Regardless of the responsible solute atoms, there are several research papers that report a temperature range for DSA in T91. Keller et al. [24] reported that DSA occurs between 500 K (227 °C) and 700 K (427 °C) for modified 9Cr–1Mo T91 tested with strain rate 4 × 10 4 s 1 . Based on the presence of serrations, Hojná et al. [35] indicated that DSA was observed between 350 °C and 450 °C for T91 in 10 6 s 1 strain rate tests. Srinivas et al. [15] elaborated that DSA was present in the temperature range between 250 °C and 400 °C for 10 3 s 1 , 10 4 s 1 , and 10 5 s 1 strain rate tests. Li et al. [36] reported fracture analysis of T91Si steel with obvious DSA and without DSA. From their perspective, T91Si steel with DSA has a relatively flat fracture surface with shallow dimples and multiple platforms, while T91Si steel without DSA is characterized by an uneven surface with many dimples [36].
Despite the similarity, the potential interaction between DSA and LME in T91/LBE system has not been satisfactorily explained yet [4,37]. Therefore, the aim of this paper is to investigate the relationship between DSA and LME for the T91/LBE system. Focus was put on elucidating the interplay between tensile degradation induced by DSA and LME-induced failure based on the results of SSRT tests performed in two environments: a reference condition and in LBE.

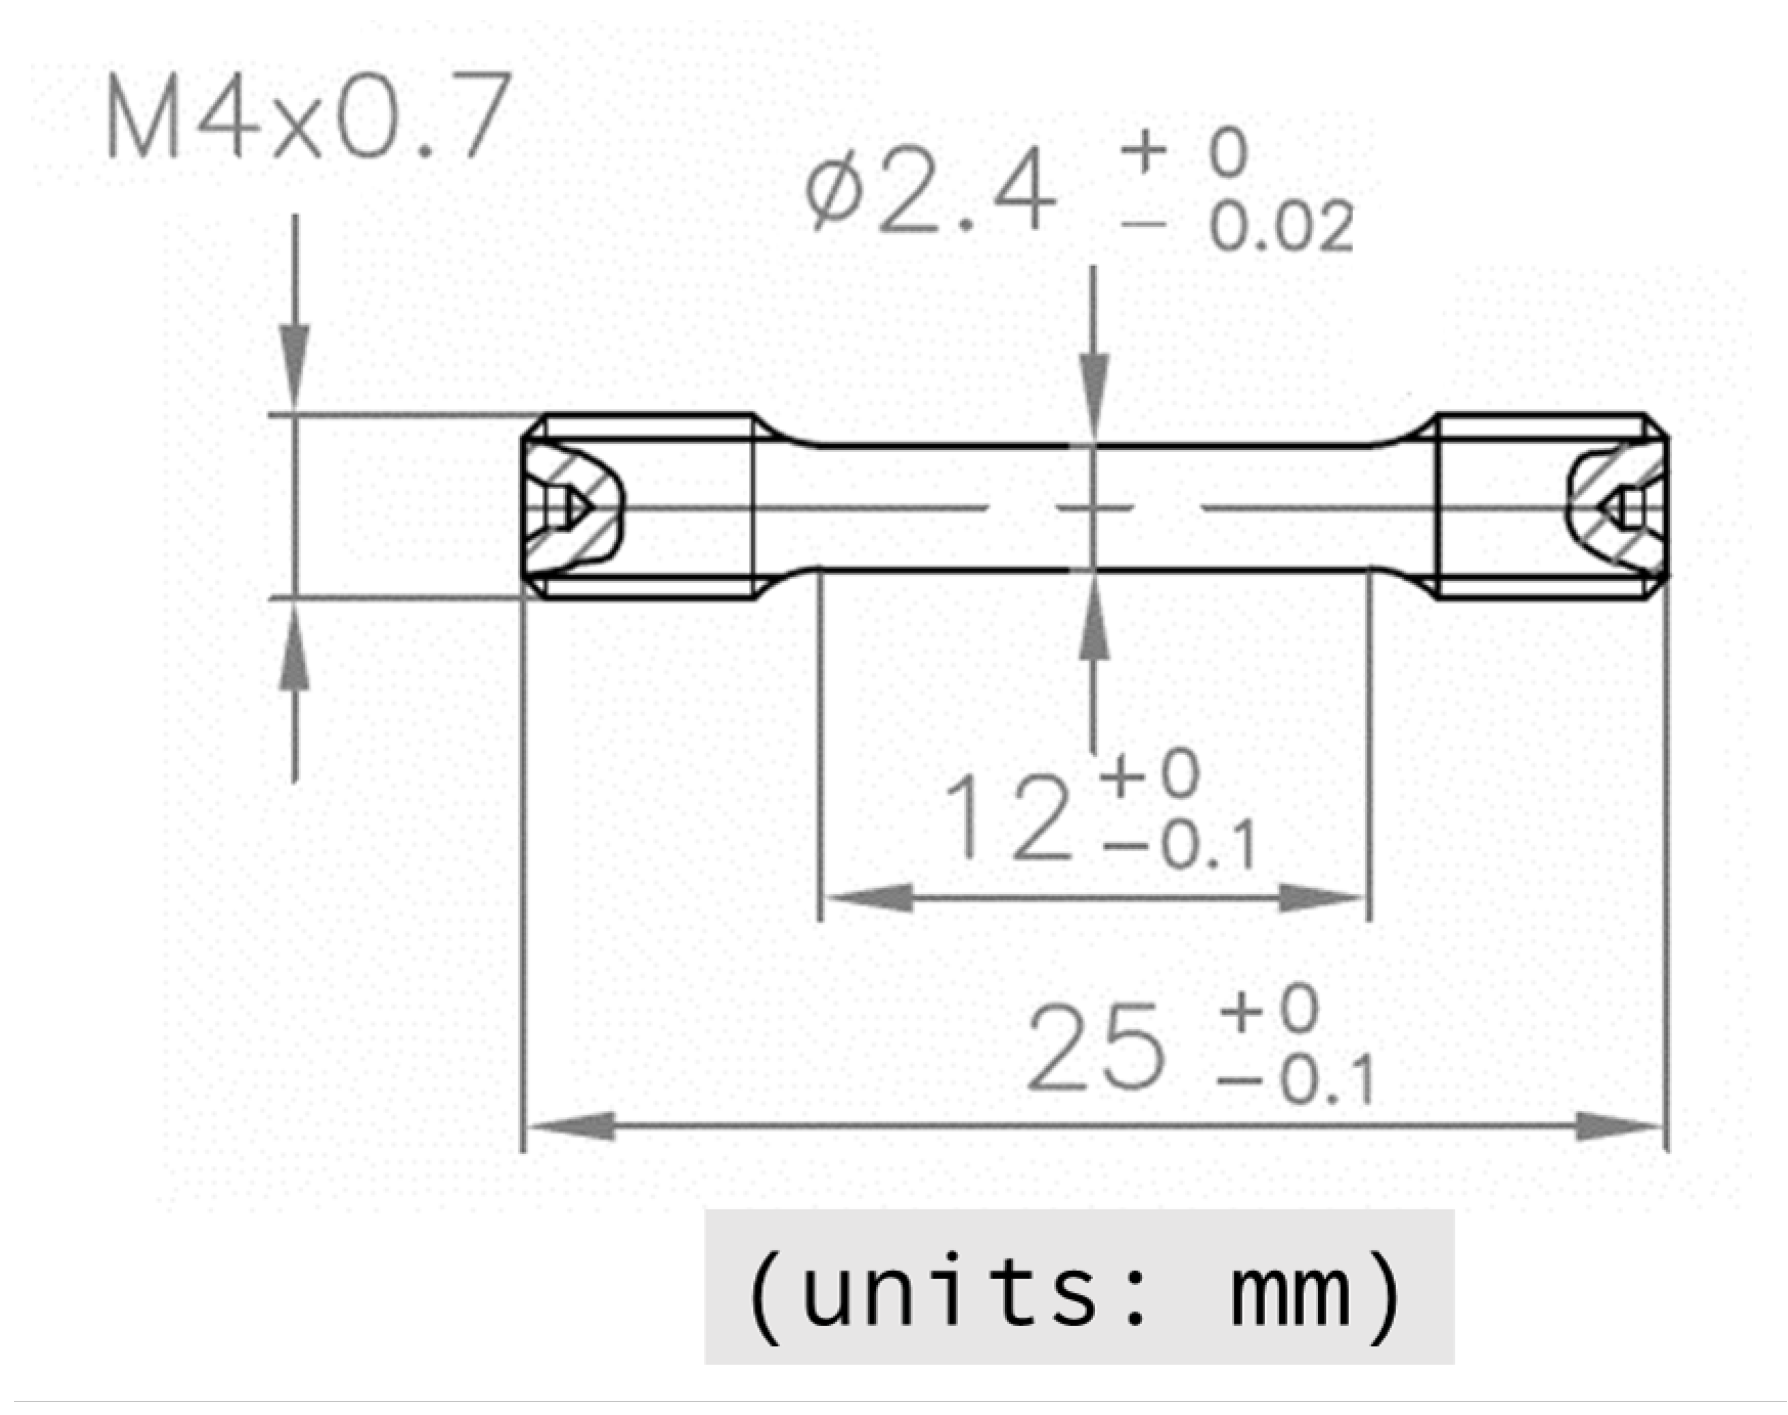
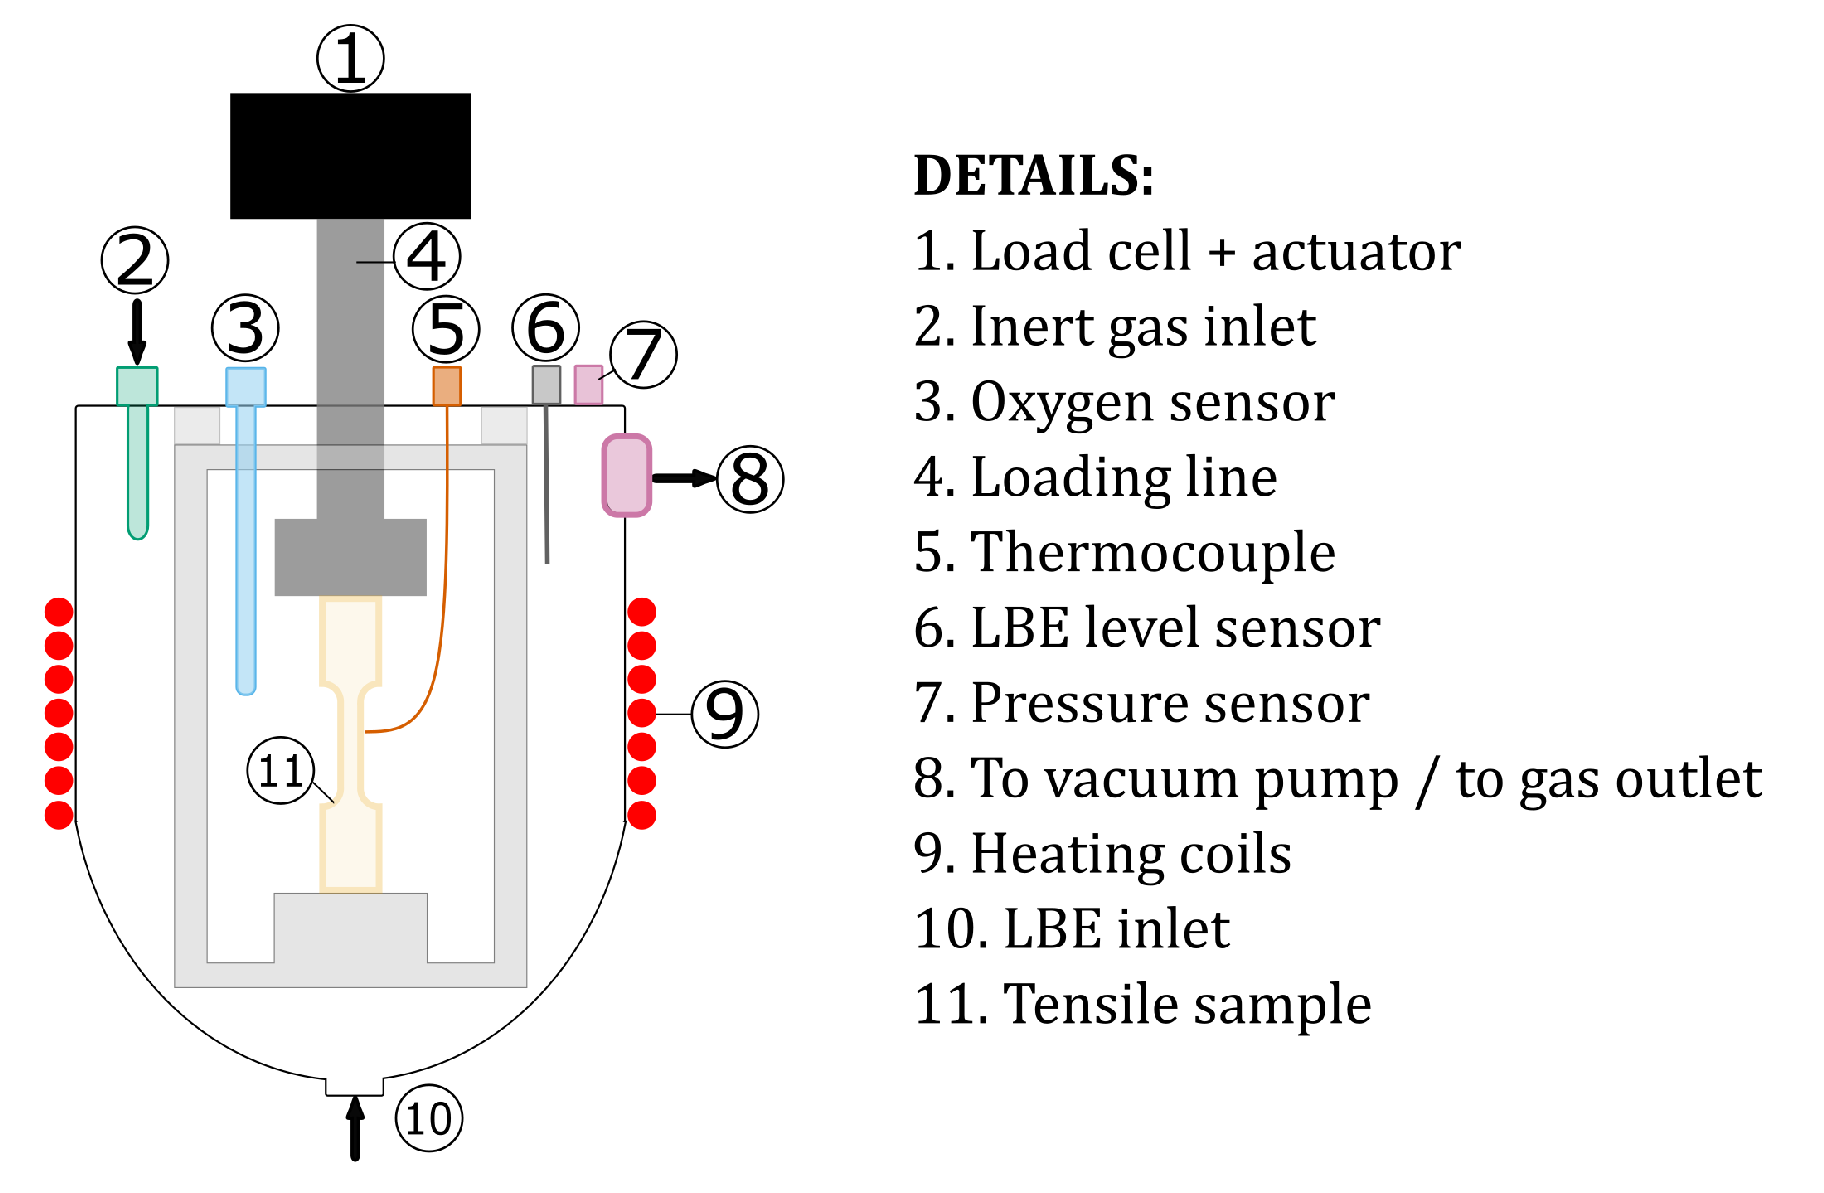
2. Materials and Methods

The studied material is a ferritic–martensitic steel T91 that underwent heat treatments consisting of normalization at 1100 °C for 15 min followed by water quenching to room temperature. The quenched plate was then tempered at 770 °C for 45 min before air cooling to room temperature. The chemical composition of the studied T91 was measured with spark source optical emission spectroscopy (SS-OES), and the results are shown in Table 1.
The initial T91 microstructure was examined by scanning electron microscopy (SEM) using a JEOL JSM6610 system from JEOL, Tokyo, Japan. As shown in Figure 1, the microstructures of the studied T91 consisted of tempered martensitic laths with carbides decorating the lath and prior austenite grain boundaries.
In this study, cylindrical tensile samples with a diameter of 2.4 mm and a gauge length of 12 mm, as shown in Figure 2, were used. The samples were submitted to SSRT tests at the temperatures (°C) 200, 250, 300, 350, 400, and 450 in combination with the strain rates 5 × 10 5 s 1 and 5 × 10 6 s 1 . The relatively slow strain rates were chosen to allow the liquid LBE to interact with T91 and at the same time to be fast enough to produce failure in a reasonable period of time. To ensure that the temperature dependence of LME was captured, the testing temperatures were varied from temperatures close to the melting temperature of the LBE to the temperature where ductility recovery of T91 is reported in the literature [8]. The combinations of these two parameters were expected to sufficiently map the LME and DSA range. For each temperature/strain rate combination, two different environments were evaluated, inert and a molten LBE environment, where the dissolved oxygen concentration was kept between 1 × 10 11 and 3 × 10 13 wt%. The displacement was measured based on the position of the loading line.
The tests were carried out in the Liquid Metal Embrittlement Testing Stations (LIMETS) No. 1 and No. 4, which were especially designed and manufactured for tensile testing in a controlled liquid LBE environment [38]. In the LIMETS setups, tensile testing is carried out in the autoclave as illustrated in Figure 3. The use of an autoclave allows better control of the LBE chemistry and allows for the use of inert gases as a testing environment. For tests in LBE, there was a pre-conditioning stage during which the sample was immersed in LBE at 450 °C for 20–24 h before the start of the test. This stage was performed to increase the probability of interactions between bare T91 and molten LBE. After the tests, the samples tested in LBE were cleaned with a hydrogen peroxide, acetic acid, and water mixture in a ratio of 1:1:1 to remove all LBE covering the failed samples. The fracture surfaces as well as lateral surfaces of tested samples were observed with SEM using the JEOL JSM6610 system. From the SEM fracture surface analysis, quantification of the area of interest, such as the quasi-cleavage area, was performed using open-source software called ImageJ version 1.53e [39]. Table 2 summarizes the number of tests performed in this study.
To study the hardening behavior of the material, true stress–true strain curves were derived for each sample. The classical Hollomon equation (Equation (1)) was then used to fit the true stress–true strain curves [24]. In Equation (1), true stress and true strain are represented by σ and ε , respectively, while the strength coefficient and the strain hardening exponent are represented by K and n, respectively.
σ = K ε n

3. Results

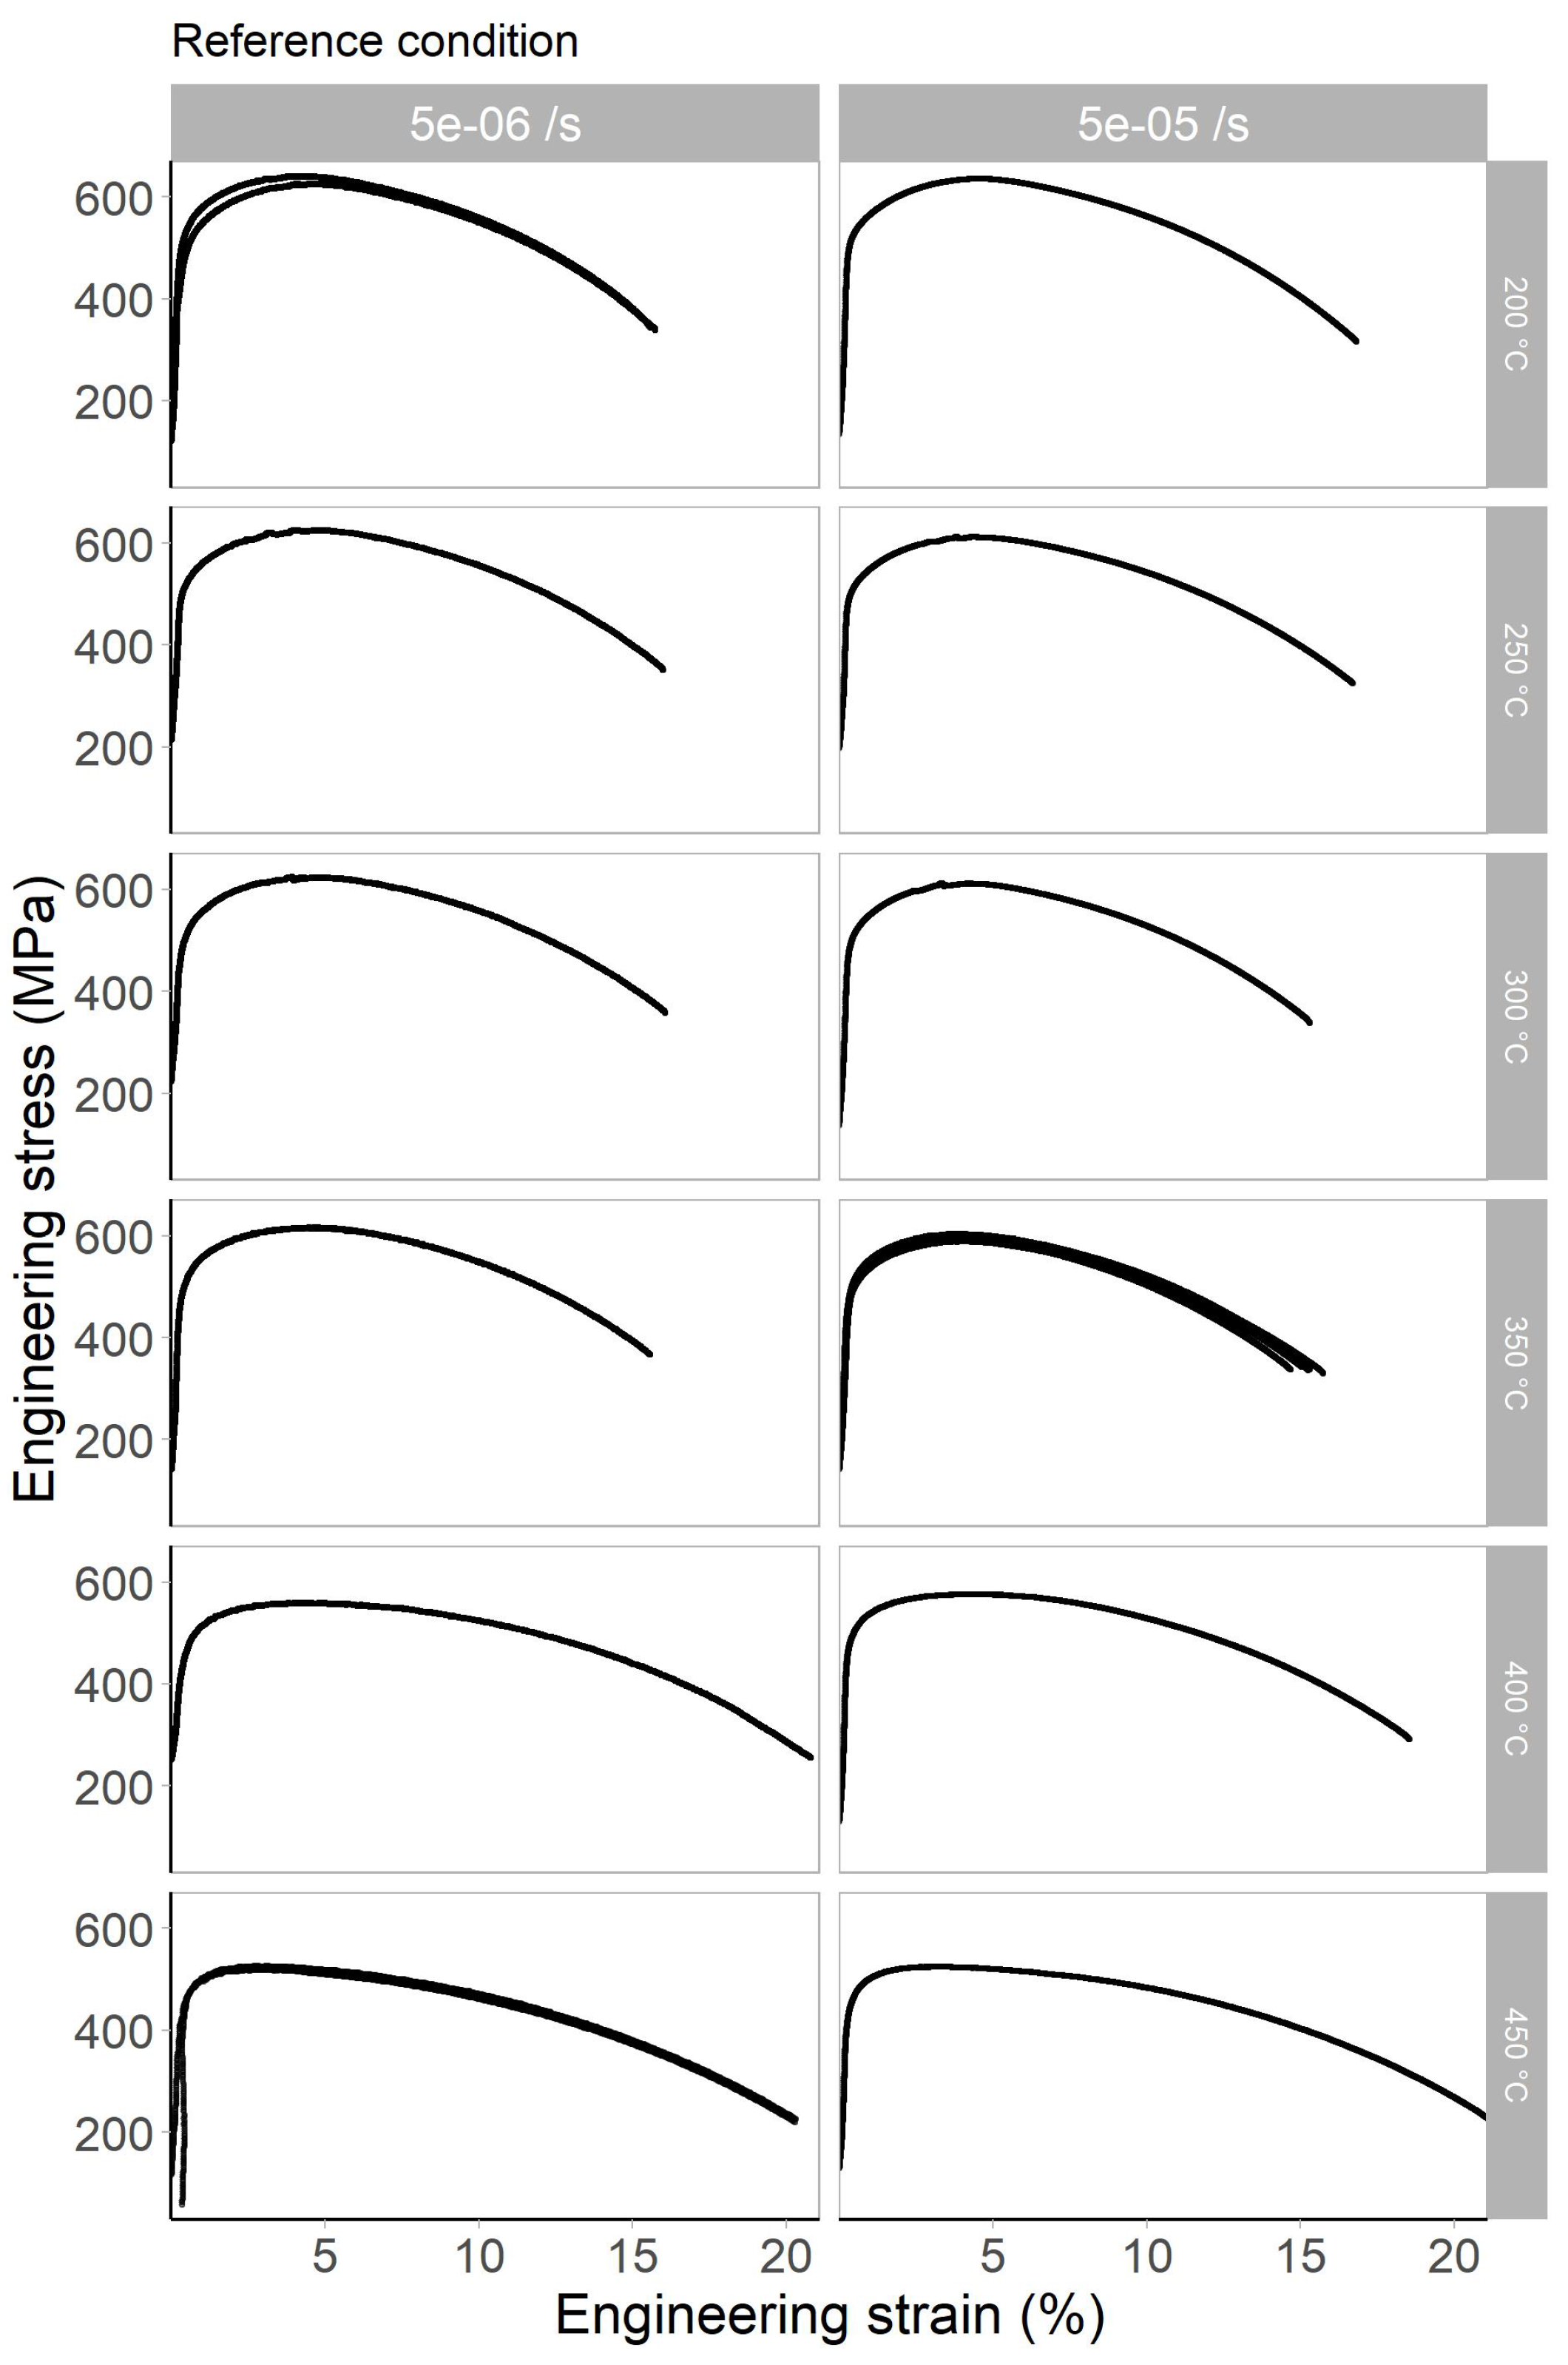
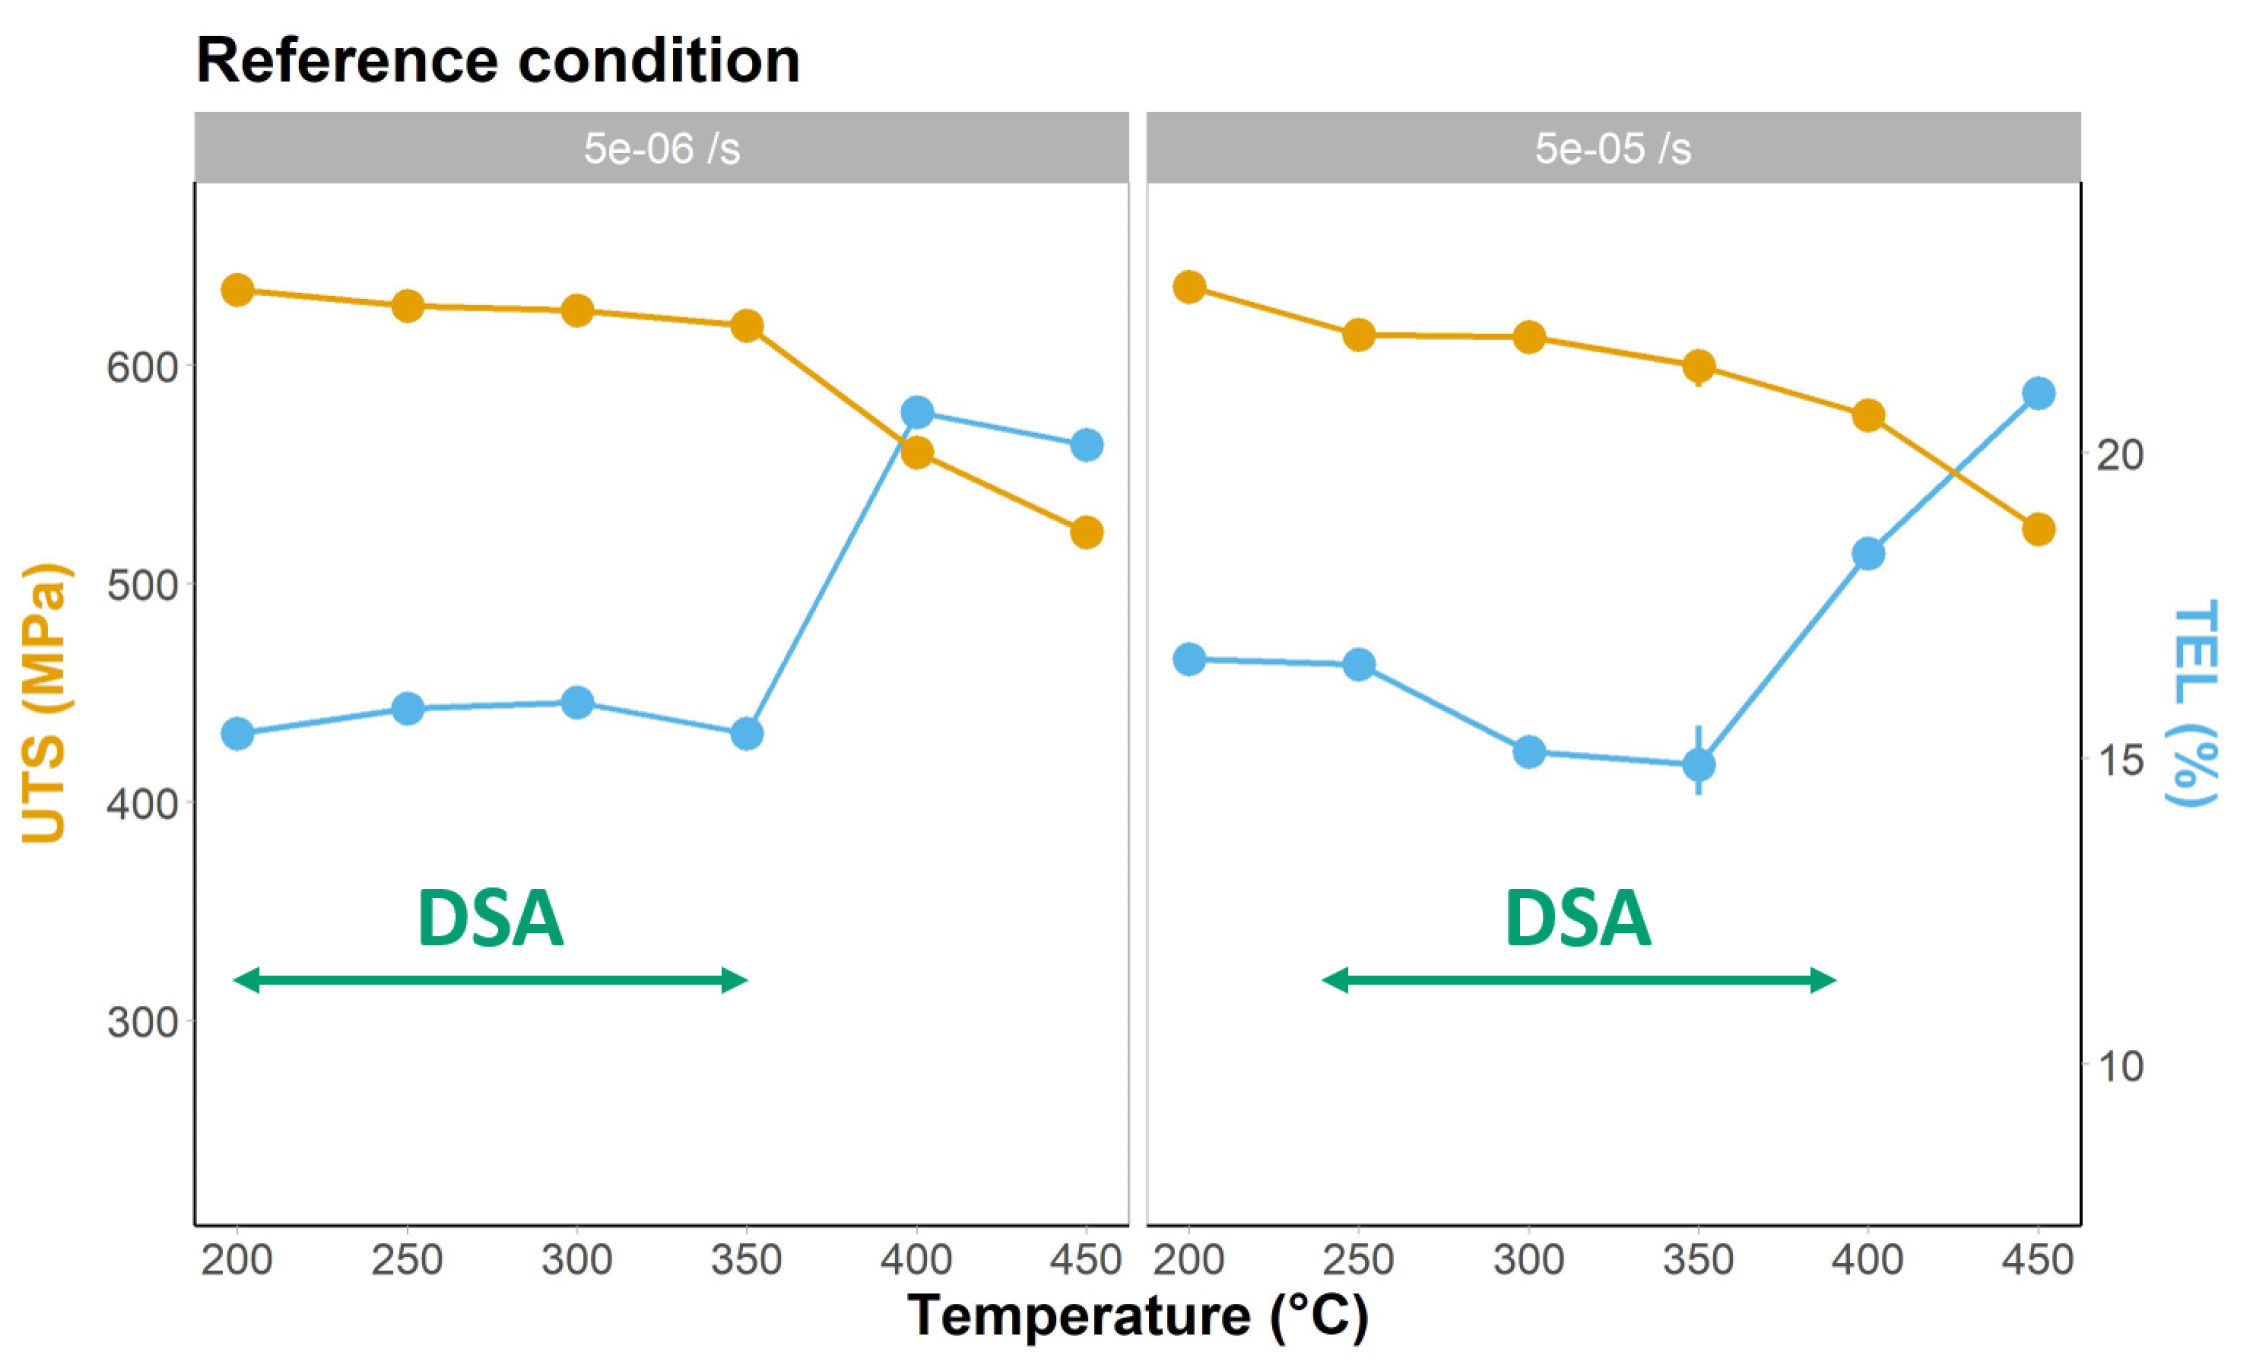
3.1. Tensile Tests in Reference Condition

Magnified views of representative curves of the specimens that were tested in the reference condition are presented in Figure 4. All the engineering stress–strain curves for each testing condition are provided in Appendix A. The curves showed type-A serrations between 250 °C and 300 °C when tested at 5 × 10 5 s 1 strain rate and a mixture of type A and type B serrations between 200 °C and 350 °C when tested at 5 × 10 6 s 1 strain rate. Figure 4 also indicates that there was some uncertainty in the identification of DSA based on the serrated flow due to some scatter on the load measurement which may have masked the presence of serrations due to DSA. Nevertheless, serrated flow indicated that DSA was present in some tested conditions.
Figure 5 shows the evolution of the strain hardening coefficient at different temperatures and strain rates. From Figure 5, it can be seen that for temperatures between 200 °C and 250 °C, the strain hardening coefficient slightly decreases for both 5 × 10 5 s 1 and 5 × 10 6 s 1 strain rates. At 300 °C, the strain hardening coefficient reaches a maximal value and then decreases with an increase in temperature for both the 5 × 10 5 s 1 and 5 × 10 6 s 1 strain rate. The increase in n at intermediate temperatures may indicate that DSA was present in the studied conditions.
Figure 6 shows the dependency of UTS and TEL on the strain rate and temperature. From Figure 6, the temperature range where a retardation in the decrease in UTS was observed almost corresponded to the temperature range where the U-shape in TEL curve was located. Based on Figure 6, the temperature window of DSA can be found between 250 °C and 400 °C for the 5 × 10 5 s 1 strain rate and between 200 °C and 350 °C for the 5 × 10 6 s 1 strain rate.
Regardless of the test temperatures and strain rates, the fracture surfaces of the samples tested in the reference conditions showed typical features of ductile failure, i.e., a fibrous zone in the middle of the samples decorated with equiaxed dimples and sheared dimples in the shear lip as shown in Figure 7b,c, respectively. Lateral views of the samples tested in the reference condition showed that lateral cracks which are perpendicular to the tensile axis were not found as pictured by Figure 7d. Here, no features were identified on the fractured samples that could indicate the presence of DSA. The fracture and lateral surfaces of the representative samples for each reference condition are shown in Appendix C.

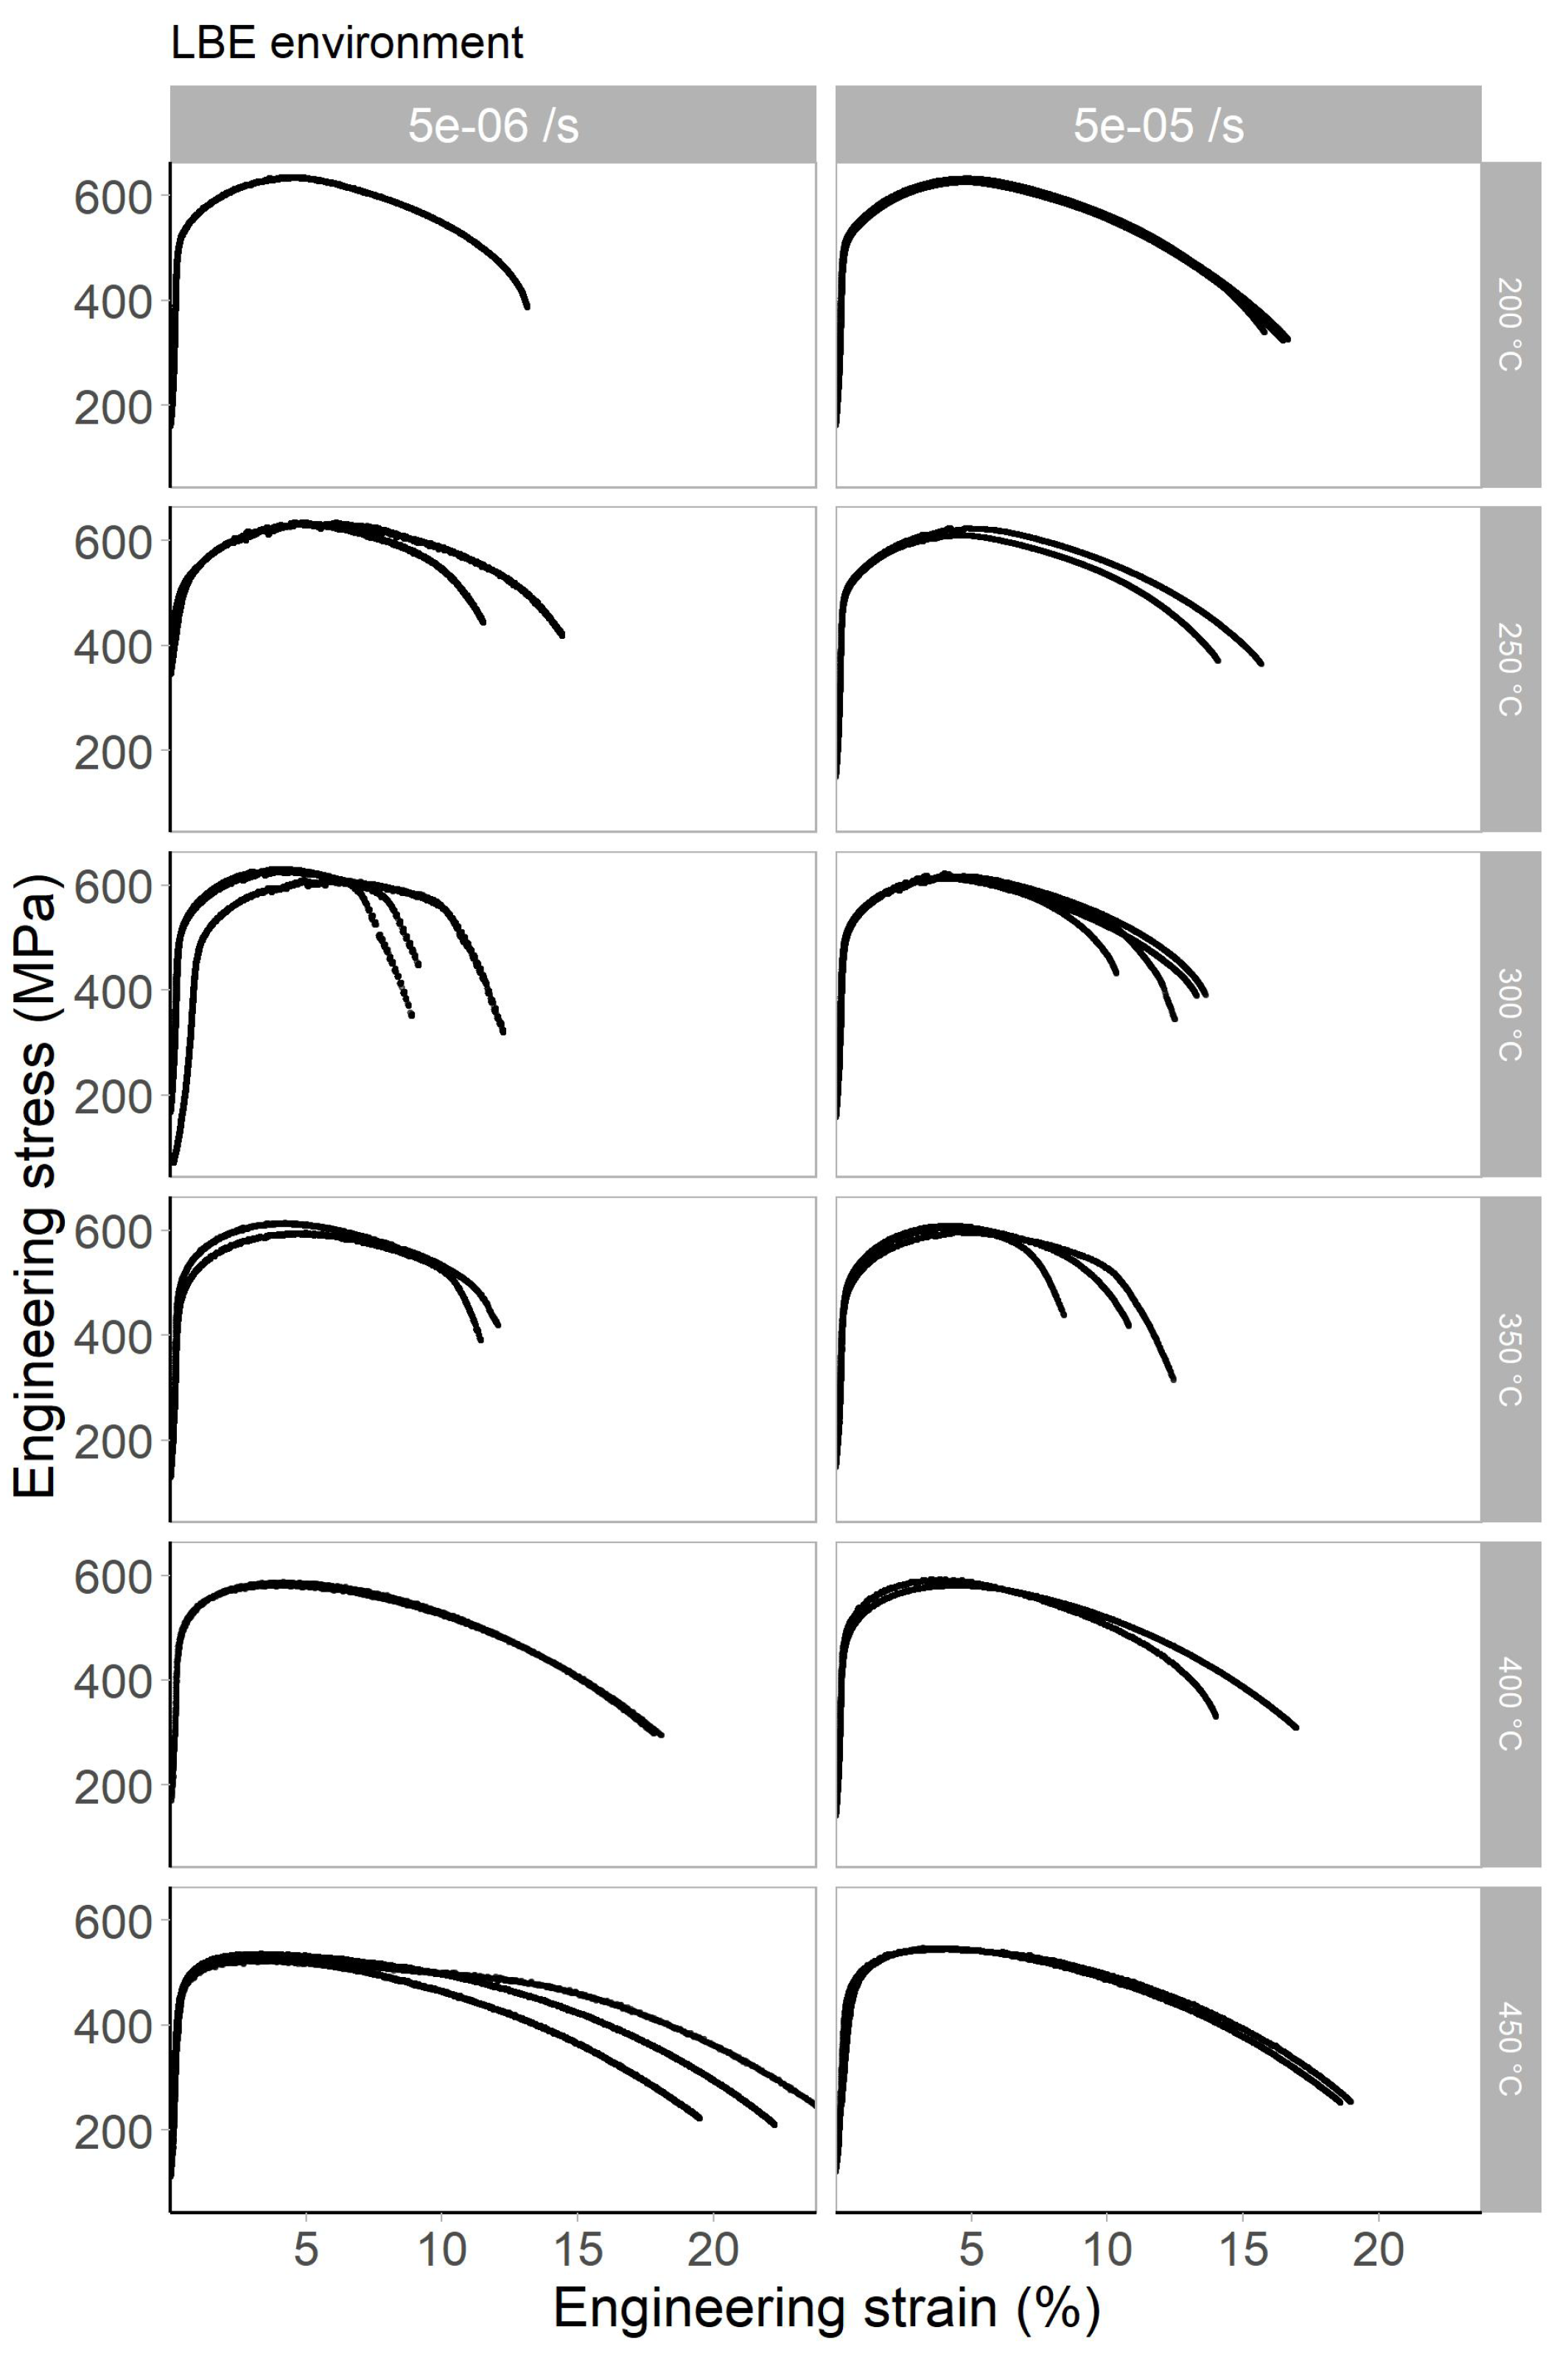
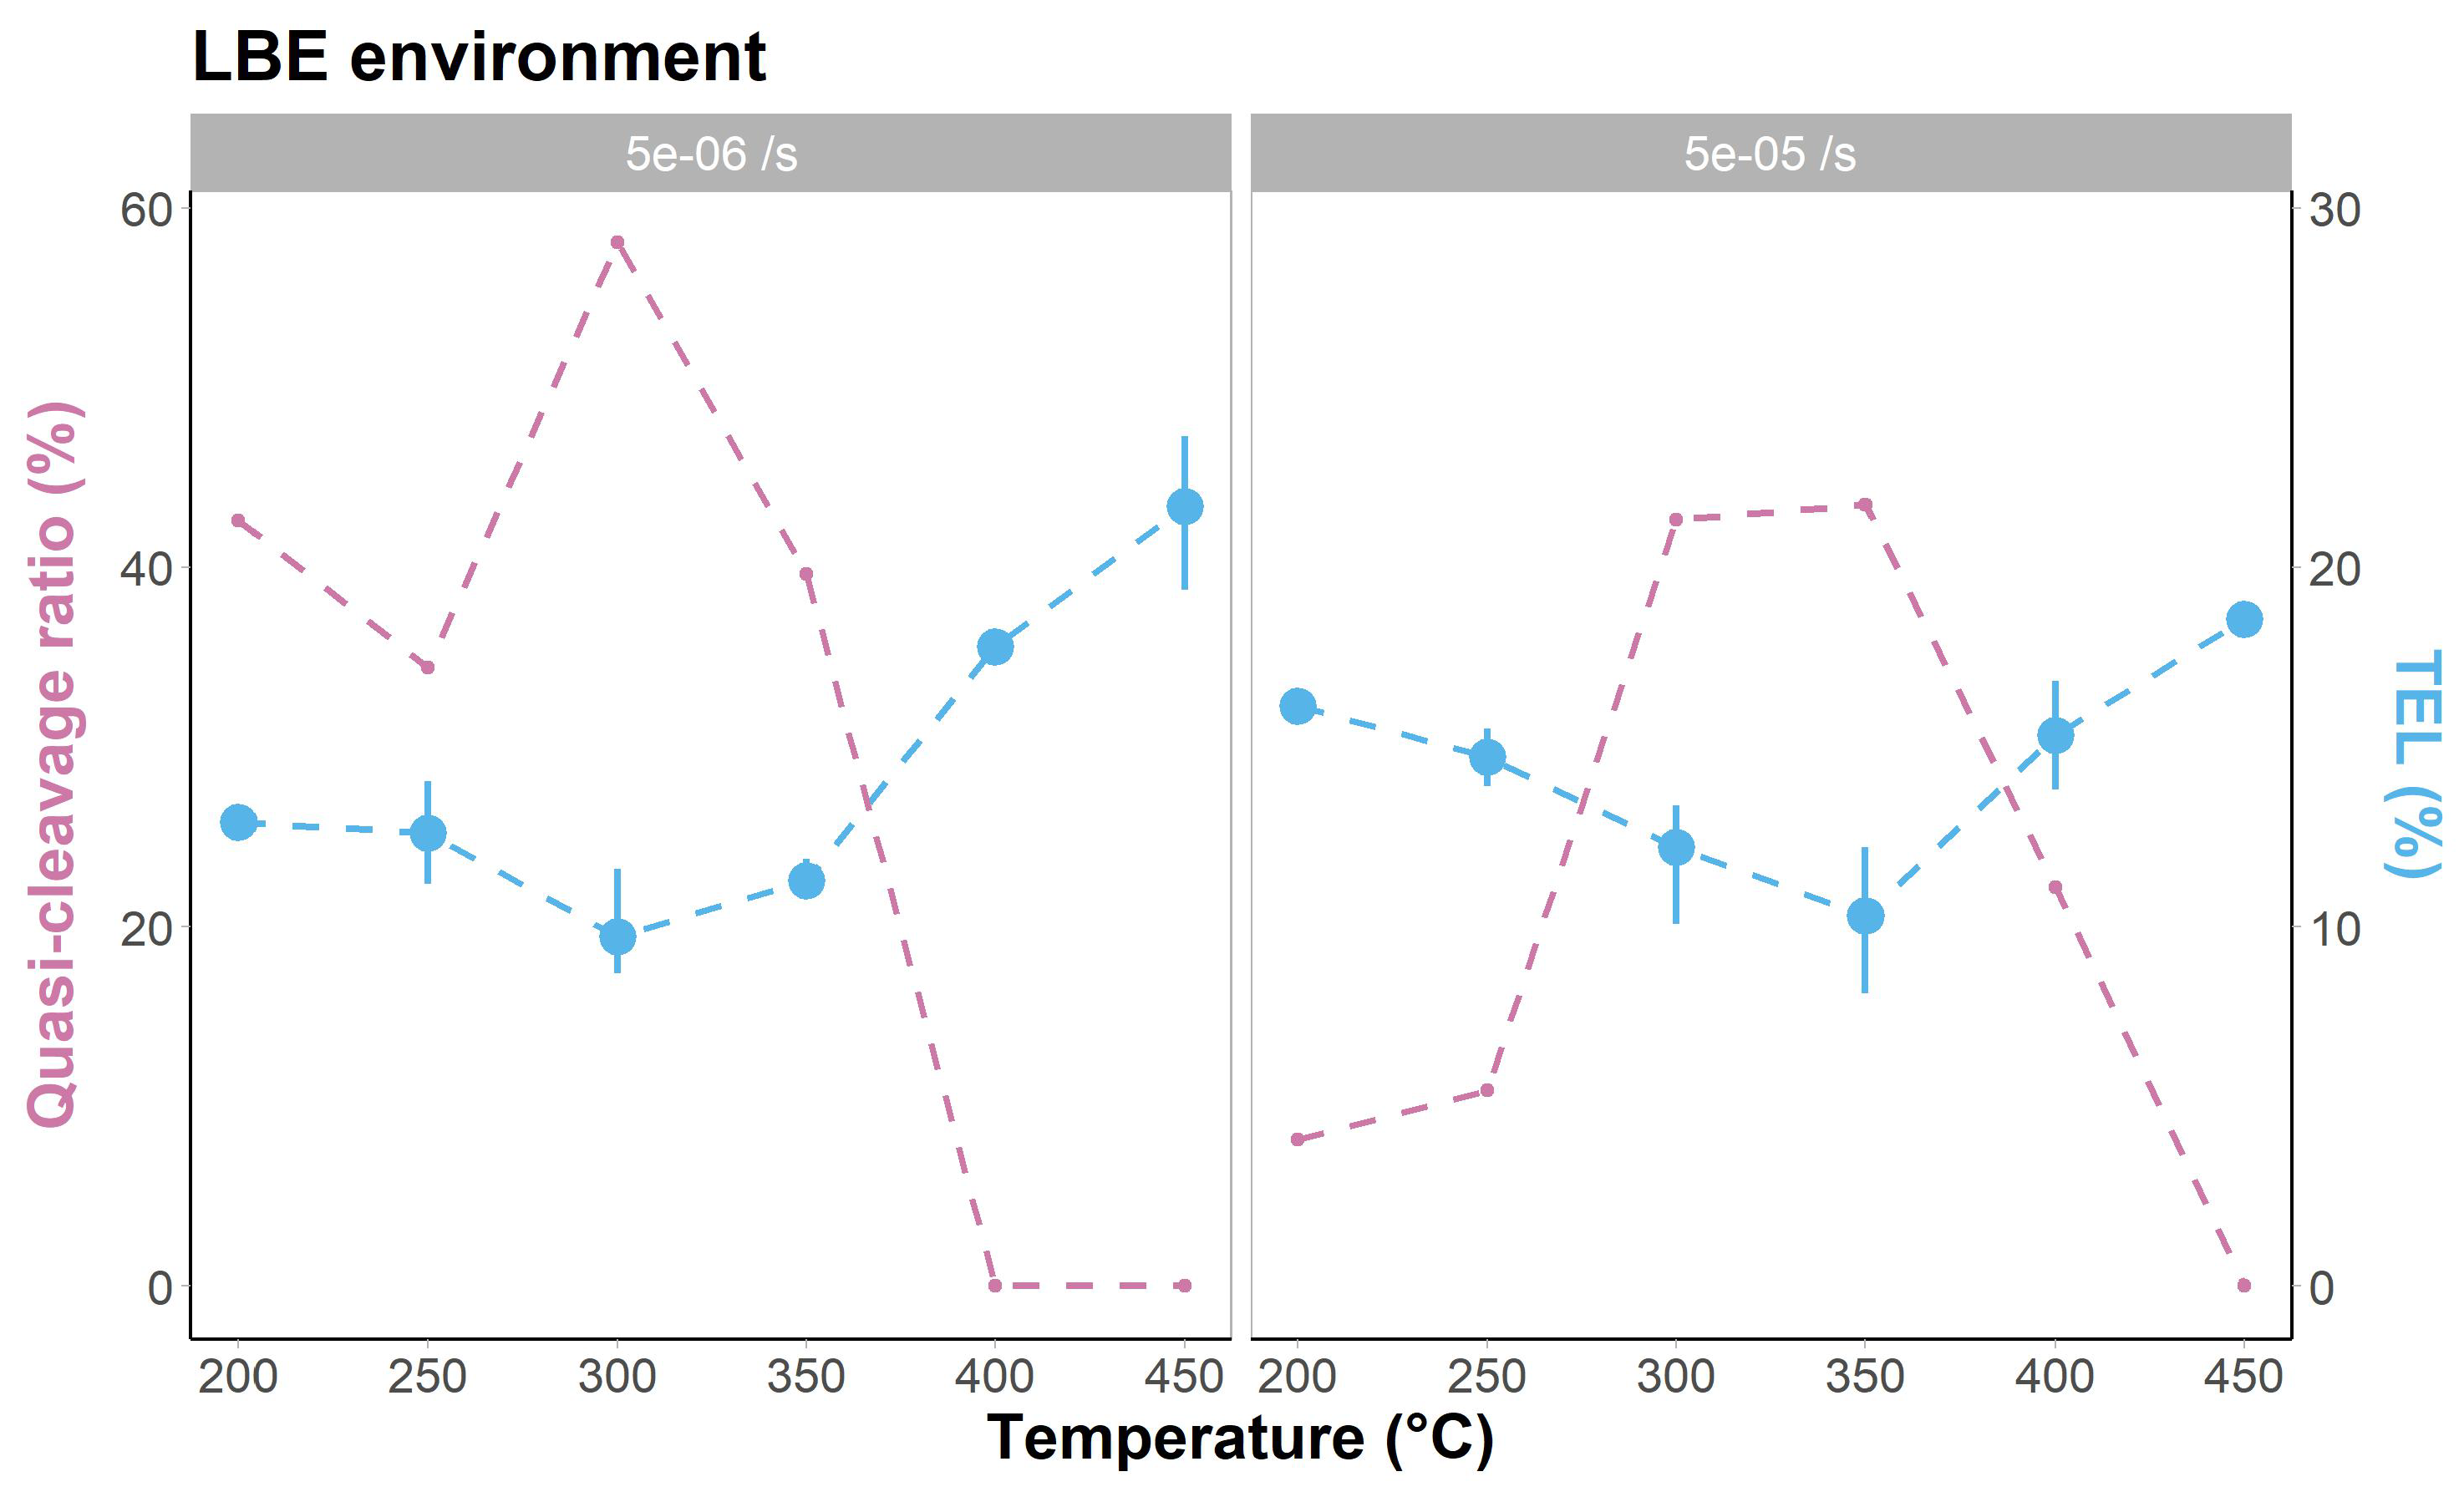
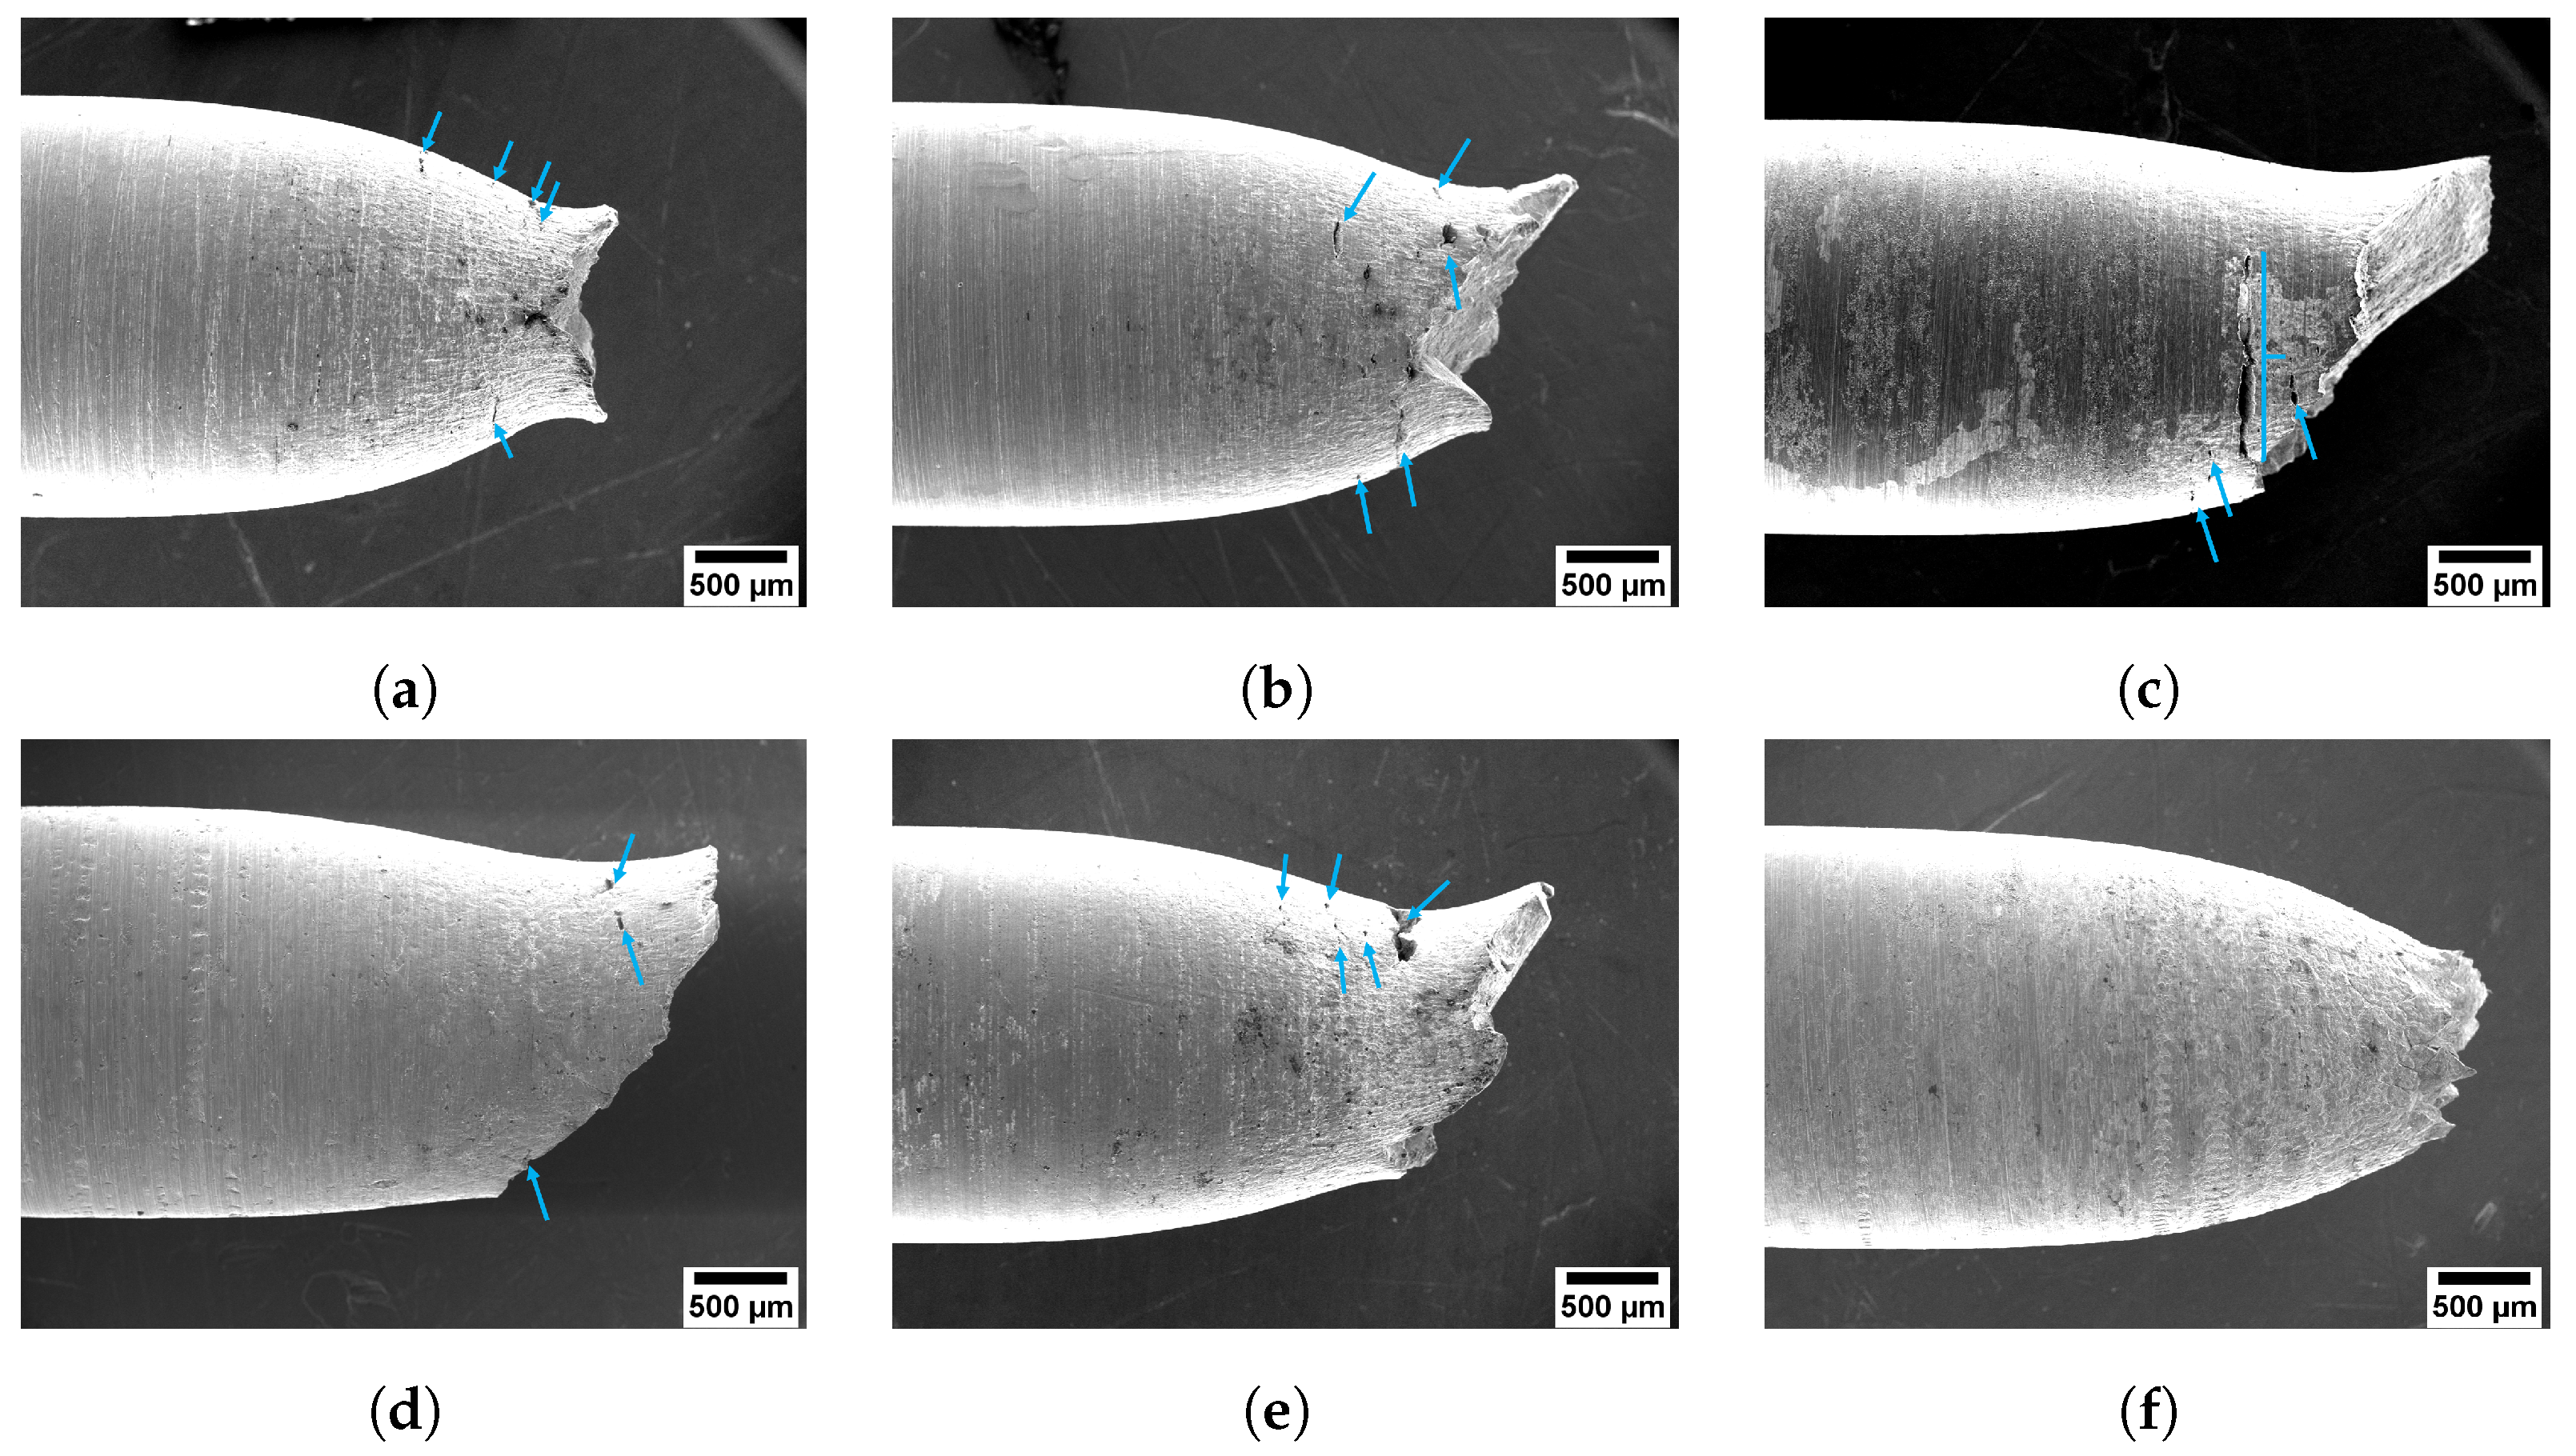
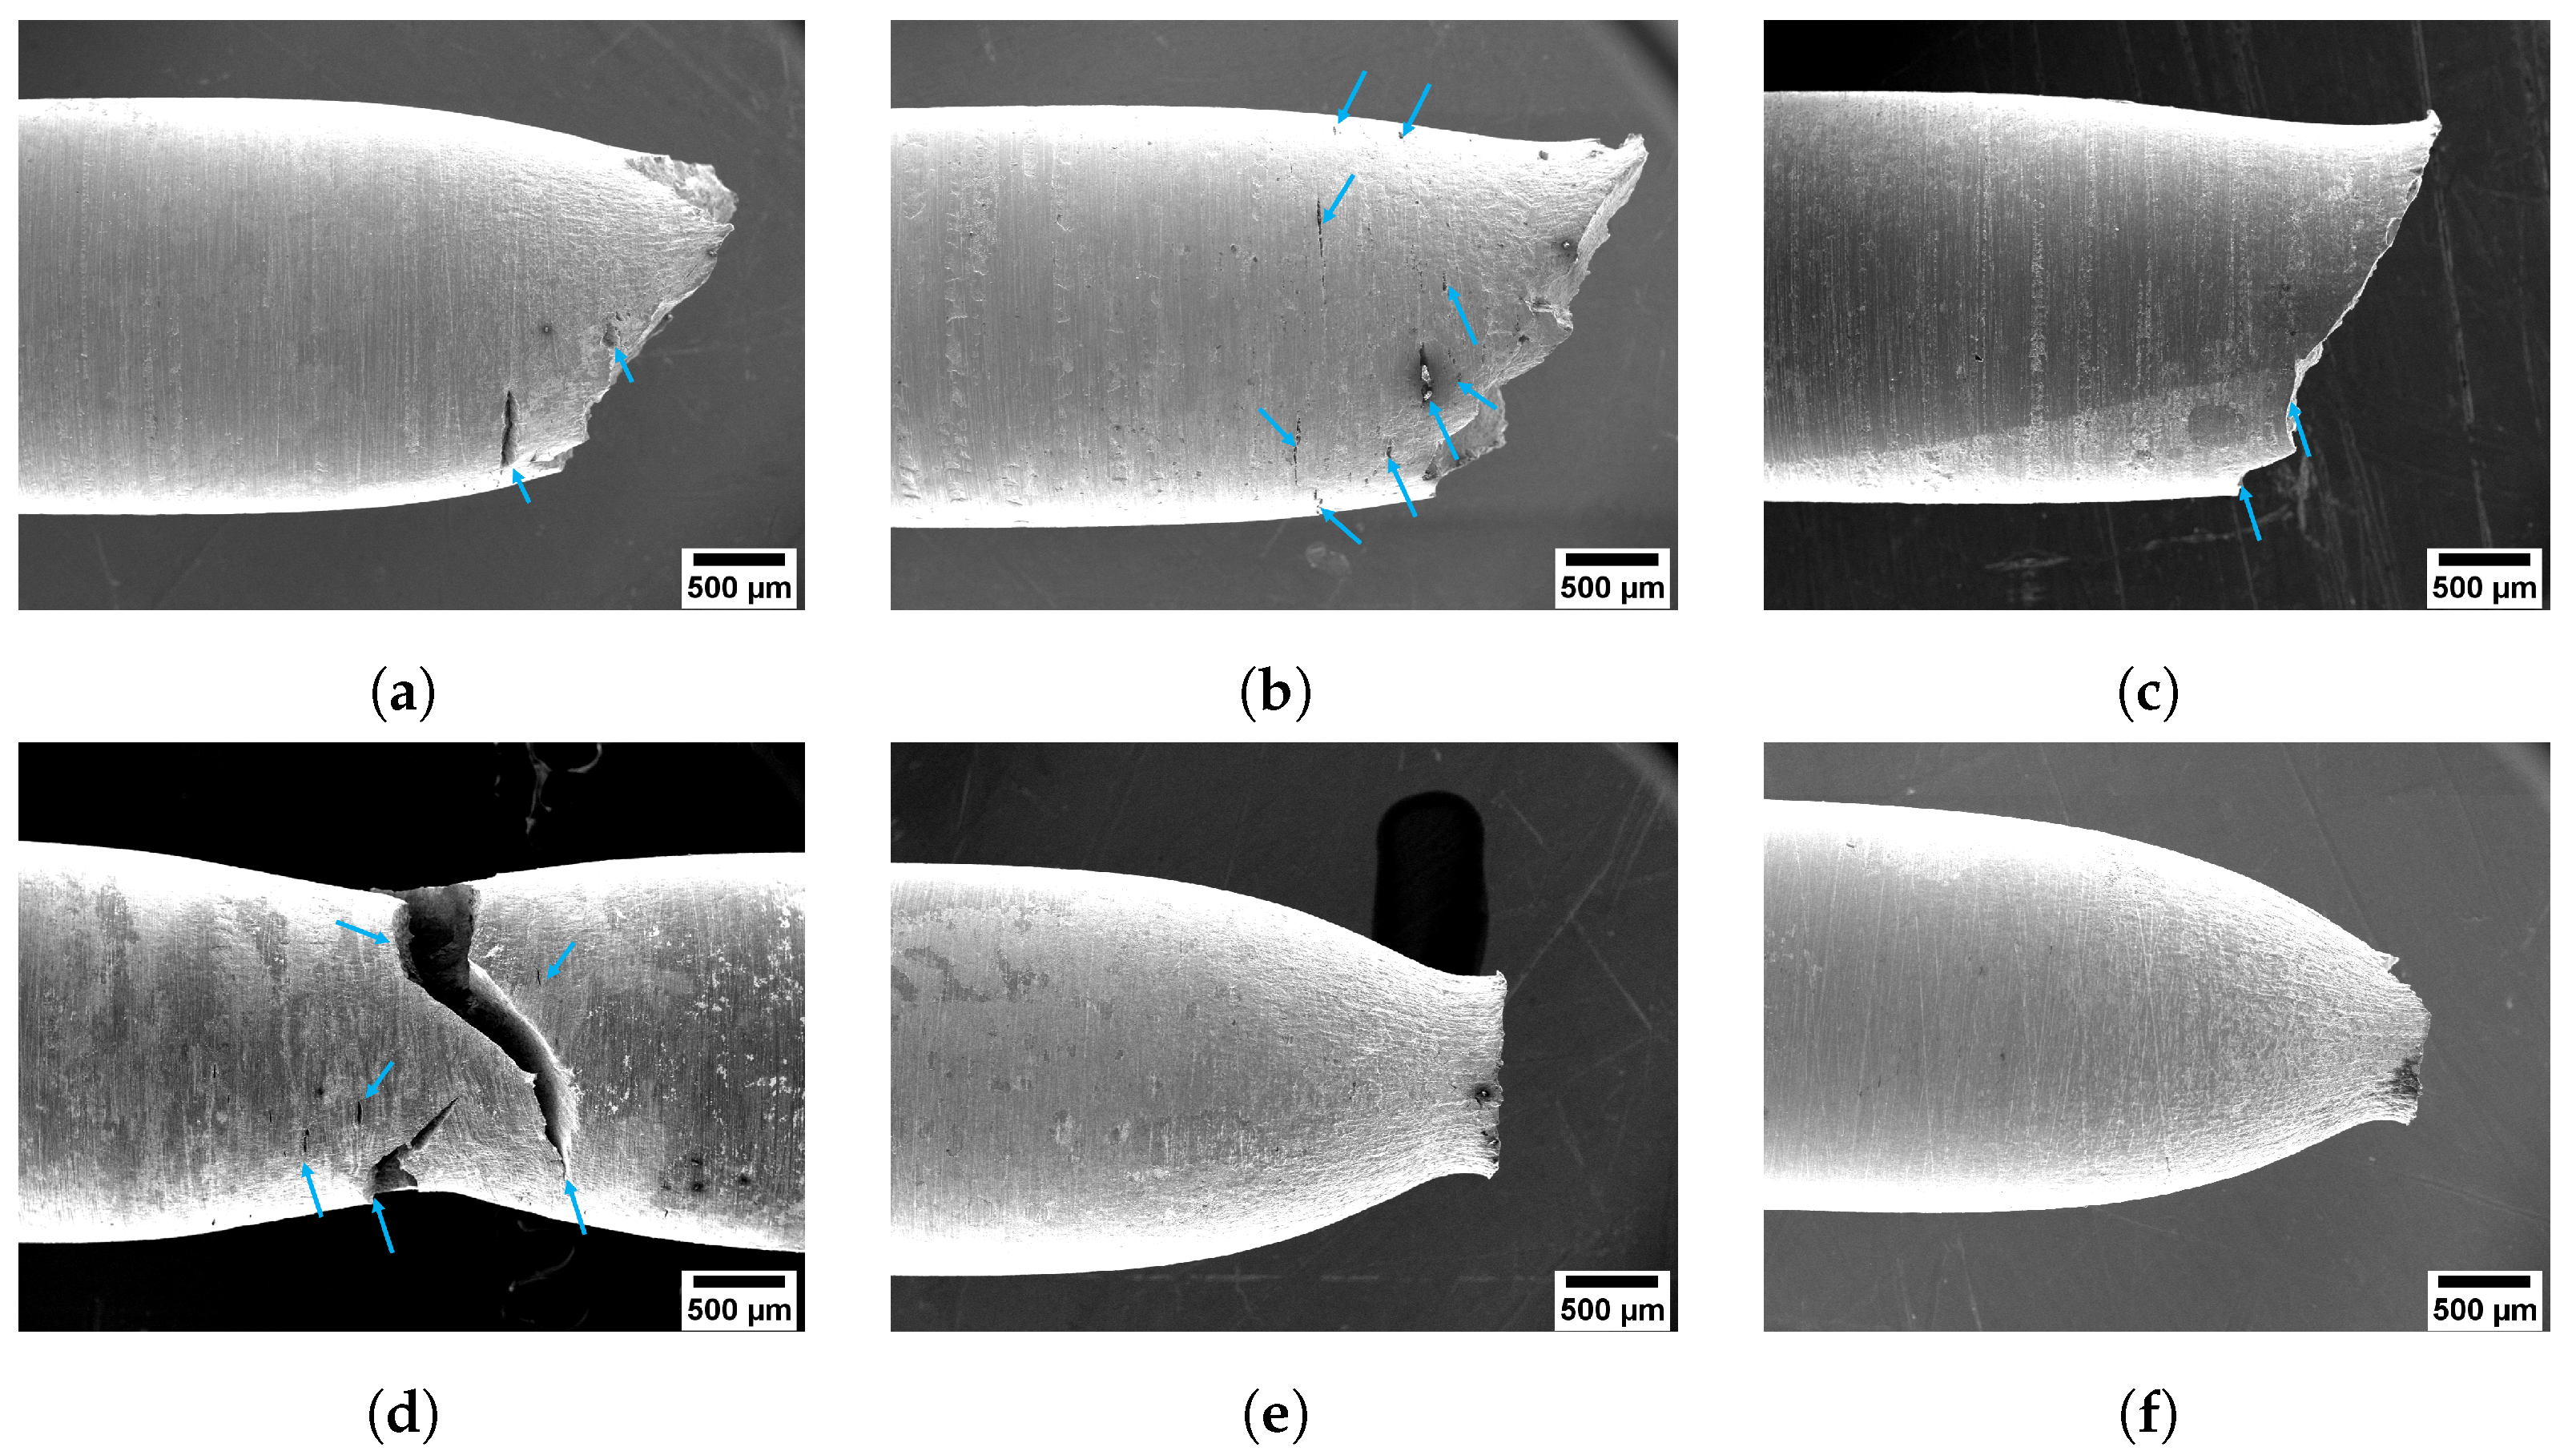
3.2. Tensile Tests in LBE Environment

A magnified view of representative curves of the specimens that were tested in LBE are shown in Figure 8. The complete engineering stress–strain curves are presented in Appendix B. Apart from the tests at 200 °C and 5 × 10 5 s 1 , all curves exhibited serrations. Since there is no change in the tested material, serrations at temperatures between 250 °C and 300 °C at the 5 × 10 5 s 1 strain rate and between 200 °C and 350 °C at the 5 × 10 6 s 1 strain rate may result from a similar origin as those observed in the reference tests, i.e., from DSA. It should be mentioned that a qualitative analysis of the serrations shown in Figure 8 indicates that the serrations of samples tested in LBE are generally more apparent than those of samples tested in the reference condition. This condition leads to the clear representation of type A serrations for 250 °C and 300 °C in the 5 × 10 5 s 1 strain rate tests as well as a mixture of type A and type B serrations between 200 °C and 350 °C in the 5 × 10 6 s 1 strain rate tests.
Since the tested material is similar, serrations at temperatures between 250 °C and 300 °C at the 5 × 10 5 s 1 strain rate and between 200 °C and 350 °C at the 5 × 10 6 s 1 strain rate may result from a similar origin as those observed in the reference tests, i.e., from DSA. The serrations observed between 350 °C and 450 °C at the 5 × 10 5 s 1 strain rate and between 400 °C and 450 °C at the 5 × 10 6 s 1 strain rate may be caused by the scatter in the load measurement related to the properties of liquid LBE. The relatively high testing temperatures caused a decrease in the viscosity of the liquid LBE inside the autoclave [40]. During LBE tests, inert gases are continuously supplied to the autoclave to control the chemistry of the LBE. Combining the decrease in the viscosity with the gas flow may result in more appreciable movement of the LBE during the testing temperatures which are recorded by the load acquisition instrument. Since the movement of liquid LBE happened during the test regardless of the deformation behavior of the sample, serrations can already be found at the beginning of the tensile tests as shown in Figure 9.
Figure 10 shows the evolution of the strain hardening coefficient at different temperatures and strain rates for the tests in LBE. In Figure 10, it can be seen that for temperatures between 200 °C and 300 °C, the strain hardening coefficient slightly decreases for the 5 × 10 5 s 1 strain rate tests but it increases for the 5 × 10 6 s 1 strain rate tests. At 350 °C, the strain hardening coefficient reaches a maximal value and then decreases with increasing temperature for 5 × 10 5 s 1 . However, the strain hardening coefficient reaches its maximum at 300 °C for the 5 × 10 6 s 1 strain rate tests.
Figure 11 shows the dependency of the UTS and TEL for the studied strain rates and temperatures in LBE. At a similar strain rate as the reference condition, the UTS plateau and U-shaped TEL curves were observed at intermediate temperatures. It should be mentioned that generally, TEL in LBE tests was lower compared to TEL in the reference condition.
Similar to the observations on the reference test samples, a fibrous zone can be clearly identified at 450 °C for the 5 × 10 5 s 1 strain rate tests and at 400 °C to 450 °C in 5 × 10 6 s 1 strain rate tests as shown in Figure 12f and Figure 13e,f respectively. Those three testing conditions have equiaxed dimples on the shear lips. However, the other studied conditions produced fracture surfaces which have quasi-cleavage features as shown in Figure 13a,d.
From the measurement of the quasi-cleavage areas and cross-sectional area of the fractured samples using ImageJ, a percentage of the quasi-cleavage area with respect to the fracture surface area was derived. The percentage obtained is termed the quasi-cleavage ratio, and the results are plotted in Figure 14. In Figure 14, the quasi-cleavage ratio equal to zero, such as that found in tests at at 450 °C and 5 × 10 5 s 1 strain rate and at 400 °C to 450 °C and 5 × 10 6 s 1 strain rate, indicates that LME was absent. In Figure 14, it can be seen that the amount of the quasi-cleavage ratio is inversely proportional to the total elongation, e.g., the quasi-cleavage ratio was the largest when the total elongation was the lowest.
From lateral view of the samples, lateral cracks were observed in all studied conditions except at 450 °C for the 5 × 10 5 s 1 strain rate tests and at 400 °C to 450 °C for the 5 × 10 6 s 1 strain rate tests as shown in Figure 15 and Figure 16.

4. Discussion

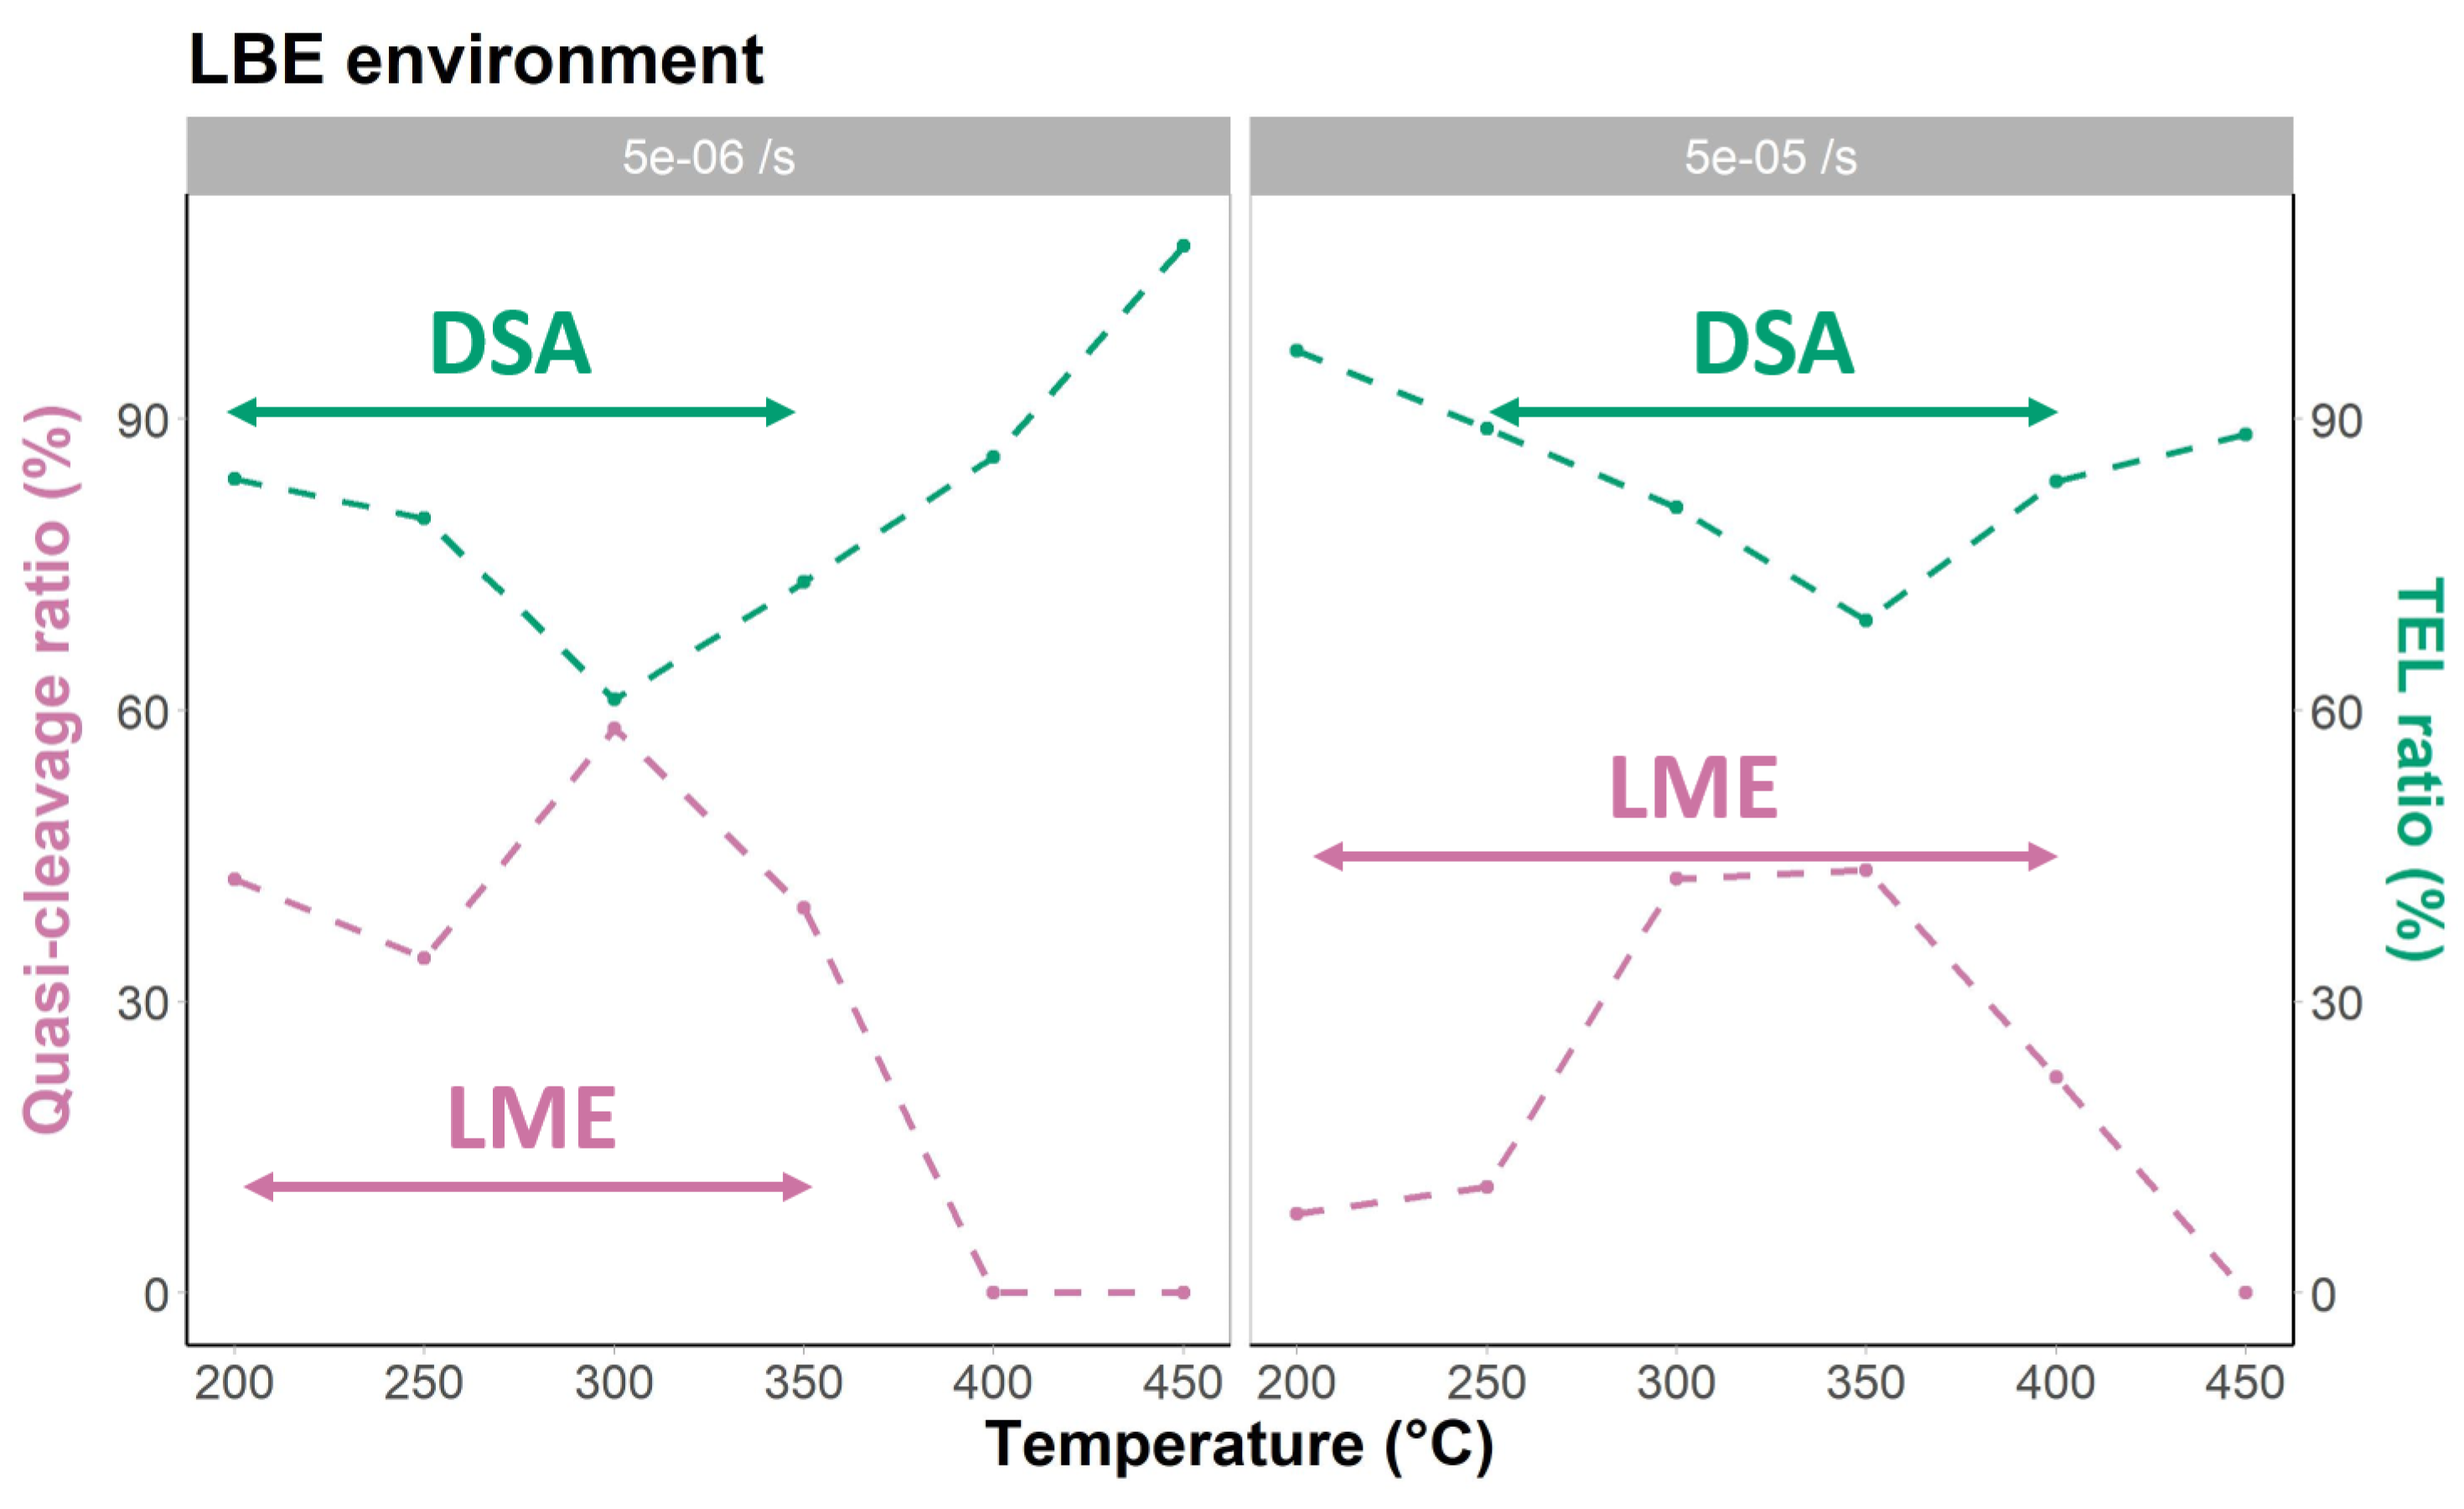
4.1. Identification of DSA

As mentioned in the previous section, serrated plastic flow may be seen in the curves corresponding to the temperatures between 250 °C and 300 °C in the 5 × 10 5 s 1 strain rate and to the temperatures between 200 °C and 350 °C in the 5 × 10 6 s 1 strain rate, suggesting the presence of DSA. In addition to the serrated plastic flow, for other characteristics of DSA, such as the peak in strain hardening coefficient, the strength plateau, and minima in ductility, the temperature range of DSA was determined to be between 250 °C and 400 °C for the 5 × 10 5 s 1 strain rate and between 200 °C and 350 °C for the 5 × 10 6 s 1 strain rate. The defined DSA range does not significantly deviate from the ranges reported in the literature [15,23,24,32]. Small differences in the temperature range may be caused by differences in the chemical composition of the T91 and/or the strain rates used.
In our study, we also observed the appearance of type A serrations in 5 × 10 5 s 1 strain rate tests and A+B type serrations in 5 × 10 5 s 1 strain rate tests. Type A occurred at lower temperature of the DSA regime due to the short waiting time, which results in limited aging and eventually causes the weak load drop [27,28,29,30,31]. Type B often develops from type A with reducing strain rate [27,28,29,30,31]. An explanation can be found in the decrease in the time needed to nucleate a new deformation band. Thus, it is favorable for the next deformation band to nucleate near the previously formed deformation band since it is easier to mitigate the stress relaxation than to form in an isolated area [27,28,29,30,31]. The effect of DSA on the deformation process of the material can be discussed based on the Hall–Petch relation [14]. In the Hall–Petch equation, during the deformation of a single grain, dislocation sources within the grain must be activated for the deformation to occur. An increase in deformation is followed by an increase in dislocation density. These dislocations are then piled up near the grain boundaries and generate an internal stress. After reaching the maximum value, this internal stress also affects the plastically undeformed grains adjacent to the deformed grains and initiates plastic deformation of the neighboring grains. The deformed grains establish the PLC band and subsequently affect the adjacent undeformed grains, causing non-uniform levels of strain aging. The difference may cause the formation of a small notch, which may become the nucleation point for the next PLC band [41]. When DSA is present, the material exhausts its plasticity sooner than without the presence of DSA. Hence, lower TEL is found in the DSA regime.

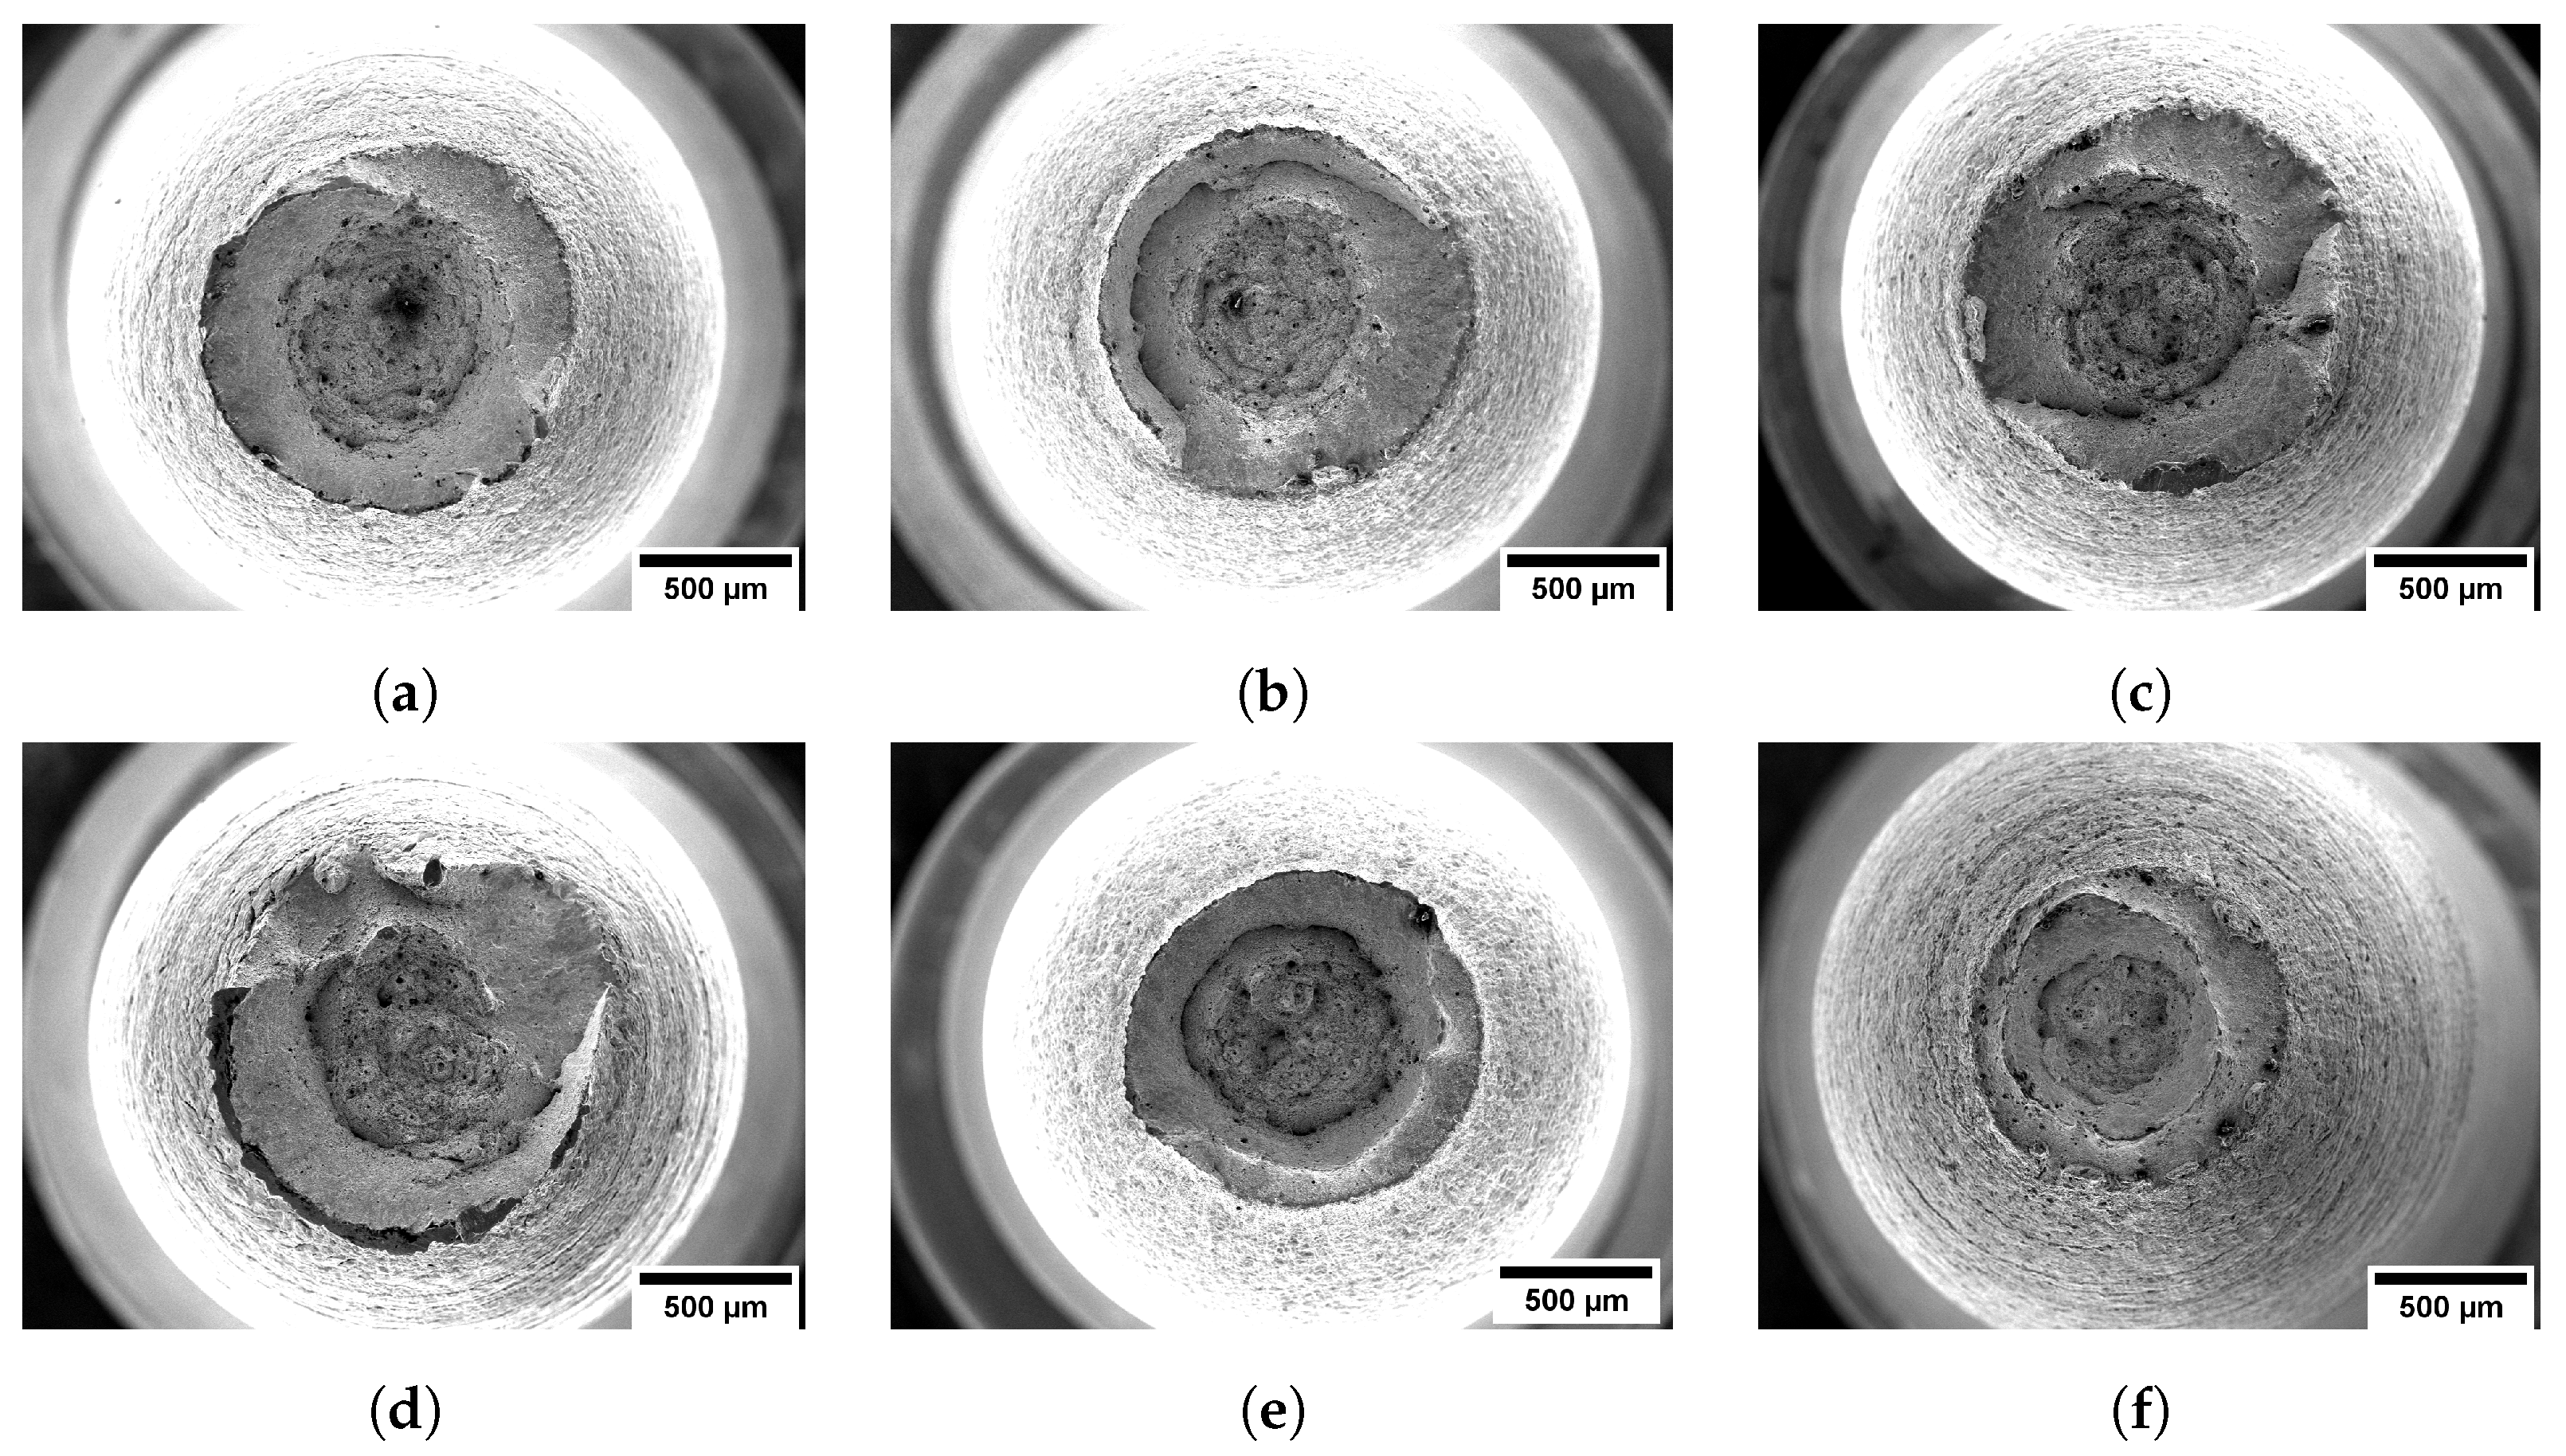
4.2. Identification of LME

Based on the presence of lateral cracks, quasi-cleavage features, and reduction in TEL compared to the reference tests, LME was observed in all test conditions except for tests at 450 °C at 5 × 10 5 s 1 and both at 400 °C and 450 °C at a strain rate of 5 × 10 6 s 1 .
The fracture surfaces of LBE-embrittled samples still showed clear ductile features, such as dimples, especially in the central area of the sample. In addition, a typical brittle feature, such as a flat fracture surface, was not identified in the LBE-embrittled samples. Thus, it is plausible to suggest that in our studied condition, the adsorption-enhanced plasticity mechanism of LME [10,37,42,43,44] was more pronounced than the adsorption-enhanced decohesion mechanism. Based on the adsorption-enhanced plasticity mechanism [10,37,44], the adsorption of embrittling atoms from the environment eases the nucleation of dislocations in the material. Based on the above discussion, it is plausible to suggest that the LBE facilitates dislocation nucleation in T91.
As indicated before, the interactions between LBE and the sample essentially occurred at the material’s surface. Based on the adsorption-enhanced plasticity mechanisms, interaction with LBE may result in an increase in the dislocation density in the surface layer, resulting in the hardening of the surface layer. A harder surface may, as such, result in the loss of ductility. Since the surface layer has loss of its ductility sooner than the bulk, lateral cracks can initiate. Based on the observation of the lateral surface of the LBE-embrittled samples, lateral cracks were found close to the necking area of the samples. This observation may indicate that these lateral cracks were initiated after a considerable level of plastic deformation was reached. The continuous supply of the LBE to the lateral crack tips resulted in the propagation of the lateral cracks towards the bulk of the sample and resulted in the formation of an affected zone on the fracture surface, showing a quasi-cleavage appearance.
As shown in Figure 14, the size of the quasi-cleavage area became wider as it approached the minimum in ductility, and the size decreased when it approached 450 °C. The increase in size of the quasi-cleavage area may suggest that lateral cracks were able to grow deeper into the bulk, hence explaining the wider affected zone. This observation may also suggest the decrease in LME severity with an increase in the temperature. One of the possible explanations for the weaker LME effect at a high temperature is related to ductility recovery [45]. At higher temperatures, the increase in the dislocation density at the surface layer is compensated by the high dislocation annihilation at the higher temperature.
Compared to the literature [46], the temperature range proposed in this study is somewhat different. Since the reduction in TEL compared to the reference condition was relatively small, LME in the T91/LBE system was not considered to occur at 250 °C and 275 °C in the 10 5 s 1 strain rate tests in the work of Dai et al. [46]. In our study, the difference in TEL with reference tests at temperatures below 300 °C was indeed also lower for both studied strain rates. However, lateral cracks were also present at temperatures lower than 300 °C in our work, while they were absent in the reference tests. Due to their absence in the reference tests, it was envisaged that this feature resulted directly from the interactions with LBE. Considering that T91 is a candidate material for the future nuclear reactor, any possible defects caused by LBE should be considered. Thus, in our study, we considered the presence of lateral cracks, despite the limited reduction in TEL, as an identification aspect of LME. Based on the absence of lateral cracks, the temperature limit of LME was defined to be at 450 °C at the 5 × 10 5 s 1 strain rate and at 400 °C at a strain rate of 5 × 10 6 s 1 . Therefore, we advocate an evaluation of the fracture surface and lateral cracks, which are more sensitive features to claim the potential occurrence of LME than the TEL.

4.3. Evaluation of the Potential Correlation between DSA and LME

In the evaluation of the possible correlation between DSA and LME, a parameter named the TEL ratio was defined. This TEL ratio was defined from the TEL of the material in LBE to the corresponding value determined in the reference condition [47]. While TEL ratios are generally used for the evaluation of material susceptibility to LME [47], the TEL ratio was used in this work to compare the temperature dependency of both LME and DSA. The results of overlapping the TEL ratio with the quasi-cleavage ratio presented previously (Figure 14) are presented in Figure 17. Figure 17 shows that the temperature where the quasi-cleavage ratio reached its maximum coincides with the temperature where TEL reached its minimum (Figure 17). In addition, the overlapping temperatures were located within the DSA range. It is worth mentioning that the overlap between the minimum temperature in the TEL ratio and the maximum temperature in the quasi-cleavage ratio was observed for both studied strain rates. Thus, it can be said that the maximum mechanical degradation occurred in conditions where the effects of DSA and LME were at their peaks, suggesting a correlation between both.
The effects of DSA not only occurred in the bulk but also took place on the sample surface, i.e., where the LBE effect was most prominent. Hence, optical methods such as Digital Image Correlation (DIC) can be used to investigate DSA [28]. Interaction with LBE may result in an increase in the dislocation density in the surface layer and cause this layer to be hardened. This hardened layer may also interact with the DSA effect, i.e., the PLC band, and further weaken the material. The concurrence between the LBE-affected surface layer and the PLC band may result in faster failure and enhanced crack propagation. This suggestion also explains why the size of the quasi-cleavage area increased for conditions where the effect of DSA increased as well (cf. Figure 17). The potential correlation between DSA and LME can additionally explain why the quasi-cleavage area was not noticed at 200 °C in the 5 × 10 5 s 1 strain rate test, as in this condition, DSA was not present either. The lateral cracks formed at the surface due to interactions with LBE can, therefore, not grow easily towards the bulk of T91. The correlation between DSA and LME may also explain the characteristics of the observed serrations in the LBE environment. As stated before, serrations in samples tested in LBE are qualitatively more apparent here than in samples tested in the reference condition. One of the essential aspects of DSA is the waiting time of dislocations at obstacles [48,49]. Longer waiting times at obstacles result in stronger aging, and thus a larger increase in the applied stress is needed to break away the dislocations from the solute atoms atmosphere. High resistance to dislocation mobility can be achieved by having obstacles which have a complex structure, such as dislocation tangle networks or by having a high density of dislocations [49]. Based on the adsorption-enhanced plasticity mechanism of LME, it is plausible to suggest that LBE facilitates dislocation nucleation in T91, thus enhancing the serrations.
While there are overlapping experimental conditions where DSA and LME are observed, the results obtained also suggest that DSA is not a pre-requisite for LME to occur. This suggestion is made based on some difference in the temperature window of DSA and LME. This study observed that LME still occurred in the condition where DSA was absent, or at least not observed in our tests, i.e., LBE tests at 200 °C in 5 × 10 6 s 1 strain rate. It is hoped that the results shown in study can help to increase awareness in the nuclear community about the correlation between DSA and surface degradation due to the heavy liquid metal environment. It is worth mentioning that austenitic stainless steel, which shows insensitivity to LME, also exhibits the presence of DSA [50]. Thus, further investigations regarding DSA beyond LME-sensitive materials is necessary to justify the results of the materials selection and qualification program for the Generation IV system.

5. Conclusions

Based on the microscopic observations and fractography of the lateral surfaces as well on the evaluation of the tensile test results, a potential correlation between DSA and LME was suggested. This correlation was supported by the observation that the maximum mechanical degradation that occurred in T91/LBE was found under the experimental conditions where the effects of DSA and LME were at their peaks. In addition, the following findings of LME in the T91/LBE system were disclosed in the present study, namely:
1.
The adsorption-enhanced plasticity mechanism was more likely to explain the observations as compared to the adsorption-enhanced decohesion mechanism for the studied T91/LBE system.
2.
The changes in the fracture surface and lateral surfaces are more sensitive features to claim the potential occurrence of LME than the value of the total elongation resulting from the tensile test.
3.
While there are correlations between DSA and LME, observation of DSA is not a prerequisite for LME to occur.

Author Contributions

Conceptualization, C.A.F. and S.G.; methodology, C.A.F.; validation, C.A.F., L.C., S.G. and K.V.; formal analysis, C.A.F.; investigation, C.A.F.; resources, S.G.; data curation, C.A.F.; writing—original draft preparation, C.A.F.; writing—review and editing, L.C., S.G. and K.V.; visualization, C.A.F.; supervision, L.C., S.G. and K.V.; project administration, S.G.; funding acquisition, S.G. All authors have read and agreed to the published version of the manuscript.

Funding

This work has been supported and partially funded by the Belgian government as a part of the MYRRHA project.

Data Availability Statement

The data that support the findings of this study are available upon request to SCK CEN. Restrictions apply to the availability of these data, which were used under license for this study. Data are available on request from the corresponding author, C.A.F., with the permission of SCK CEN.

Acknowledgments

The authors gratefully acknowledge the works carried out in the Heavy Metal Laboratory by Erich Stergar, David Fazer, and Gunter Coen. The authors appreciate the valuable technical assistance of Joris Jasper, Jelle Bouwens, and Bart Geykens.

Conflicts of Interest

The authors declare no conflicts of interest.

Appendix A. Engineering Stress–Strain Curves Obtained in an Inert Environment

All the engineering stress–strain curves obtained in the reference conditions are shown in Figure A1.
Figure A1. Engineering stress–strain curves obtained in the reference conditions.
Metals 14 00044 g0a1

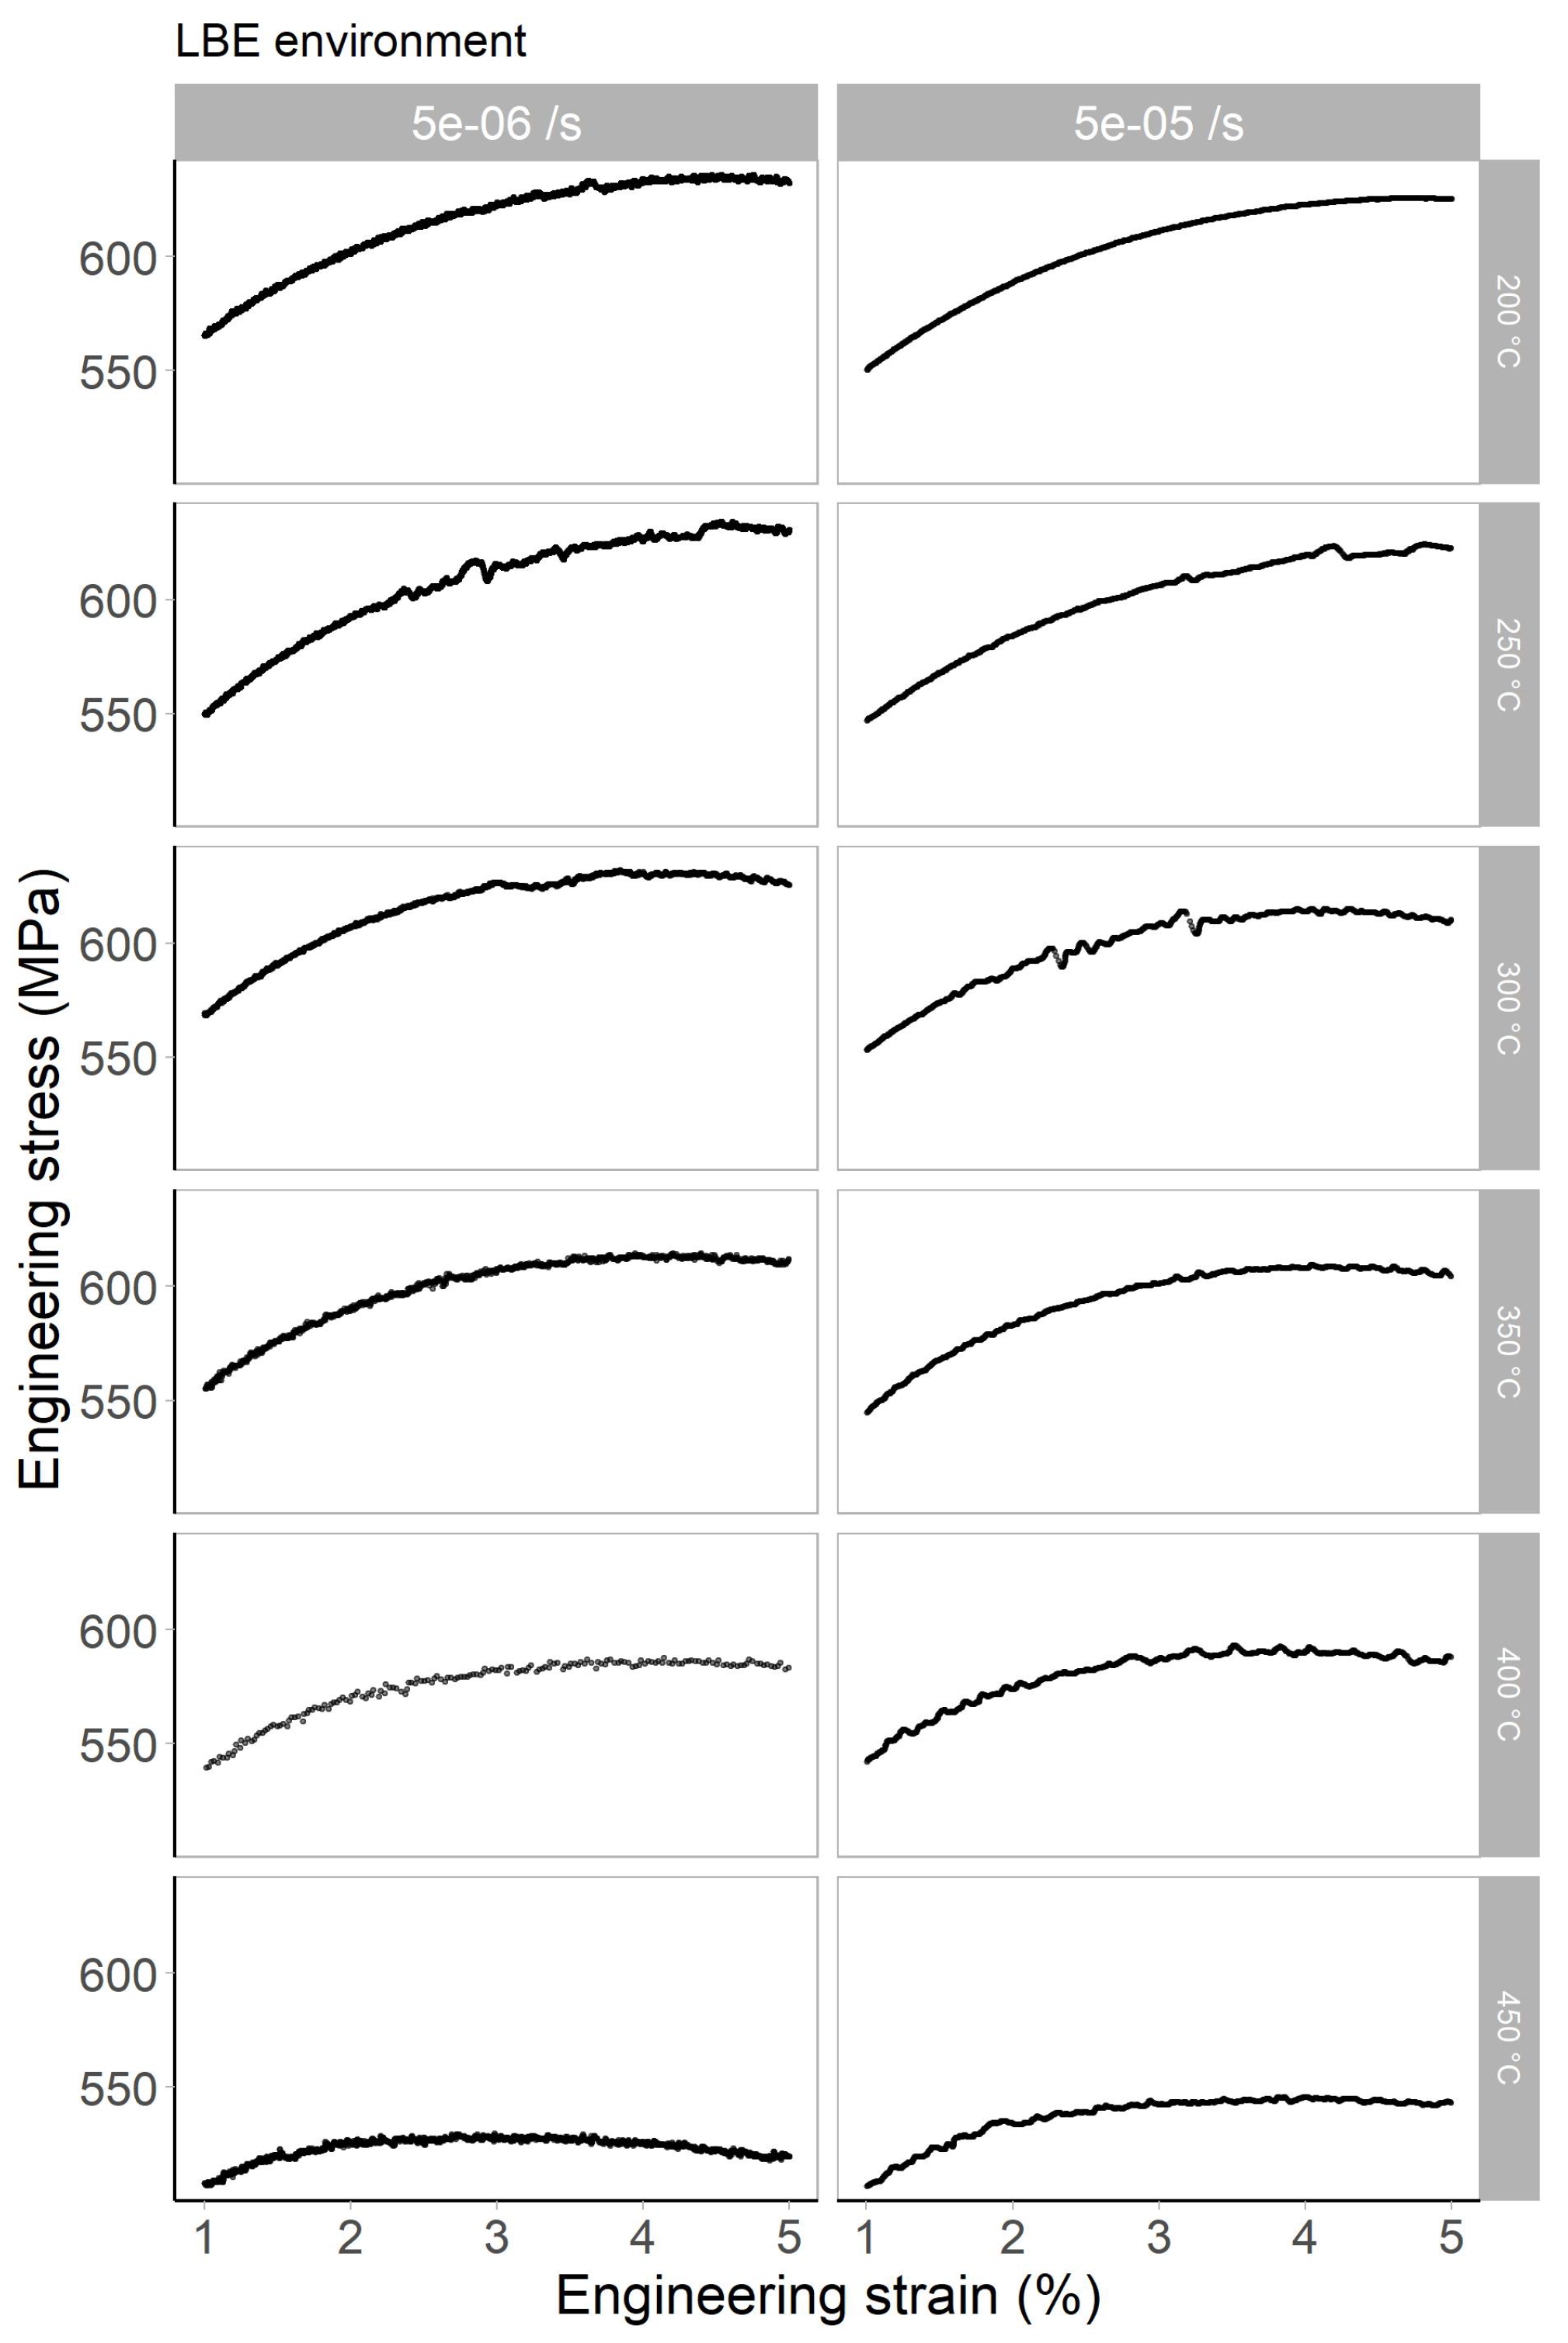
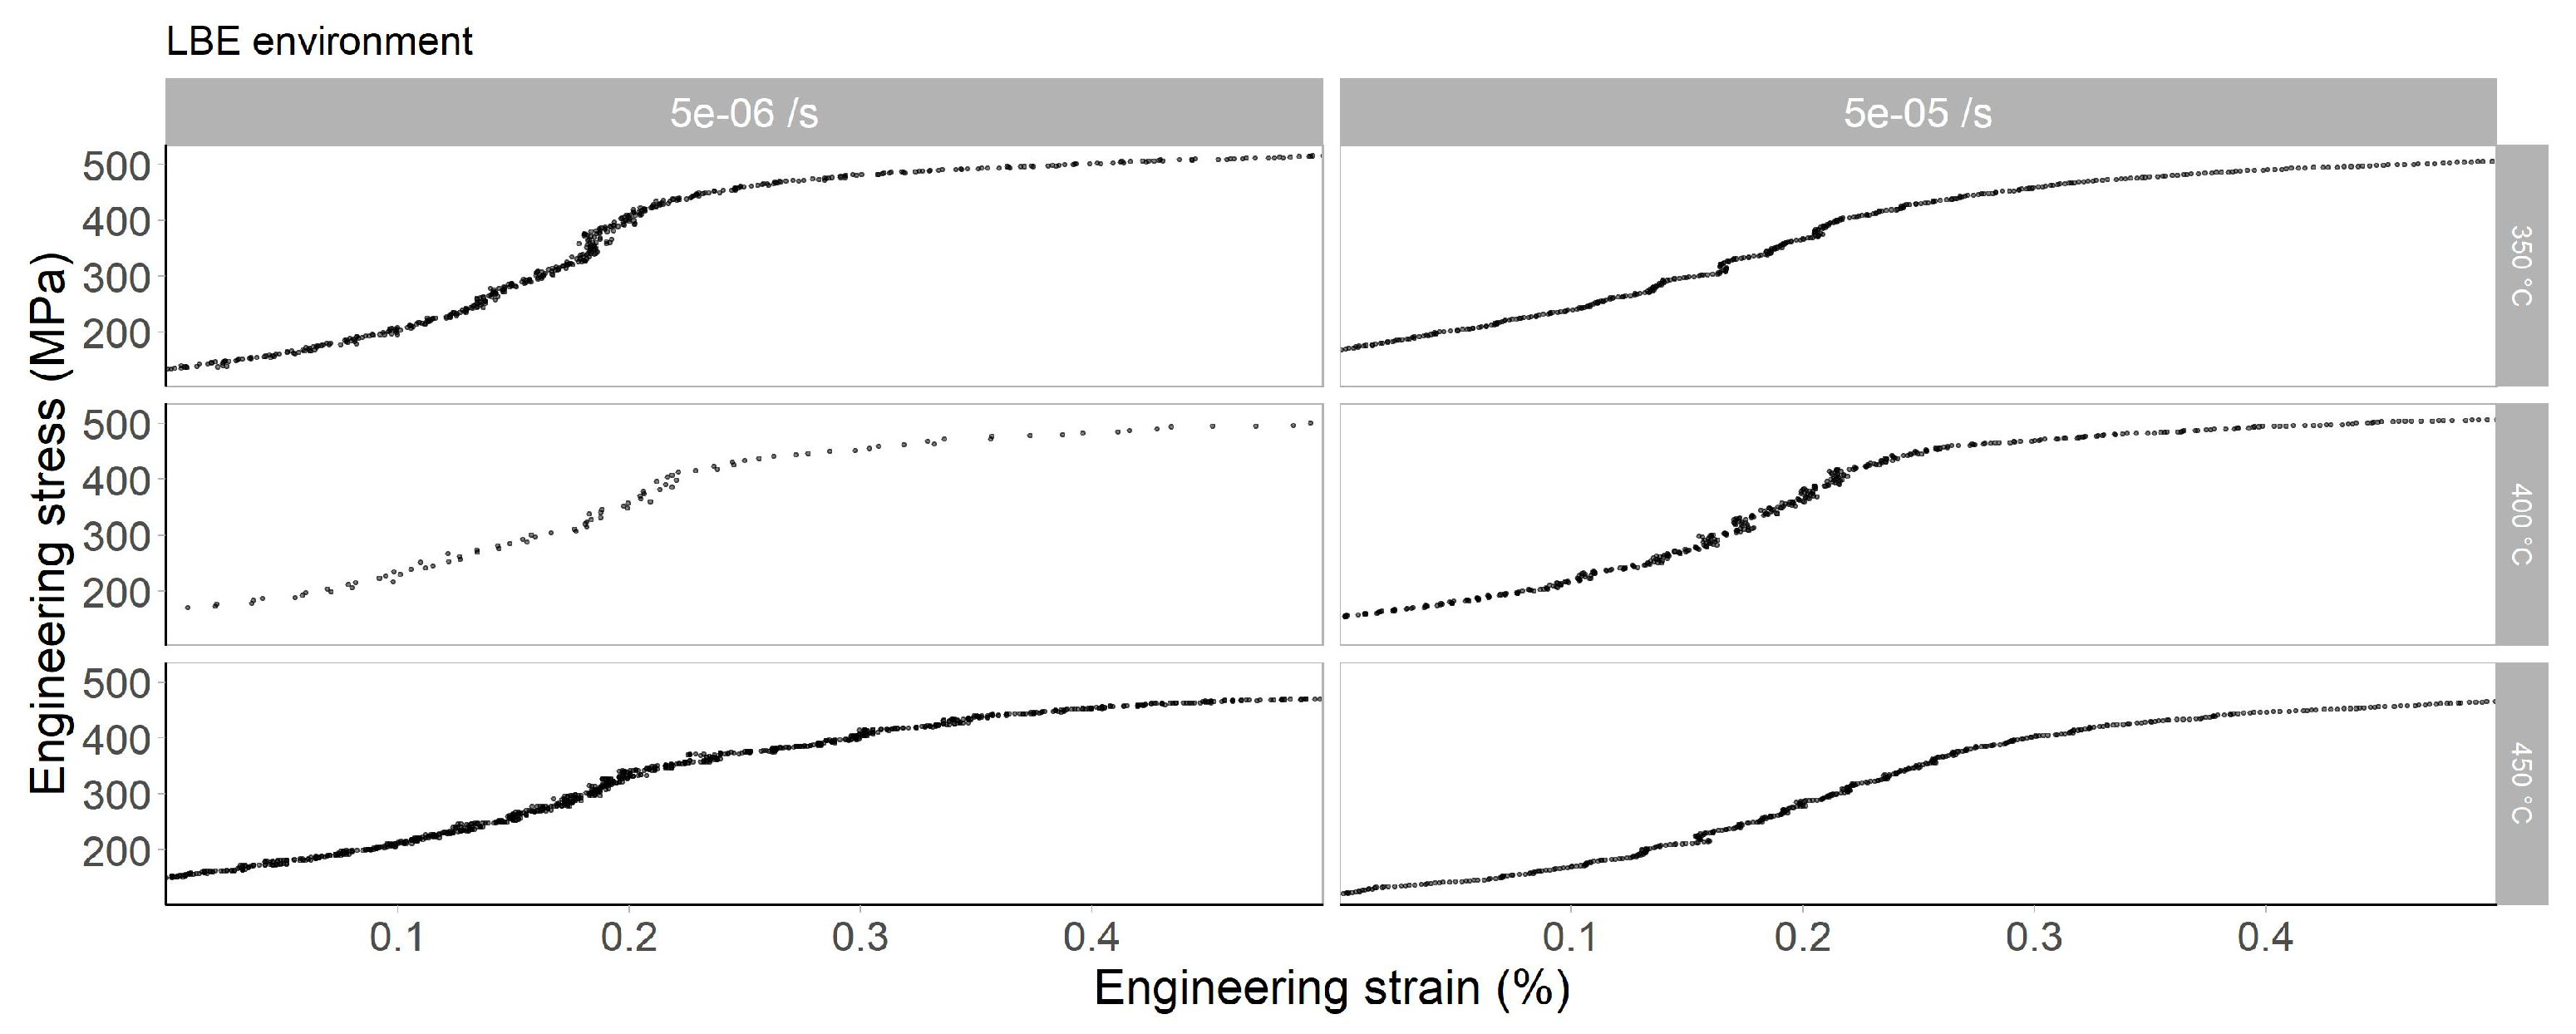
Appendix B. Engineering Stress–Strain Curves Obtained in Liquid LBE Environment

All the engineering stress–strain curves obtained in the liquid LBE environment are shown in Figure A2.
Figure A2. Engineering stress–strain curves obtained in the liquid LBE environment.
Metals 14 00044 g0a2

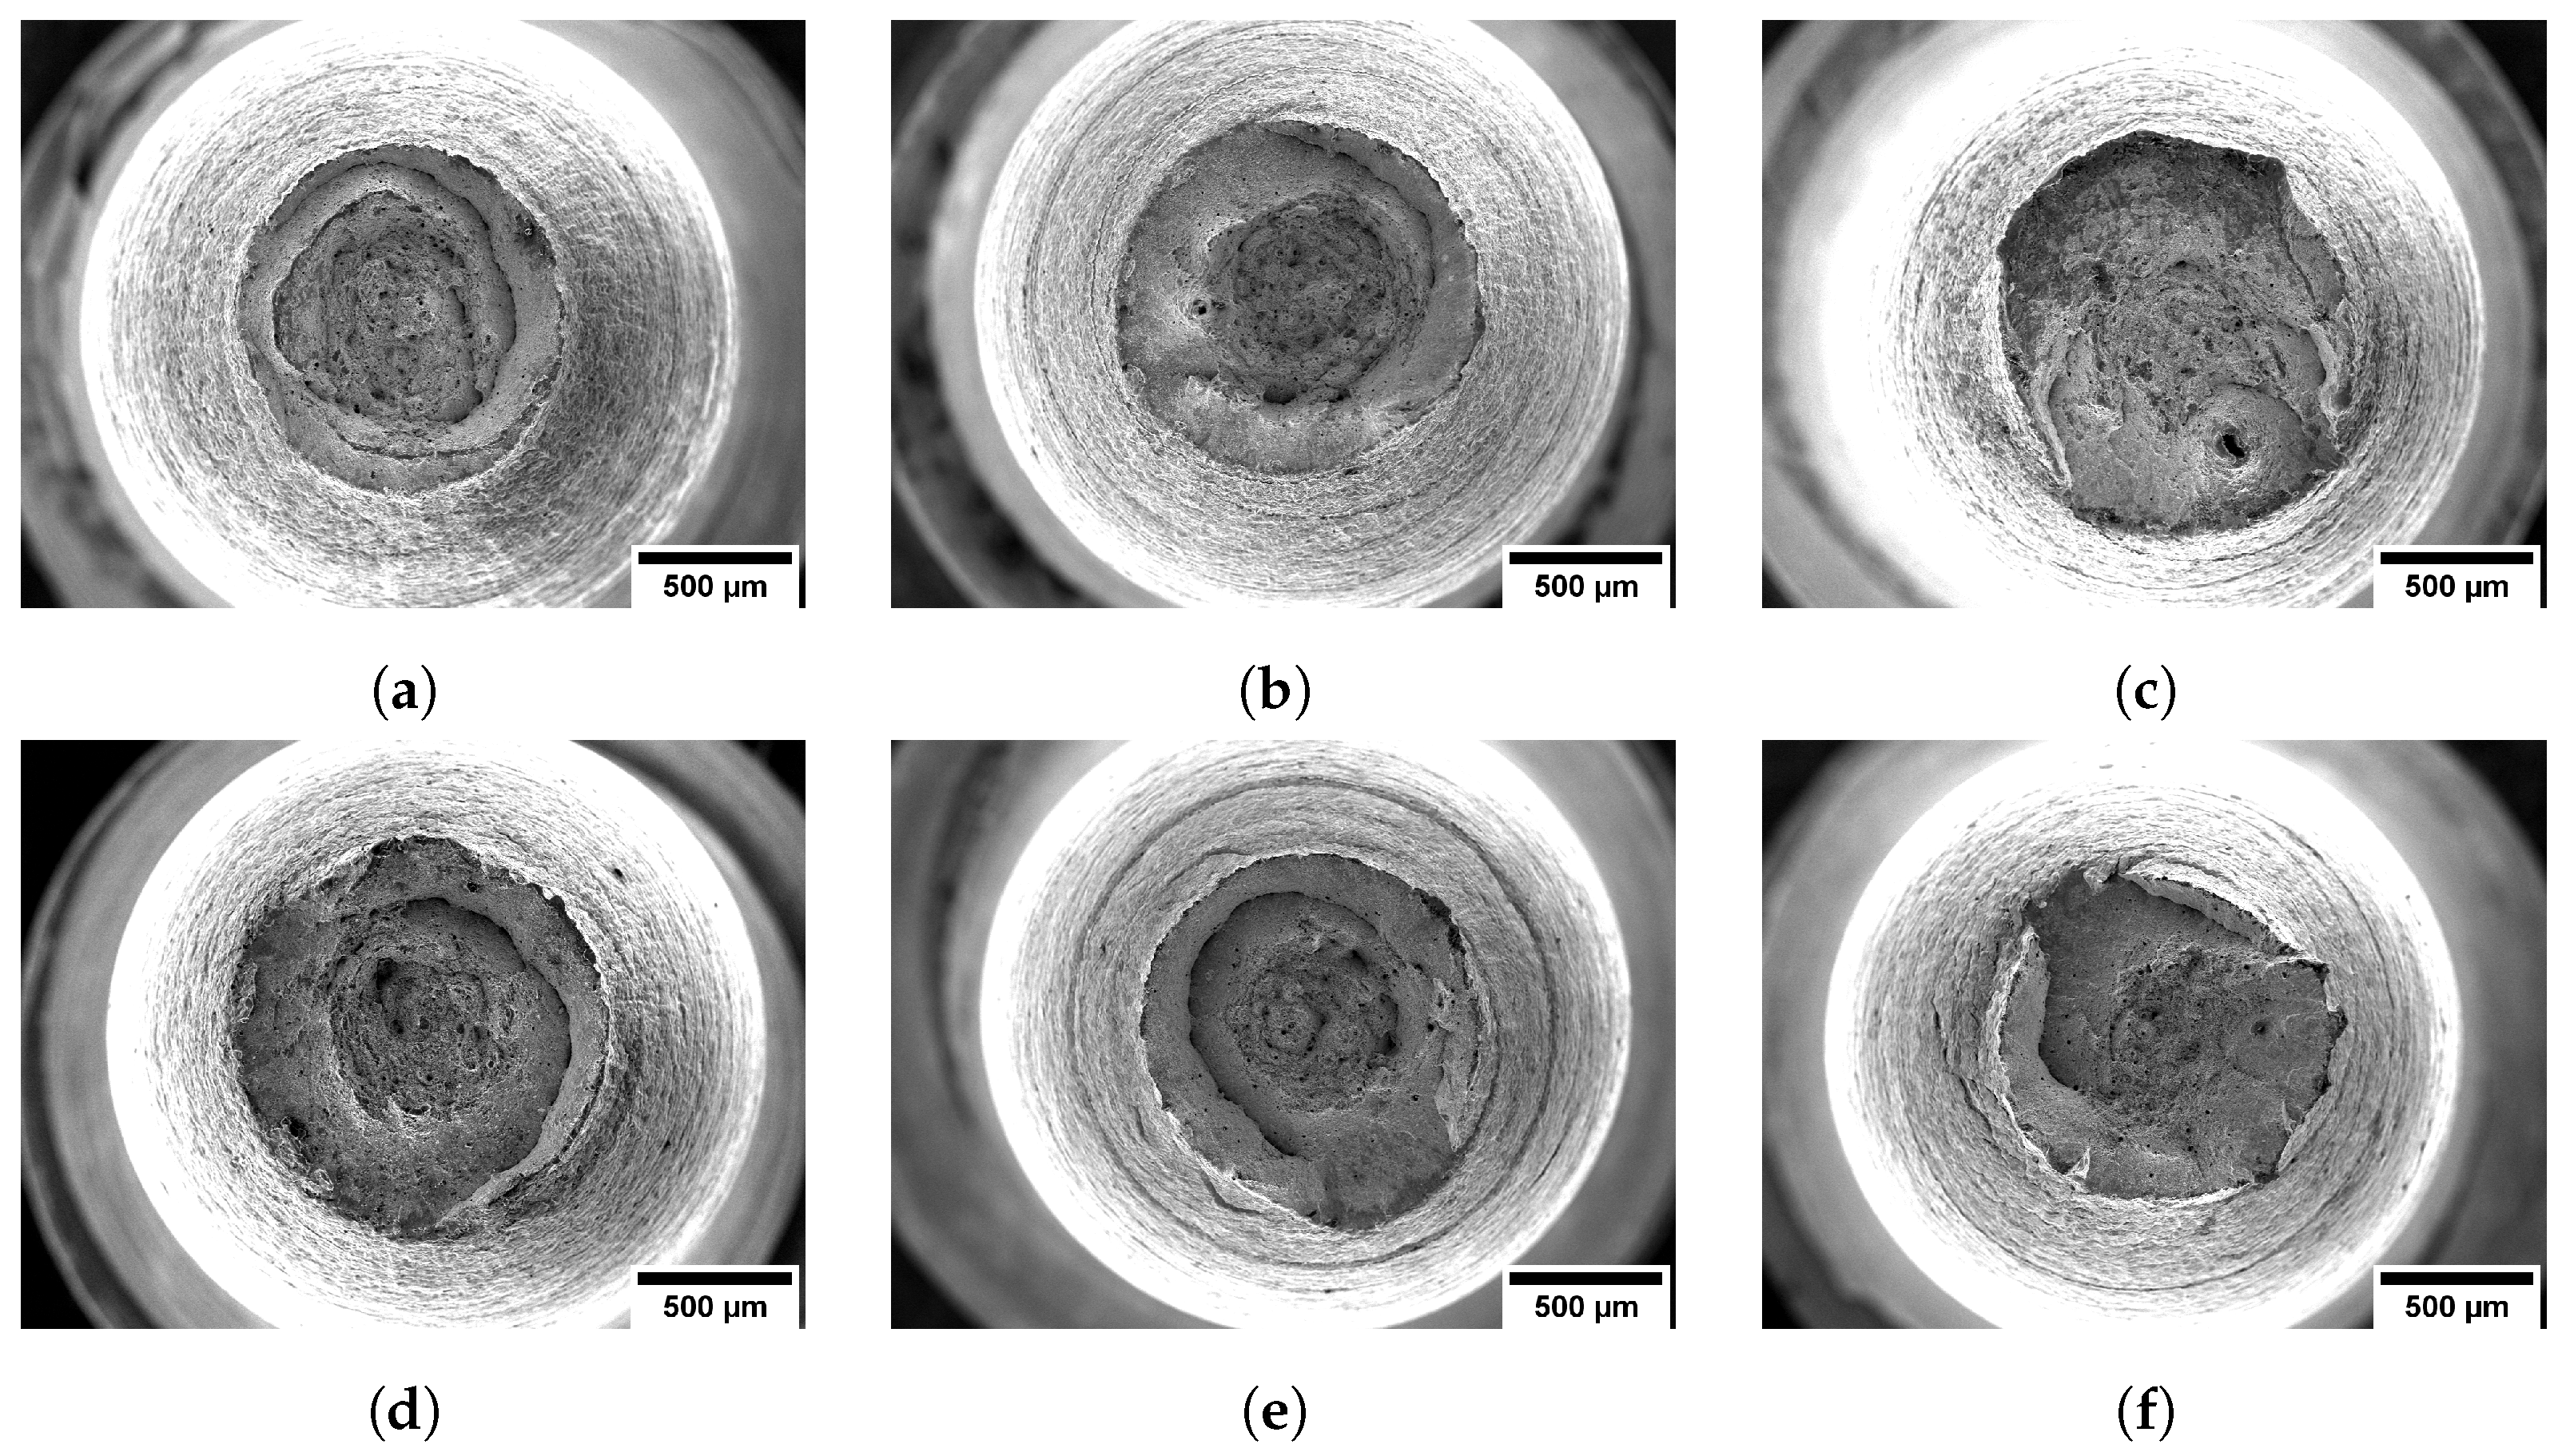
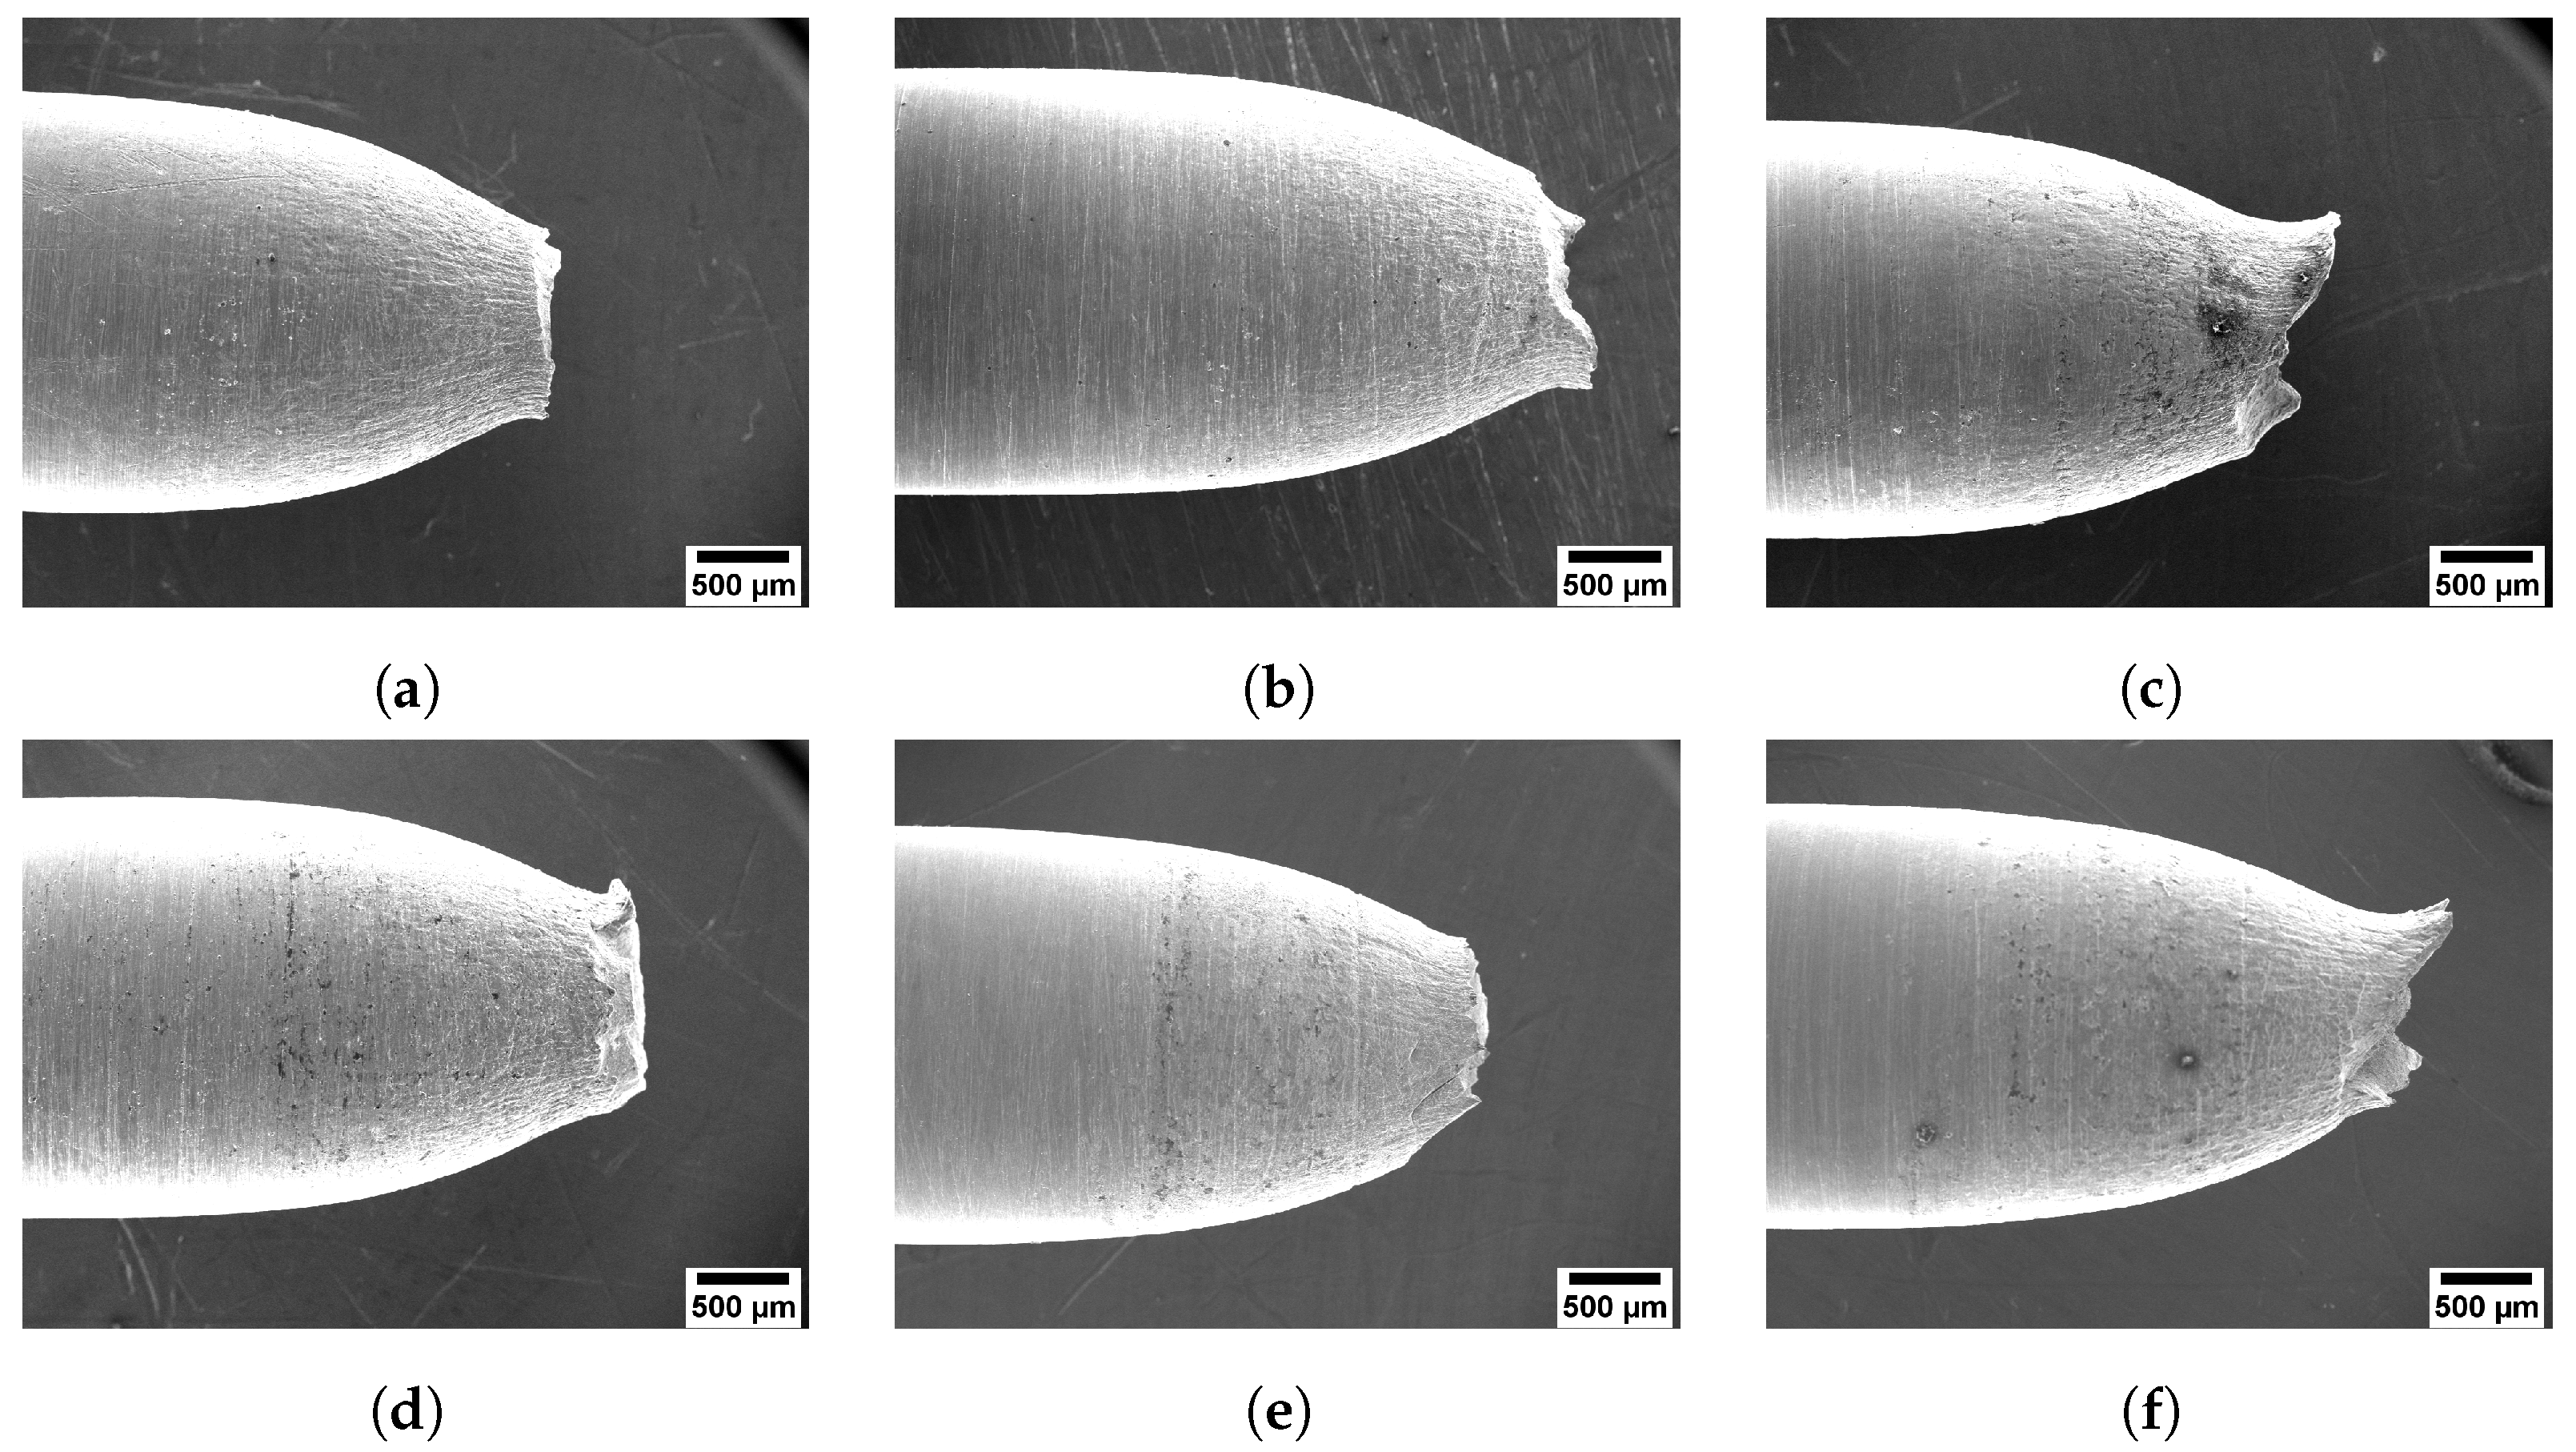
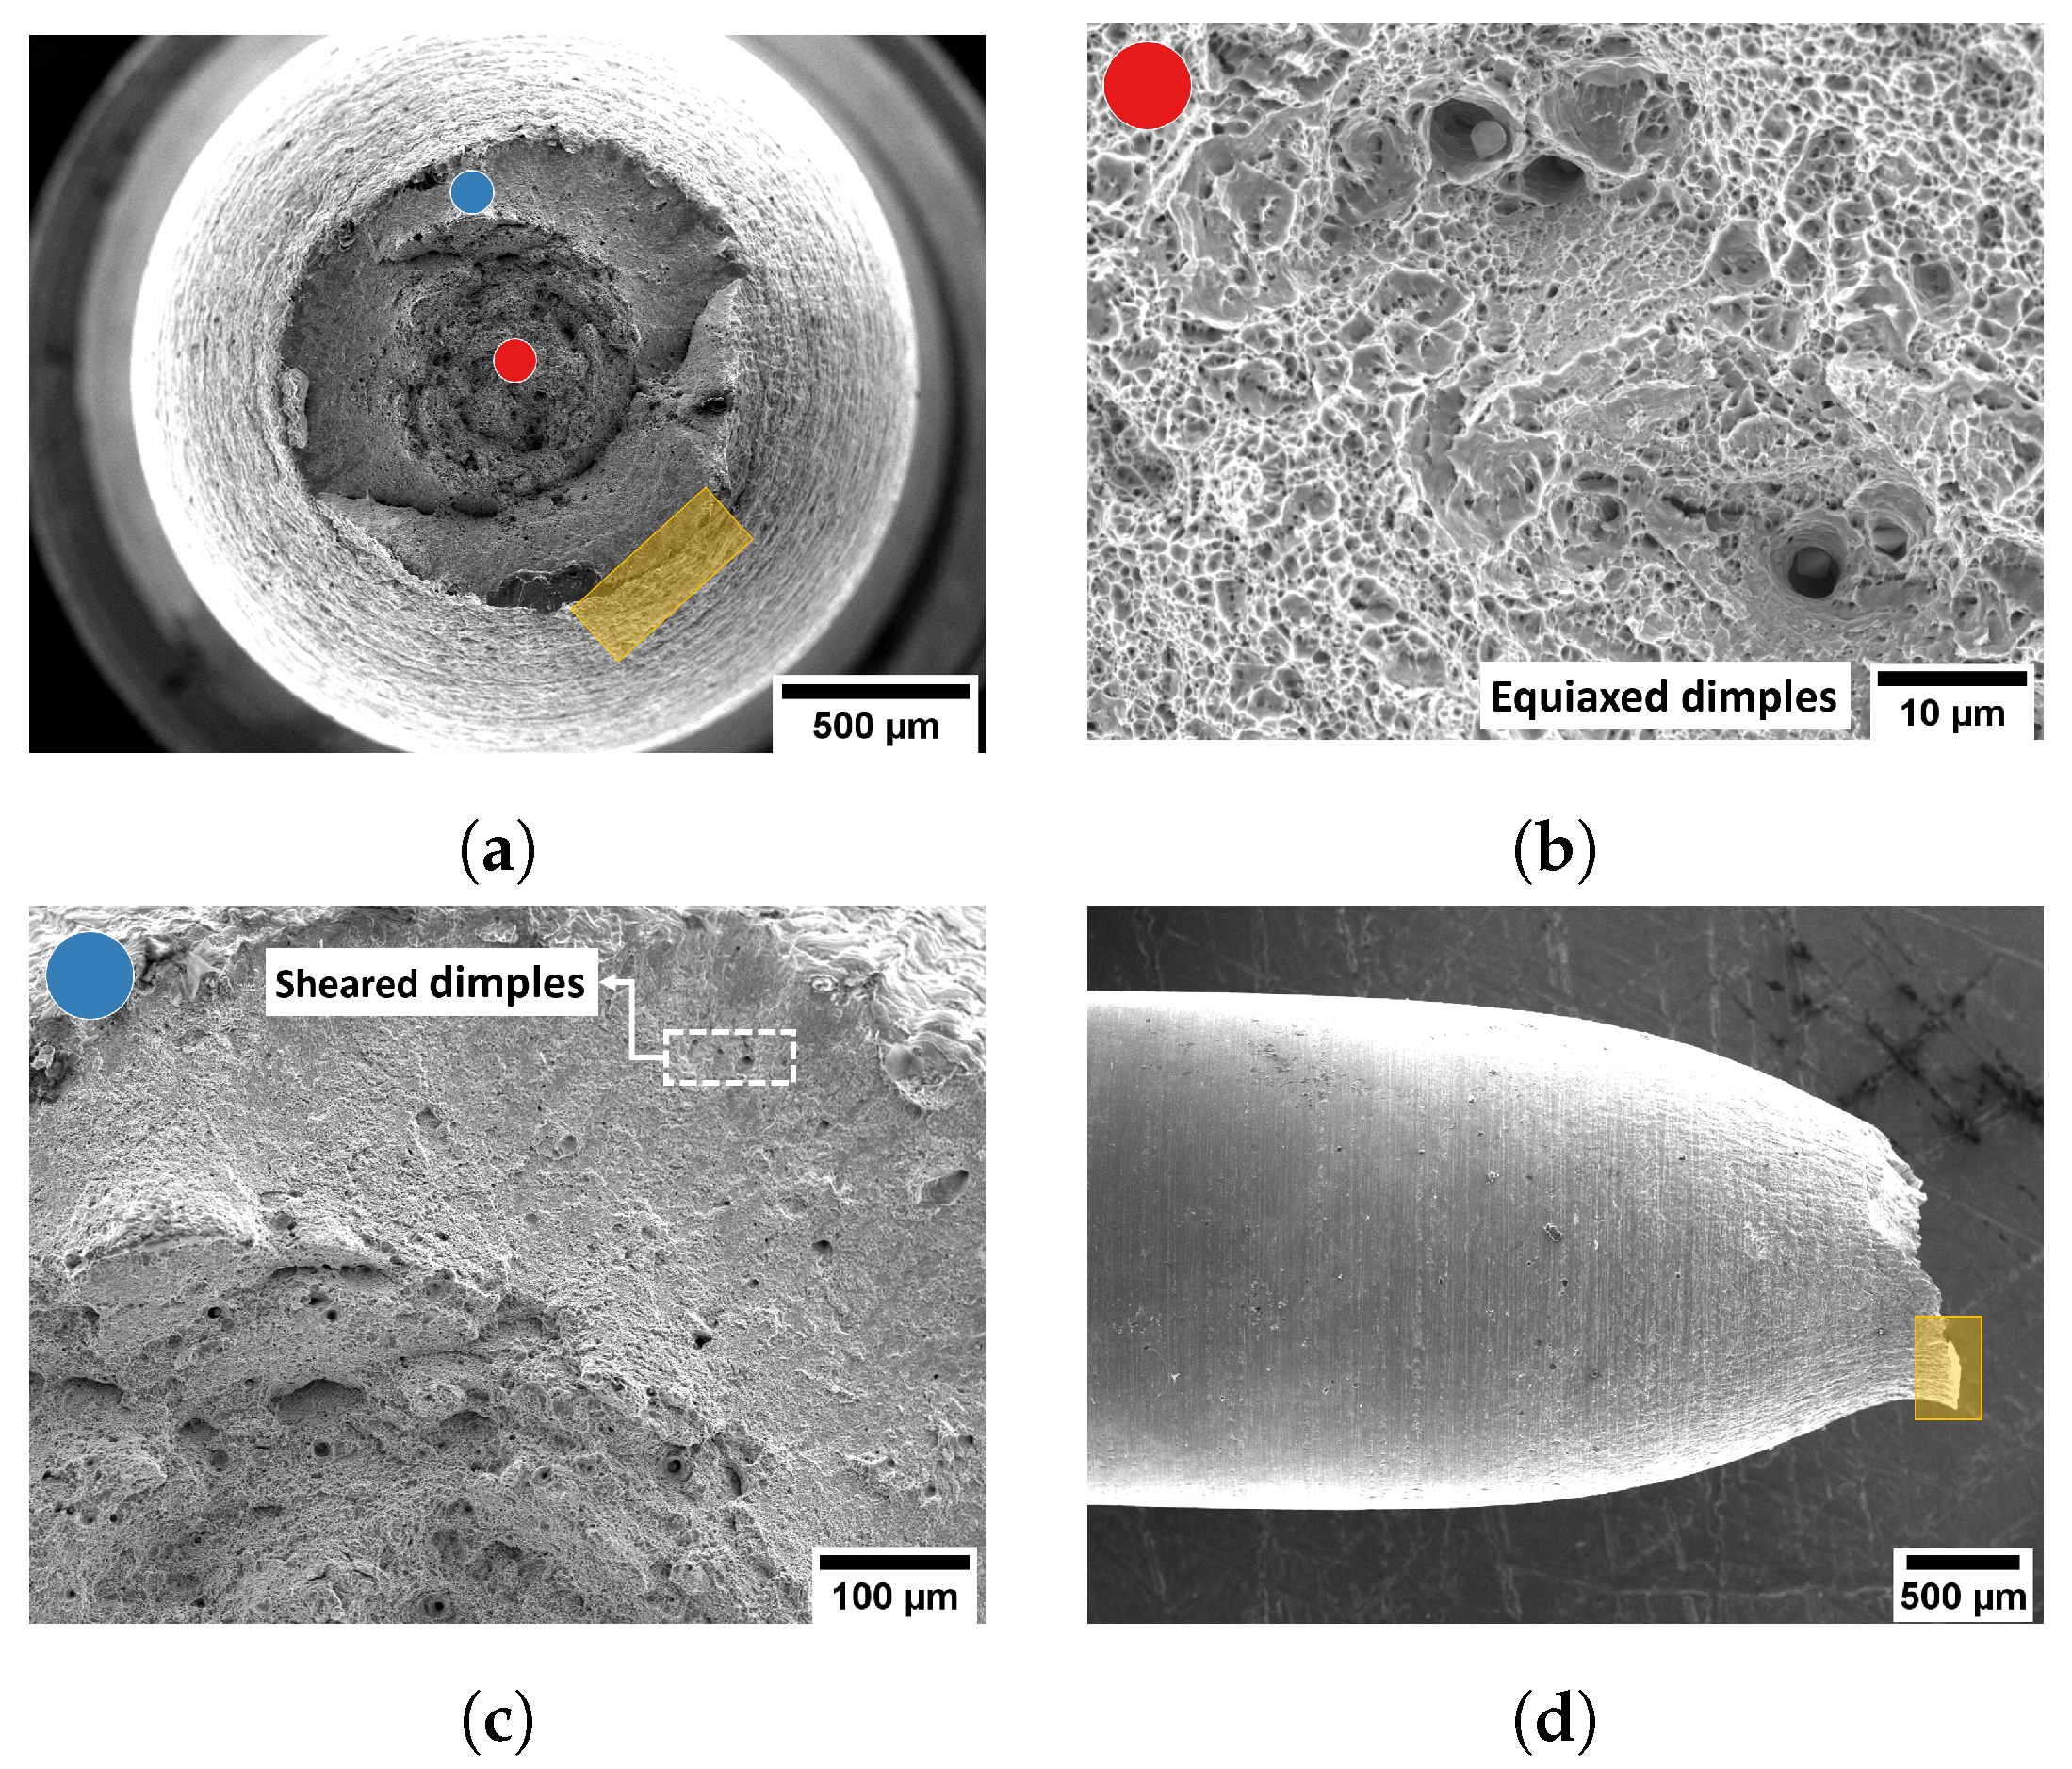
Appendix C. Fracture Surfaces of Reference Conditions

Fracture surfaces of representative samples tested in reference conditions are shown in Figure A3Figure A6.
Figure A3. Top view of samples tested in reference condition at 5 × 10 5 s 1 strain rate. (a) Temperature: 200 °C; (b) temperature: 250 °C; (c) temperature: 300 °C; (d) temperature: 350 °C; (e) temperature: 400 °C; (f) temperature: 450 °C.
Metals 14 00044 g0a3
Figure A4. Top view of samples tested in reference condition at 5 × 10 6 s 1 strain rate. (a) Temperature: 200 °C; (b) temperature: 250 °C; (c) temperature: 300 °C; (d) temperature: 350 °C; (e) temperature: 400 °C; (f) temperature: 450 °C.
Metals 14 00044 g0a4
Figure A5. Lateral view of samples tested in reference condition at 5 × 10 5 s 1 strain rate. (a) Temperature: 200 °C; (b) temperature: 250 °C; (c) temperature: 300 °C; (d) temperature: 350 °C; (e) temperature: 400 °C; (f) temperature: 450 °C.
Metals 14 00044 g0a5
Figure A6. Lateral view of samples tested in reference condition at 5 × 10 6 s 1 strain rate. (a) Temperature: 200 °C; (b) temperature: 250 °C; (c) temperature: 300 °C; (d) temperature: 350 °C; (e) temperature: 400 °C; (f) temperature: 450 °C.
Metals 14 00044 g0a6

References

  1. Tan, L.; Hoelzer, D.T.; Busby, J.T.; Sokolov, M.A.; Klueh, R.L. Microstructure control for high strength 9Cr ferritic–martensitic steels. J. Nucl. Mater. 2012, 422, 45–50. [Google Scholar] [CrossRef]
  2. Zhong, W.; Sridharan, N.; Isheim, D.; Field, K.G.; Yang, Y.; Terrani, K.; Tan, L. Microstructures and mechanical properties of a modified 9Cr ferritic-martensitic steel in the as-built condition after additive manufacturing. J. Nucl. Mater. 2021, 545, 152742. [Google Scholar] [CrossRef]
  3. Auger, T.; Lorang, G. Liquid metal embrittlement susceptibility of T91 steel by lead-bismuth. Scr. Mater. 2005, 52, 1323–1328. [Google Scholar] [CrossRef]
  4. Gong, X.; Short, M.P.; Auger, T.; Charalampopoulou, E.; Lambrinou, K. Environmental degradation of structural materials in liquid lead- and lead-bismuth eutectic-cooled reactors. Prog. Mater. Sci. 2022, 126, 100920. [Google Scholar] [CrossRef]
  5. Martin, M.L.; Dadfarnia, M.; Nagao, A.; Wang, S.; Sofronis, P. Enumeration of the hydrogen-enhanced localized plasticity mechanism for hydrogen embrittlement in structural materials. Acta Mater. 2019, 165, 734–750. [Google Scholar] [CrossRef]
  6. Rajasekaran, R.; Lakshminarayanan, A.K.; Damodaram, R.; Balasubramanian, V. Stress corrosion cracking failure of friction stir welded nuclear grade austenitic stainless steel. Eng. Fail. Anal. 2021, 120, 105012. [Google Scholar] [CrossRef]
  7. Razmpoosh, M.H.; DiGiovanni, C.; Zhou, Y.N.; Biro, E. Pathway to understand liquid metal embrittlement (LME) in Fe-Zn couple: From fundamentals toward application. Prog. Mater. Sci. 2021, 121, 100798. [Google Scholar] [CrossRef]
  8. Gavrilov, S.; Lambrecht, M.; Coen, G.; Stergar, E.; Van den Bosch, J. PIE of ASTIR: Report on the full set of results of tests on irradiated and non-irradiated specimens. In FP7-212175-GETMAT; SCK-CEN: Mol, Belgium, 2014. [Google Scholar]
  9. Long, B.; Tong, Z.; Gröschel, F.; Dai, Y. Liquid Pb–Bi embrittlement effects on the T91 steel after different heat treatments. J. Nucl. Mater. 2008, 377, 219–224. [Google Scholar] [CrossRef]
  10. Joseph, B.; Picat, M.; Barbier, F. Liquid metal embrittlement: A state-of-the-art appraisal. Eur. Phys. J. AP 1999, 5, 19–31. [Google Scholar] [CrossRef]
  11. Nicaise, G.; Legris, A.; Vogt, J.; Foct, J. Embrittlement of the martensitic steel 91 tested in liquid lead. J. Nucl. Mater. 2001, 296, 256–264. [Google Scholar] [CrossRef]
  12. Ersoy, F.; Verbeken, K.; Gavrilov, S. Influence of displacement rate and temperature on the severity of liquid metal embrittlement of T91 steel in LBE. Mater. Sci. Eng. A 2021, 800, 140259. [Google Scholar] [CrossRef]
  13. Ye, C.; Vogt, J.B.; Proriol Serre, I. Liquid metal embrittlement of the T91 steel in lead bismuth eutectic: The role of loading rate and of the oxygen content in the liquid metal. Mater. Sci. Eng. A 2014, 608, 242–248. [Google Scholar] [CrossRef]
  14. Gottstein, G. Physical Foundations of Materials Science; Springer: Berlin/Heidelberg, Germany, 2013. [Google Scholar]
  15. Srinivas, N.C.S.; Verma, P.; Singh, V. Dynamic Strain Ageing Behaviour of Modified 9Cr-1Mo Steel Under Monotonic and Cyclic Loading. Procedia Eng. 2017, 184, 765–772. [Google Scholar] [CrossRef]
  16. Kolman, D.G. A Review of Recent Advances in the Understanding of Liquid Metal Embrittlement. Corrosion 2018, 75, 42–57. [Google Scholar] [CrossRef] [PubMed]
  17. Kubin, L.; Estrin, Y. Dynamic strain ageing and the mechanical response of alloys. J. Phys. III 1991, 1, 929–943. [Google Scholar] [CrossRef]
  18. Kashyap, B.P.; McTaggart, K.; Tangri, K. Study on the substructure evolution and flow behaviour in type 316L stainless steel over the temperature range 21–900 °C. Philos. Mag. A 1988, 57, 97–114. [Google Scholar] [CrossRef]
  19. Sleeswyk, A.W. Slow strain-hardening of ingot iron. Acta Metall. 1958, 6, 598–603. [Google Scholar] [CrossRef]
  20. Van den Beukel, A. Theory of the effect of dynamic strain aging on mechanical properties. Phys. Status Solidi A 1975, 30, 197–206. [Google Scholar] [CrossRef]
  21. Xu, J.; Holmedal, B.; Hopperstad, O.S.; Mánik, T.; Marthinsen, K. Dynamic strain ageing in an AlMg alloy at different strain rates and temperatures: Experiments and constitutive modelling. Int. J. Plast. 2022, 151, 103215. [Google Scholar] [CrossRef]
  22. Fressengeas, C.; Beaudoin, A.J.; Lebyodkin, M.; Kubin, L.P.; Estrin, Y. Dynamic strain aging: A coupled dislocation—Solute dynamic model. Mater. Sci. Eng. A 2005, 400, 226–230. [Google Scholar] [CrossRef]
  23. Kishore, R.; Singh, R.N.; Sinha, T.K.; Kashyap, B.P. Effect of dynamic strain ageing on the tensile properties of a modified 9Cr-1Mo steel. J. Mater. Sci. 1997, 32, 437–442. [Google Scholar] [CrossRef]
  24. Keller, C.; Margulies, M.M.; Hadjem-Hamouche, Z.; Guillot, I. Influence of the temperature on the tensile behaviour of a modified 9Cr-1Mo T91 martensitic steel. Mater. Sci. Eng. A 2010, 527, 6758–6764. [Google Scholar] [CrossRef]
  25. Roy, A.K.; Kumar, P.; Maitra, D. Dynamic strain ageing of P91 grade steels of varied silicon content. Mater. Sci. Eng. A 2009, 499, 379–386. [Google Scholar] [CrossRef]
  26. Choudhary, B.; Christopher, J. Influence of temperature and strain rate on tensile deformation and fracture behaviour of boron added P91 steel. Int. J. Press. Vessel. Pip. 2019, 171, 153–161. [Google Scholar] [CrossRef]
  27. Rodriguez, P. Serrated plastic flow. Bull. Mater. Sci. 1984, 6, 653–663. [Google Scholar] [CrossRef]
  28. Yilmaz, A. The Portevin–Le Chatelier effect: A review of experimental findings. Sci. Technol. Adv. Mater. 2011, 12, 063001. [Google Scholar] [CrossRef]
  29. Zhang, Y.; Liu, J.P.; Chen, S.Y.; Xie, X.; Liaw, P.K.; Dahmen, K.A.; Qiao, J.W.; Wang, Y.L. Serration and noise behaviors in materials. Prog. Mater. Sci. 2017, 90, 358–460. [Google Scholar] [CrossRef]
  30. Lee, S.Y.; Chettri, S.; Sarmah, R.; Takushima, C.; Hamada, J.I.; Nakada, N. Serrated flow accompanied with dynamic type transition of the Portevin–Le Chatelier effect in austenitic stainless steel. J. Mater. Sci. Technol. 2023, 133, 154–164. [Google Scholar] [CrossRef]
  31. Jiang, H.; Zhang, Q.; Chen, X.; Chen, Z.; Jiang, Z.; Wu, X.; Fan, J. Three types of Portevin–Le Chatelier effects: Experiment and modelling. Acta Mater. 2007, 55, 2219–2228. [Google Scholar] [CrossRef]
  32. Choudhary, B.K. Influence of strain rate and temperature on serrated flow in 9Cr–1Mo ferritic steel. Mater. Sci. Eng. A 2013, 564, 303–309. [Google Scholar] [CrossRef]
  33. Choudhary, B.K.; Rao, K.B.S.; Mannan, S.L. Effects of strain rate and temperature on tensile deformation and fracture behaviour of forged thick section 9Cr-1Mo ferritic steel. Int. J. Press. Vessel. Pip. 1994, 58, 151–160. [Google Scholar] [CrossRef]
  34. Kishore, R.; Singh, R.N.; Sinha, T.K.; Kashyap, B.P. Serrated flow in a modified 9Cr-1Mo steel. Scr. Metall. Mater. 1995, 32, 1297–1300. [Google Scholar] [CrossRef]
  35. Hojná, A.; Di Gabriele, F.; Klecka, J.; Burda, J. Behaviour of the steel T91 under uniaxial and multiaxial slow loading in contact with liquid lead. J. Nucl. Mater. 2015, 466, 292–301. [Google Scholar] [CrossRef]
  36. Li, J.; He, X.k.; Yang, G.; Xu, B.; Tang, Z.x. Effect of silicon on ductility of T91 steel in liquid lead–bismuth eutectic environment. J. Iron Steel Res. Int. 2023, 30, 363–374. [Google Scholar] [CrossRef]
  37. Dmukhovs’ka, I.H.; Popovych, V.V. Influence of stress concentrators on the temperature dependence of the liquid metal embrittlement of Armco iron. Mater. Sci. 1994, 29, 501–506. [Google Scholar] [CrossRef]
  38. Van den Bosch, J.; Sapundjiev, D.; Almazouzi, A. Effects of temperature and strain rate on the mechanical properties of T91 material tested in liquid lead bismuth eutectic. J. Nucl. Mater. 2006, 356, 237–246. [Google Scholar] [CrossRef]
  39. Schneider, C.A.; Rasband, W.S.; Eliceiri, K.W. NIH Image to ImageJ: 25 years of image analysis. Nat. Methods 2012, 9, 671–675. [Google Scholar] [CrossRef]
  40. Sobolev, V. Database of thermophysical properties of liquid metal coolants for GEN-IV. In Scientific Report: SCK CEN-BLG-1069; SCK-CEN: Mol, Belgium, 2010. [Google Scholar]
  41. Jacobs, T.R.; Matlock, D.K.; Findley, K.O. Characterization of localized plastic deformation behaviors associated with dynamic strain aging in pipeline steels using digital image correlation. Int. J. Plast. 2019, 123, 70–85. [Google Scholar] [CrossRef]
  42. Popovich, V.V.; Dmukhovskaya, I.G. Rebinder effect in the fracture of Armco iron in liquid metals. Sov. Mater. Sci. Transl. Fiziko-Khimich. Mekh. Mater. Acad. Sci. Ukr. SSR 1978, 14, 365–370. [Google Scholar] [CrossRef]
  43. Dmukhovskaya, I.G.; Popovich, V.V. A phenomenological model of embrittlement of metals under conditions of the adsorption action of liquid metal media. Sov. Mater. Sci. Transl. Fiziko-Khimich. Mekh. Mater. Acad. Sci. Ukr. SSR 1983, 18, 461–467. [Google Scholar] [CrossRef]
  44. Lynch, S.P. Environmentally assisted cracking: Overview of evidence for an adsorption-induced localised-slip process. Acta Metall. 1988, 36, 2639–2661. [Google Scholar] [CrossRef]
  45. Kamdar, M.H. Embrittlement by liquid metals. Prog. Mater. Sci. 1973, 15, 289–374. [Google Scholar] [CrossRef]
  46. Dai, Y.; Long, B.; Groeschel, F. Slow strain rate tensile tests on T91 in static lead-bismuth eutectic. J. Nucl. Mater. 2006, 356, 222–228. [Google Scholar] [CrossRef]
  47. ASTM G129-00; Standard Practice for Slow Strain Rate Testing to Evaluate the Susceptibility of Metallic Materials to Environmentally Assisted Cracking. ASTM: West Conshohocken, PA, USA, 2000.
  48. Casarotto, L.; Dierke, H.; Tutsch, R.; Neuhäuser, H. On nucleation and propagation of PLC bands in an Al–3Mg alloy. Mater. Sci. Eng. A 2009, 527, 132–140. [Google Scholar] [CrossRef]
  49. Peng, K.; Qian, K.; Chen, W. Effect of dynamic strain aging on high temperature properties of austenitic stainless steel. Mater. Sci. Eng. A 2004, 379, 372–377. [Google Scholar] [CrossRef]
  50. De Almeida, L.; Le May, I.; Emygdio, P. Mechanistic Modeling of Dynamic Strain Aging in Austenitic Stainless Steels. Mater. Charact. 1998, 41, 137–150. [Google Scholar] [CrossRef]
Figure 1. SEM images of studied T91 indicating the presence of (1) tempered martensitic laths with carbides (2) decorating the lath boundaries and (3) decorating the prior austenite grain boundaries.
Metals 14 00044 g001
Figure 2. Technical drawing of the tensile sample.
Metals 14 00044 g002
Figure 3. Schematic representation of the testing setup.
Metals 14 00044 g003
Figure 4. Magnified view of engineering stress–strain curves in reference condition for both strain rates at different temperatures.
Metals 14 00044 g004
Figure 5. Variation in strain hardening coefficient (n) with temperature for both strain rates in the reference condition.
Metals 14 00044 g005
Figure 6. Variation in ultimate tensile strength and total elongation with temperature for both strain rates in reference condition.
Metals 14 00044 g006
Figure 7. (a) Fractographs of samples tested at 5 × 10 6 s 1 strain rate at 300 °C in reference condition with colored shapes indicating specific features. Those features are (b) equiaxed dimples, (c) sheared dimples and (d) sheared lip with no lateral cracks.
Metals 14 00044 g007
Figure 8. Magnified view of engineering stress–strain curves in LBE environment tested at both strain rates and at different temperatures.
Metals 14 00044 g008
Figure 9. Magnified view of the lower strain level of engineering stress–strain curves in LBE environment tested at both strain rates and at different temperatures.
Metals 14 00044 g009
Figure 10. Variation of strain hardening coefficient (n) with temperature at different strain rates in LBE environment.
Metals 14 00044 g010
Figure 11. Variation of ultimate tensile strength and total elongation with temperature at different strain rates for tests in LBE environment.
Metals 14 00044 g011
Figure 12. Top view of samples tested in LBE for the 5 × 10 5 s 1 strain rate. (a) Temperature: 200 °C; (b) temperature: 250 °C; (c) temperature: 300 °C; (d) temperature: 350 °C; (e) temperature: 400 °C; (f) temperature: 450 °C.
Metals 14 00044 g012
Figure 13. Top view of samples tested in LBE for the 5 × 10 6 s 1 strain rate. (a) Temperature: 200 °C (top view of quasi-cleavage); (b) temperature: 250 °C; (c) temperature: 300 °C; (d) temperature: 350 °C (side view of quasi-cleavage); (e) temperature: 400 °C; (f) temperature: 450 °C.
Metals 14 00044 g013
Figure 14. Variation of the quasi-cleavage area and total elongation with temperature at different strain rates in the LBE environment.
Metals 14 00044 g014
Figure 15. Lateral view of samples tested in LBE at 5 × 10 5 s 1 strain rate. Arrows on the images points to lateral cracks. (a) Temperature: 200 °C; (b) temperature: 250 °C; (c) temperature: 300 °C; (d) temperature: 350 °C; (e) temperature: 400 °C; (f) temperature: 450 °C.
Metals 14 00044 g015
Figure 16. Lateral view of samples tested in LBE at 5 × 10 6 s 1 strain rate. Arrows on the images indicate lateral cracks. (a) Temperature: 200 °C; (b) temperature: 250 °C; (c) temperature: 300 °C; (d) temperature: 350 °C; (e) temperature: 400 °C; (f) temperature: 450 °C.
Metals 14 00044 g016
Figure 17. Variation of the quasi-cleavage area and TEL ratio with the temperature at different strain rates in LBE environment.
Metals 14 00044 g017
Table 1. Chemical composition of grade T91 alloy studied in this work.
CPCrMoMnSiVNiNbCuNFe
0.1080.0188.730.8800.3730.2030.1910.1270.0830.0650.046bal.
Table 2. Summary of the testing parameters for the different tests.
(1)(2)(3)(4)
200 5 × 10 5  s 1 13
250 5 × 10 5  s 1 12
300 5 × 10 5  s 1 14
350 5 × 10 5  s 1 63
400 5 × 10 5  s 1 12
450 5 × 10 5  s 1 12
200 5 × 10 6  s 1 21
250 5 × 10 6  s 1 12
300 5 × 10 6  s 1 13
350 5 × 10 6  s 1 12
400 5 × 10 6  s 1 12
450 5 × 10 6  s 1 23
(1) Test temperature (°C). (2) Strain rate (∖s). (3) Number of samples tested in reference condition. (4) Number of samples tested in LBE.
Disclaimer/Publisher’s Note: The statements, opinions and data contained in all publications are solely those of the individual author(s) and contributor(s) and not of MDPI and/or the editor(s). MDPI and/or the editor(s) disclaim responsibility for any injury to people or property resulting from any ideas, methods, instructions or products referred to in the content.

