Article

The Phase Diagram of a CaO-Al2O3-VOx Slag System under Argon Atmosphere at 1500 °C

1
School of Metallurgy, Northeastern University, Shenyang 110819, China
2
Key Laboratory for Ecological Metallurgy of Multimetallic Ores (Ministry of Education), Northeastern University, Shenyang 110819, China
*
Authors to whom correspondence should be addressed.
Metals 2024, 14(1), 108; https://doi.org/10.3390/met14010108
Submission received: 15 December 2023 / Revised: 12 January 2024 / Accepted: 15 January 2024 / Published: 16 January 2024
(This article belongs to the Special Issue Advances in Slag Metallurgy)

Abstract

:
The thermodynamic properties of the CaO-Al2O3-VOx slag system are of great significance to the direct alloying of vanadium in the smelting process of vanadium steel. In this paper, the phase equilibrium relationship of the CaO-Al2O3-VOx system under argon atmosphere at 1500 °C was studied with a high-temperature phase equilibrium experiment. Combined with SEM-EDS, XRD, and XPS, the types and compositions of each phase of the equilibrium slag samples and the content of different valence states of the vanadium element were determined. The result shows that under argon atmosphere (p(O2) = 10−3 atm) at 1500 °C, the CaO-Al2O3-VOx slag system contains four three-phase regions, seven two-phase regions, and a single-phase region (glass phase). The phase equilibrium results were plotted in a CaO-Al2O3-V2O5-VO2 spatial phase diagram, and the phase equilibrium results were projected on the CaO-Al2O3-V2O5 and CaO-Al2O3-VO2 pseudo-ternary phase diagrams, respectively. In the end, the rationality of projecting the phase equilibrium results to the pseudo-ternary phase diagram was quantitatively evaluated.

1. Introduction

Alloy steels are indispensable basic materials; among them, vanadium alloy steel benefits from its excellent high thermal resistance and corrosion resistance, and it is widely used in nuclear energy, petrochemicals, and other fields [1,2]. At present, vanadium steel is mostly smelted by adding ferrovanadium to an electric arc furnace or converter process [3]. However, the production process of ferrovanadium has some problems, such as high energy consumption and a low recovery rate of vanadium [4,5,6,7]. Against this background, direct alloying of vanadium with vanadium slag has become an important research direction. The direct alloying process of vanadium refers to a reduction in vanadium in vanadium-containing oxides into molten steel using a reducing agent during steel metallurgy [8]. Up to now, vanadium oxide raw materials have been mostly V2O5 [9], but there are still some unsolved problems, such as V2O5 volatilization, and the addition of V2O5 leads to the compositional fluctuation in molten steel, which results in unstable vanadium yield, so its industrial application has not been realized [10,11,12,13,14,15].
Research shows that the addition of CaO as a slag component can effectively inhibit the volatilization of V2O5 and increase the yield of vanadium [9]. Considering the current clean steel smelting background, the CaO-Al2O3-based slag system is more applicable than the CaO-SiO2-based slag system; therefore, the CaO-Al2O3-VOx slag system is a potential-based slag system for the direct alloying of vanadium. In addition, in view of the slag–metal interfacial reaction between vanadium-containing molten steel and the metallurgical slag system, it is also important to study the properties of the CaO-Al2O3-VOx slag system for the optimization of the smelting process of vanadium steel.
A phase diagram is important to the design of the metallurgical slag system and subsequent thermodynamic assessment [16]. At present, the phase diagrams of the sub-binary system of the CaO-Al2O3-V2O5 slag system, including the CaO-Al2O3 [17,18,19,20], Al2O3-V2O5 [21,22,23,24], and CaO-V2O5 [25,26,27,28,29] systems under air atmosphere at 1500 °C and 1600 °C, have been determined. In addition, Arnulf Muan [30] also studied the types of solid phases in the CaO-Al2O3-V2O3 system and their preparation methods under temperature conditions of 700 °C to 1500 °C and oxygen partial pressures ranging from 10−10 to 10−6 atm. However, the phase diagrams of vanadium-containing oxides under a reductive atmosphere have not been reported. Considering that the alloying process for vanadium inevitably involves the redox process of vanadium, the phase diagram information of the CaO-Al2O3-VOx system under a reducing atmosphere is particularly important for process guidance and process optimization, but so far, no relevant reports have been reported.
In this paper, the phase equilibrium relationship of the CaO-Al2O3-VOx slag system under argon atmosphere (PO2 = 10−3 atm) at 1500 °C was determined with a high-temperature phase equilibrium experiment. The component, type, and oxidation states of vanadium in each equilibrium phase were determined with a scanning electron microscope-energy dispersive spectrometer (SEM-EDS, Phenom Pro X (Phenom-world, Eindhoven, Holland), 15 KV, SDD, CeB6), X-ray Diffraction (XRD, Ultima IV ((Rigaku Corporation, Tokyo, Japan), 1.6 KW, Cu Kα), and X-ray photoelectron spectroscopy (XPS, Thermo Kalpha, Al Kα, 100~4000 eV). The research results of this paper not only provide theoretical guidance for the composition design of a slag system and technology optimization in the direct alloying process of vanadium but are also helpful for other potential application fields of the slag system, such as the removal of nitrogen from molten steel with molten slag, the pyrometallurgy of vanadium from vanadium titano-magnetite, and the establishment of Ca-Al-V-O thermodynamic database [31,32]. For the removal of nitrogen from molten steel with molten slag, the vacuum method commonly used for steel degassing cannot meet the requirements for nitrogen content in clean steel. The CaO-Al2O3-VOx slag system, which is a new type of basic slag system, can form a stable product (VN) with nitrogen, which shows potential for nitrogen removal. Hence, the phase diagram information of this slag system can directly assist in slag system design and process optimization. For the pyrometallurgy of vanadium from vanadium titano-magnetite, the CaO-Al2O3-VOx slag system is one of the basic slag systems formed in the multi-component slag systems, and its phase diagram information can also guide further research on the properties of multi-component slag systems and help to optimize the process. For the establishment of a Ca-Al-V-O thermodynamic database, the phase diagram information of the slag system can provide a data foundation and reference for thermodynamic optimization.

2. Experimental Procedure

The experimental process consists of three steps: sample preparation, a high-temperature phase equilibrium experiment, and equilibrium slag sample detection.
Sample preparation. To ensure the accuracy of the experimental results, 4N (99.99%) reagents CaO, Al2O3, and V2O5 were selected to prepare the slag samples, which were sourced from Sinopharm Co., Ltd. (Beijing, China) [33]. Firstly, CaO and Al2O3 were calcined at 1000 °C for 4 h to evaporate water and impurities. Due to the high-temperature instability of V2O5, it was calcined at 600 °C. Then, a 1.5 g slag sample was weighed using an electronic balance with an accuracy of 0.1 mg. The sample was fully mixed and put into a platinum crucible to compact so that the slag material was fully contacted. To prevent incomplete reactions due to insufficient mixing, it was necessary to thoroughly grind the mixed residue for 30 min. Table 1 lists the initial compositions of the slag system, and Figure 1 shows the Ca-Al-V element ratio of the initial compositions.
High-temperature phase equilibrium experiment. The platinum crucible containing the slag sample was put into a MoSi2 furnace, and the slag was heated to 1500 °C and kept at equilibrium for 24 h under argon atmosphere. Based on the results of our preliminary experiments, we found that there is a significant difference between the equilibrium experiment results for 12 h of insulation and 24 h of insulation. However, the equilibrium experiment results for 20 h of insulation and 24 h of insulation are basically consistent. Therefore, to ensure that the slag samples reached an equilibrium state, we chose an insulation duration of 24 h. In addition, according to the literature on high-temperature equilibrium experiments conducted by various scholars, a 24-hour insulation time can enable the system to reach an equilibrium state [34,35]. The argon flow rate was 500 mL/min, and the B-type thermocouple was used for temperature measurement and control, with a temperature control accuracy within ±2 °C. Then, the slag sample was quenched for 3 s with an ice–water mixture and quickly dried. The oxygen partial pressure in the furnace under argon atmosphere was measured with a ZrO2 oxygen sensor, and the result was PO2 = 10−3 atm.
Equilibrium slag sample detection. The quenching slag was inlaid, polished, and analyzed with SEM-EDS (detection error: 1%) to obtain the composition of each equilibrium phase. The typical slag samples were tested with XRD to identify the type of equilibrium phase. The determination of the valence state of vanadium in the glass phase was introduced and discussed as follows. Previous research has found that, in the study of the high-temperature phase equilibrium of slag systems containing variable valence components, the valence states of variable valence components in the glass phase are usually neglected, and the glass phase composition of an equilibrium slag sample will be projected to a certain valence state plane with approximate projection, such as the CaO-Al2O3-V2O5 and CaO-Al2O3-VO2 planes. The reliability of the projected phase diagram depends on the extent of approximation between the valence state of the components in the actual slag system and the system that will be projected. In order to truly represent the phase equilibrium results under the conditions studied in this paper and evaluate the reliability of the approximate projection, an XPS detection method was carried out on each equilibrium slag sample to determine the relative content of vanadium with different valence states in the glass phase.
In photoelectron spectroscopy, V2p is the main peak of the vanadium element, with spin–orbit splitting peaks V2p3/2 and V2p1/2, which is the basis for the qualitative analysis of the vanadium element. Table 2 summarizes the relevant data of the V2p peak, in which the binding energy and FWHM are reference values, which is the basis of the XPS peak fitting of the vanadium element in this paper.

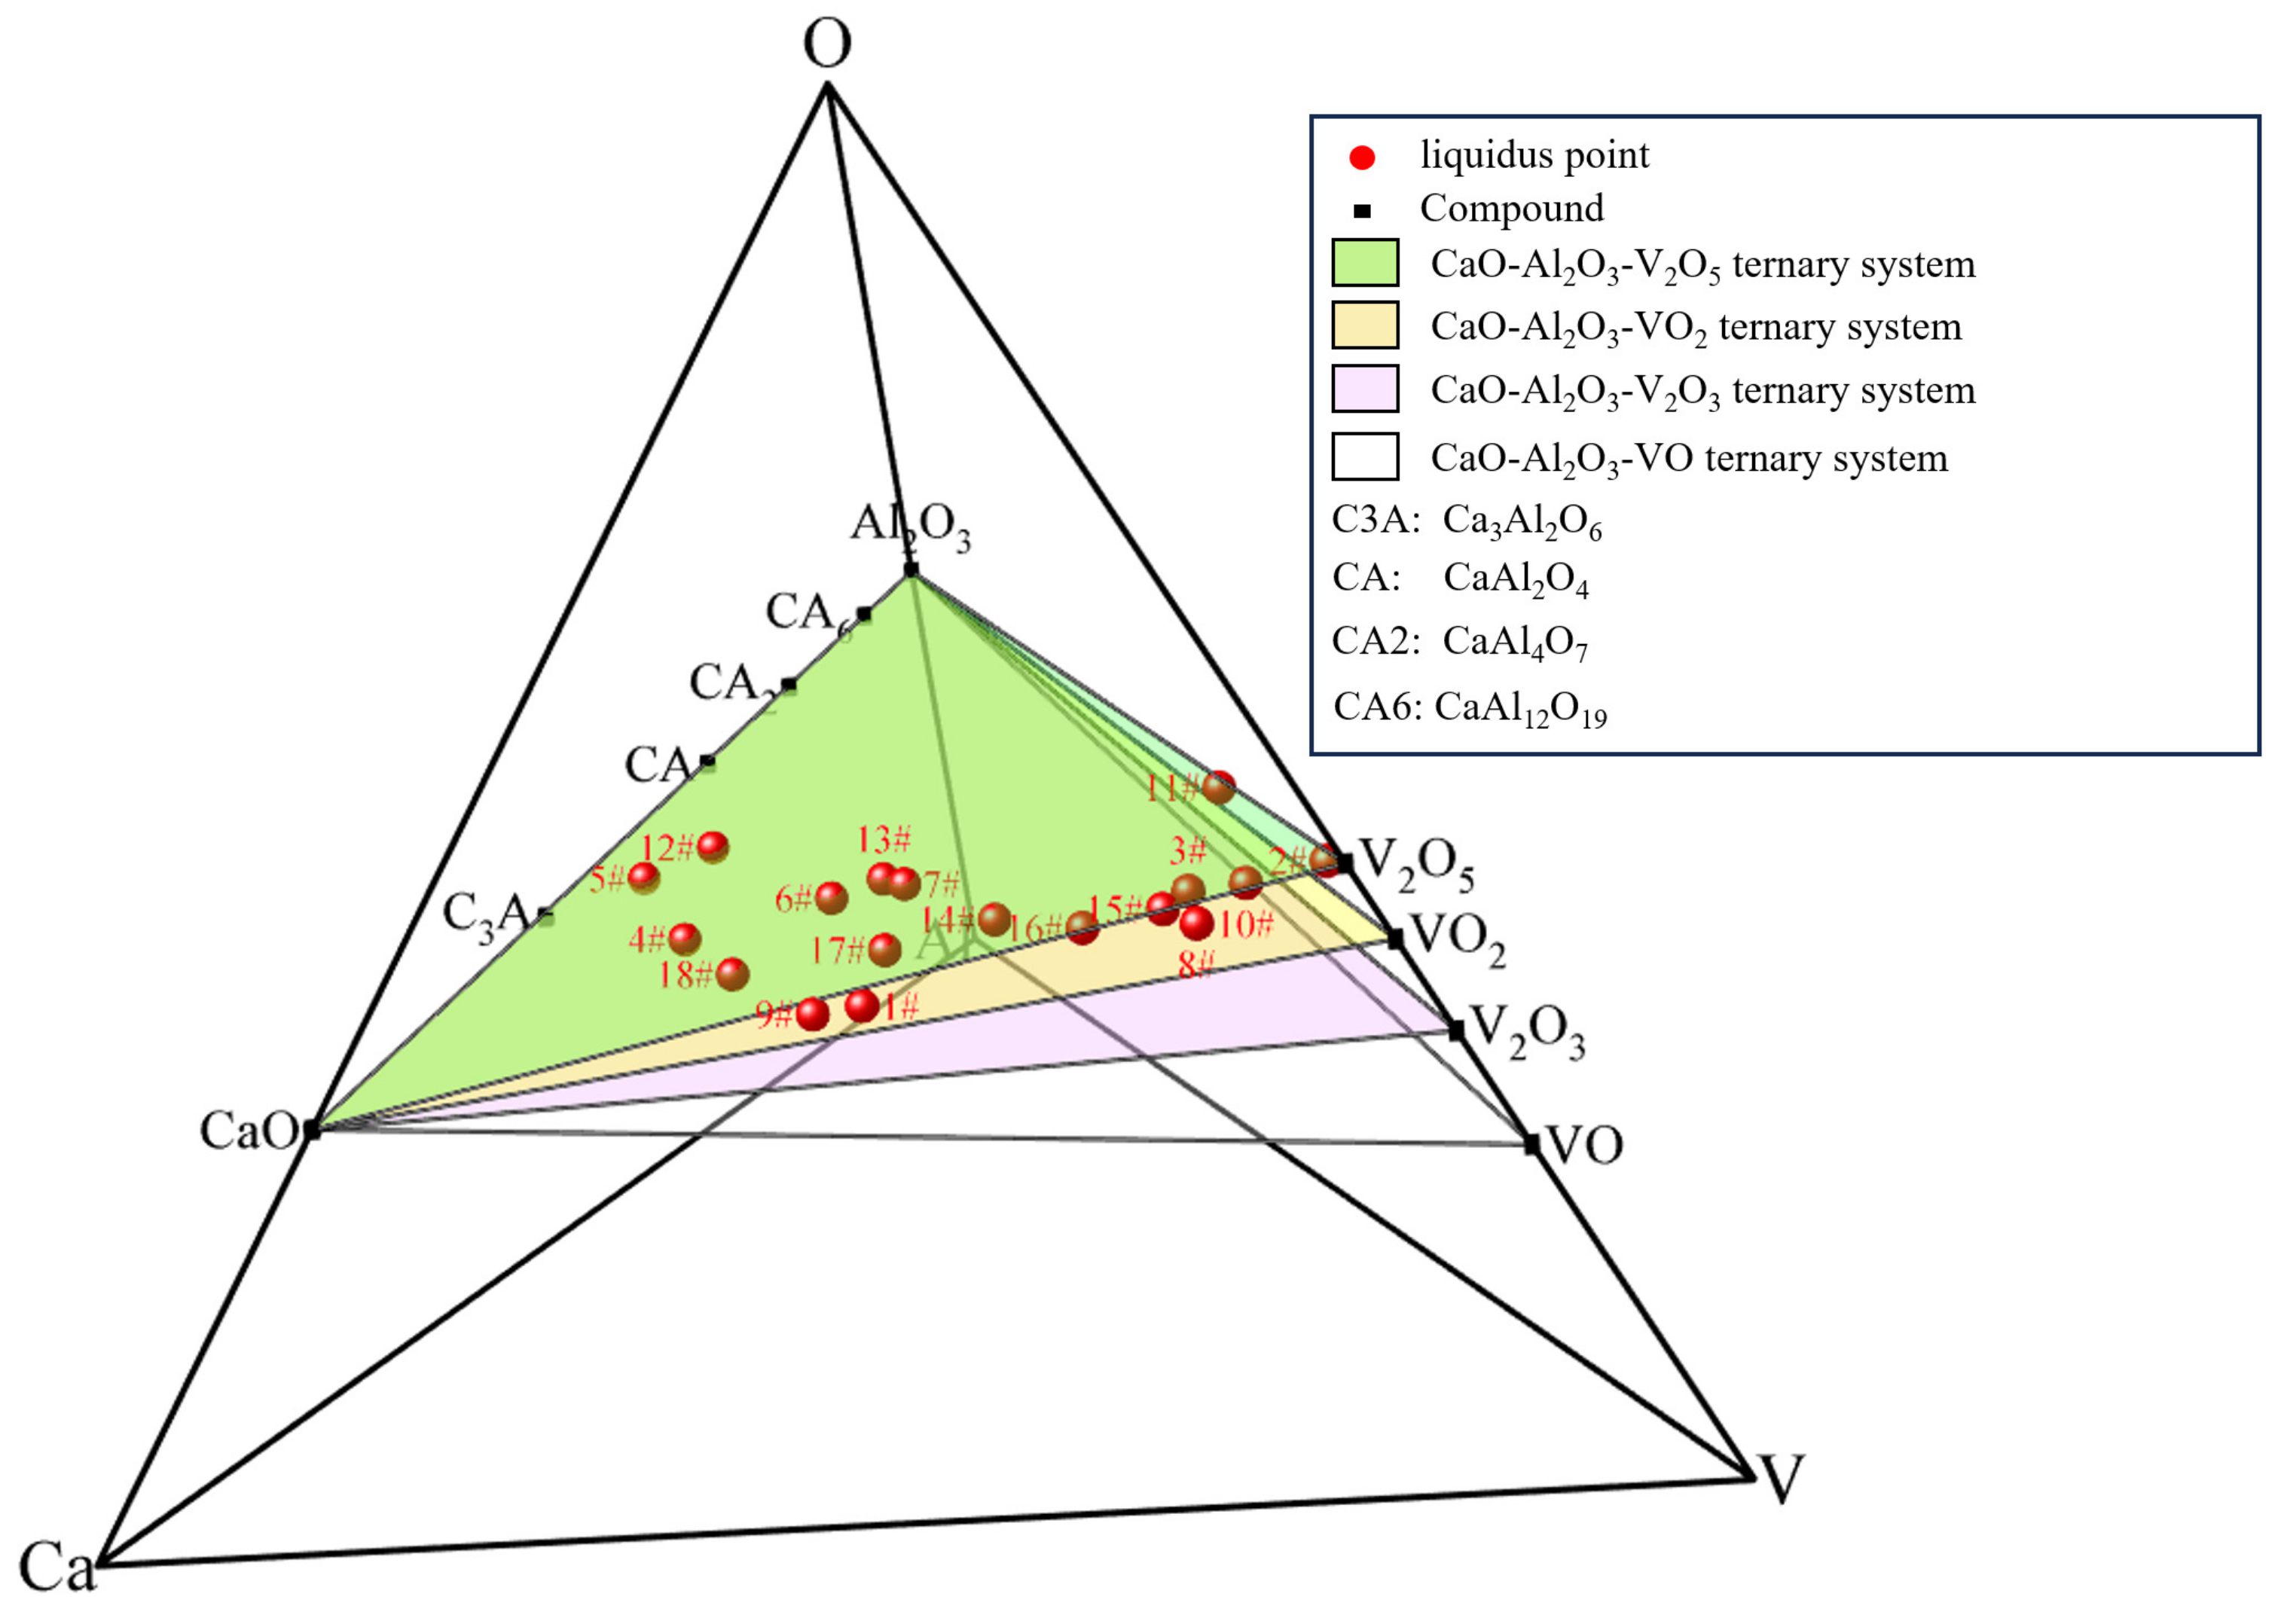
3. Phase Equilibria of the CaO-Al2O3-VOx System under Argon Atmosphere at 1500 °C

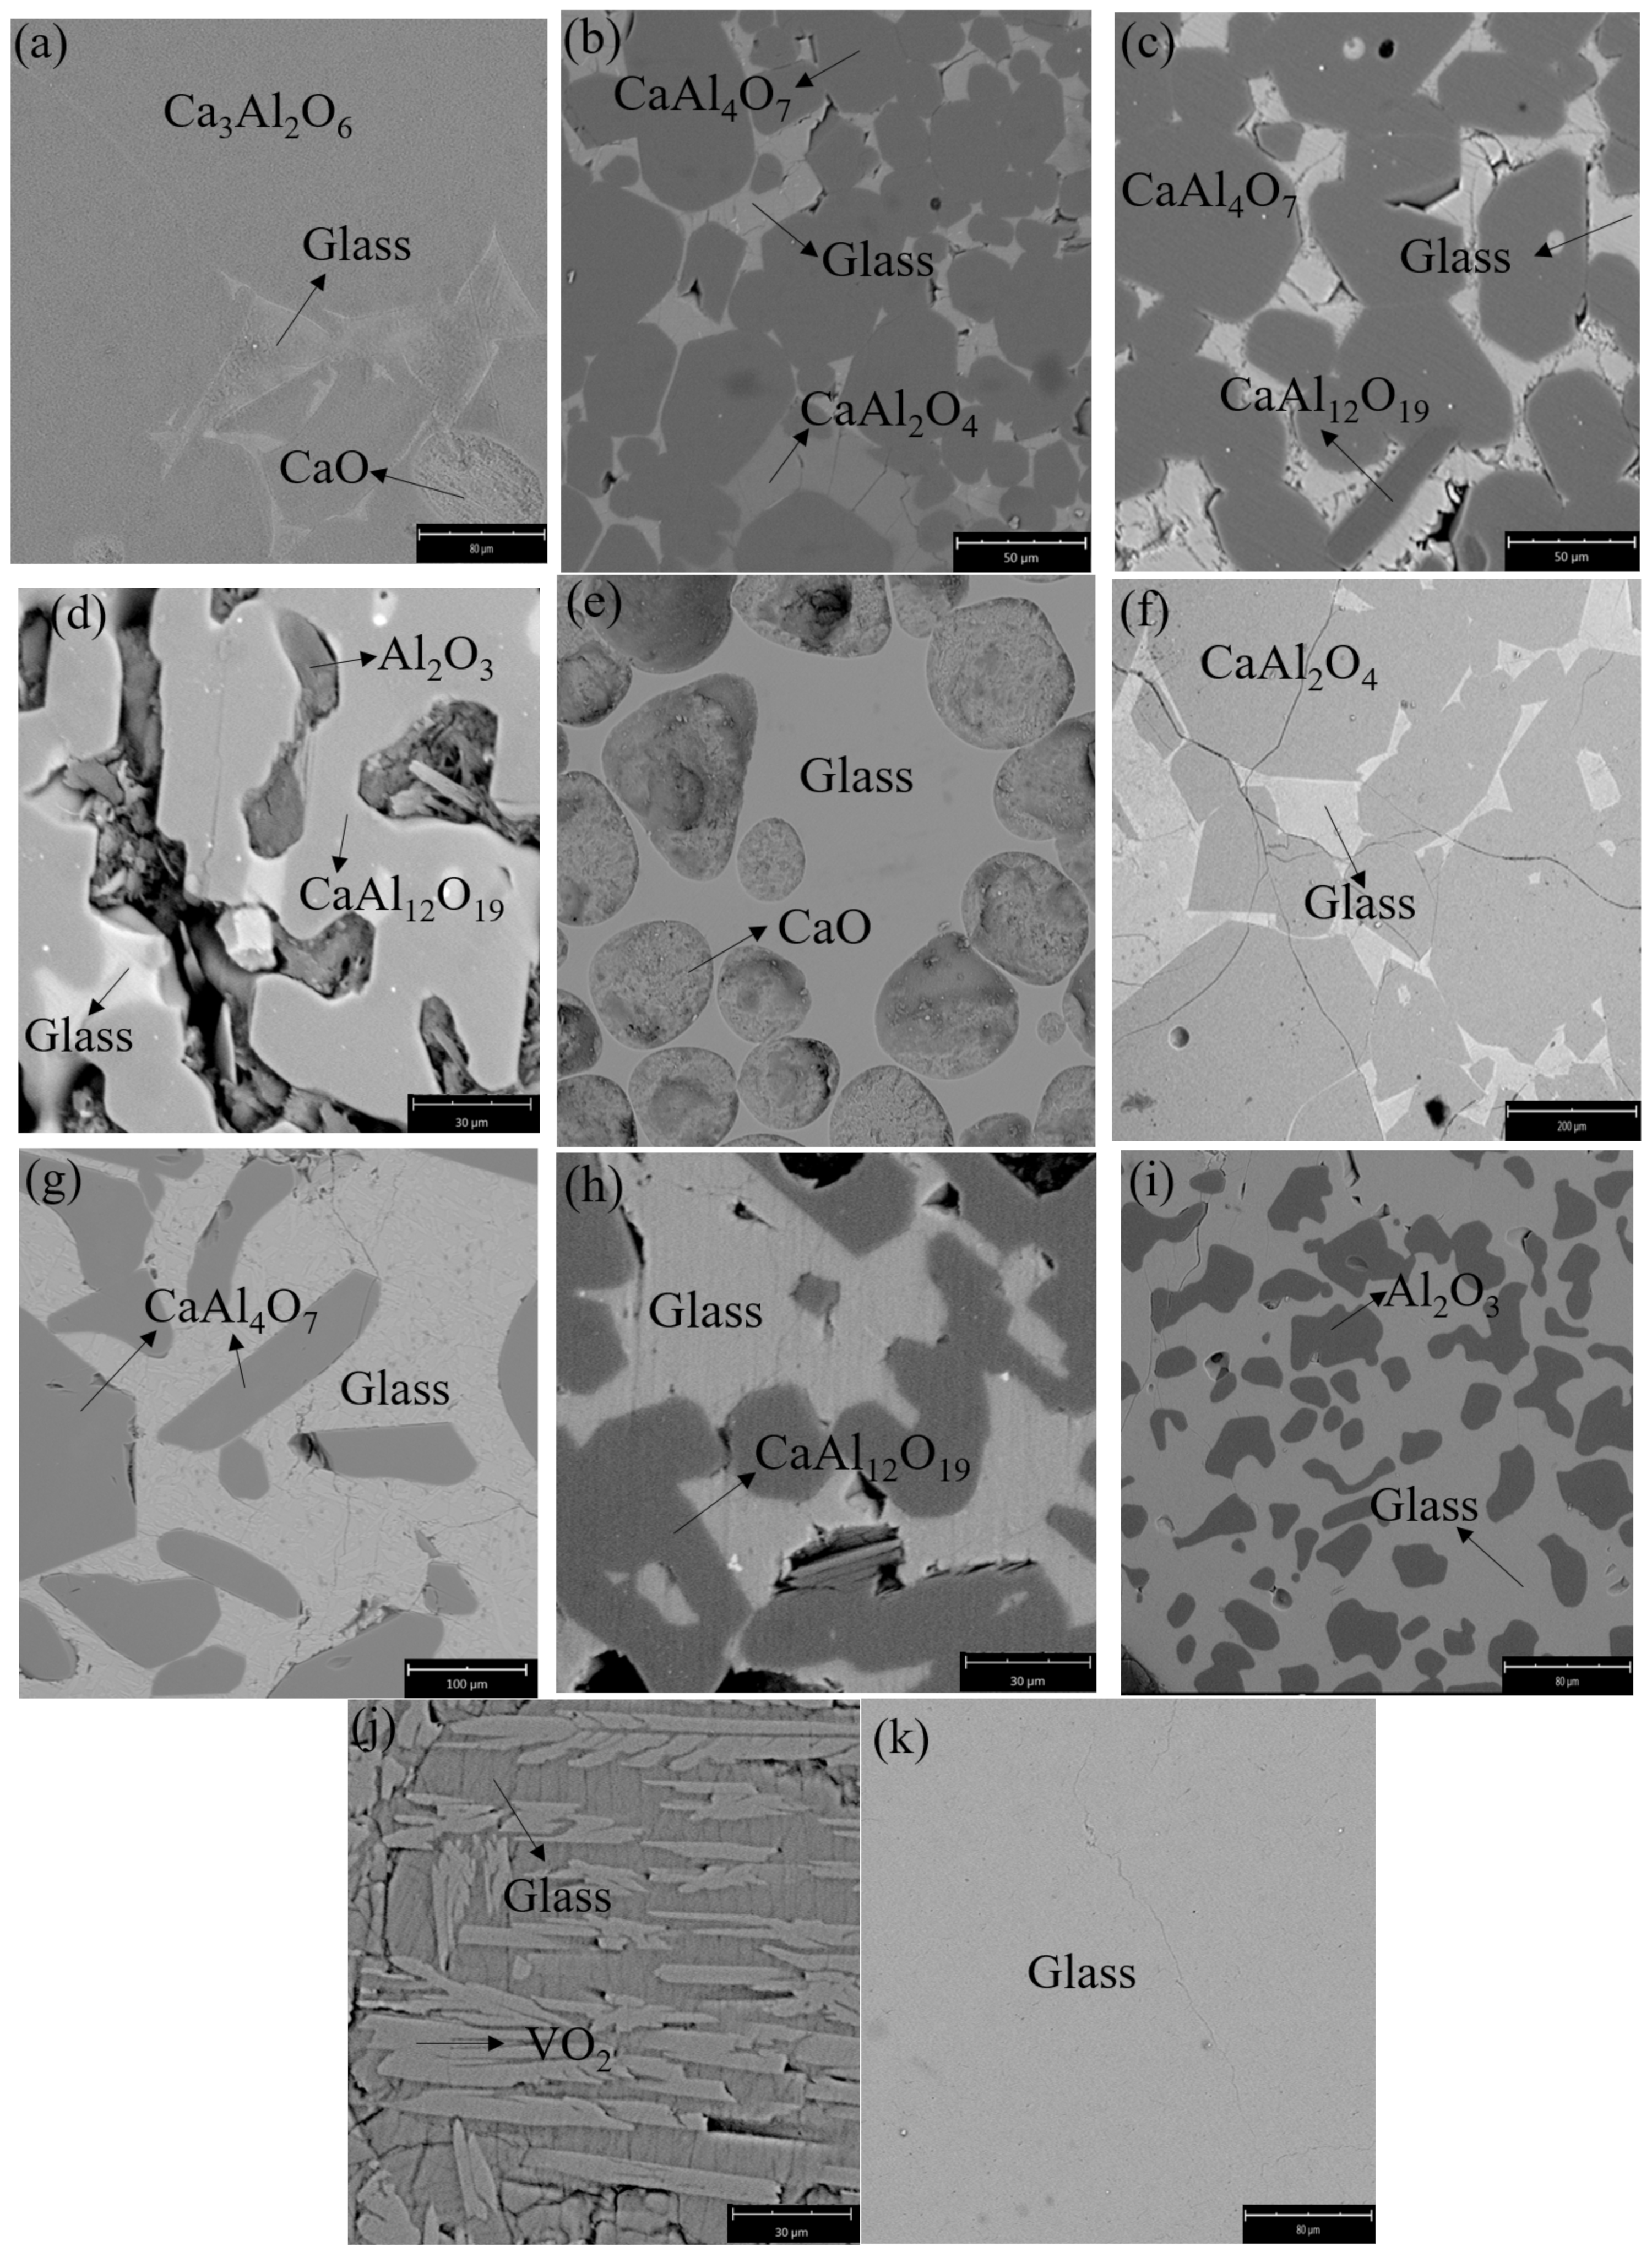
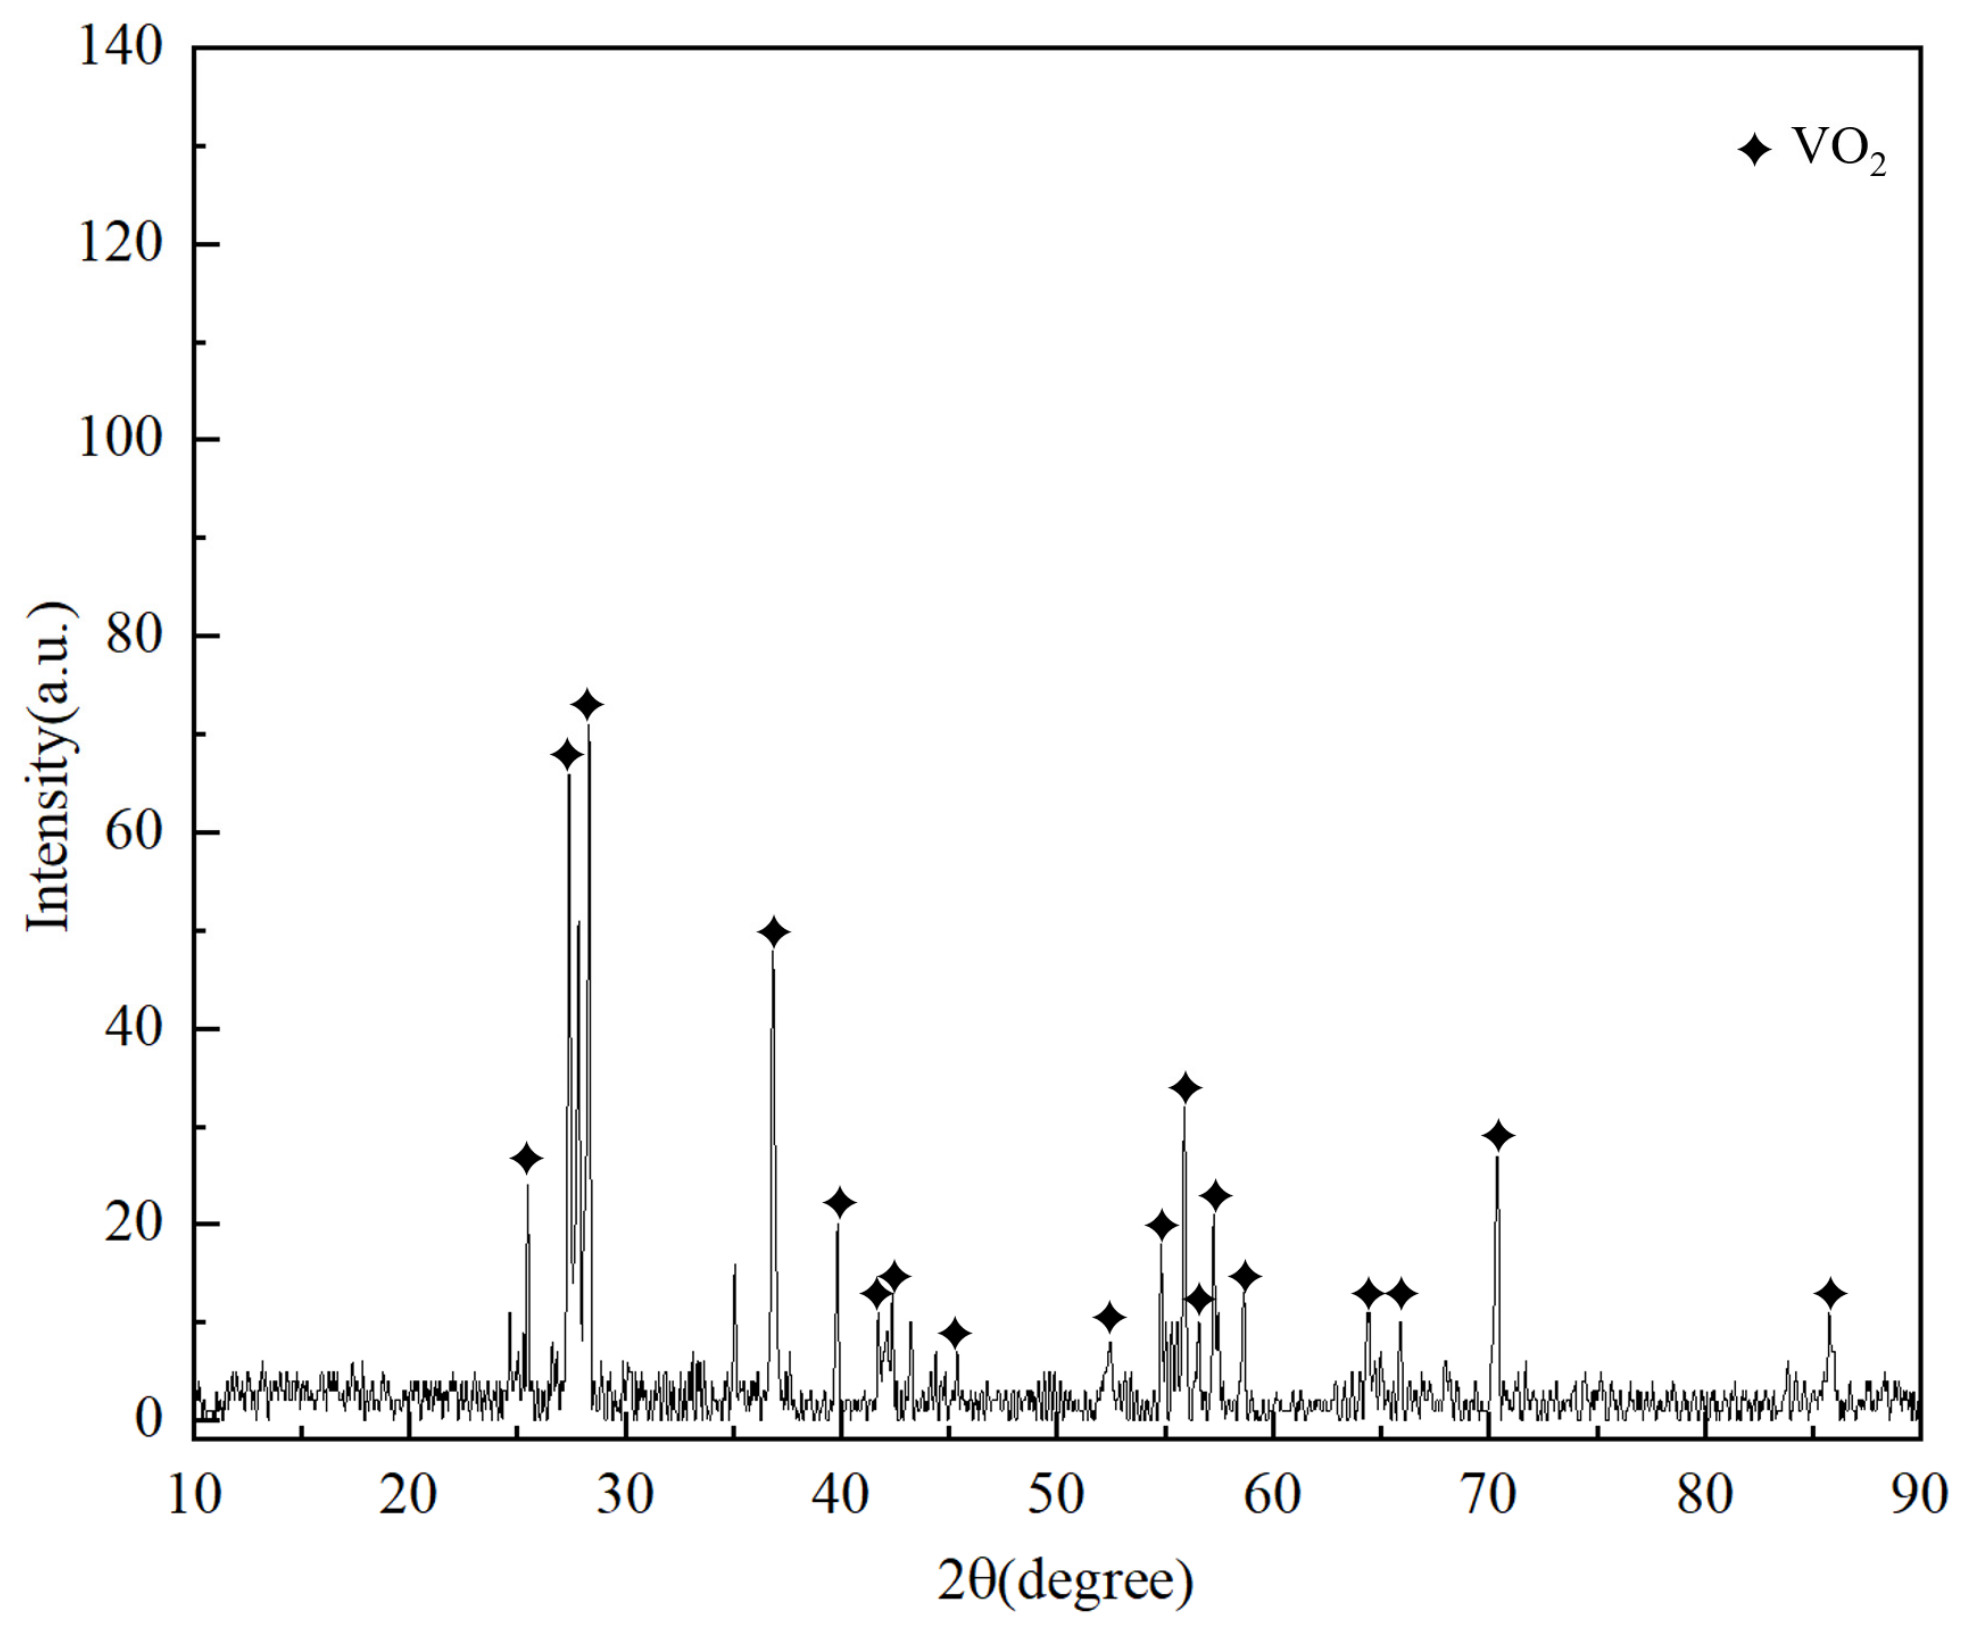
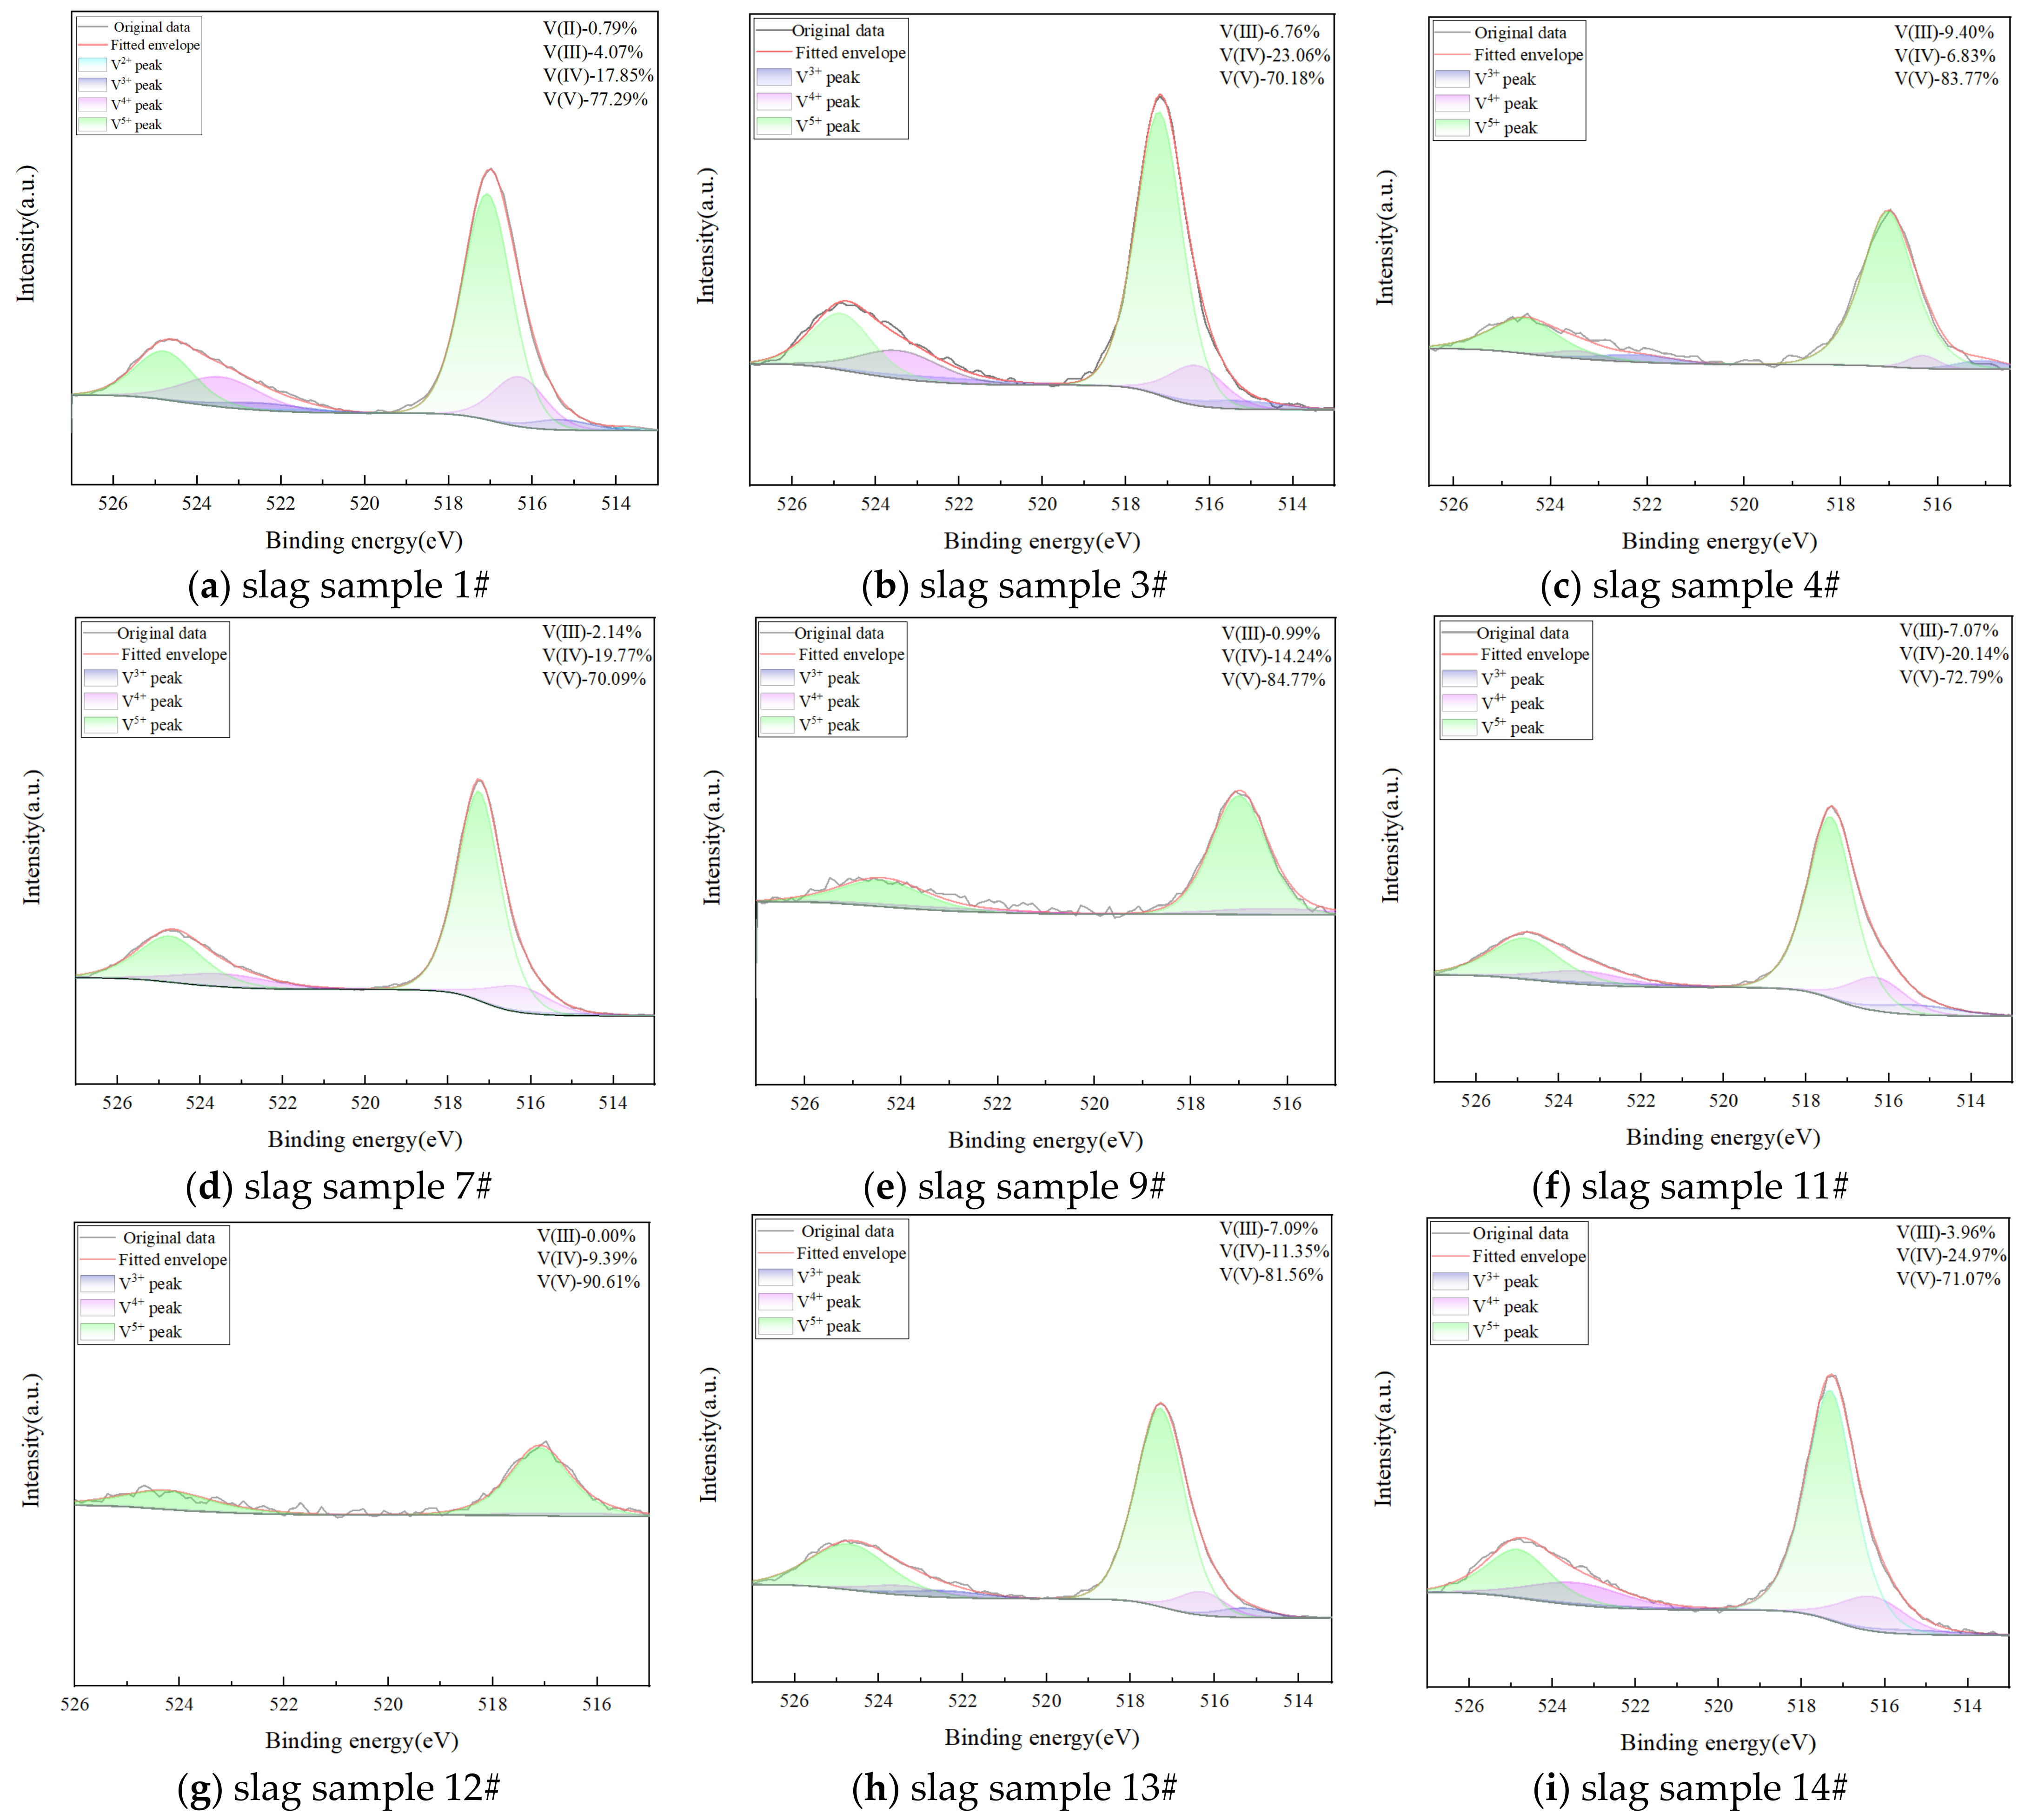
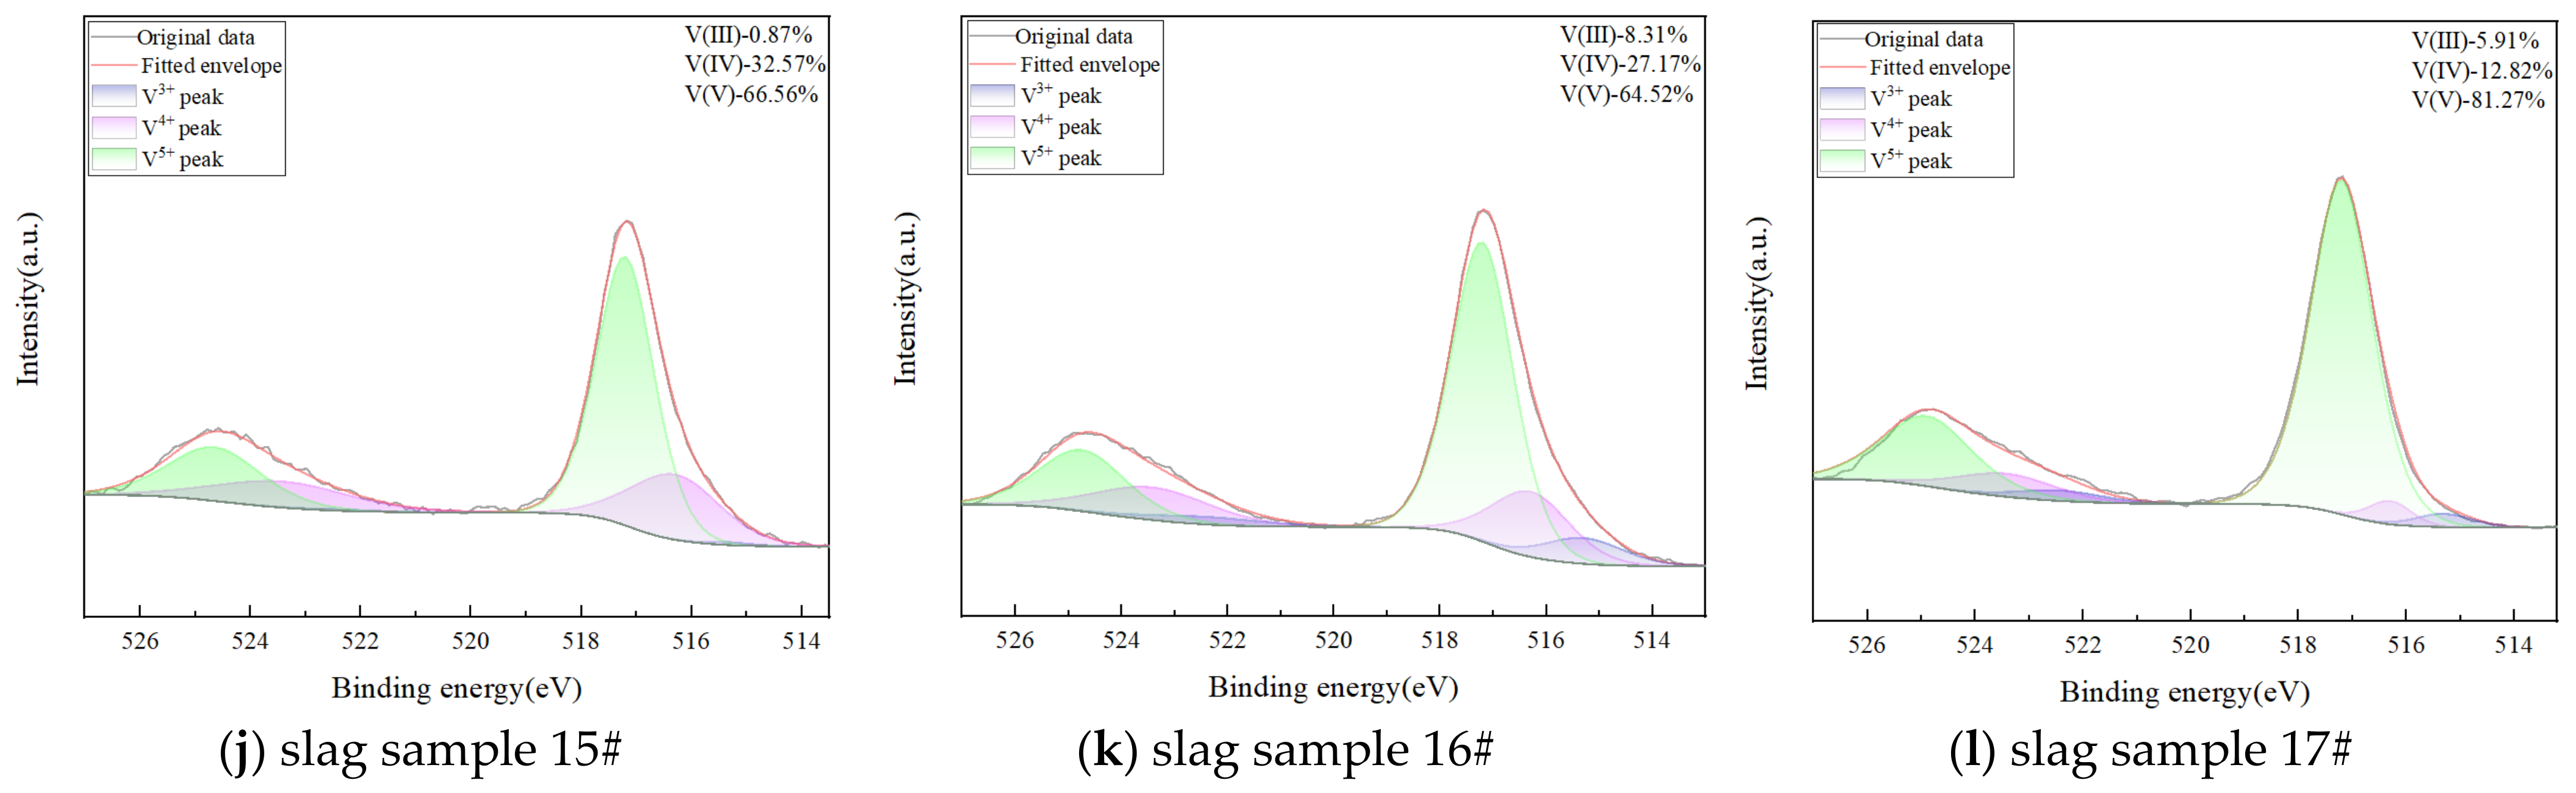
3.1. Experimental Results

Under the current experimental conditions, slag samples 1#–18# show a total of 11 kinds of phase equilibrium relations, and Table 3 summarizes the energy spectrum analysis results of the equilibrium phases in each slag sample. Since the energy spectrum analysis can only determine the relative content of different elements, it is powerless to determine the relative content of different valence states of the same element. Therefore, the constituent content of each phase in Table 3 is expressed in terms of the mass fraction of metallic elements. Figure 2 shows the specific SEM images. Slag sample 5# shows glass + CaO + Ca3Al2O6 three-phase coexistence (Figure 2a). Slag sample 6# shows the three-phase coexistence of glass + CaAl2O4 + CaAl4O7 (Figure 2b). Slag sample 13# shows the three-phase coexistence of glass + CaAl4O7 + CaAl12O19 (Figure 2c). Slag sample 14# shows glass + CaAl12O19 + Al2O3 three-phase coexistence (Figure 2d). Slag sample 4#, 9#, and 18# show the coexistence of glass + CaO (Figure 2e). Slag sample 12# shows glass + CaAl2O4 two-phase coexistence (Figure 2f). Slag sample 17# shows the coexistence of glass+ CaAl4O7 (Figure 2g). Slag sample 7# shows glass + CaAl12O19 two-phase coexistence (Figure 2h). Slag samples 3# and 16# show the coexistence of glass + Al2O3 (Figure 2i). Slag samples 2#, 8#, 10#, and 15# show glass + VO2 two-phase coexistence (Figure 2j). Slag sample 1# shows a single glass phase, as shown in Figure 2k. In addition, in order to figure out the phase of vanadium oxide in the form of precipitation under argon atmosphere, slag sample 10 # was detected with XRD, and the test result showed that the crystal structure of the precipitated solid phase was VO2, as shown in Figure 3.
Figure 4 shows the XPS energy spectrum of the vanadium element after the charge-correction treatment of each equilibrium slag sample. The relative contents of different valence vanadium in each equilibrium slag sample are listed in Table 4. The percentage content of VOx in the glass phase can be determined based on the data from Table 3 and Table 4, which are listed in Table 5. Taking the subsequent need to show the phase equilibrium relationship in the Ca-Al-V-O phase diagram into account, Table 5 also gives the O/V ratio of the glass phase after synthesizing various valence state contents. Figure 4a shows the result of the peak fitting of slag sample 1# using the characteristic peaks of +5, +4, +3, and +2 valence of vanadium. It can be seen that the content of V2+ is about 0.73%, which is lower than the detection accuracy of XPS, and it is too low to be considered. Therefore, the existence of V2+ in slag can be ignored under the current experimental condition. In addition, there are no obvious V2p peaks in the XPS test results for slag samples 2#, 5#, 6#, 8#, 10#, and 18#, so the peak fitting of vanadium cannot be carried out. The reason for the result could be that the content of the vanadium element in the slag sample is small, and the proportion of the CaO, Al2O3, or calcium aluminate solid phase precipitated in the slag sample is large, which will affect the signal acquisition of the vanadium element in the glass phase during the XPS detection process. In view of the fact that the ratio of each valence state of vanadium in the glass phase fluctuates a little under one oxygen partial pressure, to ensure the integrity of the characterization of the phase equilibrium relationship, this paper used the ratio average of each valence state of vanadium in the system to characterize the proportions of different valence states of vanadium in slag samples 2#, 5#, 6#, 8#, 10#, and 18#.

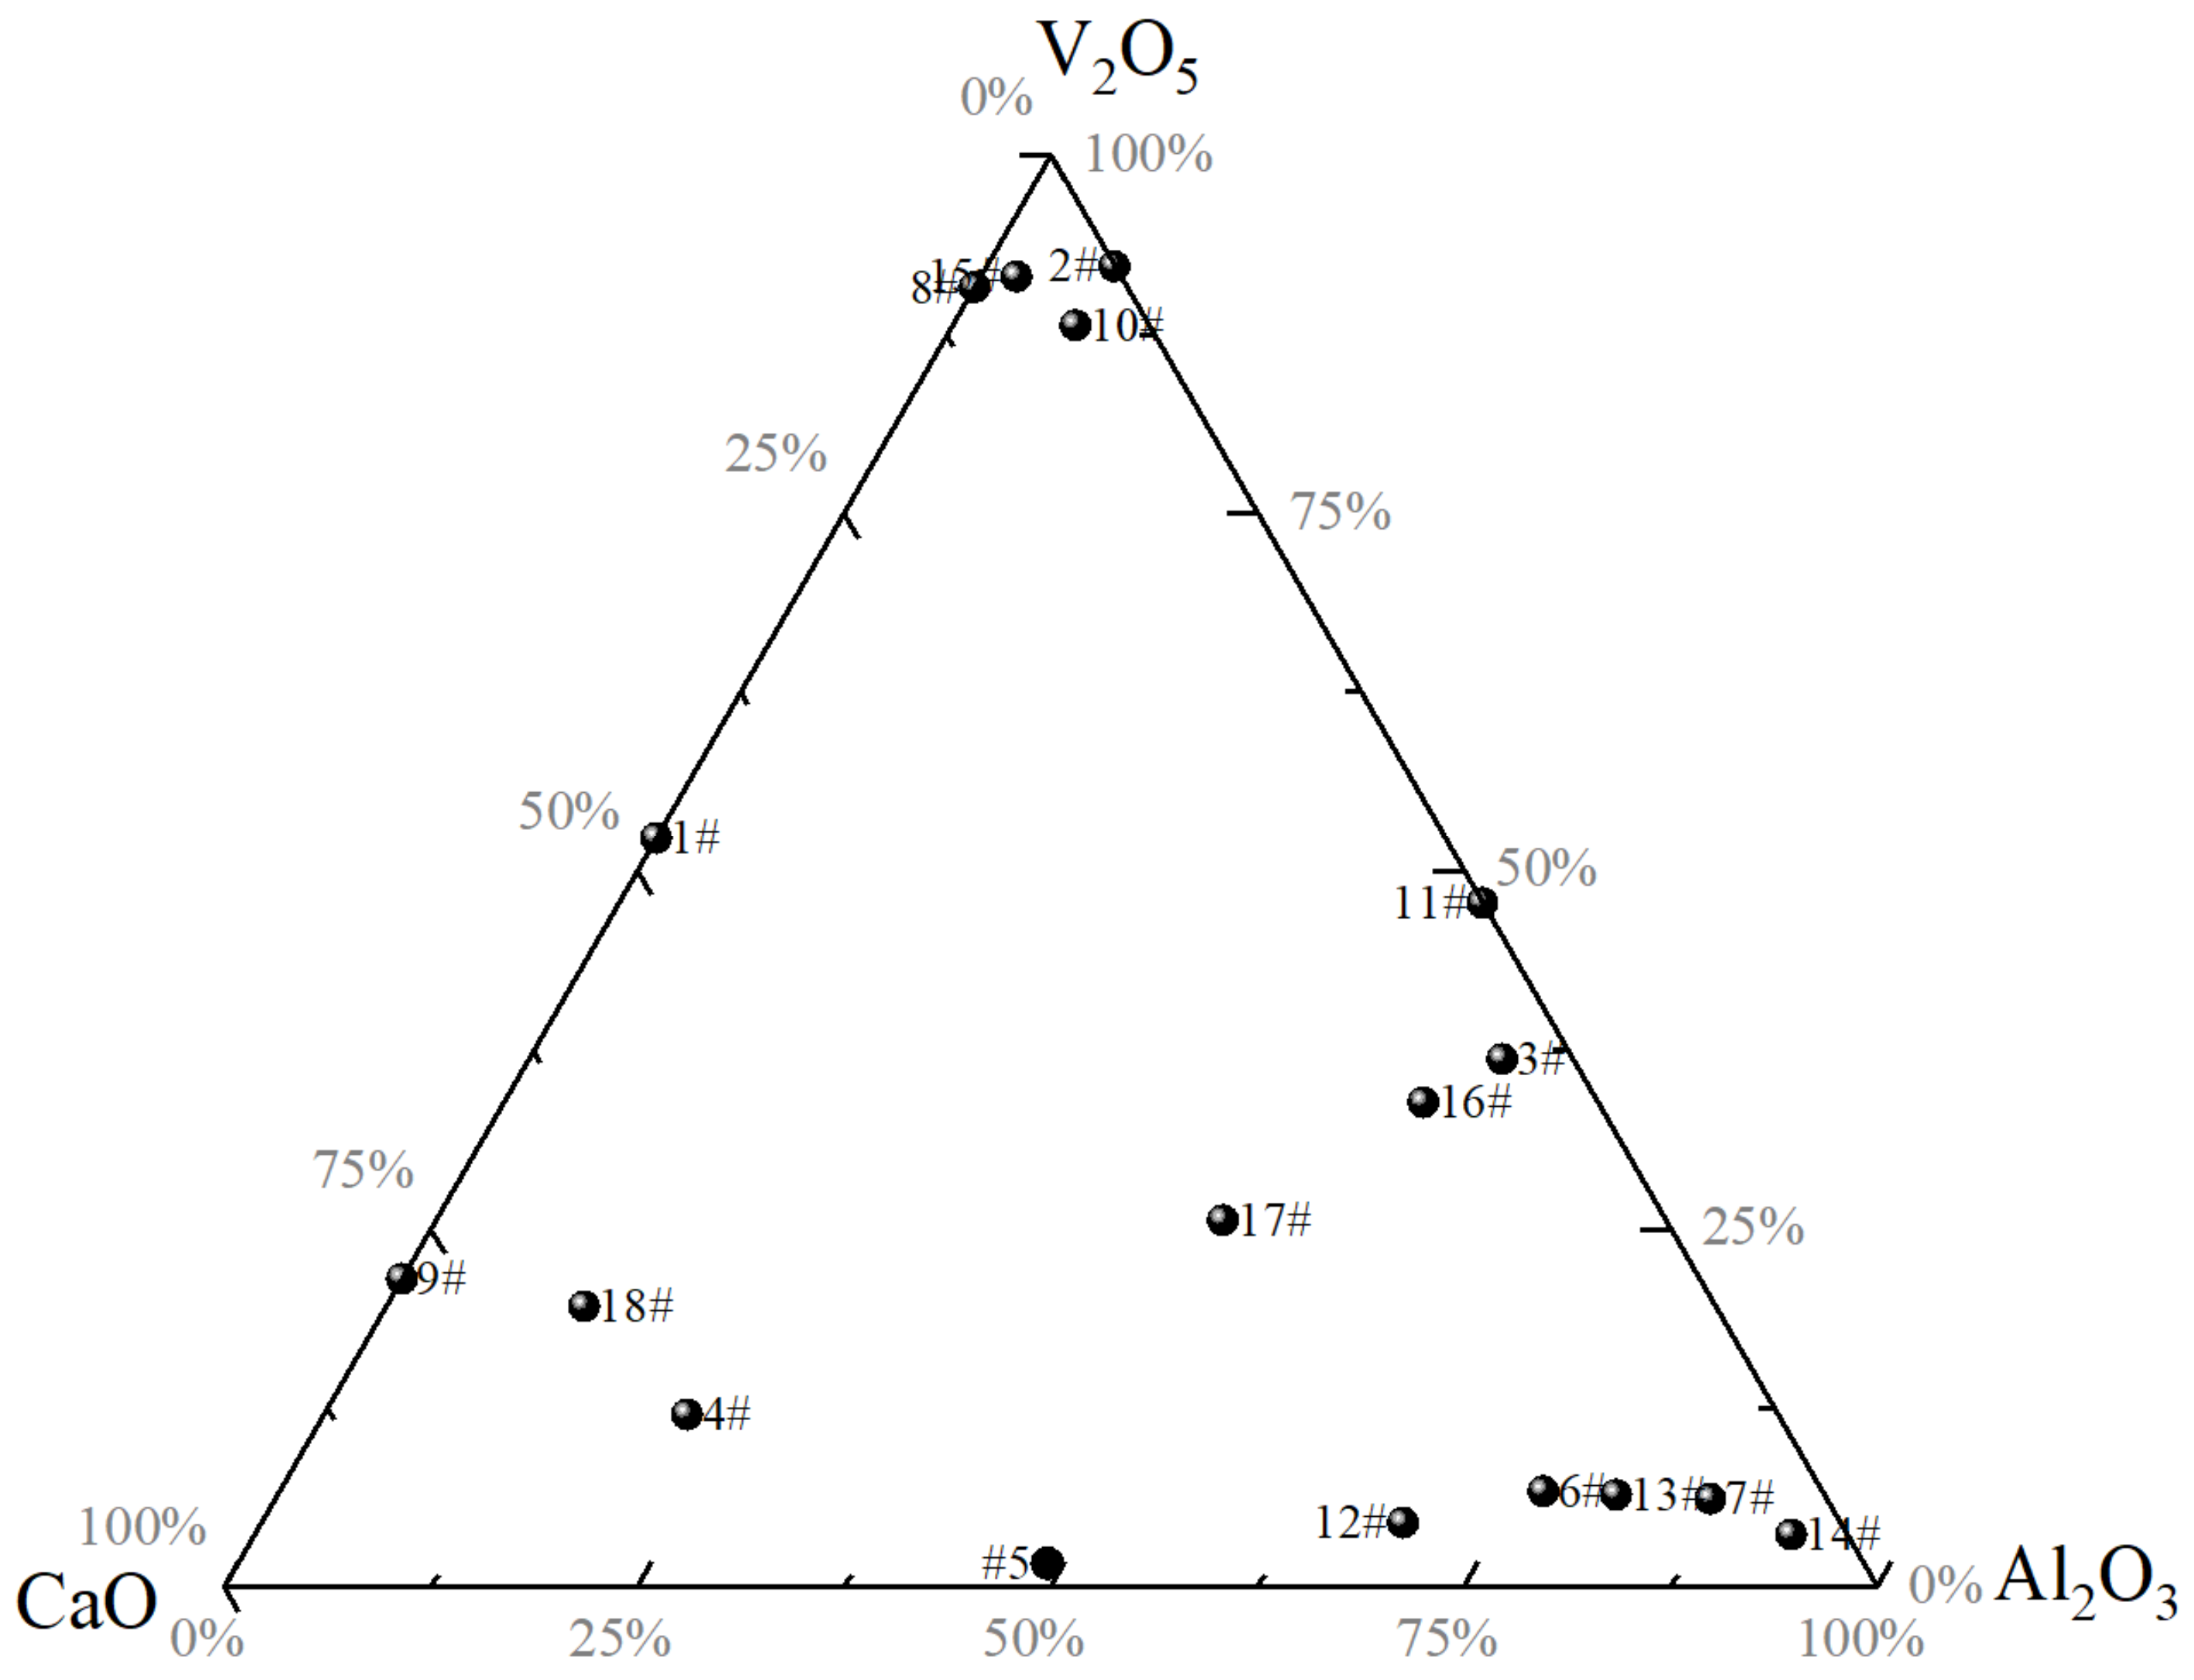
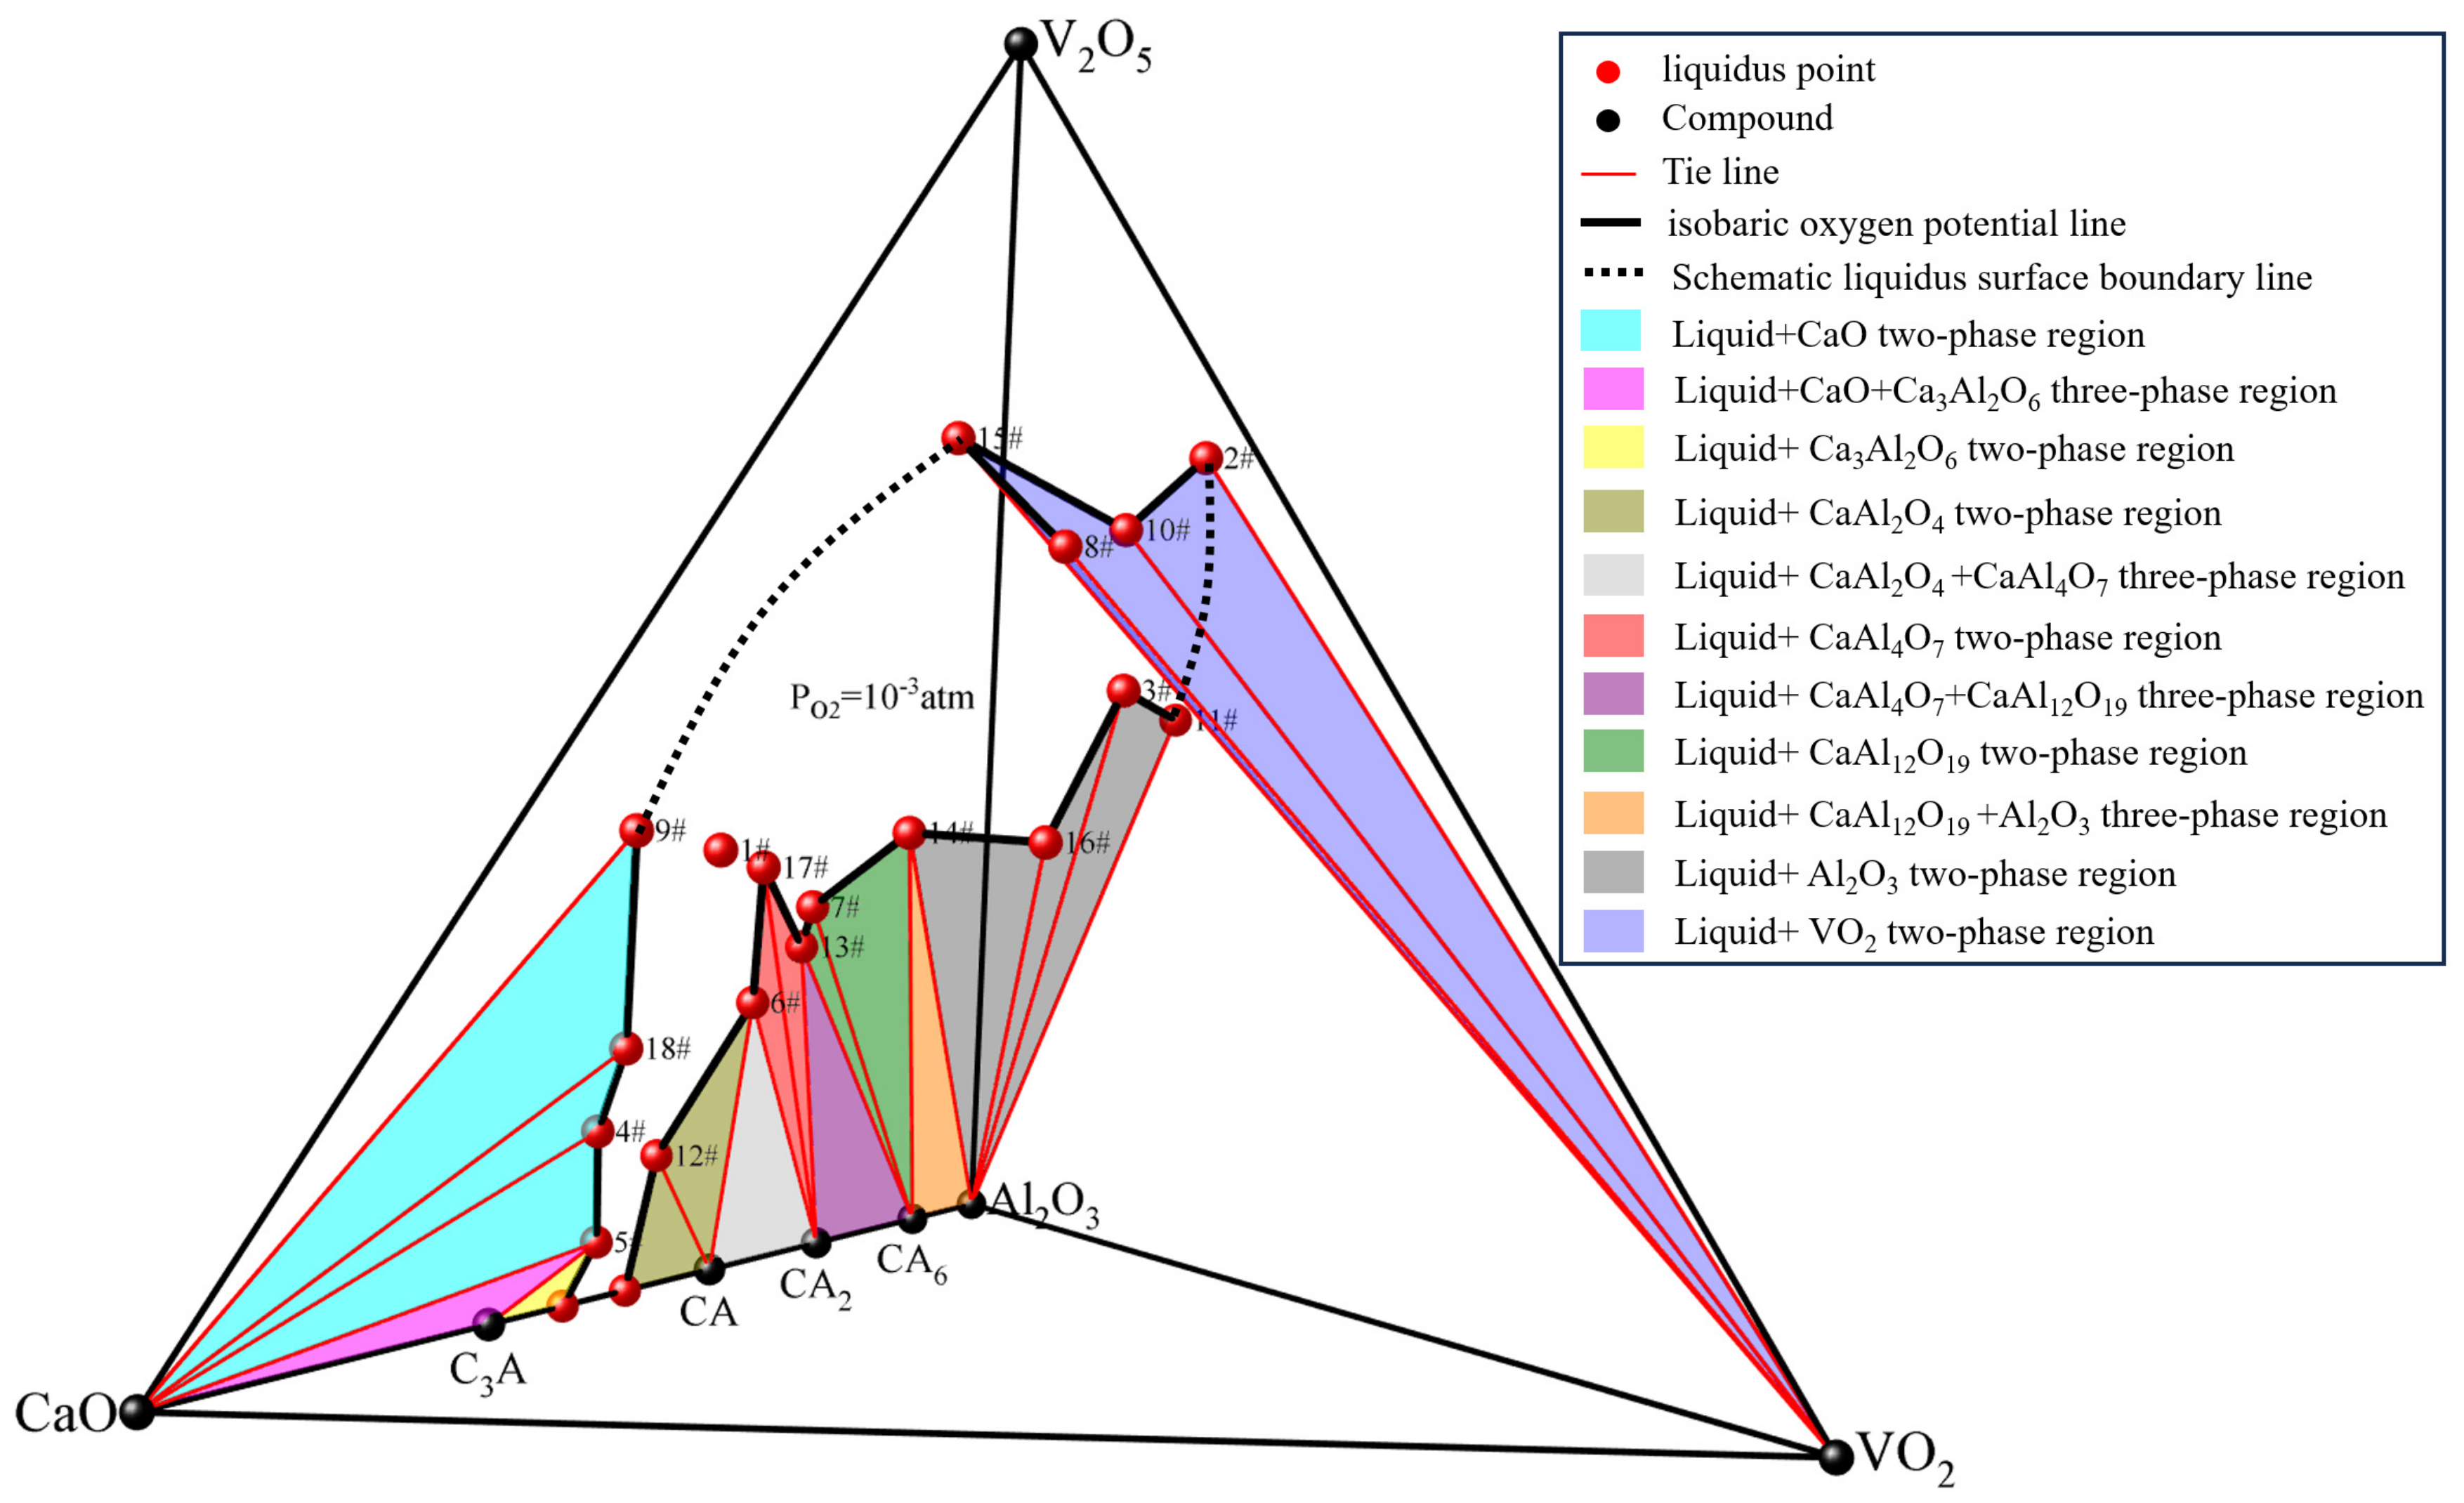
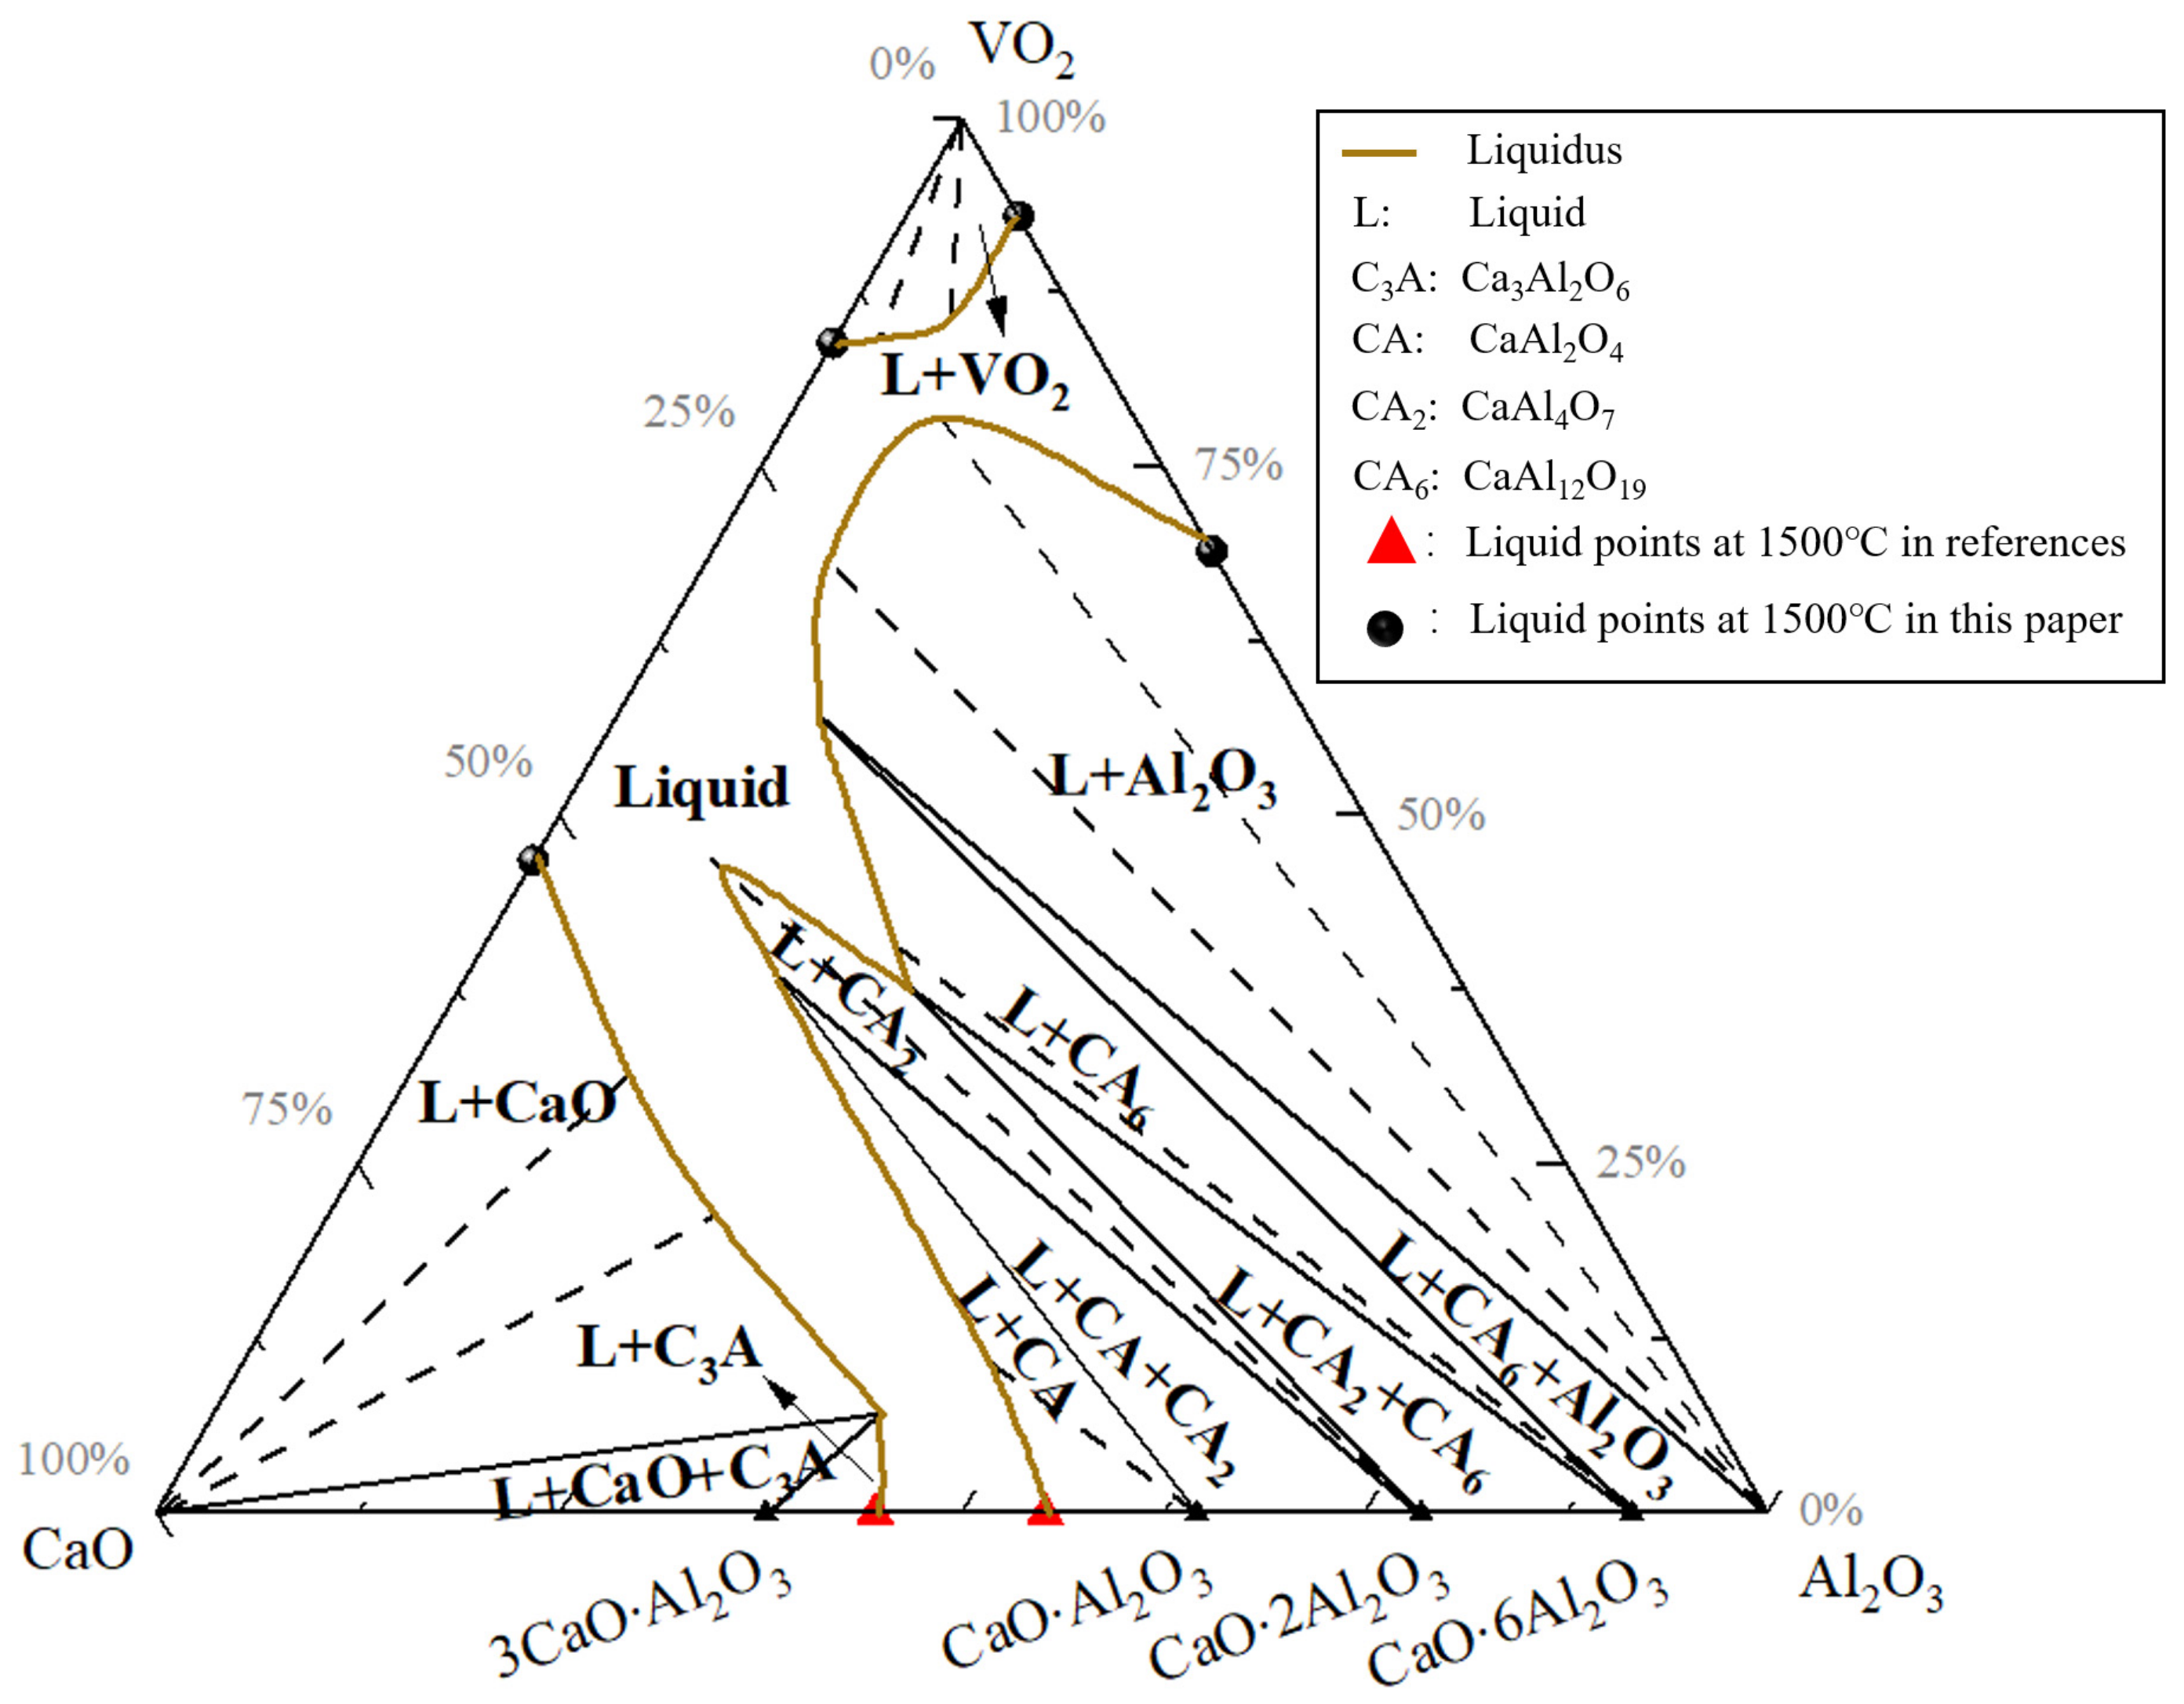
3.2. The 1500 °C Iso-Thermal Phase Diagram of the CaO-Al2O3-VOx System

According to the data in Table 5, the glass phase compositions of each equilibrium slag sample are marked in the Ca-Al-V-O three-dimensional phase diagram, as shown in Figure 5. It can be seen from the diagram that the glass phase compositions are located between the CaO-Al2O3-V2O5 plane and the CaO-Al2O3-VO2 plane, which mainly depends on the O/V ratio of the glass phase compositions. Therefore, in this paper, the CaO-Al2O3-V2O5-VO2 local space quaternary system is used as the framework to show the phase equilibrium relationships of the Ca-Al-V-O slag system, as shown in Figure 6.
According to the Gibbs phase law, under the fixed condition of temperature and pressure, when the equilibrium oxygen partial pressure is also fixed, the degrees of freedom of the glass phase region in the Ca-Al-V-O quaternary slag system is F = 4-P-1 = 2, the degrees of freedom of the two-phase region F = 4-P-1 = 1, and the degrees of freedom in the three-phase region F = 4-P-1 = 0. In other words, the glass region of the Ca-Al-V-O system under one oxygen partial pressure at 1500 °C is a curved surface in the Ca-Al-V-O space. The equilibrium glass phase composition in the glass–solid two-phase coexistence region is the boundary curve of the curved surface, and the equilibrium glass phase composition in the solid three-phase coexistence region is the boundary point of the curved surface. According to the experimental results for the phase equilibrium in Section 3.1, the isothermal phase diagram contains four three-phase regions (glass + CaO + Ca3Al2O6, glass + CaAl2O4 + CaAl4O7, glass + CaAl4O7 +CaAl12O19, glass + CaAl12O19 + Al2O3), seven two-phase regions (glass + CaO, glass + Ca3Al2O6, glass + CaAl2O4, glass + CaAl4O7, glass + CaAl12O19, glass +Al2O3, glass + VO2), and a single-phase region (glass phase). By connecting the equilibrium glass phase components of each phase region, the isobaric oxygen potential line of the system under the condition of PO2 = 10−3 atm can be determined, and the area surrounded is the glass phase surface, as shown in Figure 6. It can be seen from Figure 6 that the phase region of the CaO-Al2O3-VOx slag system under the experimental condition extends from the low melting point region of the CaO-Al2O3 binary system to the interior of the CaO-Al2O3-V2O5-VO2 system. With the decrease in the w(CaO)/w(Al2O3) ratio, the O/V ratio of VOx of the glass phase decreases gradually, which means the content of V2O5 in the glass phase decreases gradually, and the content of low valence vanadium oxide increases gradually. In the range of 45% < w(CaO) < 55%, the shape of the glass region can remain relatively stable when the w(Al2O3)/w(VOx) ratio changes drastically, and the valence states of vanadium in the glass phase can remain relatively stable in the range of w(CaO)/w(Al2O3) < 0.55.
At the same time, the equilibrium phase regions (mainly the glass phase composition) in Figure 6 are projected on the CaO-Al2O3-VO2 and CaO-Al2O3-V2O5 pseudo-ternary phase diagram, and the traditional isothermal section shown in Figure 7 and Figure 8 can be obtained, respectively. Considering the existing comprehensive study of the CaO-Al2O3 binary phase diagram, the equilibrium glass phase compositions of CaO and Al2O3 in the CaO-Al2O3 sub-binary system are taken from values available in the literature, while the glass phase compositions of other sub-binary systems are experimental values obtained in this study. As the equilibrium slag samples 2#, 8#, 9#, and 11# in this study belong to the CaO-VOx and Al2O3-VOx sub-binary systems, their phase equilibrium results can complement and revise the corresponding binary phase diagrams. Among them, the phase diagrams for the CaO-VO2 and Al2O3-VO2 binary systems have not been reported in the literature. Therefore, in this study, the equilibrium glass phase compositions of CaO and VO2 in the CaO-VO2 binary system at 1500 °C and the equilibrium glass phase compositions of Al2O3 and VO2 in the Al2O3-VO2 binary system at 1500 °C serve as supplements to the respective binary systems. The equilibrium glass phase compositions of CaO in the CaO-V2O5 binary system and Al2O3 in the Al2O3-V2O5 binary system at 1500 °C are consistent with data available in the literature, demonstrating the reliability of the experimental results.
It can be seen in Figure 7 that in the range of w (VO2) < 55%, the glass phase region of the ternary slag system extends from the low melting point region of the CaO-Al2O3 binary system to the increasing direction of w (VO2) and the w(CaO)/w(Al2O3) ratio to the CaO-VO2 binary system. In the range of 50% < w(VO2) < 85%, the glass region extends from the low-melting-point region of the CaO-VO2 binary system to the range of w(Al2O3) = 10%. In the range of 80% < w(VO2) < 85%, the glass phase region extends from the low-melting-point range of the Al2O3-VO2 binary system to the direction of increasing CaO content to the CaO-VO2 binary system. The glass regions that extend from the three binary systems are connected as a whole. When w(CaO) is in the range of 45~50%, the shape of the glass phase region can remain relatively stable under the condition of drastic change in w (Al2O3)/w (VO2). The CaO-Al2O3-V2O5 isothermal section in Figure 7 shows a similar variation in the glass region as shown in Figure 6, but what is different in the former is that the CaO-Al2O3-V2O5 phase diagram has no glass + VO2 two-phase region. The reason is that the experimental temperature (1500 °C) is higher than the melting point of V2O5 (690 °C) and lower than the melting point of VO2 (1545 °C). Therefore, the glass phase region of the CaO-Al2O3-V2O5 isothermal section can be extended from the glassus of the glass + Al2O3 two-phase region to the increasing direction of V2O5 to the composition of V2O5.
It should be clearly pointed out that Figure 7 and Figure 8 are only the approximate projections of the Ca-Al-V-O spatial phase equilibrium relationship (mainly the equilibrium glass phase composition) shown in Figure 6 on the two pseudo-ternary phase diagrams. Whether it can truly characterize the phase equilibrium relationships of the corresponding pseudo-ternary system depends on the approaching degree of the spatial phase equilibrium relationship to the pseudo-ternary plane. To this end, this paper evaluated the reliability of the projection of the Ca-Al-V-O spatial phase equilibrium relationships to the CaO-Al2O3-VO2 and CaO-Al2O3-V2O5 pseudo-ternary systems by calculating and comparing the O/V ratio of VOx of the glass phase composition with the O/V ratio of the adjacent pseudo-ternary planes. For the glass + VO2 phase equilibrium in the Ca-Al-V-O space (slag samples 2#, 8#, 10#, and 15#), because the phase diagram of the CaO-Al2O3-V2O5 pseudo-ternary system does not contain the glass–solid two-phase coexistence region of vanadium oxide, if the spatial phase equilibrium relationship is projected to this plane, it will cause the lack of phase equilibrium information, so it is reasonable to project the glass phase compositions to the CaO-Al2O3-VO2 pseudo-ternary system. For the rest of the phase equilibrium relationships, by calculating the O/V ratios of each equilibrium slag sample, as listed in Table 5, it can be seen that the average O/V ratio of the system (O/V = 2.367) is closer to the CaO-Al2O3-V2O5 pseudo-ternary system (O/V = 2.5), so it is more reasonable to project the rest of the phase equilibrium relationships to the CaO-Al2O3-V2O5 pseudo-ternary system.
Using the CaO-Al2O3-VOx system as a metallurgical slag presents significant potential for addressing the issue of fluctuating vanadium recovery rates during the direct alloying process of vanadium. The research conducted in this paper on the phase equilibrium of the CaO-Al2O3-VOx system under argon atmosphere at 1500 °C provides practical guidance for optimizing the direct alloying process of vanadium. Specifically, when designing the slag composition for the direct alloying of vanadium, it is crucial to consider the requirements of slag properties such as density, melting point, viscosity, and fluidity. The composition is generally designed within the glass phase region of the system. Therefore, utilizing the information from the CaO-Al2O3-VOx phase diagram for slag composition design is an effective approach to address the existing issues in the direct alloying process of vanadium.

4. Conclusions

In this paper, the phase equilibrium relationship of the CaO-Al2O3-VOx system under argon atmosphere at 1500 °C was studied with a high-temperature phase equilibrium experiment. The types and compositions of each phase of the equilibrium slag samples and the content of different valence states of the vanadium element were determined. The result shows that the CaO-Al2O3-VOx slag system contains four three-phase regions (glass + CaO + Ca3Al2O6, glass + CaAl2O4 + CaAl4O7, glass + CaAl4O7 + CaAl12O19, glass + CaAl12O19 + Al2O3), seven two-phase regions (glass + CaO, glass + Ca3Al2O6, glass + CaAl2O4, glass + CaAl4O7, glass + CaAl12O19, glass + Al2O3, glass + VO2), and a single-phase region (glass) under argon atmosphere (p(O2) = 10−3 atm) at 1500 °C. By calculating and comparing the O/V ratio of the equilibrium glass phase composition of VOx with the O/V ratio of adjacent pseudo-ternary planes, it was found that projecting the glass + VO2 equilibrium of the Ca-Al-V-O space onto the CaO-Al2O3-VO2 pseudo-ternary system is more reasonable, while the rest of the phase equilibrium relationships project more reasonably onto the CaO-Al2O3-V2O5 pseudo-ternary system.

Author Contributions

Conceptualization, C.L.; methodology, J.Q.; validation, W.L. and G.H.; formal analysis, J.Q. and W.L.; investigation, X.X.; resources, W.L.; data curation, X.X.; writing—original draft, X.X.; writing—review and editing, J.Q.; supervision, C.L. and G.H.; project administration, C.L. All authors have read and agreed to the published version of the manuscript.

Funding

The National Key R&D Program of China (2021YFC2901200), the National Natural Science Foundation of China (52104327), China Postdoctoral Science Foundation General Program (2020M680966), the Young Elite Scientists Sponsorship Program by CAST (2022QNRC001), Liaoning Provincial Natural Science Foundation of China (No. 2022-YQ-09), Liao Ning Revitalization Talents Program (XLYC2002047), and the Postdoctoral Fellowship Program of CPSF (GZC20230393).

Data Availability Statement

The data presented in this study are available on request from the corresponding author. The data are not publicly available due to privacy.

Conflicts of Interest

The authors declare no conflicts of interest.

References

  1. Kumar, R.R.; Gupta, R.K.; Sadhasivam, M.; Pradeep, K.; Prasad, M. Mechanical behaviour and interface correlative microscopic analysis of vacuum diffusion bonded dissimilar stainless steel/α-Ti alloy joint for aerospace applications. Vacuum 2023, 217, 112561. [Google Scholar] [CrossRef]
  2. Murugesan, V.; Govindarasu, M.; Manoharadas, S.; Pandiaraj, S.; Thiruvengadam, M.; Govindasamy, R.; Vaiyapuri, M. Combinatorial anticancer effects of multi metal ion and drug substitute with hydroxyapatite coatings on surgical grade 316LSS stainless steel alloys towards biomedical applications. J. Mater. Res. Technol. 2023, 27, 7244–7258. [Google Scholar] [CrossRef]
  3. Wang, Y.; Meng, W.; Hu, X.; Yao, Y.; Wang, H. Reduction and reconstruction of vanadium-containing steel slag at high temperature. J. Environ. Chem. Eng. 2023, 11, 111320. [Google Scholar] [CrossRef]
  4. Yücel, O.; Cinar, F.; Addemir, O.; Tekin, A. The Preparation of Ferroboron and Ferrovanadium by Aluminothermic Reduction. High Temp. Mater. Process. 1996, 15, 103–110. [Google Scholar] [CrossRef]
  5. Zhou, Y.; Wang, Y.; Chou, K. Synthesis of high-quality ferrovanadium nitride by carbothermal reduction nitridation method. J. Iron Steel Res. Int. 2021, 28, 255–262. [Google Scholar] [CrossRef]
  6. Wang, W. Study on the Process of Vanadium Containing Steel Smelting by Direct Alloying with V2O5 Self-Reduction. Ph.D. Thesis, Wuhan University of Science and Technology, Wuhan, China, 2013. [Google Scholar]
  7. Xiao, Y.; Jalkanen, H.; Yang, Y.; Mambote, C.R.; Boom, R. Ferrovanadium production from petroleum fly ash and BOF flue dust. Miner. Eng. 2010, 23, 1155–1157. [Google Scholar] [CrossRef]
  8. Wang, C.; Tian, X.; He, R.; Zhang, J.; Shi, C.; Zhang, D. Study on the technology of V2O5 direct alloying. Sichaun Metall. 2015, 37, 26–30. [Google Scholar] [CrossRef]
  9. Ding, Z. Study on the production of vanadium containing steel by direct alloying of V2O5. Hebei Metall. 2021, 1, 51–54. [Google Scholar] [CrossRef]
  10. Dai, M. Study on Direct Alloying of Vanadium Oxides for Smelting Untempered Steel. Ph.D. Thesis, Wuhan University of Science and Technology, Wuhan, China, 2015. [Google Scholar]
  11. Moskalyk, R.R.; Alfantazi, A.M. Processing of vanadium: A review. Miner. Eng. 2003, 16, 793–805. [Google Scholar] [CrossRef]
  12. Xiong, Y.; Wang, L.; Wang, L.; Li, S.; Yang, G.; Cao, C.; Liu, S.; Nie, Y.; Jia, L. Optimization and kinetic analysis of direct acid leaching of vanadium from converter vanadium slag under atmospheric pressure. Miner. Eng. 2023, 198, 108091. [Google Scholar] [CrossRef]
  13. Jiang, H.; Yu, C.; Sun, S.; Zhen, T. Tungsten, molybdenum, vanadium oxide direct alloying production of M2 high speed steel. J. Chongqiang Univ. 2002, 25, 76–79. [Google Scholar] [CrossRef]
  14. Rovnushkin, V.A.; Toprishchev, G.A.; Rakavaskii, F.S. Mechanisms of direct alloying of steel with vanadium. Steel USSR 1979, 10, 11–14. [Google Scholar]
  15. Zhou, Y.; Li, Z. Theory and technology of smelting high speed steel by direct alloying of tungsten, molybdenum and vanadium oxide ore. China Tungsten Ind. 2006, 21, 13–18. [Google Scholar] [CrossRef]
  16. Yu, Y. Principle of Metallurgy; Metallurgical Industry Press: Beijing, China, 2020; p. 453. [Google Scholar]
  17. Hallstedl, B. Assessment of the CaO-Al2O3 System. J. Am. Ceram. Soc. 1990, 73, 15–23. [Google Scholar] [CrossRef]
  18. Jerebtsov, D.A.; Mikhailov, G.G. Phase diagram of CaO-Al2O3 system. Ceram. Int. 2001, 27, 25–28. [Google Scholar] [CrossRef]
  19. Eriksson, G.; Pelton, A.D. Critical evaluation and optimization of the thermodynamic properties and phase diagrams of the CaO-Al2O3, Al2O3-SiO2, and CaO-Al2O3-SiO2 systems. Metall. Trans. B 1993, 24, 807–816. [Google Scholar] [CrossRef]
  20. Pezzin, R.d.O.; Berger, A.P.L.; Grillo, F.F.; Junca, E.; Furtado, H.S.; de Oliveira, J.R. Analysis of the influence of the solid and glass phases on steel desulfurization with slags from the CaO–Al2O3 systems using computational thermodynamics. J. Mater. Res. Technol. 2020, 9, 838–846. [Google Scholar] [CrossRef]
  21. Li, X.; Xie, W.; Wang, N.; Qiao, Z.; Cao, Z. Thermodynamic optimization of Al2O3-V2O5 systems. Nonferrous Met. Sci. Eng. 2019, 10, 13–18. [Google Scholar] [CrossRef]
  22. Dabrowska, G.; Tabero, P.M.K. Phase relations in the Al2O3-V2O5-MoO3 system in the solid state. The crystal structure of AlVO4. J. Phase Equilibria Diffus. 2009, 30, 220–229. [Google Scholar] [CrossRef]
  23. Walczak, J.; Tabero, P. Studies on the system Al2O3-V2O5-MoO3. J. Therm. Anal. 1990, 36, 2173–2176. [Google Scholar] [CrossRef]
  24. Kurzawa, M.; Dabrowska, G. Phase Relations in The System Al2(MoO4)3–V2O5. J. Therm. Anal. Calorim. 2000, 60, 183–186. [Google Scholar] [CrossRef]
  25. Cao, Z.; Wang, N.; Xie, W.; Qiao, Z.; Jung, I.-H. Critical evaluation and thermodynamic assessment of the MgO-V2O5 and CaO-V2O5 systems in air. Calphad 2017, 56, 72–79. [Google Scholar] [CrossRef]
  26. Qiu, J.; Jiang, J.; Xie, X.; Li, W.; Liu, C. Phase Diagram of CaO–Al2O3–V2O5 Slag System at 1500 °C and 1600 °C. J. Sustain. Metall. 2023, 9, 1010–1019. [Google Scholar] [CrossRef]
  27. Xiang, J.-Y.; Wang, X.; Pei, G.-S.; Huang, Q.-Y.; Lü, X.-W. Solid-state reaction of a CaO-V2O5 mixture: A fundamental study for the vanadium extraction process. Int. J. Miner. Metall. Mater. 2021, 28, 1462–1468. [Google Scholar] [CrossRef]
  28. Yang, Y.; Mao, H.; Malin, S. CALPHAD: Computer Coupling of Phase Diagrams and Thermochemistry Contents of volume 26. Calphad 2002, 26, 599–602. [Google Scholar] [CrossRef]
  29. Maltsev, V.; Janod, E. Crystallization of quasi-two-dimensional vanadates in the CaO–V2O3–VO2–V2O5 system. J. Cryst. Growth 2002, 240, 170–175. [Google Scholar] [CrossRef]
  30. Muan, A.; Najjar, M.S. Compositions involving V2O3-Al2O3-CaO. US, 5070065, 3 December 1991. [Google Scholar]
  31. Menon ESarath Kumar Krishnan, R. Phase transformations in Ti-V alloys. J. Mater. Sci. 1983, 18, 365–374. [Google Scholar] [CrossRef]
  32. Qing, X. Vanadium Titanium Magnetite Blast Furnace Smelting; Metallurgical Industry Press: Beijing, China, 1994; pp. 1–8. [Google Scholar]
  33. Available online: http://www.sinopharm.com/ (accessed on 11 December 2023).
  34. Liu, C.; Qiu, J.; Liu, Z. Phase Equilibria in the System CaO-SiO2-La2O3-Nb2O5 at 1400 °C. Metals 2021, 11, 1892. [Google Scholar] [CrossRef]
  35. Qiu, J.; Wang, H.; Huo, G.; Liu, C. Phase Equilibria of CaO-Al2O3-CeOx slag system at 1600 °C in reducing atmosphere. Ceram. Int. 2023, 19, 20447–20455. [Google Scholar] [CrossRef]
  36. Biesinger, M.C.; Payne, B.P.; Grosvenor, A.P.; Lau, L.W.M.; Gerson, A.R.; Smart, R.S.C. Resolving surface chemical states in XPS analysis of first row transition metals, oxides and hydroxides: Cr, Mn, Fe, Co and Ni. Appl. Surf. Sci. 2011, 257, 2717–2730. [Google Scholar] [CrossRef]
Figure 1. Design composition of samples in the CaO-Al2O3-VOx system, mass%.
Metals 14 00108 g001
Figure 2. Typical SEM images of samples in the CaO-Al2O3-VOx system at 1500 °C: (a) glass + CaO + Ca3Al2O6, (b) glass + CaAl2O4 + CaAl4O7, (c) glass + CaAl4O7 + CaAl12O19, (d) glass + CaAl12O19 + Al2O3, (e) glass + CaO, (f) glass + CaAl2O4, (g) glass + CaAl4O7, (h) glass + CaAl12O19, (i) glass + Al2O3, (j) glass + VO2, and (k) glass.
Metals 14 00108 g002
Figure 3. XRD results of slag sample 10#.
Metals 14 00108 g003
Figure 4. XPS spectrum results of samples in the CaO-Al2O3-VOx system at 1500 °C.
Metals 14 00108 g004aMetals 14 00108 g004b
Figure 5. The positions of the glass compositions in the Ca-Al-V-O three-dimensional phase diagram.
Metals 14 00108 g005
Figure 6. Phase diagram of CaO-Al2O3-V2O5-VO2 at 1500 °C and p(O2) = 10−3atm.
Metals 14 00108 g006
Figure 7. Isothermal section of the CaO-Al2O3-VO2 system at 1500 °C, mass%.
Metals 14 00108 g007
Figure 8. Isothermal section of the CaO-Al2O3-V2O5 system at 1500 °C, mass%.
Metals 14 00108 g008
Table 1. Design composition of samples in the CaO-Al2O3-VOx system, mass%.
No.CaOAl2O3V2O5No.CaOAl2O3V2O5
1#47.70-52.3010#4.437.4488.13
2#-7.7592.2511#-52.2547.75
3#4.2358.9036.8712#26.4169.104.49
4#65.9621.9912.0513#12.5481.016.45
5#49.3648.991.6514#3.3492.993.67
6#16.8276.476.7115#6.262.1991.55
7#7.0086.856.1516#10.5255.6433.84
8#9.20-90.8017#26.7747.6225.61
9#78.49-21.5118#68.4011.9919.61
Table 2. Related data of V2p [36].
Oxidation StateBinding Energy of V2p3/2 (eV)Std. DeV. (±eV)Energy Difference between V2p1/2 and V2p3/2 (eV)FWHM,
V2p3/2 (eV)
FWHM,
V2p1/2 (eV)
+2513.670.27.33~7.352.0~2.32.6~3.4
+3515.300.27.33~7.352.7~4.03.1~4.7
+4516.300.27.33~7.352.2~3.23.1~3.7
+5517.180.67.33~7.481.0~1.52.6
Table 3. EDS measurement of samples in the CaO-Al2O3-VOx system at 1500 °C, mass%.
No.PhaseCaAlVONo.PhaseCaAlVO
1#Glass40.58-26.4432.9810#Glass6.972.8843.7746.38
2#Glass-2.8042.9354.27 VO2-1.5049.4649.04
VO2--49.5750.4311#Glass-15.7440.6043.66
3#Glass11.024.1340.4244.43 Al2O3-48.135.8246.05
Al2O3-49.064.5646.3812#Glass39.3021.096.6932.92
4#Glass47.8411.5511.0629.55 CaAl2O427.9732.70 39.33
CaO61.692.342.2133.7613#Glass30.1012.8420.3936.67
5#Glass42.3417.943.6936.03 CaAl4O717.4441.20-41.37
CaO63.142.83-34.03 CaAl12O196.8445.13-48.03
Ca3Al2O642.3317.943.6836.0514#Glass25.885.8230.0838.22
6#Glass33.7911.7917.5036.92 CaAl12O195.7748.11-46.12
CaAl2O427.5629.834.3238.29 Al2O3-42.17-57.83
CaAl4O716.4139.95-43.6415#Glass14.971.3841.1042.55
7#Glass28.8212.4619.7039.02 VO20.940.3546.2152.49
CaAl12O19-47.97-52.0316#Glass20.263.3035.1941.25
8#Glass13.45-43.0043.55 Al2O30.4349.494.6045.48
VO2--51.1448.8617#Glass32.905.0724.7337.30
9#Glass42.20-22.7935.01 CaAl4O716.0037.49-46.51
CaO49.54-2.0448.4218#Glass43.806.1415.3234.74
CaO29.670.792.5766.97
Table 4. Relative contents of vanadium with different valence states of equilibrium slag samples, mole%.
NO.V5+V4+V3+
1#77.2917.854.07
3#70.1823.066.76
4#83.776.839.40
7#78.0919.772.14
9#84.7714.240.99
11#72.7920.147.07
12#90.619.39-
13#81.5611.357.09
14#71.0724.973.96
15#66.5632.570.87
16#64.5227.178.31
17#81.2712.825.91
Table 5. Actual contents of each component in the glass phase of the CaO-Al2O3-VOx system at 1500 °C, mass%.
NO.CaOAl2O3V2O5VO2V2O3O/V
1#46.79-42.438.941.842.37
2#-6.5773.6716.043.722.32
3#12.418.7857.1417.134.542.37
4#53.8024.5418.561.381.722.38
5#51.2440.996.131.330.312.42
6#39.0825.7027.776.051.402.33
7#32.4524.4834.367.930.782.45
8#15.21-66.8614.553.382.37
9#51.26-41.916.420.402.34
10#7.846.1467.8314.773.432.43
11#-29.7052.7613.314.222.28
12#43.2043.7911.881.12-2.38
13#33.4926.9732.994.192.362.36
14#29.1212.3442.8413.731.972.36
15#16.622.8971.248.480.772.36
16#23.347.2346.5917.894.952.36
17#40.0810.8240.795.872.442.36
18#53.4014.1125.625.581.292.36
X ¯ = 2 . 367
Disclaimer/Publisher’s Note: The statements, opinions and data contained in all publications are solely those of the individual author(s) and contributor(s) and not of MDPI and/or the editor(s). MDPI and/or the editor(s) disclaim responsibility for any injury to people or property resulting from any ideas, methods, instructions or products referred to in the content.

