Article

Investigating the Origin of Non-Metallic Inclusions in Ti-Stabilized ULC Steels Using Different Tracing Techniques

1
Christian Doppler Laboratory for Inclusion Metallurgy in Advanced Steelmaking, Montanuniversitaet Leoben, Franz Josef–Straße 18, 8700 Leoben, Austria
2
voestalpine Stahl GmbH, voestalpine-Straße 3, 4020 Linz, Austria
3
Chair of General and Analytical Chemistry, Montanuniversitaet Leoben, Franz Josef–Straße 18, 8700 Leoben, Austria
*
Author to whom correspondence should be addressed.
Metals 2024, 14(1), 103; https://doi.org/10.3390/met14010103
Submission received: 13 December 2023 / Revised: 3 January 2024 / Accepted: 9 January 2024 / Published: 15 January 2024
(This article belongs to the Special Issue Secondary Refining)

Abstract

:
Since steel cleanness comes to the fore of steel producers worldwide, it is necessary to understand the formation mechanism and modification of non-metallic inclusions (NMIs) in more detail. One central point is the identification of the source of especially interfering NMIs to prevent their evolution in the future. The present study applies two approaches to determine the source of NMIs in Ti-stabilized ultra-low carbon (ULC) steels—the active and the passive tracing. Both approaches are applied to an industrial experiment. The active tracing technique is focused on investigating the clogging layer formation in submerged entry nozzles and, hence, the origin of alumina particles. This method adds rare earth elements (REEs) directly to the melt to mark pre-existing deoxidation products at a certain point of the steelmaking process. The main concern of the passive method, the so-called REE fingerprint, is the determination of the source of mesoscopic NMIs. For the REE fingerprint, the pre-existing concentration of REEs in different potential sources and the investigated NMIs are measured by using an inductively coupled plasma mass spectrometer (ICP-MS). The resulting patterns are compared after normalizing the contents to chondrites, and the NMIs’ origins are identified. Concerning the EDS analysis and the resulting patterns from the REE fingerprint, the mold slag and, respectively, the casting powder were the sources of the investigated NMIs.

1. Introduction

Steel cleanness is crucial for a wide spectrum of steel grades and is primarily defined by quantity, size, spatial distribution and the chemical composition of small particles in the steel, so-called non-metallic inclusions (NMIs) [1,2,3]. NMIs influence the chemical and physical properties of the final product as well as the stability of the steelmaking process [4,5,6]. One example of their detrimental impact is nozzle clogging during continuous casting at special steel grades, such as Ti-stabilized ultra-low carbon (ULC) steel used in the automotive industry for car body shell parts [7,8]. Of the four main clogging mechanisms, at least one, but in most cases several, always coincides with and contributes to the formation of submerged entry nozzle (SEN) clogging and, consequently, its blockage [9,10,11,12]. One of these mechanisms is the agglomeration of deoxidation products and their attachment to the SEN wall due to fluid flow and interfacial tension effects [13]. Another possible cause is reoxidation, which can occur due to air aspiration into the SEN [14]. Phenomena like SEN clogging can be comprehended by understanding how inclusions are formed and modified during steelmaking. Tracing is a revealing tool for gaining knowledge about inclusions, which allows for marking and tracking the NMI’s path throughout the production process.
This publication focuses on two different tracing approaches—active and passive tracing. The active tracing technique is already known in the steel industry [15,16]. In this method, NMIs are partially reduced due to the direct addition of rare earth elements (REEs) [17]. Several studies [18,19,20,21] have already managed to track the modification of deoxidation products, such as alumina NMIs, by adding La and Ce to the melt on industrial and laboratory scales. The benefit of this approach is the easy retrieval of REE-marked NMIs during automated scanning electron microscopy with energy dispersive X-ray spectroscopy (SEM/EDS) analysis, since REEs appear brighter than the steel matrix in backscattered electron (BSE) images due to their higher atomic number [22]. However, REEs do not only mark NMIs. They also influence their physical and chemical behaviors, such as wettability or agglomeration tendency [23,24,25]. Hence, finding another way to identify the origin of NMIs is beneficial.
The second technique, the REE fingerprint, is a novel approach in metallurgy but has already been applied in other research fields, such as archaeology or geo-and food chemistry [26,27,28,29]. In the latter, it is mainly utilized to determine the geographical origin of resources used since the soils of origin differ even in the same country [30]. In the REE fingerprint method, the pre-existing concentrations of lanthanoids (La to Lu) are measured by using inductively coupled plasma mass spectrometry (ICP-MS) in the materials to be examined. The concentrations are in the range of a few mg/kg and have to be normalized to a suitable reference dataset in order to facilitate the recognition of patterns. Most frequently, a dataset obtained for chondrites, which are meteoritic rocks, is used [31]. By comparing the patterns with each other, the source of, e.g., an NMI, can be determined. In contrast to active tracing, the NMIs and their properties are not influenced or modified.
Both approaches are applied in the present study to investigate the formation mechanism behind SEN clogging and the origin of mesoscopic NMIs in Ti-stabilized ULC steels. For active tracing, melts are actively marked with La and Ce on an industrial scale. Steel samples are taken at several steps of the production process to study the modification of alumina NMIs using automated SEM/EDS analysis and to identify if pre-existing deoxidation products exist in the final sample or if reoxidation occurs due to FeTi addition. For the second tracing approach, samples with mesoscopic NMIs are prepared from the traced melts. The pre-existing REE concentration of the NMIs and potential sources are measured via laser-ablation (LA) ICP-MS analysis. A match between the REE patterns that results after normalization to chondrites indicates the coherence of, e.g., an NMI and an auxiliary. Both approaches aim to clarify critical topics in steel production.

2. Materials and Methods

2.1. Active Approach

Using the active tracing technique, common NMIs in steel, especially deoxidation products, are marked by REEs to allow us to follow them over the steelmaking process. The direct addition of REEs, mainly La or Ce, after, e.g., the deoxidation of the steel melt, leads to partial reduction of the previously formed inclusions due to the higher oxygen affinity of REEs [17]. During SEM/EDS analysis, the REE-containing parts of the resulting heterogeneous multiphase NMIs appear brighter in the BSE image since REEs have a higher molar mass compared to the surrounding steel matrix. The benefit of the easier tracking of marked NMIs is also connected to the disadvantage of automated SEM/EDS analysis, since a double-threshold scan is necessary to detect not only the particles that are usually darker than the steel matrix but also the brighter ones. The subsequent data evaluation must also be optimized since the REE-containing NMIs are split into their brighter and darker parts and have to be recombined for correct measurement results [32].

2.2. Passive Approach

By using the REE fingerprint, a passive tracing technique, it is possible to analyze the source of, e.g., NMIs or determine the influence of auxiliaries on the clogging layer formation in the SEN. For this approach, the pre-existing REE contents in slags, inclusions, or the clogging layer are measured using ICP-MS or LA-ICP-MS, since only traces of a few mg/kg naturally occur inside these materials. The detected signals are normalized in the following step to achieve a more straightforward and comparable pattern. Therefore, chondrite normalization is used, a standard procedure based on meteoritic rocks, so-called chondrites, due to their similar composition of non-volatile elements to planet Earth. The mass fractions of lanthanoids in the chondrites used for normalization are listed in Table 1. Pm is excluded from the list since it practically does not exist in nature because of its radioactivity and half-life of only 17.7 years [31,33,34].

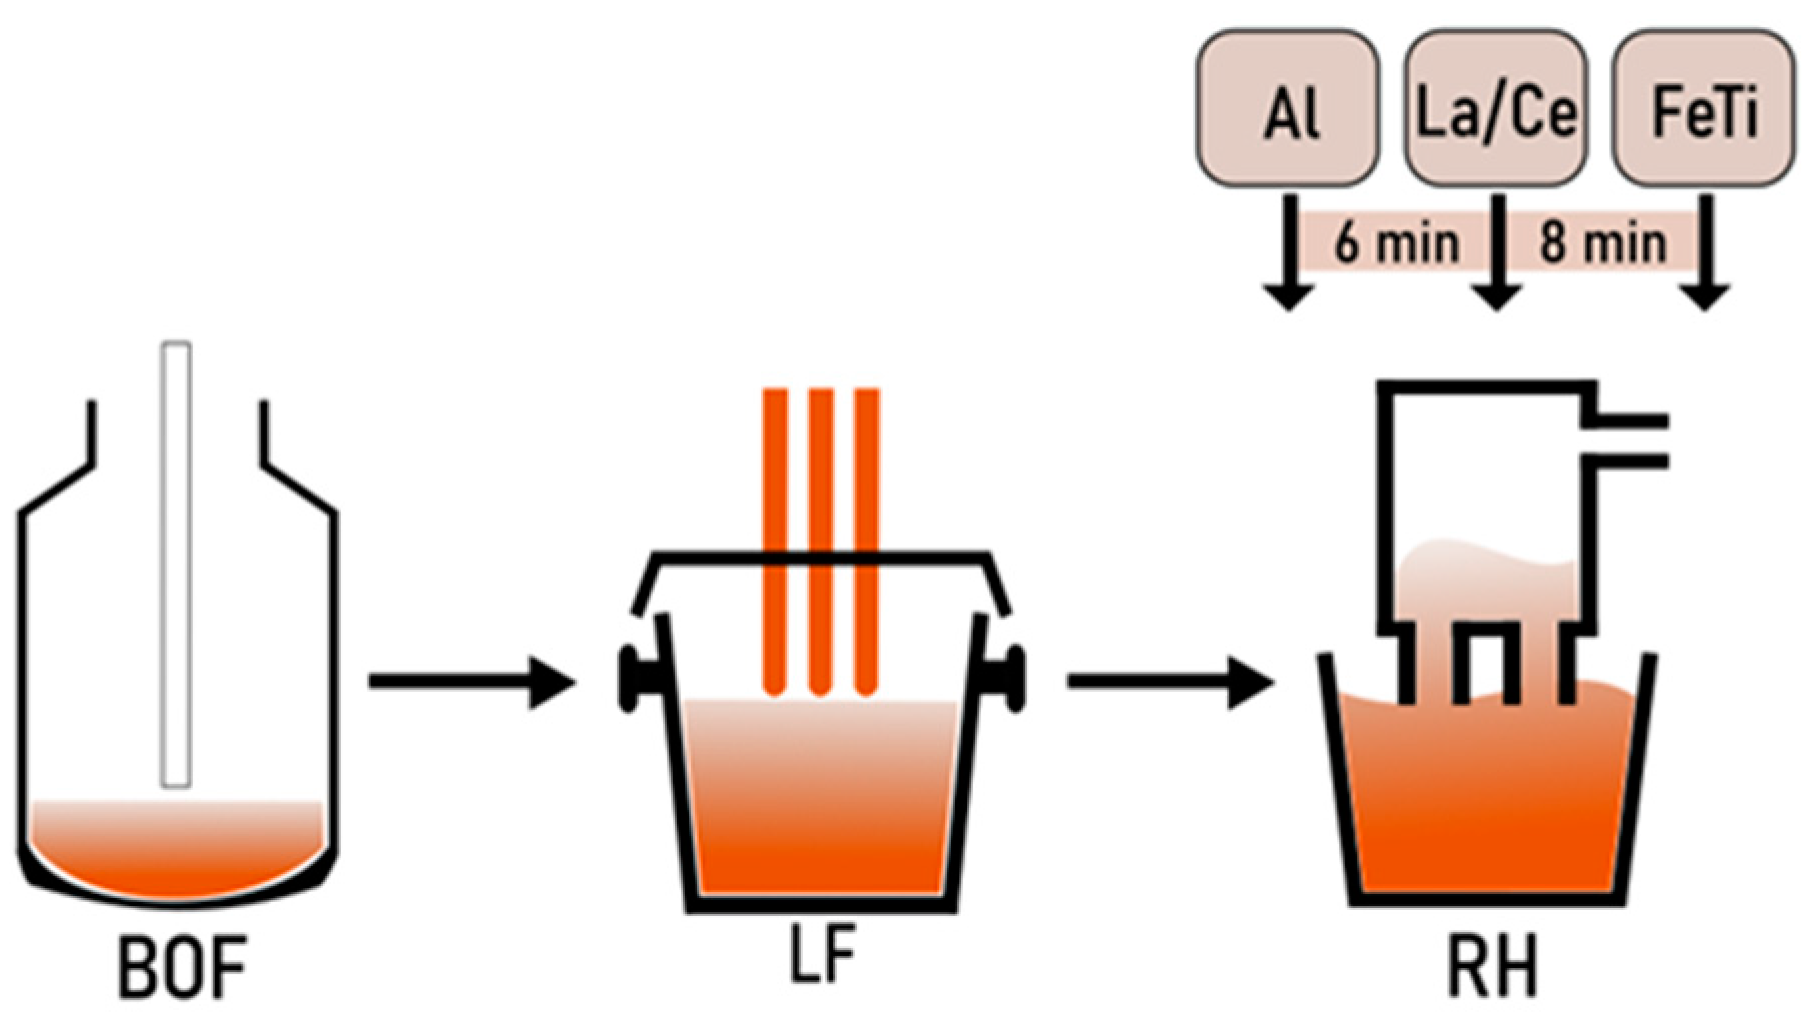
2.3. Experimental Procedure
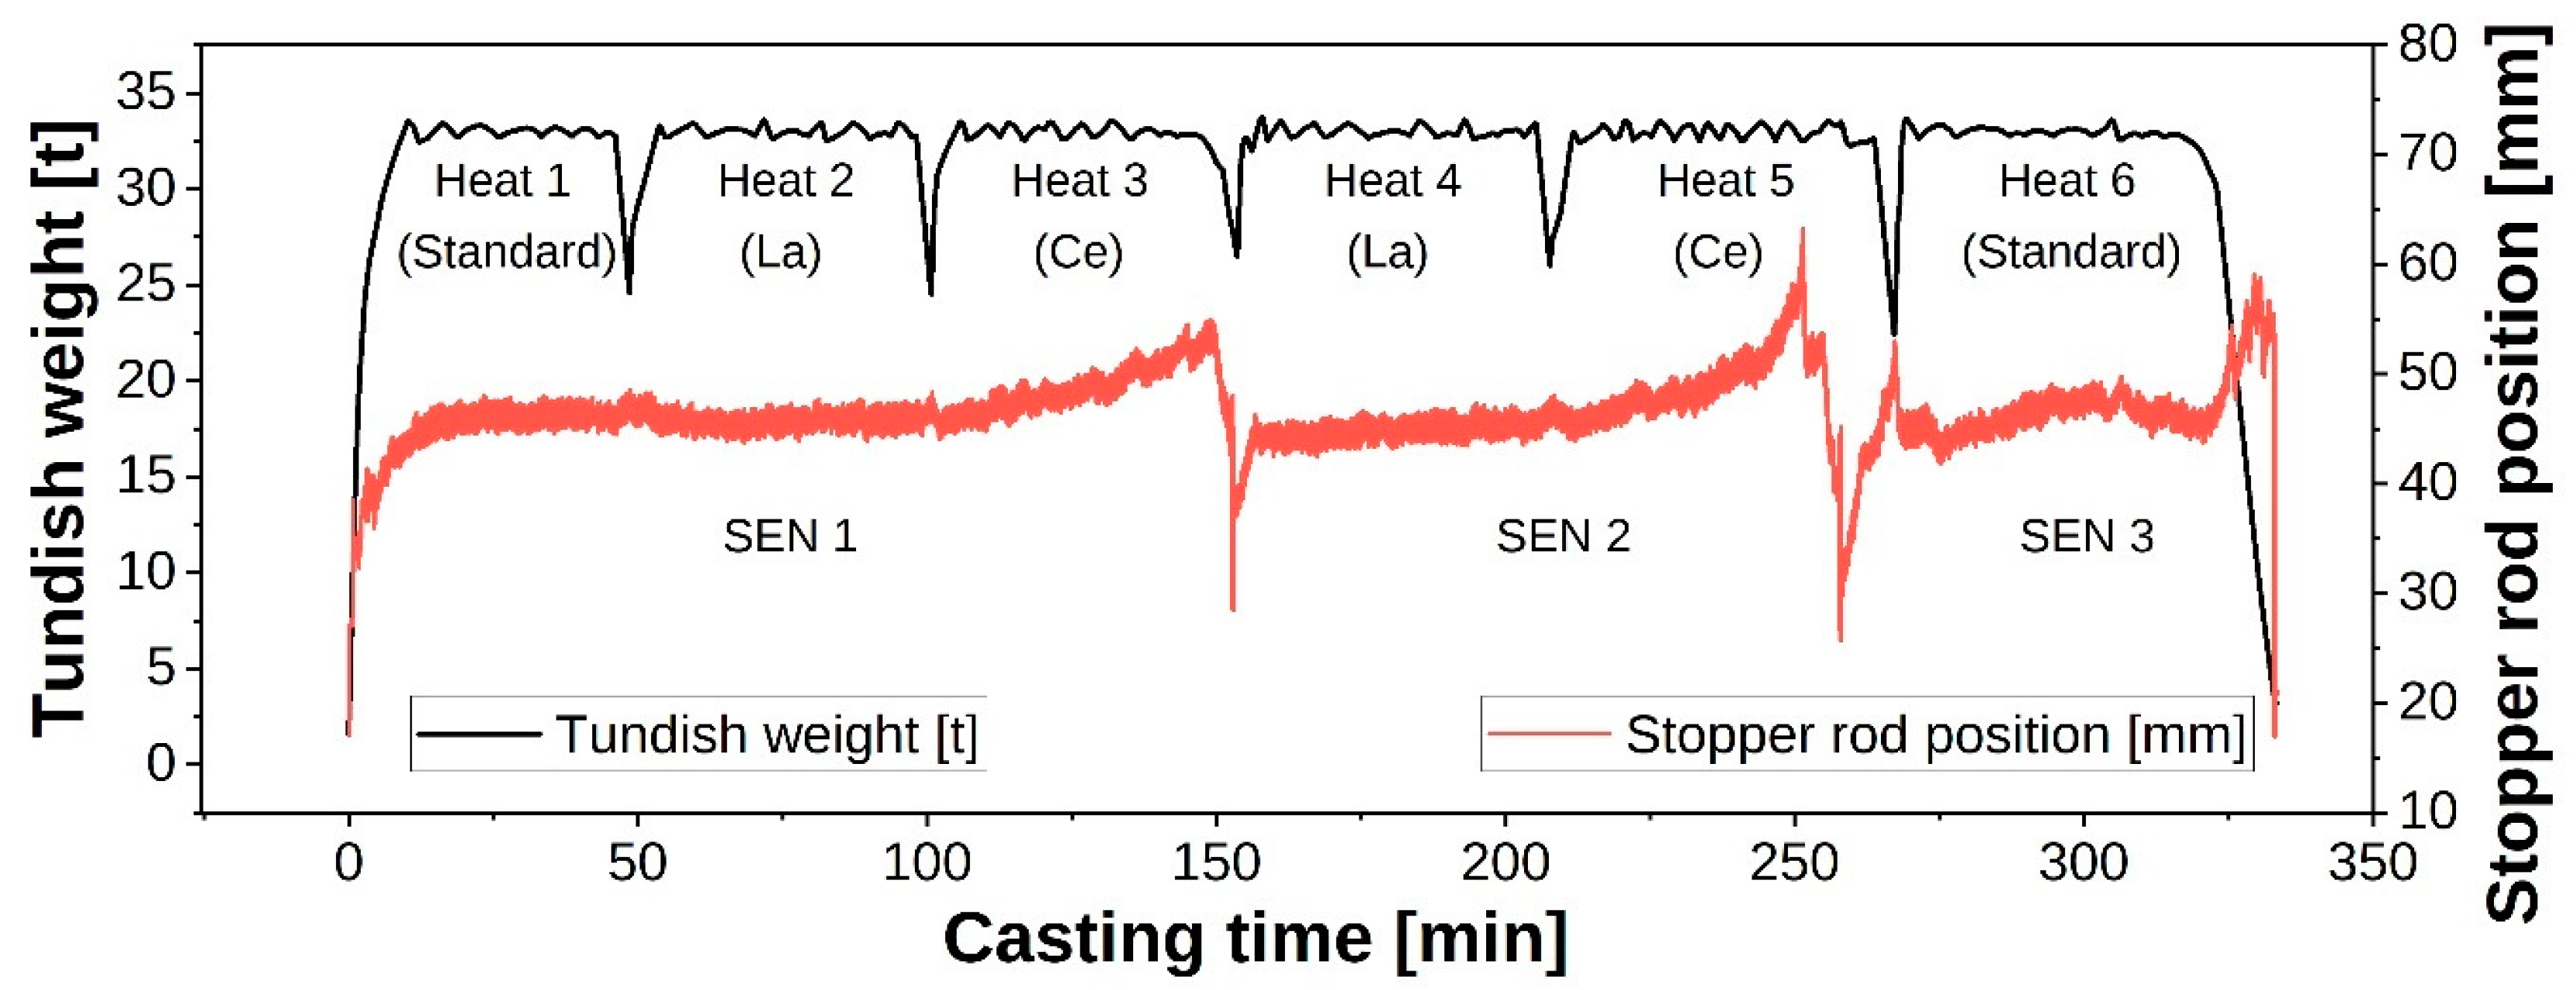
2.3.1. Tracer Trial

The industrial tracer trials were performed at the voestalpine Stahl GmbH steel plant in Linz, Austria. Ti-stabilized IF steel was chosen for this experiment due to its susceptibility to clogging. These steels are produced via a basic oxygen furnace route (BOF), followed by ladle furnace treatment, vacuum degassing at the Ruhrstahl–Heraeus (RH) facility and continuous casting using a single-strand slab caster. Figure 1 shows a schematic description of the experimental procedure including the La or Ce alloying after Al deoxidation and the subsequent FeTi addition.
After crude steel production, 180 tons of steel are tapped into the ladle. Alloy composition and temperature adjustments are performed during ladle furnace treatment. Subsequently, the heat is transferred to the RH facility. Following decarburization, the residual oxygen is killed with Al, and towards the end of the treatment, FeTi is alloyed. A common chemical composition of Ti-IF steel produced in the steel plant of voestalpine Stahl GmbH is presented in Table 2.
The tracing experiment involved six Ti-IF heats cast consecutively on the same continuous caster. As shown in Figure 2, the sequence’s first and last heats were produced without any tracer addition. The second and fourth were treated with La, while the third and fifth received Ce.
The REEs were added to the steel between the Al and FeTi addition, using approximately 40 mg/kg of La or Ce in metallic form. The timing of the tracer addition was purposefully selected to mark the existing inclusion population originating from the deoxidation practice and to distinguish them from later-formed NMIs according to their REE modification. The amount of REEs used was based on successful industrial trials from the literature, to prevent any potential increase in clogging tendency during casting. In the study by Liang et al. [16], 120 kg of a Ce-Fe alloy, with over 10 g/100 g of Ce, was added to 210 t of crude steel resulting in 28 mg/kg Ce in the steel sample from the tundish. Similar relations occurred in the industrial experiment of Gao et al. [35], where 100 kg of a Ce-Fe alloy, with 10 g/100 g of Ce, was alloyed to 250 t and 20 mg/kg Ce was detected in the final product. A third study from Geng et al. [36] added 80 kg of a Ce-Fe alloy, with 10 g/100 g of Ce, to 210 t of liquid iron. The resulting Ce content in the steel sample was about 23 mg/kg. Steel samples and process slag samples were taken in order to investigate the changes in the inclusions’ modification and their separation behavior during steel refining and casting. The steel was sampled at the RH facility after Al deoxidation, after REE addition, and finally at the end of vacuum treatment after adding FeTi. Furthermore, steel samples were taken from the tundish to study the modification of NMIs after an extended reaction time. The ladle slag was sampled at the end of secondary refining. Samples of tundish slag were collected at intervals of about 10 min following every ladle exchange. In each case, two mold slag samples were taken per heat in the 20th and 40th minute of casting.
As depicted in Figure 2, three SENs were used during the casting of the Ti-IF sequence. The first SEN (SEN 1) was picked to study the correlation between the formed clogging layer structure, the inclusion specimens, and potential primary materials using the two tracing approaches. For further investigations, the middle section of the SEN was selected and halved. A piece of the inner part of the SEN, mainly consisting of the clogged material, was embedded using a Sn-Bi alloy to stabilize the clogging structure for the following polishing procedure. The investigated area is marked in red in the halved SEN 1 shown in Figure 3. Furthermore, the backscattered electron image of the clogging layer is illustrated.

2.3.2. Micro-Cleanness Characterization

The method used for the characterization of the REE-traced inclusions in the taken steel samples was the automated SEM/EDS analysis, performed with a JEOL 7200 F field emission SEM (JEOL Germany GmbH, Freising, Germany) equipped with a 100 mm² SDD EDS detector (Oxford Instruments Ultim Max 100; Oxford Instruments GmbH NanoAnalysis, Wiesbaden, Germany) and the AZtec Feature software (AZtec 6.0; Oxford Instruments GmbH NanoAnalysis, Wiesbaden, Germany). The chemical composition of a single particle was detected using area scanning for 1 s at a beam energy of 15 keV, probe current of 13 PC, working distance of 10 mm, and resolution of 1024 × 1024, with 400× magnification. The first evaluation step with the resulting data was the removal of artifacts, such as scratches or grinding and polishing residues. Next, the heterogeneous multiphase NMIs were recombined to correct the appearing error in the inclusion population, chemical composition, and size due to the detection of more and smaller particles.

2.3.3. Measurements for REE Fingerprint Analysis

Different methods were required to determine the REE concentration in the auxiliaries for the REE fingerprint analysis. The homogeneous investigated materials, such as Al granules or slag formers, had to be digested before ICP-MS analysis. For all auxiliaries, except the Al granules, a LiBO2 fusion digestion was applied. The Al granules were digested by using HCl/HNO3. The used ICP-MS was an Agilent 7500 (Agilent Technologies, Santa Clara, CA, USA). For the analysis of solid inhomogeneous samples, such as the mesoscopic inclusions or the investigated clogging layer, LA-ICP-MS was utilized to measure the REE concentrations. For this purpose, an Agilent 8800 Triple Quadrupole ICP-MS (Agilent Technologies, Santa Clara, CA, USA) was coupled to an NWR 213 laser ablation system (ESI-NWR, Omaha, NE, USA). In Table 3, the investigated materials and the chosen analyzing methods are listed.

3. Results

3.1. Active Tracing

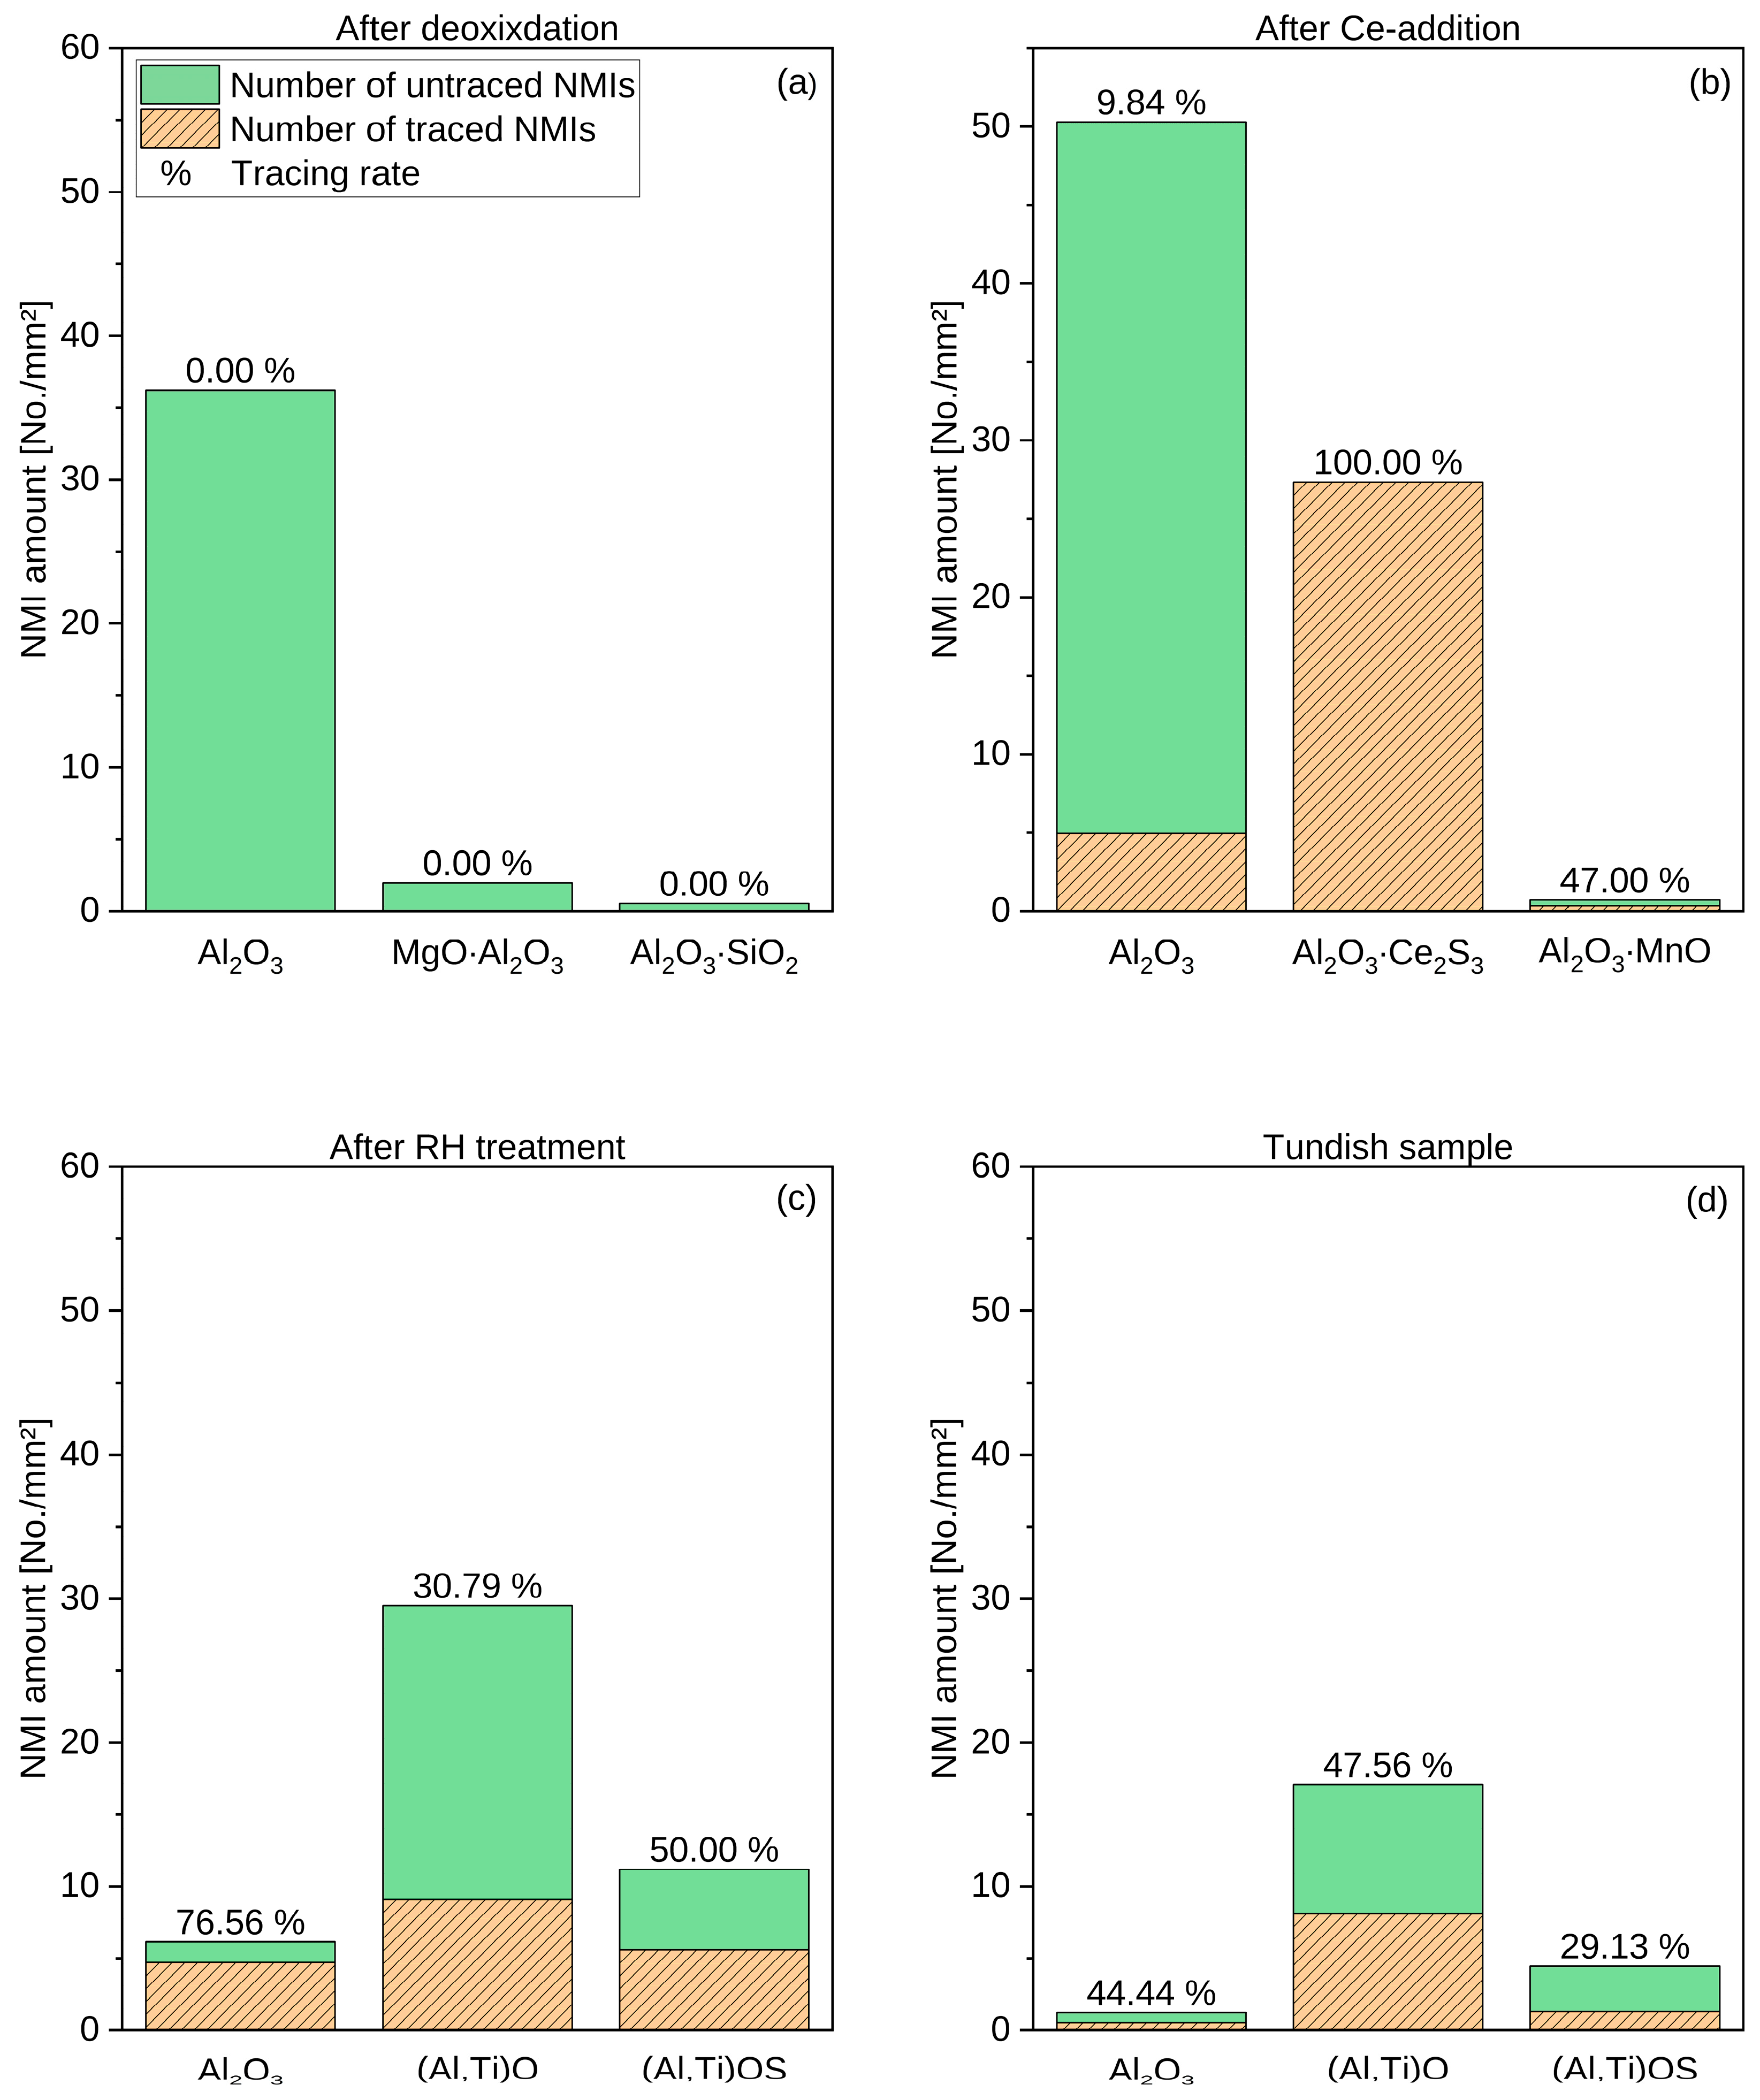
3.1.1. NMI Evaluation

The NMI evaluation and the determination of the active tracing success are schematically shown on the samples of the Ce-traced heat cast through the first SEN. The micro-cleanness evaluation was conducted via automated SEM/EDS analysis, in which the three main types of NMIs were identified after each process step. This is illustrated in Figure 4, where it can be seen that different inclusion types occurred in various stages of the process.
The inclusion population of the sample taken after Al deoxidation (Figure 4a) consists of 36.22 No./mm² alumina inclusions and only a few MA spinel and Al2O3∙SiO2 inclusions. In the second sample after Ce-addition (Figure 4b), a higher total number of NMIs was detected (81.05 No./mm²). The main types in the second sample were Al2O3 (50.29 No./mm²), Al2O3∙Ce2S3 (27.34 No./mm²), and Al2O3∙MnO (0.28 No./mm²). A total of 44.69% of all inclusions (32.62 No./mm2) were Ce-traced Al-containing inclusions in the second sample. After the FeTi addition and RH treatment, the inclusion population in sample three changed to a lower total inclusion density (56.59 No./mm²). The pre-existing inclusion types were also influenced and modified by FeTi. (Al,Ti)-containing oxides and oxide-sulfides existed besides alumina NMIs. The last sample investigated, the tundish sample (Figure 4d), had the same main inclusion types as the previous one but with a decreased total number of NMIs per mm², namely 36.82 No./mm². The total number of NMIs, the three main NMI types, as well as the overall tracing rates of the four investigated samples are listed in Table 4.
The mean equivalent circle diameters (ECDs) and the corresponding standard deviation of the three main NMI types of each sample, categorized into traced and untraced NMIs, are listed in Table 5. In samples 3 and 4, after FeTi addition, the ECDs of the traced NMIs were higher for each inclusion type compared to the untraced ones. The inclusion sizes increased between samples 2 and 4.
Figure 4 also shows the tracing rate for each inclusion type in the four analyzed samples. Besides the Ce-traced Al2O3 inclusions, the Al-Ti oxides and oxide-sulfides contained Ce-rich areas as well. The highest total tracing rate in the Al-containing NMIs was found in the second sample after Ce addition at 41.26%, followed by the sample after RH treatment at 38.43%, and the last sample at 34.26%.
The change in inclusion types over the process is shown in Figure 5 with exemplary BSE images and the associated elemental mappings. Figure 5a depicts an example of the main NMI type, an alumina inclusion after deoxidation. After REE addition, these alumina particles were modified by, e.g., Ce, and NMIs with brighter areas were formed, as shown in Figure 5b. The FeTi addition led to modification in the inclusion landscape, and complex Ce-traced (Al,Ti) oxides were found, as Figure 5c displays. Examples of the two main NMI types in the last sample, traced and untraced (Al,Ti) oxides, are shown in Figure 5d,e.

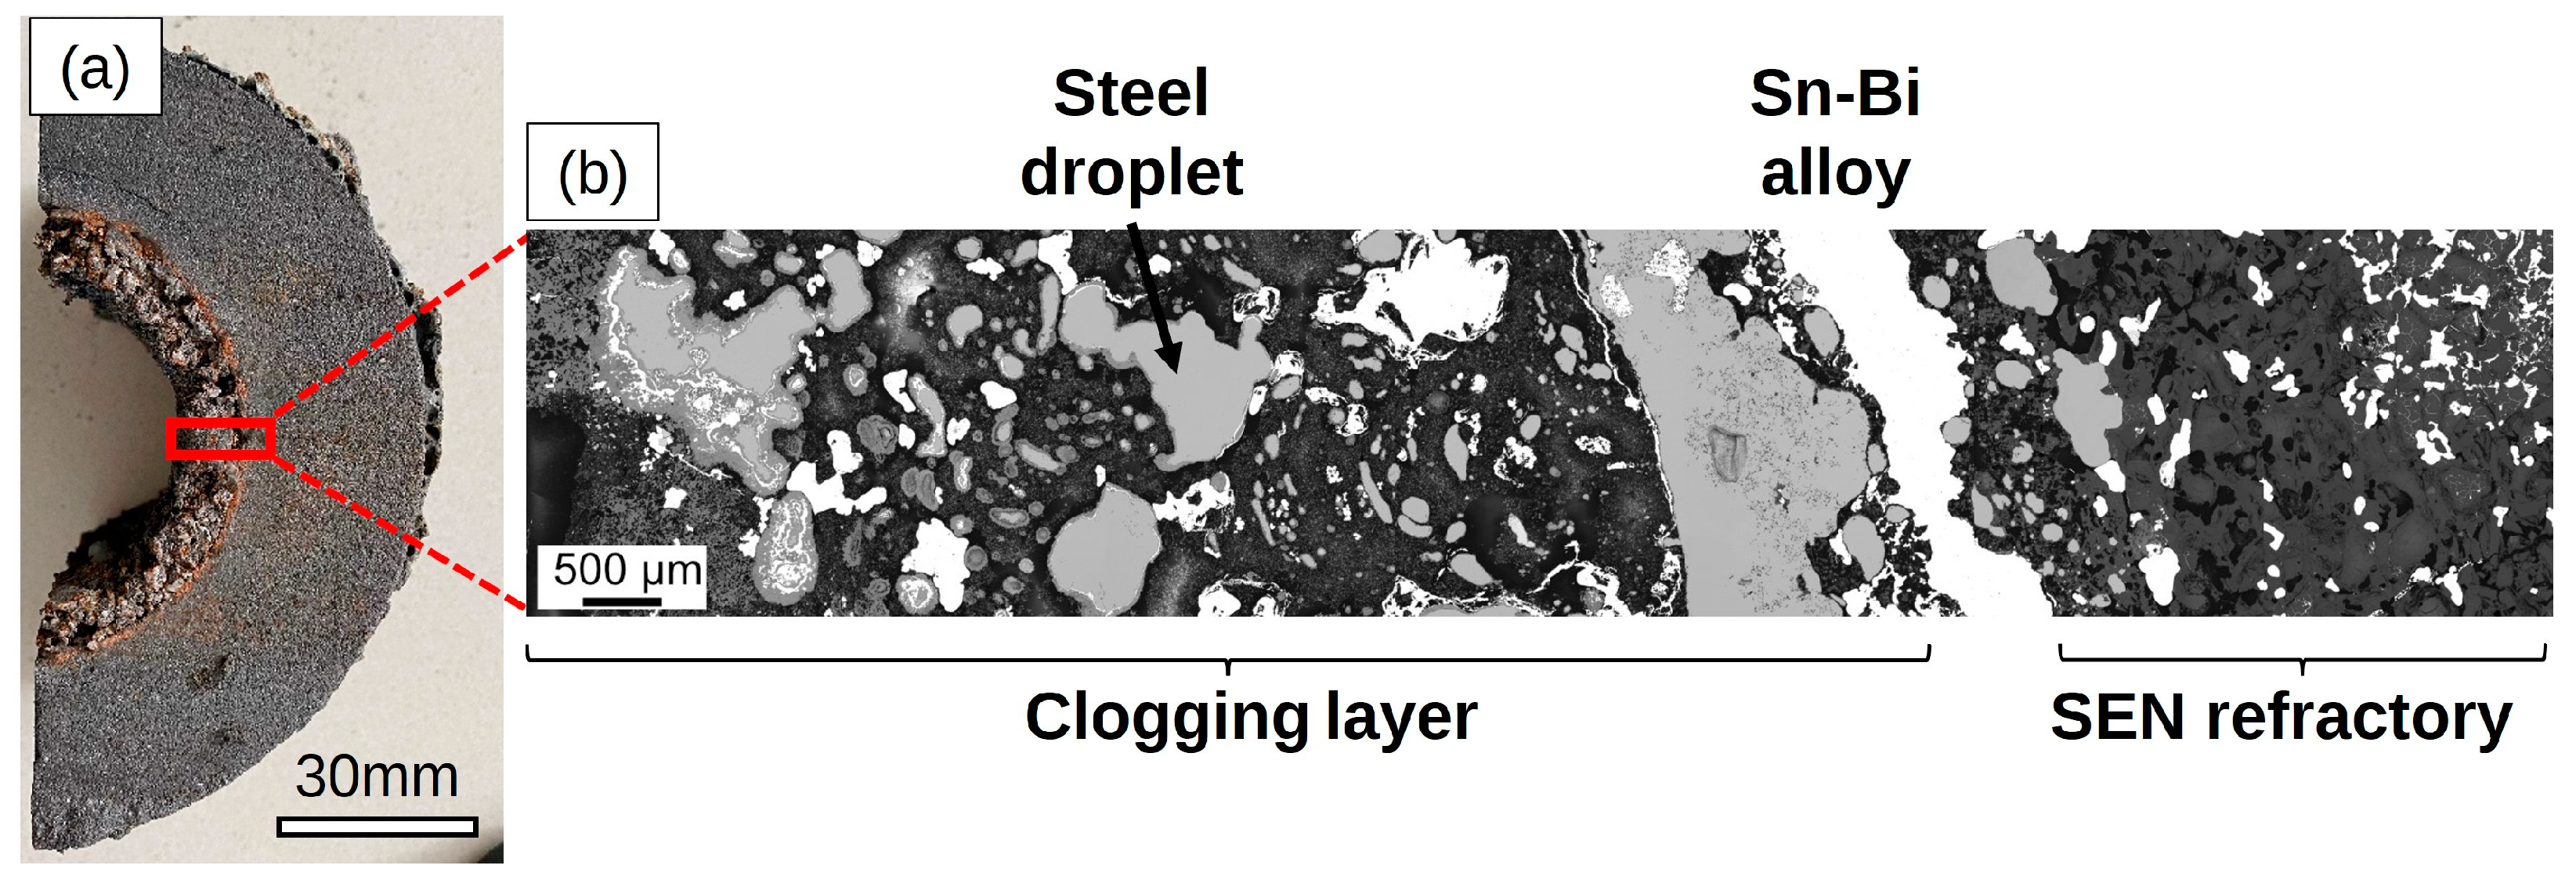
3.1.2. Clogging Layer Investigation

An SEM/EDS analysis of the clogging layer inside the first SEN was performed to find out if pre-existing, traced alumina inclusions influenced the layer formation. Besides the BSE image and the elemental mappings of the main elements, Al, Fe, and O, the detected concentrations of Ti, La, and Ce are illustrated in Figure 6. Concerning this diagram, the clogging layer can be divided into different parts that can be allocated to the three cast heats. The first part of the clogging layer from the standard heat consisted primarily of a large steel droplet, as seen in the elemental mappings. In the second section, associated with the La-traced heat, an irregular signal of La varying between w = 0.2 and 0.9% was detected. The La and Ce signal cannot be assigned to the pre-existing traced aluminum oxide particles with regard to the associated element allocation due to insufficient signal intensity. Similar to La, an irregular signal of Ce appeared in the third part of the clog. The signal of Ti over the whole clogging layer was below w = 0.2%, with no significant peak in the clogged material.

3.2. Passive Tracing

The REE concentration in the clogging layer was determined with ICP-MS after a LiBO2 digestion. The averaged mass fraction of the homogenized, digested clogging layer normalized to chondrites is shown as a thick, continuous blue line in Figure 7. Besides the resulting fingerprint of the clogging layer, the patterns of the main influencing auxiliaries, such as slags, casting powder, and Al granules, are illustrated. High mass fractions for La and Ce and a Tb anomaly were detected for the clogging layer. A similar increase in heavy REEs occurs for the patterns of the clogging layer and the sliding gate sand. The other auxiliaries’ patterns do not conform with the clogging layer, except for the Tb anomaly of the mold slag from the Ce-traced heat.
The REE fingerprint technique was moreover applied to determine the source of mesoscopic NMIs in steel samples from the traced melts. One NMI per melt was investigated via LA-ICP-MS. In Figure 8, the BSE image and the corresponding elemental mappings of the mesoscopic NMI (NMI 1) found in the La-traced melt cast through the first SEN are shown. NMI 1 is a conglomerate primarily consisting of Al-, Ca-, Na-oxides and smaller parts of Zr-, Ti- and La-oxides. The whole conglomerate is surrounded by CaS.
The detected concentrations are constant over the whole depth of the complex mesoscopic NMI. Figure 9 shows the REE patterns of NMI 1 and all investigated auxiliaries. An Er anomaly occurs in the patterns of NMI 1, the casting powder, and the mold slag. High La mass fractions were detected for NMI 1 and both slags due to the La addition. In the mesoscopic NMI 1 pattern, anomalies for Gd and Yb also occurred. No similarities can be seen between NMI 1 and the other auxiliaries, such as the covering agent, sliding gate sand, slag former, Al granules, and tundish slag of the La-traced heat. The chondrite-normalized mass fraction of the investigated Al granules is significantly lower than those of the slags, the casting powder, and the inclusion. A similarly formed peak for the Er anomaly of the mold slag and mesoscopic NMI 1 can be seen. The Er anomaly is also visible in the casting powder, but with lower intensity.
The second investigated mesoscopic inclusion (NMI 2) is taken from the first Ce-traced heat. The BSE image and the corresponding elemental mappings are illustrated in Figure 10. Similar to NMI 1, this inclusion is a conglomerate consisting of Al-, Ca-, and Na-oxides, with small parts of Zr- and Ti-oxides. Traces of Ce were also detected in conjunction with O and S via manual SEM/EDS analysis.
The REE patterns of NMI 2 and those of the auxiliaries that are the main potential contributors for the formation of NMI 2 (casting powder, Al granules, and both slags of the third heat) are plotted in Figure 11 for better visibility. A coherence can be seen between the patterns of the mold slag and NMI 2. Both lines have high mass fractions of La and Ce as well as Eu, Tb, and Er anomalies. The resulting REE fingerprint of the casting powder also shows Eu and Er anomalies similar to the mold slag and NMI 2. The tundish slag’s and Al granules’ patterns show no similarity to the other patterns.

4. Discussion

4.1. Modification of NMIs Using REEs

The aim of applying the active tracing approach to the production of Ti-stabilized IF steels was to determine if an agglomeration of pre-existing alumina inclusions was involved in the clogging layer formation, or if reoxidation and thus newly formed NMIs occurred due to the FeTi addition and subsequently played a role in clogging. The deoxidation products were successfully traced via La or Ce, as was shown in Figure 5 with the example of the Ce-treated heat. Regarding the automated SEM/EDS analysis of the taken samples, it was found that only about 50% of all Al-containing NMIs were marked by REEs. This suggests that the sampling after REE treatment was too fast, and there was too little interaction time between the REEs and the melt. Furthermore, new inclusions occurred after the addition of the REEs.
After RH treatment, fewer inclusions were detected in the automated SEM/EDS analysis due to inclusion separation into the slag. The sample taken after RH treatment consisted primarily of Al- and Ti-containing (AT)-oxides and oxide-sulfides. The tracing rates for FeTi-modified deoxidation products were 30.79% and 50% for oxides and sulfides, respectively. Since already a high number of detected Al2O3 NMIs were not marked in the previous sample, it is difficult to determine if the high number of untraced new deoxidation products is due to previous low tracing rates or if inclusions were newly formed after FeTi addition.
After RH treatment, the number of NMIs was reduced further, as the results of the automated SEM/EDS analysis of the tundish sample showed. The inclusion types remained the same as after RH treatment. Concerning the automated SEM/EDS analysis, untraced and traced AT-NMIs occurred simultaneously, leading to the conclusion that, on the one hand, FeTi likely modified pre-existing alumina particles; and, on the other hand, new, smaller NMIs were formed after FeTi addition.
Although active tracing seems to be an easy way to mark and track NMIs over the steelmaking process, this method is also connected to some difficulties since REEs partially reduce pre-existing NMIs. The degree of the reduction depends on the interaction time between the NMIs and REEs. Two potential challenges occur during processing with REEs. While a too-long interaction time leads to a complete reduction of the NMIs to be traced, sampling directly after REE addition results in the problem that not all particles are marked in this stage, as seen with the example of the Ce-traced melt. Furthermore, the examination using automated SEM/EDS analyses of samples containing REE-traced NMIs takes longer due to the required double threshold scan and the subsequent recombination. Last but not least, the wetting and separation behavior of NMIs is influenced by the active tracing technique since the inclusions are modified. Hence, a new tracing approach is demanded.

4.2. Clogging Layer Investigation

The clogging layer was investigated twice. In the first step, it was analyzed via SEM/EDS, and then LA-ICP-MS was used to determine the REE pattern for the fingerprint approach. During SEM/EDS analysis, only a few La- and Ce-traced alumina particles were found in parts of the examined clogging layer. Thus, it can be assumed that pre-existing Al2O3 NMIs were involved in the formation of the clogging layer in the SEN. Due to the detection of La and Ce, it is possible to divide the clogged material into three sections for each cast heat through this SEN. The La and Ce signals varied in a low range for amounts between w = 0.2 and 0.9%. The Ti concentration was below w = 0.2% over the whole clogging layer. Hence, in the investigated section of the clog, no Ti-modified Al-NMIs were found. Since only traces of La and Ce were detected with SEM/EDS in the clogging layer, the REE fingerprint approach was applied to confirm the influence of pre-existing deoxidation products on the clogging layer formation.
By using the passive tracing technique, a similar increase in heavy REEs could be observed for the sliding gate sand and the clogging layer. Due to this resemblance, it can be concluded that the sliding gate sand influenced the formation of the clogged SEN. The Al granules showed only low REE concentrations, leading to low mass fractions, which is why a comparison with the resulting pattern is not reasonable. The Tb anomaly that was observed for the clogging layer and the mold slag from the Ce-traced heat was presumably an interference caused by the very high Ce contents. One problem of the REE fingerprint approach concerning the clogging layer is that the signal was averaged. A promising method for more targeted investigations of inhomogeneous materials, such as the clogging layer, would be a spatially resolved analysis of specific parts instead of homogenizing and averaging the detected signal, since the REE concentration varied over the clogging layer. However, dividing the layer into the respective sections and the subsequent spatially resolved analysis is difficult. Further studies to improve the measuring method are required.
While both tracing methods are suitable for the determination of the actual source, they do not provide definitive insights into the underlying mechanism responsible for clogging layer formation. As mentioned in the introduction, the four main mechanisms behind the clogging phenomenon during continuous casting of Ti-stabilized ULC steels coincide in most cases. The FeTi addition is a critical factor for the occurrence of clogging during continuous casting since it influences interfacial tension [37] and further delivers additional oxygen to the melt, leading to the formation of new smaller NMIs [38]. The detection of Ce and La in the SEM/EDS analysis of the clogging layer leads to the conclusion that pre-existing alumina inclusions agglomerated to the nozzle wall, which is one of the most common mechanisms.

4.3. Origin of Mesoscopic NMIs

The SEM/EDS analysis of the mesoscopic NMIs (NMI 1 and 2) led to the result that both particles were conglomerates consisting of different oxides. Al-, Ca-, and Na-oxides were the main oxides in both investigated heterogeneous NMIs. Small parts of Zr-, Ti-, and La-oxides were irregularly distributed in the particles. Due to the high concentration of Ca and Na, as well as the detection of F in the SEM/EDS analysis, the casting powder was identified as one possible source, despite the absence of Si, a major component, in this auxiliary. Applying the REE fingerprint method should clarify if the mesoscopic NMIs originate from the casting powder or if they have another source. Based on the chemical composition of the NMIs, other auxiliaries that may have influenced the inclusions’ formation were determined. Similarities between the mold slag and the casting powder occurred in the case of NMI 1 (traced with La). Hence, the main source of the mesoscopic NMIs is likely the casting powder, as was expected after the SEM/EDS analysis, since mold slag is primarily molten casting powder. Although small parts of ZrO2 were detected during our SEM/EDS analysis, no similarity occurred between the sliding gate sand and the investigated NMIs. Another possible source for ZrO2 is an absorption of refractory into the mold slag from the slag zone of the SEN. The presence of ZrO2 in the mold slag strengthens the assumption that the mold slag is the source of NMI 1. The intensity of the Er anomaly increased more in the REE patterns of the mold slag and the NMIs compared to the sliding gate sand. The Gd and Yb anomalies visible in the pattern of NMI 1 most likely resulted from interferences of 139LaOH+ and 139LaO2+ on 156Gd and 172Yb, respectively, occurring due to oxide ion formation in the plasma. The high values for the La mass fraction of NMI 1, tundish, and mold slag are non-natural La concentrations and resulted from the active tracing approach. As a consequence of the La-traced alumina parts occurring in the EDS analysis of NMI 1, the Al granules also influenced the inclusion formation. However, similar to the clogging layer investigation, the REE concentrations in the Al granules being significantly lower than in the other investigated materials made the comparison with the other resulting REE patterns impossible. Thus, the REE fingerprint technique cannot confirm the assumption of the Al influence on the conglomerate after SEM/EDS analysis.
Concerning the manual SEM/EDS analysis, the mesoscopic inclusion of the Ce-traced heat, NMI 2, had origins similar to NMI 1. The resulting elemental pattern after the REE fingerprint investigation differed regarding the occurring anomalies from NMI 1. The pattern of mold slag from the third Ce-traced heat is almost identical to the pattern of NMI 2. Both lines showed anomalies for Eu, Tb, and Er in a similar intensity. In addition to the different intensities for the Eu and Er anomalies, the REE fingerprint differs regarding the higher concentrations for La and Ce and the occurring Tb anomaly. The reason for the significantly higher mass fraction of La and Ce in the mold slag is its contact with the traced melts and carryover slag from the tundish. The Tb anomaly occurred at the clogging layer and NMI 2, but not at NMI 1. Hence, the detected Tb signal seemed to be due to an interference between 159Tb+ and 142CeOH+. The source of the Ce-traced mesoscopic NMI 2 is similar to that of NMI 1, the mold slag, and thus the casting powder.

5. Conclusions

Active and passive tracing approaches were applied to study the clogging layer formation during the industrial production of Ti-stabilized ULC steels and to further identify the source of mesoscopic NMIs. The following findings were obtained from this study:
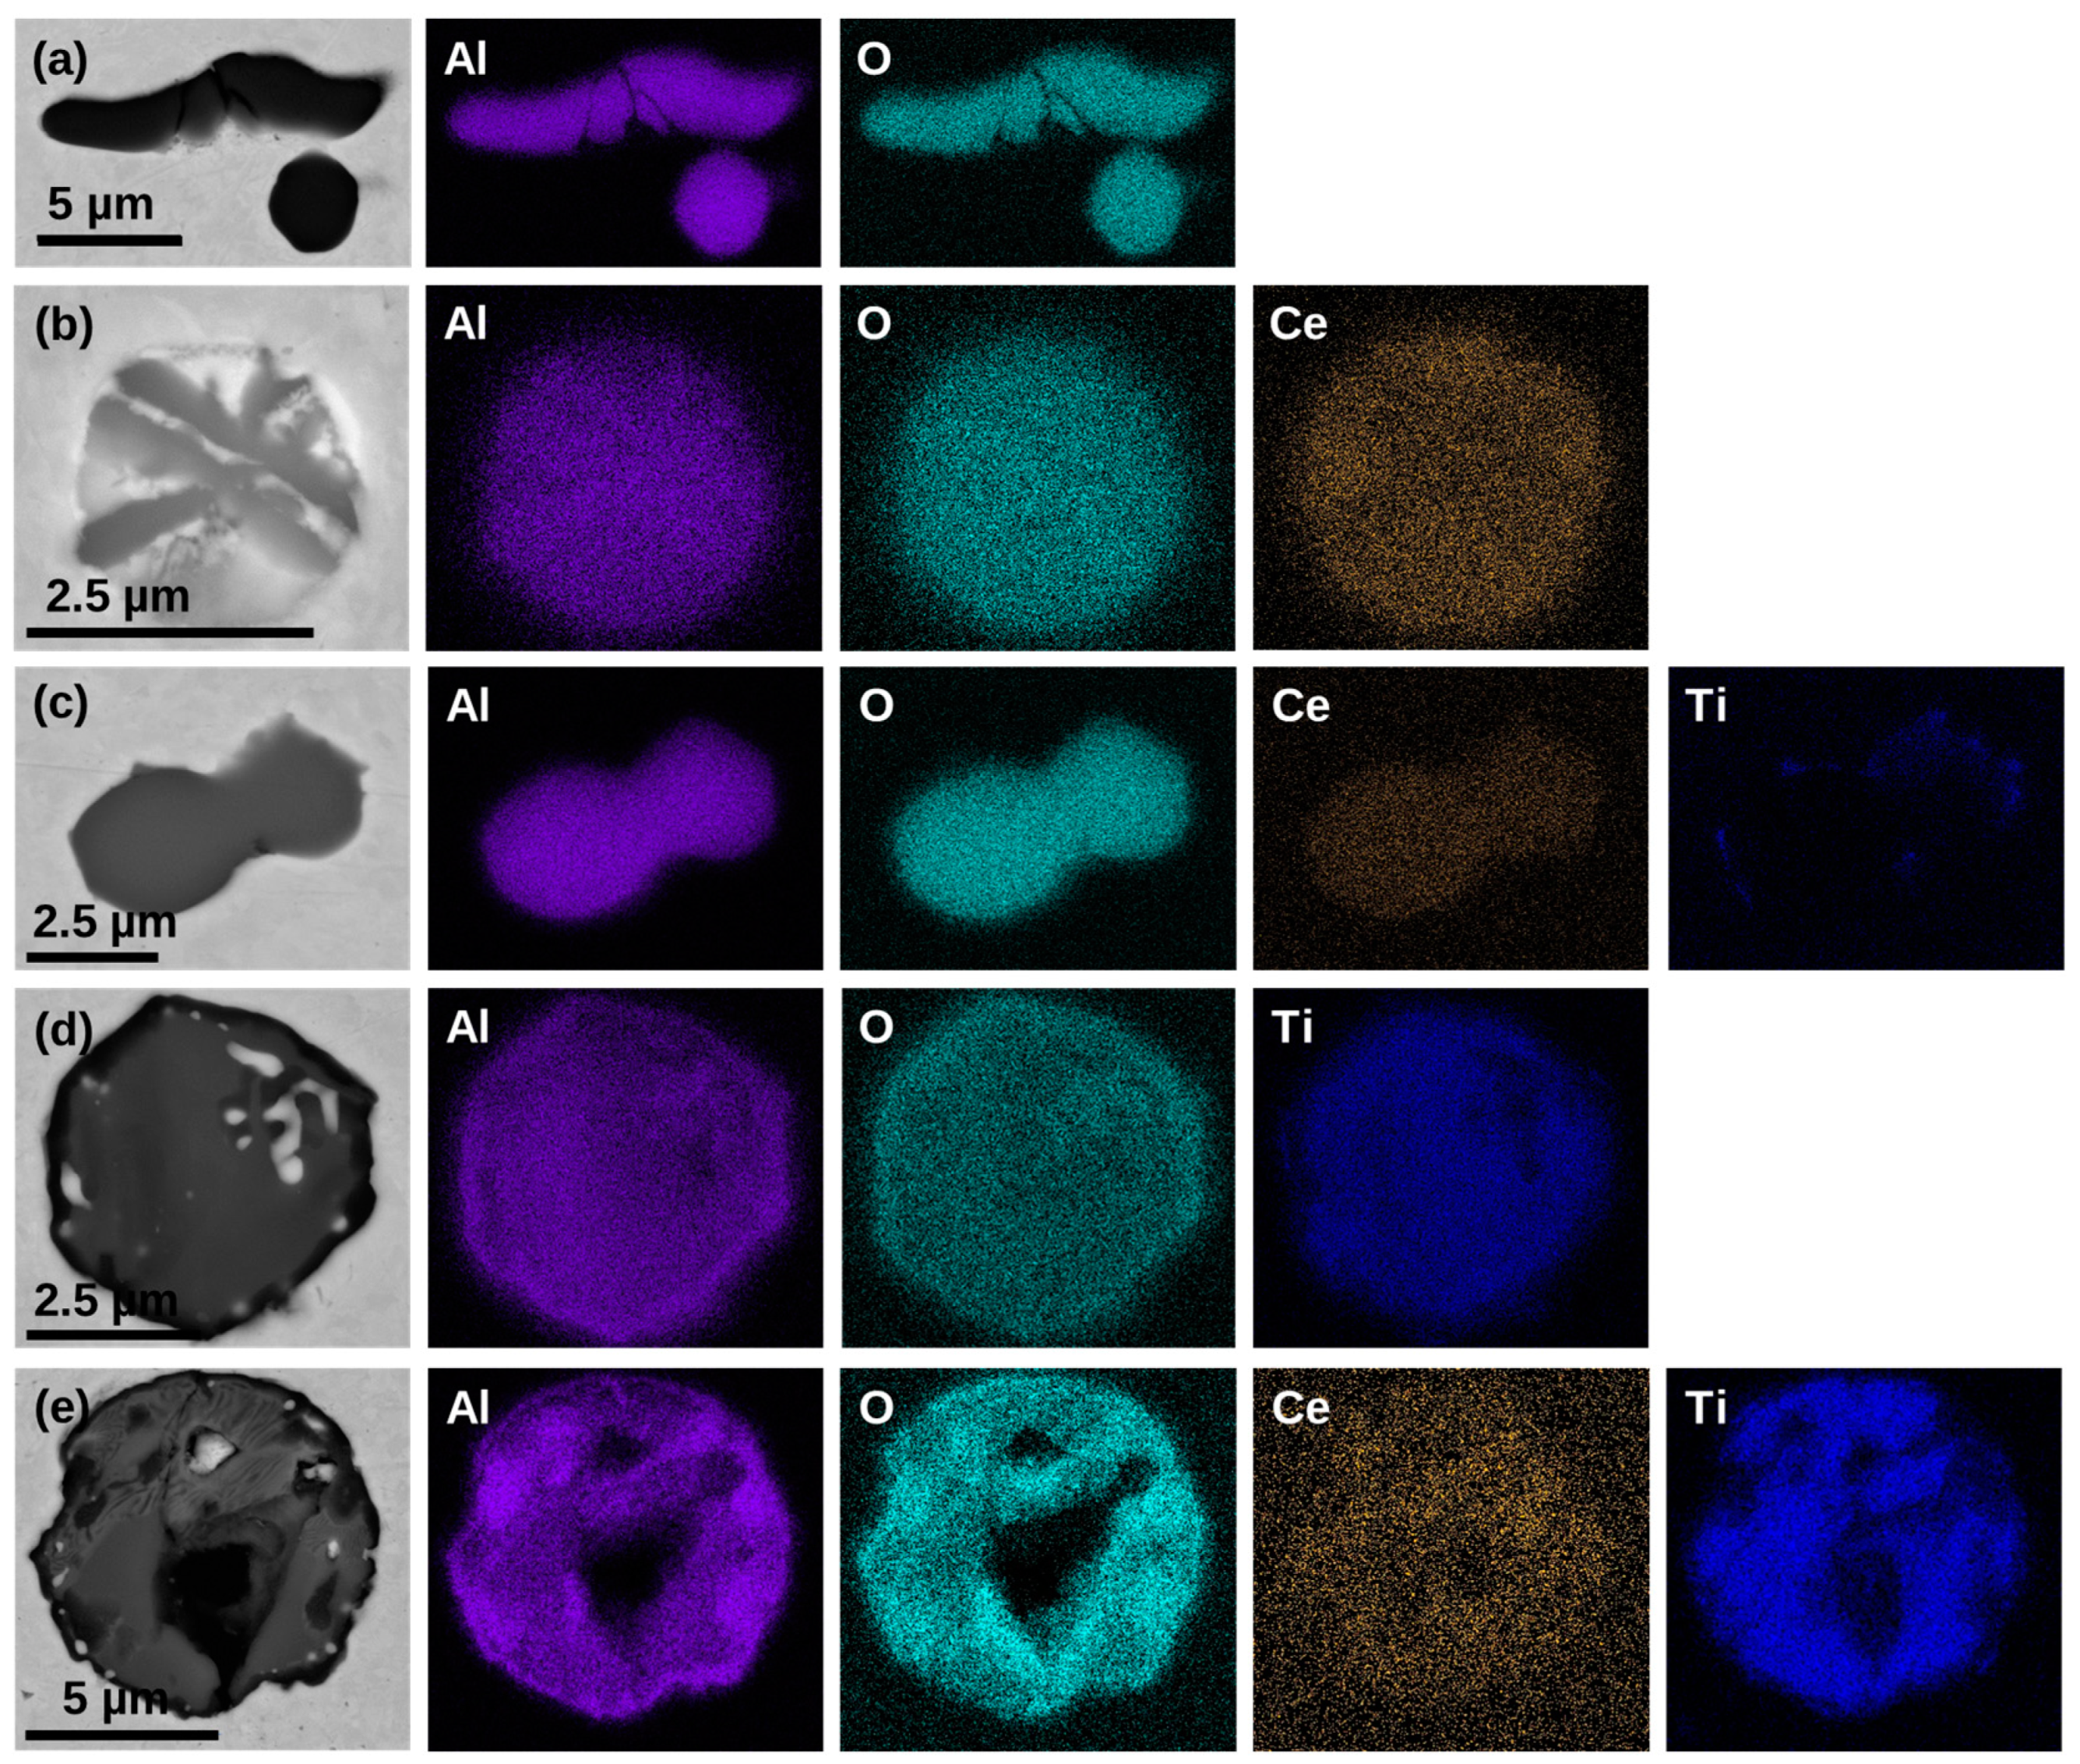
  • For the active tracing method, La and Ce were directly alloyed subsequent to Al deoxidation to trace the formed alumina NMIs. The experiment was applied to the production of Ti-stabilized ULC steel on an industrial scale. The micro-cleanness evaluation over this process showed a modification of the formed alumina inclusions after deoxidation to La- or Ce-traced and untraced Al- and Ti-containing oxides in the tundish sample. The occurrence of traced AT-NMIs confirms that alumina particles formed during the deoxidation process exist in the final sample, whereas untraced AT-NMIs led us to the conclusion that new small NMIs were formed after the FeTi addition.
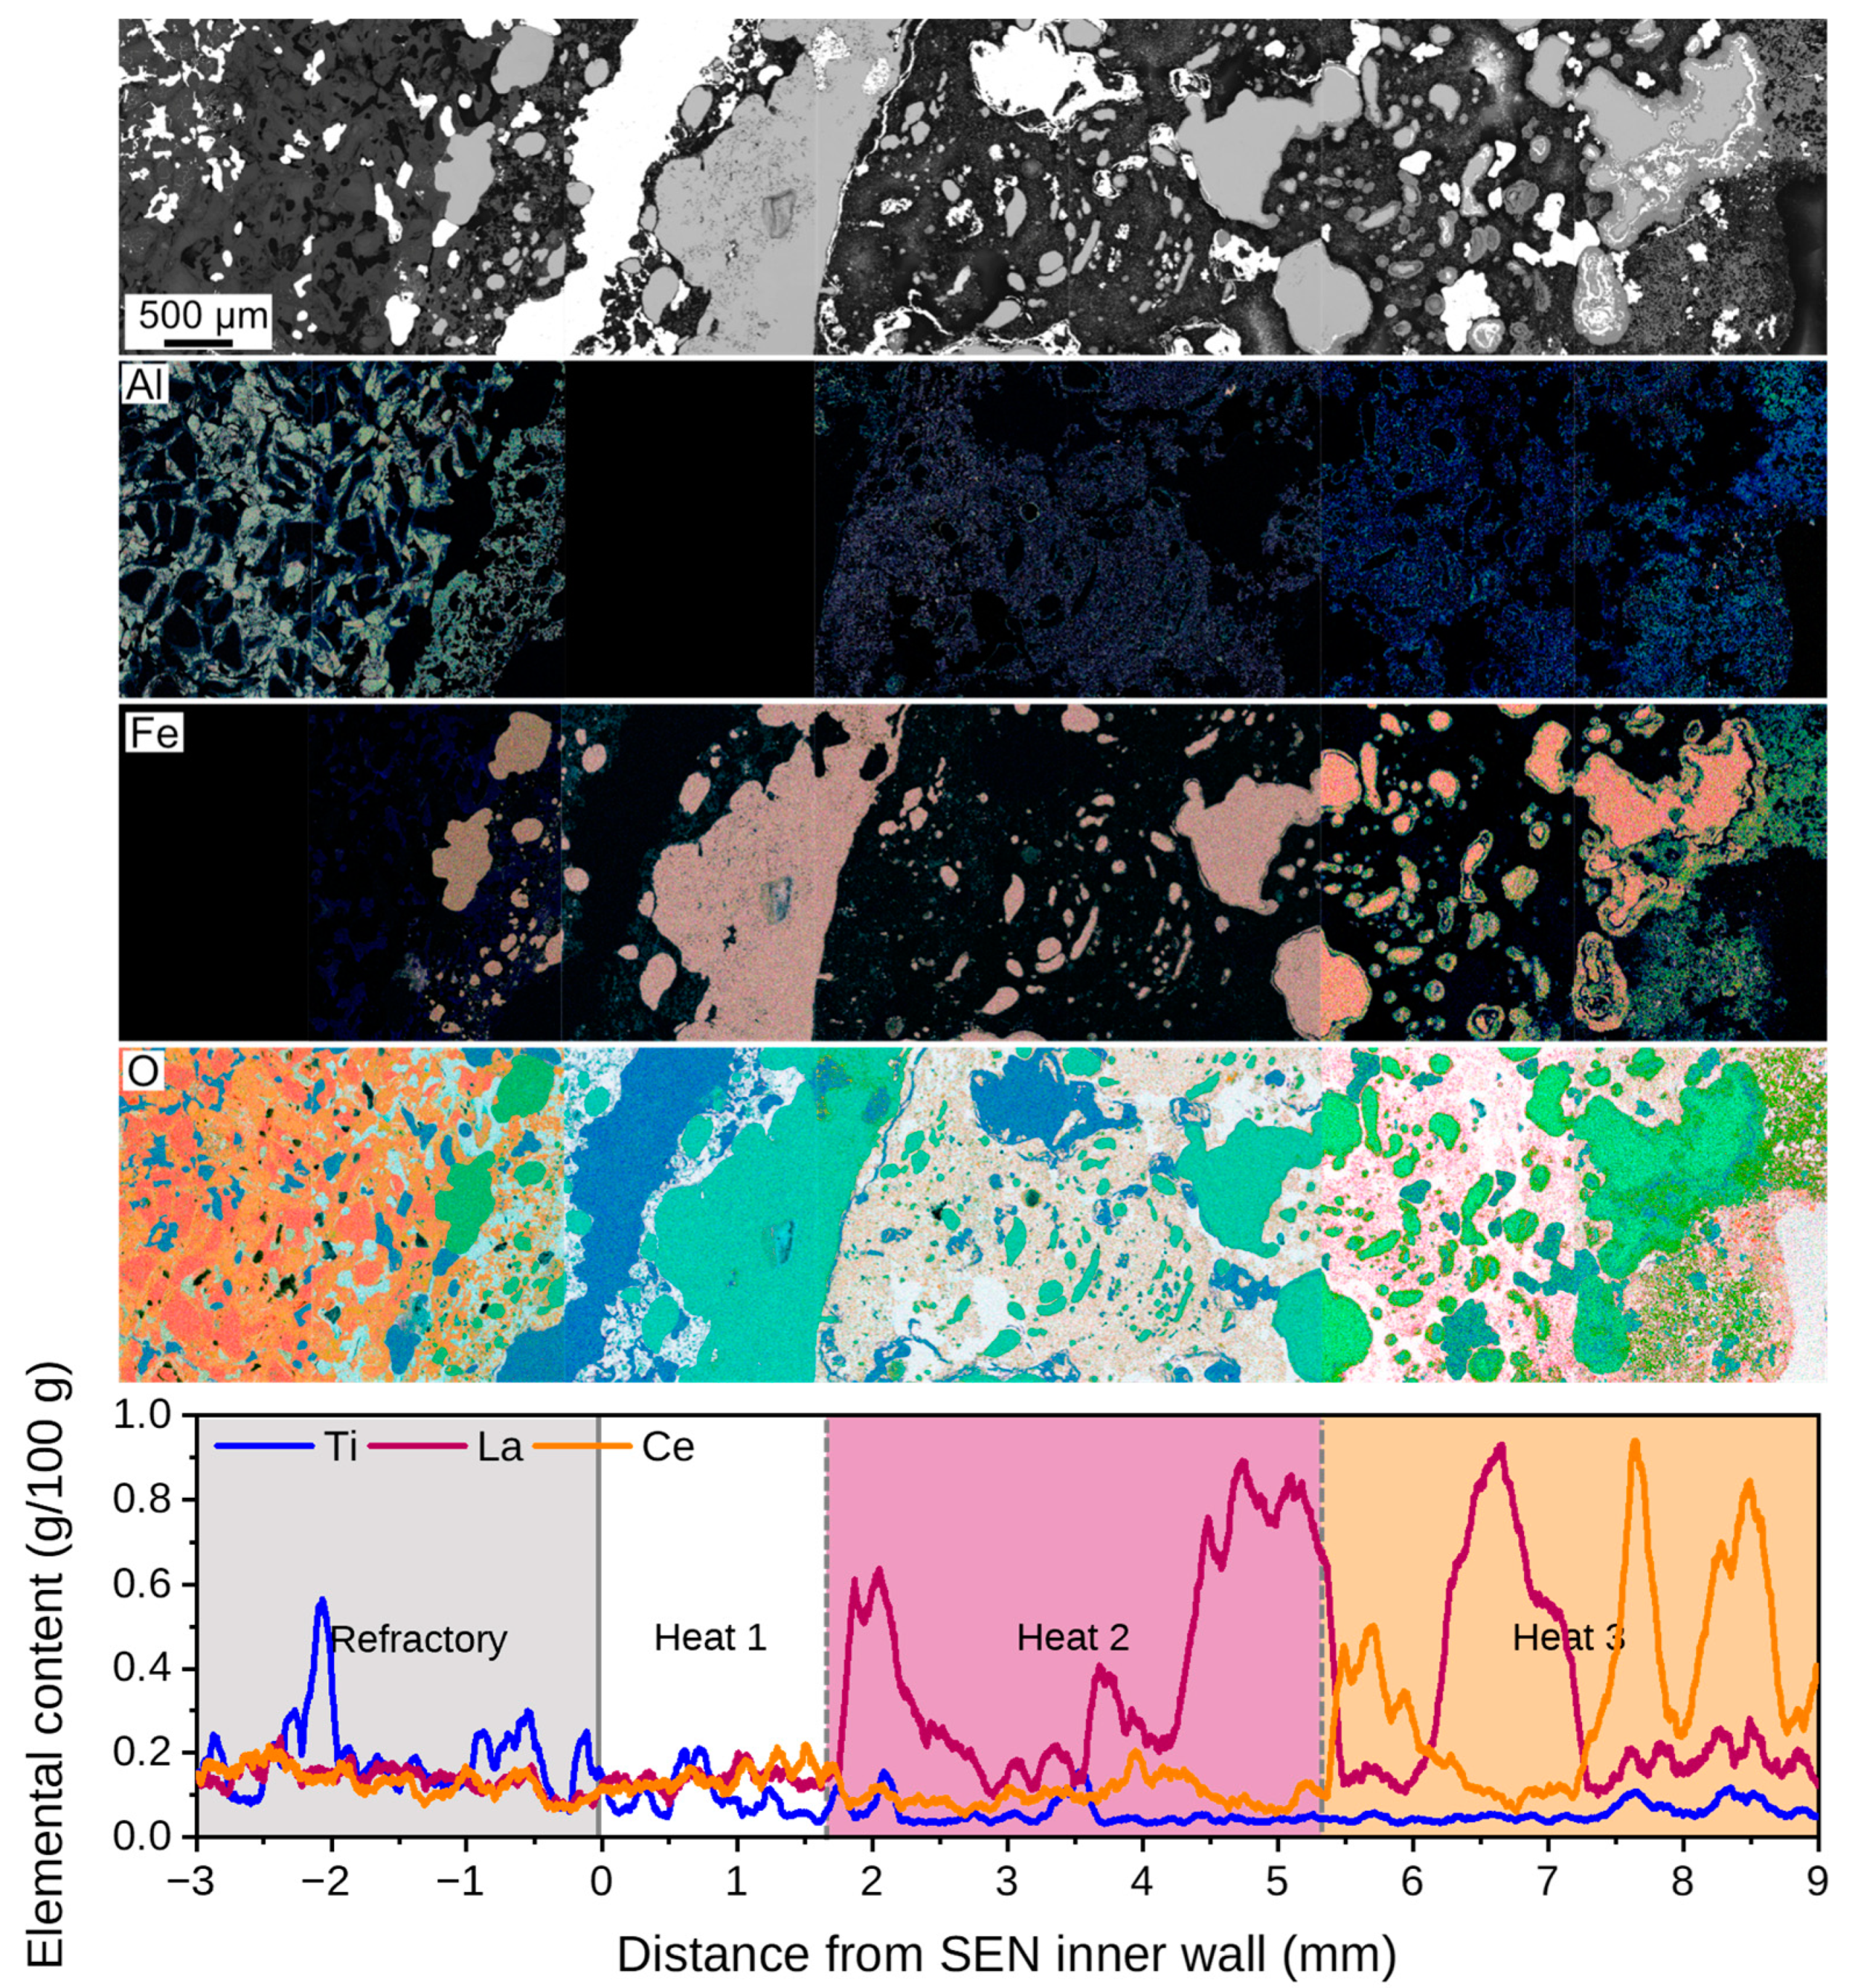
  • The elemental mappings of the SEM/EDS analysis from the clogging layer highlighted only small, traced alumina parts in the clog. The detected concentrations of La and Ce varied in a low range between w = 0.2 and 0.9%, making it possible to divide the clogging layer into three sections corresponding with the three cast heats. Due to the occurrence of traced NMIs in the clog, it can be concluded that pre-existing alumina particles were involved in the layer formation.
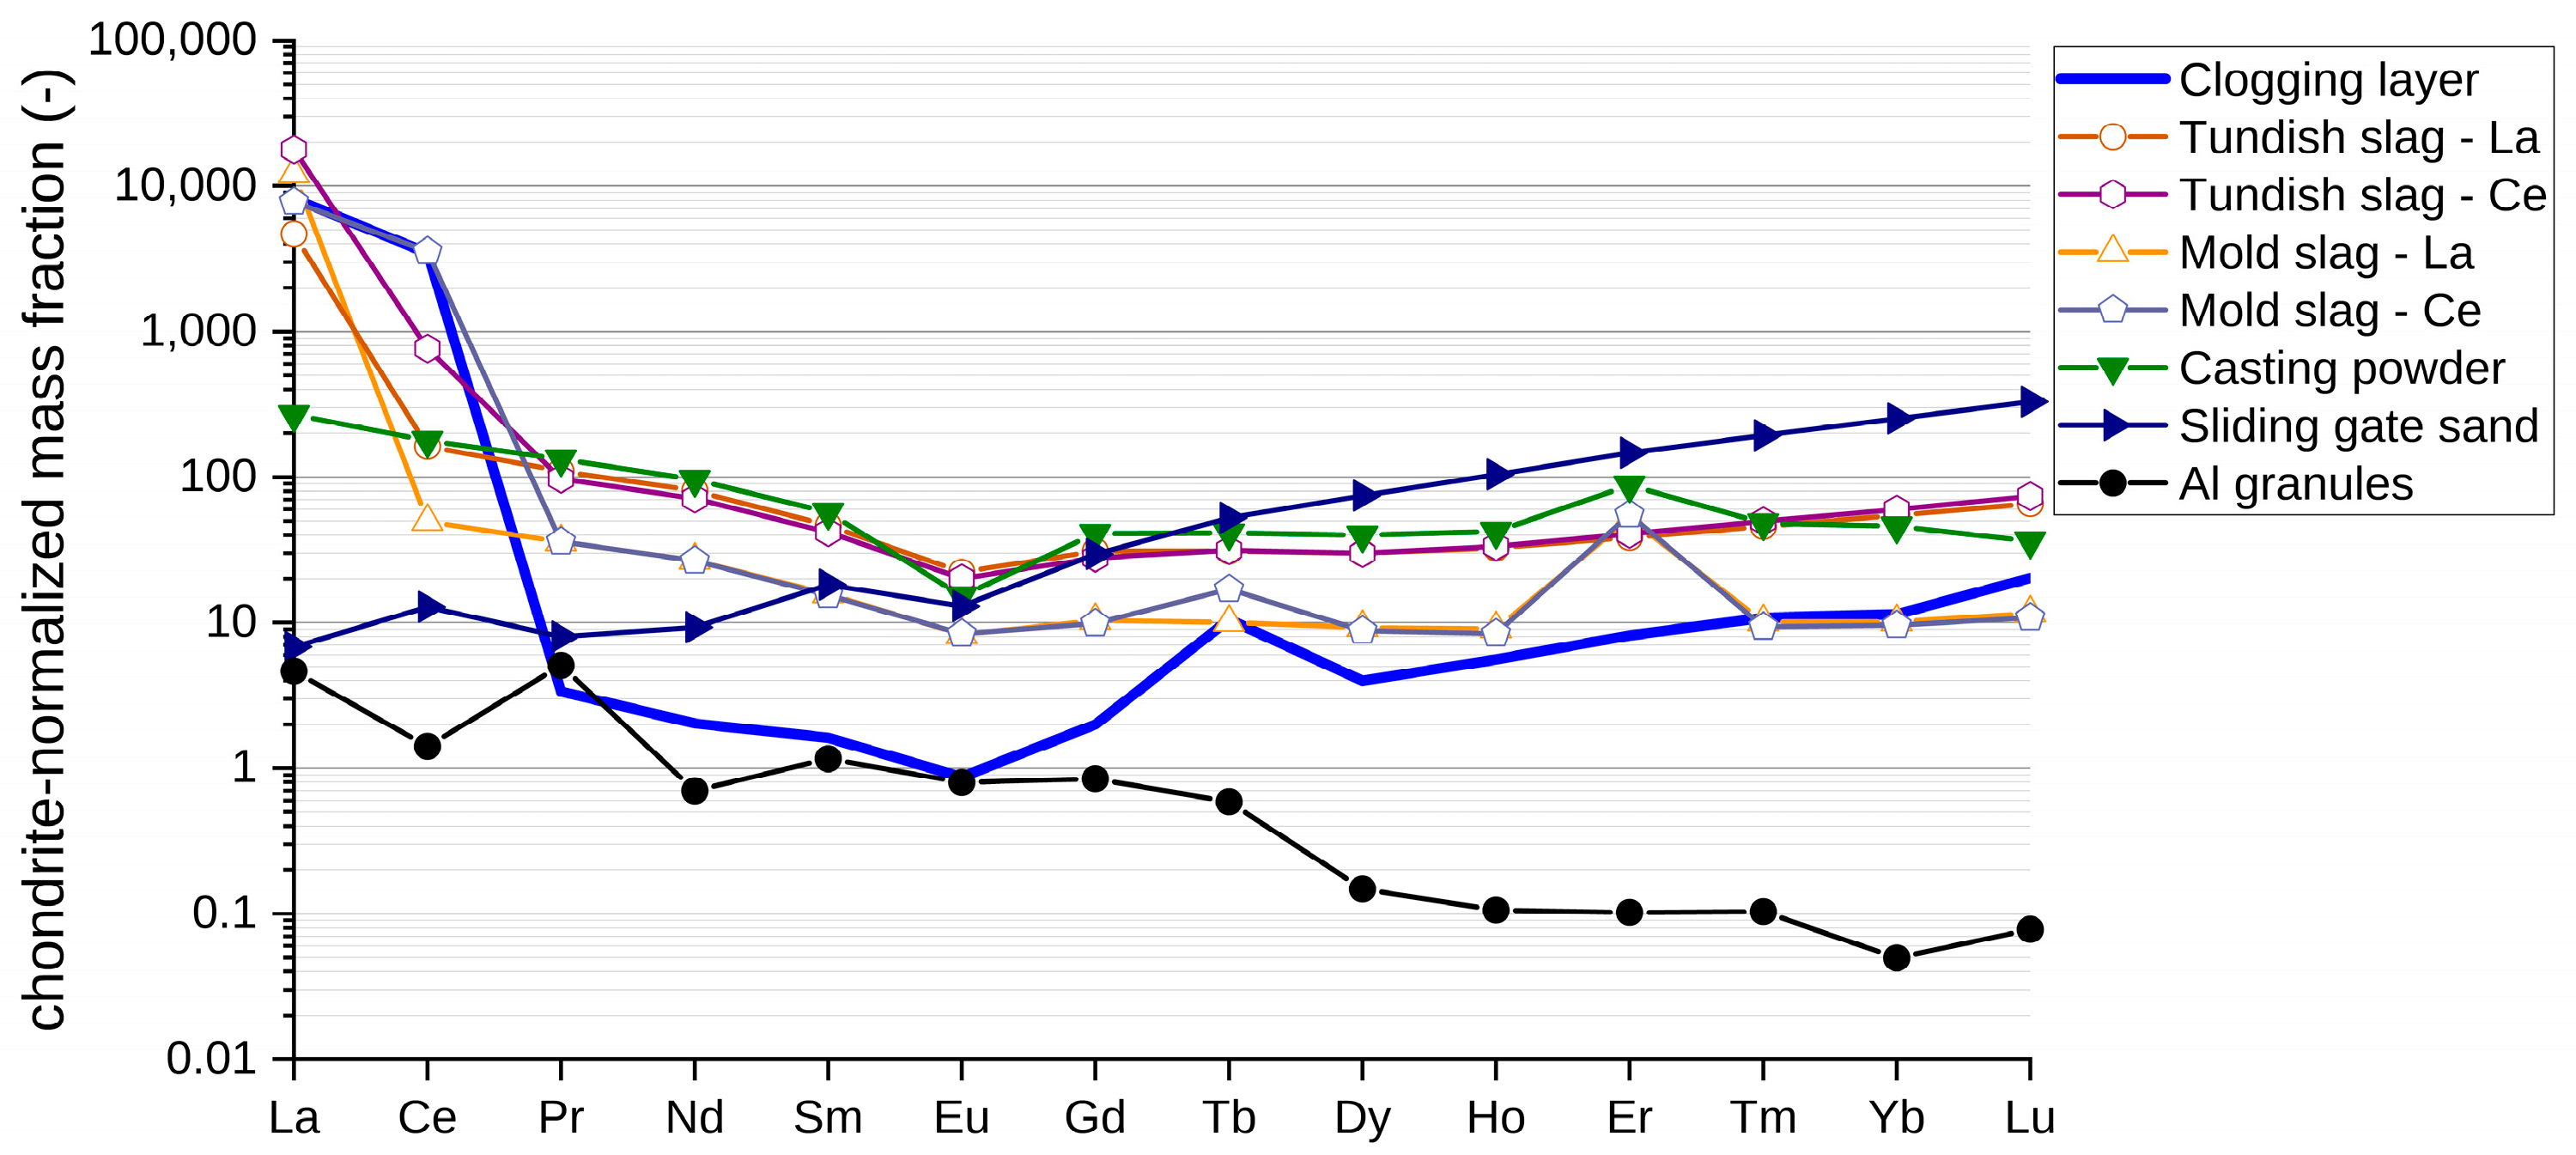
  • No similarities between the clog and the investigated Al granules were found during the additional investigation of the clogging layer using the passive tracing approach since the REE concentrations in the Al granules were too low. However, according to the REE fingerprint approach, the sliding gate sand influenced the formation of the clogging layer. The detailed reaction mechanism behind the impact of the sliding gate sand on clogging is not clarified. Hence, further studies need to be conducted to answer this issue.
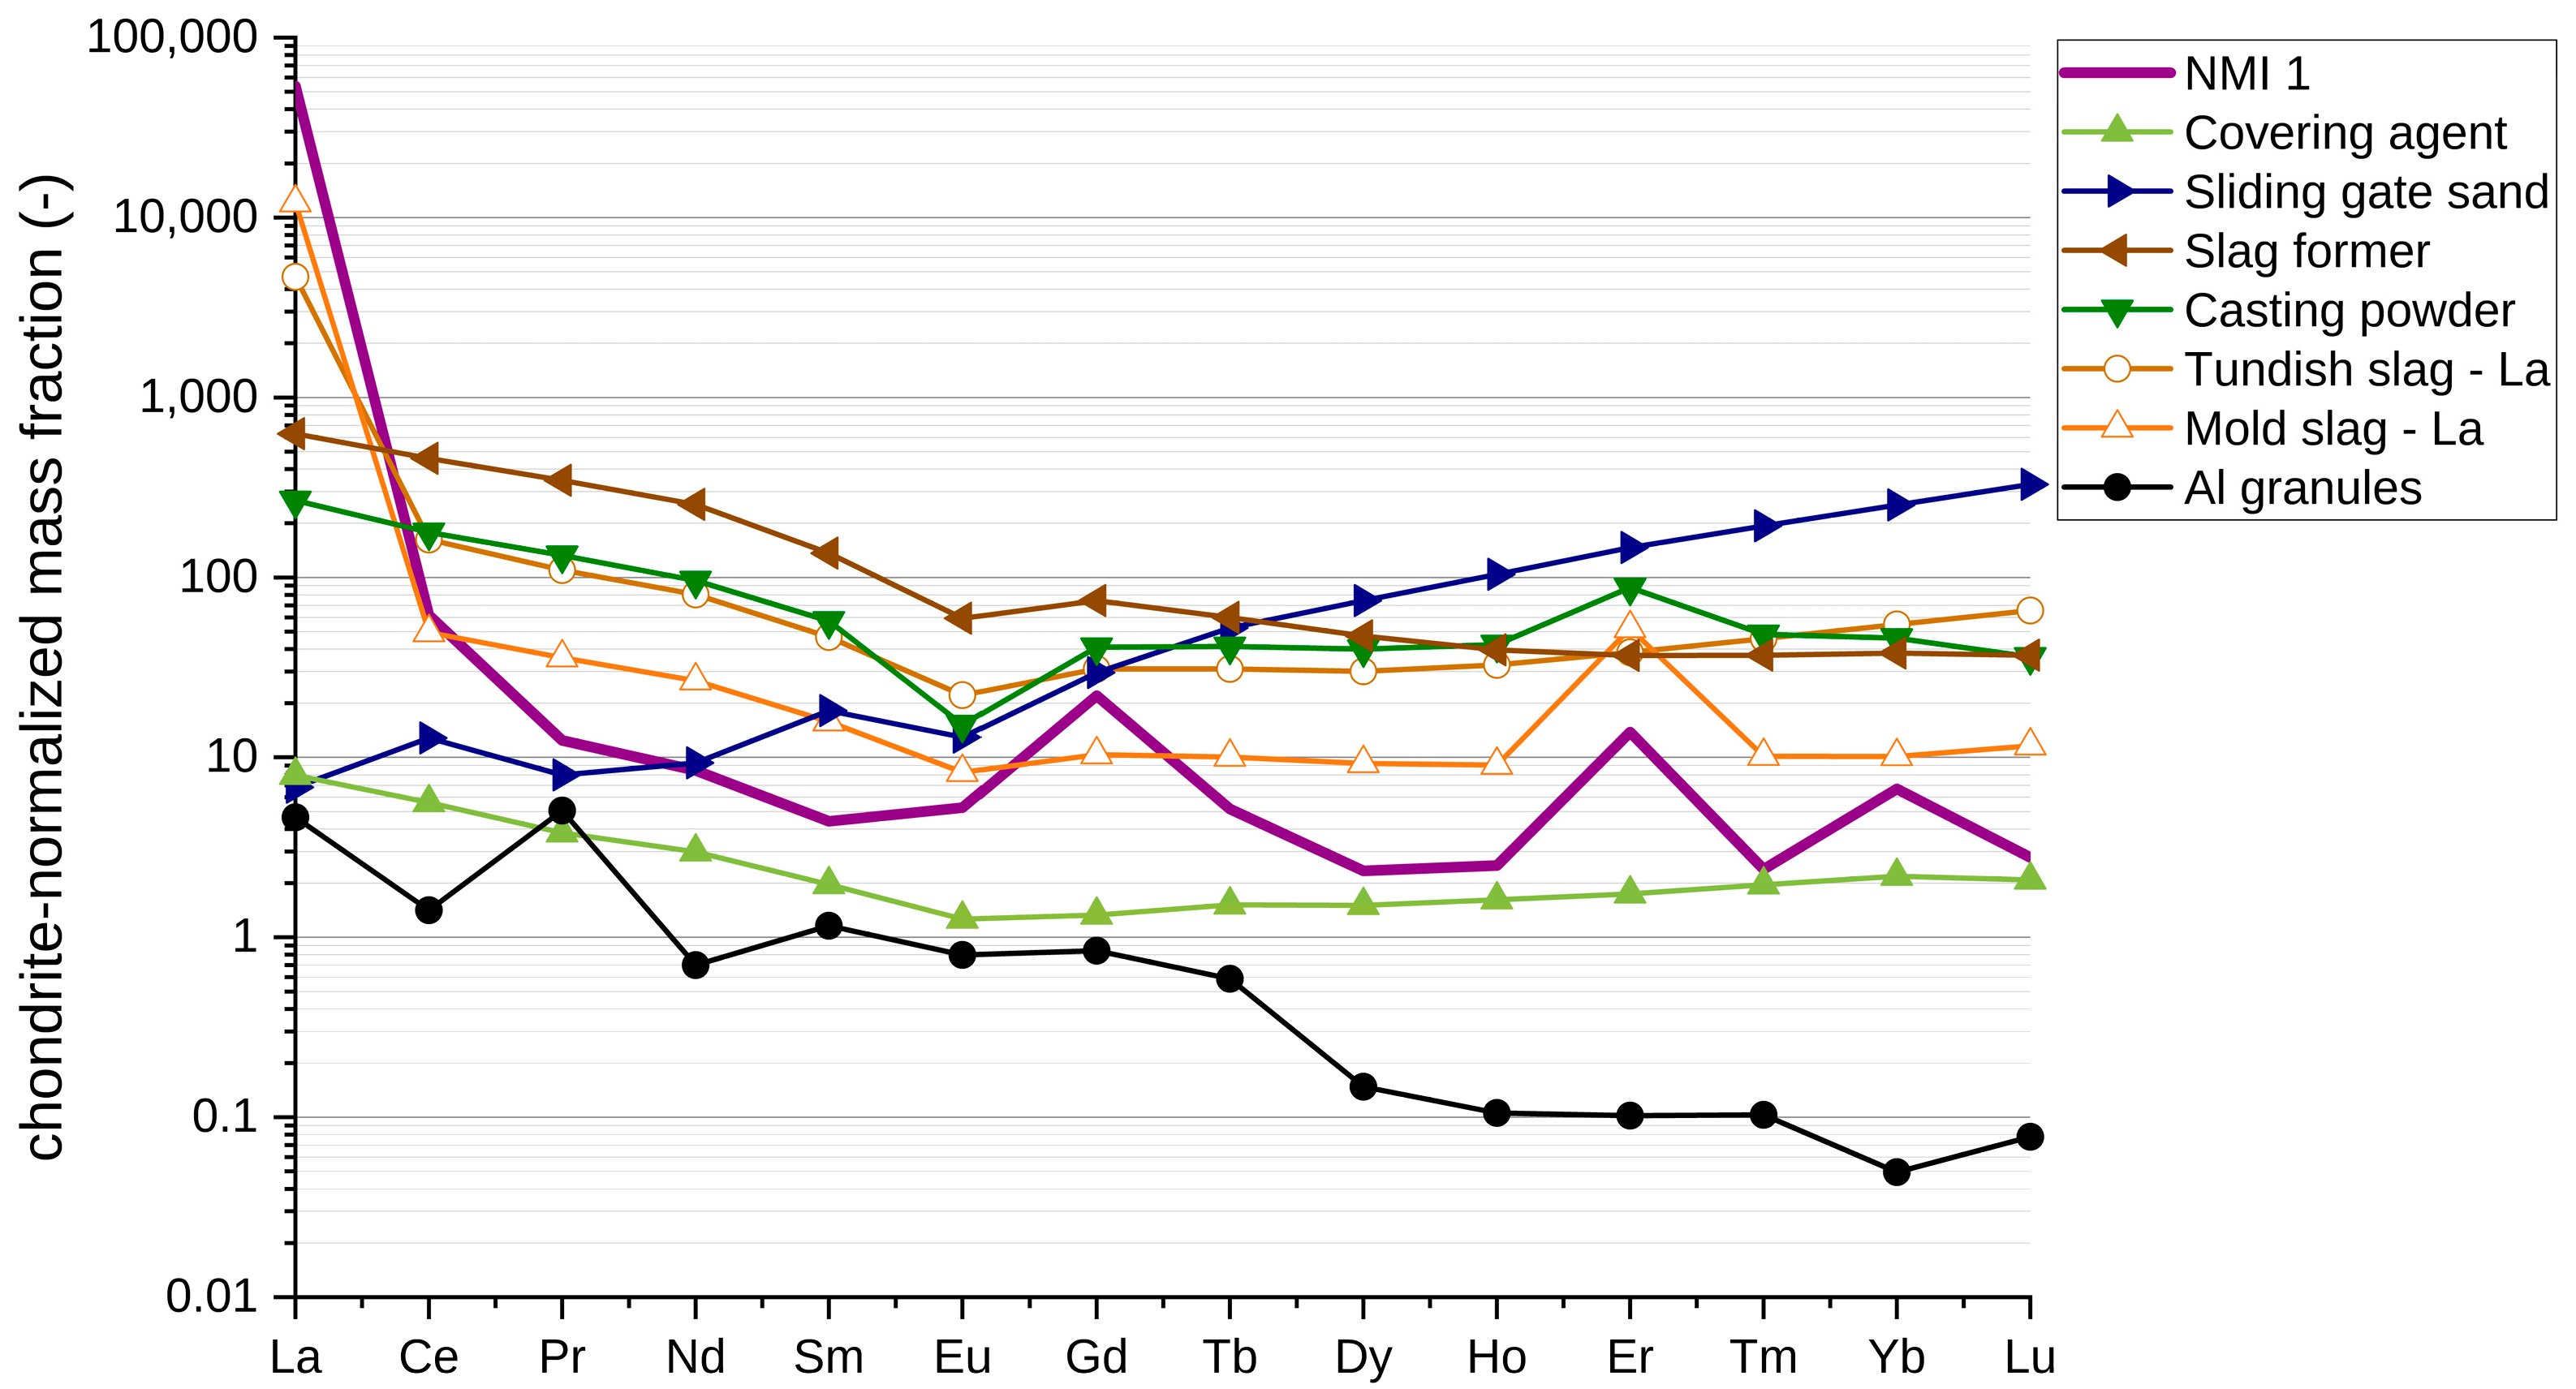
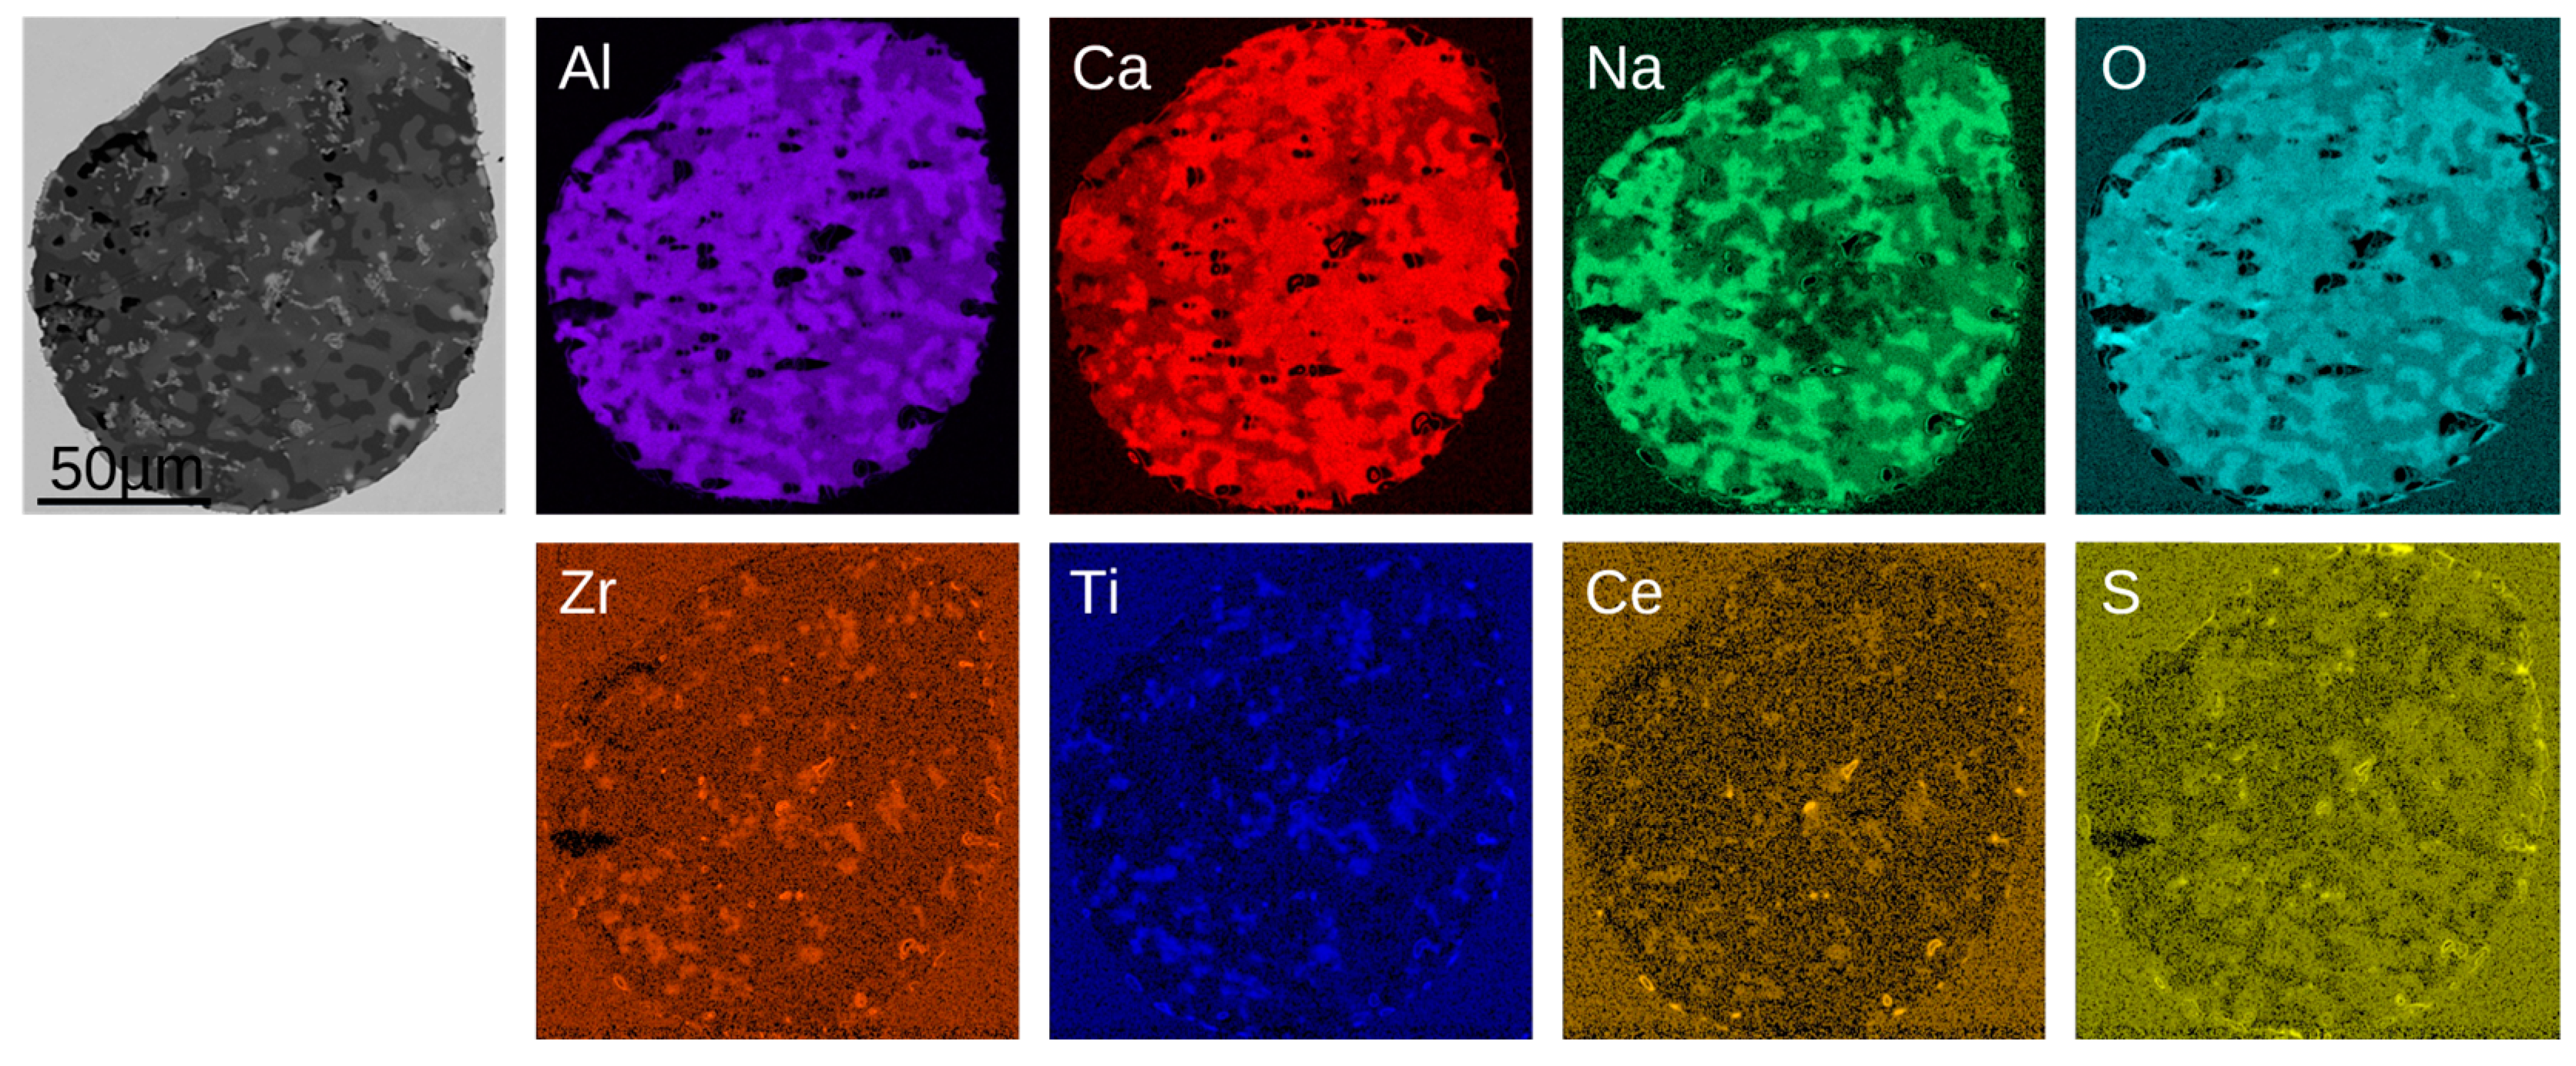
  • The two investigated mesoscopic NMIs of La- and Ce-traced heats were conglomerates primarily consisting of Al-, Ca-, and Na-oxides with traces of Zr-, Ti, and La/Ce-oxides. By applying the passive tracing technique, it was determined that the casting powder and the resulting mold slags, respectively, were the sources for both NMIs.
  • The REE fingerprint technique is a new approach for, e.g., identifying the source of NMIs and learning more about the origin of phenomena such as clogging during steel production. In contrast to the already-applied active tracing method, no additional element, which modifies the existing NMIs and influences their behaviors, is needed for training.

Author Contributions

Conceptualization, K.T.; methodology, K.T., C.T., R.R., S.I. and C.W.; validation, K.T., C.T. and C.W.; investigation, K.T., C.T., R.R., S.I. and C.W.; resources, K.T., R.R. and S.I.; data curation, K.T.; writing—original draft preparation, K.T. and C.T.; writing—review and editing, C.W., T.C.M. and S.K.M.; visualization, K.T.; supervision, S.K.M.; project administration, S.I., R.R. and S.K.M.; funding acquisition, S.K.M. All authors have read and agreed to the published version of the manuscript.

Funding

The financial support from the Austrian Federal Ministry for Labour and Economy; the National Foundation for Research, Technology and Development; the Christian Doppler Research Association; and voestalpine Stahl GmbH is gratefully acknowledged.

Data Availability Statement

The raw data supporting the conclusions of this article will be made available by the corresponding author on request.

Conflicts of Interest

The authors declare no conflict of interest.

References

  1. Kiessling, R. Clean steel—A debatable concept. Met. Sci. 1980, 14, 161–172. [Google Scholar] [CrossRef]
  2. Kaushik, P.; Pielet, H.; Yin, H. Inclusion characterisation—Tool for measurement of steel cleanliness and process control: Part 1. Ironmak. Steelmak. 2009, 36, 561–571. [Google Scholar] [CrossRef]
  3. Burty, M.; Louis, C.; Dunand, P.; Osmont, P.; Ruby-Meyer, F.; Nadif, M.; Penet, F.; Isono, T.; Takeuchi, E.; Toh, T. Methodology of steel cleanliness assessment. Rev. Metall. 2000, 97, 775–782. [Google Scholar] [CrossRef]
  4. Atkinson, H.V.; Shi, G. Characterization of inclusions in clean steels: A review including the statistics of extremes methods. Prog. Mater. Sci. 2003, 48, 457–520. [Google Scholar] [CrossRef]
  5. Thornton, P.A. The influence of non-metallic inclusions on the mechanical properties of steel: A review. J. Mater. Sci. 1971, 6, 347–356. [Google Scholar] [CrossRef]
  6. Park, J.H.; Kang, Y. Inclusions in Stainless Steels—A Review. Steel Res. Int. 2017, 88, 1700130. [Google Scholar] [CrossRef]
  7. Kaushik, P.; Kruse, D.; Ozgu, M. Assessment of castability issues in interstitial-free (IF) steels. Rev. Metall. 2008, 105, 92–101. [Google Scholar] [CrossRef]
  8. Jungreithmeier, A.; Pissenberger, E.; Burgstaller, K.; Mörtl, J. Production of ULC IF Steel Grades at Voestalpine Stahl GmbH, Linz. In Proceedings of the Iron & Steel Society International Technology Conference and Exposition, Indianapolis, IN, USA, 27–30 April 2003. [Google Scholar]
  9. Rackers, K.G.; Thomas, B.G. Clogging in Continuous Casting Nozzles. In Proceedings of the 78th Steelmaking Conference Proceedings, Iron and Steel Society, Warrendale, PA, USA, 2–5 April 1995; pp. 723–734. [Google Scholar]
  10. Cui, H.; Bao, Y.P.; Wang, M.; Wu, W. Clogging behavior of submerged entry nozzles for Ti-bearing IF steel. Int. J. Miner. Metall. Mater. 2010, 17, 154–158. [Google Scholar] [CrossRef]
  11. Michelic, S.K.; Bernhard, C. Significance of Non-metallic Inclusions for the Clogging Phenomenon in Continuous Casting of Steel––A Review. Steel Res. Int. 2022, 93, 2200086. [Google Scholar] [CrossRef]
  12. Singh, S.N. Mechanism of Alumina Buildup in Tundish Nozzle during Continuous Casting of Aluminium-Killed Steels. Metall. Mater. Trans. B 1974, 5, 2165–2178. [Google Scholar] [CrossRef]
  13. Nadif, M.; Lehmann, J.; Burty, M.; Domgin, J.-F. Control of steel reoxidation and CC nozzle clogging: An overview. Metall. Res. Technol. 2007, 104, 493–500. [Google Scholar] [CrossRef]
  14. Lee, J.-H.; Kang, M.-H.; Kim, S.-K.; Kim, J.; Kim, M.-S.; Kang, Y.-B. Influence of Al/Ti Ratio in Ti-ULC Steel and Refractory Components of Submerged Entry Nozzle on Formation of Clogging Deposits. ISIJ Int. 2019, 59, 749–758. [Google Scholar] [CrossRef]
  15. Zhao, B.; Wu, W.; Zhi, J.; Su, C.; Zhang, J. Study on the formation mechanism of clogging layer of rare earth microalloyed Q355 steel’s submerged entry nozzle and process optimization. Ironmak. Steelmak. 2023, 50, 782–793. [Google Scholar] [CrossRef]
  16. Liang, W.; Li, J.; Lu, B.; Zhi, J.; Zhang, S.; Liu, Y. Analysis on clogging of submerged entry nozzle in continuous casting of high strength steel with rare earth. J. Iron Steel Res. Int. 2022, 29, 34–43. [Google Scholar] [CrossRef]
  17. Burty, M.; Dunand, P.; Ritt, J.P.; Soulard, H.; Blanchard, A.; Jeanne, G.; Penet, F.; Pluquet, R.; Poissonnet, I. Control of DWI steel cleanness by lanthanum tracing of deoxidation inclusions, ladle slag treatment and a methodical approach. Ironmak. Conf. Proc. 1997, 56, 711–717. [Google Scholar]
  18. Wang, Y.; Li, C.; Wang, L.; Xiong, X.; Chen, L.; Zhuang, C. Modification of Alumina Inclusions in SWRS82B Steel by Adding Rare Earth Cerium. Metals 2020, 10, 1696. [Google Scholar] [CrossRef]
  19. Ren, Q.; Zhang, L. Effect of Cerium Content on Inclusions in an Ultra-Low-Carbon Aluminum-Killed Steel. Metall. Mater. Trans. B 2020, 51, 589–600. [Google Scholar] [CrossRef]
  20. Pan, C.; Hu, X.; Lin, P.; Chou, K. Evolution of Inclusions after Cerium and Titanium Addition in Aluminum Deoxidized Fe-17Cr-9Ni Austenitic Stainless Steel. ISIJ Int. 2020, 60, 1878–1885. [Google Scholar] [CrossRef]
  21. Li, B.; Zhu, H.; Zhao, J.; Song, M.; Li, J.; Xue, Z. Effect of Rare-Earth La on Inclusion Evolution in High-Al Steel. Steel Res. Int. 2021, 93, 2100347. [Google Scholar] [CrossRef]
  22. Goldstein, J.I.; Newbury, D.E.; Michael, J.R.; Ritchie, N.W.; Scott, J.H.J.; Joy, D.C. Scanning Electron Microscopy and X-ray Microanalysis; Springer: New York, NY, USA, 2018; ISBN 978-1-4939-6674-5. [Google Scholar]
  23. Wang, Y.; Liu, C. Agglomeration Characteristics of Various Oxide Inclusions in Molten Steel Containing Rare Earth Element under Different Deoxidation Conditions. ISIJ Int. 2021, 61, 1396–1403. [Google Scholar] [CrossRef]
  24. Zhang, L.; Cheng, L.; Ren, Y.; Zhang, J. Effect of cerium on the wettability between 304 stainless steel and MgO–Al2O3-based lining refractory. Ceram. Int. 2020, 46, 15674–15685. [Google Scholar] [CrossRef]
  25. Wang, H.; Bao, Y.; Zhao, M.; Wang, M.; Yuan, X.; Gao, S. Effect of Ce on the cleanliness, microstructure and mechanical properties of high strength low alloy steel Q690E in industrial production process. Int. J. Miner. Metall. Mater. 2019, 26, 1372–1384. [Google Scholar] [CrossRef]
  26. Akagi, T.; Edanami, K. Sources of rare earth elements in shells and soft-tissues of bivalves from Tokyo Bay. Mar. Chem. 2017, 194, 55–62. [Google Scholar] [CrossRef]
  27. Danezis, G.P.; Pappas, A.C.; Zoidis, E.; Papadomichelakis, G.; Hadjigeorgiou, I.; Zhang, P.; Brusic, V.; Georgiou, C.A. Game meat authentication through rare earth elements fingerprinting. Anal. Chim. Acta 2017, 991, 46–57. [Google Scholar] [CrossRef] [PubMed]
  28. Su, Y.; Yang, M. Combining Rare Earth Element Analysis and Chemometric Method to Determine the Geographical Origin of Nephrite. Minerals 2022, 12, 1399. [Google Scholar] [CrossRef]
  29. Gallello, G.; Ferro-Vázquez, C.; Chenery, S.; Lang, C.; Thornton-Barnett, S.; Kabora, T.; Hodson, M.E.; Stump, D. The capability of rare earth elements geochemistry to interpret complex archaeological stratigraphy. Microchem. J. 2019, 148, 691–701. [Google Scholar] [CrossRef]
  30. Cerutti, C.; Sánchez, R.; Sánchez, C.; Ardini, F.; Grotti, M.; Todolí, J.-L. Prospect on Rare Earth Elements and Metals Fingerprint for the Geographical Discrimination of Commercial Spanish Wines. Molecules 2020, 25, 5602. [Google Scholar] [CrossRef]
  31. Wasson, J.T.; Kallemeyn, G.W. Compositions of chondrites. Philos. Trans. R. Soc. Lond. Ser. A Math. Phys. Sci. 1988, 325, 535–544. [Google Scholar] [CrossRef]
  32. Thiele, K.; Musi, R.; Ramesh Babu, S.; Michelic, S.K. Optimization of the Two- and Three-Dimensional Characterization of Rare Earth-Traced Deoxidation Products. Adv. Eng. Mater. 2023, 25, 2201748. [Google Scholar] [CrossRef]
  33. Wibner, S.; Antrekowitsch, H.; Meisel, T.C. Studies on the Formation and Processing of Aluminium Dross with Particular Focus on Special Metals. Metals 2021, 11, 1108. [Google Scholar] [CrossRef]
  34. Voncken, J. The Rare Earth Elements; Springer International Publishing: Cham, Switzerland, 2016; ISBN 978-3-319-26807-1. [Google Scholar]
  35. Gao, S.; Wang, M.; Guo, J.; Wang, H.; Zhi, J.; Bao, Y. Characterization Transformation of Inclusions Using Rare Earth Ce Treatment on Al-Killed Titanium Alloyed Interstitial Free Steel. Steel Res. Int. 2019, 90, 1900194. [Google Scholar] [CrossRef]
  36. Geng, R.; Li, J.; Shi, C. Evolution of Inclusions with Ce Addition and Ca Treatment in Al-killed Steel during RH Refining Process. ISIJ Int. 2021, 61, 1506–1513. [Google Scholar] [CrossRef]
  37. Basu, S.; Choudhary, S.K.; Girase, N.U. Nozzle Clogging Behaviour of Ti-bearing Al-killed Ultra Low Carbon Steel. ISIJ Int. 2004, 44, 1653–1660. [Google Scholar] [CrossRef]
  38. Dorrer, P.; Michelic, S.K.; Bernhard, C.; Penz, A.; Rössler, R. Study on the influence of FeTi-addition on the inclusion population in Ti-stabilized ULC steels and its consequences for SEN-clogging. Steel Res. Int. 2019, 90, 1800635. [Google Scholar] [CrossRef]
Figure 1. Processing of Ti-IF steel with additional REE treatment during secondary refining.
Metals 14 00103 g001
Figure 2. Ti-IF casting sequence of the industrial trial.
Metals 14 00103 g002
Figure 3. (a) Cross-sectional view of the halved SEN 1; (b) BSE image: embedded SEN and clogging structure.
Metals 14 00103 g003
Figure 4. Change in NMI number per mm² over the process in the third melt (Ce-traced): (a) after Al deoxidation, (b) after Ce addition, (c) after RH treatment with the FeTi addition, and (d) tundish sample.
Metals 14 00103 g004
Figure 5. BSE images and elemental mappings of the NMI modification in the Ce-traced melt: (a) NMI after Al deoxidation, (b) NMI after Ce addition, (c) NMI in the sample after FeTi addition, (d) traced and (e) untraced AT-NMI from the tundish sample.
Metals 14 00103 g005
Figure 6. BSE images and the corresponding elemental mappings of the main elements detected in the clogging layer from the investigated SEN; below: EDS-detected elemental content of Ti, La, and Ce over the clogging layer.
Metals 14 00103 g006
Figure 7. REE fingerprint of mold and tundish slag, casting powder, sliding gate sand, Al granules, and clogging layer.
Metals 14 00103 g007
Figure 8. BSE image and elemental mappings of NMI 1.
Metals 14 00103 g008
Figure 9. REE fingerprints of all investigated auxiliaries and mesoscopic NMI 1 of La-traced heat.
Metals 14 00103 g009
Figure 10. BSE image and elemental mappings of NMI 2.
Metals 14 00103 g010
Figure 11. REE fingerprints of mold and tundish slag, casting powder, Al granules, and mesoscopic NMI of Ce-traced heat (NMI 2).
Metals 14 00103 g011
Table 1. Mass fractions of lanthanoids in chondrites (ng/g) [31].
LaCePrNdSmEuGdTbDyHoErTmYbLu
23661692.945714956.019735.524554.716024.715924.5
Table 2. Chemical composition of a Ti-IF steel sample in g/100 g provided by the voestalpine Stahl GmbH steel plant.
CSiMnPSAlTiNOtotalFe
0.00110.00190.11050.00910.00480.05500.05490.00350.0021Bal.
Table 3. Overview of analyzed samples and the analyzing methods used.
MaterialAnalyzing Method
Al granulesICP-MS analysis after HCl/HNO3 digestion
Casting powderICP-MS analysis after LiBO2 fusion digestion
Covering agentICP-MS analysis after LiBO2 fusion digestion
Sliding gate sandICP-MS analysis after LiBO2 fusion digestion
Slag formerICP-MS analysis after LiBO2 fusion digestion
Mold and tundish slagsICP-MS analysis after LiBO2 fusion digestion
Clogging layerICP-MS analysis after LiBO2 fusion digestion
NMI 1 and 2LA-ICP-MS (point scans for 180 s)
Table 4. Total number of NMIs per mm², the three main NMI types per sample, and the associated tracing rates of the samples from the third heat (Ce-traced).
Sample No. Date of Sampling Total No. of NMIs (No./mm²)Three Main NMI TypesOverall Tracing Rate (%)
1After deoxidation38.70Al2O3, MgO∙Al2O3, Al2O3∙SiO2-
2After Ce addition105.91Al2O3, Al2O3∙Ce2S3, Al2O3∙MnO41.26
3After RH treatment46.83Al2O3, (Al,Ti)O,∙(Al,Ti)OS38.43
4Tundish sample25.06Al2O3, (Al,Ti)O,∙(Al,Ti)OS34.26
Table 5. Mean ECDs in µm of the traced and untraced main NMI types of the Ce-traced samples from the third heat.
Sample No. NMI TypeMean ECD Untraced (µm)Mean ECD Traced (µm)
1Al2O32.55 ± 1.66-
1MgO∙Al2O33.06 ± 1.37-
1Al2O3∙SiO24.43 ± 3.22-
2Al2O31.51 ± 0.532.17 ± 1.13
2Al2O3∙Ce2S3-1.48 ± 0.49
2Al2O3∙MnO1.46 ± 0.401.34 ± 0.28
3Al2O32.24 ± 1.223.06 ± 1.50
3(Al,Ti)O1.89 ± 1.102.72 ±1.07
3(Al,Ti)OS1.43 ± 0.462.35 ± 1.09
4Al2O34.21 ± 1.995.23 ± 2.66
4(Al,Ti)O2.54 ± 1.393.35 ± 1.38
4(Al,Ti)OS1.75 ± 0.602.15 ± 0.78
Disclaimer/Publisher’s Note: The statements, opinions and data contained in all publications are solely those of the individual author(s) and contributor(s) and not of MDPI and/or the editor(s). MDPI and/or the editor(s) disclaim responsibility for any injury to people or property resulting from any ideas, methods, instructions or products referred to in the content.

