Article

The Effects of Layer Thickness on the Mechanical Properties of Additive Friction Stir Deposition-Fabricated Aluminum Alloy 6061 Parts

Department of Mechanical & Industrial Engineering, Louisiana State University, Baton Rouge, LA 70803, USA
*
Authors to whom correspondence should be addressed.
Metals 2024, 14(1), 101; https://doi.org/10.3390/met14010101
Submission received: 1 December 2023 / Revised: 1 January 2024 / Accepted: 12 January 2024 / Published: 14 January 2024

Abstract

:
Solid-state additive friction stir deposition (AFSD) is a thermomechanical-based additive manufacturing technique. For this study, AFSD was utilized to produce aluminum alloy 6061 (AA6061) blocks with varying layer thicknesses (1 mm, 2 mm, and 3 mm). The mechanical properties were assessed through uniaxial tensile tests and Vickers microhardness measurement, and statistical analysis was employed to investigate differences among data groups. The results revealed that the deposition layer thickness influences tensile properties in the building (Z) direction, while the properties in the X and Y directions showed minor differences across the three AFSD blocks. Furthermore, variations in tensile properties were observed depending on the sample orientation in the AFSD blocks and its depth-wise position in the part in the building direction. The microhardness values decreased non-linearly along the building direction, spread across the width of the part’s cross-section, and highlighted that the deposition layer thickness significantly affects this property. The 1 mm block exhibited lower average microhardness values than the 2 mm and 3 mm blocks. The temperature histories and dynamic heat treatment are influenced by the deposition layer thickness and depend on the location of the point being studied in the part, resulting in variations in the microstructure and mechanical properties along the building direction and across the part’s width.

1. Introduction

The solid-state additive friction stir deposition (AFSD) is an innovative thermomechanical process designed for additive manufacturing (AM) of large-scale pieces under open-air conditions [1]. In the AFSD process, a rotating deposition tool, which operates in conjunction with an applied downward force upon the feedstock rod facilitates frictional heat generation, subsequently softening and plasticizing the feedstock rod [2,3]. While undergoing plasticization, the predominant portion of the plastic work is converted to thermal energy [4,5]. This causes an additional mechanism for volumetric heat generation [4]. The feedstock rod flows to fill the gap underneath the deposition tool. Subsequently, the feedstock rod is deposited onto a previously deposited layer or a fixed substrate. This systematic deposition process enables the continuing manufacturing of a part, as the deposition tool traverses along a predefined path, working layer by layer [6].
As the feedstock material experiences plastic deformation in the deposition region and due to high pressure, the internal defects are minimized [6]. One of the greatest advantages of AFSD is depositing fully dense as-printed parts [6]. Solidification-induced porosity and hot tearing or hot cracking are not an issue, because the AFSD is a solid-state process [7]. AFSD also eliminates defects that are induced by melting processes, such as a lack of infusion and spatter ejection [6]. The use of a large deposition tool and a high feeding rate has enabled fast deposition (large-scale additive manufacturing) and, as a result, a high build rate for AFSD. While this technology allows for the 3D printing of a large component, the minimum feature size and complexity in the geometry are restricted [6].
AFSD is a friction-based additive manufacturing process that originates from friction stir welding (FSW) [1,8]. Friction Deposition, Rotary Friction Welding (RFW), Linear Friction Welding (LFW), Friction Surfacing, and Friction Stir Additive Manufacturing (FSAM) are other solid-state friction-based additive manufacturing techniques [8,9]. The AFSD (MELD [10,11]) process (or additive friction stir (AFS) fabrication [12]) is a relatively new [13] and revolutionary AM technique [14], which the Aeroprobe corporation patented and developed [15,16]. The primary benefit of AFSD lies in its capacity to produce fully dense parts [6,17] efficiently in an open-air environment, offering a high deposition rate [18] that is suitable for a broad spectrum of materials used as feedstock. AFSD has various applications, e.g., (multi-material) additive manufacturing, composite AM [19], hybrid manufacturing [20,21], coating, cladding [22], joining [15], repair [23,24,25], and reinforcement. AFSD may process recycled material [26] or feedstock materials with lower quality characteristics, such as internal defects and contaminants, making it a trustworthy method for processing feedstocks that are made of used materials [27].
The application of AFSD has been successfully demonstrated for the processing of aluminum alloys. These AFSD-produced aluminum parts find extensive applications in industries such as aerospace, automotive, and various other sectors [28]. Aluminum alloys, known for their lightweight nature, possess exceptional strength-to-weight ratios, as well as remarkable resistance to corrosion [28]. Notably, the literature has documented the successful utilization of AFSD in the manufacturing of AA6061 [19,29,30], AA2050 [31], AA2011 [32], AA2024 [13], AA2219 [33,34], AA5083 [35,36], AA5B70 [37], and AA7075 [24,38,39,40,41] parts, showcasing the versatility and potential of this technique for aluminum alloy processing. The deposition of parts made of other metal alloys is also reported in the literature. Various aspects of AFSD-fabricated parts made with Titanium alloy [26,42], magnesium alloy [2,43,44,45], Inconel alloy [46,47], stainless steel [48,49,50], copper alloy [51], and also high-entropy alloy (HEA) [52] are studied in the literature.
To enhance our comprehension of the AFSD process, numerous studies have endeavored to perform in situ process monitoring and non-destructive evaluation of the deposited components. Garcia et al. employed a combination of infrared imaging, optical imaging, and thermocouple measurements to monitor the thermal field and material flow dynamics during the AFSD process [4]. Merritt et al. integrated thermocouples into the deposition tool to enable real-time temperature monitoring [53]. Nemati et al. used neutron imaging to investigate the layer-by-layer structure of an AFSD as-deposited AA6061 part [30]. Numerous efforts to simulate the AFSD process have also been documented [54,55,56,57].
Various aspects of the mechanical and microstructural properties of AFSD AA6061 parts have been studied in the literature. The relationship between process parameters (deposition tool’s rotation and traverse speed and feed-rate) and the mechanical properties and the microstructure/nanostructure properties for AA6061 parts that are made using AFSD has been investigated in studies [17,58,59,60]. Zhu et al. employed neutron diffraction to investigate the distribution of residual stress across the thickness of an AA6061 part that was fabricated using AFSD [61]. Zeng et al. investigated the evolution of the AA6061 microstructure from feedstock to AFSD part [29]. Examining the fatigue life of components holds significant importance due to the substantial risk that fatigue fractures pose to the structural integrity of the components [62,63,64,65]. Rutherford et al. studied the strain-controlled fatigue performance and tensile properties of as-deposited AFSD AA6061 parts and investigated the microstructure–mechanical properties’ relationship [66]. Zhu et al. conducted a study to examine how the presence of aluminum oxide coatings on the surfaces of AA6061 feedstock material influences the mechanical and microstructural properties of the as-deposited parts [67].
To the best of the authors’ knowledge, no research on the effects of the deposition layer thickness on the mechanical properties of AFSD-manufactured components has been conducted. This study employs the AFSD process to make AA6061 blocks with varying layer thicknesses (1 mm, 2 mm, and 3 mm) and subsequently assesses their mechanical properties using uniaxial tensile tests and Vickers microhardness measurements. Statistical analysis was employed to investigate disparities among the datasets. Variations in tensile properties were statistically analyzed based on the orientation of the tensile test specimens, as well as the specific position within the part (depth and width) from which the specimens were extracted. Microhardness tests were conducted along the building direction, and statistical analysis was applied to appraise variances in microhardness values across different blocks and their respective locations. Additionally, the deposition data were analyzed, and the temperature history, the reaction force applied on the feedstock rod, and the torque applied on the deposition tool during the AFSD process are discussed. Furthermore, this study explores the temperature histories of distinct regions within the manufactured parts and their impact on microstructural properties. This paper provides insights into the intricate interplay between AFSD parameters, layer thickness, orientation, and material behavior, thereby augmenting the comprehension of how these factors affect the mechanical and microhardness properties of the produced components.

2. Materials and Methods

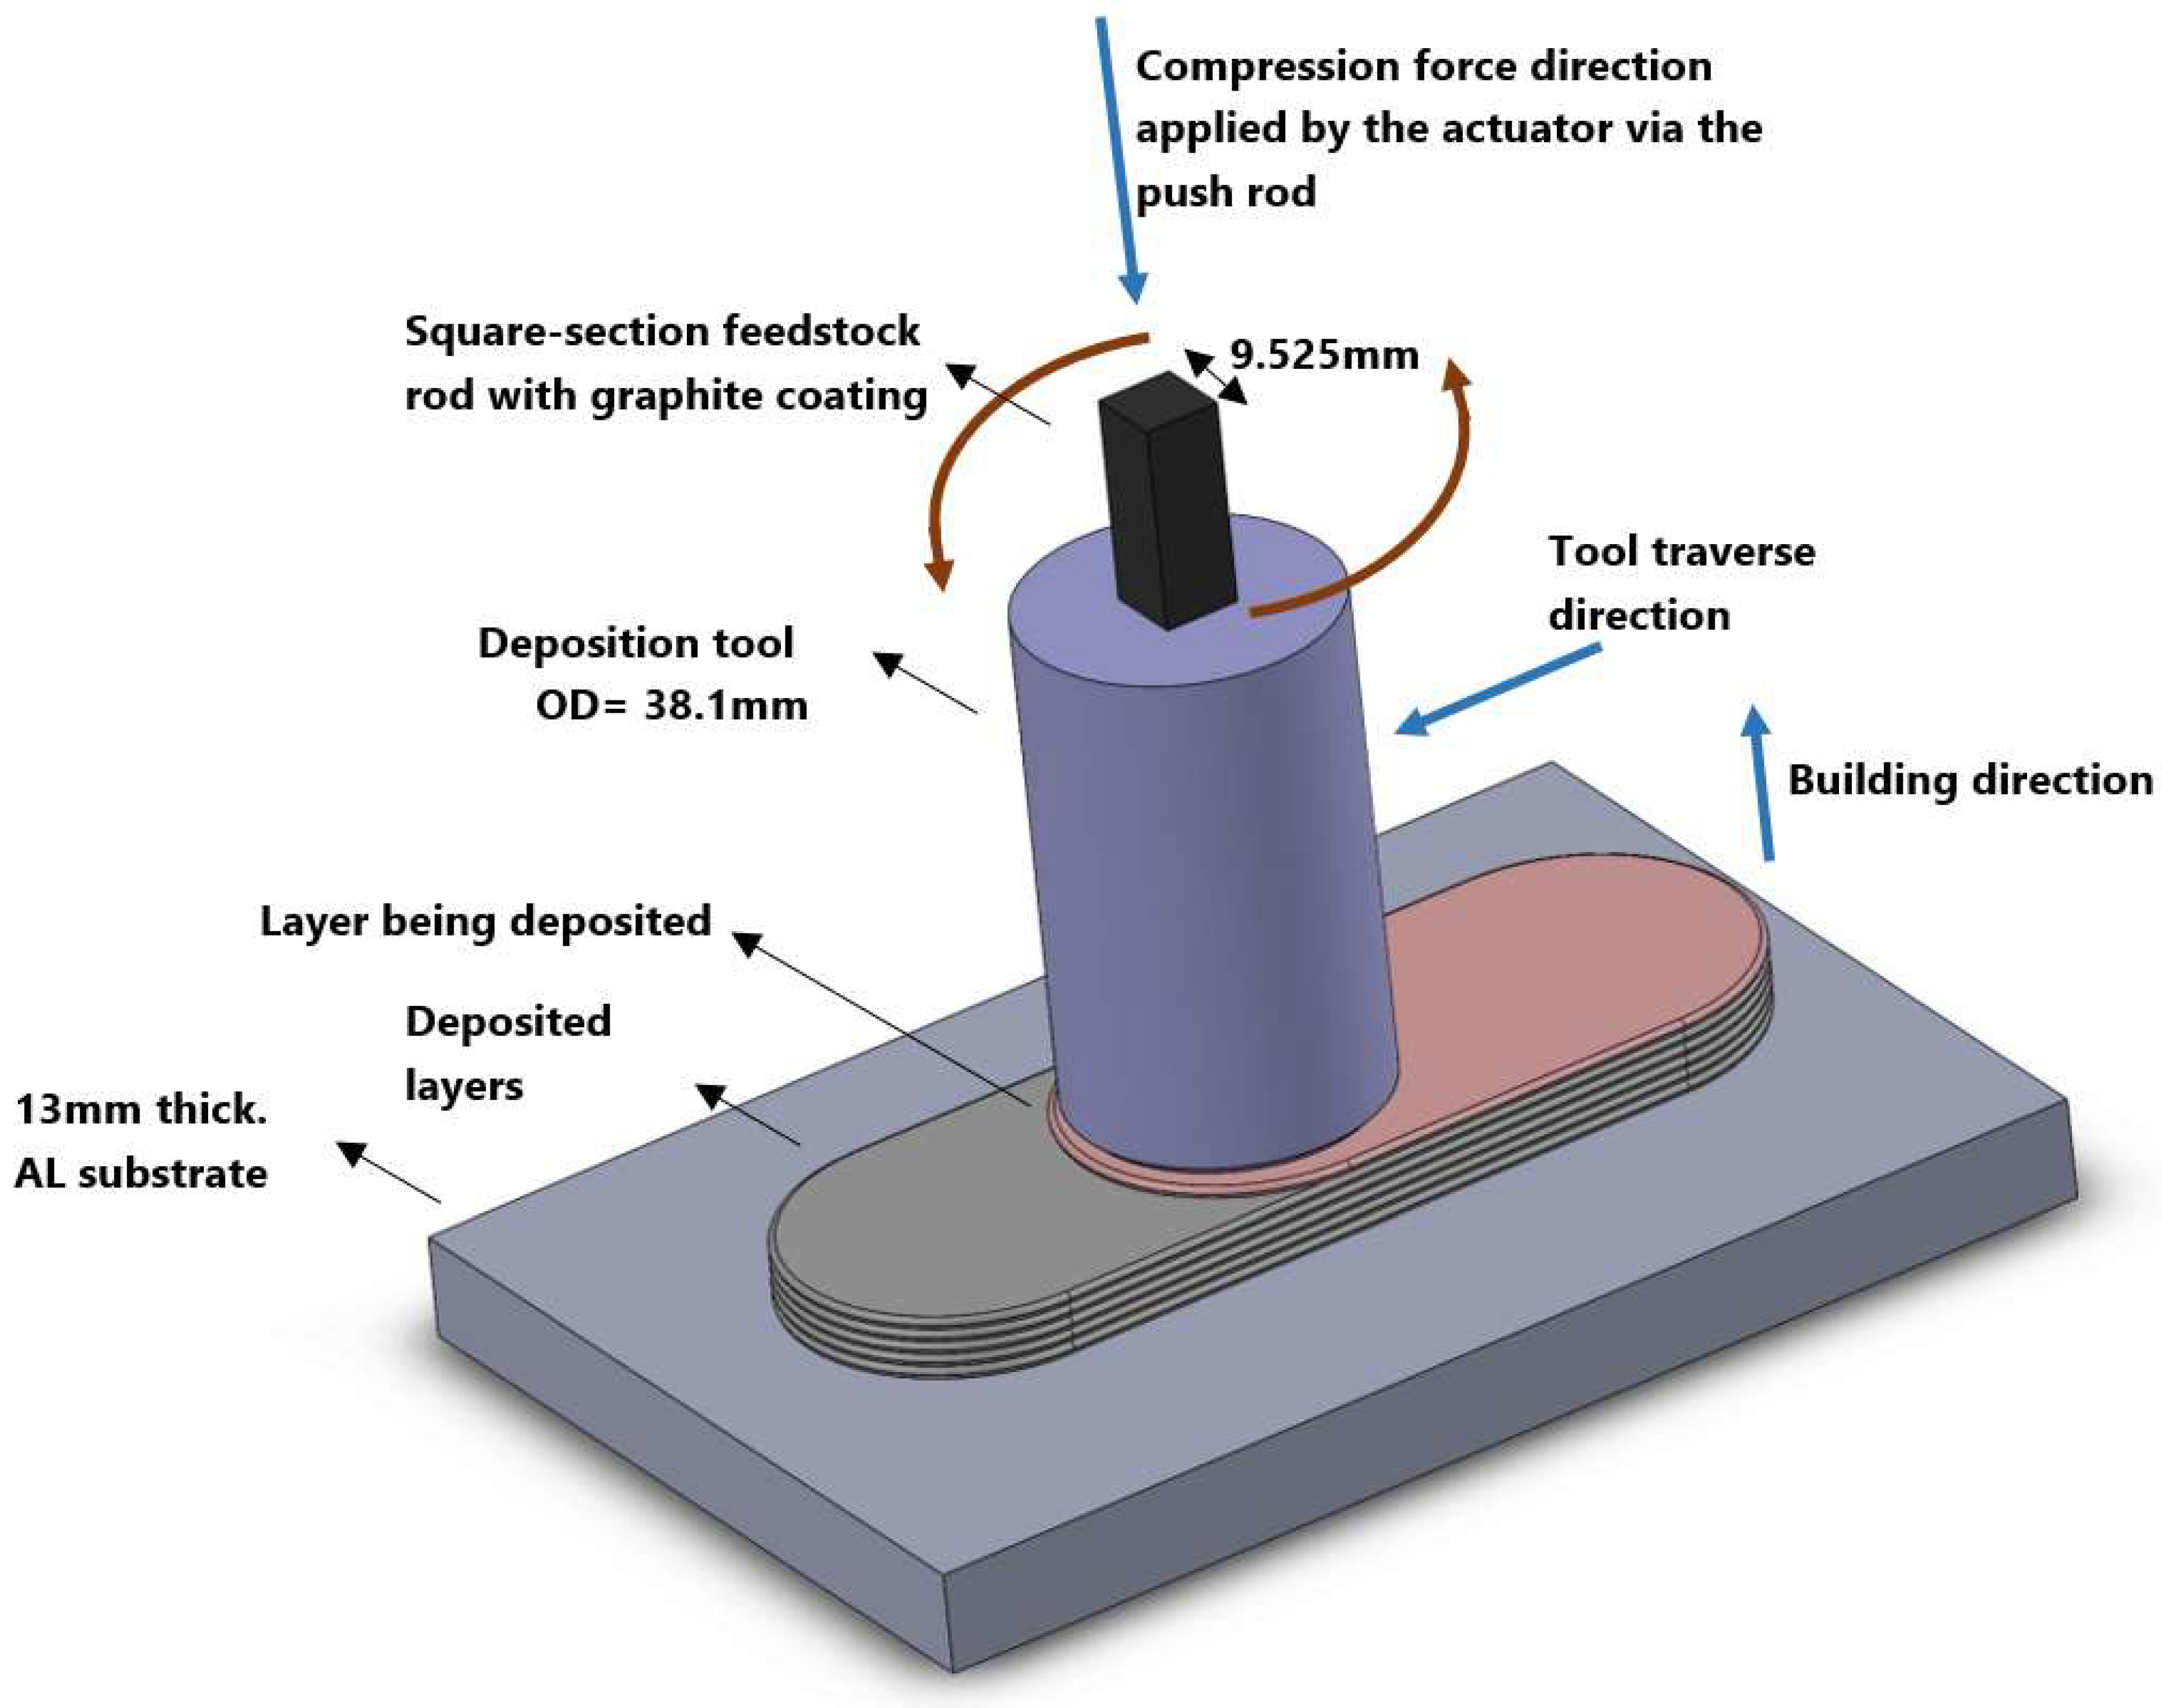
2.1. Additive Friction Stir Deposition Process and Layer Thickness

The thermomechanical process of AFSD is an innovative solid-state metal AM technique designed for the efficient production of large-scale pieces under open-air conditions [68]. This process employs a rotating deposition tool to plastically deform feedstock rods, which are subsequently integrated into the deposited layer or a substrate, enabling the gradual deposition of a part, layer by layer. In this study, a MELD [10] L3 machine was used for AFSD deposition of AA6061. To fabricate the components, commercial AA6061 feedstock rods (with a square cross-section 3/8 in × 3/8 in) were used. Rods were cut into 500 mm (20 in) pieces to be manually fed to the machine during the deposition process. A graphite coating was applied on the surface of the feedstock rods, preventing the rod from becoming jammed in the deposition tool.
The AFSD procedure starts with the activation of the deposition tool, set into rotation while the feedstock rod is within it. A downward force is exerted by the push rod onto the rotating feedstock rod, generating frictional heat between the rotating rod and the stationary substrate. As the temperature elevates, the feedstock rod undergoes yielding and extrusion, allowing the softened material to flow beneath the rotating deposition tool. As the material continues to flow, the deposition tool follows a predetermined path, forming a new layer in the additive manufacturing process. The gap existing between the tool’s lower surface and the previously deposited layer (or the substrate) dictates the deposition’s layer thickness. Figure 1 shows the arrangement of the additive friction stir deposition (AFSD) and introduces the different parts.
The deposition tool used for the purpose of this study is the standard tool provided by the manufacturer. The outside diameter of the deposition tool is 38.1 mm (1.5 in), and it has two pairs of protrusions at the lower face of the tool. Figure 2 presents the used deposition tool and the deposited layer details.
Two pairs of teardrop-shaped protrusions located at the lower surface of the deposition tool (see Figure 2) help stir the depositing softened material and also generate additional heat due to added friction [4]. Furthermore, protrusions allow for the re-stirring of previously laid materials while depositing a layer while the layer thickness is smaller than the height of the protrusion. For instance, for a layer thickness of 1 mm (0.04 in), the height of the larger protrusion is larger than the sum of two layers’ thicknesses, which means that while depositing a new layer, the last two already deposited layers are also re-stirred. It is also feasible to deposit a layer with a thickness that is greater than the height of the larger protrusion. When depositing a part with such a layer thickness, the depositing tool is not stirred into any of the underneath layers.

2.2. AFSD Part Deposition Parameters and Feedstock Material

In this study, commercial AA6061 alloy material (with Al-1.63 Mg-0.44 Si-0.23 Cu-0.16 Fe (wt.%) composition) was utilized. Table 1 presents the physical and mechanical properties of AA6061 (T6 temper) wrought alloy (specification: AMS 4117).
Three blocks were deposited (with different layer thicknesses) for the purpose of this study. For the deposition of these blocks, the same deposition parameters of the feedstock material feed rate and the tool’s rotation speed were used, while the deposition tool’s traverse speed was adjusted for each build with a different layer thickness. The printed blocks were named based on their layer thicknesses: 1 mm, 2 mm, and 3 mm. The deposition parameters for the printed builds are listed in Table 2.

2.3. Tensile Test Specimen

Wire EDM (electrical discharge machining) was used to cut the as-deposited AFSD blocks (1 mm, 2 mm, and 3 mm) to prepare the tensile and hardness test specimens for this study. Figure 3 illustrates the dimensions of the sub-sized flat-plate test specimen that was used for this study and shows the test specimen arrangement in the as-deposited blocks. Thirty-three specimens were cut out of each printed block (see Figure 4 and Figure 5). The tensile test specimens were cut from the main section of the as-deposited build, right beneath the deposition tool, rather than the flash zone (see Figure 6). The tensile test pieces were cut from the various parts of the as-deposited blocks in X, Y, and Z directions and were carefully marked. This allows for the study of the properties of different locations and orientations.
From each block (1 mm, 2 mm, and 3 mm), 12 tensile test specimens were cut in the X direction (the deposition tool’s traverse direction), 12 in the Y direction (the part’s width), and 9 in the Z direction (the building direction). The specimens in the X direction were cut from the center, left, and right sides (cross-section view) of the as-deposited block at different distances from the bottom of the part (see Figure 5). Similarly, the specimens in the Y direction were cut from different positions located at different distances from the bottom of the part. Additionally, specimens in the Z direction (building direction) were cut from the center, right, and left sides (cross-section view) of the block. Figure 4 and Figure 5 show the tensile test specimens’ markings that were used for this study. Table 3 presents the naming arrangement used for tensile test specimens.

2.4. Microhardness Test Specimen

Figure 6 depicts the microhardness test specimen and its location. Thin slices (with 2–3 mm thickness) were cut from the as-deposited blocks (1 mm, 2 mm, and 3 mm) and meticulously polished. Vickers microhardness tests were then performed on the specimens along three vertical lines in the building direction, located at the cross-section’s center, left, and right sides, as shown in Figure 6. Vickers microhardness values were measured at thirty points along each line for each block (1 mm, 2 mm, and 3 mm), namely, points #1 to #30, with point #1 located near the top of the parts and each point being 1 mm lower than the previous one.

2.5. Statistical Analysis of Groups’ Means

As mentioned, from each block (1 mm, 2 mm, and 3 mm), a total of 33 tensile test specimens were cut (12 tensile test specimens in the X direction, 12 in the Y direction, and 9 in the Z direction). Tensile properties were evaluated through uniaxial tensile tests, and stress–strain curves were generated for each specimen. The test specimens/results were grouped based on the blocks that they were cut from in order to assess whether there is sufficient evidence to conclude that there are statistically significant differences among the groups being compared. Additionally, test specimens were re-grouped based on the test specimen’s direction in the block (X, Y, and Z) and the position of the test specimen within the block (left, right, or center in the horizontal direction and the position in the vertical building direction) to identify potential variations. Statistical analysis was used to investigate the differences between each set of groups of data and provide a meaningful comparison between the groups. Similar statistical analysis was also used to explore the differences between the groups of data that were acquired from microhardness tests. The utilized set of statistical analysis tools to explore the significance of group means’ differences includes one-way ANOVA, Kruskal–Wallis, and pairwise post hoc tests. These analytical techniques were applied within a Jupyter notebook environment utilizing the Python programming language.
The one-way ANOVA (Analysis of Variance) test contrasts variance within group means, allowing us to evaluate the statistical significance of the degree of difference between group means [70]. The independence, normality, and homogeneity of variances (homoscedasticity) are the three underlying presumptions of the ANOVA test [70]. The independence assumption posits that the observations or data points within each group are treated as independent entities, meaning that the outcome of one observation does not affect or influence the outcome of another. The normality assumption assumes that the data within each group or treatment level adhere to a normal distribution, where the majority of observations cluster around the mean with a symmetrical bell-shaped curve. The homogeneity of variances assumption implies that the variability, or spread, of the data among the different groups being compared is roughly equal, indicating that the dispersion of scores within each group is similar. By ensuring that the assumptions are satisfied or properly handled, the ANOVA test can deliver accurate and insightful findings for comparing the means of many groups of data. The null hypothesis in the context of the conducted one-way ANOVA test for this research asserts that the population means across all groups are equal. In contrast, the alternative hypothesis posits that at least one group’s mean deviates from the others.
The primary objective of the one-way ANOVA test carried out for this study was to examine whether there was evidence of differences in the tensile properties’ means among the three blocks with layer thicknesses of 1 mm, 2 mm, and 3 mm. The purpose was to assess whether there was sufficient evidence to reject the null hypothesis (all means are equal) and conclude that there are significant mean differences among the groups (representing the mechanical properties of the blocks) being compared. Additionally, the one-way ANOVA analysis was applied to investigate the effect of the test specimens’ direction (X, Y, and Z) and their position within the block (left, right, or center in the horizontal direction and the position in the vertical building direction) to identify potential variations. The null and alternative hypotheses remained consistent across all the ANOVA tests conducted. For the groups of data investigated in this research, the assumptions were examined first and if met, the one-way ANOVA test was carried out. The independence assumption was met for all the data, as the tests and data analysis were carried out independently for all test specimens. The normality assumption was assessed by carrying out the Shapiro–Wilk test for the groups of data [71]. Levene’s test was carried out to assess the homogeneity of variances assumption [72]. If the assumptions were met, the one-way ANOVA test was carried out. If the normality, or homogeneity of variances, were violated, as an alternative, the non-parametric Kruskal–Wallis test was carried out [73,74]. Kruskal–Wallis test does not include the normality and the homogeneity of variances assumption [73]. The significant results of the one-way ANOVA or Kruskal–Wallis tests indicates the presence of significant differences among the means of the various groups under investigation; however, these tests do not provide more detail about the difference between specific groups’ means. To further investigate the difference between the pairs of groups, after obtaining significant results from ANOVA or Kruskal–Wallis test, the pairwise post hoc (comparison) tests were carried out to determine the difference between pairs of group means [70]. Tukey’s HSD [75,76] and Games–Howell [76] tests were carried out as pairwise post hoc tests to identify which specific groups exhibited significant differences in means if the one-way ANOVA or Kruskal–Wallis yielded a significant result, respectively. It is important to highlight that for each of the aforementioned statistical tests, p-values were computed and employed as determinants of statistical significance. In this study, a significance level of α = 0.05 was adopted. Consequently, the null hypothesis was rejected for p-values that were lower than 0.05.

3. Results

3.1. Layer-by-Layer Deposition

During the layer-by-layer deposition process of AFSD deposits, the protrusions play a substantial role in stirring the plastically deformed material and generating heat. The penetration depth of the protrusion into the previously deposited layer varies depending on the deposition layer thickness. This interaction between the protrusions and the existing layer (or substrate in the case of the first layer) results in a distinct pattern of material deposition. To observe and compare these layers’ deposition patterns, slices of 1 mm, 2 mm, and 3 mm blocks were cut (as shown in Figure 6). The cross-sections of the three blocks were then polished and etched for examination. The results depicted in Figure 7 reveal that the layers in the 1 mm block exhibit a higher degree of intermixing compared to the other two blocks. Conversely, in the 3 mm block, where the layer thickness exceeds the height of the protrusions, distinct boundaries between the layers can be observed.

3.2. Tensile Properties

The uniaxial tensile tests were conducted using an MTS tester to examine the mechanical properties of the as-deposited AFSD parts. These tests aimed to capture the response of the material to the applied tension and provide insights into its structural behavior and deformation characteristics under uniaxial loading conditions. Stress–strain (S-S) curves were obtained for each test. From each S-S curve, three parameters of ultimate stress, fracture strain, and area underneath the S-S curve were extracted. Tensile tests/specimens were then organized into various groups, and statistical analyses were conducted to investigate the differences in the means of ultimate stress, fracture strain, and the area under the stress–strain curve among these data groups.

3.2.1. The Effect of Layer Thickness

The layer thickness effect on the tensile properties was investigated in this study. Figure 8 presents a comparison of the fracture strain, ultimate stress, and area under the stress–strain (S-S) curve for all of the 33 tensile test specimens obtained from each one of the 1 mm, 2 mm, and 3 mm blocks. A statistical analysis was also carried out. In the statistical analysis of the fracture strain and the area under the S-S curve data, it was observed that the assumptions of normality and/or homogeneity were not met, rendering the ANOVA test inappropriate. Consequently, the Kruskal–Wallis test was employed, revealing no statistically significant difference among the groups. On the other hand, in the case of ultimate stress (normality assumptions were violated), the Kruskal–Wallis test yielded a p-value of 0.0221, indicating a statistically significant variance amongst the means of the examined groups. Subsequent pairwise post hoc testing (Games–Howell) demonstrated the most significant distinction to be between the 1 mm and 3 mm blocks. Otherwise, the statistical analysis conducted thus far has indicated no statistically significant difference among the means of the fracture strain and the area under the stress–strain curve based on the tensile test results obtained from the 1 mm, 2 mm, and 3 mm blocks. Nevertheless, there is a statistically significant difference in the means of ultimate stresses for the specimens from these three blocks. Further investigation was carried out to go deeper into the difference between the three blocks’ tensile properties.
For a more detailed study, the tensile test results were organized into groups based on both the layer thickness of the block from which they were cut and the orientation of the test pieces (X, Y, and Z). Then, a comparative analysis was conducted, contrasting the tensile properties of the test specimens in the X, Y, and Z directions within each block with those from other blocks. For the test specimens in the X and Y directions, separate statistical analysis results showed that the normality assumptions were not satisfied for any of the groups under study. As a result, Kruskal–Wallis tests were employed to assess potential differences. The outcomes of the Kruskal–Wallis tests indicated no statistically significant distinctions among the means of the examined groups. It is noteworthy that although the p-values for the fracture strain and the area under the S-S curve for specimens in the Y direction were 0.0529 and 0.0924, respectively, they still exceeded the significance level of 0.05, signifying a lack of statistical significance. Consequently, it can be inferred that, based on the findings of this investigation, the layer thickness of the deposited part does not exert a statistically significant influence on the tensile properties in the X and Y directions.
However, an investigation into the tensile properties in the Z direction revealed a significant difference among the means. In the context of fracture elongation and the area under the S-S curve, the homogeneity assumptions were found to be in violation, so a Kruskal–Wallis test was carried out, resulting in p-values of 0.00068 and 0.000141, respectively. Subsequent pairwise post hoc tests (Games–Howell) revealed that the most substantial differences were observed within the 1 mm–3 mm and 1 mm–2 mm pairs. In the case of ultimate stress, the normality assumption was not satisfied, and the Kruskal–Wallis test produced a significant outcome with a p-value of 0.01214. Further analysis through pairwise post hoc tests (Games–Howell) indicated that the most substantial difference lay within the 1 mm and 3 mm pairs. Specifically, the Z specimens derived from the 1 mm blocks showed considerably smaller fracture strains and ultimate stress values compared to their counterparts from the other two blocks. In summary, the findings of this study suggest that the deposition layer thickness affects the tensile properties of the as-deposited parts in the Z direction. The comparative investigation in the X, Y, and Z directions for the 1 mm, 2 mm, and 3 mm blocks are illustrated in Figure 9, Figure 10 and Figure 11.

3.2.2. The Effect of Test Specimen Direction

The specimens were cut in the X, Y, and Z directions from each block, yielding a total of 36 test pieces in the X direction, 36 specimens in the Y direction, and 27 in the Z direction. Subsequently, the tensile test characteristics of these specimens were examined and compared across the different directions. The fracture strain, ultimate stress, and the area under the S-S curve were selected as parameters for analysis. To visually represent the distribution of these parameters, box plots were generated for each specimen group, as depicted in Figure 12.
For the statistical evaluation of the fracture elongation and the area under the S-S curve properties, it was observed that the normality assumptions were not met, rendering the application of one-way ANOVA inappropriate. Consequently, the Kruskal–Wallis test was used. The results of the Kruskal–Wallis test revealed p-values of 6.384 × 10⁻¹⁴ and 5.449 × 10⁻¹³ for the fracture elongation and the area under the stress–strain curve, respectively. These results indicate a statistically significant difference amongst the means of the various groups studied. To gain a deeper understanding of these differences, pairwise post hoc tests (Games–Howell) were conducted. These tests demonstrated that the difference among all pairs (X-Y, X-Z, and Y-Z) were statistically significant. This signifies that the tensile properties exhibit variations across the X, Y, and Z directions. Regarding the ultimate stress properties, it was noted that both the normality and homogeneity assumptions were violated. The Kruskal–Wallis test, which is robust against these violations, yielded a p-value of 0.0018, suggesting a significant difference in means among the groups studied. Subsequent pairwise post hoc tests (Games–Howell) indicated that the differences in means between the X-Z and Y-Z pairs were statistically significant. In summary, for an as-deposited AFSD part, the tensile properties are different in the X, Y, and Z directions.
The variations in tensile properties across different orientations (for specimens from the 2 mm block) are presented in Figure 13. The graphs shown provide a visual representation of the outcomes of the tensile tests that were performed on the specimens extracted from 2 mm blocks along the X, Y, and Z directions. The specimens cut along the Z direction (building direction) exhibit the lowest fracture strain values in comparison to specimens in the X and Y directions. Extensive research in the literature [77] has explored the influence of the printing layer direction on the mechanical properties of additively manufactured components. Concerning the Z-oriented test specimens, the loading direction stands perpendicular to the orientation of the printing layers. This configuration results in a greater susceptibility to crack growth and accelerated fracture due to the presence of layer boundary defects or weakened interfacial layers [77]. For AFSD, the layer boundaries are formed differently from a regular layer-by-layer printing because of re-stringing of the previous layer [29,31]. Saber et al. investigated the layer-by-layer architecture of distinct segments within as-built AA6061 parts created via the AFSD process, employing neutron imaging techniques as a non-destructive evaluation methodology [30]. Their observations indicated that the graphite coating, employed as a dry lubricant on the feedstock’s surface, exhibited a tendency to segregate between layers. According to them, this phenomenon may result in non-uniform mechanical properties in the building direction and serve as a stimulus for crack initiation during mechanical loading, as stated in their analysis.

3.2.3. The Effect of the Specimens’ Position in relation to the Width of the Block

In the X and Z directions, the tensile test specimens were obtained by cutting from the middle, right, and left sides of the cross-section of the blocks. The specimens taken from the left and right sides were positioned at 9.5 mm (0.375 in) from the center of the part, as illustrated in Figure 5. Each block comprised twelve specimens in the X direction, with four of them each at the left, right, and center positions. In the Z direction, each block consisted of nine specimens, with three specimens each at the right, left, and center positions. Consequently, a total of 21 test specimens were obtained for each position (left, right, and center) across all the blocks (1 mm, 2 mm, and 3 mm). Figure 14 provides a comparison of the fracture strain, ultimate stress, and area under the S-S curve for the tensile test specimens located at the left, right, and center positions in both the X and Z directions. This analysis encompasses data from all the blocks. The normality assumptions were not met for the fracture strain and ultimate stress, so a Kruskal–Wallis test was conducted. The p-values obtained from the Kruskal–Wallis test on the fracture strain and ultimate stress were 0.96806 and 0.89004, respectively. For the area under the S-S curve, the normality and the homogeneity assumptions were met, and the one-way ANOVA test was carried out, which yielded a p-value of 0.8043. These p-values indicate that there is insufficient evidence to reject the null hypothesis. In other words, there is not statistically sufficient evidence to support the notion that there are significant differences in the properties across the width of the parts.

3.2.4. The Effect of the Specimens’ Position in the Building Direction

The tensile test specimens are cut at various depths within the blocks. Specifically, in the X and Y directions, specimens are cut from the bottom, middle, middle-top, and top positions of the blocks along the building direction, as depicted in Figure 4 and Figure 5. Each block (1 mm, 2 mm, and 3 mm) has three specimens at each vertical position in each of the X and Y directions, resulting in a total of 18 test specimens for each of the top, middle-top, middle, and bottom positions. To investigate the differences in properties within the depth of the part (in the building direction), the fracture strain, ultimate stress, and area under the S-S curve are compared.
In the case of fracture elongation, the normality assumption was not satisfied, leading to the utilization of the Kruskal–Wallis test, which yielded a p-value of 0.013722. The subsequent pairwise post hoc test (Games–Howell), revealed that a significant difference exists between the means of the specimens of the B-T (bottom-top) pair. Regarding the ultimate stress and the area under the stress–strain curve properties, both the normality and homogeneity assumptions were met. Consequently, a one-way ANOVA test was performed, resulting in p-values of 3.5234 × 10⁻³³ and 2.4632 × 10⁻⁸, respectively. Post hoc testing using Tukey’s HSD method indicated significant differences between the means of the following pairs: B-MT (bottom and middle-top), B-T (bottom–top), M-T (middle–top), and MT-T (middle-top and top). The obtained p-values provide sufficient evidence to reject the null hypothesis, indicating that the means of the compared features are statistically significantly different from each other. This suggests that there are statistically significant variations in the fracture strain, ultimate stress, and the area under the S-S curve across the depth of the part in the building direction. Figure 15 shows the box plots comparing the fracture strain, ultimate stress, and area under stress–strain curve for tensile test specimens located in different positions along the depth of the blocks (building direction) in the X and Y directions (from all blocks).
Figure 16 provides a visual representation of the fluctuations in tensile properties (for the 2 mm block) along the building direction (a part’s height). The illustration focuses on test specimens that were extracted from a 2 mm block in the X and Y directions. This graphic shows the distinctions between the tensile properties of specimens obtained from the uppermost sections (T specimens) of the parts in contrast to those from the lower regions along the building direction (see Figure 5).

3.3. Comparing the Tensile Properties of AFSD Blocks and the Feedstock

Tensile test specimens were cut from the AA6061 feedstock material, following the introduced design as depicted in Figure 3. These specimens were subjected to tensile testing, and the resulting outcomes were then compared against specimens that were extracted from the 1 mm, 2 mm, and 3 mm as-deposited blocks in the X direction (see Figure 4). Figure 17 illustrates the findings of this examination. Evidently, a trend emerges wherein specimens that were cut from the as-deposited blocks consistently exhibit larger fracture strain characteristics coupled with a distinct reduction in ultimate strength, setting them apart from their feedstock counterparts. Remarkably, these findings correspond harmoniously with the patterns illuminated by the microhardness analysis of feedstock versus as-deposited blocks, which is presented in subsequent sections.

3.4. Vickers Microhardness Distribution

Slices were cut from the as-deposited blocks (see Figure 6) to conduct Vickers microhardness tests along three vertical lines for each slice. The microhardness values were measured at 30 points on each line (left, center, and right) along the building direction. Figure 18 depicts the study’s findings, illustrating the microhardness values along the three lines in each block’s cross-section as well as trendlines indicating the value trends and their averages. A statistical analysis was conducted to investigate the effect of the deposition layer thickness on the microhardness characteristics of the fabricated parts. To facilitate this examination, the microhardness measurements were categorized into three distinct groups based on the layer thickness of the respective part from which they were obtained. Each group comprised 90 data points, representing 30 measurements taken along three vertical lines within the cross-sectional area of the block. Due to the non-normal distribution of the data, a Kruskal–Wallis test was employed to explore potential differences in the means across the three groups. The Kruskal–Wallis test yielded a p-value of 2.95226 × 10⁻⁸, signifying a statistically significant difference in the means of the groups under investigation. Consequently, it can be inferred that the thickness of the deposition layer does, indeed, have a statistically significant impact on the microhardness properties of the as-deposited parts within the cross-sectional plane. Subsequent pairwise post hoc tests (Games–Howell) further showed that the differences between the 1 mm–2 mm and 2 mm–3 mm pairs are statistically significant.
To investigate the microhardness distribution across the width of the fabricated parts, measurements were taken along lines positioned at the left, center, and right sides of the cross-sectional area (see Figure 6). Different statistical analyses were conducted for each block configuration to assess the variations in the data collected from different positions (left, right, and center). For the 1 mm and 2 mm blocks, where the normality assumption was violated, a Kruskal–Wallis test was applied, yielding significant differences with p-values of 5.69197 × 10⁻⁵ and 0.018067, respectively. Subsequent pairwise post hoc tests (Games–Howell) revealed that the left-center and right-center pairs exhibited statistically significant differences in means. However, in the case of the 3 mm block, the Kruskal–Wallis test, also applied due to the violation of the normality assumption, resulted in a p-value of 0.90969. This suggests that in the 3 mm block case, the null hypothesis cannot be rejected, signifying no statistically significant difference between the means of this group. Consequently, it can be concluded that there is compelling evidence to support the assertion that microhardness values statistically significantly vary across the width of the part’s cross-section for the 1 mm and 2 mm blocks, while no such difference is observed in the case of the 3 mm block.
Additionally, the graphs in Figure 18 reveal a non-linear decrease in microhardness values along the measured lines for all blocks. The decrease is more pronounced at higher layers (top of the blocks) and levels off as measurement points approach the bottom of the part. This phenomenon can be attributed to the temperature history experienced by the parts during processing, which is discussed in detail in the next section. The tensile test results for the test specimens that were cut from various positions along the height of the parts were discussed in the preceding section. Consistent with the microhardness measurements, the test specimens taken from the top of the cross-section (in the building direction) exhibit notably higher ultimate stresses and lower elongations compared to the test specimens from the lower parts (see Figure 15).
Furthermore, Figure 19 presents a comparison of the average microhardness values for the three blocks and the feedstock material. The microhardness values obtained for the as-deposited parts are notably lower than those measured for the feedstock material, and this observation aligns with the outcomes of the tensile tests. For the as-deposited blocks (1 mm, 2 mm, and 3 mm), the graph indicates that the average measured microhardness values are slightly smaller for the 1 mm block in comparison to the 2 mm and 3 mm blocks. Moreover, it shows that the 3 mm block exhibits lower average microhardness values than the 2 mm block.

4. Discussion

In the previous section, it was demonstrated that blocks with different layer thicknesses exhibit distinct mechanical properties. In this section, a comparison is made between the blocks to assess their respective temperature histories during deposition. Furthermore, the torque applied on the deposition tool and the reaction force exerted on the feedstock material are also investigated in order to elucidate the differences observed among the blocks.

4.1. Applied Torque on the Deposition Tool

During the deposition process, the torque exerted on the deposition tool is generated by the spindle motor of the machine. The spindle motor rotates the deposition tool at a predetermined speed as specified in the G-code instructions. In this study, all the deposited materials were processed using a deposition tool with a rotational speed of 300 revolutions per minute (rpm). The torque applied to the deposition tool during the deposition of a 1 mm block is illustrated in Figure 20. This figure displays the maximum, minimum, and average torque values that were recorded throughout the deposition of each layer.
Blocks with layer thicknesses of 1 mm, 2 mm, and 3 mm were deposited. The height of the larger protrusions is larger than 2 mm (see Figure 2). In the case of thinner layers, the protrusions on the deposition tool make deeper engagements with the previously deposited material or the substrate as the tool traverses. Due to the lower temperature of the previously deposited part or substrate in comparison to the material being deposited, an increase in the torque applied on the deposition tool occurs, resulting in more heat generation. Specifically, for the 1 mm block, the larger protrusions penetrate more than 1 mm into the deposited layer or substrate, whereas in the case of the 3 mm block, the protrusions do not make any contact with the previously deposited layer or substrate. The average torque values were computed for each layer during the deposition of every block. Figure 21 presents the calculated average torque values for each layer during the deposition of the 1 mm, 2 mm, and 3 mm blocks.

4.2. Reaction Force during Deposition

The feedstock material is propelled downward by the push rod as it passes through the rotating deposition tool. The actuator ensures a consistent feed rate, specified in the G-code, throughout the deposition process. In this study, all blocks were deposited at a constant feed rate of 152 mm per minute (6 in/minute). The machine calculates and records the reaction force exerted on the feedstock rod and push rod. Figure 22 shows the maximum, minimum, and average of the reaction force applied on the pushing rod during the deposition of the 1 mm block.
The reaction force comprises two components. Firstly, it includes the force applied by the rotating rod against the as-deposited layer or substrate, contributing to the generation of friction and the displacement of plastically deformed material away from the center of the deposition tool. Secondly, the reaction force encompasses the vertical force exerted on the system due to the friction between the feedstock rod and the inner surface of the deposition tool. As the temperature of the rotating rod increases, the feedstock material becomes more malleable and deforms under the pressure exerted by the push rod. This deformation causes the expanded feedstock rod to come into contact with the inner surface of the deposition tool, resulting in friction at the lower edge. Improperly configured deposition parameters can lead to the feedstock rod jamming within the tool due to this friction force.
The average reaction force values were computed for each layer during the deposition of every block. Figure 23 presents the calculated average reaction force values for each layer during the deposition of the 1 mm, 2 mm, and 3 mm blocks.

4.3. Correlation between Torque and Force

During the rotation of the deposition tool, heat is generated, leading to an increase in material malleability due to elevated temperatures. To maintain a constant feed rate and flow to the plastically deformed material, the feedstock rod is pushed down during the process. The reaction force applied on the feedstock rod and the push rods is measured and recorded by the machine. The rise in temperature and material malleability affect the reaction force at a constant feed rate (the feed rate is the same for all the blocks), with a smaller reaction force associated with a more malleable material. Additionally, the degree of the material’s malleability may influence the torque that is required to maintain a constant rotation speed of the tool (the tool’s rotation speed is the same for all blocks). Therefore, it is expected that the reaction force and applied torque are correlated, with their increase and decrease synchronized. Figure 24 displays the correlation coefficient between the torque that is applied on the deposition tool and the reaction force applied on the feedstock rod during the deposition process of blocks with thicknesses of 1 mm, 2 mm, and 3 mm. The graphs indicate inconsistencies in the torque and force correlations, particularly in the case of the 2 mm block, as evidenced by the significant change in correlation coefficients compared to the other two blocks.
As the rod is continuously pushed downwards from the top, the deformation of the rod initiates at the interface where its rotating lower surface comes into contact with the stationary substrate or the previously deposited layer. With a rising temperature, the rod undergoes further deformation within the stirring zone due to the pressure exerted from the top. This deformation causes the rod to touch the inside surface of the deposition tool. The resulting contact generates a friction force that needs to be counteracted by the force that is applied from the push rod to facilitate the smooth flow of the material.
Prior to being fed into the machine, the feedstock rods are coated with a graphite coating, serving as a dry lubricant, to reduce the friction force that was previously mentioned. The application of a graphite coating for this study was manually conducted on the rods used. As a result, variations in the amount of graphite coating on the rods’ surfaces may introduce inconsistencies in the friction force and subsequently affect the recorded reaction forces. Furthermore, subtle changes in material deformation can contribute to variations in the calculated forces. Consequently, the recorded reaction forces from the machine may not consistently reflect the actual forces applied on the deposited rods.

4.4. Substrate Temperature and Temperature History

A thermocouple was positioned on the substrate during the deposition process of the blocks to monitor the temperature at a fixed location (see Figure 6). The recorded data provided information on the temperature profile at that specific point. In Figure 25, the substrate temperature values, including the maximum and minimum temperatures, are presented, reflecting the temperature of a specific point during the deposition of layers in the 1 mm block.
The rotating deposition tool generates the highest temperature in the zone beneath it (see Figure 2). As the tool traverses, the temperature of the freshly deposited material decreases. The blocks used for this study were fabricated using a layer-by-layer approach, maintaining a consistent track length from the bottom to the top layer. As the deposition tool approached the location of the thermocouple, the temperature at that point increased due to heat conduction. Conversely, as the tool moved away, the temperature decreased. Each point within the deposited block experiences these temperatures’ rise and fall cycles throughout the process, with the number of cycles varying based on its position. For example, a point in the first layer undergoes heating and reheating cycles corresponding to the number of layers deposited in the block, whereas a point in the third layer from the top may experience only two or three cycles. Additionally, as the deposition progresses, the temperature of the entire block gradually rises due to heat accumulation. Figure 25 illustrates these heating and reheating cycles, as well as the overall temperature increase during the deposition of the 1 mm block. Over time, the temperature changes in the block may appear less pronounced due to heat dissipation from the block’s sides and the substrate through convection and conduction, as well as heat generation from the deposition of new layers. The average substrate temperature values were computed for each layer during the deposition of every block. Figure 26 presents the calculated values for each layer during the deposition of the 1 mm, 2 mm, and 3 mm blocks.

4.5. Effect of Temperature History on Microstructure

In the AFSD manufacturing process, the mixture of a high temperature and strain rate leads to dynamic recrystallization of the material being deposited [1,29,66]. Consequently, the as-deposited material exhibits smaller equiaxed grain sizes compared to the feedstock material [29,31]. Zeng et al. reported a grain size of 8.5 ± 3 μm for the as-deposited AA6061 parts and 163.5 ± 96 μm for the feedstock material [29]. Zeng et al. exhibited the EBSD inverse pole figure (IPF) orientation maps of the regions in the cross-section of an as-deposited AA6061 part [29]. Their observations revealed that the grain sizes in the building direction remain unchanged, and there is a symmetric grain structure relative to the central line of the part’s cross-section. Based on this study, the microhardness values change along the width of the part as well as in the building direction. This finding indicates that the finer grain sizes resulting from dynamic recrystallization do not explain the observed change in microhardness values in the as-deposited part and its variation in the building direction and the width of the parts’ cross-sections.
To investigate the phase structure of AA6061 during the AFSD process, Zeng et al. employed Thermo-Calc software (2021b) to predict the composition and amount of different phases in AA6061 at different temperatures [29]. They also conducted X-ray diffraction (XRD) characterization of both the AA6061 feedstock and the as-deposited part, comparing the results to analyze any changes [29]. The XRD analysis revealed a decrease in the lattice parameters of the as-deposited material compared to the feedstock. This observation led them to conclude that the precipitates in the material had dissolved back into the aluminum matrix due to AFSD processing [29]. Similarly, Phillips et al. reported the dissolution of the strengthening precipitant due to AFSD processing [58]. This phenomenon was attributed to the temperature history experienced by the material during the AFSD process. To further investigate this phenomenon, Zeng et al. conducted a study to analyze the composition distribution in both the feedstock and as-deposited material using Energy-Dispersive X-ray Spectroscopy (EDS) mapping [29]. The researchers compared the distribution of the macro-sized precipitates of magnesium (Mg) and silicon (Si) elements between the two samples. The results revealed a uniform distribution of precipitates in the feedstock material [29,78]. However, in the as-deposited parts, the precipitates exhibited growth and increased in size compared to the feedstock material. This observation led the researchers to propose that the growth of precipitates occurs during the thermophysical process of AFSD [29].

4.6. Effect of Deposition Layer Thickness on Mechanical Properties

AA6061 is a precipitate-hardened alloy [79]. AFSD components undergo a dynamic heat treatment process throughout their manufacturing process, which significantly influences the size and distribution of precipitates, thereby impacting the microstructural and mechanical properties of the resulting part [58,66]. This phenomenon is affected by the temperature history experienced by the part during the deposition. Notably, the different deposition layer thicknesses of 1 mm, 2 mm, and 3 mm impart distinct thermal histories to the blocks during the deposition procedure, resulting in different mechanical properties of samples taken from different blocks. Additionally, different regions of a specific part experience varying temperature histories depending on their positioning within the part along the building direction. This disparity in temperature profiles accounts for the variations in tensile strength between samples taken from the top and bottom regions of the cross-section in the building direction, as well as the variations in the microhardness value measured along the building direction and across the parts’ widths.

5. Conclusions

The effects of the AFSD deposition layer thickness were studied. Three Al6061 blocks with layer thicknesses of 1 mm, 2 mm, and 3 mm were fabricated using AFSD. Tensile test specimens were cut from the as-deposited blocks, tests were carried out, and stress–strain curves were generated for each specimen. A set of statistical analysis tools was employed to assess differences in tensile properties among specimen groups. Also, a comparative study was conducted between the tensile properties of specimens sourced from as-deposited parts and feedstock material. The key findings from the tensile property investigation include:
  • The layer thickness of deposition affects the tensile properties of the as-deposited part in the Z direction. Specifically, the Z specimens derived from the 1 mm block showed considerably smaller fracture strains and ultimate stress values compared to their counterparts from the other two blocks. This can be a result of the effect of the layer thickness (where there are more defects in the gauge section of the test specimens in case of a thinner layer thickness of deposition) as well as the difference among the temperature histories experienced by each block. The disparities in the tensile properties between the specimens cut from the uppermost sections of the parts (which displayed higher ultimate stress levels and smaller fracture strains) and those from the lower regions along the building direction are notably pronounced.
  • The tensile properties in the X and Y directions exhibited no noteworthy distinctions across the three blocks (1 mm, 2 mm, and 3 mm). For properties across the part’s width, p-values from the statistical test indicated no compelling evidence to confirm substantial differences. The tensile properties remained consistent across the part’s width.
  • Specimens derived from the as-deposited blocks consistently displayed increased fracture strain attributes and distinct reductions in ultimate strength when compared to their feedstock counterparts.
Vickers microhardness examinations were conducted at 30 points along each of the three vertical lines, spanning the center, left, and right on the cross-sections of the as-deposited blocks. The key findings related to Vickers microhardness properties encompassed:
  • Microhardness values exhibited a non-linear decline along the measured lines for all blocks, with more pronounced decreases at higher layers, leveling off as measurement points nearer the part’s bottom. The microhardness values obtained for the as-deposited parts are notably lower than those measured for the feedstock material.
  • The statistical analysis of data showed that the thickness of the deposition layer has an impact on the microhardness properties of the as-deposited parts within the cross-sectional plane. The average microhardness values for the 1 mm block were marginally lower compared to the 2 mm and 3 mm blocks. Across the width of the part’s cross-section for the 1 mm and 2 mm blocks, the microhardness values along the center line are slightly smaller than those along the left and right lines. However, no such difference was observed in the case of the 3 mm block.
The deposition layer thicknesses affect the thermal histories of the AFSD blocks during the deposition procedure. Consequently, parts deposited with various layer thicknesses have different mechanical properties. Additionally, different regions of a specific part experience varying temperature histories depending on their positioning within the part along the building direction. These disparities in temperature history cause variations in the mechanical properties both in the building direction and across the width of the as-deposited part.

Author Contributions

Conceptualization, H.G.; Methodology, H.G.; Software, H.G.; Validation, H.G.; Formal analysis, H.G.; Investigation, H.G.; Resources, H.G., M.T., H.D. and S.E.; Data curation, H.G.; Writing—original draft, H.G.; Writing—review and editing, H.G. and S.G.; Supervision, S.G.; Project administration, H.G., H.D., S.E. and M.T.; Funding acquisition, S.G. All authors have read and agreed to the published version of the manuscript.

Funding

This work is supported by the Center for Innovations in Structural Integrity Assurance (CISIA), a National Science Foundation (NSF) Industry/University Cooperative Research Center (Award number 2052810). The use of instruments housed within the LSU Shared Instrumentation Facilities (SIF), a part of LAMDA (Grant Number NSF #OIA-1946231) Core User Facilities, is acknowledged.

Data Availability Statement

The raw data required to reproduce these findings are available to download from https://github.com/HamedGhadimi/AFSD_AA6061_Data. The processed data required to reproduce these findings are available to download from https://github.com/HamedGhadimi/AFSD_AA6061_Data. Accessed on 13 January 2024.

Conflicts of Interest

The authors declare that they have no known competing financial interests or personal relationships that could have appeared to influence the work reported in this paper.

References

  1. Dong, H.; Li, X.; Xu, K.; Zang, Z.; Liu, X.; Zhang, Z.; Xiao, W.; Li, Y. A Review on Solid-State-Based Additive Friction Stir Deposition. Aerospace 2022, 9, 565. [Google Scholar] [CrossRef]
  2. Williams, M.B.; Robinson, T.W.; Williamson, C.J.; Kinser, R.P.; Ashmore, N.A.; Allison, P.G.; Jordon, J.B. Elucidating the Effect of Additive Friction Stir Deposition on the Resulting Microstructure and Mechanical Properties of Magnesium Alloy WE43. Metals 2021, 11, 1739. [Google Scholar] [CrossRef]
  3. Shao, J.; Samaei, A.; Xue, T.; Xie, X.; Guo, S.; Cao, J.; MacDonald, E.; Gan, Z. Additive friction stir deposition of metallic materials: Process, structure and properties. Mater. Des. 2023, 234, 112356. [Google Scholar] [CrossRef]
  4. Garcia, D.; Hartley, W.D.; Rauch, H.A.; Griffiths, R.J.; Wang, R.; Kong, Z.J.; Zhu, Y.; Yu, H.Z. In Situ Investigation into Temperature Evolution and Heat Generation during Additive Friction Stir Deposition: A Comparative Study of Cu and Al-Mg-Si. Addit. Manuf. 2020, 34, 101386. [Google Scholar] [CrossRef]
  5. Mukhopadhyay, A.; Saha, P. A critical review on process metrics–microstructural evolution–process performance correlation in additive friction stir deposition (AFS-D). J. Braz. Soc. Mech. Sci. Eng. 2022, 44, 422. [Google Scholar] [CrossRef]
  6. Yu, H.Z.; Mishra, R.S. Additive friction stir deposition: A deformation processing route to metal additive manufacturing. Mater. Res. Lett. 2020, 9, 71–83. [Google Scholar] [CrossRef]
  7. Stubblefield, G.G.; Fraser, K.A.; Van Iderstine, D.; Mujahid, S.; Rhee, H.; Jordon, J.B.; Allison, P.G. Elucidating the influence of temperature and strain rate on the mechanics of AFS-D through a combined experimental and computational approach. J. Mater. Process. Technol. 2022, 305, 117593. [Google Scholar] [CrossRef]
  8. Palanivel, S.M.; Rajiv, S. Building without melting: A short review of friction-based additive manufacturing techniques. Int. J. Addit. Subtractive Mater. Manuf. 2017, 1, 82–103. [Google Scholar] [CrossRef]
  9. Mishra, R.S.; Haridas, R.S.; Agrawal, P. Friction stir-based additive manufacturing. Sci. Technol. Weld. Join. 2022, 27, 141–165. [Google Scholar] [CrossRef]
  10. MELD Manufacturing Corporation. Available online: https://www.meldmanufacturing.com/ (accessed on 16 September 2023).
  11. Khodabakhshi, F.; Gerlich, A.P. Potentials and strategies of solid-state additive friction-stir manufacturing technology: A critical review. J. Manuf. Process. 2018, 36, 77–92. [Google Scholar] [CrossRef]
  12. Calvert, J.R. Microstructure and Mechanical Properties of We43 Alloy Produced via Additive Friction Stir Technology. Master’s Thesis, Virginia Tech University, Blacksburg, VA, USA, 29 June 2015. [Google Scholar]
  13. Perry, M.E.J.; Griffiths, R.J.; Garcia, D.; Sietins, J.M.; Zhu, Y.; Yu, H.Z. Morphological and microstructural investigation of the non-planar interface formed in solid-state metal additive manufacturing by additive friction stir deposition. Addit. Manuf. 2020, 35, 101293. [Google Scholar] [CrossRef]
  14. Yu, H.Z.; Jones, M.E.; Brady, G.W.; Griffiths, R.J.; Garcia, D.; Rauch, H.A.; Cox, C.D.; Hardwick, N. Non-beam-based metal additive manufacturing enabled by additive friction stir deposition. Scr. Mater. 2018, 153, 122–130. [Google Scholar] [CrossRef]
  15. Kandasamy, K. Solid State Joining Using Additive Frction Stir Processing. U.S. Patent 9,511,445 B2, 6 December 2016. [Google Scholar]
  16. Innovation Meets Function: Aeroprobe Corporation Commercializes Patented MELD Technology, a Revolutionary Manufacturing Process for Metal. Available online: https://www.meldmanufacturing.com/innovation-meets-function-aeroprobe-corporation-commercializes-patented-meld-technology-a-revolutionary-manufacturing-process-for-metal/ (accessed on 16 September 2023).
  17. Griffiths, R.J.; Garcia, D.; Song, J.; Vasudevan, V.K.; Steiner, M.A.; Cai, W.; Yu, H.Z. Solid-state additive manufacturing of aluminum and copper using additive friction stir deposition: Process-microstructure linkages. Materialia 2021, 15, 100967. [Google Scholar] [CrossRef]
  18. Gopan, V.; Leo Dev Wins, K.; Surendran, A. Innovative potential of additive friction stir deposition among current laser based metal additive manufacturing processes: A review. CIRP J. Manuf. Sci. Technol. 2021, 32, 228–248. [Google Scholar] [CrossRef]
  19. Griffiths, R.J.; Perry, M.E.J.; Sietins, J.M.; Zhu, Y.; Hardwick, N.; Cox, C.D.; Rauch, H.A.; Yu, H.Z. A Perspective on Solid-State Additive Manufacturing of Aluminum Matrix Composites Using MELD. J. Mater. Eng. Perform. 2018, 28, 648–656. [Google Scholar] [CrossRef]
  20. Kincaid, J.; Charles, E.; Garcia, R.; Dvorak, J.; No, T.; Smith, S.; Schmitz, T. Process planning for hybrid manufacturing using additive friction stir deposition. Manuf. Lett. 2023, 37, 26–31. [Google Scholar] [CrossRef]
  21. Kincaid, J.; Zameroski, R.; No, T.; Bohling, J.; Compton, B.; Schmitz, T. Hybrid Manufacturing: Combining Additive Friction Stir Deposition, Metrology, and Machining. In Proceedings of the TMS Annual Meeting & Exhibition, San Diego, CA, USA, 19–23 March 2023. [Google Scholar]
  22. Hartley, W.D.; Garcia, D.; Yoder, J.K.; Poczatek, E.; Forsmark, J.H.; Luckey, S.G.; Dillard, D.A.; Yu, H.Z. Solid-state cladding on thin automotive sheet metals enabled by additive friction stir deposition. J. Mater. Process. Technol. 2021, 291, 117045. [Google Scholar] [CrossRef]
  23. Avery, D.Z.; Cleek, C.E.; Phillips, B.J.; Rekha, M.Y.; Kinser, R.P.; Rao, H.M.; Brewer, L.N.; Allison, P.G.; Jordon, J.B. Evaluation of Microstructure and Mechanical Properties of Al-Zn-Mg-Cu Alloy Repaired via Additive Friction Stir Deposition. J. Eng. Mater. Technol. 2022, 144, 031003. [Google Scholar] [CrossRef]
  24. Griffiths, R.J.; Petersen, D.T.; Garcia, D.; Yu, H.Z. Additive Friction Stir-Enabled Solid-State Additive Manufacturing for the Repair of 7075 Aluminum Alloy. Appl. Sci. 2019, 9, 3486. [Google Scholar] [CrossRef]
  25. Martin, L.P.; Luccitti, A.; Walluk, M. Repair of aluminum 6061 plate by additive friction stir deposition. Int. J. Adv. Manuf. Technol. 2021, 118, 759–773. [Google Scholar] [CrossRef]
  26. Agrawal, P.; Haridas, R.S.; Yadav, S.; Thapliyal, S.; Gaddam, S.; Verma, R.; Mishra, R.S. Processing-structure-property correlation in additive friction stir deposited Ti-6Al-4V alloy from recycled metal chips. Addit. Manuf. 2021, 47, 102259. [Google Scholar] [CrossRef]
  27. Jordon, J.B.; Allison, P.G.; Phillips, B.J.; Avery, D.Z.; Kinser, R.P.; Brewer, L.N.; Cox, C.; Doherty, K. Direct recycling of machine chips through a novel solid-state additive manufacturing process. Mater. Des. 2020, 193, 108850. [Google Scholar] [CrossRef]
  28. Chemin, A.E.A.; Afonso, C.M.; Pascoal, F.A.; Maciel, C.I.d.S.; Ruchert, C.O.F.T.; Bose Filho, W.W. Characterization of phases, tensile properties, and fracture toughness in aircraft-grade aluminum alloys. Mater. Des. Process. Commun. 2019, 1, 1–13. [Google Scholar] [CrossRef]
  29. Zeng, C.; Ghadimi, H.; Ding, H.; Nemati, S.; Garbie, A.; Raush, J.; Guo, S. Microstructure Evolution of Al6061 Alloy Made by Additive Friction Stir Deposition. Materials 2022, 15, 3676. [Google Scholar] [CrossRef] [PubMed]
  30. Nemati, S.; Butler, L.G.; Ham, K.; Knapp, G.L.; Zeng, C.; Emanet, S.; Ghadimi, H.; Guo, S.; Zhang, Y.; Bilheux, H. Neutron Imaging of Al6061 Prepared by Solid-State Friction Stir Additive Manufacturing. Metals 2023, 13, 188. [Google Scholar] [CrossRef]
  31. Ghadimi, H.; Ding, H.; Emanet, S.; Talachian, M.; Cox, C.; Eller, M.; Guo, S. Hardness Distribution of Al2050 Parts Fabricated Using Additive Friction Stir Deposition. Materials 2023, 16, 1278. [Google Scholar] [CrossRef]
  32. Ahmed, M.M.Z.; El-Sayed Seleman, M.M.; Elfishawy, E.; Alzahrani, B.; Touileb, K.; Habba, M.I.A. The Effect of Temper Condition and Feeding Speed on the Additive Manufacturing of AA2011 Parts Using Friction Stir Deposition. Materials 2021, 14, 6396. [Google Scholar] [CrossRef] [PubMed]
  33. Anderson-Wedge, K.; Stubblefield, G.; Zhu, N.; Long, B.; Daniewicz, S.R.; Allison, P.; Sowards, J.; Rodriguez, O.; Amaro, R. Characterization of the evolution of 2219-T87 aluminum as a function of the friction stir welding process. Int. J. Fatigue 2021, 142, 105954. [Google Scholar] [CrossRef]
  34. Rivera, O.G.; Allison, P.G.; Brewer, L.N.; Rodriguez, O.L.; Jordon, J.B.; Liu, T.; Whittington, W.R.; Martens, R.L.; McClelland, Z.; Mason, C.J.T.; et al. Influence of texture and grain refinement on the mechanical behavior of AA2219 fabricated by high shear solid state material deposition. Mater. Sci. Eng. A 2018, 724, 547–558. [Google Scholar] [CrossRef]
  35. Phillips, B.J.; Williamson, C.J.; Kinser, R.P.; Jordon, J.B.; Doherty, K.J.; Allison, P.G. Microstructural and Mechanical Characterization of Additive Friction Stir-Deposition of Aluminum Alloy 5083 Effect of Lubrication on Material Anisotropy. Materials 2021, 14, 6732. [Google Scholar] [CrossRef]
  36. Li, Y.; Yang, B.; Zhang, M.; Wang, H.; Gong, W.; Lai, R.; Li, Y.; Teng, J. The corrosion behavior and mechanical properties of 5083 Al-Mg alloy manufactured by additive friction stir deposition. Corros. Sci. 2023, 213, 110972. [Google Scholar] [CrossRef]
  37. Shen, Z.; Zhang, M.; Li, D.; Liu, X.; Chen, S.; Hou, W.; Ding, Y.; Sun, Z.; Su, Y.; Li, W.; et al. Microstructural characterization and mechanical properties of AlMg alloy fabricated by additive friction stir deposition. Int. J. Adv. Manuf. Technol. 2023, 125, 2733–2741. [Google Scholar] [CrossRef]
  38. Rekha, M.Y.; Avery, D.; Allison, P.G.; Jordon, J.B.; Brewer, L. Nanostructure Evolution in AA7075 Alloy Produced by Solid State Additive Manufacturing—Additive Friction Stir—Deposition. Microsc. Microanal. 2021, 27, 3118–3119. [Google Scholar] [CrossRef]
  39. Avery, D.Z.; Phillips, B.J.; Mason, C.J.T.; Palermo, M.; Williams, M.B.; Cleek, C.; Rodriguez, O.L.; Allison, P.G.; Jordon, J.B. Influence of Grain Refinement and Microstructure on Fatigue Behavior for Solid-State Additively Manufactured Al-Zn-Mg-Cu Alloy. Metall. Mater. Trans. A 2020, 51, 2778–2795. [Google Scholar] [CrossRef]
  40. Stubblefield, G.G.; Williams, M.B.; Munther, M.; Tew, J.Z.; Rowe, R.A.; Barkey, M.E.; Jordon, J.B.; Allison, P.G. Ballistic Evaluation of Aluminum Alloy (AA) 7075 Plate Repaired by Additive Friction Stir Deposition Using AA7075 Feedstock. J. Dyn. Behav. Mater. 2022, 9, 79–89. [Google Scholar] [CrossRef]
  41. Yu, H.Z.; Hahn, G.D. Potential and challenges for large-scale near-net-shaping of 7xxx aerospace grade aluminum via additive friction stir deposition. Mater. Lett. X 2023, 19, 100217. [Google Scholar] [CrossRef]
  42. Farabi, E.; Babaniaris, S.; Barnett, M.R.; Fabijanic, D.M. Microstructure and mechanical properties of Ti6Al4V alloys fabricated by additive friction stir deposition. Addit. Manuf. Lett. 2022, 2, 100034. [Google Scholar] [CrossRef]
  43. Sharma, S.; Mani Krishna, K.V.; Radhakrishnan, M.; Pantawane, M.V.; Patil, S.M.; Joshi, S.S.; Banerjee, R.; Dahotre, N.B. A pseudo thermo-mechanical model linking process parameters to microstructural evolution in multilayer additive friction stir deposition of magnesium alloy. Mater. Des. 2022, 224, 111412. [Google Scholar] [CrossRef]
  44. Joshi, S.S.; Sharma, S.; Radhakrishnan, M.; Pantawane, M.V.; Patil, S.M.; Jin, Y.; Yang, T.; Riley, D.A.; Banerjee, R.; Dahotre, N.B. A multi modal approach to microstructure evolution and mechanical response of additive friction stir deposited AZ31B Mg alloy. Sci. Rep. 2022, 12, 13234. [Google Scholar] [CrossRef]
  45. Joshi, S.S.; Patil, S.M.; Mazumder, S.; Sharma, S.; Riley, D.A.; Dowden, S.; Banerjee, R.; Dahotre, N.B. Additive friction stir deposition of AZ31B magnesium alloy. J. Magnes. Alloys 2022, 10, 2404–2420. [Google Scholar] [CrossRef]
  46. Avery, D.Z.; Rivera, O.G.; Mason, C.J.T.; Phillips, B.J.; Jordon, J.B.; Su, J.; Hardwick, N.; Allison, P.G. Fatigue Behavior of Solid-State Additive Manufactured Inconel 625. JOM 2018, 70, 2475–2484. [Google Scholar] [CrossRef]
  47. Rivera, O.G.; Allison, P.G.; Jordon, J.B.; Rodriguez, O.L.; Brewer, L.N.; McClelland, Z.; Whittington, W.R.; Francis, D.; Su, J.; Martens, R.L.; et al. Microstructures and mechanical behavior of Inconel 625 fabricated by solid-state additive manufacturing. Mater. Sci. Eng. A 2017, 694, 1–9. [Google Scholar] [CrossRef]
  48. Joey Griffiths, R.; Gotawala, N.; Hahn, G.D.; Garcia, D.; Yu, H.Z. Towards underwater additive manufacturing via additive friction stir deposition. Mater. Des. 2022, 223, 111148. [Google Scholar] [CrossRef]
  49. Beladi, H.; Farabi, E.; Hodgson, P.D.; Barnett, M.R.; Rohrer, G.S.; Fabijanic, D. Microstructure evolution of 316L stainless steel during solid-state additive friction stir deposition. Philos. Mag. 2022, 102, 618–633. [Google Scholar] [CrossRef]
  50. Agrawal, P.; Haridas, R.S.; Yadav, S.; Thapliyal, S.; Dhal, A.; Mishra, R.S. Additive friction stir deposition of SS316: Effect of process parameters on microstructure evolution. Mater. Charact. 2023, 195, 112470. [Google Scholar] [CrossRef]
  51. Priedeman, J.L.; Phillips, B.J.; Lopez, J.J.; Tucker Roper, B.E.; Hornbuckle, B.C.; Darling, K.A.; Jordon, J.B.; Allison, P.G.; Thompson, G.B. Microstructure Development in Additive Friction Stir-Deposited Cu. Metals 2020, 10, 1538. [Google Scholar] [CrossRef]
  52. Agrawal, P.; Haridas, R.S.; Agrawal, P.; Mishra, R.S. Deformation based additive manufacturing of a metastable high entropy alloy via Additive friction stir deposition. Addit. Manuf. 2022, 60, 103282. [Google Scholar] [CrossRef]
  53. Merritt, G.R.; Williams, M.B.; Allison, P.G.; Jordon, J.B.; Rushing, T.W.; Cousin, C.A. Closed-Loop Temperature and Force Control of Additive Friction Stir Deposition. J. Manuf. Mater. Process. 2022, 6, 92. [Google Scholar] [CrossRef]
  54. Stubblefield, G.G.; Fraser, K.A.; Robinson, T.W.; Zhu, N.; Kinser, R.P.; Tew, J.Z.; Cordle, B.T.; Jordon, J.B.; Allison, P.G. A computational and experimental approach to understanding material flow behavior during additive friction stir deposition (AFSD). Comput. Part. Mech. 2023, 10, 1629–1643. [Google Scholar] [CrossRef]
  55. Stubblefield, G.G.; Fraser, K.; Phillips, B.J.; Jordon, J.B.; Allison, P.G. A meshfree computational framework for the numerical simulation of the solid-state additive manufacturing process, additive friction stir-deposition (AFS-D). Mater. Des. 2021, 202, 109514. [Google Scholar] [CrossRef]
  56. Stubblefield, G.; Fraser, K.; Phillips, B.; Jordon, J.; Allison, P. Smoothed Particle Hydrodynamic Modeling of Additive Friction Stir Deposition Manufacturing of Aluminum Alloy 6061. In Proceedings of the Welding Institute 12th International Symposium on Friction Stir Welding, Chicoutimi, QC, Canada, 26–28 June 2018. [Google Scholar]
  57. Kincaid, K.C.; MacPhee, D.W.; Stubblefield, G.G.; Jordon, J.B.; Rushing, T.W.; Allison, P.G. A Finite Volume Framework for the Simulation of Additive Friction Stir Deposition. J. Eng. Mater. Technol. 2023, 145, 031002. [Google Scholar] [CrossRef]
  58. Phillips, B.J.; Avery, D.Z.; Liu, T.; Rodriguez, O.L.; Mason, C.J.T.; Jordon, J.B.; Brewer, L.N.; Allison, P.G. Microstructure-deformation relationship of additive friction stir-deposition Al–Mg–Si. Materialia 2019, 7, 100387. [Google Scholar] [CrossRef]
  59. Chen, G.; Wu, K.; Wang, Y.; Sun, Y.; Wang, X.; Zhu, Z.; Hu, F. Quantitative study on the correlation between microstructure and mechanical properties of additive friction stir deposited 6061-T6 Al-Mg-Si alloy. J. Mater. Res. Technol. 2023, 25, 6725–6736. [Google Scholar] [CrossRef]
  60. Chen, G.; Wu, K.; Wang, Y.; Zhu, Z.; Nie, P.; Hu, F. Effect of rotational speed and feed rate on microstructure and mechanical properties of 6061 aluminum alloy manufactured by additive friction stir deposition. Int. J. Adv. Manuf. Technol. 2023, 127, 1165–1176. [Google Scholar] [CrossRef]
  61. Zhu, N.; Avery, D.Z.; Chen, Y.; An, K.; Jordon, J.B.; Allison, P.G.; Brewer, L.N. Residual Stress Distributions in AA6061 Material Produced by Additive Friction Stir Deposition. J. Mater. Eng. Perform. 2022, 32, 5535–5544. [Google Scholar] [CrossRef]
  62. Amooie, M.A.; Khonsari, M.M. On the effect of environmental temperature on fracture fatigue entropy. Int. J. Fatigue 2022, 168, 107411. [Google Scholar] [CrossRef]
  63. Sehhat, M.H.; Mahdianikhotbesara, A.; Yadegari, F. Impact of temperature and material variation on mechanical properties of parts fabricated with fused deposition modeling (FDM) additive manufacturing. Int. J. Adv. Manuf. Technol. 2022, 120, 4791–4801. [Google Scholar] [CrossRef]
  64. Mahmoudi, A.; Khonsari, M. Investigation of metal fatigue using a coupled entropy-kinetic model. Int. J. Fatigue 2022, 161, 106907. [Google Scholar] [CrossRef]
  65. Moghanlou, M.R.; Khonsari, M. On the kinetic formulation of fracture fatigue entropy of metals. Fatigue Fract. Eng. Mater. Struct. 2022, 45, 565–577. [Google Scholar] [CrossRef]
  66. Rutherford, B.A.; Avery, D.Z.; Phillips, B.J.; Rao, H.M.; Doherty, K.J.; Allison, P.G.; Brewer, L.N.; Jordon, J.B. Effect of Thermomechanical Processing on Fatigue Behavior in Solid-State Additive Manufacturing of Al-Mg-Si Alloy. Metals 2020, 10, 947. [Google Scholar] [CrossRef]
  67. Zhu, N.; Avery, D.Z.; Rutherford, B.A.; Phillips, B.J.; Allison, P.G.; Jordon, J.B.; Brewer, L.N. The Effect of Anodization on the Mechanical Properties of AA6061 Produced by Additive Friction Stir-Deposition. Metals 2021, 11, 1773. [Google Scholar] [CrossRef]
  68. Gumaste, A.; Dhal, A.; Agrawal, P.; Haridas, R.S.; Vasudevan, V.K.; Weiss, D.; Mishra, R.S. A Novel Approach for Enhanced Mechanical Properties in Solid-State Additive Manufacturing by Additive Friction Stir Deposition Using Thermally Stable Al-Ce-Mg Alloy. JOM 2023, 75, 4185–4198. [Google Scholar] [CrossRef]
  69. Battelle Memorial Institute. Metallic Materials Properties Development and Standardization (MMPDS-17); Battelle Memorial Institute: Columbus, OH, USA, 2022. [Google Scholar]
  70. Ostertagová, E.O. Oskar Methodology and Application of One-way ANOVA. Am. J. Mech. Eng. 2013, 1, 256–261. [Google Scholar]
  71. González-Estrada, E.; Villaseñor, J.A.; Acosta-Pech, R. Shapiro-Wilk test for multivariate skew-normality. Comput. Stat. 2022, 37, 1985–2001. [Google Scholar] [CrossRef]
  72. Gastwirth, J.L.; Gel, Y.R.; Miao, W. The Impact of Levene’s Test of Equality of Variances on Statistical Theory and Practice. Stat. Sci. 2009, 24, 343–360. [Google Scholar] [CrossRef]
  73. Sherwani, R.A.K.; Shakeel, H.; Awan, W.B.; Faheem, M.; Aslam, M. Analysis of COVID-19 data using neutrosophic Kruskal Wallis H test. BMC Med. Res. Methodol. 2021, 21, 215. [Google Scholar] [CrossRef] [PubMed]
  74. Kruskal, W.H.; Wallis, W.A. Use of Ranks in One-Criterion Variance Analysis. J. Am. Stat. Assoc. 1952, 47, 583–621. [Google Scholar] [CrossRef]
  75. Nanda, A.; Mohapatra, D.B.B.; Mahapatra, A.P.K.; Mahapatra, A.P.K.; Mahapatra, A.P.K. Multiple comparison test by Tukey’s honestly significant difference (HSD): Do the confident level control type I error. Int. J. Stat. Appl. Math. 2021, 6, 59–65. [Google Scholar] [CrossRef]
  76. Hilton, A.A.; Richard, A. Statnote 6: Post-hoc ANOVA tests. Microbiologist 2006, 7, 34–36. [Google Scholar]
  77. Ghadimi, H.; Jirandehi, A.P.; Nemati, S.; Ding, H.; Garbie, A.; Raush, J.; Zeng, C.; Guo, S. Effects of Printing Layer Orientation on the High-Frequency Bending-Fatigue Life and Tensile Strength of Additively Manufactured 17-4 PH Stainless Steel. Materials 2023, 16, 469. [Google Scholar] [CrossRef]
  78. Rao, P.N.; Viswanadh, B.; Jayaganthan, R. Effect of cryorolling and warm rolling on precipitation evolution in Al 6061 alloy. Mater. Sci. Eng. A 2014, 606, 1–10. [Google Scholar] [CrossRef]
  79. Feng, A.H.; Chen, D.L.; Ma, Z.Y. Microstructure and Low-Cycle Fatigue of a Friction-Stir-Welded 6061 Aluminum Alloy. Metall. Mater. Trans. A 2010, 41, 2626–2641. [Google Scholar] [CrossRef]
Figure 1. Additive friction stir deposition (AFSD) arrangement.
Metals 14 00101 g001
Figure 2. Deposition properties and the deposition tool’s geometry.
Metals 14 00101 g002
Figure 3. X, Y, and Z coordinate definition, tensile test specimen dimensions, and the specimens’ arrangement in the as-deposited blocks (1 mm, 2 mm, and 3 mm layer thickness blocks).
Metals 14 00101 g003
Figure 4. Tension test specimen arrangements in X, Y, and Z directions in the as-deposited blocks and the naming of the specimens for 1 mm block (similarly for 2 mm and 3 mm blocks).
Metals 14 00101 g004
Figure 5. Specimens naming for the tensile test specimens in X direction for 1 mm as-deposited AFSD block (similarly for 2 mm and 3 mm blocks).
Metals 14 00101 g005
Figure 6. Deposited part’s cross-section and Vickers microhardness test specimens and location.
Metals 14 00101 g006
Figure 7. Layer arrangements and boundaries in the polished and etched cross-sections of 1 mm, 2 mm, and 3 mm blocks.
Metals 14 00101 g007
Figure 8. Comparing fracture strain, ultimate stress, and area under stress–strain curve for tensile test specimens in 1 mm, 2 mm, and 3 mm blocks (from all directions).
Metals 14 00101 g008
Figure 9. Comparing fracture strain, ultimate stress, and area under stress–strain curve for tensile test specimens in 1 mm, 2 mm, and 3 mm blocks for X direction.
Metals 14 00101 g009
Figure 10. Comparing fracture strain, ultimate stress, and area under stress–strain curve for tensile test specimens in 1 mm, 2 mm, and 3 mm blocks for Y direction.
Metals 14 00101 g010
Figure 11. Comparing fracture strain, ultimate stress, and area under stress–strain curve for tensile test specimens in 1 mm, 2 mm, and 3 mm blocks for Z direction.
Metals 14 00101 g011
Figure 12. Comparing (a) fracture strain, (b) ultimate stress, and (c) area under stress–strain curve for tensile test specimens in X, Y, and Z directions (from all blocks).
Metals 14 00101 g012
Figure 13. Comparing fracture strain, ultimate stress, and area under stress–strain curve for tensile test specimens in X, Y, and Z directions for 2 mm block.
Metals 14 00101 g013
Figure 14. Comparing (a) fracture strain, (b) ultimate stress, and (c) area under stress–strain curve for tensile test specimens in left, right, and center of the blocks in X and Z directions (from all blocks).
Metals 14 00101 g014
Figure 15. Comparing (a) fracture strain, (b) ultimate stress, and (c) area under stress–strain curve for tensile test specimens located in different positions along the depth of the blocks (building direction) in X and Y directions (from all blocks).
Metals 14 00101 g015
Figure 16. Stress–strain curves for tensile test specimens located in different positions along the depth of the blocks (building direction) in X and Y directions for 2 mm block.
Metals 14 00101 g016
Figure 17. Comparing the tensile strength of test specimens cut from the AA6061 feedstock against test specimens cut from 1 mm (top graphs), 2 mm (middle graphs), and 3 mm (bottom graphs) AFSD as-deposited blocks in X direction.
Metals 14 00101 g017
Figure 18. Microhardness measurements for 1 mm, 2 mm, and 3 mm blocks and the feedstock material.
Metals 14 00101 g018
Figure 19. Microhardness measurements for 1 mm, 2 mm, and 3 mm blocks and the feedstock material.
Metals 14 00101 g019
Figure 20. Applied torque on the deposition tool during deposition process of AFSD built with 1 mm layer thickness.
Metals 14 00101 g020
Figure 21. Average of torque values applied on the deposition tool during deposition of each layer for 1 mm, 2 mm, and 3 mm block.
Metals 14 00101 g021
Figure 22. Maximum, minimum, and average of the reaction force applied on the pushing rod during the deposition of layers of 1 mm block.
Metals 14 00101 g022
Figure 23. Average of reaction force values applied on the feedstock rod/push rod during deposition of each layer for 1 mm, 2 mm, and 3 mm block.
Metals 14 00101 g023
Figure 24. Correlation between the force applied on the feedstock rod and the torque applied on the deposition tool during the deposition of 1 mm, 2 mm, and 3 mm blocks.
Metals 14 00101 g024
Figure 25. Maximum and minimum of the substrate temperature during the deposition of layers of the 1 mm block.
Metals 14 00101 g025
Figure 26. Average of substrate temperature values during deposition of each layer for 1 mm, 2 mm, and 3 mm block.
Metals 14 00101 g026
Table 1. Physical and mechanical properties of AA6061 (T6 temper) wrought alloy (specification: AMS 4117) [69].
PropertyValueUnit
E, modulus of elasticity68.3GPa
G, modulus of rigidity26.2GPa
Poisson′s ratio0.33-
Density2713Kg/m3
Ultimate tensile stress290MPa
Tensile yield stress241MPa
Table 2. Deposition parameters for the samples (1 mm, 2 mm, and 3 mm block).
Part’s NameDeposition Layer Thickness (mm)Deposition Tool’s Rotation Speed (rpm)Tool’s Traverse Speed (mm/min)Feed Rate (mm/min)
Sample #1 (1 mm block)1 (0.04 in)300279.4 (11.0 in/min)152.4 (6.0 in/min)
Sample #2 (2 mm block)2 (0.08 in)300127.0 (5.0 in/min)152.4 (6.0 in/min)
Sample #3 (3 mm block)3 (0.12 in)30096.5 (3.8 in/min)152.4 (6.0 in/min)
Table 3. Tensile test specimen naming.
Layer Thickness of The BlockSpecimen’s Direction in PartSpecimen’s Position in Part’s Width (Block’s Width)Specimen’s Position in Part’s Height (Building Direction)
1, 2, or 3XCenter (C), Left (L), or Right (R)Bottom (B), Middle (M), Middle-Top (MT), or Top (T)
1, 2, or 3YNot ApplicableBottom (B), Middle (M), Middle-Top (MT), or Top (T)
1, 2, or 3ZCenter (C), Left (L), or Right (R)Not Applicable
Disclaimer/Publisher’s Note: The statements, opinions and data contained in all publications are solely those of the individual author(s) and contributor(s) and not of MDPI and/or the editor(s). MDPI and/or the editor(s) disclaim responsibility for any injury to people or property resulting from any ideas, methods, instructions or products referred to in the content.

