Abstract
By utilizing hydrogen as an eco-friendly energy source, many metals are exposed to gaseous (pressurized) hydrogen. High-strength steels with an ultimate tensile strength of 800 MPa and above are especially susceptible to hydrogen-induced fracturing, also referred to as hydrogen embrittlement (HE). Both the microstructure and phase fractions within the steel, as well as lattice distortion, carbide precipitation, residual stress, etc., significantly affect the susceptibility to HE. Among others, one important cause for this observation is found in the locally varying hydrogen solubility within different microstructural phases such as martensite, bainite, pearlite, and ferrite. Both a thorough understanding of the HE mechanisms and taking countermeasures in the form of alloying design require an accurate analysis of local diffusive hydrogen concentrations within the material. Thermal analysis methods such as Thermal Desorption Mass Spectrometry only display an integral hydrogen concentration throughout the whole sample volume. To analyze the local diffusive hydrogen concentration, novel measuring techniques with a high special resolution must therefore be utilized. The current research presents first-of-its-kind hydrogen analyses by means of the electrochemical microcapillary cell. Using a 10 µm tip opening diameter allows for conducting local diffusive hydrogen measurements within individual grains of multi-phase carbon steel C60E (1.1221). The results confirm that hydrogen is distributed heterogeneously within multi-phase steels. Considering the individual phase fractions and the respective local diffusive hydrogen concentrations, a total diffusive hydrogen concentration can be calculated. The obtained value is in good agreement with reference thermal hydrogen analyses. Our results suggest that electrochemical microcapillary cell measurements offer great potential for further studies, which will provide a better understanding of HE and local hydrogen accumulation.
1. Introduction
Hydrogen is considered an eco-friendly energy source. By utilizing pressurized hydrogen within the industry, a significant reduction in carbon dioxide emissions can be achieved [1,2]. Simultaneously, there is an increasing demand for lightweight construction, especially within the automotive industry. With the benefits of reduced fuel consumption and the possibility of added comfort, car body weights are constantly decreasing. This demand is met by increased material strength and stiffness, which has led to the development of multi-phase steels such as dual-phase (DP: martensite + ferrite) or complex-phase (CP: bainite, ferrite, and martensite) steels. Nowadays, these steels are widely used by nearly every car manufacturer [3,4]. However, other sectors within the field of mechanical engineering are steadily becoming more and more affected by lightweight design as well, resulting in the development of new high-strength materials [5].
Alongside the constructional advantages that high-strength steels may offer, there is also an increased risk of hydrogen-induced damage, also referred to as hydrogen embrittlement (HE), for these materials [6,7,8,9,10,11]. Besides being exposed to gaseous (pressurized) hydrogen during service, high-strength components often come in contact with corrosive media such as water or de-icing salts. This might facilitate corrosion processes, including the evolution of diffusive hydrogen as part of the cathodic partial reaction, which ultimately could cause cathodic stress corrosion cracking (SCC) [12,13,14].
Diffusive hydrogen in metals is responsible for a wide variety of different types of failure [15,16]. The underlying mechanisms are explained by two main theories. According to the HEDE (Hydrogen Enhanced Decohesion) mechanism, diffusive hydrogen decreases the bonding forces within the metal lattice [17,18]. Corresponding fracture surfaces feature specific characteristics [6,19,20] such as intergranular morphologies with gaping grain boundaries, “crow’s feet” and in some cases micro voids (Figure 1A).
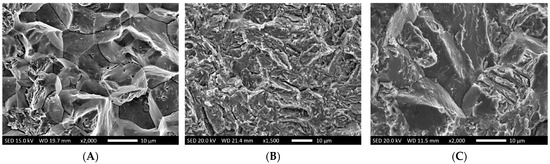
Figure 1.
Typical features of hydrogen-induced failure [6]: (A): Intergranular fracture with gaping grain boundaries and “crow’s feet” (B): Transgranular fracture with a “feathery-like” structure (C): Mixed fractures exhibiting both an inter- and transgranular structure.
The HELP theory (Hydrogen Enhanced Localized Plasticity) assumes that diffusive hydrogen facilitates both the nucleation and motion of dislocations [20,21,22,23]. That, in turn, results in the decreased tension required for yielding. Corresponding fracture surfaces typically feature a transgranular morphology with feathery-like structures (Figure 1B). Often, there is an interaction of both HEDE and HELP mechanisms, which results in mixed fracture patterns with both inter- and transgranular morphologies (Figure 1C).
Once diffusive hydrogen has been absorbed into the material, it either occupies interstitial lattice sites (diffusive hydrogen H) or becomes trapped at energetically favorable microstructural inhomogeneities (HT) such as dislocations, grain boundaries, vacancies, or phase boundaries [24,25,26,27]. Since H remains mobile at ambient temperature, it is generally considered the cause of hydrogen embrittlement. Trapped hydrogen, however, can be thermally activated and then become diffusive again. The required amount of activation energy is dependent on the type of trap, which allows for the classification of traps [24,28,29,30,31]. Traps exhibiting binding energy of are considered shallow, while trapping energies of are attributed to deep traps, Table 1.

Table 1.
Classification of different types of traps.
Within the literature, there is an understanding that diffusive hydrogen as well as very shallowly trapped hydrogen is thermally activated up to around 200 °C (573 K) and that deeper traps require much higher temperatures of several hundred degrees and even up to the melting point of the material [32,33,34].
Different steel microstructures exhibit varying types of traps, resulting in different levels of hydrogen solubility. The tempered martensitic microstructure contains large amounts of lath- and needle-boundaries [35] and a high dislocation density [36]. Therefore, within martensitic structures, the highest hydrogen uptake is found, which, in combination with the high tensile strength, facilitates considerable susceptibility to HE [37]. In comparison, bainitic structures exhibit a lower level of hydrogen uptake. In carbide-free bainite, the dominant trapping sites are the interfaces between martensite/retained austenite and the bainitic ferrite. It was found that these traps result in lower hydrogen uptake compared to martensitic structures [38]. In carbide-containing bainite, the large number of said carbides, as well as retained austenite, act as deep traps and counteract the increased amount of shallowly trapped hydrogen caused by the high dislocation density within the ferrite [39,40,41].
In pearlitic microstructures, the most important trapping sites are cementite/ferrite interfaces. Within the literature, there are significant deviations in the classification of these traps. Depending on the specific lamellae spacing and C content, widely varying trapping energies between 11 and 80 are reported [42,43,44], resulting in a mixed classification as both shallow and deep traps. However, it is reported that introducing pearlite into a ferritic-bainitic dual-phase steel resulted in improved resistance to HE [45].
Ferrite only exhibits limited trapping sites, predominantly in the form of grain boundaries and non-metallic inclusions. Additionally, the solubility of diffusive hydrogen within the lattice is comparatively low, resulting in an overall limited hydrogen uptake. Combined with its modest tensile strength, ferrite is therefore considered hardly susceptible to hydrogen embrittlement. However, facilitated dislocation nucleation and movement according to the HELP mechanism are still present in hydrogen-charged pure iron, resulting in increased stress relaxation behavior [46].
Trapping is strongly influenced by plastic deformation, i.e., cold work. Hereby, dislocations are generated, which on the one hand act as hydrogen traps but on the other hand increase the material’s strength and therefore its susceptibility to HE [47,48,49,50].
To measure the hydrogen content, various analytical methods have been developed, with the main objective being the distinct detection of diffusive and trapped hydrogen. The most common methods are based on the thermally activated effusion of diffusive and trapped hydrogen, which is subsequently measured by means of thermal conductivity cells (Hydrogen Collecting Analysis [51], Thermal Desorption Analysis) or mass spectrometry (Thermal Desorption Mass Spectroscopy [52,53]). Commercially available analyzers operate with infrared heating furnaces or electrode furnaces in which the sample can be heated up to 900 °C or even melting temperature. The application of a sufficiently slow heating rate allows for the analysis of diffusive hydrogen as well as hydrogen bound at different trapping sites. The corresponding trapping energies can then be derived from the signal plots [54,55].
Thermal analyses achieve a high resolution of up to 0.001 ppm diffusive hydrogen. However, an inherent restriction of all thermal methods is that the signal is gained by hydrogen effusion from the whole sample volume, which in many cases falsifies the result. On the one hand, hydrogen is normally not distributed equally over the whole sample volume but rather shows increased amounts towards the surface (large-scale concentration gradients). On the other hand, there are additional small-scale concentration gradients due to varying hydrogen levels within individual phases and adjacent grains of a multi-phase microstructure. The latter are impossible to distinguish by means of thermal hydrogen analysis. As an example, martensitic areas might contain much more hydrogen than, for instance, ferritic areas when dual-phase steel (DP) is analyzed. To assess the risk of HE, the local distribution is often of significant importance. For example, it is well known that diffusive hydrogen accumulates in front of notches or cracks, which is referred to as the Gorsky effect [56,57]. In those cases, the local hydrogen content within these areas is much more relevant for the mechanical behavior and crack initiation than the overall hydrogen content.
Therefore, local hydrogen analyses with high spatial resolution require a different set-up than thermal analyses. This led to the development of the electrochemical microcapillary cell technique [58,59], which is based on the permeation cell introduced by Devanathan and Stachursky [60]. For local hydrogen measurements by means of the electrochemical microcapillary cell technique, the principle of the oxidizing side of the permeation cell is adapted: a microglass capillary filled with an electrolyte (typically NaOH) is brought into contact with the sample surface (working electrode). A platinum wire within the glass capillary is used as the counter electrode, while standard Ag/AgCl or Hg2Cl2 electrodes act as reference electrodes [59,61].
However, local measurements within individual microstructural phases of hydrogen-charged multi-phase steels require high-precision measuring equipment and thorough sample preparation. This paper presents the first phase-specific measurements of their kind, which aim to determine local hydrogen contents within a heat-treated and hydrogen-charged multi-phase steel.
2. Materials and Experimental Procedure
2.1. Material and Heat Treatment
All investigations were carried out on plain carbon steel C60E (1.1221) with the chemical composition given in Table 2.
Table 2.
Chemical composition of steel C60E (1.1221). All values are given in ma%.
Since the material does not contain any alloying elements other than C, hydrogen solubility is neither affected by the chemical composition of mixed crystals nor by precipitations such as carbides other than Fe3C.
Heat treatment was carried out in a protective Ar gas furnace (certified Ar purity of 5.0) at an austenitization temperature of 830 °C for 45 min. Three different microstructures were generated by applying the cooling and annealing steps given in Table 3. A uniform heat treatment condition was assured by Vickers hardness measurements at 5 individual spots per sample. The results are included in Table 3. To avoid any surface decarburization within the samples, all surfaces were ground to the final dimensions of 40 mm in length, 15 mm in width, and 2 mm in thickness after heat treatment had been applied.
Table 3.
Heat treatment steps and microstructure of the investigated conditions. * Consisting of martensite, bainite, pearlite, and ferrite.
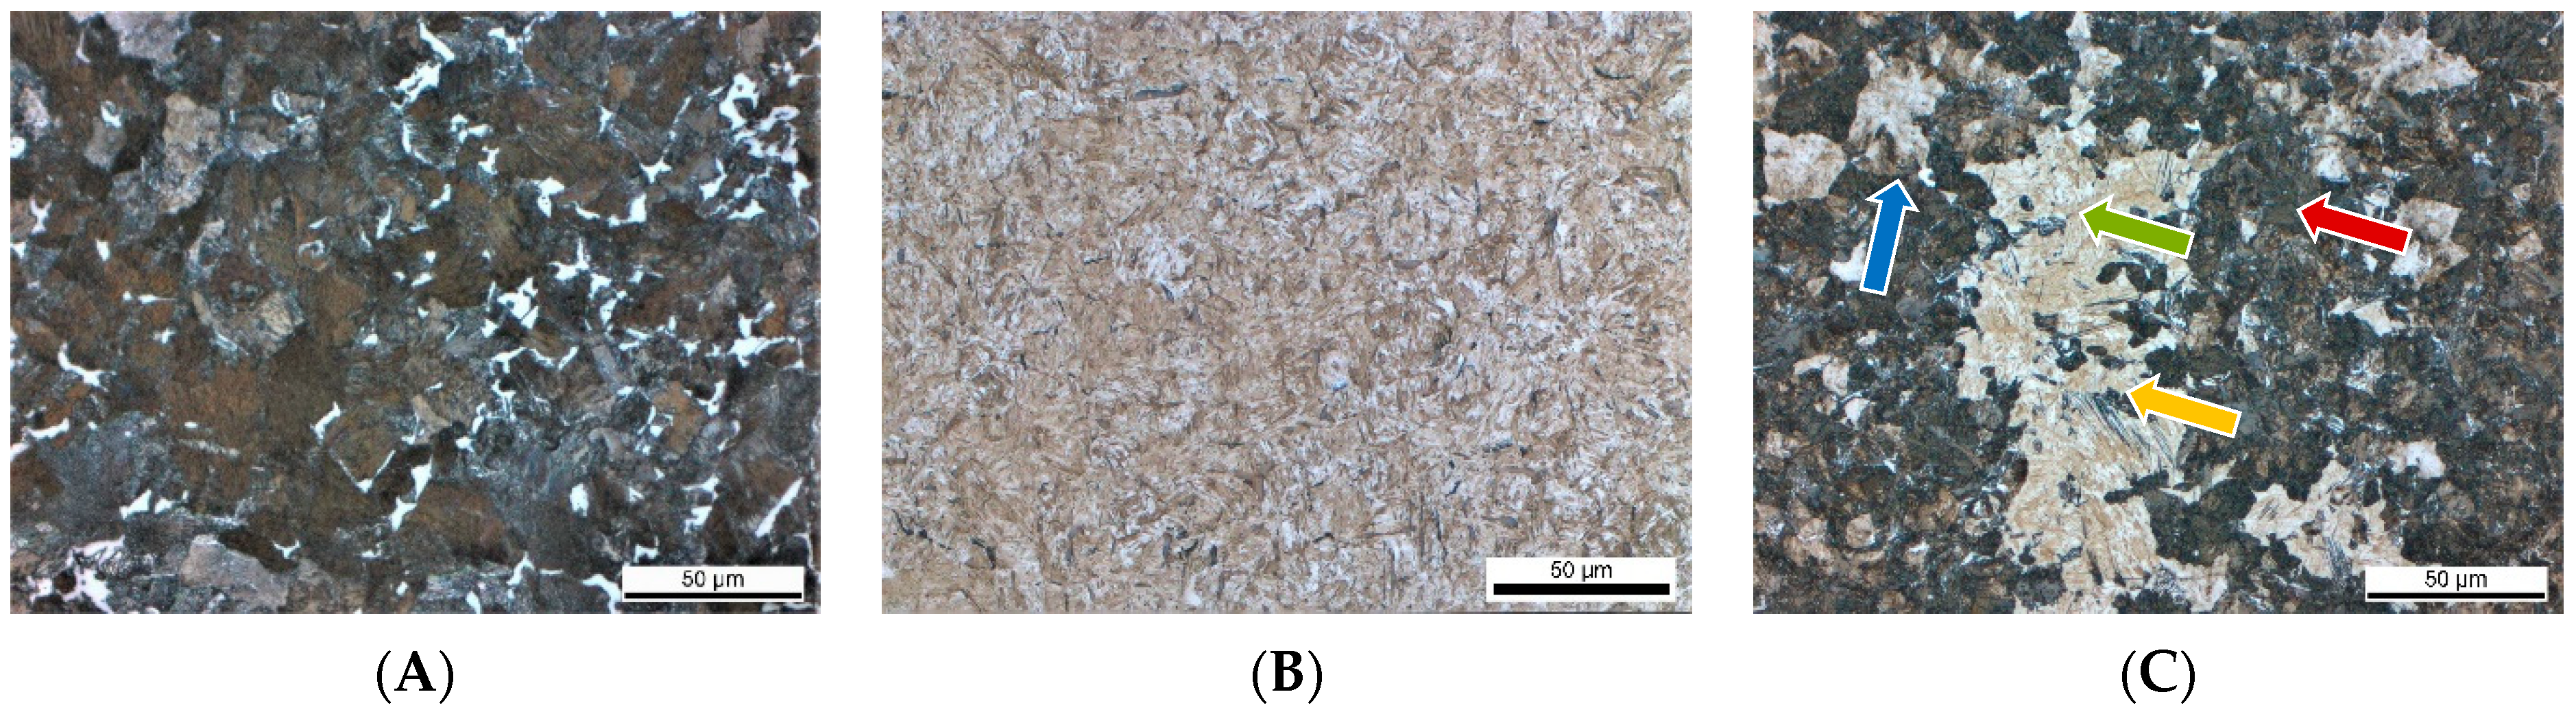
Light microscopic pictures of all material conditions are presented in Figure 2. To visualize the microstructure, all samples were ground with SiC abrasive paper with grits from #80 to #1000. Afterward, the samples were polished with diamond suspension with diameters of 6 µm to 1 µm. Etching was performed in a 3% initial solution. On the etched samples, it was verified that no decarburization was present near the surfaces.

Figure 2.
Microstructure of the investigated heat treatment conditions (A): Ferrite-Pearlite. (B): Q + T martensitic microstructure; (C): Multi-phase microstructure containing martensite (green), bainite (yellow), pearlite (red), and ferrite (blue).
2.2. Hydrogen Charging
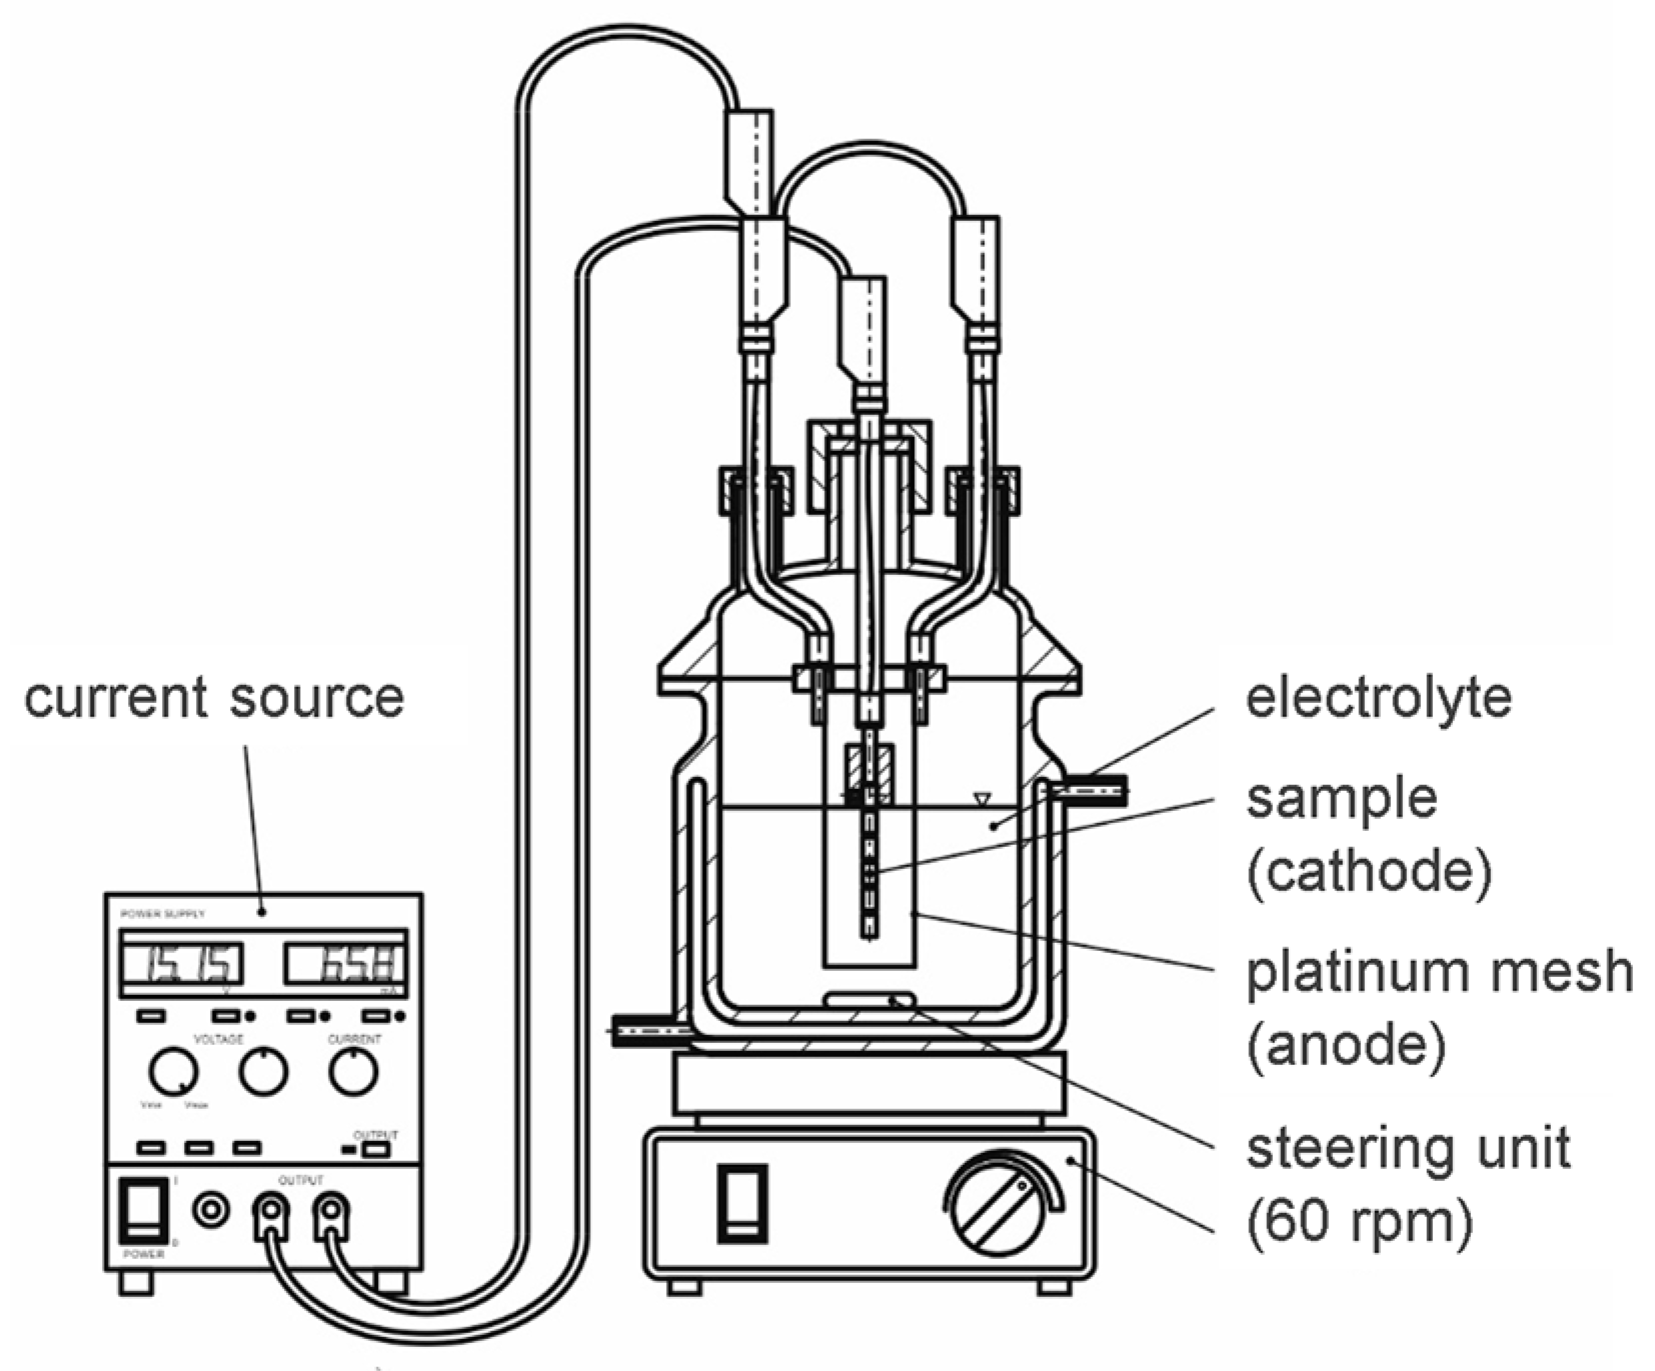
Hydrogen charging was achieved by means of electrochemical charging (Figure 3). The samples were cathodically polarized with a current density of −0.1 mA/mm2;. A platinum mesh was used as the anode, which fully surrounded the samples. The hydrogen-donating electrolyte was chosen to be 1 mol ammonium sulfate (NH4)2SO4 with the addition of 0.01 mol sodium sulfate (Na2S) as a promotor. Charging was carried out for 120 min.

Figure 3.
Electrochemical charging cell.
After hydrogen charging, all samples were electrogalvanized to prevent hydrogen effusion out of the samples while being stored in air. Simultaneously, the plating also allowed for a homogeneous hydrogen distribution within each sample [62]. Therefore, it was ensured that locally varying hydrogen contents were caused only by different solubilities of the respective phase and not by concentration gradients due to the charging procedure. This is an important requirement to compare the results of local hydrogen measurement by the microcapillary cell with reference TDMS analyses. The Zn-electrolyte for this specific purpose was developed and provided by DR. HESSE GMBH & CIE. KG. The chemical composition is based on the commercially available acidic electrolyte “Lunacid CC-100 LF.” Specific chemical additives were used to create a non-permeable Zn coating. After 48 h of exposing the electrogalvanized samples to ambient temperature, the samples were depleted in inhibited hydrochloric acid and stored in liquid nitrogen until the hydrogen measurement was conducted. This procedure ensured that no hydrogen effusion occurred during further storage and transportation of the samples.
2.3. Thermal Hydrogen Analyses
After hydrogen charging, zinc plating, and storing at ambient temperature, three additional samples of each material condition were conventionally analyzed by means of Thermal Desorption Mass Spectrometry (TDMS). The measurements were carried out in a Bruker Galileo G8 equipped with an infrared heating furnace (IR 07) and a quadrupole mass spectrometer (QMS). All measurements were performed isothermally at a temperature of 210 °C. The results give the integral diffusive hydrogen concentration within the whole sample volume. It is important to note that applying an analyzing temperature of 210 °C only results in the activation of diffusive hydrogen. Accordingly, trapped hydrogen was not activated during TDMS analyses. This is a mandatory requirement to allow for the comparison of both TMDS analyses and microcapillary cell measurements.
2.4. Local Hydrogen Measurements
Prior to the measurements, the cooled samples were thawed in pure ethanol to prevent corrosion due to atmospheric moisture. Afterward, the samples were etched and inspected under a light microscope to specify the desired measuring positions, which were subsequently mechanically marked. Since the etched sample surface would have affected the measurements, all samples were re-polished. Grinding steps were not applied since those would have potentially removed too much material, and therefore a different microstructure would have surfaced. The whole sample preparation did not exceed a time frame of 15 min for any sample. To verify that the capillary had been placed within the desired phase, all samples were etched again after the measurements without preliminary cleaning of the surface. Thereby, alkaline residues of the 0.2 mol NaOH remained on the surface, which resulted in local neutralization reactions with the acidic etchant. This way, the measurement spots were made visible.
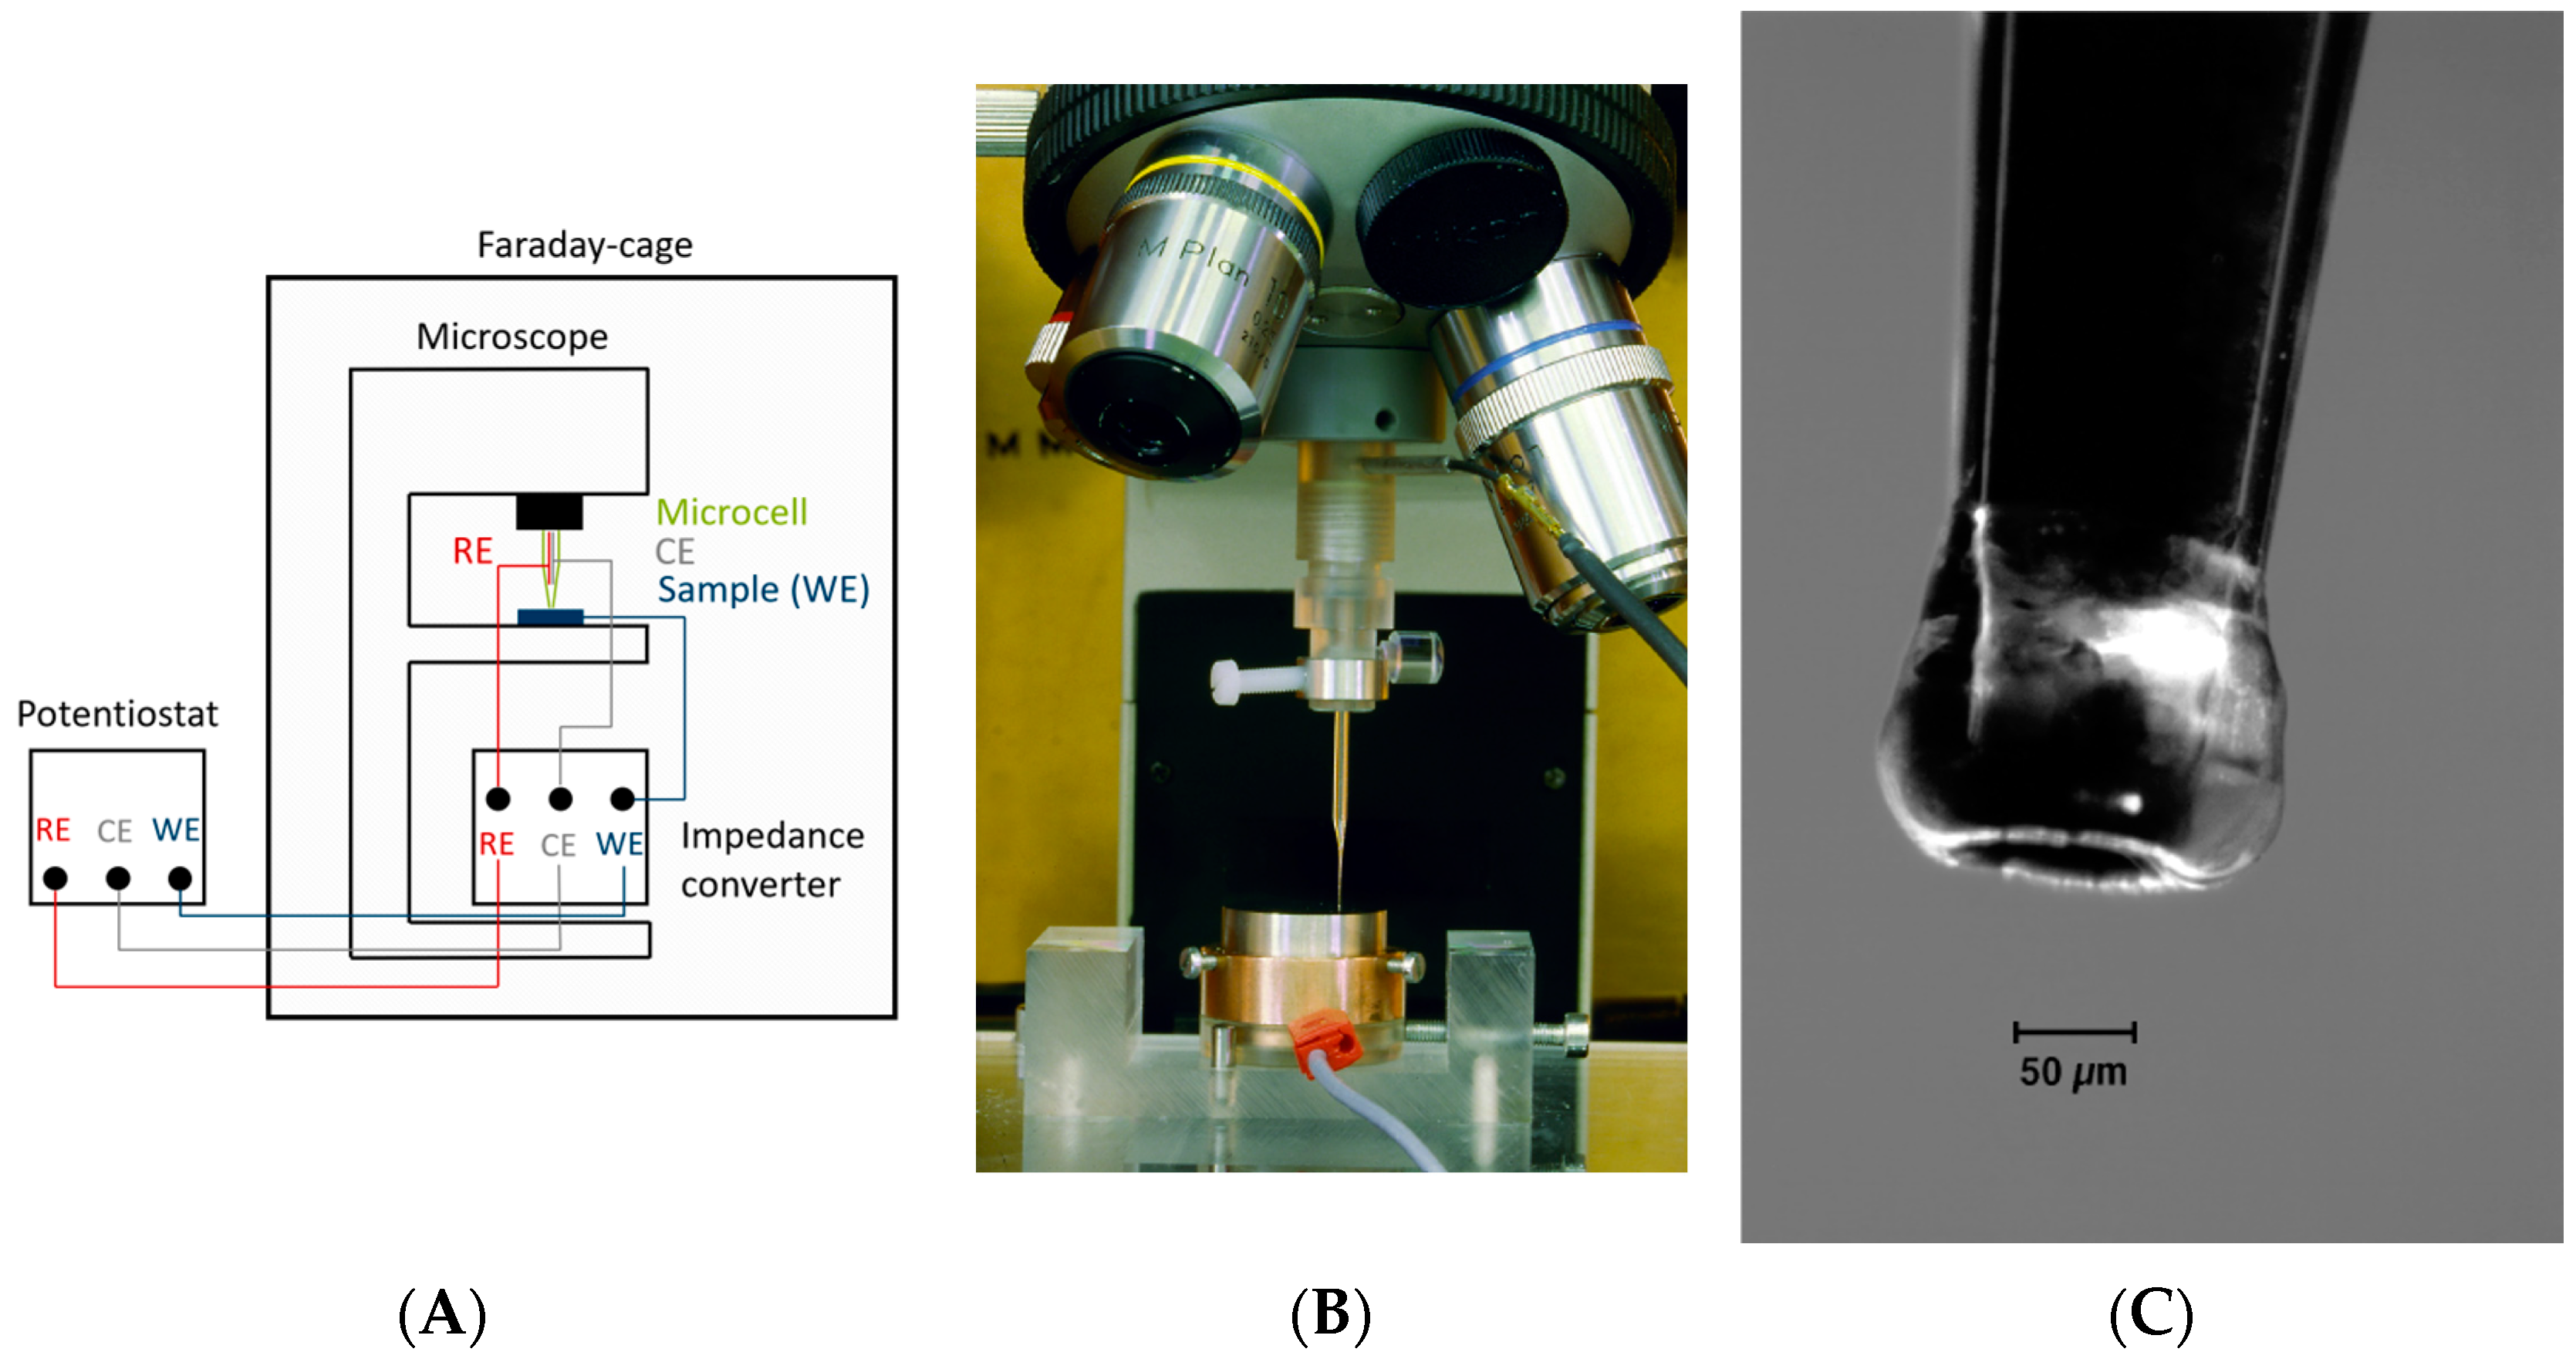
The set-up of the electrochemical microcapillary cell technique is shown in Figure 4. The glass micro-capillary is filled with 0.2 mol NaOH, and a platinum wire is inserted as the counter electrode. A saturated calomel electrode (SCE) is used as the reference electrode, while the sample surface acts as the working electrode. The glass capillary is mounted to the lens holder of a microscope, which allows for inspecting the surface of interest and subsequently gently placing the capillary within the center of the image section. For the present study, a tip opening diameter of 10 µm was used, which is considerably smaller than the capillaries used in previous research [48,63].

Figure 4.
Setup for electrochemical microcapillary cell technique measurements (A): Schematic drawing. (B): Sample placed in the optical light microscope [64]. (C): A Silicon-covered tip in contact with the sample surface [64]. The present measurements were conducted with a capillary tip diameter of 10 µm.
To prevent both leaking of the electrolyte and crevice corrosion, the glass capillary tip is coated with a deformable, hydrophobic silicon rubber. Once the capillary tip has been brought into contact with the sample surface, a constant anodic potential of +0.3 V vs. the SCE is applied to prevent corrosion, which would result in an overlaying corrosion current. During the measurement, the oxidation current (hydrogen discharge) is recorded for 1800 s (30 min.) by a high-resolution potentiostat. Since typical currents are within the range of a few nA, the whole setup is located within a Faraday cage to prevent interfering currents.
To account for passivation processes occurring on the sample surface, reference measurements on uncharged samples need to be conducted. The corresponding passivation current is then subtracted from the data gained on charged samples. According to Suter, passivation of steel results in a decay of the current over the analyzing time which is described by Equation (1). and are material-dependent parameters [59].
In the case of hydrogen-containing samples, diffusive hydrogen is consumed at the sample surface throughout the measurement. Due to the reaction of said hydrogen with OH-ions within the 0.2 mol NaOH electrolyte, water is generated according to Equation (2). Since this reaction releases electrons, the recorded oxidation current is shifted to higher values when diffusive hydrogen is present within the sample. As the applied potential of +0.3 V vs. the SCE prevented corrosion of the sample and all other parameters were kept identical for all measurements, the shift in oxidation current is solely attributed to diffusive hydrogen within the sample.
To quantify the amount of diffusive hydrogen within the sample, the integral value between both the reference reading and the actual measurement is calculated, which represents an electric charge given in Coulomb.
The conversion of the electric charge to a hydrogen concentration given in parts per million (ppm) can be achieved by two different methods. The first approach is based on Faraday’s second law (Equation (3)), which states that the amount of a given species (here, hydrogen) deposited at an electrode is directly proportional to the electric charge (here, the integral value between the oxidation current of the reference and charged sample). Martin et al. confirmed this relationship for hydrogen electrolysis processes [65].
With
: Electric charge in C
: Number oxidized electrons, with n = 1, since
: Faraday constant, with
: Effective diffusion volume
Since is considered a half-ellipsoidal volume, Equation (4) applies.
With
: radius of the microcapillary, here = 5 µm
: Diffusion distance of hydrogen during the measurement
can be derived by applying Fick’s law according to Equation (5)
With
: Diffusion coefficient for the investigated material conditions
: measuring time in s, here t = 1800 s
Finally, the hydrogen concentration can be calculated by the relations given in Equation (6) [66] and Equation (7) which is obtained by inserting the specific density for hydrogen (0.0899 g/L) and iron (7.874 g/cm3).
The authors found that the conversion by Faraday’s law consistently resulted in a hydrogen concentration of one to two decimal powers below the expected value. This finding could be explained by the large number of interfaces within the investigated materials as well as residual stress.
Therefore, a second approach was used to derive the diffusive hydrogen concentration from the microcapillary cell measurements. The method is based on calibration measurements similar to those performed by Kühn et al. [16] and Ozdirik et al. [24]. The calibration procedure was done by TDMS analysis on both hydrogen-free samples and homogeneously charged samples of different single-phase microstructures. TDMS analyses were carried out at 210 °C to ensure that solely diffusive hydrogen was analyzed (c.f. Section 2.3). Equally prepared samples were then measured by means of the electrochemical microcapillary cell technique. For this procedure, 10 individual samples were used per material condition, providing a reliable statistic for safety. It was found that for steel C60E (1.1221), an electric charge of 32 ± 3 nC (the integral value between the reference sample and charged samples) equals a hydrogen concentration of 1 wppm (subsequently ppm). In Section 3, this second approach is used to calculate the hydrogen concentration within the investigated samples.
3. Results and Discussion
3.1. Thermal Hydrogen Analyses (TDMS)
The results of TDMS reference analyses are summarized in Table 4. In agreement with the above-mentioned differences in solubility, the quenched and tempered microstructure exhibits the highest concentration of diffusive hydrogen, while the ferrite-pearlite microstructure exhibits the lowest amount.
Table 4.
Results of Thermal Desorption Analyses for all materials.
The corresponding time vs. current plots of representative samples are shown in Figure 5.
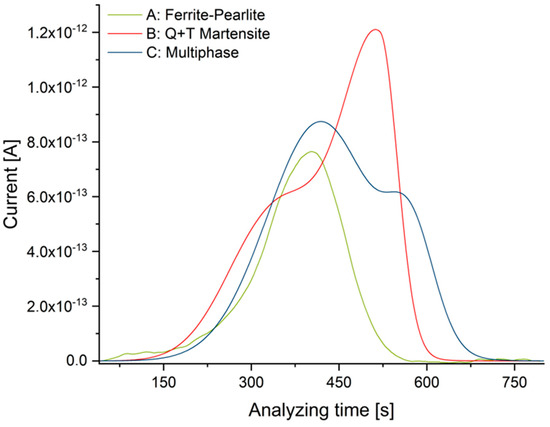
Figure 5.
TDMS analyses for all materials (T = 210 °C).
3.2. Local Hydrogen Measurements
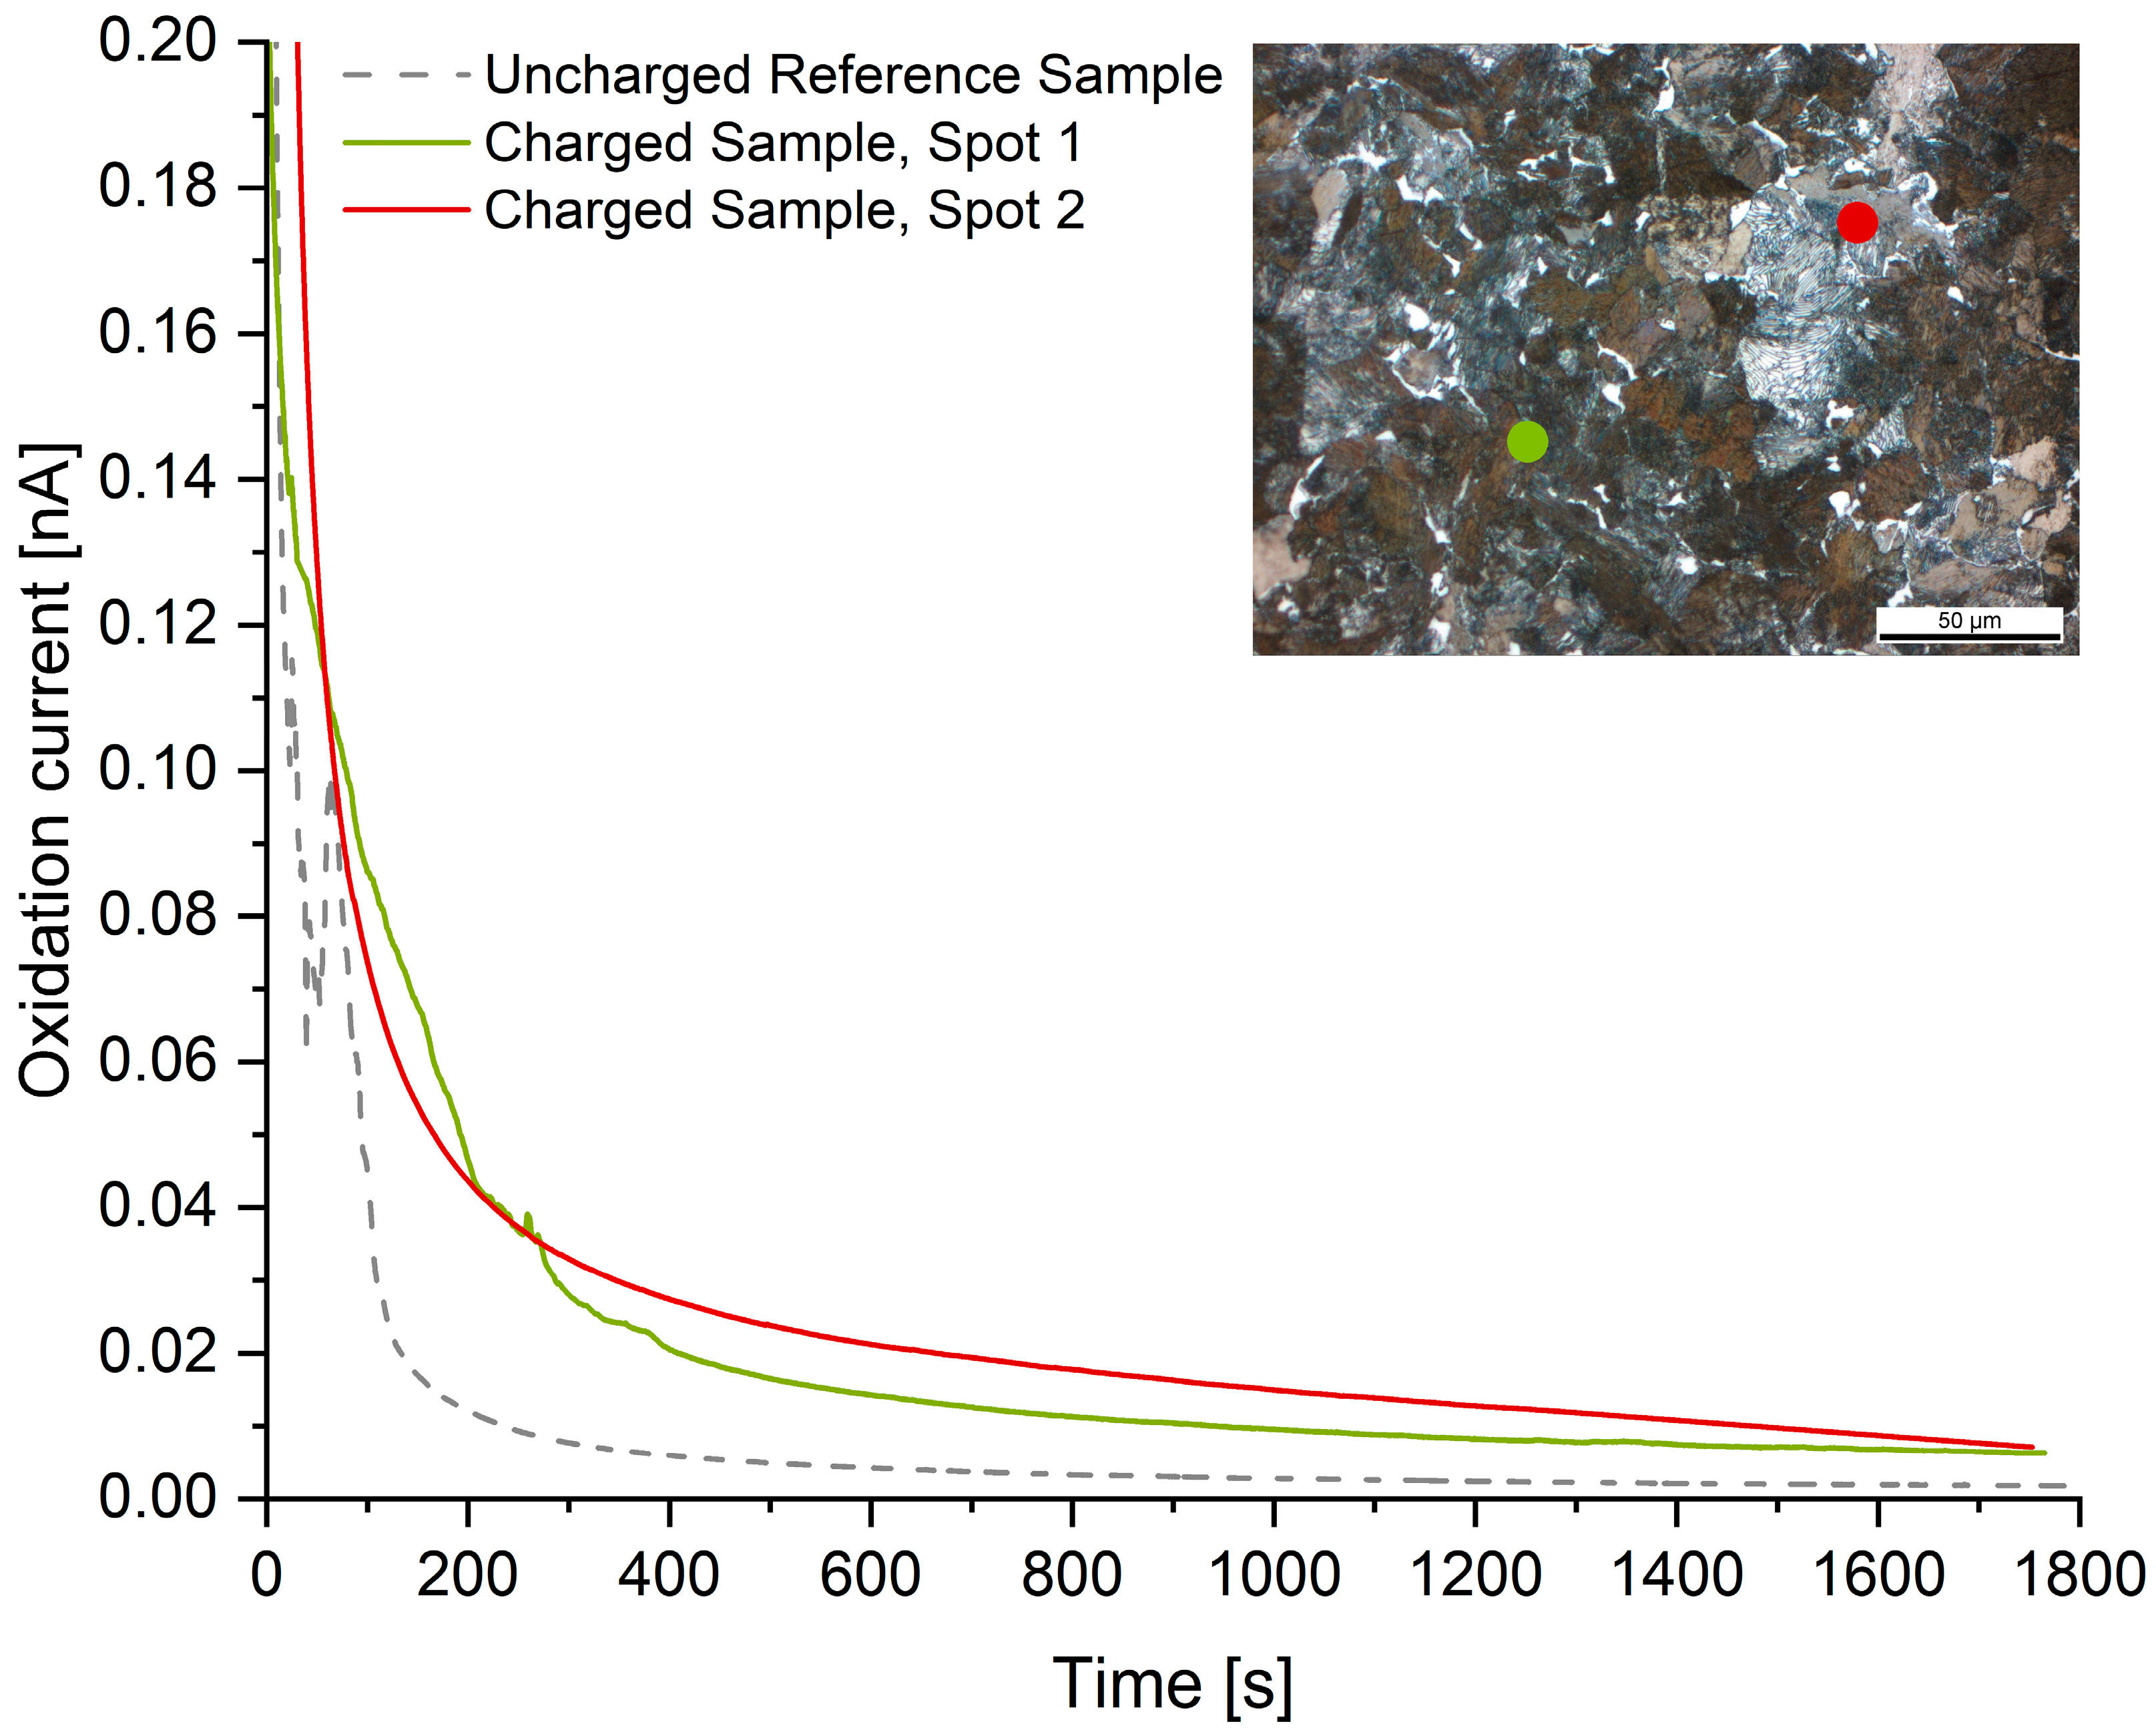
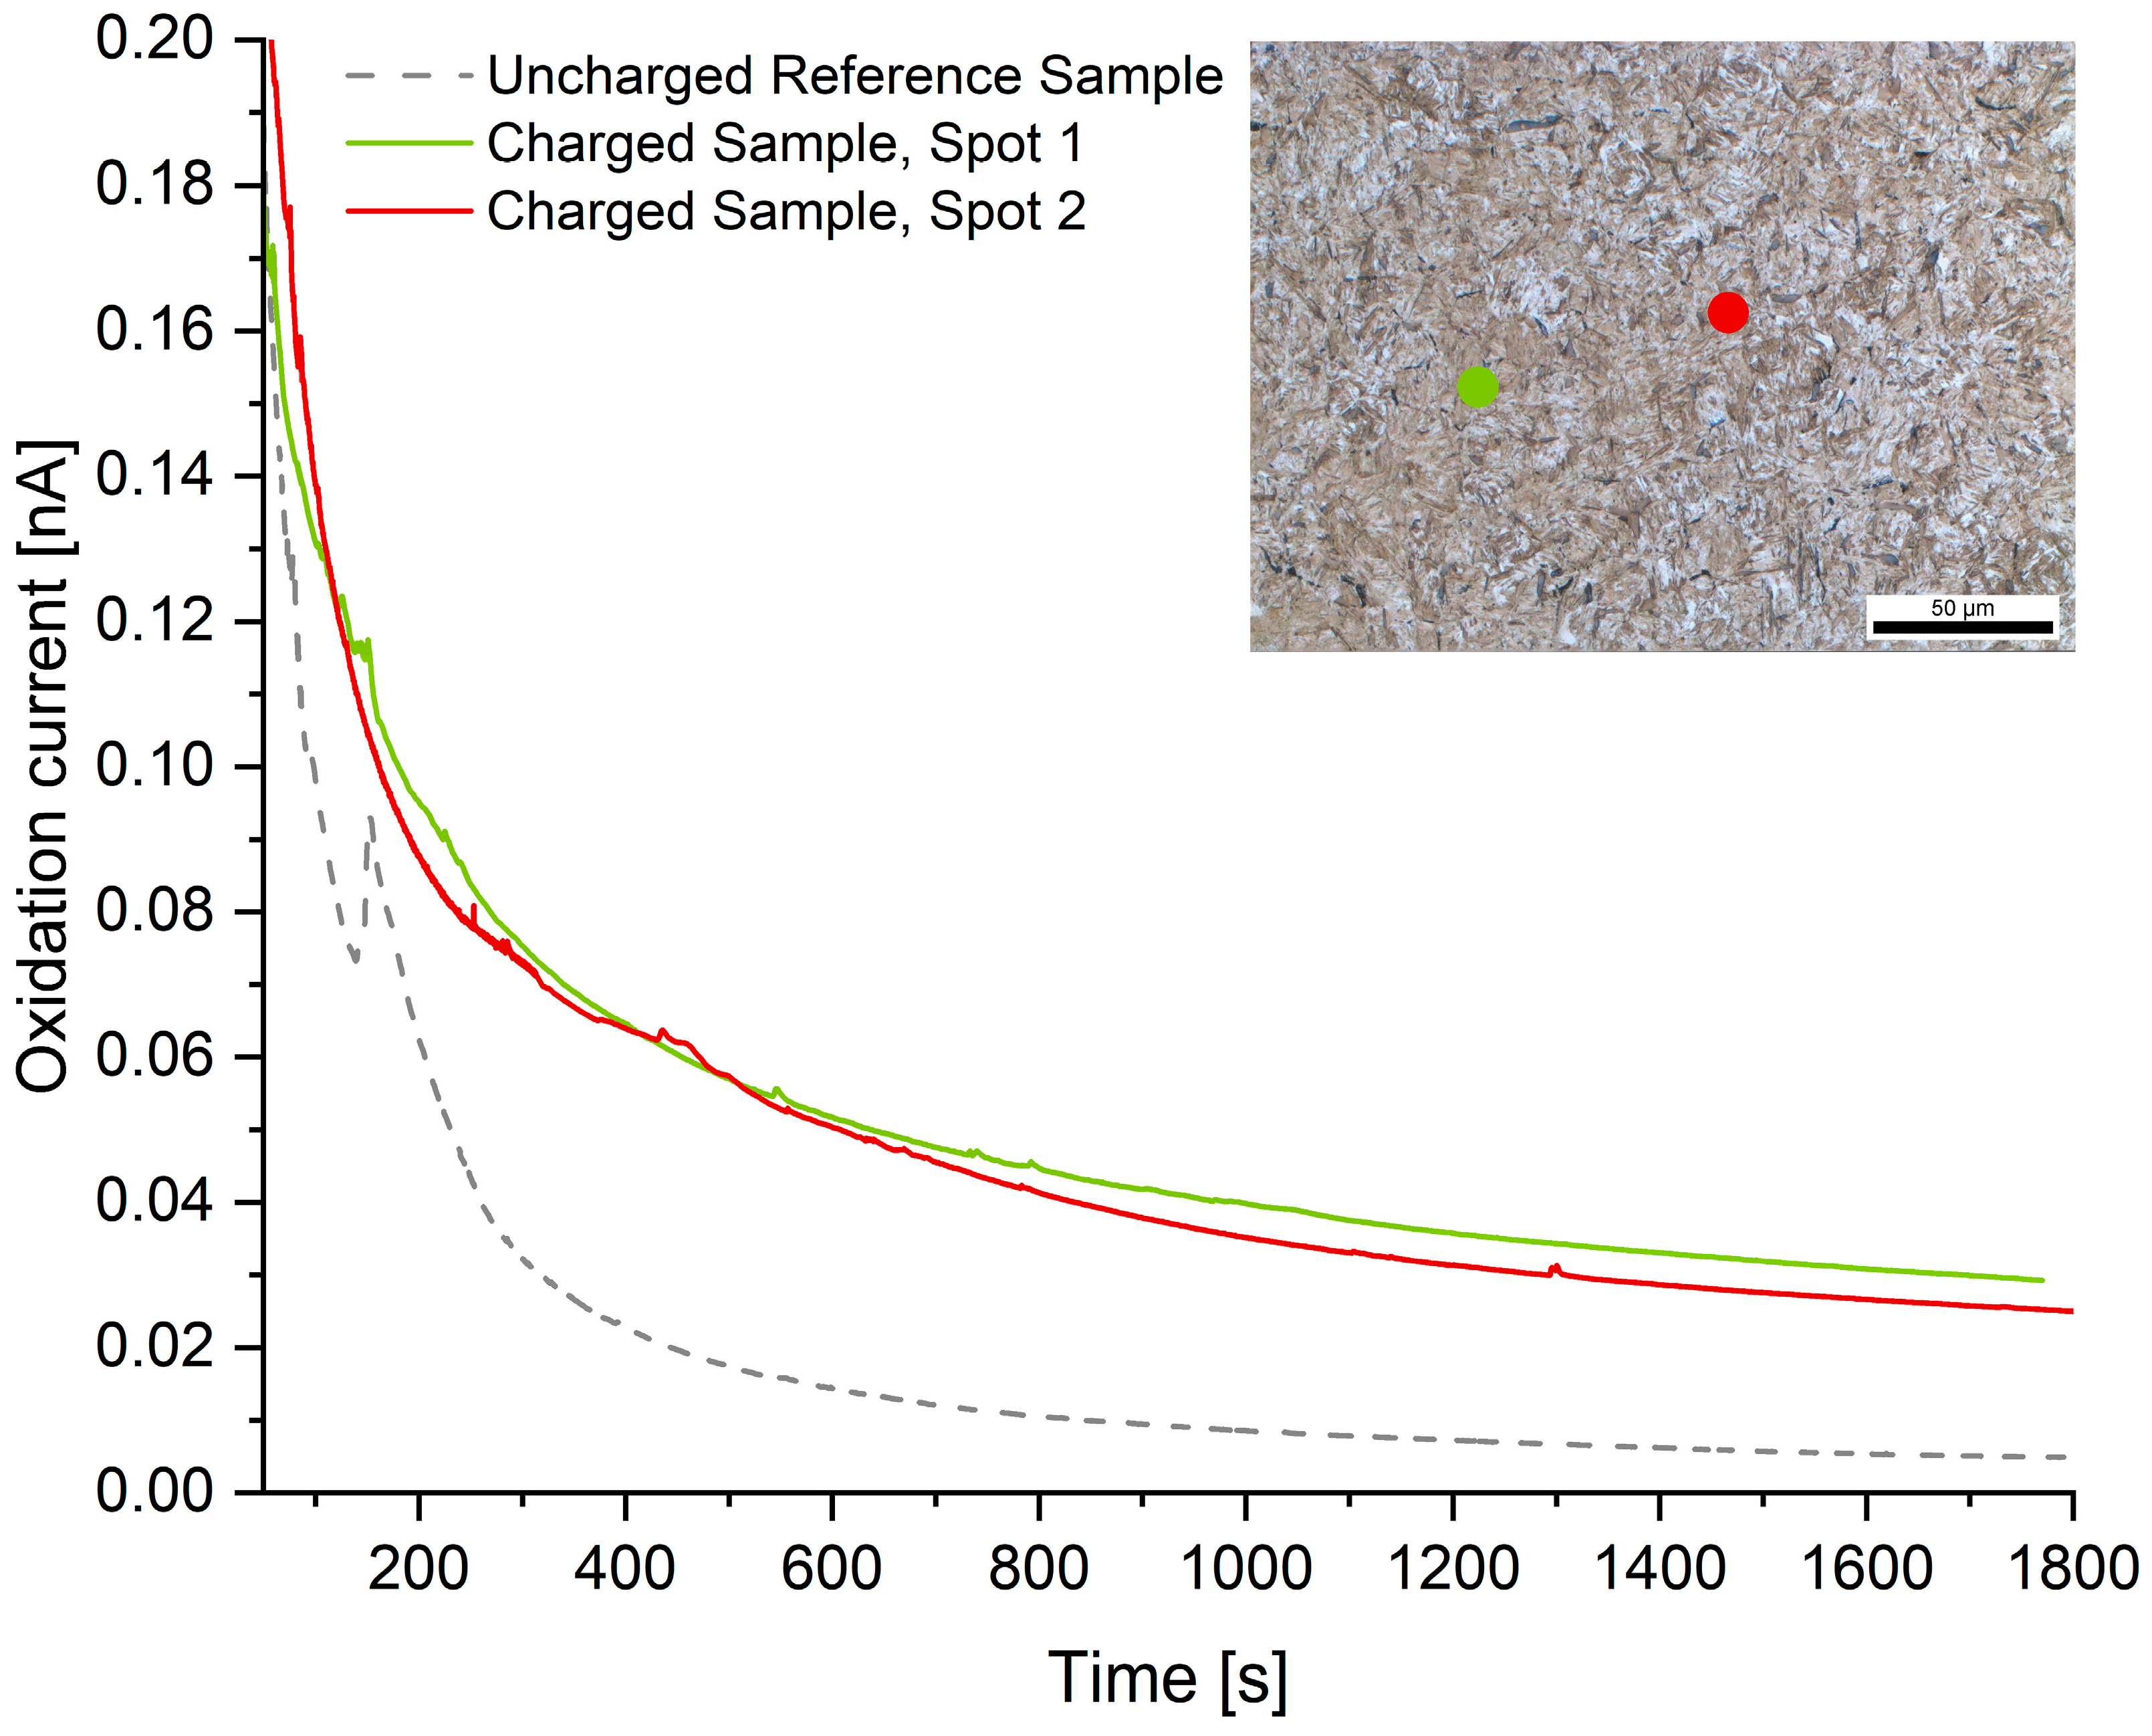
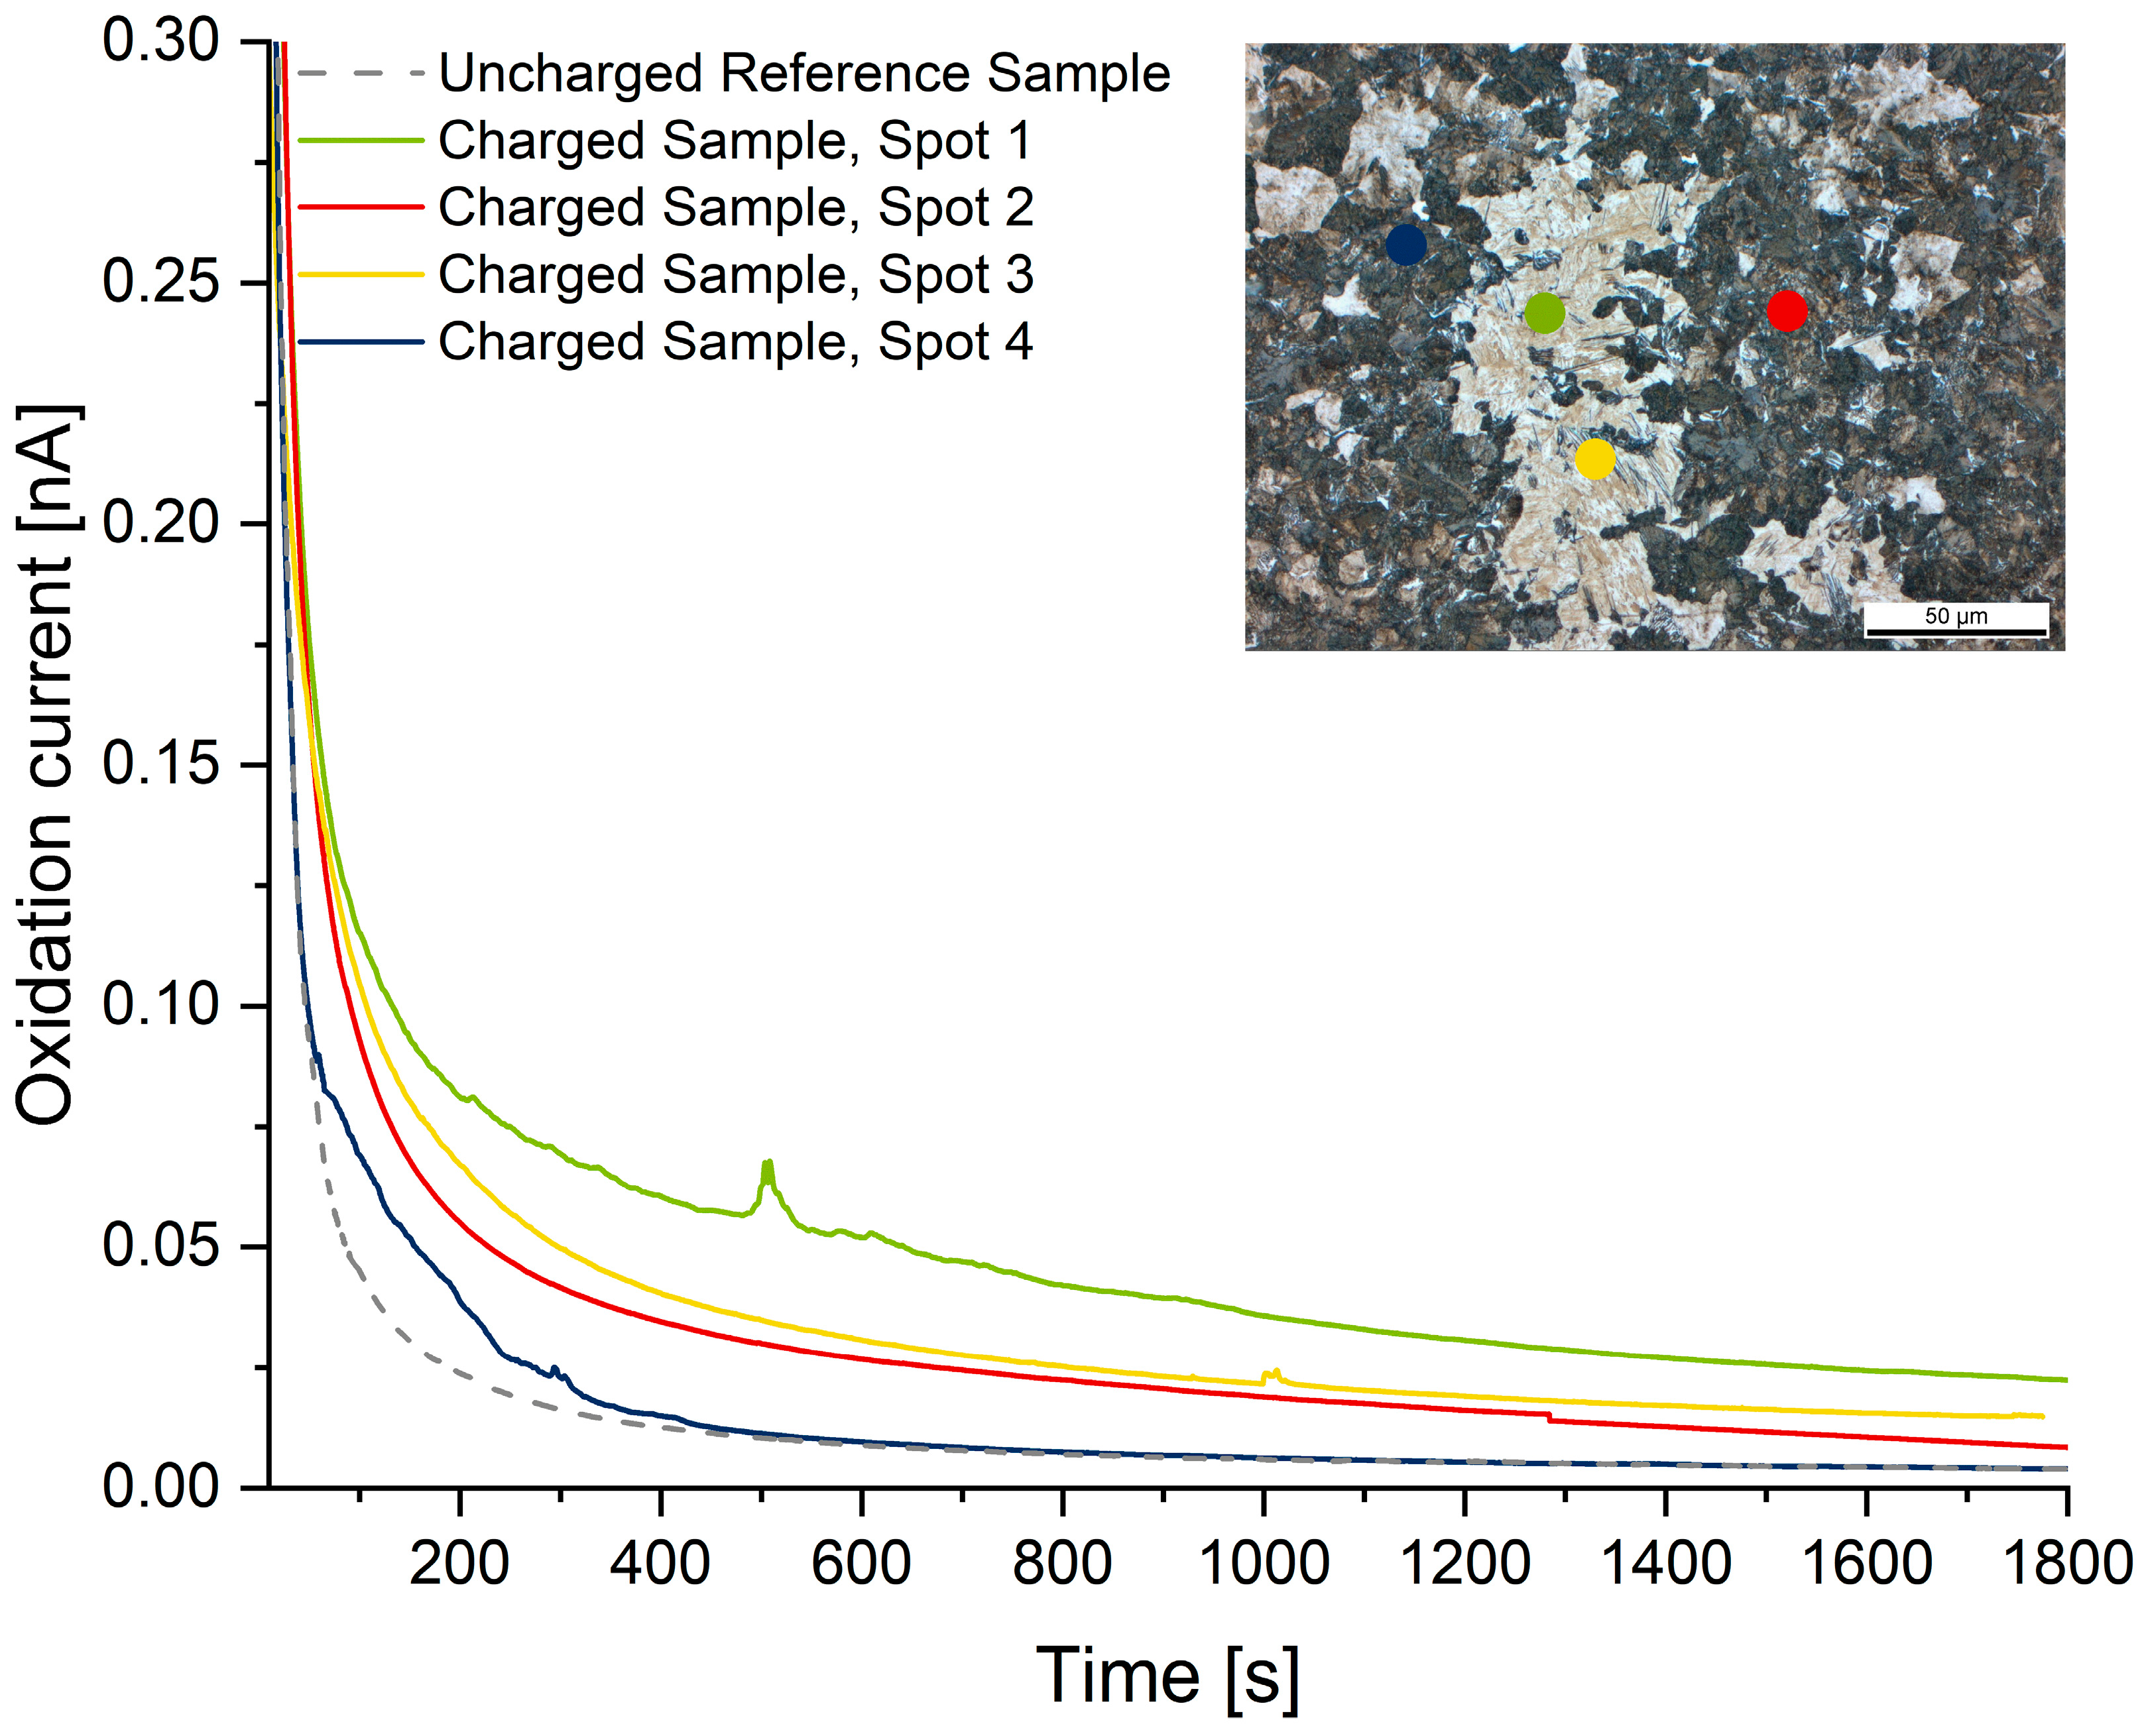
The readings of the local hydrogen measurements are summarized in Figure 6, Figure 7 and Figure 8. Compared to the hydrogen-free reference samples, all hydrogen-charged samples exhibit a significantly increased oxidation current due to the presence of diffusive hydrogen. The measuring spots are represented in the metallographic cross-section by colored dots. The dot’s diameter is true to the scale of the micrograph.

Figure 6.
Microcapillary measurements on microstructure A: Ferrite-Pearlite.

Figure 7.
Microcapillary measurements on microstructure B: Q + T martensite.

Figure 8.
Microcapillary measurements on microstructure C: multi-phase microstructure For improved readability, only one measurement per phase is shown (Spot 1 in Table 5).
The corresponding hydrogen concentrations were derived from the conversion of the electric charge as described in Section 2.4. The results are summarized in Table 5.
Table 5.
Results of local microcapillary cell measurements.
In the case of microstructure A (ferrite-pearlite), the microcapillary measurements amounted to a diffusive hydrogen content of 0.90 ± 0.18 ppm. Compared to the TDMS analyses (0.66 ppm), this concentration is slightly increased. This is traced back to the fact that the microcapillary was placed within the pearlite phase since the ferrite grains were smaller than the diameter of the glass capillary. Therefore, measurements solely within the ferrite phase were not feasible for material A. Due to pearlite’s higher solubility for hydrogen compared to ferrite, the current is shifted to values slightly higher than those gained by TDMS analysis.
Microstructure B (Q + T martensite) exhibited a diffusive hydrogen content of 3.40 ± 0.27 ppm. In comparison to the TDMS analyses (2.03 ppm), the hydrogen concentration is significantly higher. This might be explained by the comparatively low diffusion coefficient of martensitic microstructures, which could have led to a higher concentration of diffusive hydrogen near the surface. In addition, there are potentially high residual stresses present within martensite, and the density of interfaces and grain boundaries is very high. Grain boundary diffusion is significantly faster than bulk diffusion [67,68], which could result in higher readings during microcapillary cell measurements. Lastly, the reference measurement on the hydrogen-free sample exhibits some scattering and spiking, which could have resulted in a false reading and therefore an electric charge.
The most insightful results were gained on material C (multi-phase microstructure). Since this sample exhibited several phases large enough to allow for local hydrogen measurements, the overall hydrogen content measured by TDMS (1.37 ppm) could be referenced to individual phases. The highest amount of hydrogen was measured in the martensitic phase (3.52 ± 0.39 ppm). The results are in good agreement with the findings on material B. The bainitic phase exhibits the second-highest amount of hydrogen (1.58 ± 0.35). However, since the bainitic areas were comparatively small and mostly embedded within martensitic grains, it is likely that the signal overlapped with hydrogen present in adjacent martensites. This would also explain why the results show significant scattering. Pearlite exhibits the highest phase fraction, which allows for reproducible measurements. The diffusive hydrogen in there amounted to 1.12 ± 0.25 ppm, which is in good agreement with the results gained on material A. Similar to the bainitic phase, ferrite grains were comparatively small, and it is therefore very likely that surrounding grains (mostly pearlite) affected the oxidation current and caused a shift to higher values. This is reflected by high scattering, although ferrite exhibits the lowest amount of hydrogen (0.48 ± 0.24 ppm) of all phases.
Subsequently, the overall amount of hydrogen within multi-phase material C is calculated from the individual phase fractions (based on metallographic evaluation) and their respective concentrations of diffusive hydrogen measured by means of the microcapillary cell technique. The results are summarized in Table 6.
Table 6.
Calculation of the overall hydrogen concentration for multi-phase material C.
The calculated amount of diffusive hydrogen within multi-phase microstructure C ranges from 1.41 ppm to 1.99 ppm. The lower limit of 1.41 ppm is in good agreement with the results of TDMS analyses (1.37 ppm).
The results therefore prove that diffusive hydrogen is distributed heterogeneously within multi-phase steels. These findings are in agreement with published data for ferritic-austenitic duplex stainless steels [69], martensitic-austenitic dual phase steels [70], bainitic-martensitic-ferritic complex phase steels [71] as well as welded austenitic stainless steel [72].
The highest diffusive hydrogen concentration was detected within the martensitic phase fraction. This is explained by the large number of interfaces, high dislocation density, and potential residual stress. Similar findings were reported in [35,36].
Since both pearlite and bainite also exhibit considerable amounts of interfaces, the diffusive hydrogen content within these phases was higher than that of ferrite but lower compared to martensite. This is also in agreement with reported research, such as [38]. However, more effort will be made to distinguish hydrogen levels in pearlite from bainite. Especially within bainite, the current results exhibit too much scatter to allow for a more detailed evaluation.
4. Summary
In the present work, the local concentration of diffusive hydrogen within single and multi-phase microstructures of plain carbon steel C60E (1.1221) was analyzed by means of electrochemical microcapillary cell measurements. The microstructures are composed of:
- A: Ferrite-Pearlite
- B: Q + T Martensite
- C: Multi-phase
The results show that the electrochemical microcapillary cell technique with a capillary diameter of 10 µm allows for measurements within individual phases of said multi-phase material. The results further prove that diffusive hydrogen is distributed heterogeneously within multi-phase steel. By far, the highest hydrogen concentration is present within martensite grains. Bainite exhibits the second highest amount, and the small grain size of these fractions could have caused a signal overlap of adjacent martensite grains. Therefore, it is likely that bainite and pearlite, in fact, show a comparable amount of diffusive hydrogen. Pearlite gives consistent readings both for the predominantly pearlitic microstructure A and the multi-phase material C. Ferrite exhibits the lowest hydrogen content. Similar to bainite, these fractions were so small that the signal was most likely affected by adjacent pearlite grains.
The results of the microcapillary measurements were compared to Thermal Desorption Mass Spectrometry (TDMS) analyses. For the martensite phase (both in materials B and C), the hydrogen level converted from the microcapillary cell readings was consistently higher than TDMS analysis suggests. This finding could be caused by high residual tensile stresses within this phase as well as a large number of interfaces and grain boundaries. Grain boundary diffusion is significantly faster than bulk diffusion, which could result in higher readings during microcapillary cell measurements. In addition, it is well known that residual stress impacts both the local hydrogen accumulation and therefore hydrogen concentration [73] as well as the local hydrogen diffusion coefficient [74] within the material. This directly translates to the results gained by microcapillary measurements. In the present research, the comparison of TDMS analyses and microcapillary measurements was conducted on samples exhibiting approximately the same residual stress condition. However, further research is necessary to fully understand the influence of residual stress and external stress on the results.
The overall hydrogen content for microstructure C was calculated via the percentual phase fractions and their respective hydrogen contents. The lower limit of these values was in very good agreement with the results derived by TDMS analyses (1.41 ppm vs. 1.37 ppm). This proves that the electrochemical microcapillary cell technique provides a promising measuring procedure for the analysis of the local diffusive hydrogen concentration within single phases and grains of multi-phase microstructures. This potentially allows for a deeper understanding of both the hydrogen distribution and its effect on hydrogen embrittlement in steel. However, further effort needs to be made in terms of spatial resolution and the effect of adjacent and underlying grains. The latter holds particularly true for multi-phase material conditions since both adjacent and underlying grains might consist of varying microstructures compared to the grain in focus. For example, a reading within the pearlitic phase of material condition C would most likely be shifted to higher hydrogen concentrations when adjacent and underlying grains consisted of martensite. Contrary to that, the same reading would be shifted to lower values if ferrite was present instead of martensite.
5. Upcoming Work
All investigations presented in this study were performed on unstressed samples so that the differences in hydrogen concentration were solely attributed to the varying solubility of the respective phase. As described in the Section 1 of this paper, hydrogen solubility is also affected by tensile stress (residual and external), which results in elastic lattice strain. Thus, the local solubility of diffusive hydrogen is increased, providing a thermodynamic driving force (the Gorsky effect) for diffusion and accumulation. This effect is most certainly also affected by the local microstructure, which has not been investigated yet. Therefore, upcoming investigations will be performed on hydrogen-charged multi-phase samples, which will be mechanically stressed during the electrochemical microcapillary measurements. These investigations will also cover further microstructural compositions with varying phase fractions.
In addition, the corresponding effect of the local hydrogen concentration on the mechanical properties of both notched and notch-free samples will be investigated by means of Slow Strain Rate Testing (SSRT). This will allow for a thorough understanding of the interplay of hydrogen embrittlement mechanisms and the local hydrogen concentration.
Further efforts will be made in terms of accelerating the test procedure. Since the measurement within one spot takes 30 min + preparation time, hydrogen effusion must be considered. This problem could be addressed by the application of Scanning Electrochemical Cell Microscopy (SECCM), which allows for automated measurements with significantly reduced durations. Another significant benefit is that the spatial resolution of SECCM is even higher since sub-micrometer tip diameters are feasible. The first measurements have been conducted by the authors and show promising results.
Author Contributions
Investigation, J.J.; Writing—original draft, J.J.; writing—review and editing, J.J.; Supervision, M.P. All authors have read and agreed to the published version of the manuscript.
Funding
This research was funded by Deutsche Forschungsgemeinschaft (DFG, German Research Foundation)—project number 266684047.
Data Availability Statement
The data presented in this study are available on request from the corresponding author. The data are not publicly available since further research is still being conducted.
Acknowledgments
The authors thank Thomas Suter and the empa Dübendorf in Switzerland for conducting the local hydrogen analyses.
Conflicts of Interest
The authors declare no conflict of interest.
References
- Song, H.; Luo, S.; Huang, H.; Deng, B.; Ye, J. Solar-driven hydrogen production: Recent advances, challenges, and future perspectives. ACS Energy Lett. 2022, 7, 1043–1065. [Google Scholar] [CrossRef]
- Cha, J.; Bak, H.; Kwon, I. Hydrogen-fueled CO2 reduction using oxygen-tolerant oxidoreductases. Front. Bioeng. Biotechnol. 2023, 10, 1078164. [Google Scholar] [CrossRef] [PubMed]
- Birkert, A.; Haage, S.; Straub, M. Umformtechnische Herstellung Komplexer Karosserieteile; Springer: Berlin/Heidelberg, Germany, 2013; ISBN 978-3-642-34669-9. [Google Scholar]
- Zhang, W.; Xu, J. Advanced lightweight materials for Automobiles: A review. Mater. Des. 2022, 221, 110994. [Google Scholar] [CrossRef]
- Moon, J.; Ha, H.Y.; Kim, K.W. A new class of lightweight, stainless steels with ultra-high strength and large ductility. Sci. Rep. 2020, 10, 12140. [Google Scholar] [CrossRef] [PubMed]
- Jürgensen, J.; Pohl, M. Differenzierende Wasserstoffanalytik zum Nachweis von Wasserstoffversprödung. In Tagungsband “Werkstoffprüfung”; Brockmann, S., Krupp, U., Eds.; Stahleiseninstitut VDEh: Duesseldorf, Germany, 2021; ISBN 978-3-941269-98-9. [Google Scholar]
- Pradhan, A.; Vishwakarma, M.; Dwivedi, S.K. A review: The impact of hydrogen embrittlement on the fatigue strength of high strength steel. Mater. Today Proc. 2020, 26, 3015–3019. [Google Scholar] [CrossRef]
- Gong, P.; Turk, A.; Nutter, J.; Yu, F.; Wynne, B.; Rivera-Diaz-del-Castillo, P.; Rainforth, W.M. Hydrogen embrittlement mechanisms in advanced high strength steel. Acta Mater. 2022, 223, 117488. [Google Scholar] [CrossRef]
- Cho, S.; Kim, G.-I.; Ko, S.-J.; Yoo, J.-S.; Jung, Y.-S.; Yoo, Y.-H.; Kim, J.-G. Comparison of Hydrogen Embrittlement Susceptibility of Different Types of Advanced High-Strength Steels. Materials 2022, 15, 3406. [Google Scholar] [CrossRef]
- Zhou, C.; Ren, Y.; Yan, X.; Zheng, Y.; Liu, B. A Bibliometric and Visualized Overview of Hydrogen Embrittlement from 1997 to 2022. Energies 2022, 15, 9218. [Google Scholar] [CrossRef]
- Zhao, L.; Ma, C.; Zhao, A.; Fan, Y.; Li, Z. Hydrogen Embrittlement Behavior of a Commercial QP980 Steel. Metals 2023, 13, 1469. [Google Scholar] [CrossRef]
- Abubakar, S.A.; Mori, S.; Sumner, J. A Review of Factors Affecting SCC Initiation and Propagation in Pipeline Carbon Steels. Metals 2022, 12, 1397. [Google Scholar] [CrossRef]
- Liu, W.; Meng, Y.; Zhao, J.; Wen, W.; Gong, M.; Wu, S.; Li, S.; Yu, M.; Liu, J. Electrochemical and Mechanical Properties of Cathodically Protected X80 Steel in Different Temperature Soil. Materials 2022, 15, 5526. [Google Scholar] [CrossRef]
- Yang, X.; Sun, F.; Li, Q.; Zhu, R.; Liu, Z.; Du, C.; Li, X. Effect of Hydrogen Charging on the Stress Corrosion Cracking Behavior of X70 Steel in Simulated Deep Seawater Environment. Metals 2022, 12, 334. [Google Scholar] [CrossRef]
- Pohl, M. Hydrogen in Metals: A Systematic Overview. Pract. Metallogr. 2014, 51, 291–305. [Google Scholar] [CrossRef]
- Ilyushechkin, A.; Schoeman, L.; Carter, L.; Hla, S.S. Material Challenges and Hydrogen Embrittlement Assessment for Hydrogen Utilisation in Industrial Scale. Hydrogen 2023, 4, 599–619. [Google Scholar] [CrossRef]
- Morlet, J.G.; Johnson, H.H.; Troiano, A.R. A New Concept of Hydrogen Embrittlement in Steel. Appl. Phys. Rev. 1958, 189, 37–44. [Google Scholar]
- Lynch, S. Hydrogen embrittlement phenomena and mechanisms. Corros. Rev. 2012, 30, 105–123. [Google Scholar] [CrossRef]
- Castens, M.; Hoja, S.; Surm, H.; Hoffmann, F.; Fechte-Heinen, R.; Steinbacher, M. Hydrogen Absorption during Case Hardening of Steels EN20MnCr5 (SAE5120) and EN18CrNiMo7-6 (SAE4820). Metals 2022, 12, 6. [Google Scholar] [CrossRef]
- Feng, X.; Shi, Y.; Zhang, W.; Volodymyr, K. Hydrogen Embrittlement Failure Behavior of Fatigue-Damaged Welded TC4 Alloy Joints. Crystals 2023, 13, 512. [Google Scholar] [CrossRef]
- Beachem, C.D. A new model for hydrogen-assisted cracking (hydrogen “embrittlement”). Met. Trans 1972, 3, 441–455. [Google Scholar] [CrossRef]
- Birnbaum, H.K. Mechanisms of Hydrogen Related Fracture of Metals. In Technical Report; University of Illinois: Urbana, IL, USA, 1989. [Google Scholar]
- Wasim, M.; Djukic, M.B.; Ngo, T.D. Influence of hydrogen-enhanced plasticity and decohesion mechanisms of hydrogen embrittlement on the fracture resistance of steel. Eng. Fail. Anal. 2021, 123, 105312. [Google Scholar] [CrossRef]
- Kholtobina, A.S.; Pippan, R.; Romaner, L.; Scheiber, D.; Ecker, W.; Razumovskiy, V.I. Hydrogen Trapping in bcc Iron. Materials 2020, 13, 2288. [Google Scholar] [CrossRef] [PubMed]
- Metalnikov, P.; Ben-Hamu, G.; Eliezer, D. Hydrogen Trapping in Laser Powder Bed Fusion 316L Stainless Steel. Metals 2022, 12, 1748. [Google Scholar] [CrossRef]
- Bai, S.; Liu, L.; Liu, C.; Xie, C. Phase-Field Insights into Hydrogen Trapping by Secondary Phases in Alloys. Materials 2023, 16, 3189. [Google Scholar] [CrossRef] [PubMed]
- Eichinger, M.; Loder, B.; Tkadletz, M.; Schnideritsch, H.; Klösch, G.; Mori, G. On the Change in Hydrogen Diffusion and Trapping Behaviour of Pearlitic Rail Steel at Different Stages of Production. Materials 2023, 16, 5780. [Google Scholar] [CrossRef] [PubMed]
- Riecke, E.; Bohnenkamp, K. Über den Einfluß von Gitterstörstellen in Eisen auf die Wasserstoffdiffusion. Z. Met. 1983, 75, 76–81. [Google Scholar] [CrossRef]
- Dadfarnia, M.; Sofronis, P.; Neeraj, T. Hydrogen interaction with multiple traps: Can it be used to mitigate embrittlement. Int. J. Hydrog. Energy 2011, 36, 10141–10148. [Google Scholar] [CrossRef]
- Lee, J.-Y.; Lee, S.M. Hydrogen trapping phenomena in metals with B.C.C. and F.C.C. crystals structures by the desorption thermal analysis technique. Surf. Coat. Technol. 1986, 28, 301–304. [Google Scholar] [CrossRef]
- Yang, B.; Li, L.; Cheng, L. Numerical Evaluation on Analysis Methods of Trapping Site Density in Steels Based on Hydrogen Permeation Curve. Materials 2020, 13, 3712. [Google Scholar] [CrossRef]
- Wang, M.; Akiyama, E.; Tsuzaki, K. Effect of hydrogen on the fracture behavior of high strength steel during slow strain rate test. Corros. Sci. 2007, 49, 4081–4097. [Google Scholar] [CrossRef]
- Salmi, S.; Rhode, M.; Jüttner, S.; Zink, M. Hydrogen determination in 22MnB5 steel grade by use of carrier gas hot extraction technique. Weld. World Soudage Dans Monde 2015, 59, 137–144. [Google Scholar] [CrossRef]
- Wallaert, E.; Depover, T.; Pieters, B.; Arafin, M.A.; Verbeken, K. TDS Evaluation of the Hydrogen Trapping Capacity of NbC Precipitates. In International Hydrogen Conference (IHC 2012): Hydrogen-Materials Interactions; Somerday, B.P., Sofronis, P., Eds.; ASME Press: New York, NY, USA, 2014. [Google Scholar]
- Sun, C.; Fu, P.; Liu, H.; Liu, H.; Du, N.; Cao, Y. The Effect of Lath Martensite Microstructures on the Strength of Medium-Carbon Low-Alloy Steel. Crystals 2020, 10, 232. [Google Scholar] [CrossRef]
- Macchi, J.; Gaudez, S.; Geandier, G.; Teixeira, J.; Denis, S.; Bonnet, F.; Allain, S.Y.P. Dislocation densities in a low-carbon steel during martensite transformation determined by in situ high energy X-ray diffraction. Mater. Sci. Eng. A 2021, 800, 140249. [Google Scholar] [CrossRef]
- Cho, L.; Kong, Y.; Speer, J.G.; Findley, K.O. Hydrogen Embrittlement of Medium Mn Steels. Metals 2021, 11, 358. [Google Scholar] [CrossRef]
- Ma, H.; Tian, H.; Xin, J.; Cui, Z. Correlation between Microstructure and Hydrogen Degradation of 690 MPa Grade Marine Engineering Steel. Materials 2021, 14, 851. [Google Scholar] [CrossRef] [PubMed]
- Shim, D.H.; Lee, T.; Lee, J.; Lee, H.J.; Yoo, J.-Y.; Lee, C.S. Increased resistance to hydrogen embrittlement in high-strength steels composed of granular bainite. Mater. Sci. Eng. A 2017, 700, 473–480. [Google Scholar] [CrossRef]
- Cota, A.B.; Ooi, S.W.; Solano-Alvarez, W.; Bhadeshia, H.K.D.H. Infusion of hydrogen into nanostructured bainitic steel. Mater. Charact. 2017, 134, 96–102. [Google Scholar] [CrossRef]
- Dias, J.O.V. The First High-Strength Bainitic Steel Designed For Hydrogen Embrittlement Resistance. Ph.D. Thesis, Department of Materials Science and Metallurgy, University of Cambridge, Cambridge, UK, 2018. [Google Scholar]
- Mirzoev, A.A.; Verkhovykh, A.V.; Okishev, K.Y.; Mirzaev, D.A. Hydrogen interaction with ferrite/cementite interface: Ab initio calculations and thermodynamics. Mol. Phys. 2017, 116, 482–490. [Google Scholar] [CrossRef]
- Kim, J.S.; Lee, Y.H.; Lee, D.L.; Park, K.T.; Lee, C.S. Microstructural influences on hydrogen delayed fracture of high strength steels. Mater. Sci. Eng. A 2009, 505, 105–110. [Google Scholar] [CrossRef]
- Gibala, R.; DeMiglio, D.S. Hydrogen in iron and steels: Interactions, traps and crack path. In Hydrogen Effects in Metals; Bernstein, I.M., Thompson, A.W., Eds.; The Metallurgical Society of AIME: Wilkes-Barre, PA, USA, 1980. [Google Scholar]
- Tu, X.; Ren, Y.; Shi, X.; Li, C.; Yan, W.; Shan, Y.; Yang, K. Enhancing Strain Capacity by the Introduction of Pearlite in Bainite and Polygonal Ferrite Dual-Phase Pipeline Steel. Materials 2021, 14, 5358. [Google Scholar] [CrossRef]
- Yanachkov, B.; Lyutov, L.; Katzarov, I.; Drenchev, L.; Kolev, K. Effect of Microstructure on the Mechanical Response of Hydrogen-Charged Pure Iron. Metals 2022, 12, 2160. [Google Scholar] [CrossRef]
- Luithle, A. Einfluss der Kaltverfestigung und des Wasserstoffgehaltes auf die Flüssigmetallinduzierte Spannungsrisskorrosion beim Feuerverzinken von Baustählen. Ph.D. Thesis, Fakultät für Maschinenbau, Ruhr-Universität Bochum, Bochum, Germany, 2013. [Google Scholar]
- Ozdirik, B.; Suter, T.; Hans, U.; Depover, T.; Verbeken, K.; Schmutz, P.; Jeurgens, L.P.H.; Terryn, H.; De Graeve, I. Study of the hydrogen uptake in deformed steel using the microcapillary cell technique. Corros. Sci. 2019, 155, 55–66. [Google Scholar] [CrossRef]
- Toribio, J.; Lorenzo, M. Influence of the Straining Path during Cold Drawing on the Hydrogen Embrittlement of Prestressing Steel Wires. Metals 2023, 13, 1321. [Google Scholar] [CrossRef]
- Drexler, A.; Helic, B.; Silvayeh, Z.; Sommitsch, C.; Mraczek, K.; Domitner, J. Influence of Plastic Deformation on the Hydrogen Embrittlement Susceptibility of Dual Phase Steels. Key Eng. Mater. 2022, 926, 2077–2091. [Google Scholar] [CrossRef]
- Kühn, S.; Unterumsberger, F.; Suter, T.; Pohl, M. Neue Methoden zur Analyse von diffusiblem Wasserstoff in hochfesten Stählen. J. Mater. Test. 2013, 55, 648–652. [Google Scholar] [CrossRef]
- Weiss, Z. Analysis of Hydrogen in Inorganic Materials and Coatings: A Critical Review. Hydrogen 2021, 2, 225–245. [Google Scholar] [CrossRef]
- Fangnon, E.; Malitckii, E.; Yagodzinskyy, Y.; Vilaça, P. Improved Accuracy of Thermal Desorption Spectroscopy by Specimen Cooling during Measurement of Hydrogen Concentration in a High-Strength Steel. Materials 2020, 13, 1252. [Google Scholar] [CrossRef]
- Depover, T.; Verbeken, K. Thermal desorption spectroscopy study of the hydrogen trapping ability of W based precipitates in a Q&T matrix. Int. J. Hydrog. Energy 2018, 43, 5760–5769. [Google Scholar] [CrossRef]
- Truschner, M.; Pengg, J.; Loder, B.; Köberl, H.; Gruber, P.; Moshtaghi, M.; Mori, G. Hydrogen resistance and trapping behaviour of a cold-drawn ferritic–pearlitic steel wire. Int. J. Mater. Res. 2023, 114, 439–452. [Google Scholar] [CrossRef]
- Völkl, J.; Alefeld, G. The Gorsky Effect: Recent Results. Il Nuovo C 1976, 33B, 190–204. [Google Scholar] [CrossRef]
- Shibata, A.; Takeda, Y.; Kimura, Y.; Tsuji, N. Hydrogen-Related Fracture Behavior under Constant Loading Tensile Test in As-Quenched Low-Carbon Martensitic Steel. Metals 2022, 12, 440. [Google Scholar] [CrossRef]
- Suter, T. Mikroelektronische Untersuchungen bei Austenitischen “Rostfreien” Stählen. Ph.D. Thesis, ETH Zürich, Zürich, Switzerland, 1997. [Google Scholar] [CrossRef]
- Suter, T.; Böhni, H. The microcell technique. In Analytical Methods in Corrosion Science and Engineering; CRC Press: Boca Raton, FL, USA, 2005; pp. 649–696. [Google Scholar] [CrossRef]
- Devanathan, M.A.V.; Stachurski, Z. The Adsorption and Diffusion of Electrolytic Hydrogen in Palladium. Proc. R. Soc. Lond. Ser. A Math. Phys. Sci. 1962, 270, 90–102. [Google Scholar] [CrossRef]
- Manke, G.; Jürgensen, J.; Pohl, M. Development of an in-situ measuring Cell to nondestructive, local measurement of diffusible hydrogen content in steels. In Proceedings of the International Hydrogen Conference, Jackson Lake Lodge, WY, USA, 11–14 September 2016; pp. 440–445. [Google Scholar]
- Backhaus, F. Einflussgrößen auf die Wasserstoffaufnahme und Wasserstoffeffusion Hochfester Stähle. Ph.D. Thesis, Ruhr-Universität Bochum, Bochum, Germany, 2022. [Google Scholar] [CrossRef]
- Kühn, S. Einfluss von diffusiblem Wasserstoff auf die mechanischen Eigenschaften von hochfesten Mehrphasenstählen unter Berücksichtigung der Kaltverfestigung. In Berichte aus der Werkstofftechnik; Shaker Verlag: Aachen, Germany, 2011; ISBN 9783832299514. [Google Scholar]
- Suter, T. Möglichkeiten und Grenzen der lokalen, elektrochemischen Wasserstoffdetektion. Ph.D. Thesis, Ruhr-University Bochum, Bochum, Germany, 2019. [Google Scholar]
- Martin, A.; Trinke, P.; Bensmann, B.; Hanke-Rauschenbach, R. Hydrogen Crossover in PEM Water Electrolysis at Current Densities up to 10 A cm−2. J. Electrochem. Soc. 2022, 169, 094507. [Google Scholar] [CrossRef]
- Berns, H.; Theisen, W. Ferrous Materials: Steel and Cast Iron, 1st ed.; Springer: Berlin/Heidelberg, Germany, 2008; ISBN 10 3-540-71848-6. [Google Scholar]
- Jaseliunaite, J.; Galdikas, A. Kinetic Modeling of Grain Boundary Diffusion: The Influence of Grain Size and Surface Processes. Materials 2020, 13, 1051. [Google Scholar] [CrossRef] [PubMed]
- Zhou, X.-Y.; Zhu, J.-H.; Wu, H.-H. Molecular dynamics studies of the grain-size dependent hydrogen diffusion coefficient of nanograined Fe. Int. J. Hydrog. Energy 2021, 46, 5842–5851. [Google Scholar] [CrossRef]
- Turk, A.; Pu, S.D.; Bombač, D.; Rivera-Díaz-del-Castillo, P.E.J.; Galindo-Nava, E. Quantification of hydrogen trapping in multiphase steels: Part II—Effect of austenite morphology. Acta Mater. 2020, 197, 253–268. [Google Scholar] [CrossRef]
- Koyama, M.; Tasan, C.C.; Nagashima, T.; Akiyama, E.; Raabe, D.; Tsuzaki, K. Hydrogen-assisted damage in austenite/martensite dual-phase steel. Philos. Mag. Lett. 2016, 96, 9–18. [Google Scholar] [CrossRef]
- Ebling, F.; Klitschke, S.; Wackermann, K.; Preußner, J. The Effect of Hydrogen on Failure of Complex Phase Steel under Different Multiaxial Stress States. Metals 2022, 12, 1705. [Google Scholar] [CrossRef]
- Yan, Y.; Zhang, Y.; Zhao, L.; Chen, Y.; Cao, R.; Wu, H.; He, Y.; Yan, Y.; Qiao, L. Effect of Applied Tensile Stress on Hydrogen-Induced Delayed Fracture Mode of Fe-Ni-Cr Austenitic Alloy Weldment. Metals 2022, 12, 1614. [Google Scholar] [CrossRef]
- Toribio, J.; Lorenzo, M.; Aguado, L. Innovative Design of Residual Stress and Strain Distributions for Analyzing the Hydrogen Embrittlement Phenomenon in Metallic Materials. Materials 2022, 15, 9063. [Google Scholar] [CrossRef]
- Khader, I.; Kürten, D.; Kailer, A. The influence of mechanical stresses on the diffusion and accumulation of hydrogen in a cylindrical roller thrust bearing. Bear. World J. 2021, 5, 81–91. [Google Scholar]


Disclaimer/Publisher’s Note: The statements, opinions and data contained in all publications are solely those of the individual author(s) and contributor(s) and not of MDPI and/or the editor(s). MDPI and/or the editor(s) disclaim responsibility for any injury to people or property resulting from any ideas, methods, instructions or products referred to in the content. |
© 2023 by the authors. Licensee MDPI, Basel, Switzerland. This article is an open access article distributed under the terms and conditions of the Creative Commons Attribution (CC BY) license (https://creativecommons.org/licenses/by/4.0/).