Article

Design and Validation of Lifetime Prediction Model for Lithium-Thiocarbonyl Chloride Batteries Based on Accelerated Aging Experiments

1
School of Environment and Safety Engineering, North University of China, Taiyuan 030051, China
2
Institute of Advanced Energy Materials and Systems, North University of China, Taiyuan 030051, China
3
Hefei National Laboratory for Physical Sciences at the Microscale and Department of Chemistry, University of Science and Technology of China, Hefei 230026, China
4
School of Resources and Safety Engineering, Central South University, Changsha 410010, China
*
Authors to whom correspondence should be addressed.
Metals 2023, 13(9), 1579; https://doi.org/10.3390/met13091579
Submission received: 23 July 2023 / Revised: 22 August 2023 / Accepted: 4 September 2023 / Published: 10 September 2023
(This article belongs to the Special Issue Manufacturing and Characterization of Metallic Electrode Materials)

Abstract

:
The purpose of this study is to establish a life prediction model of lithium-thiocarbonyl chloride batteries by semi-empirical method. In the experiment, accelerated life tests on several groups of batteries at different temperatures were conducted. After a period of operation in the range from 25 °C to 74 °C, it was found that the higher the temperature, the less the remaining capacity of the batteries. According to the study of the battery aging mechanism, the characteristic parameter impedance of an aging battery would change exponentially with the increase of storage time and environmental temperature. The established life prediction model showed that the change in battery impedance spectrum had a good law, which made it possible to predict the state of charge (SOC) of the battery according to the local change characteristics of the electrochemical impedance spectroscopy (EIS) spectrum. The experimental data were compared with the fitted prediction curve, and the maximum deviation of the prediction was only 4.1036%, which indicated that the constructed model had high accuracy.

Graphical Abstract

1. Introduction

A lithium galvanic battery is a primary battery with lithium metal or alloy as the negative electrode, which has the advantages of large specific energy, a high working voltage, a wide temperature range, good storage performance, and a small self-discharge rate as well as being easy to carry and use. It can form various battery packs through a series-parallel connection, which is one of the preferred power sources for military and civilian equipment [1]. The lithium-thionyl chloride (Li\SOCl2) cell in the lithium galvanic battery system is a novel chemical power source that has developed rapidly in the past 40 years, whose mass-specific energy is relatively high among the known ones, which can reach more than 500 Wh/kg, 4 times that of the conventional alkaline zinc-manganese battery. In recent years, it has been widely used in the field of national defense [2].
As the negative electrode of the battery, lithium metal will release electrons when discharging, and the generated Li+ will enter the electrolyte and react with Cl on the surface of the positive electrode to generate LiCl. SOCl2 is not only the active material in the positive electrode of batteries, but it could also be a solvent [3]. SOCl2 is a mixture of sulfuric acid and hydrochloric acid in water, and it is easy to produce. When SOCl2 encounters water, it is easy to generate mixed acid. This mixture is very corrosive and easily corrodes stainless steel and general metals, so it is difficult to store or handle it in the air.
The negative electrode in the Li\SOCl2 cell is lithium metal, and the positive electrode material is a kind of inert porous carbon material. SOCl2 dissolved with inorganic salts such as LiClO4 or LiAlCl4 could be used as an electrolyte. Li\SOCl2 cell and its working principle [4] could be expressed as follows:
(−) Li|SOCl2/LiAlCl4|SOCl2 (C) (+)
Anode: Li → Li+ + e (oxidation reaction)
Cathode: 2SOCl2 + 4e→ SO2 ↑ + S ↓ + 4Cl (reduction reaction)
Total reaction: 4Li + 2SOCl2 → SO2 ↑ + S ↓ + 4LiCl ↓
The cathode of a Li\SOCl2 battery is a mixture of polytetrafluoroethylene (PTFE) and acetylene black, which are carriers of discharge products S and LiCl. The reaction products sulfur and sulfur dioxide are dissolved in excess thionyl chloride electrolyte, and during discharge, there will be a certain degree of pressure due to the production of sulfur dioxide [5]. Wang et al. [6] found that, during the storage period, the lithium negative electrode gradually reacts with the thionyl chloride electrolyte to form LiCl, and the lithium negative electrode can be protected by the LiCl film formed on it. This passivation film is beneficial to prolong the storage life of the battery, but it will cause voltage lag at the beginning of discharge. If the voltage of a lithium primary battery cannot immediately reach the required working state due to passivation or other reasons, it suffers a voltage lag. After long-term storage at high temperatures, the voltage lag phenomenon will be particularly obvious when the battery is discharged at a low temperature or with a slightly large current.
The carbon cathode of a Li\SOCl2 battery plays an important role in the flow of electrolytes in the battery and has the function of storing the reaction product lithium chloride. The discharge time, discharge voltage platform, and energy density of the battery are closely related to the porosity and pore size distribution of the carbon cathode. As electrolyte and cathode active material, SOCl2 needs to pass through the pores of the carbon cathode during the battery reaction. The uniform distribution of pores directly affects the reaction degree of SOCl2. The distribution of lithium chloride particles in the carbon cathode is directly related to pore size, and the reaction product lithium chloride can enter the carbon cathode through mesopores and macropores, which will directly affect the discharge time and capacity of the battery. It is found that the carbon cathode with a large specific surface area can prolong the discharge time of the battery [7].
In recent years, a lot of research on the long-term storage of batteries has been mostly aimed at lithium-ion secondary batteries rather than primary batteries, and the existing life prediction models are mostly developed based on lithium-ion secondary batteries. There are few studies on the life prediction model of lithium primary batteries.
At present, the research on the anode of a Li\SOCl2 battery is mainly aimed at the voltage lag phenomenon of the battery and the lithium chloride passivation film that appears on the anode lithium, which leads to the low initial discharge voltage platform of the battery. During the storage of the battery, lithium metal will contact SOCl2, and a redox reaction will occur, resulting in a lithium chloride passivation film insoluble in electrolytes. The transfer of electrons and the flow of electrolytes will be hindered by this passivation film [8]. At present, the existing research is mainly divided into three solutions [9]. The first is to change the anode lithium into lithium alloy, which increases the difficulty of forming a purified membrane. The second is to coat conductive electrolytes on a lithium sheet to improve the conductivity of the passivation film. The third is to make a lithium-thionyl chloride battery and a supercapacitor hybrid battery and destroy the passivation film of the anode by pulse current. Metal oxide electrodes can effectively solve the problem of passive-film deposition. Almessiere et al. [10] and Zdorovet et al. [11] developed a Dy-substituted Ni-Cu-Zn spinel ferrite material and a FeCo-Fe2CoO4/Co3O4-spinel type material. These two materials can not only fundamentally solve the problem of passive film, but also have excellent electrochemical performance. They are ideal candidates for electrode materials. In addition, many studies have shown that the addition of the second phase can significantly improve the electronic properties of the resulting composite film. The telluride glass doped with CeO2 obtained by Kozlovskiy et al. [12] not only has excellent anti-degradation ability but also has excellent electromagnetic shielding ability. Almessiere et al. [13] doped Sc3+ in Sr0.5Ba0.5ScxFe12−xO19 (SrBaSc)/NiFe2O4 (NiFe) hard-soft nanocomposites (NCs) to change their structure, morphology, and electromagnetic properties. Zhang and Wang [14] used the accelerated life test method. The charging and discharging tests and analysis of lithium batteries at different temperatures are carried out, and it is considered that the environmental temperature has a very serious impact on the life of lithium batteries. The results show that when the ambient temperature is higher than the normal working temperature, the higher the charging and discharging temperature of a lithium battery, the faster the battery aging speed, and the more serious the battery life attenuation. When the ambient temperature is lower than the normal working temperature, the electrochemical reaction of ions inside the battery will intensify, which will also accelerate the decay process of battery life. Research by Abraham et al. [15] studies the aging mechanism of batteries based on the lithium loss of negative electrodes. According to the representative accelerated aging data, the relationship between lithium loss and temperature and time was finally established, and the battery life prediction model was developed. Kassem et al. [16], through the experimental study of lithium batteries at different temperatures such as 30 °C, 45 °C, and 60 °C, explored the influence of different temperatures on the life of lithium batteries. The test results show that with the increase of ambient temperature, the life of lithium batteries will be reduced, and the battery-capacity loss is the most serious under the most serious aging condition (T = 60 °C).
Because the storage life of lithium primary batteries is longer than that of other lithium battery systems, it is necessary to obtain its key characteristic parameter information through an accelerated life test, which is convenient for establishing a model for prediction [17]. Under the premise of not changing the failure mechanism of the product, the test conditions are enhanced, so that the sample leaks out its defects in a short time, and the failure effect is aggravated [18]. The prediction of the storage life of lithium primary batteries is usually carried out at room temperature (RT), and the test time is quite long. To get the storage life of lithium primary batteries quickly, the accelerated life test method is usually adopted [19,20].
The basic principle of accelerated life tests is to deduce the life change law of test samples under normal strength stress by analyzing and processing the life change law of test samples under high strength stress. The relationship between different strength stress and the life change law of test samples is established, and the bridge reflecting the mathematical relationship between stress and the life of test samples is called the aging model. At present, there is a certain amount of theoretical basis for the construction of a lithium battery aging model. Through the study of the existing literature [21,22], it is found that the aging models of lithium primary batteries are mainly divided into life-prediction models based on physical and chemical mechanism-mechanism models, data-driven life-prediction-empirical model, and integrated life-prediction-semi-empirical model. The advantage of the semi-empirical model is that compared with the empirical model, there are not so many parameters that need to be obtained through experimental tests, and it can connect the internal electrochemical reaction of the battery with the external stress test so that the working process of the battery can be more intuitively reflected [23,24,25,26].
In the accelerated life experiment of the battery, the previous results show that the capacity attenuation of the battery is the key factor in determining whether the battery can continue to work with the increase of storage time and the change of storage temperature [27]. Dubarry et al. [28] found that the battery-capacity attenuation mechanism can be divided into three categories: active lithium loss, negative active material loss, and positive active material loss. For lithium primary batteries, the capacity attenuation mainly depends on the degree of lithium loss, and the main ways of lithium loss during storage are self-discharge reaction and the formation of solid electrolyte interface film (SEI) at the interface between electrode and electrolyte [29,30,31,32]. Combined with other testing methods such as battery charging and discharging performance tests, electrochemical impedance spectroscopy (EIS), capacity increment analysis (ICA), and differential voltage analysis (DVA), a lot of information about battery aging mechanisms can be obtained. In actual production processing and during normal use, the storage and shelving statuses of batteries are very common. The high-temperature storage environment will cause the battery capacity to significantly decay, and the influence degree will be aggravated with the increase in temperature [33,34,35,36,37,38,39].
In this study, a lithium primary battery was taken as the object, and a lithium thionyl chloride battery was taken as an example to study its performance degradation during storage through accelerated life tests at high temperatures. By analyzing the reaction mechanism of the lithium-thionyl chloride battery and combining it with the change in the AC impedance spectrum, the main aging mechanism of the battery was determined. On this basis, the semi-empirical model between performance characteristic parameters and storage time and temperature stress is established. Through this model, the relationship between accelerated stress and battery life can be quantitatively described. By comparing the experimental data with the aging model to predict the battery life, the accuracy of the model is verified.
Table 1 lists the comparison between this work and other main references in this paper.

2. Experimental and Modeling
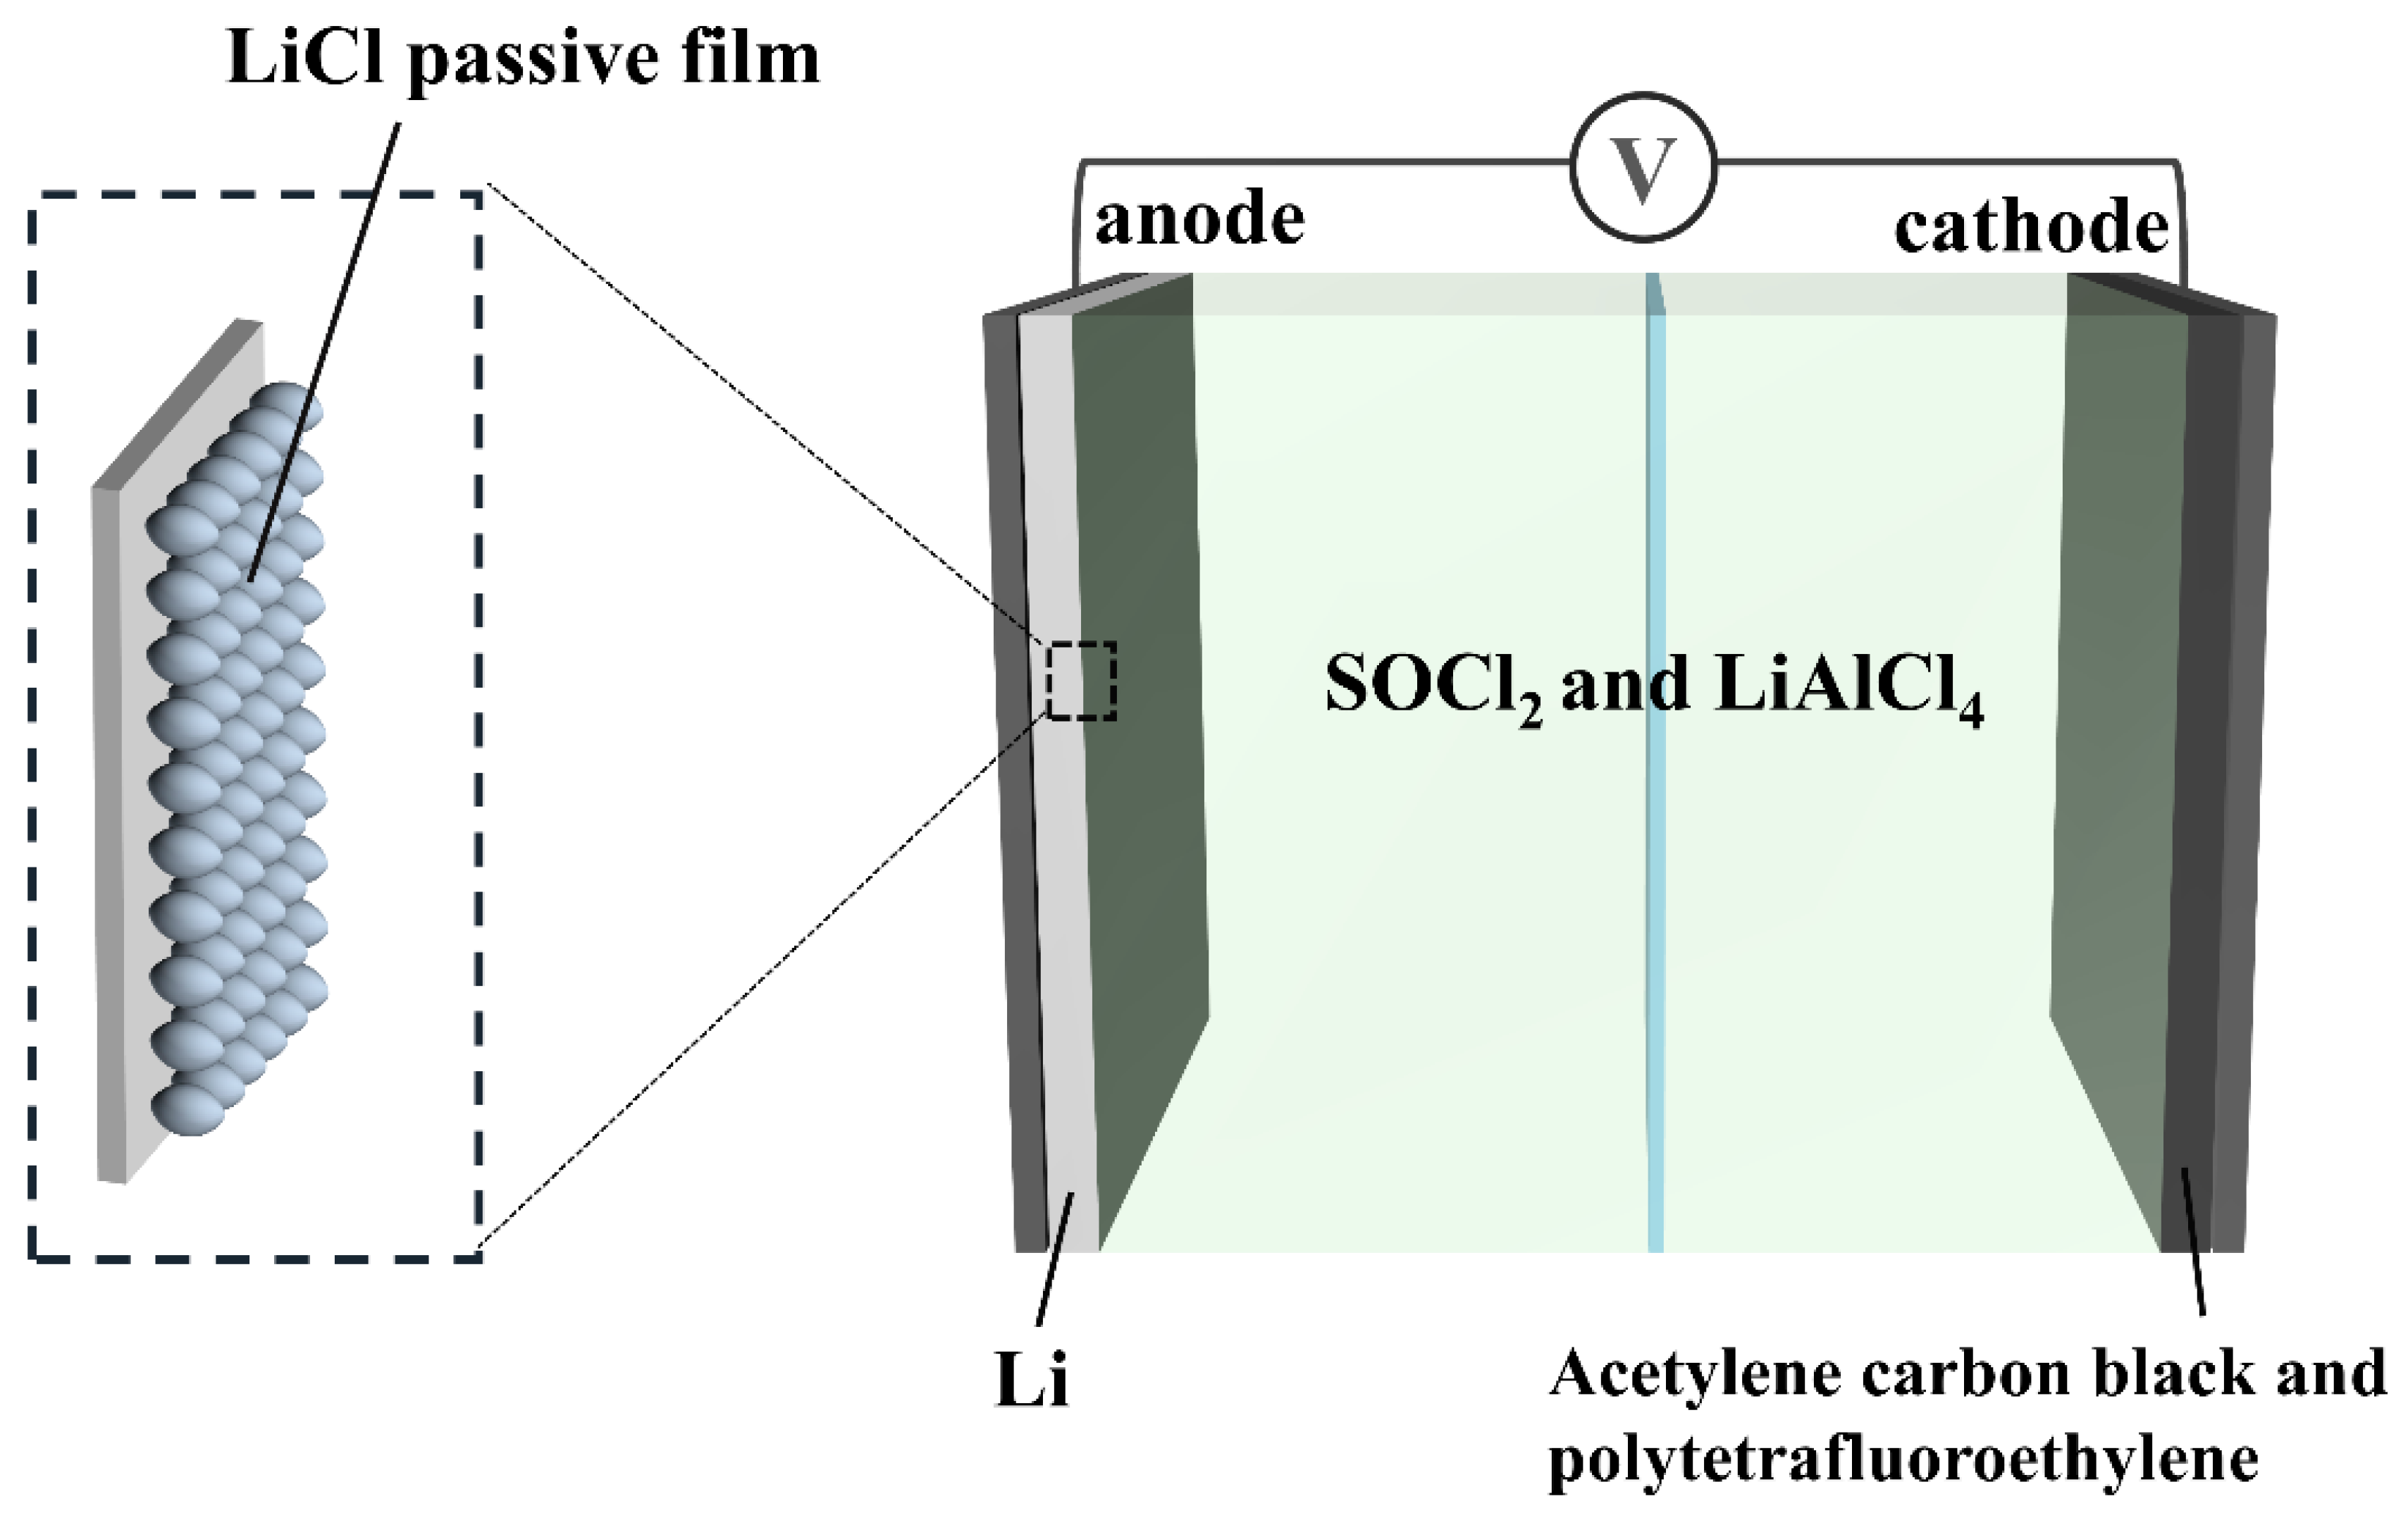
2.1. Materials

An ER14250 battery with a 1/2AA carbon-clad structure was taken as the research object of the accelerated life test under different temperature stresses. The open-circuit voltage of this Li\SOCl2 battery was 3.6∼3.7 V, and the capacity under 1 mA load was taken as its nominal capacity of 1200 mA·h. The thermal grade of the ER14250 battery material is shown in Table 2.
The constant stress accelerated life test of an AA-type winding Li\SOCl2 battery was carried out. The thermal grade of this kind of battery material is the same as that of the ER14250 battery material.

2.2. Accelerated Life Test

An accelerated life test mainly includes the following three types: constant-stress accelerated life test, step-stress accelerated life test, and progressive-stress accelerated life test. For the above-mentioned accelerated life tests, there are perfect theoretical bases and successful test experiences in the world, but at present, the most mainstream is the constant-stress accelerated life test.
Compared with the life test in an ordinary environment, the advantages of a constant-stress accelerated life test mainly include continuous adjustment of test conditions, shorter test time, less cost, convenient operation, accurate prediction, and strong reliability.
To ensure that the established aging model can be accurately used in the life prediction of Li\SOCl2 battery, it should be ensured that the increase of stress level will not change the capacity-degradation mechanism of the battery, that is, the capacity-degradation mechanism of the battery is the same under a normal environment and accelerated stress conditions. Therefore, when designing the accelerated stress level, the physical and chemical properties related to the applied stress in the internal materials and structures of the battery should be analyzed in detail to avoid the capacity-degradation mechanism that is inconsistent with the actual environment after the applied stress [29,30,31,32].

2.2.1. Accelerated Life Test under Different Temperature Stresses

According to the thermal grade of the ER14250 battery material and related standards, four different temperature stresses are drawn up: 25 °C (298.15 K), 45 °C (318.15 K), 56 °C (329.15 K), and 74 °C (347.15 K). After determining different test stresses, the accelerated life test of the lithium-thionyl chloride battery was set as a 24-week-long timed truncated test. The number of samples in each test cycle at each temperature is 4 batteries. The residual capacity of the battery was measured under the condition of a constant resistance of 330 Ω and a cut-off voltage of 2.0 V. The number distribution and test interval of batteries under different temperature stresses are shown in Table 3.

2.2.2. Constant-Stress Accelerated Life Test

Five different temperature stresses were set: RT namely 25 °C (298.15 K), 40 °C (313.15 K), 50 °C (323.15 K), 60 °C (333.15 K), and 70 °C (343.15 K).
In this experiment, the electrochemical workstation of the Zahner company in Germany was used. At an RT of 25 °C, an AC amplitude of 10 mV and an equilibrium potential were used as the open-circuit voltage, and the scanning frequency was 0.005 Hz~500 kHz. After the electrochemical impedance spectroscopy (EIS) test was completed, the remaining capacity of the battery was measured under the conditions of constant resistance discharge at 900 kΩ and a cut-off voltage of 2.0 V. The number of samples in each test cycle at each temperature is 4 batteries. The battery quantity distribution and performance test interval under different temperature stresses are shown in Table 4. The original data in this chapter are all from the research of Cheng et al. [33].

2.3. Modelling

2.3.1. Establishment of Aging Model

In the accelerated life test, the acceleration mechanism and effect corresponding to different accelerated stresses are different. The accelerated model is used to describe the relationship between the reliability characteristics of failure modes (such as characteristic life, average life, failure rate, etc.) and the accelerated stress level. Among the established accelerated life prediction models, the failure physical model is an important part, including the interface model, durability model (power law model, exponential model, and logarithmic model), stress-strength model, model based on reaction rate theory (Arrhenius model, Eyring model), weakest ring model, parallel model, cumulative damage model, competitive failure model and so on. Among them, the Arrhenius model, inverse power law model, Eyring model, and polynomial acceleration model are commonly used. In a certain environment, when the temperature becomes the absolute main factor affecting the aging and service life of products, the Arrhenius model derived by simply considering the effect of the thermal acceleration factor will be used to describe the test, and its predicted results will be closer to the real value, and the simulation test will be better [34].
In the experiment of temperature stress acceleration, the Arrhenius equation is often used as the model of the relationship between temperature constant stress acceleration life and temperature, as the following Equation (1) [35]:
A F = A × e ( E a R T )
where,
A is a constant;
Ea is the activation energy;
T is the thermodynamic temperature (K);
R is Boltzmann constant (R = 8.314 J·(mol·K)−1); and
AF is the ratio of a certain life characteristic value of a product under accelerated stress to that under normal stress, which can also be called the acceleration coefficient. It is a dimensionless number, reflecting the acceleration effect of a certain accelerated stress level in an accelerated life experiment, and is a function of accelerated stress. It can be seen from Equation (1) that the greater the activation energy (Ea), the lower the acceleration coefficient (AF), the easier it is to accelerate failure, and the more obvious the effect of the accelerated test. Here the actual percentage of battery-remaining capacity could be used, namely as Equation (2),
C a p a c t C a p i n i % = A · e ( E a R T )
Take natural logarithms on both sides to obtain Equation (3)
ln ( C a p a c t C a p i n i % ) = ( E a R ) ( 1 T ) + ln A
There is a linear relationship between the natural logarithm of the percentage of battery-remaining capacity and 1/T.

2.3.2. Establishment of Semi-Empirical Model

Based on two conditions, the aging mechanism under different temperature stresses is the same and the passivation film thickening is the main aging process, the following semi-empirical prediction model (Equation (4)) for fitting aging data can be established [36].
I m Z a c t ( t , T ) I m Z i n i = 1 + B T · F ( t )
ImZact(t,T) is the imaginary part of the impedance corresponding to the highest point of the arc at the high-frequency end of the impedance spectrum under the conditions of storage time t and temperature stress T.
ImZini is the average value of the imaginary part of the impedance corresponding to the highest point of the arc at the high-frequency end of the impedance spectrum determined by the AC impedance test for a batch of batteries before the start of the accelerated life test.
B(T) describes the influence of temperature stress T and T0 on the impedance characteristic parameter value, which can be expressed as Equation (5),
B T = C T T T 0 Δ T
To describe the influence of temperature stress T on the characteristic value of AC impedance, the parameter CT is introduced into Equation (5). The reference temperature T0 can be randomly selected. In this chapter, T0 = 25 °C is selected. ΔT is set to 10 °C, which means that compared with the reference condition T0, the change rate of AC impedance characteristic value will increase by CT times when the temperature rises by 10 °C. Ecker et al. [24] and Oliver et al. [37] have used similar equations to describe the aging behavior of lithium-ion batteries and supercapacitors.
F(t) describes the influence of storage time t on the value of impedance characteristic parameters, which can be expressed as Equation (6),
F t = C a · t b
To describe the influence of storage time t on the characteristic value of AC impedance, the parameter Ca is introduced into Equation (6). Ca is the fitting coefficient, which describes the change rate of AC impedance characteristic value at the reference temperature.
Bring B(T) and F(t) into Equation (7) to get the final semi-empirical prediction model.
I m Z a c t   ( t , T ) I m Z i n i = 1 + C T T T 0 Δ T · C a · t b
We select three groups of experimental data under temperature stresses of 50 °C (323.15 K), 60 °C (333.15 K), and 70 °C (343.15 K) to parameterize the semi-empirical prediction model. The global optimization algorithm (UGO) on 1Stopt 8.0 software was used to fit the multivariate nonlinear curve of the experimental data, and UGO is also called the modern heuristic algorithm with global optimization performance, strong universality, and suitability for parallel processing. This algorithm generally has a strict theoretical basis, and theoretically, it can find the optimal solution or approximate optimal solution in a certain time [38]. The parameter fitting results are listed in Table 5. The data comes from Equation (7).

2.3.3. Prediction Model of Storage Life of Lithium-Thionyl Chloride Battery

The generalized prediction equation can accurately predict the impedance characteristic parameters after storage for a period under different temperature stresses. The storage life prediction model of a lithium-thionyl chloride battery can be obtained by modifying Equation (7), as shown in Equation (8).
t = I m Z a c t I m Z i n i 1 C T T T 0 Δ T · C a b

2.3.4. Nondestructive Prediction Model of Residual Capacity of Lithium-Thionyl Chloride Battery

Cheng et al. [39] found the semi-empirical formula of the residual capacity of the lithium-thionyl chloride battery studied is as shown in Equation (9),
C a p a c t C a p i n i = 1 + C T ( C a p ) T T 0 Δ T · C a ( C a p ) · t b ( C a p )
Parameterize the semi-empirical formula of residual capacity (Equation (9)) with the data of residual capacity obtained from the accelerated life test, and the parameters obtained are as follows,
CT(Cap) = 1.40494 Ca(Cap) = −0.01881 b(Cap) = 0.43819
C a p a c t C a p i n i = ( I m Z a c t I m Z i n i 1 C T T T 0 Δ T · C a ) b ( C a p ) b + 1 + C T ( C a p ) T T 0 Δ T · C a ( C a p )
The parameters in Equation (10) are as follows,
CT(Cap) = 1.40494 Ca(Cap) = −0.01881 b(Cap) = 0.43819
CT(Cap) = 1.27665 Ca(Cap) = 0.24885 b(Cap) = 0.73963

2.4. Electrochemical Impedance Spectroscopy Analysis

The battery-life-prediction problem in the experiment and modeling part of this section is based on the influence of the passivation film on the lithium metal electrode on the battery capacity. The law of capacity decline can be explained by the evolution of the electrochemical impedance spectrum of the battery. Electrochemical impedance spectroscopy (EIS) is a nondestructive parameter measurement and an effective method for measuring battery dynamic behavior. When a sine wave voltage signal with a frequency is applied to the battery system, the system produces a sine wave current response, and the change of the ratio of excitation voltage to response current is the impedance spectrum of the electrochemical system. Electrochemical impedance spectroscopy is an appropriate method to analyze the formation of film on the electrode surface.
The dense passivation film formed on the lithium metal electrode can prevent the lithium metal electrode from further corrosion or oxidation to a certain extent. Many excellent studies have studied the preparation and testing methods of such anti-corrosion films. Kozlovskiy et al. [40] used electrochemical deposition to prepare CuX-type films, which have strong corrosion resistance. Zubar et al. [41] prepared NiFe thin films deposited on Cu substrates by electrolyte deposition, which effectively hindered the removal of hydrogen on the cathode surface.
The accelerated life test of a Li\SOCl2 battery shows that capacity loss is the main failure phenomenon, and the formation of LiCl passivation film is the main influencing factor of battery aging. To further establish a non-destructive prediction model of storage life based on AC impedance characteristics, the following is an analysis of the battery. Figure 1 is the electrochemical impedance spectrum (EIS) of a Li\SOCl2 battery stored at 50 °C (Figure 1a) and 70 °C (Figure 1b) at different times.
From Figure 1a,b, it can be found that the AC impedance spectra measured by the battery have similar characteristics at RT or under accelerated stress conditions. The AC impedance spectrum of the Li\SOCl2 battery includes a semicircle generating passive-film impedance on the positive electrode surface in the middle and high-frequency range and a straight line extending to the upper right at low frequency.
Comparing the AC impedance spectra of batteries stored at 50 °C and 70 °C in Figure 1 for different times, it is found that under the same accelerated stress condition, with the increase of storage time, the arc in the high-frequency range in the impedance spectrum gradually increases, and the trend extending to the upper right at low frequency is basically the same. The above laws still exist under different accelerated stress conditions, and the higher the temperature stress, the faster the above changes. The same change law of the AC impedance spectrum shows that the aging mechanism of the battery is consistent under different accelerated stress conditions. Through analysis, we can know that the change of the battery impedance spectrum has a good law, and there are many studies to determine the state of charge according to EIS. The local change characteristics of the battery EIS spectrum obtained in this paper are also suitable for predicting the state of charge of batteries [42]. EIS can provide detailed information about the electrochemical process inside the battery, such as the ion transport of electrolytes and interface reaction between electrodes and electrolytes. EIS can provide valuable data and indicators for battery life. It can help to monitor the internal state and changes of the battery, such as the concentration of electrolytes, the adhesion and loss of materials, etc. By analyzing EIS data, the health status of the battery and the problems that may lead to shortened battery life could be identified. In this way, the service life of the battery can be prolonged by finding and solving these problems. Rapid charging will lead to excessive heat generated by the battery, which may damage the structure and performance of the battery. A high discharge rate will lead to a more intense chemical reaction inside the battery, which increases the risk of shortening the battery life. Frequent deep discharge will lead to battery-capacity attenuation. A deep discharge will cause greater impact and damage to the active materials in lithium-thionyl chloride batteries.

3. Results and Discussion

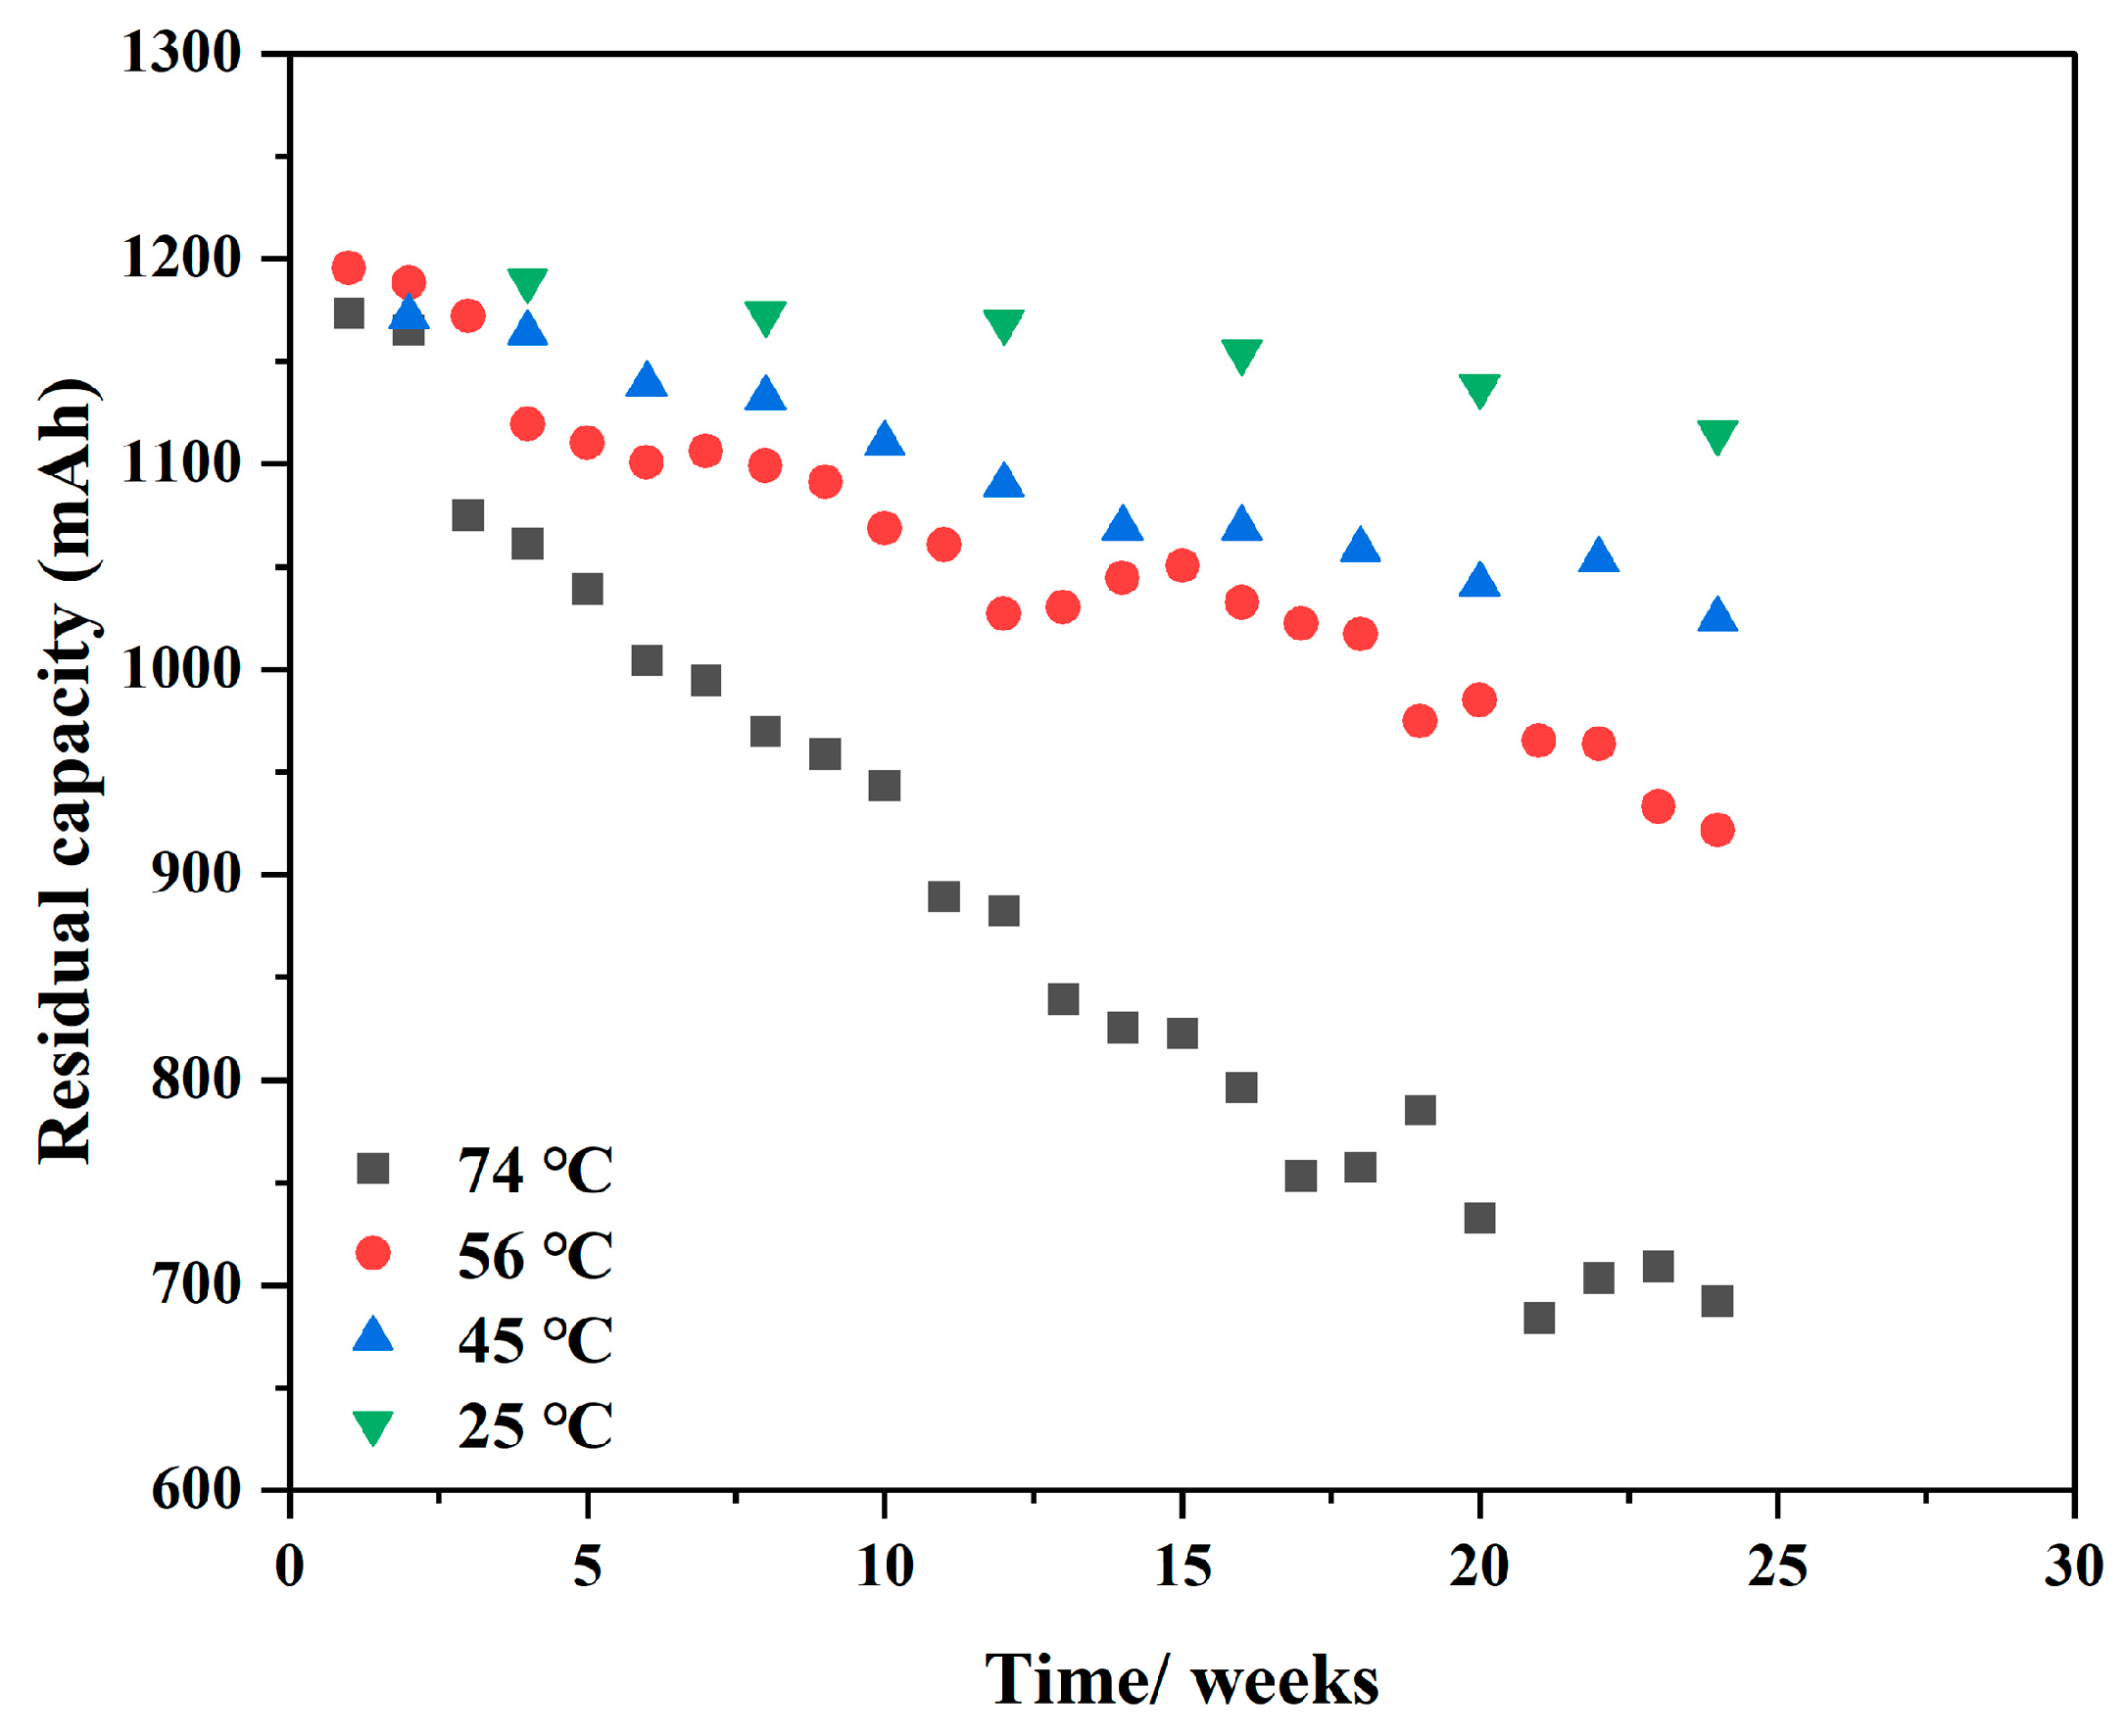
3.1. Analysis of Accelerated Life Test Data

Lithium-thionyl chloride battery was stored under different temperature stresses for an accelerated life test, and the remaining capacity of the battery was tested periodically during the test. To better observe the aging law, the scatter plot of accelerated life test data (Figure 2) is shown below. By observing the residual capacity attenuation of a lithium-thionyl chloride battery under four different temperature stresses in Figure 2, the following laws can be obtained: the residual capacity attenuation of a lithium-thionyl chloride battery stored under high-temperature stress is more significant. In the same storage time, the loss rate of residual capacity at high temperatures is greater than that at RT. The greater the acceleration stress is, the higher the temperature is, and the faster the remaining capacity of the battery decays.

3.1.1. Aging Model Test

Because there are two factors affecting the percentage of battery-remaining capacity, namely, accelerated life temperature stress T and accelerated life test time t, the change law of accelerated life test time t and battery-remaining capacity percentage is studied first.
Firstly, the data of the accelerated life test are processed, fitting trend lines are added to the scatter plot, and possible functions are fitted by Origin 2022 software (Figure 3).
Calculate the percentage of battery-remaining capacity and draw a scatter diagram (Figure 3a). By fitting the trend line results, it can be determined that the percentage of battery-remaining capacity decreases exponentially with the change of accelerated life test time t, as shown in Figure 3b. Therefore, the accelerated life test time t is transformed to establish a linear equation, as shown in Equation (11).
C a p a c t C a p i n i % = A T · t c + B ( T )
When the constant c is determined, the temperature stress T is the only variable for Equation (11), and the natural logarithm of the remaining capacity percentage has a linear relationship with 1/T, so that the functions of A(T) and B(T) can be solved and the aging function can be established. A(T) describes the influence of temperature stress T and T0 on battery-capacity parameters.
The data under temperature stresses of 25 °C (298.15 K), 56 °C (329.15 K), and 74 °C (347.15 K) were fitted to obtain fitting curves. The values of constant c of three fitting curves corresponding to these three groups of temperature stresses are all around 0.6, so the optimal value of constant c is 0.6. Exponentially transform the test time t, draw a scatter plot of the 0.6 power of the test time t and the percentage of the remaining capacity of the battery, and fit it. The fitting result is shown in Figure 4. It can be determined that this fitting is effective, and t0.6 is a very suitable choice.
After determining the constant c = 0.6, three groups of data at 25 °C (298.15 K), 56 °C (329.15 K), and 74 °C (347.15 K) are linearly fitted to obtain the corresponding values of A(T) and B(T), as shown in Table 6.
According to Equation (3), when the constant c is determined, the temperature stress T is the only variable for the accelerated life test of this formula, while according to Equation (2), there is a linear relationship between the natural logarithm of the remaining capacity percentage and the reciprocal of the temperature stress T for the accelerated life test. With 1/T as a variable, the images of it and parameters A(T) and B(T) are drawn, and it is observed that both the relationships are approximately linear, which could be expressed as Equations (12) and (13).
A ( T ) = a A T × 1000 + b A
B T = a B T × 1000 + b B
The least square method is used to linearly fit the data of 25 °C (298.15 K), 56 °C (329.15 K), and 74 °C (347.15 K). The fitting results are illustrated in Figure 5 and the parameters are listed in Table 7.
The final age function could be calculated by Equation (14).
C a p a c t C a p i n i % = ( a A T · 1000 + b A ) · t 0.6 + a B T · 1000 + b B
Because the data under the temperature stress of 45 °C (318.15 K) is not used in the fitting process, the prediction value is calculated by the aging function, and the deviation between the prediction value of the aging model and the test value is calculated, so the accuracy of the aging model can be checked.
See Table 8 for the predicted values and deviation calculation results. The predicted value calculated by the model is very close to the test value. The maximum deviation of prediction is 4.1036%, which shows that the aging model can accurately predict the remaining capacity percentage of the ER14250 battery.

3.1.2. Aging Mechanism of Lithium-Thionyl Chloride Battery

According to the electrode reaction during the discharge of a Li\SOCl2 battery, the self-discharge reaction will occur on the surface of lithium foil during storage, resulting in the formation of LiCl and S precipitates, which will lead to the formation of insoluble LiCl passivation film on the surface of lithium metal. As shown in Figure 6, the passivation film can inhibit the reaction between the anode and SOCl2 and play a key role in protecting the anode [43]. However, the formation of passive film will lead to the loss of lithium metal, which will lead to the reduction of battery capacity. On the surface of lithium metal, there are two kinds of passivation films: dense layer and sparse layer. The first layer next to the lithium electrode can prolong the storage life of the battery and reduce self-discharge, while the second layer outside is porous and will continue to grow [44]. The formation of the secondary membrane may be caused by the dissolution and precipitation of the primary membrane. Because of its loose and porous structure, the secondary membrane has good electrical conductivity and is difficult to measure by electrochemical method. After further prolonging the storage time, its thickness increased enough to be detected by a scanning electron microscope (SEM) and other electrochemical means [45].
The increase in storage temperature accelerates the chemical reaction between lithium and electrolytes, which intensifies the self-discharge of the Li\SOCl2 battery and leads to a decrease in battery capacity. With the increase of storage temperature, the diffusion speed of the products of the self-discharge reaction will also be accelerated, and more solid LiCl and undissolved S will be deposited on the surface of porous carbon, blocking the internal diffusion channels of porous carbon, and reducing the battery capacity [46].
The thickening of passivation film thickness is the main reason why the impedance value of a Li\SOCl2 battery increases with storage time during aging. Therefore, the formation of passive film can be considered as the main aging process. Under temperature stress, the formation of passive film is the main reason for the battery-capacity attenuation, and its aging mechanism is the loss of active lithium [47]. Whether the battery-capacity-degradation mechanism is the same under the same temperature stress can be determined by the similar impedance shape in the Nyquist diagram of the battery AC impedance test.

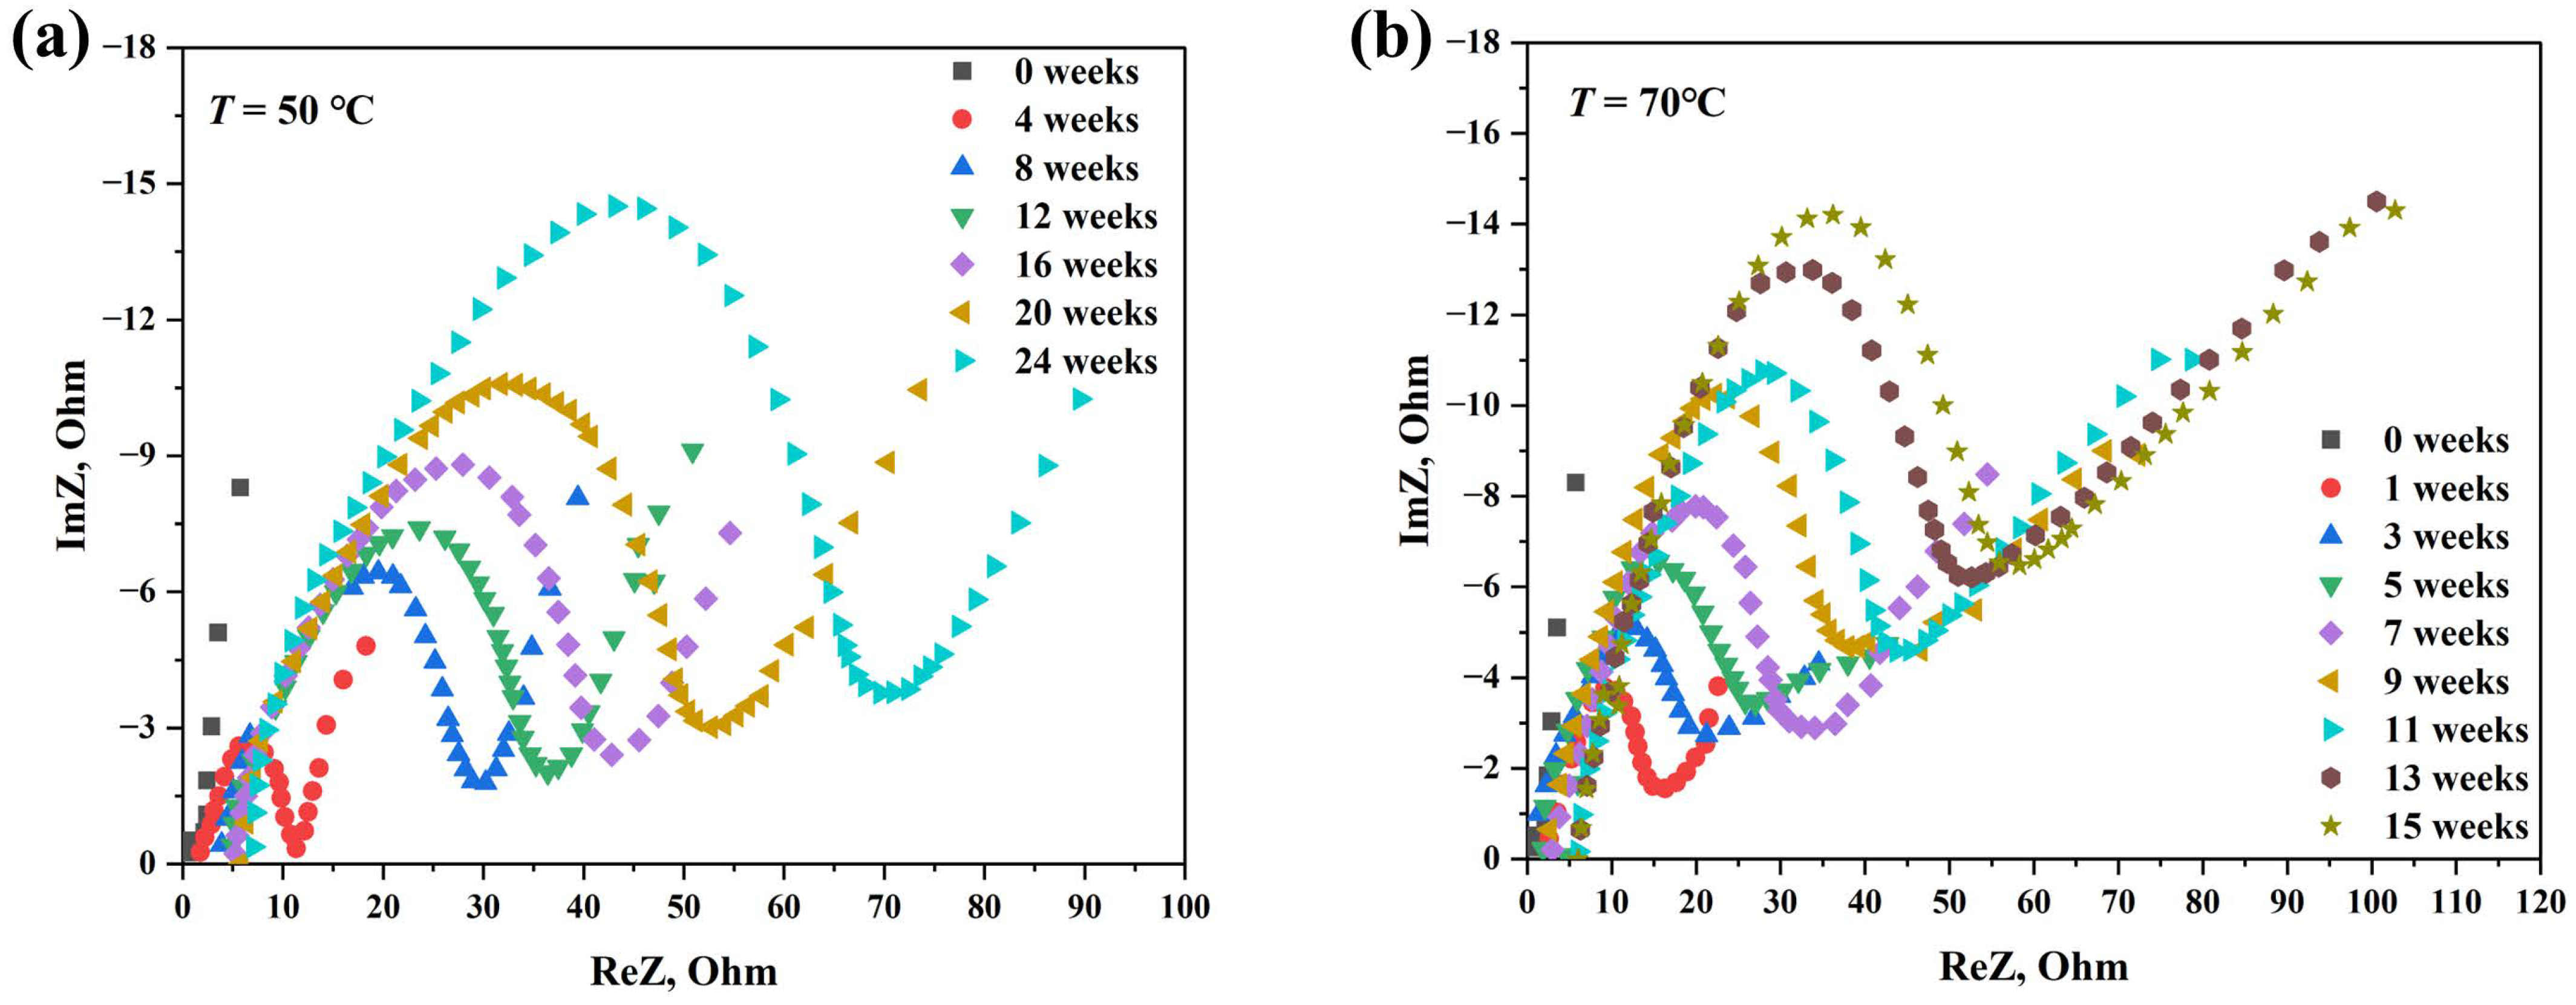
3.2. Effect of Storage Time on EIS Results of Battery after Accelerated Life Test

Figure 7 is a scatter plot of impedance characteristic parameters (ImZact/ImZini) varying with storage time t under different temperature stress conditions. Under the same temperature stress conditions, the change of impedance characteristic parameters of the sample increases with the extension of storage time. In the same storage time, the higher the applied temperature stress, the more significant the increase of the impedance characteristic parameters of the sample. In the same test time interval, the increase of its variation is also uneven, that is, the initial value of the accelerated life test is large, and with the increase of storage time, the value is gradually reduced.
It can be seen from the observation in Figure 7 that the changing trend of impedance characteristic parameters is like that of the exponential function. By using Origin 2022 software to add a trend line to it, according to the fitting results, it can be determined that its change is approximately exponential growth behavior.

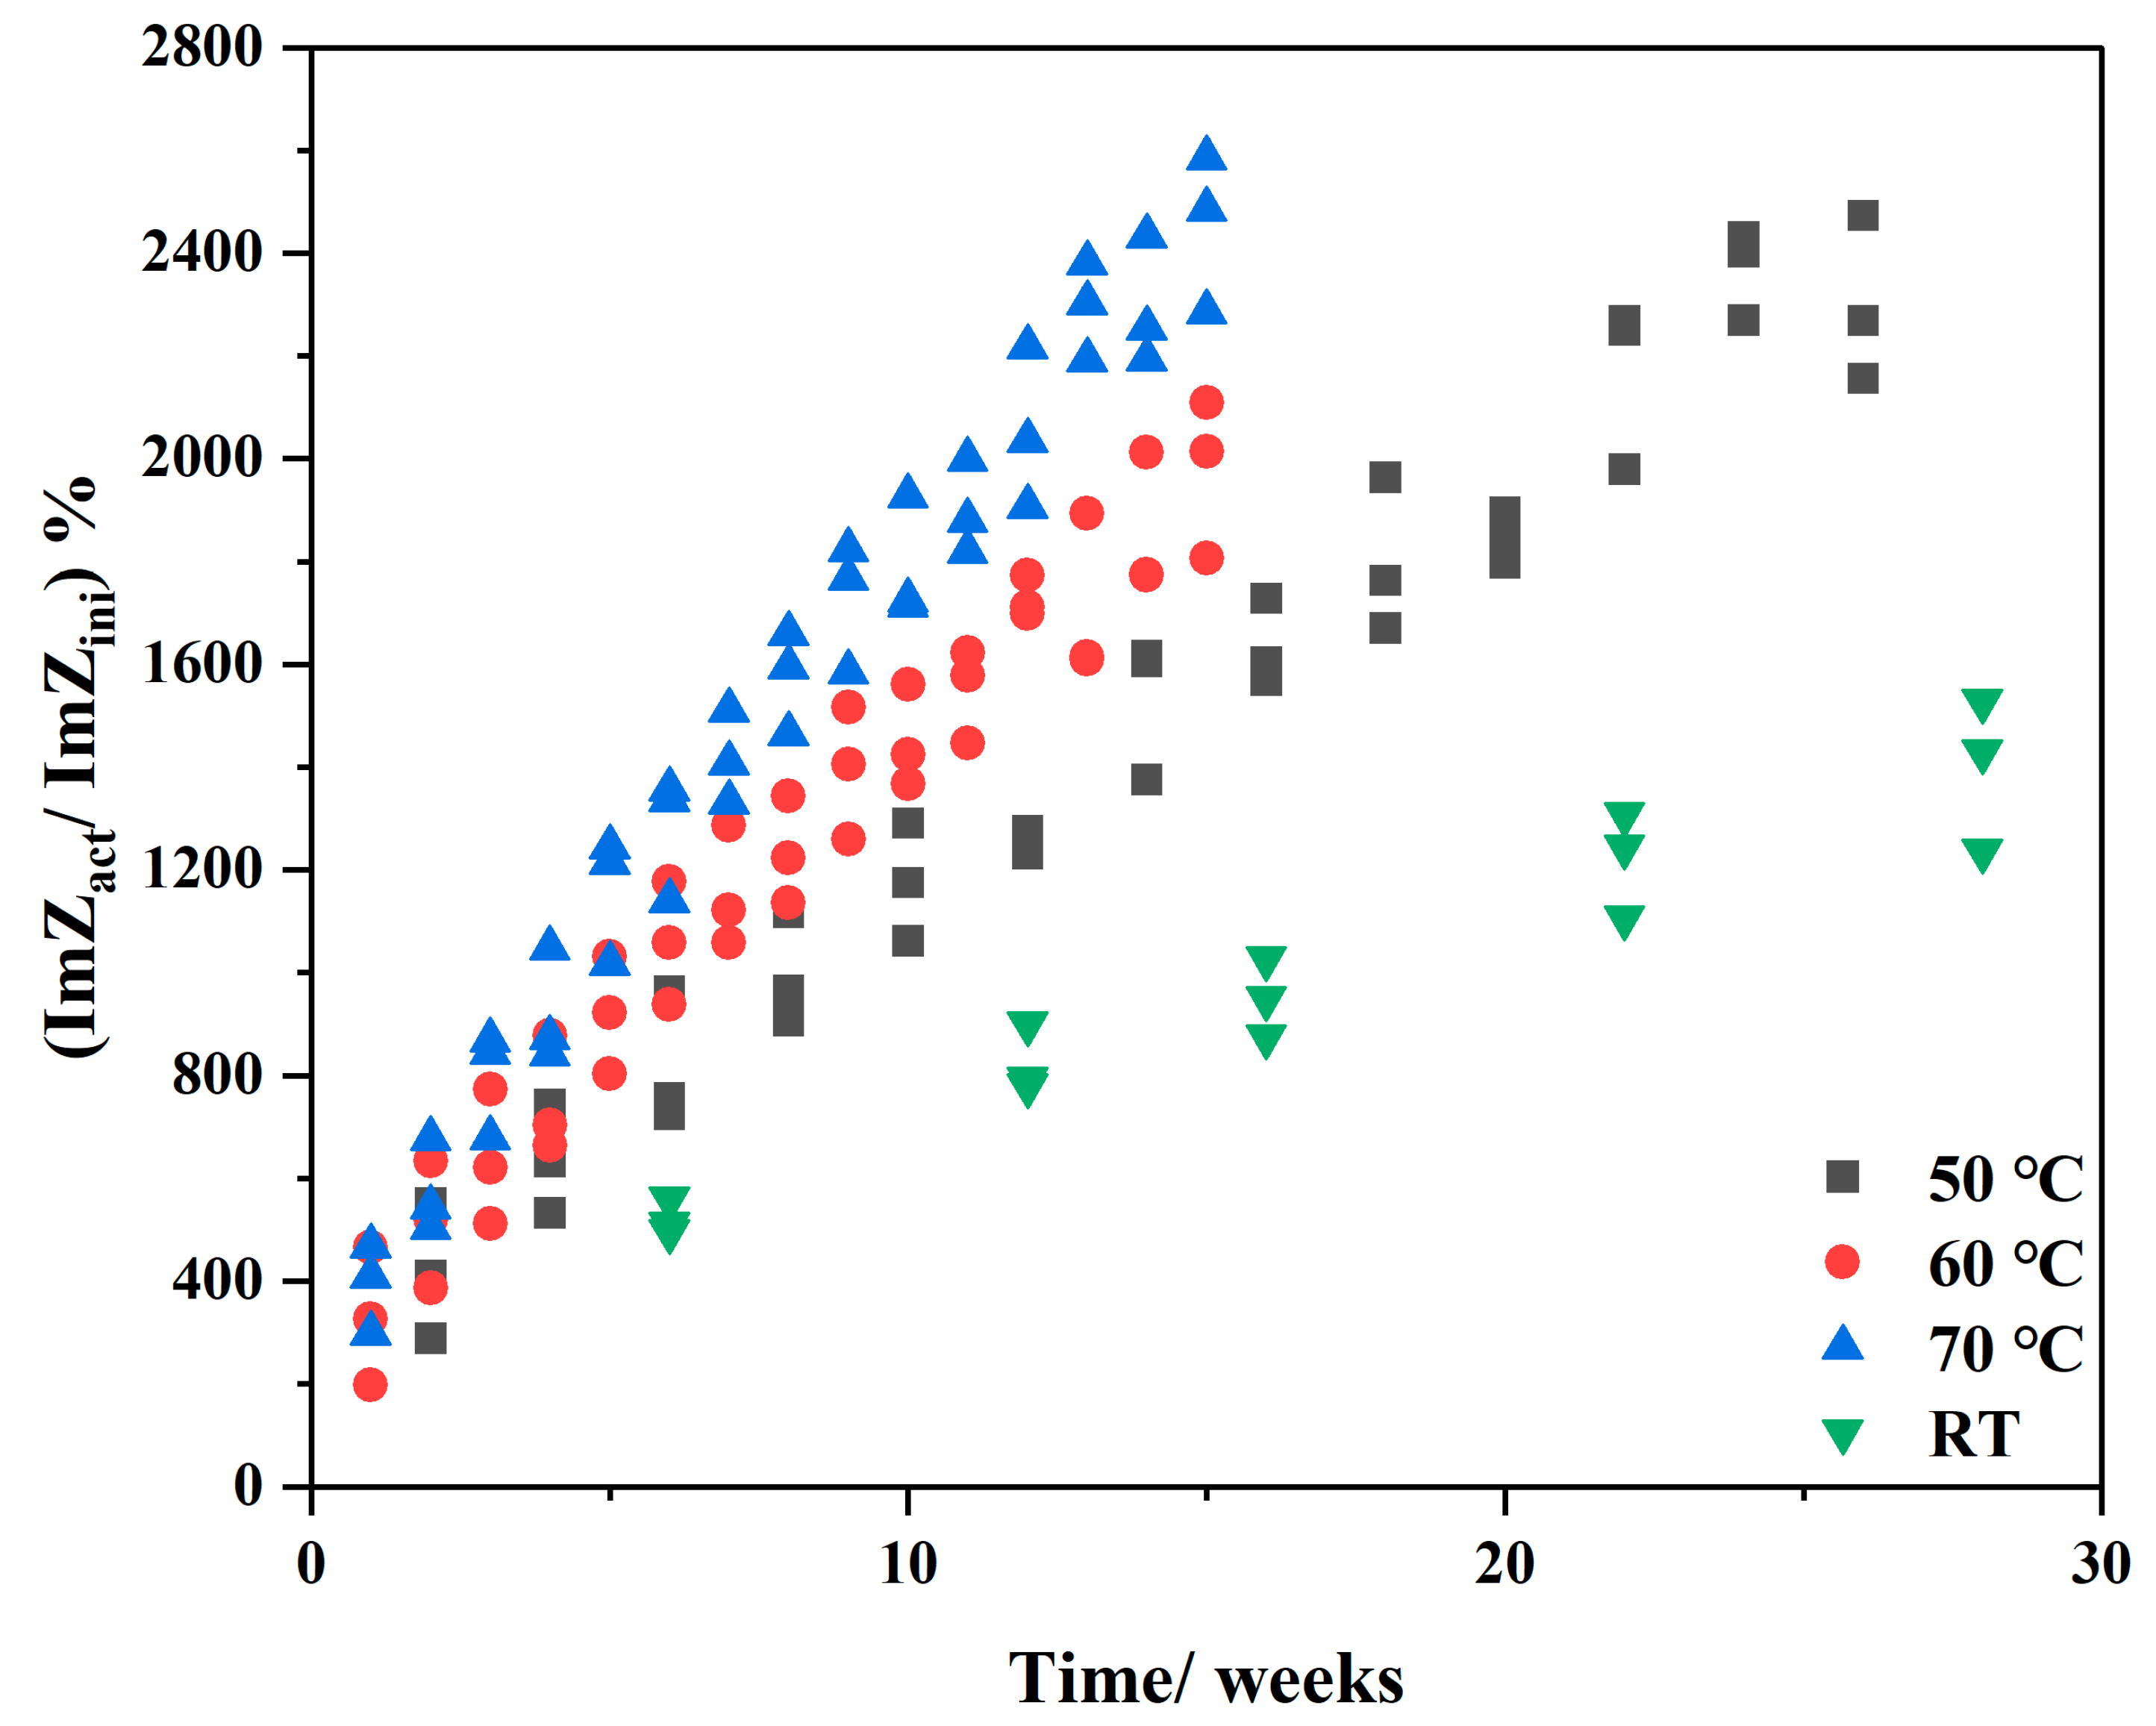
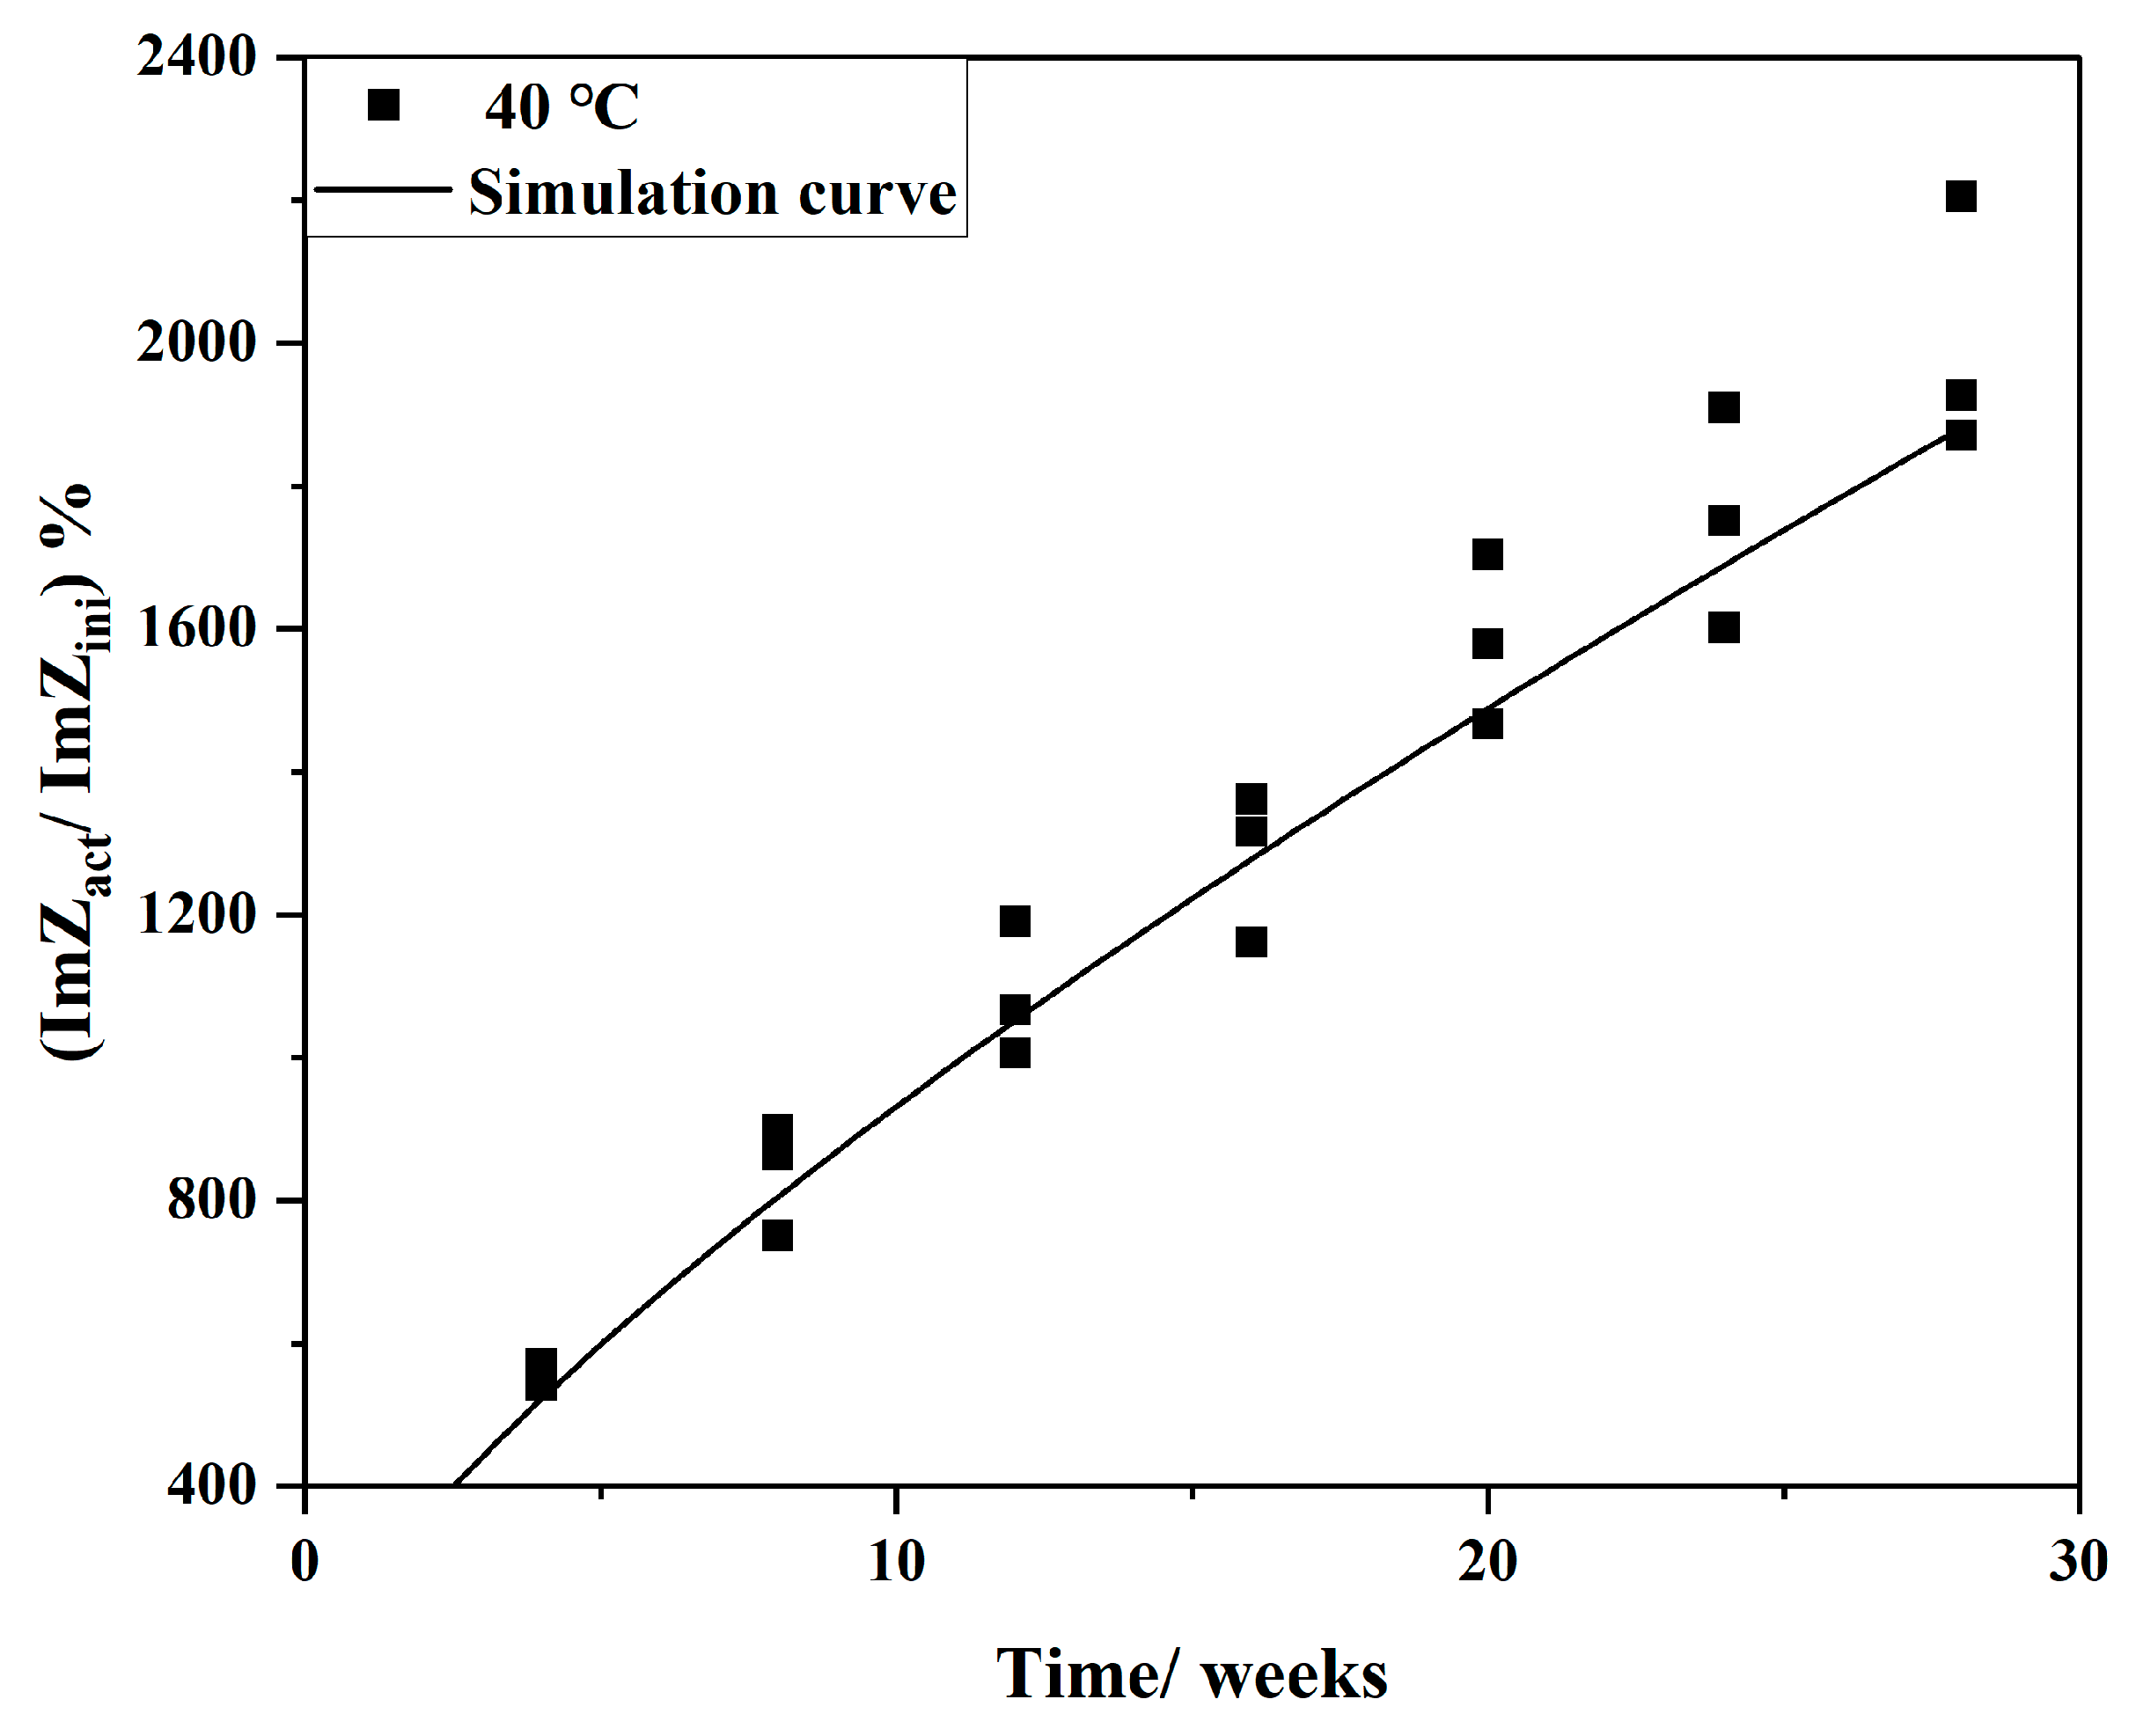
3.3. Influence of Accelerated Stress T on EIS Results of Battery

The Arrhenius model is used to describe the test results, and here the change rate of impedance characteristic parameters could be used, namely as Equation (15),
I m Z a c t I m Z i n i % = A · e ( E a R T )
Take natural logarithms on both sides to get Equation (16),
ln ( I m Z a c t I m Z i n i % ) = ( E a R ) ( 1 T ) + ln A
That is, the natural logarithm of the change rate of impedance characteristic parameters has a linear relationship with 1/T.
The data are processed, and the natural logarithm ( ln I m Z a c t / I m Z i n i × 100 ) of the change rate of impedance characteristic parameters stored for 6 weeks, 10 weeks, and 14 weeks is selected and plotted with the reciprocal of temperature stress T, and then Figure 8 is obtained by linear fitting. R2 of the fitting curve corresponding to the data stored for 6 weeks, 10 weeks, and 14 weeks is 0.97397, 0.92250, and 0.99777, respectively, shows that there is a linear relationship between the change rate of impedance characteristic parameter (ImZact/ImZini)% and the reciprocal of temperature stress T. The following assumption can be made: the influence of temperature on the impedance characteristic parameter value is an exponential function. This assumption is similar to the previous study [24], in which Ecker et al. concluded that the influence of temperature on the performance of most batteries is an exponential function.

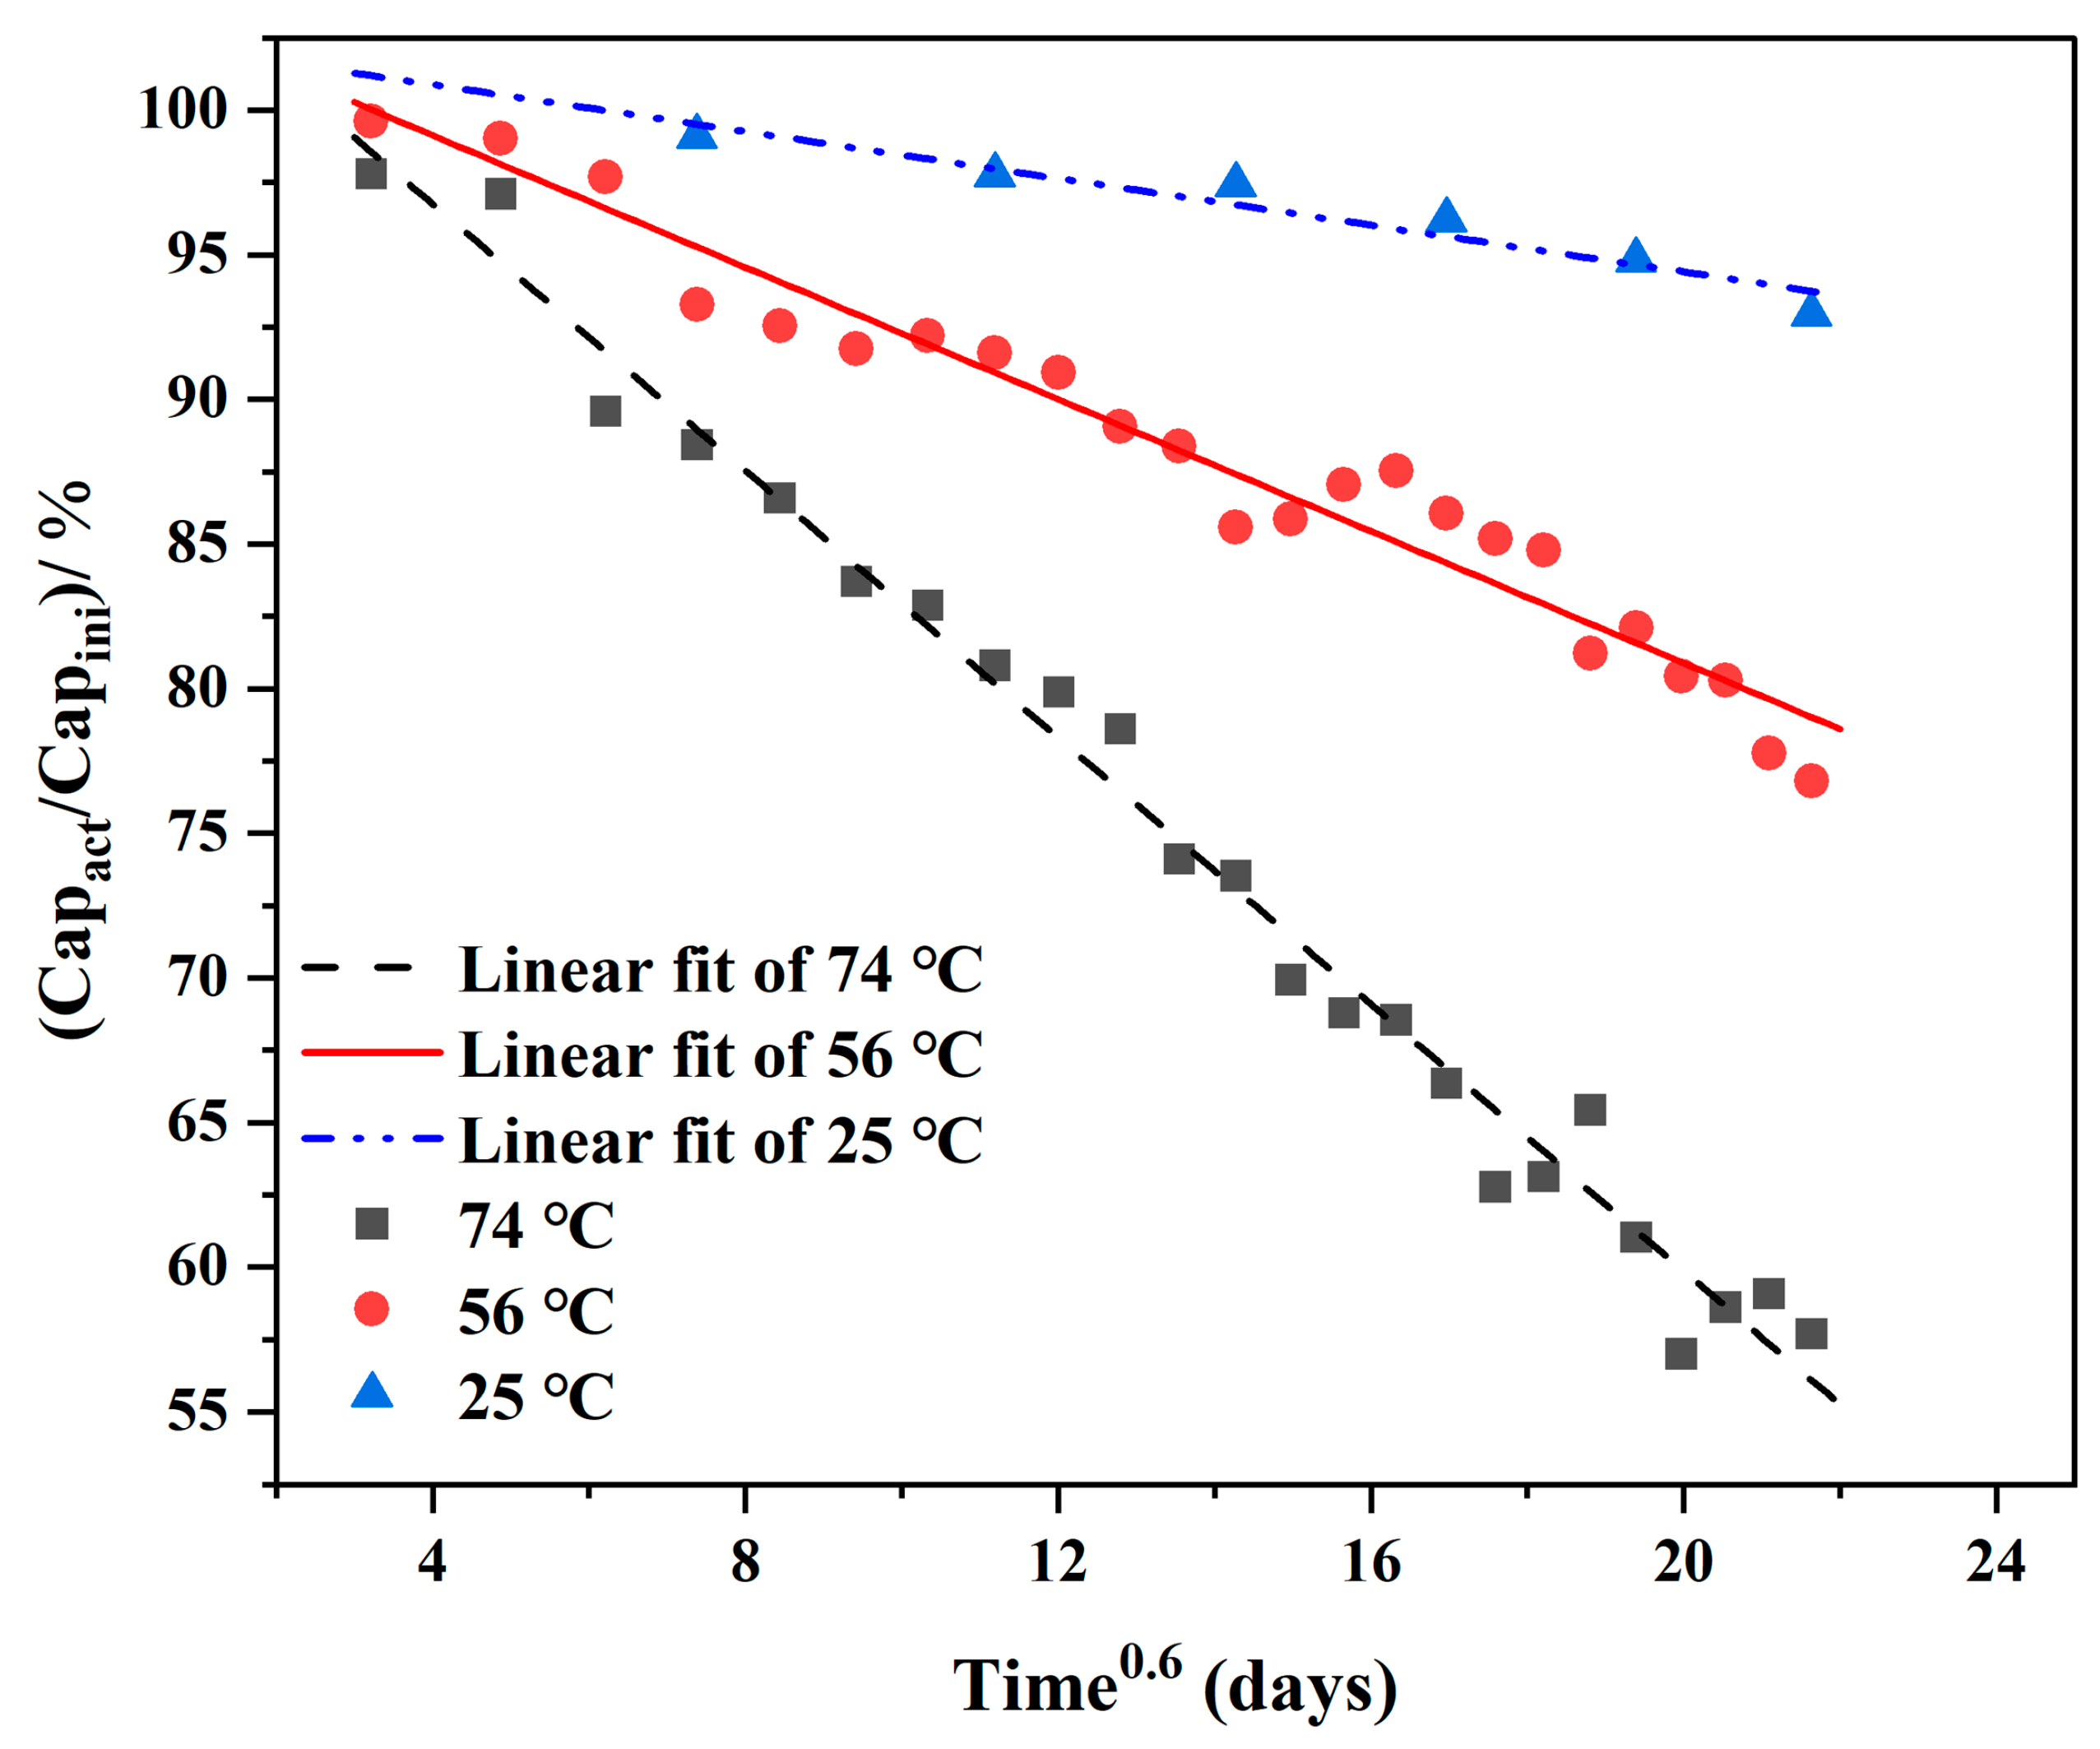
3.4. Inspection in Semi-Empirical Model

The accuracy of the semi-empirical model is tested. Because the data under the temperature stress of 40 °C (313.15 K) is not used in the modeling process, it is compared with the predicted curve. As shown in Figure 9, the prediction curve of the imaginary part of impedance corresponding to the highest point of arc at the high-frequency end of the impedance spectrum can well explain and fit the accelerated life test data under the temperature stress of 40 °C (313.15 K), which shows that the semi-empirical prediction model is not only suitable for the data under the temperature stress condition of participating in modeling but also suitable for the data under the temperature stress condition of not participating in modeling.
In addition, through Equations (9) and (10), it is calculated step by step that it takes 378.8320 days when the capacity of the battery decays to 85% at RT of 25 °C. The experimental results show that the battery-capacity decay is about 85% and the error is about 3.7896% when it is stored at RT for 365 days.

4. Conclusions

In this paper, the performance degradation of a lithium primary battery (taking Li\SOCl2 battery as an example) during storage is studied, and the storage life of a commercial Li\SOCl2 battery at RT of 25 °C is predicted by an accelerated life test. The main conclusions are as follows:
  • By analyzing the accelerated life test data of a 1/2AA carbon-coated ER14250 battery at different temperatures (25 °C, 45 °C, 56 °C, and 74 °C), the aging law was obtained, and the aging model of the battery was established based on data driving. The accuracy of the model has been tested and the maximum deviation is 4.1036%.
  • The accelerated life test results of an AA winding Li-SOCl2 battery at different temperatures were analyzed. Combined with the AC impedance spectrum, aging mechanism, and experimental data, a semi-empirical non-destructive prediction model of storage life was established. Combined with the previous capacity prediction semi-empirical model, a non-destructive prediction model of the remaining capacity of lithium-thionyl chloride battery was established. The prediction results show that it will take 378.83 days for the battery capacity to decay to 85% at room temperature. Compared with the experimental data, the error of 365 days is 3.7896%.
  • The accelerated life test, semi-empirical life prediction model, and impedance spectrum used in this study can predict the capacity-degradation law of a lithium primary battery with very small error from experimental data and can infer the capacity-degradation mechanism of a battery under the same temperature stress through the similar impedance shape in a Nyquist diagram of a battery AC impedance test.

Author Contributions

S.W.: Software, Visualization, Writing—original draft. X.H.: Conceptualization, Resources. Y.W.: Investigation. Y.C.: Formal analysis. D.X.: Data curation. C.L.: Methodology, Project administration, Supervision. Q.H.: Funding acquisition, Validation, Writing—review and editing. All authors have read and agreed to the published version of the manuscript.

Funding

This study has been sponsored by Tianjin Natural Science Foundation Project (22JCYBJC01690), Key Laboratory of Civil Aviation Thermal Hazards Prevention and Emergency Response (RZH2021-KF-04), the Graduate Innovation Project of Shanxi Province (2023SJ225), National Natural Science Foundation of China (12202410 and 51906238), Project funded by China Postdoctoral Science Foundation (2023T160734 and 2023M733935), Natural Science Foundation of Hunan Province (2023JJ40726), Research Project Supported by Shanxi Scholarship Council of China (2022-139), Natural Science Foundation of Shanxi Province (20210302123017 and 2023 recipient Changcheng Liu), Fund Program for the Scientific Activities of Selected Returned Overseas Professionals in Shanxi Province (20220012), Supported by the Opening Foundation of Key Laboratory in North University of China (DXMBJJ2023-03) and Changsha Municipal Natural Science Foundation (kq2208277). Also, the authors thank Wei Yue from Shiyanjia Lab (https://www.shiyanjia.com) for the SEM analysis.

Data Availability Statement

Data will be made available on request.

Conflicts of Interest

The authors declare no conflict of interest.

References

  1. Liu, C.; Xu, D.; Weng, J.; Zhou, S.; Li, W.; Wan, Y.; Jiang, S.; Zhou, D.; Wang, J.; Huang, Q. Phase Change Materials Application in Battery Thermal Management System: A Review. Materials 2020, 13, 4622. [Google Scholar] [CrossRef]
  2. Zabara, M.A.; Göçmez, H.; Karabatak, A.; Ulgut, B. Characterization of Different Electrolyte Composition Lithium Thionyl Chloride Reserve Battery by Electrochemical Impedance Spectroscopy. J. Electrochem. Soc. 2021, 168, 050529. [Google Scholar] [CrossRef]
  3. Ziesche, R.F.; Robinson, J.B.; Markötter, H.; Bradbury, R.; Tengattini, A.; Lenoir, N.; Helfen, L.; Kockelmann, W.; Kardjilov, N.; Manke, I.; et al. Editors’ Choice—4D Neutron and X-ray Tomography Studies of High Energy Density Primary Batteries: Part II. Multi-Modal Microscopy of LiSOCl2 Cells. J. Electrochem. Soc. 2020, 167, 140509. [Google Scholar] [CrossRef]
  4. Takata, K.; Osaka, R.; Matsushita, Y.; Nakanishi, T. In-situ imaging of Li-ion migration at interfaces in an all solid Li-ion battery. Surf. Interface Anal. 2020, 52, 1029–1033. [Google Scholar] [CrossRef]
  5. Xu, D.; Huang, G.; Guo, L.; Chen, Y.; Ding, C.; Liu, C. Enhancement of catalytic combustion and thermolysis for treating polyethylene plastic waste. Adv. Compos. Hybrid Mater. 2022, 5, 113–129. [Google Scholar] [CrossRef]
  6. Wang, D.; Jiang, J.; Pan, Z.; Li, Q.; Zhu, J.; Tian, L.; Shen, P.K. The Effects of Pore Size on Electrical Performance in Lithium-Thionyl Chloride Batteries. Front. Mater. 2019, 6, 245. [Google Scholar] [CrossRef]
  7. Ko, Y.-O.; Lee, C.-T. Effects of the structural characteristics of carbon cathode on the initial voltage delay in Li/SOCl2 battery. J. Ind. Eng. Chem. 2012, 18, 726–730. [Google Scholar] [CrossRef]
  8. Ui, K.; Yamamoto, K.; Ishikawa, K.; Minami, T.; Takeuchi, K.; Itagaki, M.; Watanabe, K.; Koura, N. Development of non-flammable lithium secondary battery with room-temperature ionic liquid electrolyte: Performance of electroplated Al film negative electrode. J. Power Source 2008, 183, 347–350. [Google Scholar] [CrossRef]
  9. Zabara, M.A.; Ulgut, B. Electrochemical Impedance Spectroscopy based voltage modeling of lithium Thionyl Chloride (Li\SOCl2) primary battery at arbitrary discharge. Electrochim. Acta 2019, 334, 135584. [Google Scholar] [CrossRef]
  10. Almessiere, M.; Slimani, Y.; Güngüneş, H.; Korkmaz, A.D.; Trukhanov, S.; Guner, S.; Alahmari, F.; Trukhanov, A.; Baykal, A. Correlation between chemical composition, electrical, magnetic and microwave properties in Dy-substituted Ni-Cu-Zn ferrites. Mater. Sci. Eng. B 2021, 270, 115202. [Google Scholar] [CrossRef]
  11. Zdorovets, M.V.; Kozlovskiy, A.L.; Shlimas, D.I.; Borgekov, D.B. Phase transformations in FeCo–Fe2CoO4/Co3O4-spinel nanostructures as a result of thermal annealing and their practical application. J. Mater. Sci. Mater. Electron. 2021, 32, 16694–16705. [Google Scholar] [CrossRef]
  12. Kozlovskiy, A.; Zdorovets, M. Effect of doping of Ce4+/3+ on optical, strength and shielding properties of (0.5−x)TeO2−0.25MoO-0.25Bi2O3−xCeO2 glasses. Mater. Chem. Phys. 2021, 263, 124444. [Google Scholar] [CrossRef]
  13. Almessiere, M.A.; Slimani, Y.; Algarou, N.A.; Vakhitov, M.G.; Klygach, D.S.; Baykal, A.; Zubar, T.I.; Trukhanov, S.V.; Trukhanov, A.V.; Attia, H.; et al. Tuning the Structure, Magnetic, and High Frequency Properties of Sc-Doped Sr0.5Ba0.5ScxFe12−xO19/NiFe2O4 Hard/Soft Nanocomposites. Adv. Electron. Mater. 2021, 8, 2101124. [Google Scholar] [CrossRef]
  14. Zhang, Y.; Wang, C.-Y. Cycle-Life Characterization of Automotive Lithium-Ion Batteries with LiNiO2 Cathode. J. Electrochem. Soc. 2009, 156, A527–A535. [Google Scholar] [CrossRef]
  15. Abraham, D.; Knuth, J.; Dees, D.; Bloom, I.; Christophersen, J. Performance degradation of high-power lithium-ion cells—Electrochemistry of harvested electrodes. J. Power Source 2007, 170, 465–475. [Google Scholar] [CrossRef]
  16. Kassem, M.; Bernard, J.; Revel, R.; Pélissier, S.; Duclaud, F.; Delacourt, C. Calendar aging of a graphite/LiFePO4 cell. J. Power Source 2012, 208, 296–305. [Google Scholar] [CrossRef]
  17. Choi, H.-S.; Seo, W.-S.; Choi, D.-K. Prediction of reliability on thermoelectric module through accelerated life test and Physics-of-failure. Electron. Mater. Lett. 2011, 7, 271–275. [Google Scholar] [CrossRef]
  18. Liu, C.; Huang, Q.; Zheng, K.; Qin, J.; Zhou, D.; Wang, J. Impact of Lithium Salts on the Combustion Characteristics of Electrolyte under Diverse Pressures. Energies 2020, 13, 5373. [Google Scholar] [CrossRef]
  19. Gu, W.; Sun, Z.; Wei, X.; Dai, H. A new method of accelerated life testing based on the Grey System Theory for a model-based lithium-ion battery life evaluation system. J. Power Source 2014, 267, 366–379. [Google Scholar] [CrossRef]
  20. Diao, W.; Saxena, S.; Pecht, M. Accelerated cycle life testing and capacity degradation modeling of LiCoO2-graphite cells. J. Power Source 2019, 435, 226830. [Google Scholar] [CrossRef]
  21. Barré, A.; Deguilhem, B.; Grolleau, S.; Gérard, M.; Suard, F.; Riu, D. A review on lithium-ion battery ageing mechanisms and estimations for automotive applications. J. Power Source 2013, 241, 680–689. [Google Scholar] [CrossRef]
  22. Omar, N.; Monem, M.A.; Firouz, Y.; Salminen, J.; Smekens, J.; Hegazy, O.; Gaulous, H.; Mulder, G.; Van Den Bossche, P.; Coosemans, T.; et al. Lithium iron phosphate based battery—Assessment of the aging parameters and development of cycle life model. Appl. Energy 2014, 113, 1575–1585. [Google Scholar] [CrossRef]
  23. Chiodo, E.; Lauria, D.; Andrenacci, N.; Pede, G. Accelerated life tests of complete lithium-ion battery systems for battery life statistics assessment. In Proceedings of the 2016 International Symposium on Power Electronics, Electrical Drives, Automation and Motion (SPEEDAM), Capri, Italy, 22–24 June 2016; pp. 1073–1078. [Google Scholar] [CrossRef]
  24. Ecker, M.; Gerschler, J.B.; Vogel, J.; Käbitz, S.; Hust, F.; Dechent, P.; Sauer, D.U. Development of a lifetime prediction model for lithium-ion batteries based on extended accelerated aging test data. J. Power Source 2012, 215, 248–257. [Google Scholar] [CrossRef]
  25. Gao, Y.; Jiang, J.; Zhang, C.; Zhang, W.; Ma, Z.; Jiang, Y. Lithium-ion battery aging mechanisms and life model under different charging stresses. J. Power Source 2017, 356, 103–114. [Google Scholar] [CrossRef]
  26. Ma, J.; Shang, P.; Zou, X.; Ma, N.; Ding, Y.; Sun, J.; Cheng, Y.; Tao, L.; Lu, C.; Su, Y.; et al. A hybrid transfer learning scheme for remaining useful life prediction and cycle life test optimization of different formulation Li-ion power batteries. Appl. Energy 2021, 282, 116167. [Google Scholar] [CrossRef]
  27. Liu, J.; Yue, M.; Wang, S.; Zhao, Y.; Zhang, J. A Review of Performance Attenuation and Mitigation Strategies of Lithium-Ion Batteries. Adv. Funct. Mater. 2022, 32, 2107769. [Google Scholar] [CrossRef]
  28. Dubarry, M.; Truchot, C.; Liaw, B.Y. Synthesize battery degradation modes via a diagnostic and prognostic model. J. Power Source 2012, 219, 204–216. [Google Scholar] [CrossRef]
  29. Li, Y.; Liu, K.; Foley, A.M.; Zülke, A.; Berecibar, M.; Nanini-Maury, E.; Van Mierlo, J.; Hoster, H.E. Data-driven health estimation and lifetime prediction of lithium-ion batteries: A review. Renew. Sustain. Energy Rev. 2019, 113, 109254. [Google Scholar] [CrossRef]
  30. Li, P.; Zhang, Z.; Grosu, R.; Deng, Z.; Hou, J.; Rong, Y.; Wu, R. An end-to-end neural network framework for state-of-health estimation and remaining useful life prediction of electric vehicle lithium batteries. Renew. Sustain. Energy Rev. 2022, 156, 111843. [Google Scholar] [CrossRef]
  31. Ma, G.; Zhang, Y.; Cheng, C.; Zhou, B.; Hu, P.; Yuan, Y. Remaining useful life prediction of lithium-ion batteries based on false nearest neighbors and a hybrid neural network. Appl. Energy 2019, 253, 113626. [Google Scholar] [CrossRef]
  32. Gao, N.; Abboud, A.W.; Mattei, G.S.; Li, Z.; Corrao, A.A.; Fang, C.; Liaw, B.; Meng, Y.S.; Khalifah, P.G.; Dufek, E.J.; et al. Fast Diagnosis of Failure Mechanisms and Lifetime Prediction of Li Metal Batteries. Small Methods 2020, 5, e2000807. [Google Scholar] [CrossRef] [PubMed]
  33. Cheng, S.; Li, B.; Yuan, Z.; Zhang, F.; Liu, J. Development of a lifetime prediction model for lithium thionyl chloride batteries based on an accelerated degradation test. Microelectron. Reliab. 2016, 65, 274–279. [Google Scholar] [CrossRef]
  34. Sun, T.; Xu, B.; Cui, Y.; Feng, X.; Han, X.; Zheng, Y. A sequential capacity estimation for the lithium-ion batteries combining incremental capacity curve and discrete Arrhenius fading model. J. Power Source 2020, 484, 229248. [Google Scholar] [CrossRef]
  35. Sun, T.; Wu, R.; Cui, Y.; Zheng, Y. Sequent extended Kalman filter capacity estimation method for lithium-ion batteries based on discrete battery aging model and support vector machine. J. Energy Storage 2021, 39, 102594. [Google Scholar] [CrossRef]
  36. Yang, N.; Fu, Y.; Yue, H.; Zheng, J.; Zhang, X.; Yang, C.; Wang, J. An improved semi-empirical model for thermal analysis of lithium-ion batteries. Electrochim. Acta 2019, 311, 8–20. [Google Scholar] [CrossRef]
  37. Bohlen, O.; Kowal, J.; Sauer, D.U. Ageing behaviour of electrochemical double layer capacitors: Part I. Experimental study and ageing model. J. Power Source 2007, 172, 468–475. [Google Scholar] [CrossRef]
  38. Qin, J.; Liu, C.; Huang, Q. Simulation on fire emergency evacuation in special subway station based on Pathfinder. Case Stud. Therm. Eng. 2020, 21, 100677. [Google Scholar] [CrossRef]
  39. Cheng, S.; Yuan, Z.; Ye, X.; Zhang, F.; Liu, J. Empirical prediction model for Li/SOCl2 cells based on the accelerated degradation test. Microelectron. Reliab. 2015, 55, 101–106. [Google Scholar] [CrossRef]
  40. Kozlovskiy, A.L.; Zdorovets, M.V. Synthesis, structural, strength and corrosion properties of thin films of the type CuX (X = Bi, Mg, Ni). J. Mater. Sci. Mater. Electron. 2019, 30, 11819–11832. [Google Scholar] [CrossRef]
  41. Zubar, T.I.; Usovich, T.I.; Tishkevich, D.I.; Kanafyev, O.D.; Fedkin, V.A.; Kotelnikova, A.N.; Panasyuk, M.I.; Kurochka, A.S.; Nuriev, A.V.; Idris, A.M.; et al. Features of Galvanostatic Electrodeposition of NiFe Films with Composition Gradient: Influence of Substrate Characteristics. Nanomaterials 2022, 12, 2926. [Google Scholar] [CrossRef]
  42. Adams, B.D.; Black, R.; Radtke, C.; Williams, Z.; Mehdi, B.L.; Browning, N.D.; Nazar, L.F. The Importance of Nanometric Passivating Films on Cathodes for Li–Air Batteries. ACS Nano 2014, 8, 12483–12493. [Google Scholar] [CrossRef]
  43. Mingant, R.; Bernard, J.; Moynot, V.S.; Delaille, A.; Mailley, S.; Hognon, J.-L.; Huet, F. EIS Measurements for Determining the SoC and SoH of Li-Ion Batteries. ECS Trans. 2011, 33, 41–53. [Google Scholar] [CrossRef]
  44. Zou, L.; He, Y.; Liu, Z.; Jia, H.; Zhu, J.; Zheng, J.; Wang, G.; Li, X.; Xiao, J.; Liu, J.; et al. Unlocking the passivation nature of the cathode–air interfacial reactions in lithium ion batteries. Nat. Commun. 2020, 11, 3204. [Google Scholar] [CrossRef] [PubMed]
  45. Ahad, S.A.; Bhattacharya, S.; Kilian, S.; Ottaviani, M.; Ryan, K.M.; Kennedy, T.; Thompson, D.; Geaney, H. Lithiophilic Nanowire Guided Li Deposition in Li Metal Batteries. Small 2022, 19, e2205142. [Google Scholar] [CrossRef] [PubMed]
  46. Li, N.-W.; Yin, Y.-X.; Li, J.-Y.; Zhang, C.-H.; Guo, Y.-G. Passivation of Lithium Metal Anode via Hybrid Ionic Liquid Electrolyte toward Stable Li Plating/Stripping. Adv. Sci. 2016, 4, 1600400. [Google Scholar] [CrossRef]
  47. Choi, S.; Jung, G.; Kim, J.E.; Kim, T.; Suh, K.S. Lithium Intercalated Graphite with Preformed Passivation Layer as Superior Anode for Lithium-Ion Batteries. Appl. Surf. Sci. 2018, 455, 367–372. [Google Scholar] [CrossRef]
Figure 1. Electrochemical impedance spectrum of Li\SOCl2 battery (a) Electrochemical impedance spectrum of a Li\SOCl2 battery stored at 50 °C for different times (b) Electrochemical impedance spectrum of a Li\SOCl2 battery stored at 70 °C for different times.
Metals 13 01579 g001
Figure 2. Scatter diagram of the residual capacity of batteries undergoing accelerated life test under different temperature stresses.
Metals 13 01579 g002
Figure 3. Data processing of accelerated life test (a) Scatter plot of the percentage of battery-remaining capacity. (b) The percentage of battery-remaining capacity decreases exponentially with the change of accelerated life test time t.
Metals 13 01579 g003
Figure 4. Linear fitting diagram of battery-remaining capacity percentage and t0.6.
Metals 13 01579 g004
Figure 5. Linear fitting result diagram (a) Linear relationship between parameter A and 1/T (b) Linear relationship between parameter B and 1/T.
Metals 13 01579 g005
Figure 6. Passivation film on the surface of metal lithium electrode.
Metals 13 01579 g006
Figure 7. Scatter diagram of different temperature stress conditions (ImZact/ImZini) with storage time t.
Metals 13 01579 g007
Figure 8. Fitting diagram of the linear relationship between ln I m Z a c t / I m Z i n i × 100 and 1/T.
Metals 13 01579 g008
Figure 9. Comparison between the predicted curve of I m Z a c t / I m Z i n i × 100 and the actual test value at 40 °C.
Metals 13 01579 g009
Table 1. Comparison of results from the published literature and this work.
Battery CategoryAnalytical Test MethodMathematical ModelCalculation and Experimental ErrorRef.
Li/SOCl2 and Li/MnO2Electrochemical impedance spectroscopyZero-free parameter method3%[9]
Li/CoO2Accelerated cycle life testCapacity-degradation model based on cycle number and environmental temperature stress factor2.6%[20]
Li/SOCl2Accelerated cycle life testSemi-empirical prediction model of residual capacity based on cycle number and environmental temperature stress factor5%[40]
LiFePO4Non-destructive electrochemical test and electrochemical impedance spectroscopy//[19]
Li/SOCl2Accelerated cycle life test and electrochemical impedance spectroscopySemi-empirical prediction model of residual capacity based on cycle number and environmental temperature stress factor3.7896%This work
Table 2. ER14250 thermal grade of battery materials.
Material.Melting PointBoiling Point
SOCl2−104.5 °C78.8 °C
Li180 °C1340 °C
LiAlCl4143 °C/
Acetylene black3550 °C/
Polytetrafluoroethylene327 °C400 °C
Ethanol−114°78 °C
Table 3. Battery test interval under different temperature stresses.
Temperature/°CTest Interval/Week
254
452
561
741
Table 4. Battery quantity distribution and performance test interval under different temperature stresses.
Temperature Stress/°CTest Interval/Week
25 (RT)6
404
50
60
2
1
701
Table 5. Semi-empirical model fitting results using Equation (7).
ParameterR2ParameterFitted Value
ImZ0.9650CT1.27665
Ca0.24885
b0.73976
Table 6. Results of percentage linear fitting of battery-remaining capacity.
Temperature Stress/°CABC
74 °C−2.30557105.977610.6
56 °C−1.14048103.693690.6
25 °C−0.40468102.503120.6
Table 7. Linear fitting results of parameters A and B.
ParameterIntercept bSlope a
A(T) 125.15992−6.82703
B(T) −12.946863.77341
Table 8. Comparative value of predicted values and test data under temperature stress of 45 °C (318.15 K).
Accelerated Life Test Time/WeekTest Residual Capacity PercentagePredicting Remaining Capacity PercentageDeviation
297.6599%98.8297%1.1979%
496.9865%96.3173%0.6899%
694.9131%94.9131%0.6632%
894.3730%92.5093%1.9749%
1092.4995%90.9059%1.7229%
1290.8262%89.4267%1.5409%
1489.0860%88.0434%1.1703%
1689.0793%86.7373%2.6291%
1888.2059%85.4951%3.0733%
2086.7992%84.3070%2.8712%
2286.7244%83.1656%4.1036%
2485.3857%82.0650%3.8891%
Disclaimer/Publisher’s Note: The statements, opinions and data contained in all publications are solely those of the individual author(s) and contributor(s) and not of MDPI and/or the editor(s). MDPI and/or the editor(s) disclaim responsibility for any injury to people or property resulting from any ideas, methods, instructions or products referred to in the content.

