Article

Numerical Simulation of Thermal Field and Performance Study on H13 Die Steel-Based Wire Arc Additive Manufacturing

1
School of Mechanical Engineering, Jiangsu University of Technology, Changzhou 213001, China
2
Key Laboratory of Advanced Materials Design and Additive Manufacturing of Jiangsu Province, Jiangsu University of Technology, Changzhou 213001, China
*
Author to whom correspondence should be addressed.
Metals 2023, 13(8), 1484; https://doi.org/10.3390/met13081484
Submission received: 6 July 2023 / Revised: 15 August 2023 / Accepted: 17 August 2023 / Published: 18 August 2023

Abstract

:
In order to explore the relationship between welding thermal cycles and the thermal field during the repair process of dies, a numerical simulation software (SYSWELD) was employed to construct a thermo-mechanical coupled model. The influence of various inter-layer cooling times was investigated on heat accumulation, residual stress, and deformation of the repaired component. The results showed that the numerical simulation results agreed well with experimental data. The temperature within the cladding layer gradually rose as the number of weld beads increased, leading to a more pronounced accumulation of heat. The residual stress exhibited a double-peak profile, where the deformation of the repaired component was large at both ends but small in the middle. The less heat was accumulated in the cladding layer with a prolonged cooling time. Meanwhile, the residual stress and deformation in the repaired component experienced a gradual decrease in magnitude. The numerical simulation results demonstrated that the microstructure of the repaired component predominantly consisted of martensite and residual austenite at the optimal cooling time (300 s). Furthermore, the microhardness and wear resistance of the cladding zone significantly surpassed those of the substrate. In conclusion, this study suggested the prolonged cooling time mitigated heat accumulation, residual stress, and deformation in repaired components, which provided a new direction for future research on the die steel repairments.

1. Introduction

H13 (4Cr5MoSiV1) steel is a common hot-working die steel with superior performance of red hardness, hardenability, and impact toughness [1,2]. It has been widely used in the production of hot extrusion dies, hot forging dies, and die casting dies [3,4]. However, the dies are vulnerable to the impulsive load and frictional wear, leading to surface failures such as thermal wear, thermal fatigue, and thermal cracking during operation. Consequently, the lifespan of the dies is reduced, resulting in immense resource wastage and economic losses [5,6]. A wire arc additive manufacturing (WAAM) technique can be employed to restore malfunctioning die surfaces, thereby extending the operational lifespan of dies and yielding cost savings. WAAM describes a manufacturing technology that can be used to build three-dimensional (3D) parts in a layer-by-layer stacking manner by utilizing a welding arc as a heat source [7]. WAAM technology possesses a variety of advantages (i.e., high forming efficiency, high wire utilization, short manufacturing cycle time, and low cost) compared to the alternative additive manufacturing technologies such as laser, electron beam, EDM, and thermal spray. It is extensively suitable for the forming of complex components, as well as the remanufacturing of damaged metal parts [8]. Almangour et al. [1,9] observed the utilization of WAAM technology contributed to a higher hardness, lower friction coefficient, and elastic modulus of H13 steel components compared to the substrate. These improvements might be primarily attributed to the influence of a fine-grained microstructure and grain boundary strengthening.
In the WAAM process, the accumulation of heat due to rapid heating and cooling cycles resulted in significant residual stress within the cladding layer and neighboring regions, thereby affecting the performance of the formed components [10]. Residual stress was a pivotal factor influencing the mechanical properties, structural dimensions, and processing precision of the formed components [11]. Consequently, the adoption of methods such as prolonging inter-layer cooling periods held paramount significance in controlling residual stress. The heat within the cladding zone was uniformly distributed between the substrate and surrounding air as the cooling time increases [12]. This could promote the release of the thermal stress in the additive formed components, thus obtaining a well-formed component with improved appearance and quality [13]. The utilization of X-ray type stress analyzer and deep hole contour (DHC) could avoid the damage on components [14,15]. Xiong et al. [16] reported that the heat accumulation could cause irregularities in the cladding layer with geometric deviations and larger grain sizes. To reduce the side effect induced by heat accumulation, relieving the residual stress was required by extending the cooling time during the WAAM process [17]. Additionally, thermoelectric cooling technology could be applied to reduce the heat accumulation, where the grain size was refined by 25%, and the bead width error was reduced by 56.8% [18]. Notably, the mechanical properties of components could be influenced by the inter-layer temperature as well. Wu et al. [19] investigated that the component had a better surface finish and increased tensile strength when the inter-layer temperature was under 100 °C.
Now that the computer simulation technology develops quickly, and numerical simulation technology can effectively predict the thermal behavior, transient stress during the welding process, and the residual stress and deformation afterwards [11]. Combined with the experiments, numerical simulation technology could improve manufacturing efficiency and save cost. In order to investigate the effect of cooling time on thermal accumulation, Lei et al. [20] used numerical simulation techniques and found that increasing the cooling time improved the heat dissipation conditions and reduced heat accumulation in cladding zone. Feng et al. [21] studied the influence of substrate thickness and inter-layer temperature on residual stress and deformation in multi-layer, multi-pass WAAM processes. They found that lower inter-layer temperatures and the thinner substrate significantly reduced residual stress within the formed components, while the thicker ones effectively minimized angular distortion. Additionally, in Turgut’s simulation study [22], decreasing the inter-layer temperature could induce microstructure refinement of components, along with an increase in microhardness and yield strength. The utilization of numerical simulation techniques enabled a comprehensive investigation into the evolving relationship between multi-layer cooling time and residual stress variations. Moreover, in the process of general WAAM (single-pass, oscillation-pass, parallel-pass, etc.), numerical simulation techniques were usually applied to investigate the impact of process optimization (aging heat treatment, limiting heat input to the heat input, controlling process parameters, etc.) on residual stress.
The innovative application of numerical simulation techniques allowed for the emulation of heat conduction and stress variation phenomena in WAAM process. This contributed to reducing the deformations and concentration of stresses during the manufacturing process, thereby enhancing component quality and precision. Furthermore, numerical simulation technology could curtail trial-and-error iterations, minimize waste generation, and elevate production efficiency. The novelties of this study were as follows: (1) The utilization of an X-ray type stress analyzer to measure residual stress at multiple points along both transverse and longitudinal axes, thus verifying model feasibility by comparison. (2) The integration of martensite content and microstructure to analyze microhardness along both horizontal and vertical directions within repaired components. The combination of numerical simulation and WAAM techniques held vast potential for applications spanning component restoration, intricate component manufacturing, and novel material development.
In this study, a finite element model of a 10 mm deep H13 steel trapezoidal groove weld was established using SYSWELD numerical simulation software. The reliability of the finite element model was further validated by the experimental data. The trapezoidal groove in the substrate was repaired through additive remanufacturing in different inter-layer cooling time. The thermal field and deformation of the repaired components were investigated and the optimal cooling time was obtained. Finally, the microstructure of the repaired components was analyzed, and the microhardness and wear resistance of the repaired components were measured.

2. Experiments and Methods

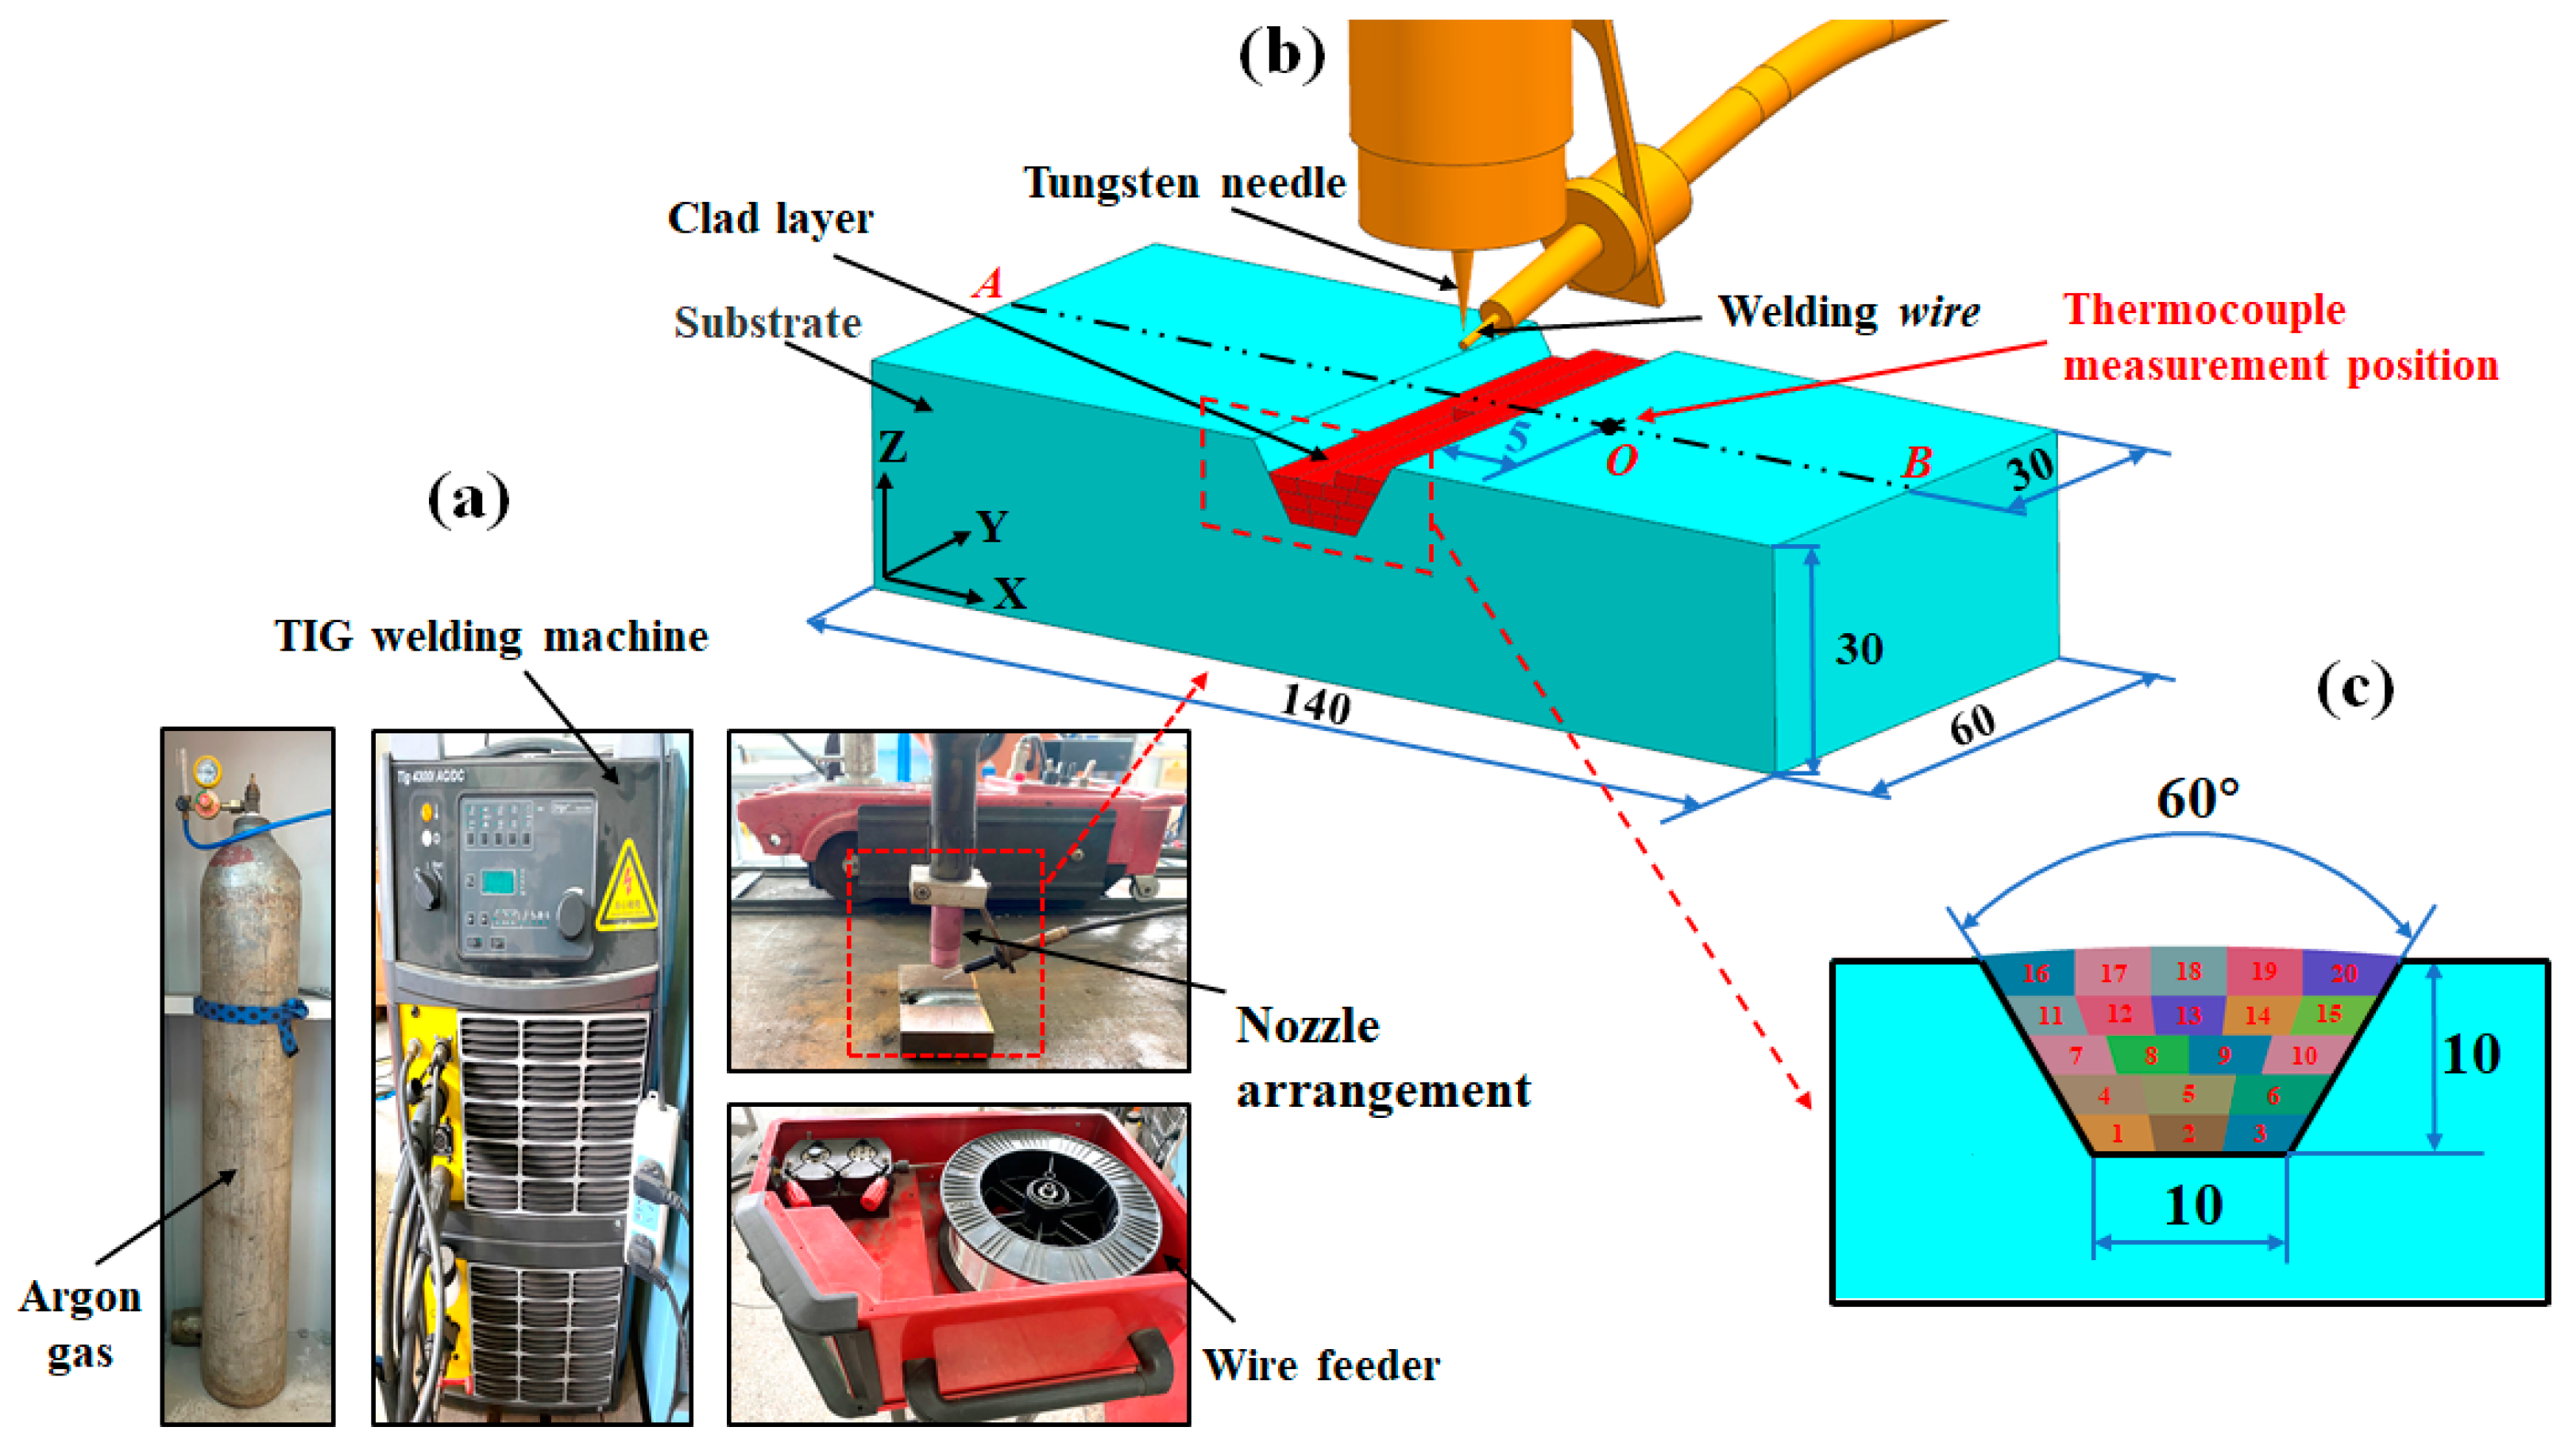
2.1. Materials and Procedures

The experimental materials in this study were a solid-core H13 steel welding wire with a diameter of 1.2 mm (Jiesheng Welding Materials Co., Ltd., Yichang, China) and H13 steel trapezoidal groove substrate with a 60° bevel angle (Longpu Metal Materials Co., Ltd., Changzhou, China), as shown in Figure 1b,c. The chemical composition of these materials is presented in Table 1. To prevent the influence of impurities (i.e., rust and oil contamination) on the forming quality, the surface of substrate to be soldered was polished with sandpaper, cleaned with acetone and alcohol, and dried before the welding experiments. As shown in Figure 1a, the experimental setup mainly consisted of an AC and DC TIG welding machine (Songzhi Machinery Co., Ltd., Shanghai, China), a WF-007A multifunctional automatic wire feeder (Shafu Environmental Protection Technology Co., Ltd., Suzhou, China), Nozzle arrangement (Sengyao Electronic Technology Co., Ltd., Jinan, China), and Argon gas. The setup was employed to perform multi-layer and multi-pass deposition welding in a reciprocating path. Rational selection of parameters such as thermal input and shielding gas flow rate was beneficial to obtain a high-quality deposition layer with fewer internal defects. The optimal welding parameters were selected based on our preliminary experiments, as shown in Table 2.

2.2. Measurement of Thermal History, Residual Stress, Microstructure, and Mechanical Performance

To obtain the temperature distribution near the cladding layer during the welding process, a K-type thermocouple was used to measure the temperature variation at point O, which was located 5 mm away from the cladding layer, as shown in Figure 1b. As previously described [23], after the welding experiment, a 350-A X-ray type stress analyzer was employed to measure the residual stresses along the AB line on the surface of repaired component. The starting point of measurement was 20 mm away from point A, and a total of 11 points were measured with 10 mm interval. Each point was measured once in the transverse and longitudinal directions, respectively, as shown in Figure 1b and Figure 2.
Three specimens with dimensions of 25 mm × 20 mm (specimen 1), 20 mm × 20 mm (specimen 2), and 15 mm × 15 mm (specimen 3) were cut from the repaired component using an SG3000 EDM machine, and their microstructure and mechanical performance were then characterized and tested, as illustrated in Figure 3. The cut specimens were subsequently ground, polished, cleaned, and dried. Specimen 1 was subjected to corrosion with corrosive acid (HNO3: C2H5OH = 1:24; v/v) for 10 s. The microstructural characterization of the specimens 1 was performed using a Nikon-MR5000 metallurgical microscope (Qingdao Jinnuo Machinery Co., Ltd., Qingdao, China). Martensite content in the specimens 1 was detected using an X-ray stress analyzer and phase analysis of the specimens 3 was conducted using an HD-Xpret type PRO X-ray diffractometer, with Cu (Kα) as the target material and a scanning rate of 5°/min. Microhardness of the specimens 1 was measured using an HVS-1000B digital microhardness tester (Dongguan Guangxin Electronic Technology Co., Ltd., Dongguan, China) with a load of 200 gf and a dwell time of 20 s. The indents were made at regular spacing of 0.5 mm and tested three times to minimize measurement errors. The wear resistance performance of the specimens 2 was evaluated using an MDW-02 type high-speed reciprocating wear tester (Jinan Yihua Tribology Testing Technology Co., Ltd., Jinan, China) at room temperature. The friction pair was a 6 mm diameter silicon nitride ceramic ball with a load of 50 N, a reciprocating stroke of 5 mm, a reciprocating frequency of 5 Hz, and a wear time of 30 min. The depth and width of wear track profile were scanned and measured using an Naonvea PS50 type 3D profiler. The test conditions were set as follows: the scanning range was 2 mm × 2 mm, the step size was 10 μm, and the scanning speed was 3.33 mm/s. The morphology of the wear tracks was observed and analyzed using a SIGMA500 type field-emission scanning electron microscope.

3. Numerical Simulation

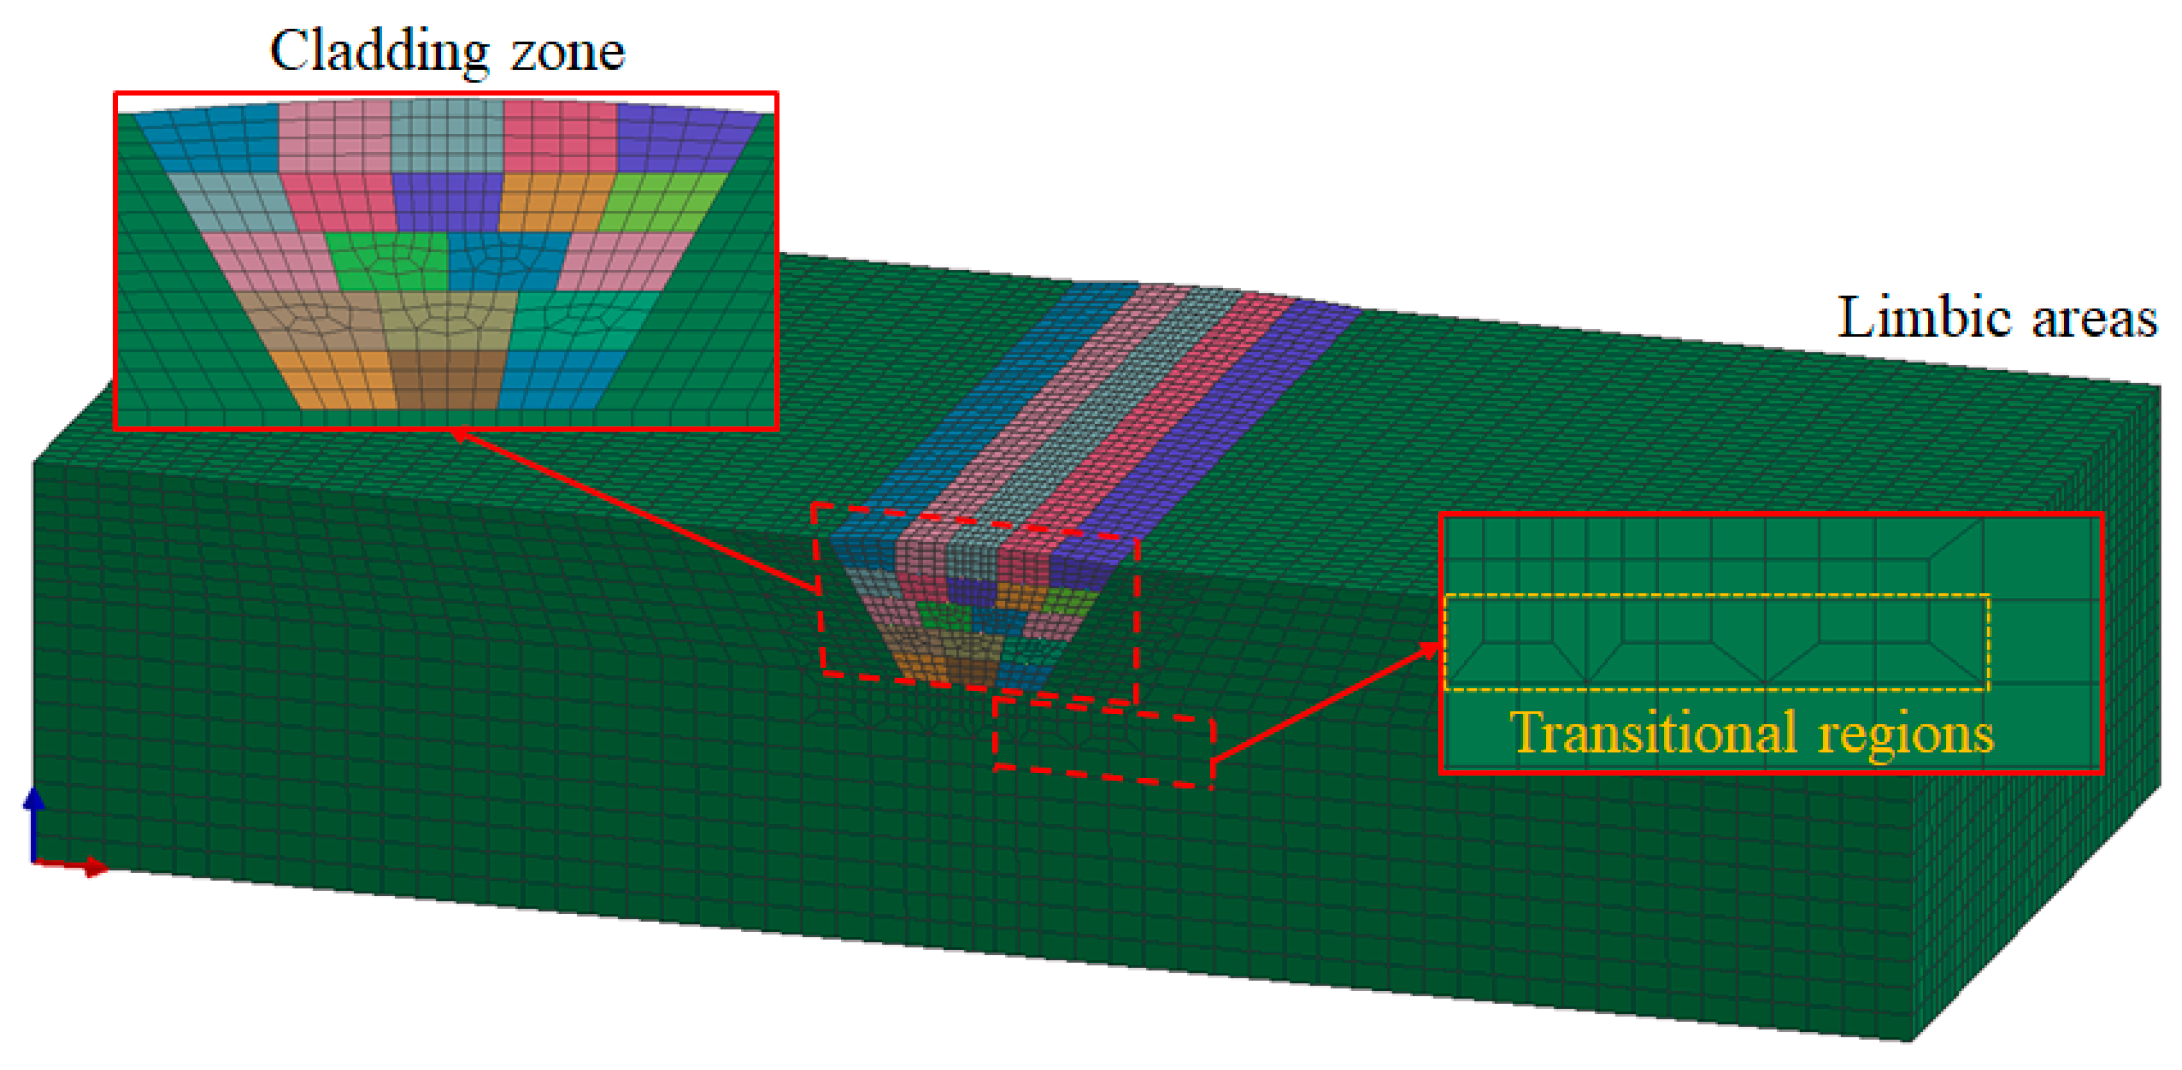
3.1. Finite Element Mode

In this study, the SYSWELD welding simulation software was used to investigate the thermal field in the WAAM process. The selected process parameters, geometric models of the substrate, and cladding layer used in the numerical simulation were consistent with the experimental results. The meshing of the models was carried out using the Visual-Mesh module in the pre-processing environment. Both the substrate and cladding layer were meshed using a hexahedral eight-node elements to improve the computational accuracy and efficiency of the numerical simulation. Due to the concentrated and transient nature of the heat source in the WAAM process, consequently, high temperature gradients, and stress existed in the cladding layer and the heat-affected zone. Thus, the mesh density in the cladding zone should be increased, and the minimum grid size was set to 0.83 mm × 0.75 mm × 1.00 mm. On the other hand, the mesh density should be decreased in the areas away from the cladding zone (limbic areas), and the maximum grid size at the edge of the substrate was set to 1.75 mm × 2.00 mm × 1.00 mm. Additionally, the transitional regions with a transition ratio of 1:2 was introduced surrounding the cladding zone to separate the limbic areas. In total, the number of elements was 73,680, and that of nodes was 92,979, which were illustrated in Figure 4.

3.2. Thermal Physical Performance Parameters of the Material

The thermal physical performance of metal material could change with the change in temperature, such as density, thermal conductivity, specific heat, and Young’s modulus. It was critical to select reasonable parameters for the accuracy of numerical simulation results [24]. However, it was hard to measure thermal physical performance parameters of metals at a high temperature, especially at the solid–liquid interface temperature. Thus, in the present study, the thermal physical performance parameters of H13 steel at different temperatures were calculated using Jmatpro simulation software [25,26]. Furthermore, the accuracy of the simulation was verified and the parameters were corrected according to the previous study [27]. The corrected thermal physical performance parameters of H13 die steel are shown in Table 3.

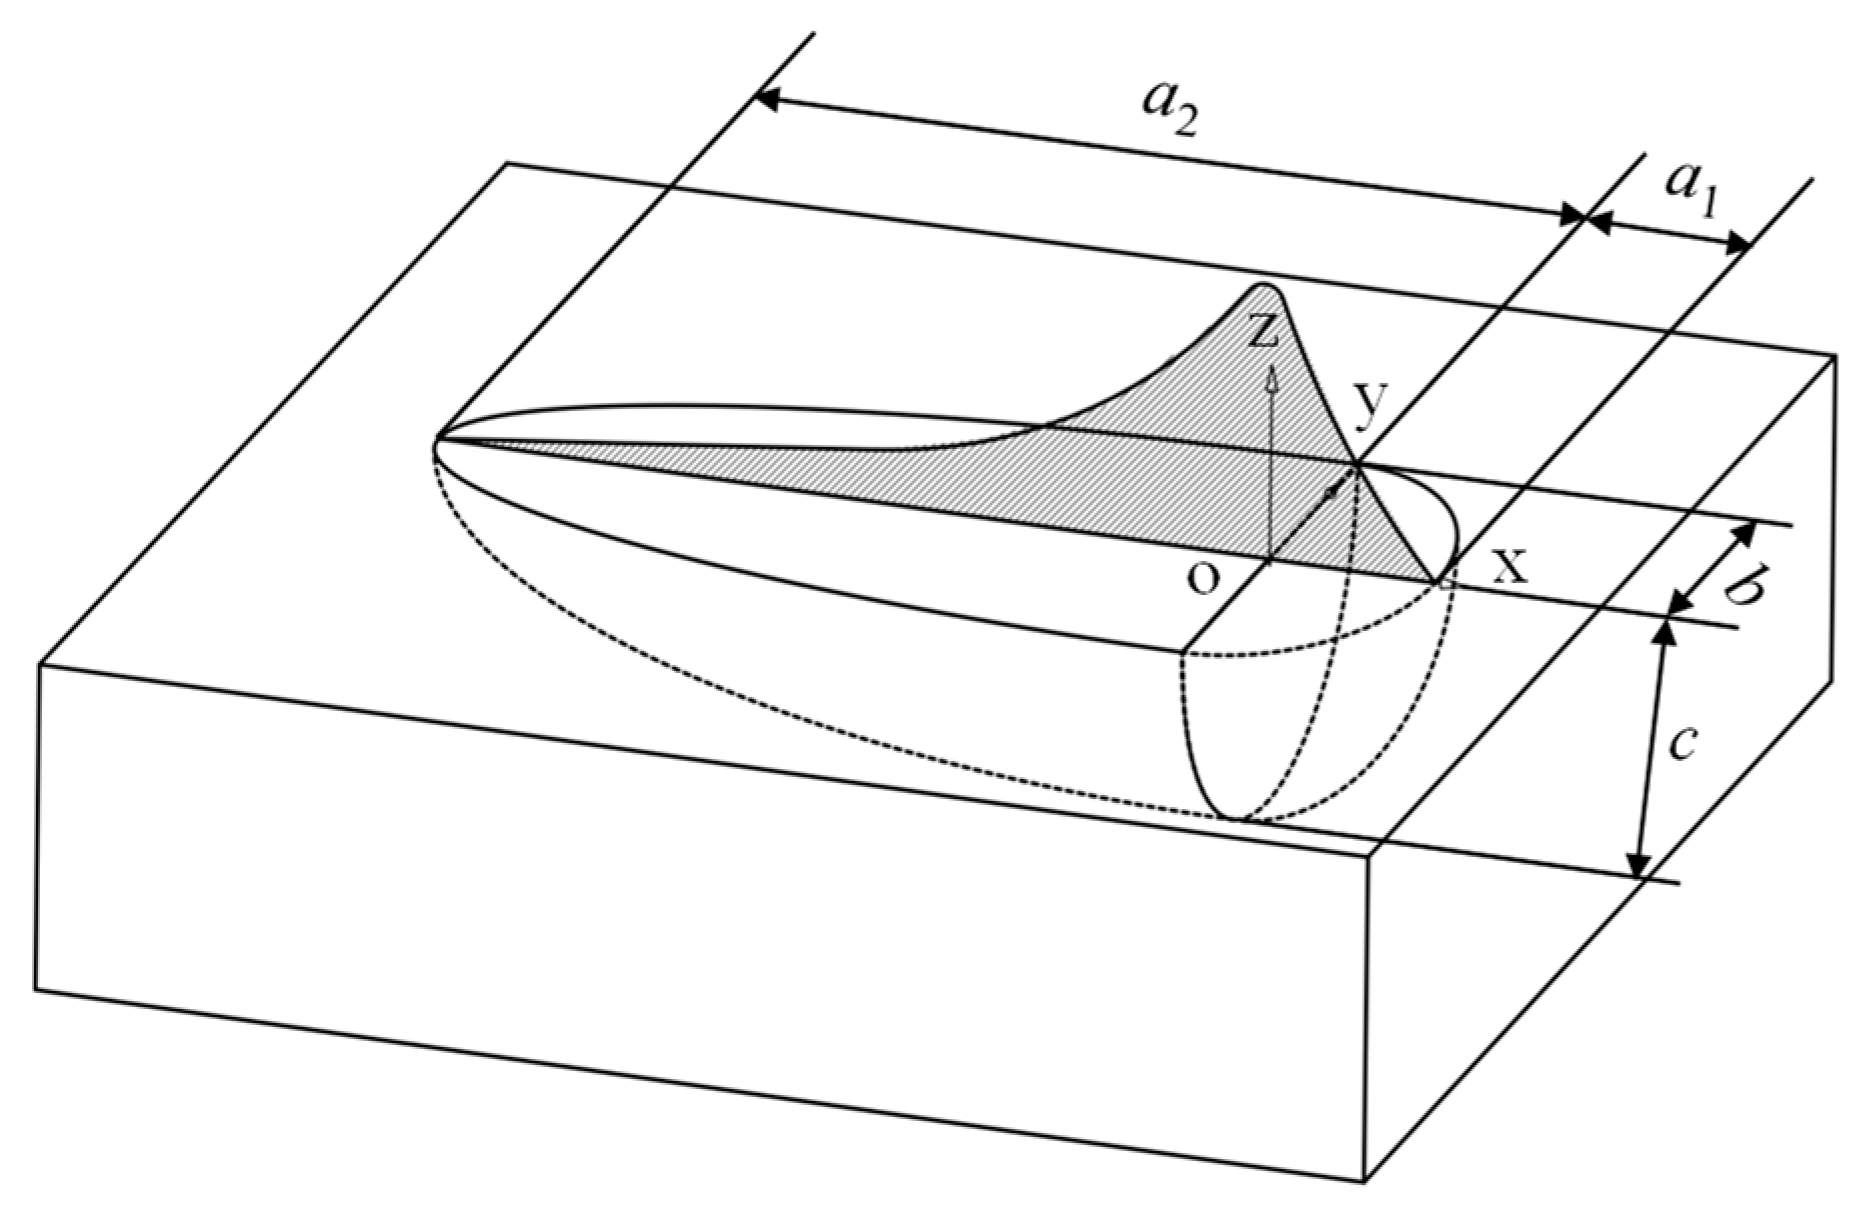
3.3. Thermal Source Model and Boundary Conditions

The selection of a reliable thermal source model was crucial for the accuracy of numerical simulation results, reflecting the corresponding physical mechanisms of temperature field, stress field, and deformation in the WAAM process. Currently, the double ellipsoid heat source model was widely used in the field of WAAM. This model was proposed by Goladk [28] for simulating the thermal input in the welding process. Given the influence of heat source movement on the heat flow distribution, the double ellipsoid heat source exhibited strong penetration ability and high flexibility compared to the other heat source models. The uneven energy distribution of the heat source was largely influenced by welding speed, for the reason that the temperature of ahead of the arc was relatively lower than that of the behind among the whole heated region. Therefore, the double ellipsoid heat source was selected to better represent and characterize the heat source distribution. The heat flux density distribution of heat source was respectively expressed by functions in two parts, the front (Q1) and the rear half ellipsoid (Q2) [28].
Heat   flux   in   the   front   half   ellipsoid :   Q 1 = 12 3 f 1 Q π 3 / 2 a 1 b c e x p 3 x 2 a 1 2 + y 2 b 2 + z 2 c 2 ,   x 0
Heat   flux   in   the   rear   half   ellipsoid :   Q 2 = 12 3 f 2 Q π 3 / 2 a 2 b c e x p 3 x 2 a 2 2 + y 2 b 2 + z 2 c 2 ,   x < 0
where, a1, a2, b, and c denote the double ellipsoid heat source, as shown in Figure 5. a1 represents the length of the front semi-axis, a2 represents the length of the rear semi-axis, and b and c represent the half-width and depth of the molten pool, respectively. f1 and f2 denote the distribution coefficients of the total heat source energy in the front and rear half ellipsoids, respectively, which satisfy the condition of f1 + f2 = 2. The effective energy input (Q) was calculated by Q = η × U × I, where η is the efficiency, U is the welding voltage, and I is the welding current. Then, the numerical simulation parameters for the double ellipsoid heat source are presented in Table 4.
The heat was transferred into the molten pool by melted welding wire, where the heat exchange was dominated by radiative cooling and convective heat transfer during the deposition process. A three-point constraint method was employed to constrain the substrate in the simulation, and the initial temperature of the substrate was set to the ambient temperature of 20 °C.

4. Results and Discussion

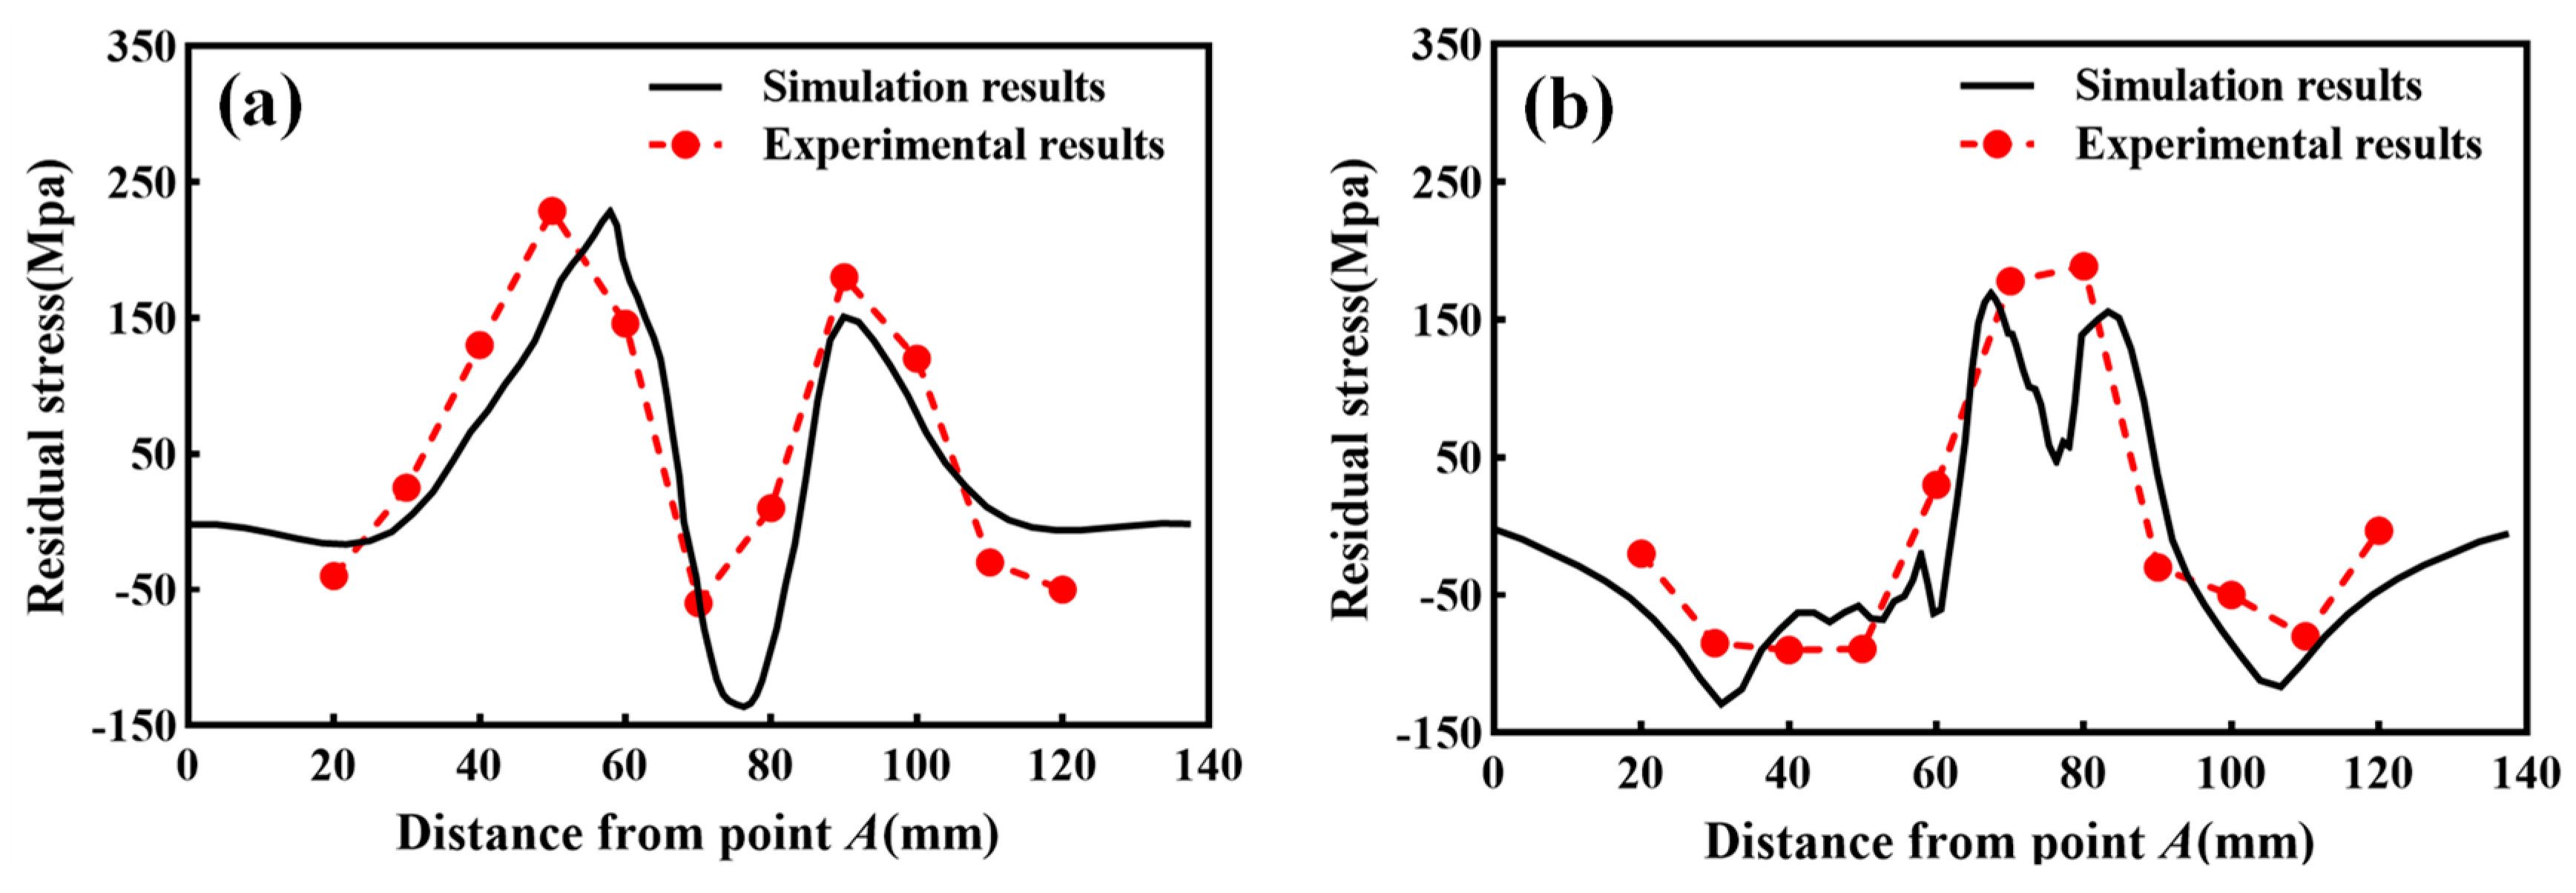
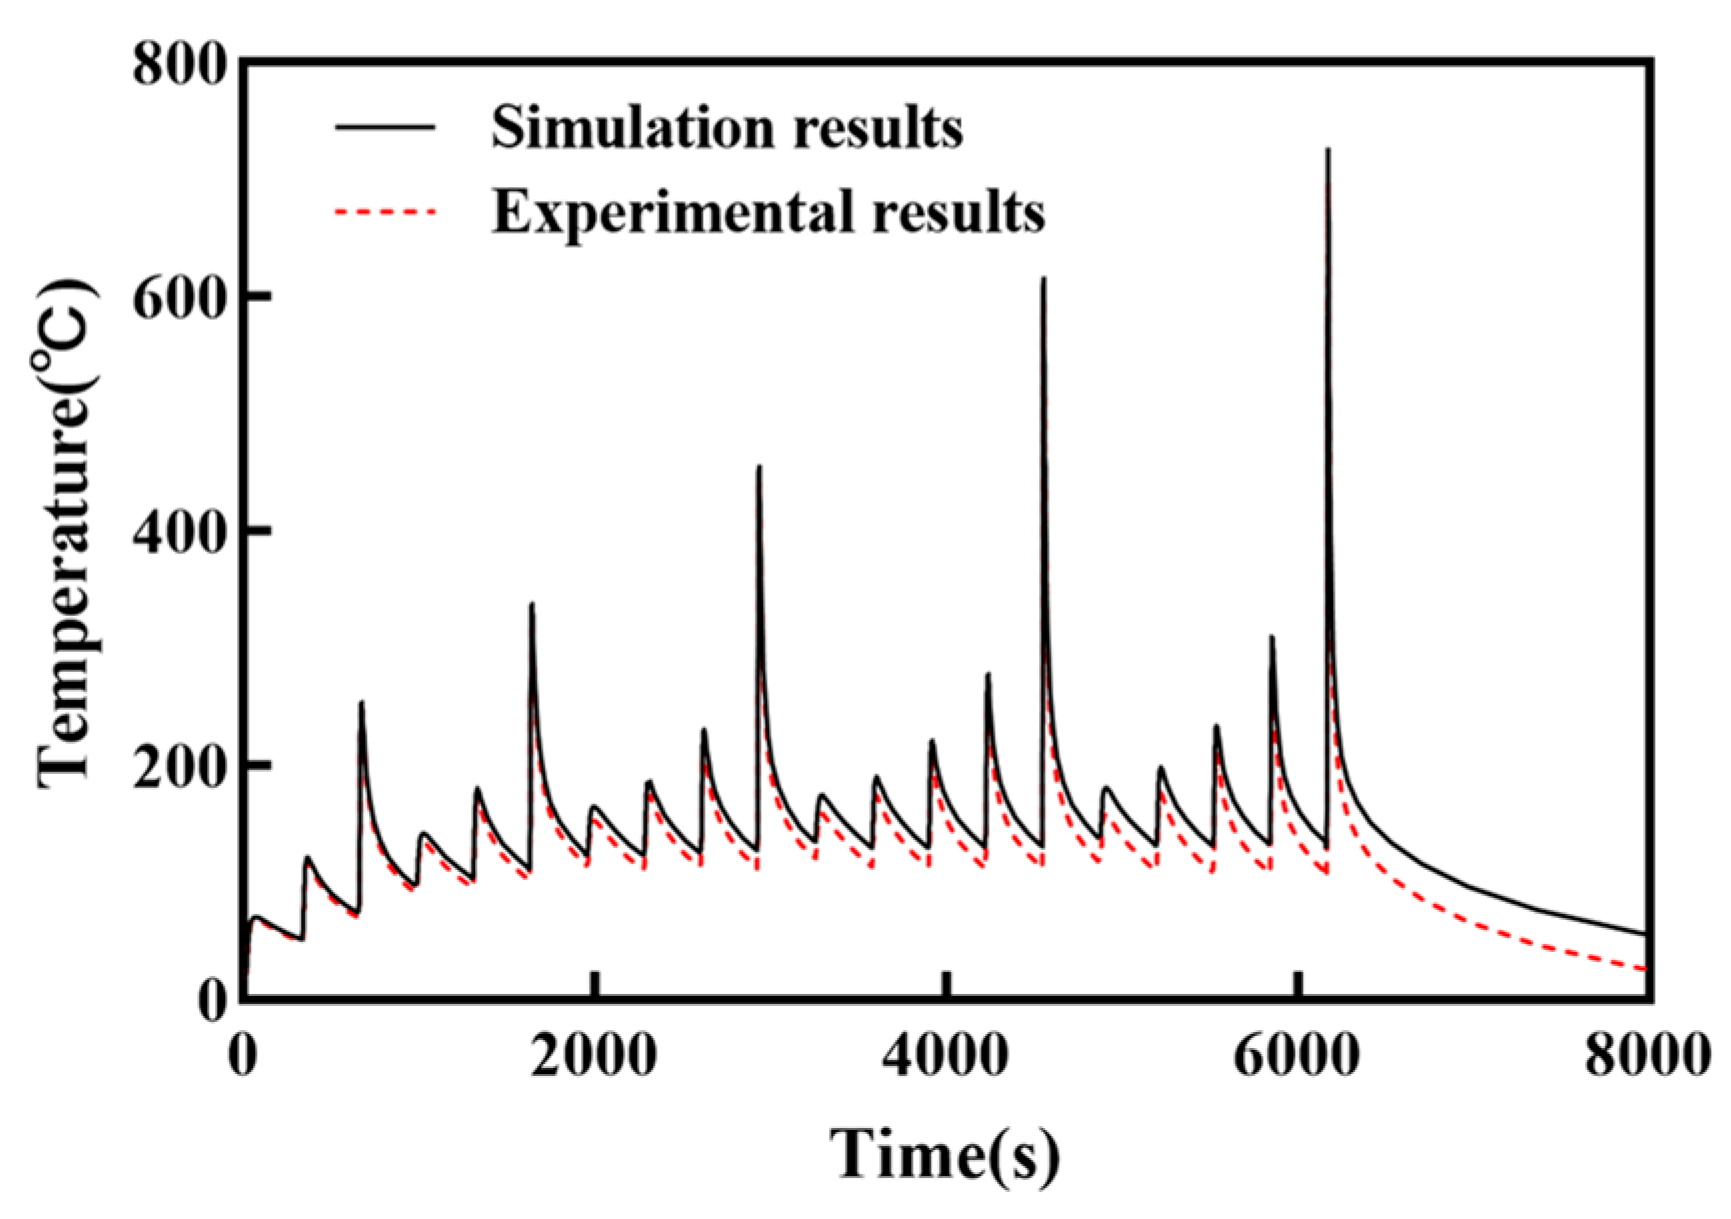
4.1. Comparison between the Simulation and Experimental Results

The temperature changes at point O on the repaired component surface, with an inter-layer cooling time of 300 s, were depicted by the two temperature variation curves during the simulation and experimental processes illustrated in Figure 6. The thermal cycling curves demonstrated numerous minor waves, with each one corresponding to the substantial heat input from individual weld bead during the WAAM process, leading to temperature fluctuations at point O. By examining the temperature cycles illustrated in the graph, it was evident that the simulation and experimental thermal cycling curves exhibited a consistent pattern and displayed a high level of concurrence. This outcome served to validate the reliability of the finite element model for accurately predicting temperature field in the repaired component.
To further validate the model’s reliability, the stress variation on the surface of repaired components was measured using an X-ray type stress analyzer in a cooling time of 300 s. The simulated results were subsequently compared with the experimental findings, as illustrated in Figure 7. The stress values in both the transverse and longitudinal directions exhibited a distinctive double-peak profile, with the highest stress occurring near the ends of the cladding layer. The relative discrepancy between the experimental and simulated results was minimal, aligning with the outcomes observed in Cao et al.’s study [29]. Additionally, the stress values of the measured points (red round dots) showed minimal fluctuations around the stress distribution curves obtained from the simulation (black curve). The simulation and experimental stress distributions demonstrated good agreement, suggesting the reliability of the finite element model for predicting the stress field in the repaired component.

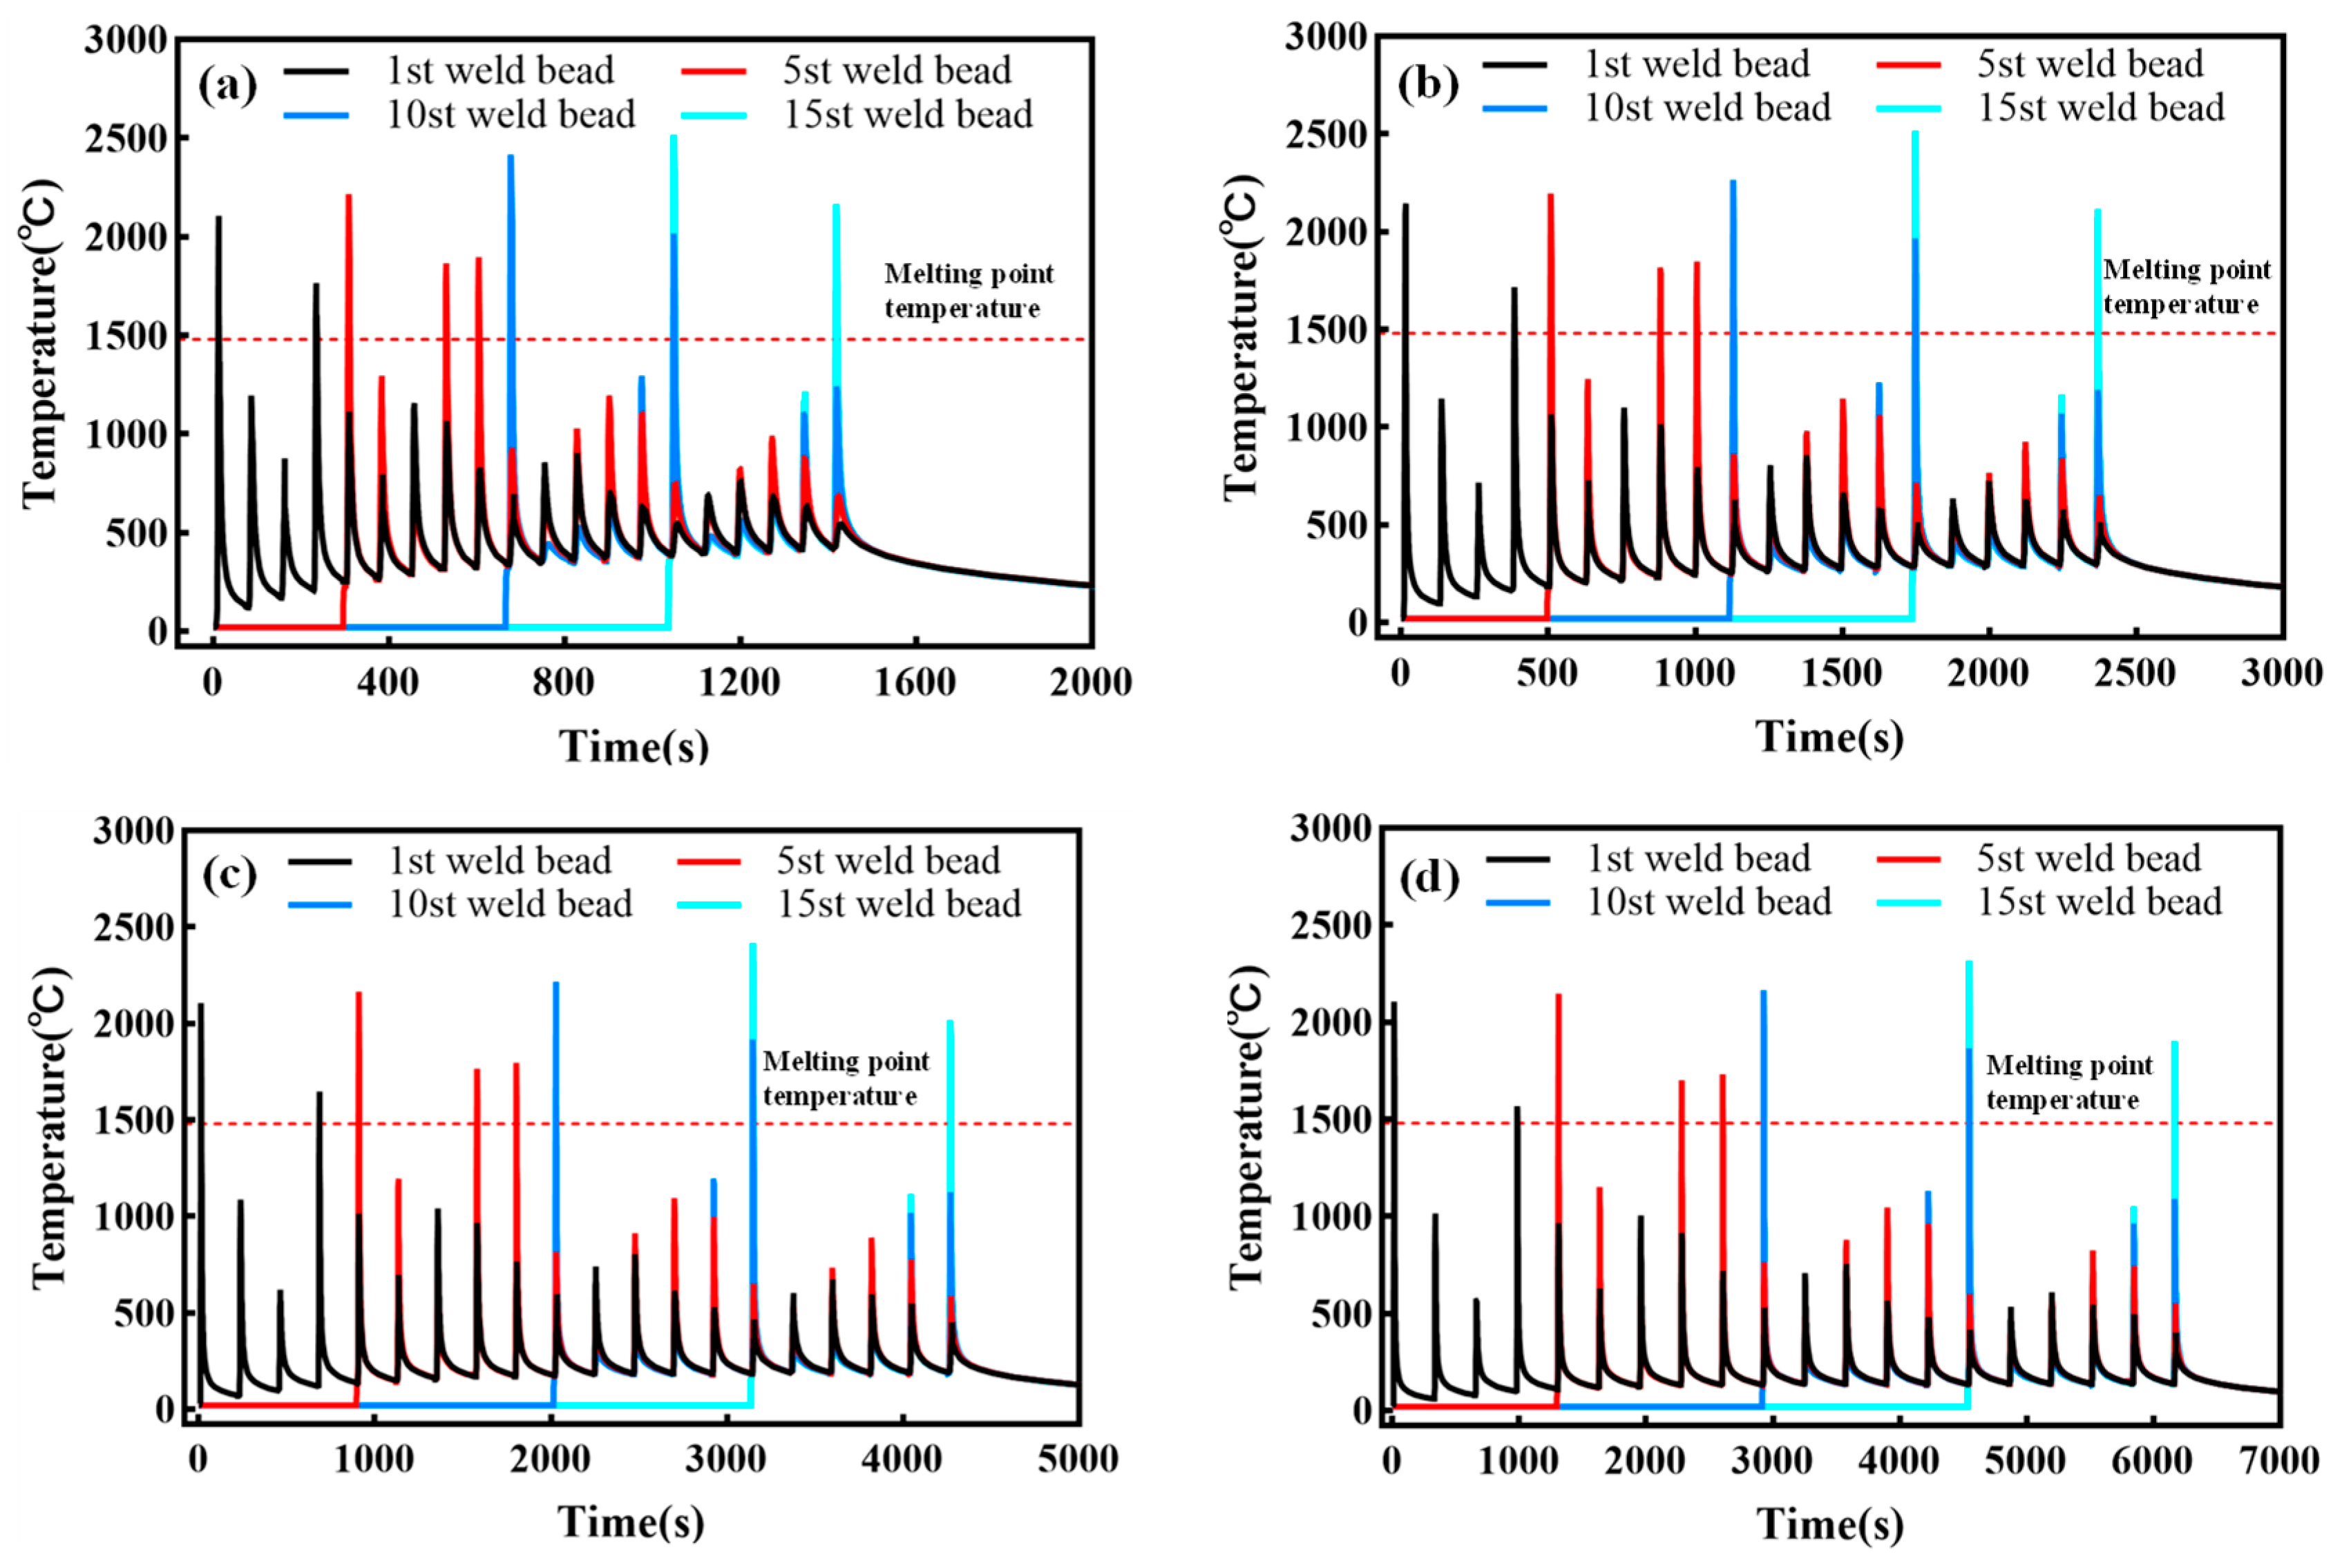
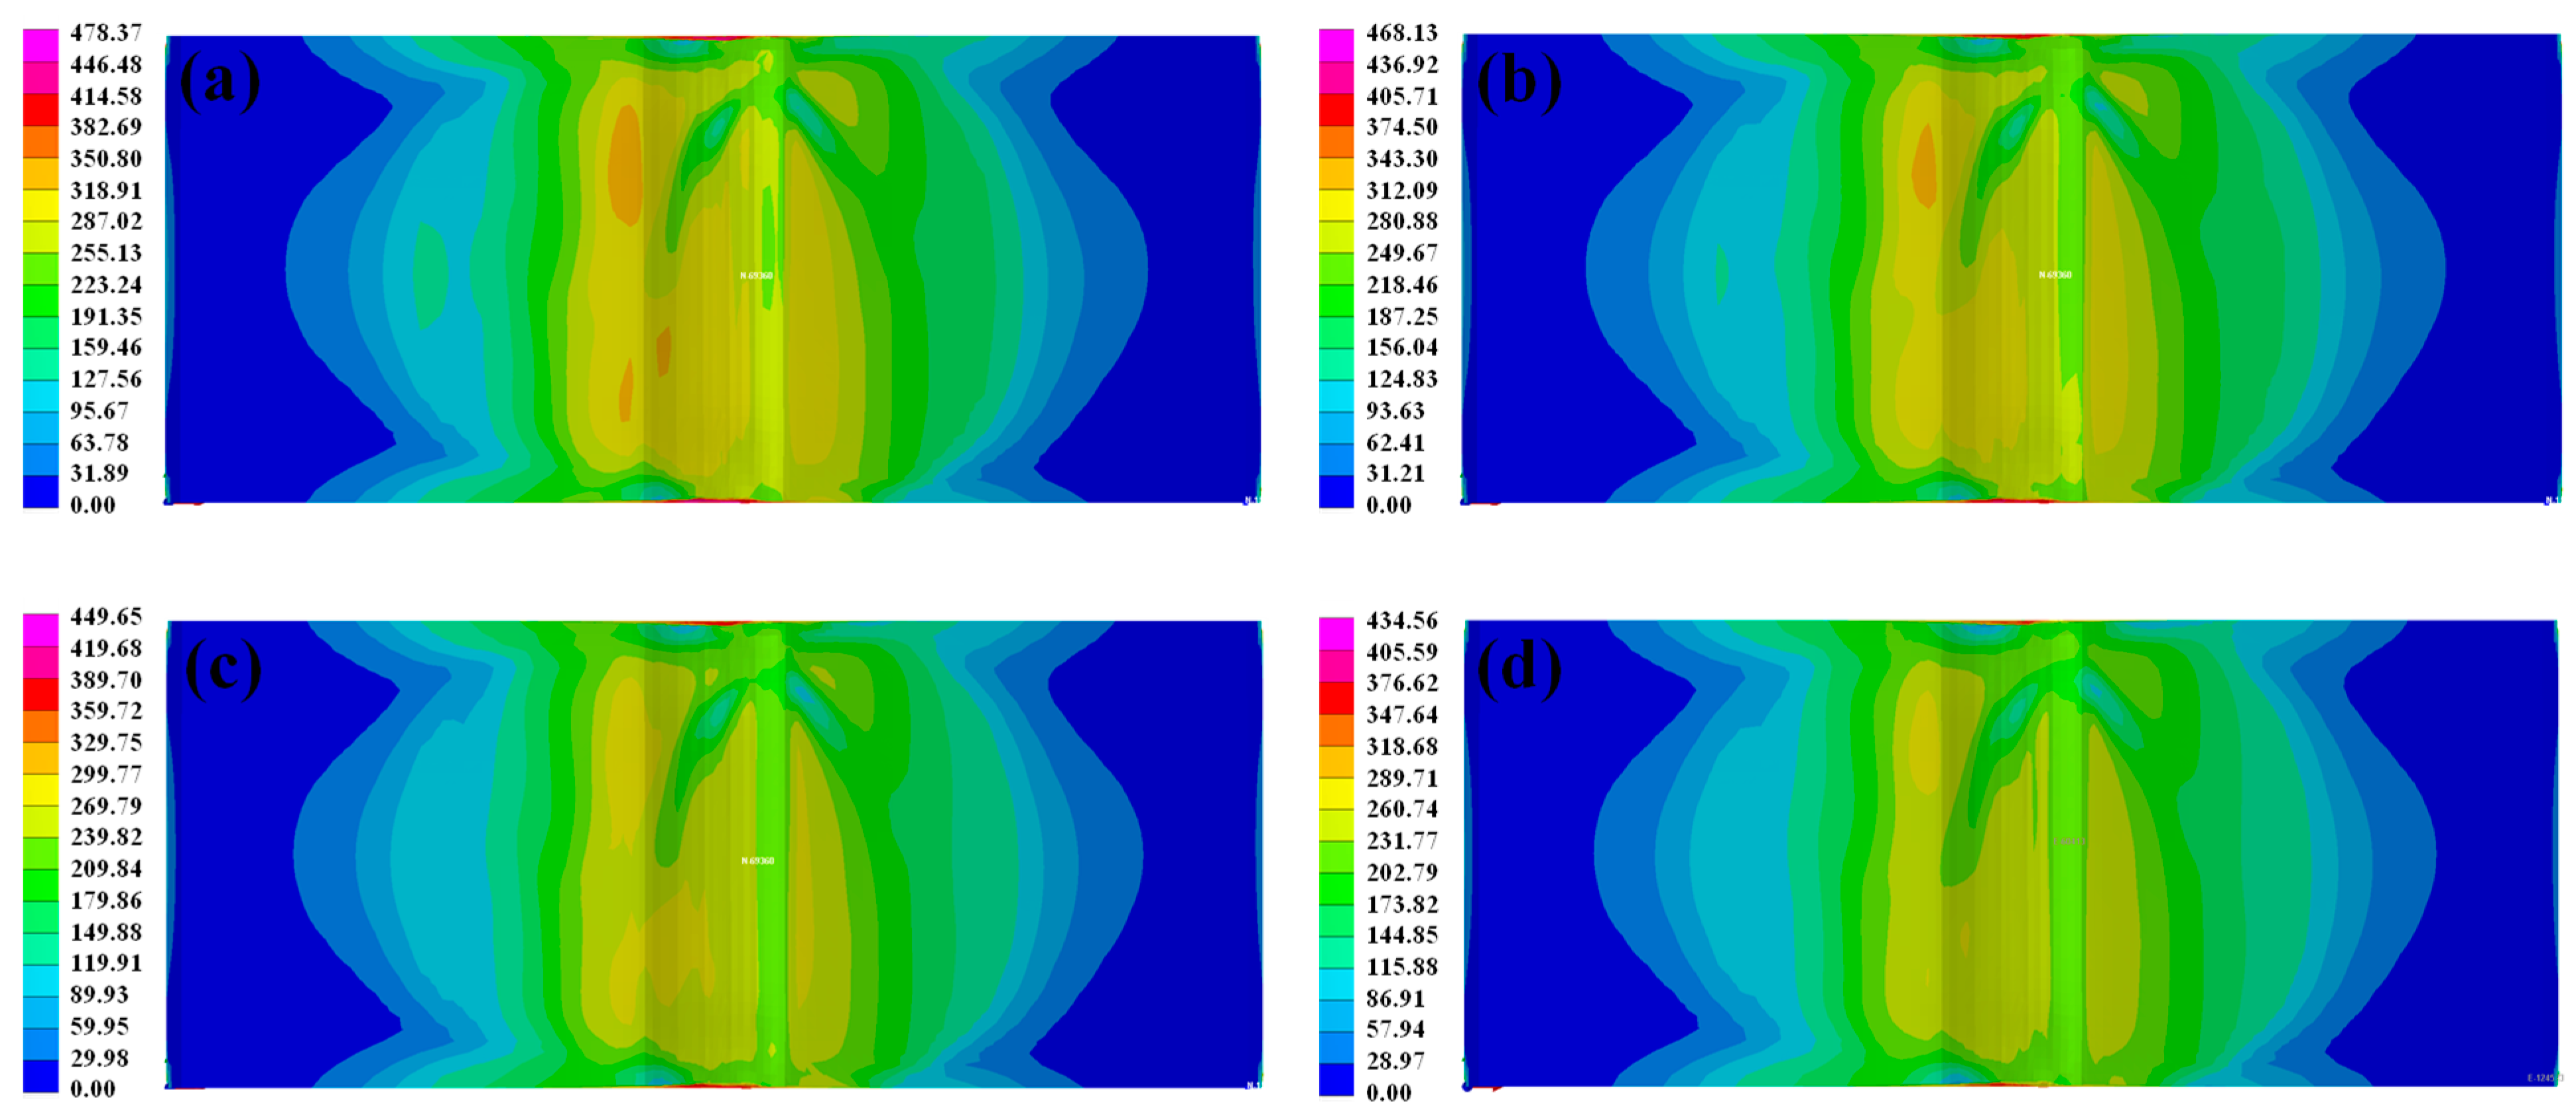
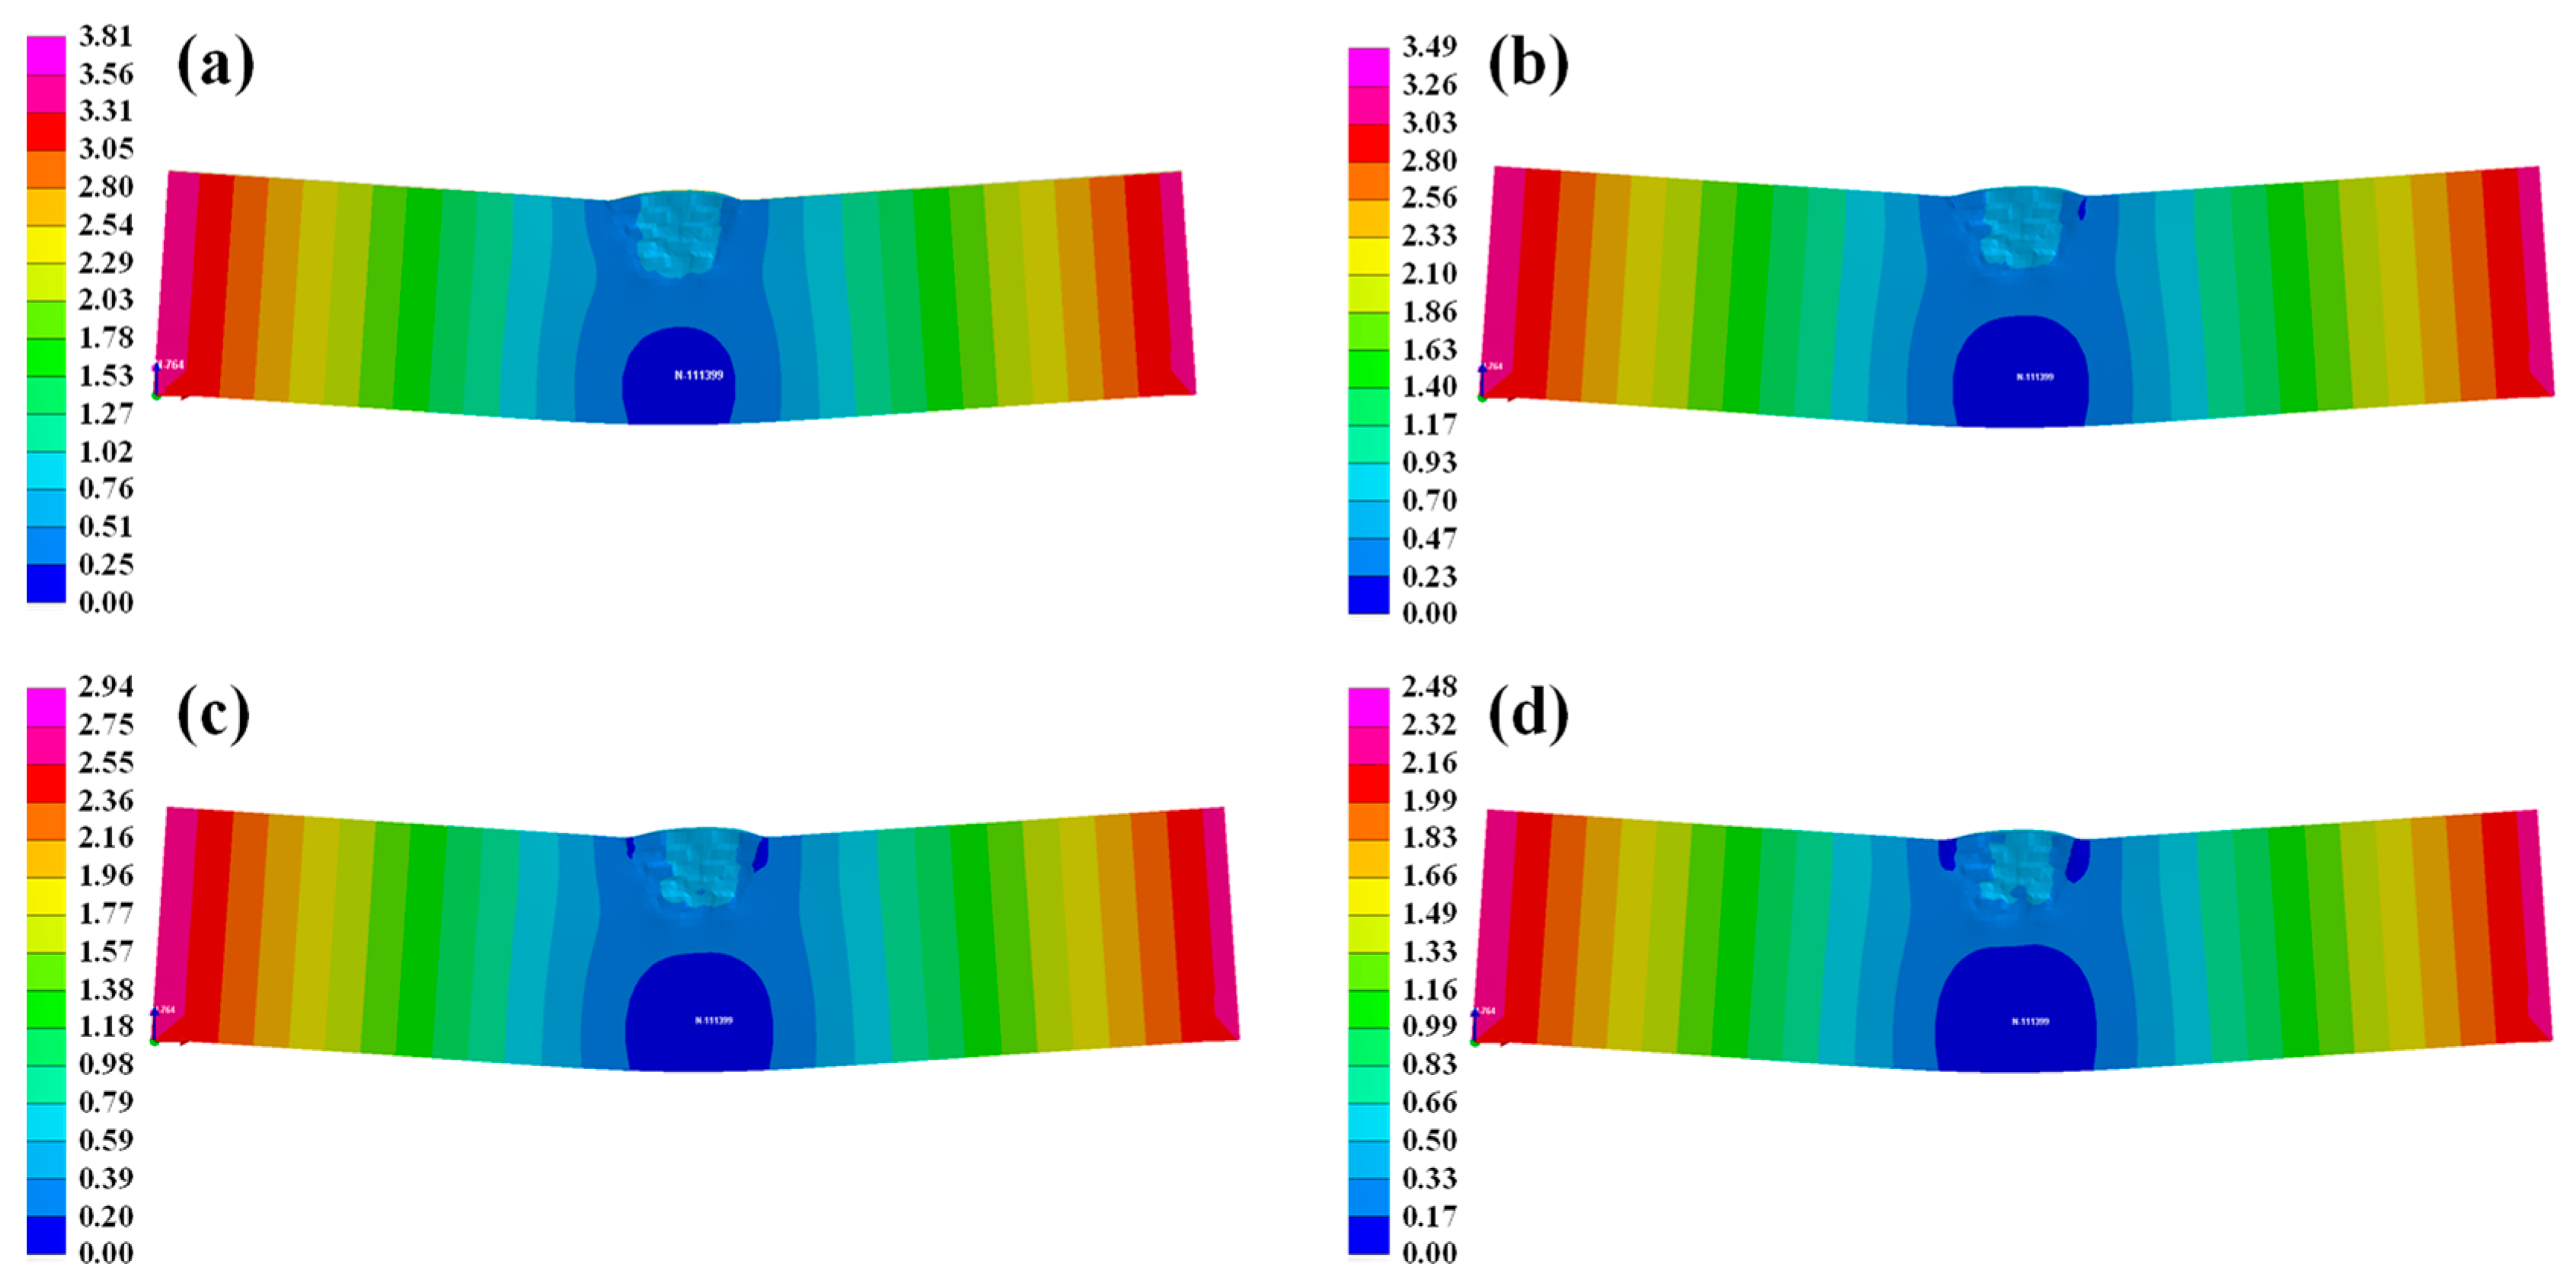
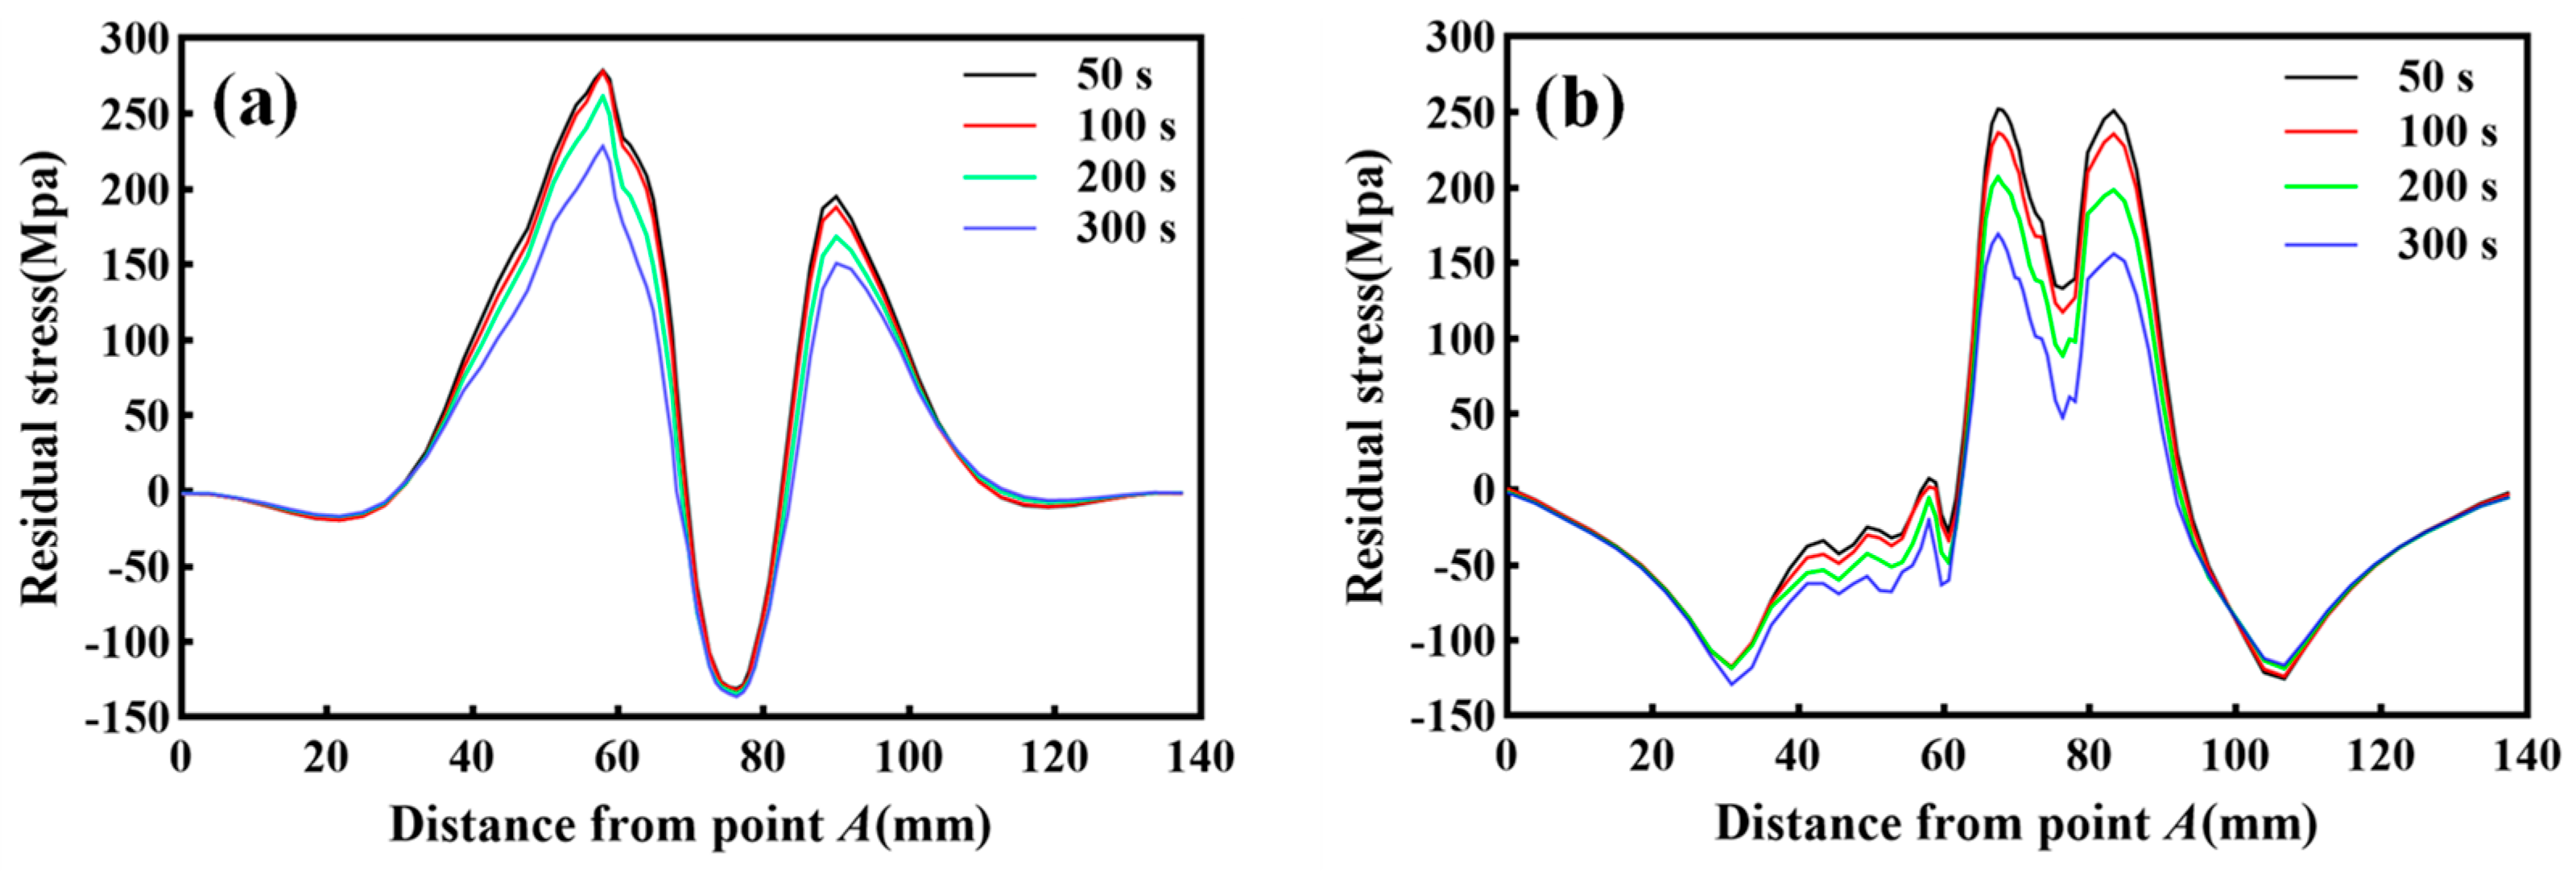
4.2. The Thermal Field and Deformation for Different Inter-Layer Cooling Time

In the process of WAAM, the substantial heat accumulation led to large residual stress due to reheating and remelting effects in the cladding layer, which might largely decrease the quality of the repaired component [30]. Therefore, it was necessary to comprehensively investigate the internal temperature variations of the repaired component in different cooling time. In this study, temperature profiles at the midpoints of the 1st, 5th, 10th, and 15th weld bead were analyzed for inter-layer cooling times of 50 s, 100 s, 200 s, and 300 s, respectively. The corresponding temperature variation curves were illustrated in Figure 8.
As shown in Figure 8a, the temperature increased sharply at the midpoint of the first weld bead when the welding heat source moved to the region. As the heat source moved away, the location fell into a cooling state, and the temperature gradually decreased. The temperature at the midpoint of the first weld bead underwent 20 peaks and valleys. Both the first and forth peak temperatures (2092 °C and 1755 °C) exceeded the material’s melting point (1480 °C). The first peak represented the temperature of the molten pool formed when the heat source passed through the point. When the heat source moved to the midpoint of the 4th weld bead, the temperature reached the second peak over the melting point of the wire, indicating a remelting effect of the latter weld bead on the former. When the heat source moved away, the temperature at the midpoint of the first weld bead was gradually reduced below the material’s melting point, indicating a high-temperature tempering effect from the latter weld beads on the first weld bead. The temperature at the midpoint of the fifth weld bead presented changes with 16 peaks and valleys. When the heat source moved to the midpoints of the 5th, 8th, and 9th weld bead, the peak temperatures (2207 °C, 1854 °C, and 1886 °C, respectively) were also increased over the material’s melting point. Both the 10th and 15th weld bead were remelted once with maximum peak temperatures of 2338 °C and 2555 °C, respectively. It was evident that the maximum peak temperature also increased with the accumulation of weld beads. This indicated that the heat dissipation performance of the repaired component gradually reduced, and the heat accumulation became more apparent in the cladding layer as the number of weld beads increased.
As illustrated in Figure 8b–d, with an increase in inter-layer cooling time, the temperatures at other midpoint positions gradually decreased, except for the first peak of the first weld bead, when the welding heat source moved away. This result suggested that appropriately extending the cooling time was beneficial to a uniform heat distribution in the repaired component and reduced the heat accumulation in the cladding layer.
In the process of WAAM, different cooling times could result in varying heat distribution processes within the cladding zone, consequently disturbing the stress distribution of the repaired component. A cloud diagram of the equivalent stress distribution for different cooling times is shown in Figure 9. It can be observed that the equivalent stress was relatively higher in the cladding zone and gradually decreased towards the surrounding areas. This was mainly due to the significant heat accumulation in the cladding zone, leading to higher stress values in the neighboring substrate. The substrate had a larger surface area and better heat dissipation performance. Thus, the stress values gradually decreased further away from the cladding zone. By comparing the equivalent stress distribution for different cooling times, it can be observed that the maximum equivalent stress gradually decreased from 478 MPa to 434 MPa with an increase in cooling time. This might primarily attribute to the prolonged cooling time that promoted a more uniform heat transfer and reduced heat accumulation in the repaired component.
To investigate the influence of different cooling time on the residual stress distribution, the transverse and longitudinal residual stress were extracted along AB line of the surface of the repaired component, as shown in Figure 10. It was observed that the transverse and longitudinal residual stress along AB line exhibited similar distribution trends. The residual compressive stress was present near the edge of the substrate, which decreased and then gradually transitioned into residual tensile stress as the distance from the substrate edge increased. Finally, the tensile stresses reached their peak values at the sides of the cladding zone. With the extension of cooling time, the peak value of longitudinal residual tensile stress was decreased from 251 MPa to 155 MPa in the cladding zone, representing a reduction of 38%. Both the transverse and longitudinal residual tensile stress near the cladding zone gradually decreased as well.
The repaired component would be subjected to bending deformation due to the presence of residual stress after WAAM. The maximum deformation occurred at the edges of the repaired component. Figure 11 showed the deformation magnitude along the Z-axis of the repaired component in different cooling times. It can be observed that the deformation magnitude of the repaired component gradually increased from the center towards both sides after cooling down to room temperature. The maximum deformations of the repaired component were 3.81 mm, 3.49 mm, 2.94 mm, and 2.48 mm in cooling times of 50 s, 100 s, 200 s, and 300 s, respectively. Therefore, as the cooling time was extended, the deformation magnitude decreased gradually. However, it was advisable to appropriately extend the cooling time given the production efficiency of WAAM.

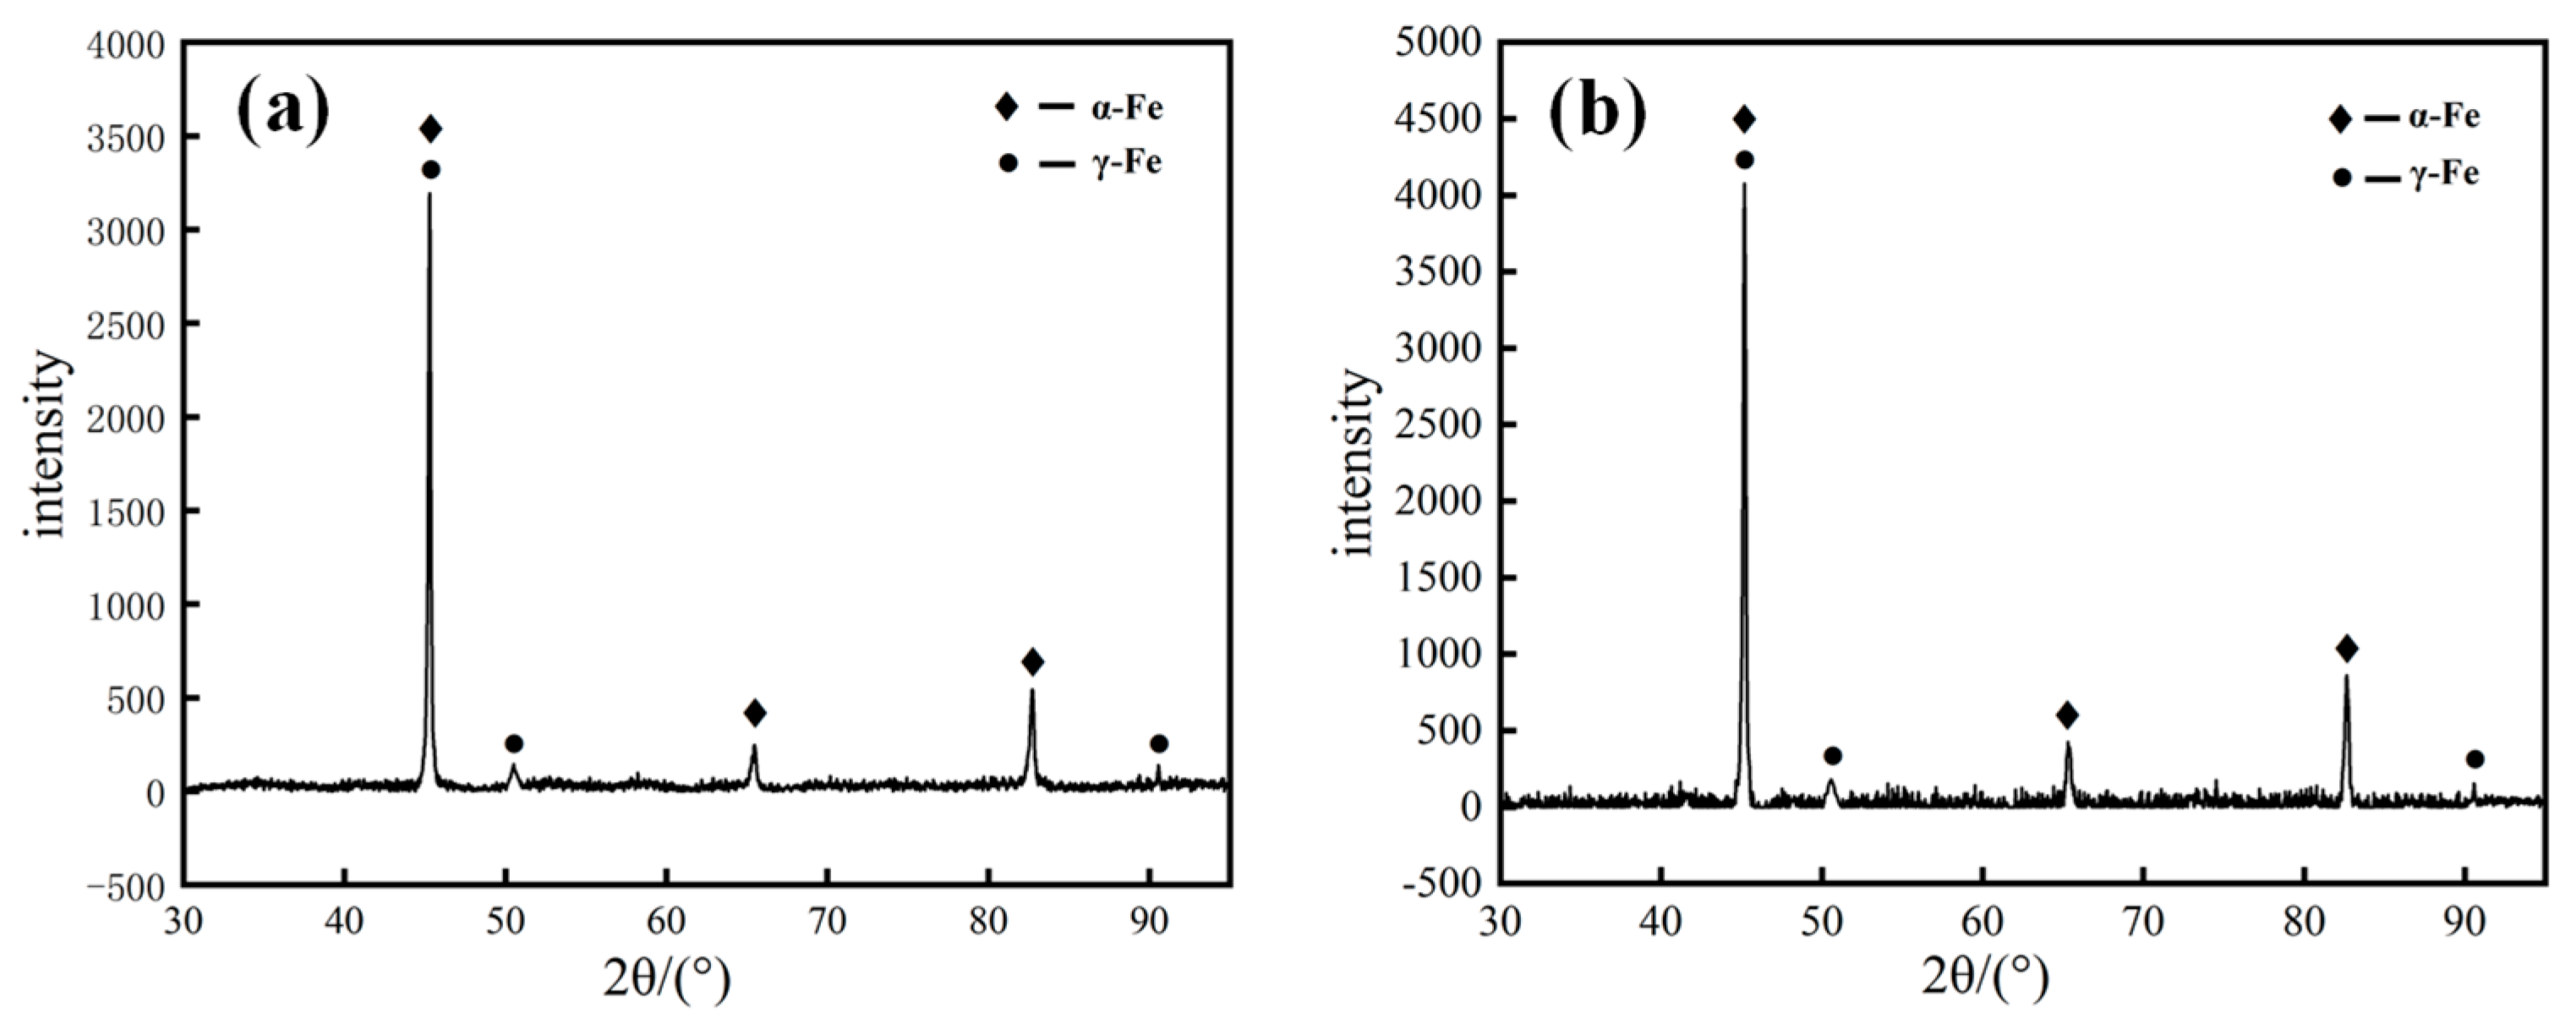
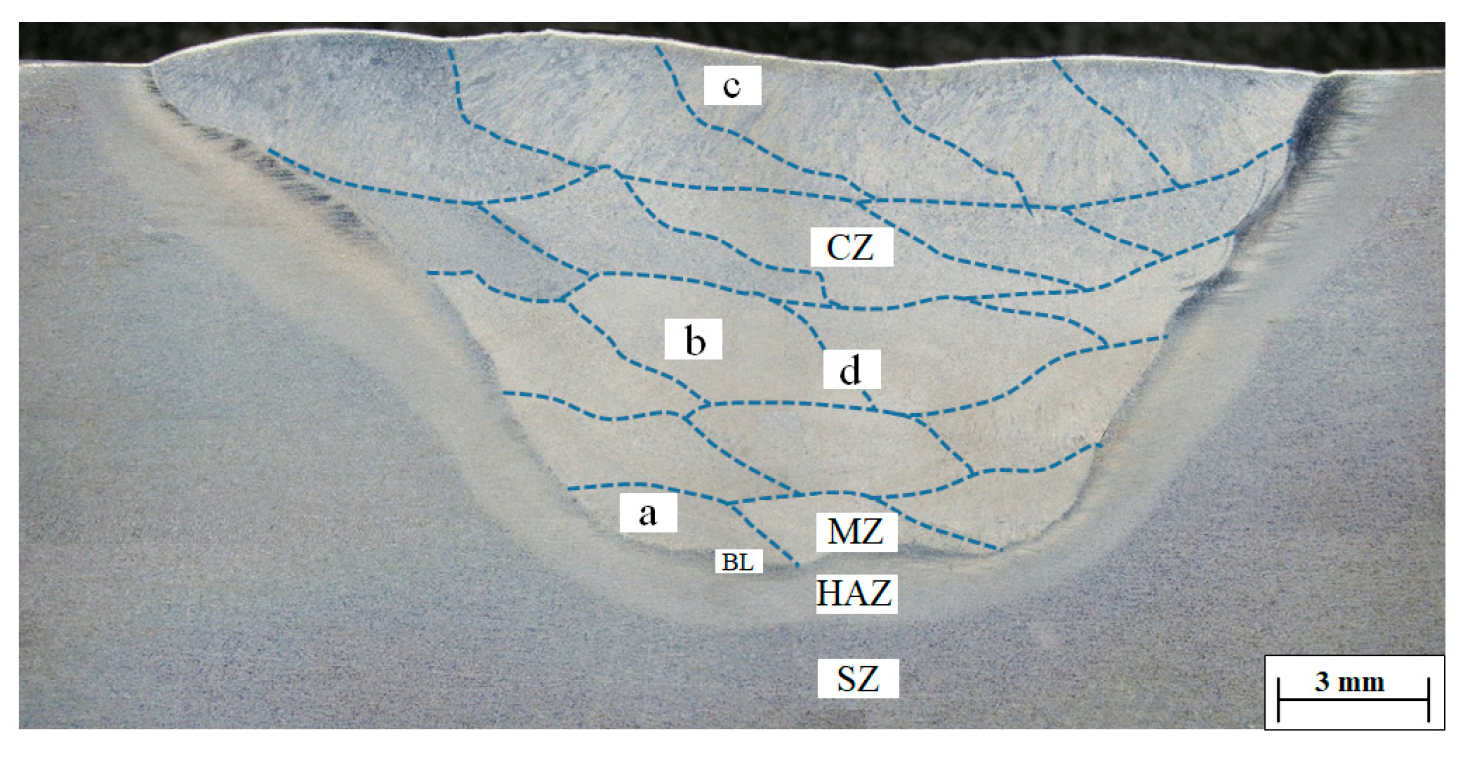
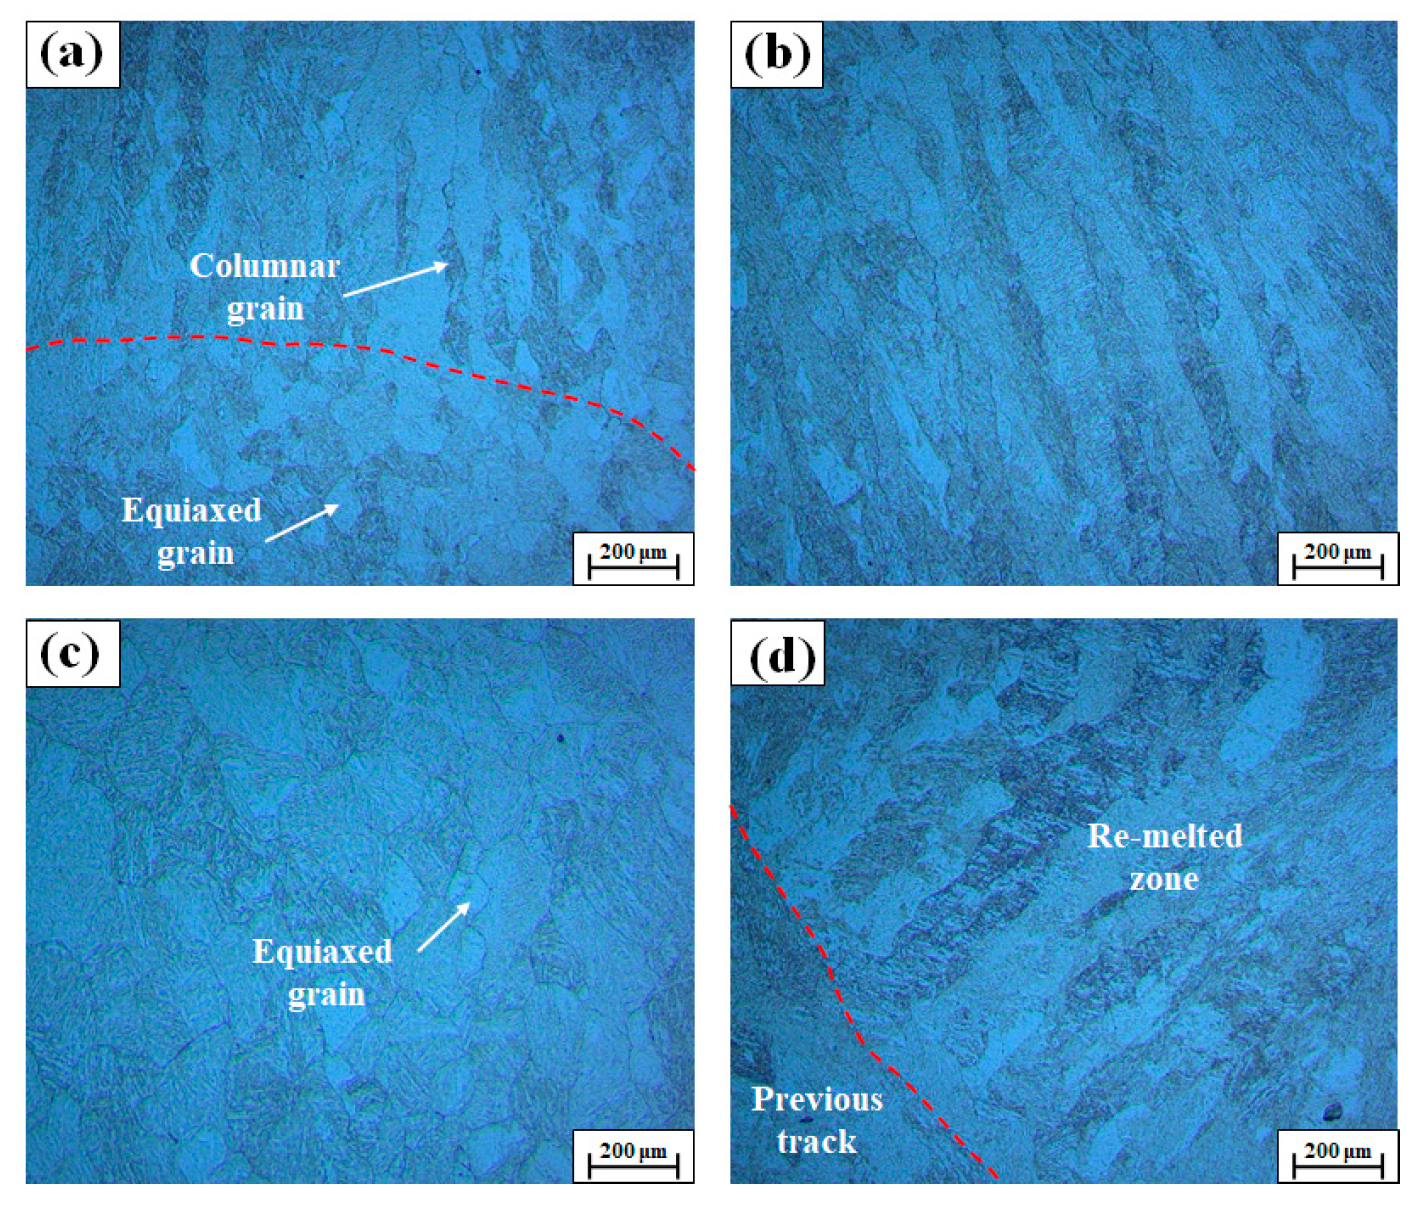
4.3. Phase Composition and Microstructure

It was found that the heat accumulation, residual stress, and bending deformation gradually decrease in the repaired component with the extension of cooling time. Therefore, the microstructure and mechanical performance of the repaired component were further characterized and measured in the inter-layer cooling time of 300 s. Figure 12 showed the X-ray diffraction (XRD) spectra of the H13 steel substrate and the cladding layer in the repaired component. It can be observed strong peaks corresponding to the body-centered cubic (bcc) structure of martensite (α-Fe) at diffraction angles 2θ of 45°, 65°, and 82°, indicating the substrate and the cladding layer were primarily composed of martensite. Moreover, there were weak peaks corresponding to the face-centered cubic (fcc) structure of austenite (γ-Fe) at diffraction angles 2θ of 44.2°, 51°, and 91°, indicating the presence of a small amount of austenite in both the substrate and the cladding layer. Additionally, their peaks could not be well detected in the XRD analysis due to the low content of carbides.
During the WAAM process, the wire was melted to form a molten pool, and then the grains transformed into austenite as the pool starts to solidify. Subsequently, eutectic reactions occurred and led to the precipitation of carbides from the austenite when the temperature of the molten pool was reduced to the eutectic point. Simultaneously, most of the austenite was transformed into martensite due to the extremely fast cooling rate in the molten pool, when the temperature was reduced to room temperature. However, owing to a large amount of alloying elements, such as Cr and Mo, solidified in the austenite, the stability of the overcooled austenite was enhanced and, meanwhile, the start temperature was decreased for the martensitic transformation. Consequently, residual austenite would appear in the WAAM H13 steel cladding layer.
Figure 13 showed the cross-sectional morphology of the H13 steel repaired component with no significant defects such as porosity and cracks in the repair zone. Additionally, the repair zone was accumulated by a series of cladding layer formed by multiple circular arc welds due to the incremental layer-by-layer deposition process within the trapezoidal groove. The cladding layer could be divided into four regions from the top to the substrate: the cladding zone (CZ), the melting zone (MZ) of the substrate, the heat-affected zone (HAZ, about 2 mm wide), and the substrate zone (SZ). Between the bottom of the cladding layer and the heat-affected zone, there was a clearly visible bright white fusion zone, known as the bonding line (BL). The formation of the BL was primarily due to the inter-diffusion of alloying elements between the cladding layer and the substrate, suggesting their formation of solid-solution bonding layer and a sound metallurgical bond.
The microstructure of different regions of in the cladding layer was observed using the microscope. There were fine equiaxed and columnar grains at the bottom of the cladding layer, as shown in Figure 14a. Larger columnar grains were present in the middle and equiaxed grains were observed at the top, as depicted in Figure 14b,c. The formation of these microstructures was influenced by the temperature gradient and solidification rate at different regions during the cooling process. The fine equiaxed and columnar grains were formed at the bottom in the direction opposite to the heat flow, due to a large temperature gradient and low solidification rate. Larger columnar grains were grown in the middle for the severe heat accumulation and slow heat dissipation rate. At the top, the equiaxed grains were formed for the reason of the heat exchange with the surrounding gas with rapid cooling rate [31]. Figure 14d showed the microstructure of the multi-layer overlapping area in the cladding layer. The upper-right part exhibited the re-melted and re-solidified structure, characterized by coarse columnar grains. The lower-left part showed the microstructure where the previous weld bead was affected by the heat from the subsequent one.

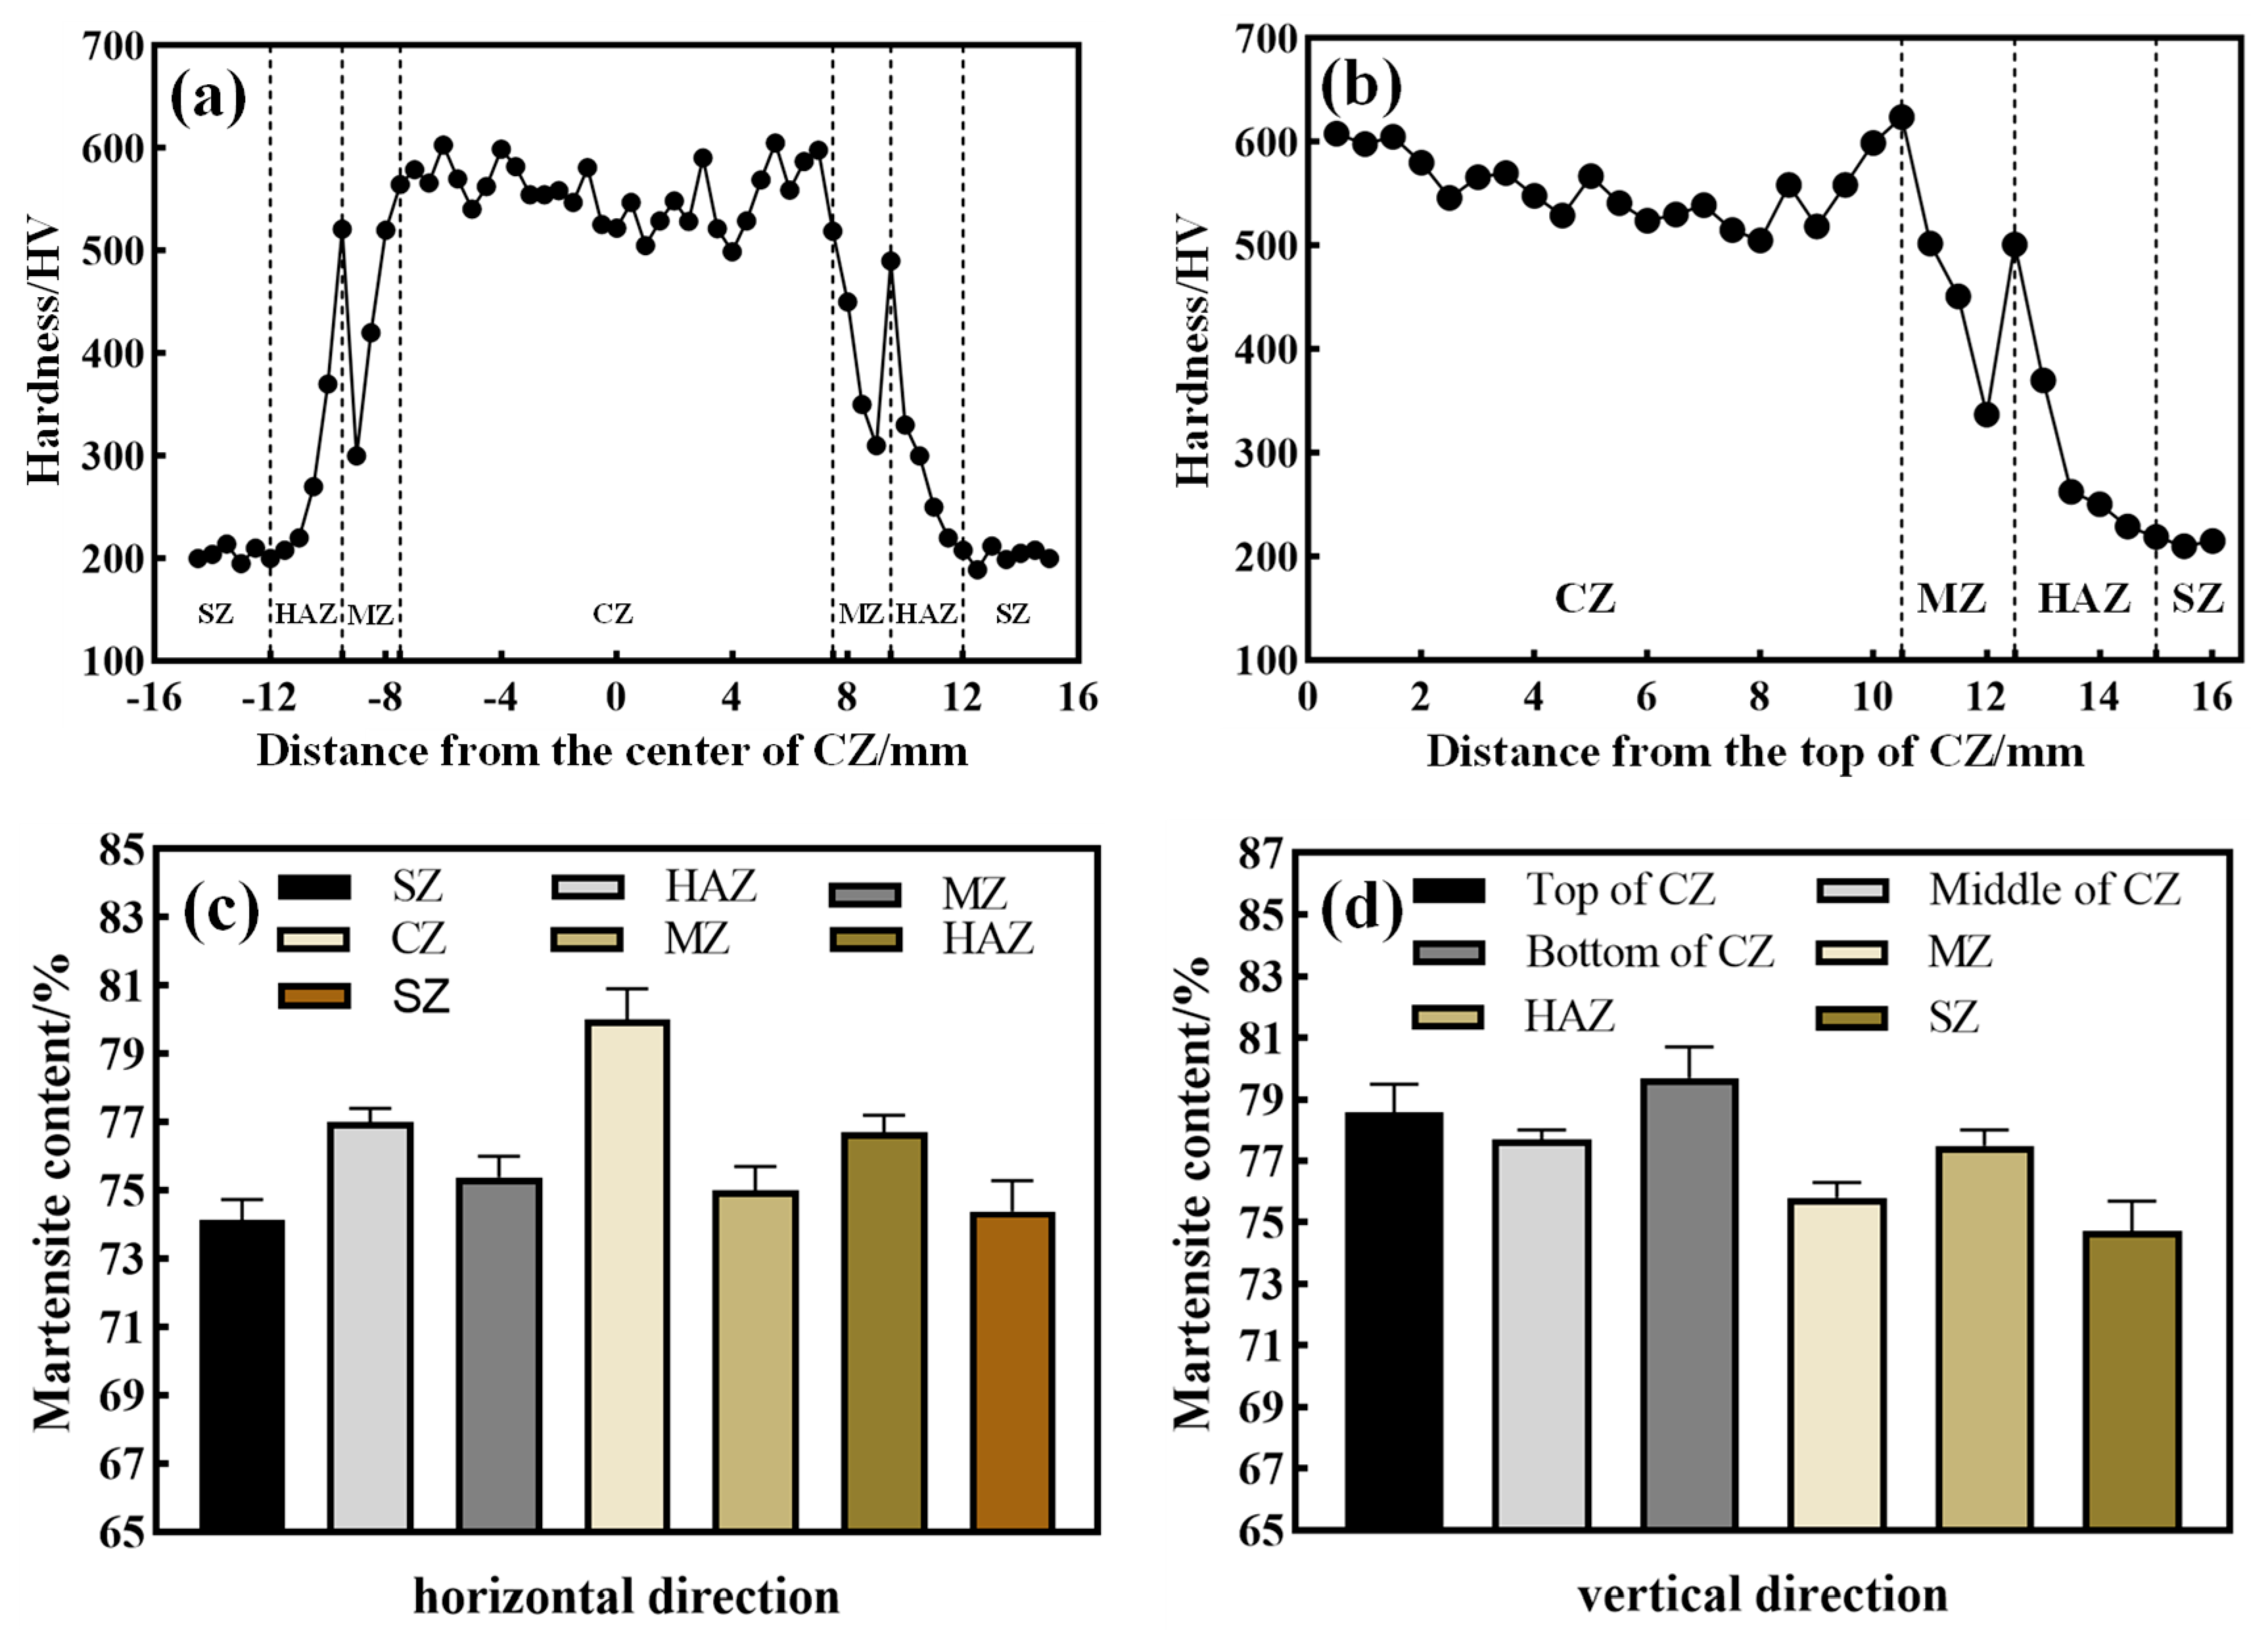
4.4. Microhardness Analysis

To test the microhardness and martensite content of the repaired component, the surfaces of the specimens were polished and then subjected to the examination as shown in Figure 15. The martensite content in the specimens determined the hardness level with a strong positive correlation. Figure 16 presented the microhardness distribution and martensite content along different directions in the cross-section of the H13 steel repaired component. It was observed that the hardness values were higher in the horizontal direction within the cladding zone in Figure 16a,c. This was due to the fact that this region was far from the melted substrate and the cladding material had not been diluted by the melted substrate, resulting in a higher martensite content. However, the dilution effect of the melted substrate was increased with the distance away from the cladding zone, leading to a gradual decrease in hardness in the substrate melting zone. Additionally, the lower content of martensite in the melting zone also resulted in minor hardness [32]. In the heat-affected zone, a martensite quenching microstructure was formed under the rapid-cooling effect of the wire arc welding process, resulting in higher hardness at the top [33]. The substrate material failed to completely transform into austenite due to the decreased temperature along the increased depth of the heat-affected zone, leading to a gradual reduction in martensite content after cooling and its hardness approaching the substrate hardness [34]. The average microhardness of substrate in the horizontal direction was 204 HV, while that of the cladding zone was 556 HV, approximately 2.73 times higher than the former.
As shown in Figure 16b,d, the hardness values in the middle were relatively lower than those in both sides of the cladding zone along the vertical direction. This was because the bottom region could be cooled through the substrate, with a large temperature gradient and fast solidification rate, leading to the formation of the fine equiaxed and columnar grains. The significant increase in strength and hardness could be attributed to the grain refinement [35]. The higher martensite content was observed at the bottom region, which was also one of the main causes of the higher level of hardness. Meanwhile, heat dissipation was slower in the middle region with severe heat accumulation, resulting in larger columnar grains, lower martensite content, and lower levels of hardness. The top region exchanged heat with the surrounding gas, resulting in higher heat dissipation and less heat accumulation. Compared with that in the bottom region, the equiaxed grains in the top region were slightly larger with lower martensite content. Therefore, the level of hardness was relatively lower as well. As for the regions away from the cladding zone in the vertical direction, the variation trend of microhardness was similar to that in the horizontal direction. The hardness gradually decreased to a minor value in the melting zone of the substrate. However, the hardness of the heat-affected zone was increased due to the rapid-cooling effect and then was gradually decreased to that of the substrate. Along the vertical direction, the average hardness of the cladding zone was 559 HV, approximately 2.66 times higher than that of the substrate (210 HV).

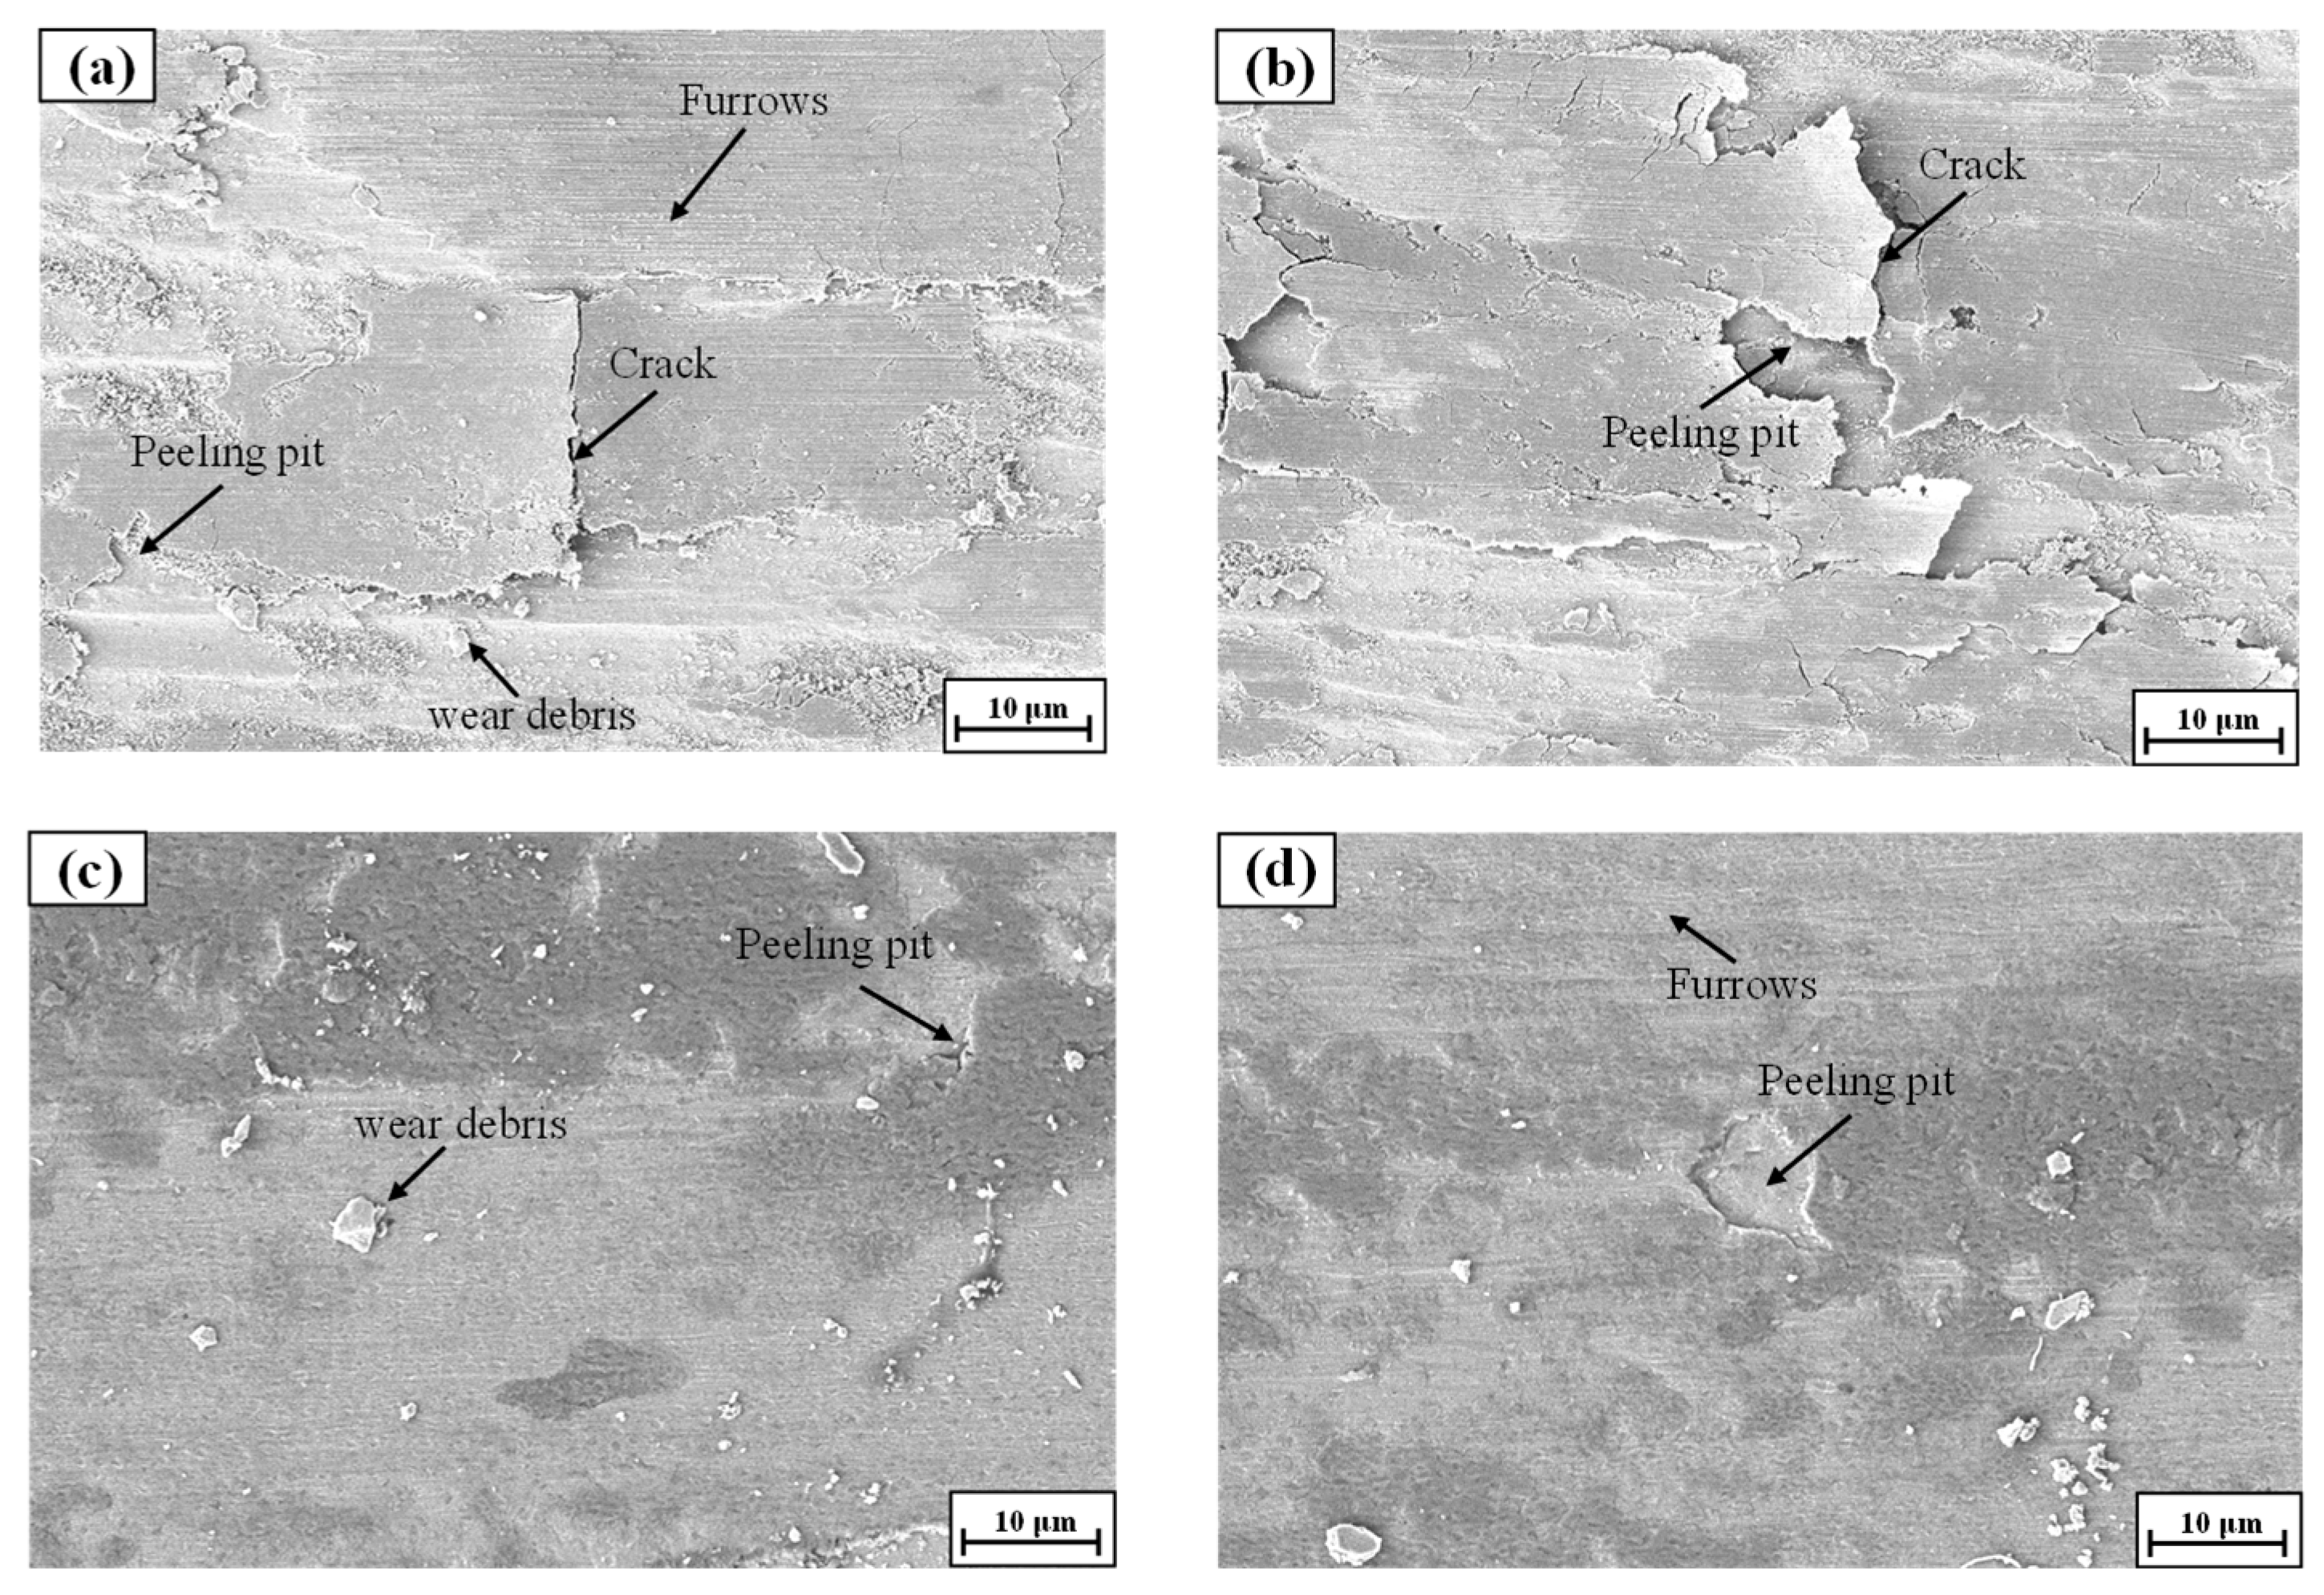
4.5. Friction and Wear Performance Analysis

To evaluate the friction and wear performance of the repaired component, the surfaces of the specimen were polished and subjected to testing wear performance in the direction as shown in Figure 17. Figure 18 shows the 3D morphology of the substrate and cladding zone for cases of dry friction. It can be observed that both the width and depth of the wear scars on the substrate were larger than those on the cladding zone, indicating the worse wear resistance compared with that of the cladding zone. The post-wear profile data revealed that the wear rate of the substrate in the horizontal direction was 49.74 × 10⁻⁴ mm3/(N·mm), while that of the cladding zone was 6.54 × 10⁻⁴ mm3/(N·mm), as shown in Figure 18a,c. Meanwhile, in the vertical direction, the wear rate of the substrate was 55.08 × 10⁻⁴ mm3/(N·mm), while that of the cladding zone was 7.46 × 10⁻⁴ mm3/(N·mm), as shown in Figure 18b,d. Collectively, it could be determined that the wear resistance of the cladding zone was increased 7.60 times higher in the horizontal direction and 7.38 times higher in the vertical direction compared to that of the substrate.
Figure 19 shows the morphology of the wear scars on the substrate and cladding zone for cases of dry friction. It can be observed that the surface of substrate exhibited deeper furrows and a large number of wear debris, parallel to the grinding direction in Figure 19a,b. This is mainly due to the substrate being of lower hardness and experiencing severe plastic deformation against the tribo-pairs with higher hardness during the wear process. Additionally, peeling pits and cracks appeared on the surface of substrate due to the generation of a large amount of heat from repeated friction, indicating that the dominate wear mode were abrasive wear and fatigue wear. On the other hand, the high strength and hardness of the wire arc cladding layer could effectively resist the initiation and propagation of cracks. Therefore, it was found that the surface of cladding zone appeared mild wear with small furrows, a small amount of wear debris, and shallow peeling pits, but without cracks in Figure 19c,d. This suggested that the wear mode of the cladding zone was primarily abrasive wear and mild adhesive wear. In summary, it was evident that the wear resistance of the cladding zone was significantly higher than that of the H13 steel substrate.

5. Conclusions

This study investigated the heat accumulation, residual stress, and deformation of the repaired component in different inter-layer cooling time. The microstructure of the repaired component was analyzed at the optimal cooling time (300 s), and the mechanical performance (hardness, friction, and wear) was tested. The research findings were as follows:
(1)
The simulation thermal cycling curves and stress distribution curves obtained using SYSWELD software were in good agreement with the experimental data, confirming the reliability of the simulation model;
(2)
The heat dissipation performance of the cladding layer gradually reduced with severe heat accumulation as the number of weld beads increased. The residual stress was highly accumulated in the cladding zone, gradually dispersing towards both sides. The deformation of the repaired component was large at both ends but small in the middle;
(3)
The peak temperature of beads and heat accumulation in the cladding layer decreased when the cooling time increased from 50 s to 300 s. Meanwhile, the values of the residual stress and deformation in the repaired component were gradually reduced;
(4)
At the cooling time of 300 s, the microstructure was primarily composed of martensite and austenite. The average microhardness and wear resistance of cladding zone were 2.73 and 7.60 times higher than that of the substrate, respectively, indicating positive correlation with each other;
(5)
Based on this study, it was recommended to utilize numerical simulation techniques to select appropriate process parameters when applying the WAAM technique into mold restoration, which ensured both the efficiency and quality of remanufacturing.

Author Contributions

Conceptualization, Y.Z. and J.C.; methodology, Y.Z.; software, J.C.; validation, X.L.; formal analysis, X.L.; investigation, Y.Z.; data curation, Y.Z.; writing—original draft preparation, Y.Z.; writing—review and editing, Y.Z. and J.C.; visualization, J.C.; supervision, J.C.; funding acquisition, Y.Z. and J.C. All authors have read and agreed to the published version of the manuscript.

Funding

This research was funded by the Postgraduate Research & Practice Innovation Program of Jiangsu Province (SJCX22_1469) and the National Natural Science Foundation of China (52205157).

Data Availability Statement

Data will be made available upon request.

Conflicts of Interest

The authors declare no conflict of interest.

References

  1. Almangour, B.; Grzesiak, D.; Yang, J.M. Nanocrystalline TiC-reinforced H13 steel matrix nanocomposites fabricated by selective laser melting. Mater. Des. 2016, 96, 150–161. [Google Scholar] [CrossRef]
  2. Li, J.Y.; Chen, Y.L.; Huo, J.H. Mechanism of improvement on strength and toughness of H13 die steel by nitrogen. Mater. Sci. Eng. A 2015, 640, 16–23. [Google Scholar] [CrossRef]
  3. Lu, H.F.; Cai, J.; Luo, K.Y.; Xing, F.; Zhang, Q.L.; Yao, J.H.; Lu, J.Z. Thermal fatigue life and improvement mechanism of Fe-based coatings on H13 extrusion die by laser additive remanufacturing. Surf. Coat. Technol. 2021, 408, 126808. [Google Scholar] [CrossRef]
  4. Shinde, T.; Chavan, R.; Savadekar, P.; Patil, I.; Walke, O.; Wagh, G. Analysis of nitrided H13 steel in rotating bending fatigue. Mater. Today Proc. 2021, 44, 2507–2510. [Google Scholar] [CrossRef]
  5. Zhu, L.D.; Wang, S.H.; Pan, H.C.; Yuan, C.T.; Chen, X.S. Research on remanufacturing strategy for 45 steel gear using H13 steel powder based on laser cladding technology. J. Manuf. Process. 2020, 49, 344–354. [Google Scholar] [CrossRef]
  6. Vachhani, H.; Rathod, M.; Shah, R. Dissolution and erosion behavior of AISI H13 shot sleeve in high pressure die casting process. Eng. Fail. Anal. 2019, 101, 206–214. [Google Scholar] [CrossRef]
  7. Huang, Y.M.; Hou, S.S.; Yang, L.J.; Tian, G.; Yong, Z.; Liu, S.Y. Effect of arc dynamic behavior on deposition quality of additive manufactured aluminum alloys. J. Mater. Process. Technol. 2021, 295, 117172. [Google Scholar] [CrossRef]
  8. Yin, Z.Q.; Xiong, J. Stereovision measurement of layer geometry in wire and arc additive manufacturing with various stereo matching algorithms. J. Manuf. Process. 2020, 56, 428–438. [Google Scholar] [CrossRef]
  9. Almangour, B.; Grzesiak, D.; Yang, J.M. Selective laser melting of TiB2/H13 steel nanocomposites: Influence of hot isostatic pressing post-treatment. J. Mater. Process. Technol. 2017, 244, 344–353. [Google Scholar] [CrossRef]
  10. Mcandrew, A.R.; Rosales, M.A.; Colegrove, P.A.; Hönnige, J.R.; Ho, A.; Fayolle, R.; Eyitayo, K.; Stan, I.; Sukrongpang, P.; Crochemore, A.; et al. Interpass rolling of Ti-6Al-4V wire+arc additively manufactured features for microstructural refinement. Addit. Manuf. 2018, 21, 340–349. [Google Scholar] [CrossRef]
  11. Liu, J.; Zheng, J.; Fu, B.; Bu, L.; Li, R.; Liu, S. Thermo-Mechanical Study of TIG Welding of Ti-6Al-4V for Residual Stresses Considering Solid State Phase Transformation. Metals 2023, 13, 1001. [Google Scholar] [CrossRef]
  12. Ma, Y.; Cuiuri, D.; Shen, C.; Li, H.J.; Pan, Z.G. Effect of interpass temperature on in-situ alloying and additive manufacturing of titanium aluminides using gas tungsten arc welding. Addit. Manuf. 2015, 8, 71–77. [Google Scholar] [CrossRef]
  13. Wang, T.T.; Zhang, Y.B.; Wu, Z.H.; Shi, C.W. Microstructure and properties of die steel fabricated by WAAM using H13 wire. Vacuum 2018, 149, 185–189. [Google Scholar] [CrossRef]
  14. Taraphdar, P.K.; Thakare, J.G.; Pandey, C.; Mahapatra, M.M. Novel residual stress measurement technique to evaluate through thickness residual stress fields. Mater. Lett. 2020, 277, 12847. [Google Scholar] [CrossRef]
  15. Rani, K.; Rajiv Kumar, R.; Mahapatra, M.M.; Mulik, R.S.; Świerczyńska, A.; Fydrych, D.; Pandey, C. Wire Arc Additive Manufactured Mild Steel and Austenitic Stainless Steel Components: Microstructure, Mechanical Properties and Residual Stresses. Materials 2022, 15, 7094. [Google Scholar] [CrossRef] [PubMed]
  16. Xiong, J.; Lei, Y.Y.; Chen, H.; Zhng, G.G. Fabrication of inclined thin-walled parts in multi-layer single-pass GMAW-based additive manufacturing with flat position deposition. J. Mater. Process. Technol. 2017, 240, 397–403. [Google Scholar] [CrossRef]
  17. Kozamernik, N.; Braun, D.; Klobar, D. WAAM system with interpass temperature control and forced cooling for near-net-shape printing of small metal components. Int. J. Adv. Manuf. Technol. 2020, 110, 1955–1968. [Google Scholar] [CrossRef]
  18. Li, F.; Chen, S.J.; Shi, J.B.; Zhao, Y.; Tian, H.Y. Thermoelectric Cooling-Aided Bead Geometry Regulation in Wire and Arc-Based Additive Manufacturing of Thin-Walled Structures. Appl. Sci. 2018, 8, 207. [Google Scholar] [CrossRef]
  19. Wu, B.T.; Pan, Z.X.; Ding, D.H.; Cuiuri, D.; Li, H.J.; Fei, Z.Y. The effects of forced interpass cooling on the material properties of wire arc additively manufactured Ti6Al4V alloy. J. Mater. Process. Technol. 2018, 258, 95–105. [Google Scholar] [CrossRef]
  20. Lei, Y.Y.; Xiong, J.; Li, R. Effect of inter layer idle time on thermal behavior for multi-layer single-pass thin-walled parts in GMAW-based additive manufacturing. Int. J. Adv. Manuf. Technol. 2018, 96, 135–1365. [Google Scholar] [CrossRef]
  21. Feng, G.; Wang, H.; Wang, Y.; Deng, D.; Zhang, J. Numerical Simulation of Residual Stress and Deformation in Wire Arc Additive Manufacturing. Crystals 2022, 12, 803. [Google Scholar] [CrossRef]
  22. Turgut, B.; Gürol, G.; Onler, R. Effect of interlayer dwell time on output quality in wire arc additive manufacturing of low carbonlow alloy steel components. Int. J. Adv. Manuf. Technol. 2023, 126, 5277–5288. [Google Scholar] [CrossRef]
  23. Somashekara, M.A.; Naveenkumar, M.; Kumar, A.; Viswanath, C.; Simhambhatla, S. Investigations into effect of weld-deposition pattern on residual stress evolution for metallic additive manufacturing. Int. J. Adv. Manuf. Technol. 2017, 90, 2009–2025. [Google Scholar] [CrossRef]
  24. Ahmad, A.S.; Wu, Y.X.; Gong, H.; Nie, L. Finite element prediction of residual stress and deformation induced by double-pass tig welding of al 2219 plate. Materials 2019, 12, 2251. [Google Scholar] [CrossRef] [PubMed]
  25. He, M.; Zhang, Z.F.; Mao, W.M.; Li, B.; Bai, Y.L.; Xu, J. Numerical and Experimental Study on Melt Treatment for Large-Volume 7075 Alloy by a Modified Annular Electromagnetic Stirring. Materials 2019, 12, 820. [Google Scholar] [CrossRef] [PubMed]
  26. Olshanskaya, T.; Fedoseeva, E. Porosity Formation in Thin Welded Joints of Al–MG–LI Alloys. Materials 2022, 15, 348. [Google Scholar] [CrossRef] [PubMed]
  27. Afazov, S.M.; Ratchev, S.M.; Segal, J. Prediction and experimental validation of micro-milling cutting forces of AISI H13 steel at hardness between 35 and 60 HRC. Int. J. Adv. Manuf. Technol. 2012, 62, 887–899. [Google Scholar] [CrossRef]
  28. Goladk, J.; Chakravariti, A.; Bibby, M. A new finite element model for welding heat sources. Metall. Trans. B 1984, 15, 299–305. [Google Scholar] [CrossRef]
  29. Cao, J.; Gharghouri, M.A.; Nash, P. Finite-element analysis and experimental validation of thermal residual stress and distortion in electron beam additive manufactured Ti-6Al-4V build plates. J. Mater. Process. Technol. 2016, 237, 409–419. [Google Scholar] [CrossRef]
  30. Zareh, P.; Urbanic, R.J. Numerical simulations for laser clad beads with a variable side-to-side overlap condition. Int. J. Adv. Manuf. Technol. 2020, 109, 1027–1058. [Google Scholar] [CrossRef]
  31. Ma, M.M.; Wang, Z.M.; Zeng, X.Y. Effect of energy input on microstructural evolution of direct laser fabricated IN718 alloy. Mater. Charact. 2015, 106, 420–427. [Google Scholar] [CrossRef]
  32. Hemmati, I.; Ocelík, V.; De Hosson, J.T.M. Dilution effects in laser cladding of Ni–Cr–B–Si–C hardfacing alloys. Mater. Lett. 2012, 84, 69–72. [Google Scholar] [CrossRef]
  33. Trojan, K.; Ocelík, V.; Čapek, J.; Čech, J.; Canelo-Yubero, D.; Ganev, N.; Kolařík, K.; De Hosson, J.T.M. Microstructure and Mechanical Properties of Laser Additive Manufactured H13 Tool Steel. Metals 2022, 12, 243. [Google Scholar] [CrossRef]
  34. Xu, P.; Lin, C.X.; Zhou, C.Y.; Yi, X.P. Wear and corrosion resistance of laser cladding AISI 304 stainless steel/Al2O3 composite coatings. Surf. Coat. Technol. 2014, 238, 9–14. [Google Scholar] [CrossRef]
  35. Shan, X.H.; Cong, M.Q.; Lie, W.N. Effect of Cladding Current on Microstructure and Wear Resistance of High-Entropy Powder-Cored Wire Coating. Metals 2022, 12, 1718. [Google Scholar] [CrossRef]
Figure 1. (a) Experimental setup; Schematic diagram of (b) measurement positions and (c) trapezoidal groove. (Units in mm).
Metals 13 01484 g001
Figure 2. Schematic diagram of residual stress measurement locations in the experiment. (Units in mm).
Metals 13 01484 g002
Figure 3. Surfaces tested for (a) microhardness; (b) friction and wear; (c) XRD. (Units in mm).
Metals 13 01484 g003
Figure 4. Schematic diagram of finite element model meshing.
Metals 13 01484 g004
Figure 5. Schematic diagram of double ellipsoidal heat source model.
Metals 13 01484 g005
Figure 6. Temperature variation curve of the surface O point of the repaired component in simulation and experiment.
Metals 13 01484 g006
Figure 7. Comparison of residual stress of AB line on the surface of repaired component in simulation and experiment: (a) transverse and (b) longitudinal.
Metals 13 01484 g007
Figure 8. The thermal cycling curves at the midpoint of the weld bead in different inter-layer cooling time: (a) 50 s; (b) 100 s; (c) 200 s; (d) 300 s.
Metals 13 01484 g008
Figure 9. Cloud diagram of the equivalent stress distribution of the repaired component in different cooling time: (a) 50 s; (b) 100 s; (c) 200 s; (d) 300 s.
Metals 13 01484 g009
Figure 10. Distribution of residual stress on AB line of the surface of the repaired component in different inter-layer cooling time (a) transverse and (b) longitudinal residual stress.
Metals 13 01484 g010
Figure 11. Cloud diagram of the deformation of the repaired component along the Z axis in different inter-layer cooling time: (a) 50 s; (b) 100 s; (c) 200 s; (d) 300 s.
Metals 13 01484 g011
Figure 12. X-ray diffraction (XRD) spectra of the H13 steel (a) substrate and (b) the cladding layer.
Metals 13 01484 g012
Figure 13. The cross-sectional morphology of the H13 steel repaired component. (a, bottom area; b, middle area; c, top area in the cladding layer).
Metals 13 01484 g013
Figure 14. Microstructure of the different areas in the cladding layer: (a) bottom area; (b) middle area; (c) top area; (d) overlapping area.
Metals 13 01484 g014
Figure 15. Schematic diagram of selecting test directions for microhardness and martensite content detection.
Metals 13 01484 g015
Figure 16. Diagram of microhardness distribution and martensite content along different directions on the cross section of the repaired component: (a,c) horizontal; (b,d) vertical direction.
Metals 13 01484 g016
Figure 17. Schematic diagram of selecting directions for friction and wear analysis.
Metals 13 01484 g017
Figure 18. Three-dimensional morphology of surface wear in different directions: surface of the substrate and cladding layer along (a,c) the transverse direction and (b,d) the longitudinal direction.
Metals 13 01484 g018
Figure 19. The surface morphology of the wear scars in different directions: surface of the substrate and cladding layer along (a,c) the transverse direction; (b,d) the longitudinal direction.
Metals 13 01484 g019
Table 1. Chemical composition of H13 substrate and welding wire (wt.%).
H13CrMoSiVMnCPSFe
Substrate5.501.201.200.900.450.400.010.002Bal.
Welding wire4.901.350.940.950.350.370.0070.006Bal.
Table 2. The welding parameters in WAAM.
ParametersValue/Unit
Welding current202 A
Welding speed2.5 mm/s
Wire feed speed125 mm/min
Argon gas flow15 L/min
Cooling time300 s
Overlap coefficient0.55
Table 3. Thermal physical performance parameters of H13 die steel [27].
Temperature20 °C200 °C400 °C600 °C800 °C1000 °C1200 °C1400 °C1600 °C
Density (10−3 g/mm3)7.677.637.577.507.457.397.337.216.85
Specific Heat (10−1 J/g·°C)4.505.736.498.488.437.176.657.758.30
Thermal conductivity (10−2 J/mm·s·°C)1.82.12.12.42.62.83.13.23.4
Young’s Modulus (GPa)20719616014212510790481
Poisson’s ratio (10−3)280290300310320350360380500
Thermal expansion (10−7/°C)117122130133135137139141143
Yield strength (MPa)113084412711510840521
Table 4. Numerical simulation parameters of double ellipsoidal heat source.
Q/(KW)ηa1/(mm)a2/(mm)b/(mm)c/(mm)
2.430.801.663.344.751.20
Disclaimer/Publisher’s Note: The statements, opinions and data contained in all publications are solely those of the individual author(s) and contributor(s) and not of MDPI and/or the editor(s). MDPI and/or the editor(s) disclaim responsibility for any injury to people or property resulting from any ideas, methods, instructions or products referred to in the content.

