Abstract
Computational Fluid Dynamics (CFD) simulations are used in this work to study the dynamic behavior of the melt pool and heat transfer during the single-track laser melting process of a nickel-based superalloy (CMSX-4). To include the effects of powder inhomogeneities and obtain a realistic distribution of the powder layer on the bed chamber, the CFD model is coupled with a Discrete Element Method (DEM) solver. The coupled model is implemented in the open-source software package OpenFOAM. In the CFD model’s governing equations, some key physical mechanisms, such as the Marangoni effect and recoil pressure, are considered. With the help of the coupled CFD-DEM model, we have investigated the effect of key process parameters, such as laser power, scanning speed of the laser, powder size, and powder shape, on the size and homogeneity of the melt pool. From the simulation results, it was discovered that high laser power and slow scanning speed create a deep and narrow keyhole that leads to porosity. In contrast, balling defects are found to be caused by a small melt pool obtained from fast scanning speeds and inadequate laser power.
1. Introduction
Ni-based superalloys are a popular choice in high-temperature applications, such as aerospace and gas turbines, due to their exceptionally high thermal and mechanical stability at temperatures close to melting temperatures [1]. This stability is a result of their complex chemical composition, mainly due to a high concentration of refractory elements such as W, Ta, and Re [2]. Conventional manufacturing routes such as directional solidification result in microstructures with higher primary dendritic arm spacings (PDAS) and stronger solute segregations, which require longer and more complex heat treatment strategies [3]. Metal additive manufacturing (AM), in which components are built layer by layer by melting a metal powder, proves to be a promising alternative, as it involves rapid solidifications resulting in lower PDAS and reduced solute segregations.
AM technologies such as electron beam powder bed fusion (EB-PBF) and laser powder bed fusion (L-PBF) are increasingly being adopted by many industries, especially in the aerospace, energy, automotive, and bio-medical industries. The key advantages of the AM process include design flexibility, short lead times, and the ability to produce complex geometries [4]. In addition to the process-based advantages, AM also offers technological benefits such as finer microstructural length scales and in situ homogenization. However, AM products still suffer from significant defects concerning part quality and reliability [5]. Factors that influence the quality of a printed object include laser power, scanning speed, powder size, and powder shape. These parameters affect the size of the melt pool by altering the energy density delivered to the powder bed. Insufficient or excessive laser energy can lead to major defects, such as porosity or balling [2].
The majority of common defects in the AM process are introduced by the dynamic movement of the melt pool and the solidification of the molten metal. Furthermore, most of these defects appear in microseconds or less, making it practically difficult to track their emergence in experimental setups. Therefore, numerical modeling and simulations are promising tools to help identify the root causes of defects, boost production rates, and enhance product quality.
Currently, numerous simulation models are available to predict melt pool dynamics and heat transfer in powder-bed-based additive manufacturing processes. These numerical models can be broadly divided into mesh-based continuum models, such as Finite Element Models (FEM), the Finite Volume Method (FVM), and discrete mesh-free models such as Lattice Boltzmann (LB), DEM, and Smoothed Particle Hydrodynamics (SPH). A detailed review of these models’ applicability, advantages, and limitations is given in [6]. In general, FEM models are not suitable for PBF process simulation because they treat the powder bed as a continuum. Furthermore, FEM models suffer from mesh distortion, which can lead to convergence errors, resulting in the intermediate termination of computation. Therefore, most of the simulations in AM processes are performed using the Finite Volume Method (FVM)-based CFD method [7]. Bayat et al. [8] presented a CFD model for Ti6Al4V material in L-PBF processes to study the effect of laser power on porosity formation. They demonstrated that when a keyhole develops, a high number of laser rays will be captured in the keyhole depression walls, resulting in numerous reflections that substantially enhance the heat transfer from the laser beam. Le et al. [9] used a CFD model to scan several tracks in the L-PBF process. They investigated two conventional scanning strategies (sequential and boustrophedon). Yan et al. [10] discovered, in 2018, that the parallel interlace pattern is more likely to create porosities after examining the impact of the scanning pattern technique on porosities.
To incorporate powder distribution on the bed chamber, a CFD model requires discrete element method (DEM) simulation. Cao [11] presented several powder distribution techniques in DEM to demonstrate the impact of packing density and powder size on melt pool track dimensions. Yu and Zhao [12] employed a CFD-DEM coupling simulation implemented in OpenFOAM (OpenFOAM Foundation, UK) to understand the movement of powders with the effect of buoyancy force in a multi-layer simulation. Wirth et al. [13] presented the effect of the Marangoni force in detail by implementing the CFD code in OpenFOAM. Furthermore, Phua et al. [14] modeled a multi-layer simulation to investigate the effect of powder spreading on a real surface with roughness. Roehling et al. [15] used large-area scanning to investigate the pulse melting strategy. They demonstrated the melt pool behavior and surface roughness after the process using commercial software ALE3D (Lawrence Livermore National Laboratory (LLNL), Livermore, CA, USA).
Parallel to the development of CFD modeling, significant improvements have been made to other modeling techniques, such as the Lattice Boltzmann method (LBM) [16,17], which has been used to investigate the thermal distribution of the melt pool and its movement. LBM models are particularly useful for simulating complex fluid flows in porous and multiphase media [18]. While LBM has shown promising results in simulating complex fluid flows and transport phenomena, its implementation poses several challenges, which can make it difficult to apply LBM models at the industry level [19]. For instance, the selection of an ideal lattice cell is crucial, as it can affect the accuracy and stability of the simulation. Moreover, extending LBM simulations from 2D to 3D is challenging and requires more computational resources [6]. Nonetheless, Zakirov et al. [20] recently presented an efficient LBM model of the L-PBF process with significantly faster computational time, which has the potential to perform multi-layer and multi-line scanning.
Currently, there is limited literature available on CFD modelling for Ni-based superalloys under AM process conditions. However, some studies have been conducted in this area. Xia et al. [21] used an FVM-based CFD model to investigate the physical mechanisms involved in the densification behavior of Ni-based superalloy IN718 under SLM process conditions. They concluded that the line energy density (LED) plays a crucial role in determining thermal evolutions, bubble migration, and final densification. Similarly, Panwisawas et al. [22] employed a CFD model to examine the relationship between the composition and process of various Ni-based superalloys under L-PBF process conditions. They established a link between alloy composition and thermo-physical property by creating a process map of additive manufacturability based on porosity, cooling rate during solidification, and volatile mass loss. More recently, Lam et al. [23] used a multi-physics-based CFD model to explore the correlation between cracking and anisotropic texture weakening of Ni-based superalloys during the L-PBF process. Their simulation results showed that the texture weakening originates from the non-epitaxial solidification region (NSR) with excessive thermal gradients. Therefore, to better understand the thermal evolution and melt flow dynamics of CMSX-4 material under L-PBF conditions, it is crucial to include all the key physical mechanisms in the numerical modelling.
The primary objective of this study is to investigate the behavior of melt pools and heat transfer during single-track laser melting of Ni-based superalloy CMSX-4. Additionally, this study aims to extend the investigation by understanding the effects of key process parameters, such as beam power, beam scanning speed, and powder morphology on melt pool geometry, heat transfer, and the formation of defects such as porosity and balling.
To achieve these objectives, a coupled CFD-DEM simulation of the single-track laser melting process was employed for CMSX-4 [24,25]. The DEM simulation represents the powder distribution and racking in the bedchamber, while the CFD simulation provides information on melt flow dynamics and heat transfer during melting and solidification. By directly coupling the CFD and DEM models, the influence of process parameters, powder morphology, size, distribution, and packing density [26,27,28] can be studied. The simulation model is based on the work of C. Tang et al. [29,30], which has been validated through experiments to understand the behavior of melt pool dynamics in various metals during the Laser Powder Bed Fusion (L-PBF) process. However, this current study includes the influence of powder morphology, which was not studied by C. Tang et al. [29,30], for the selected material powder of CMSX-4.
The remaining part of the article is structured as follows: Section 2 provides a brief description of the model equations implemented in the OpenFoam software package, as well as the CFD solver algorithm used to solve the coupled pressure and velocity equations. In Section 3, the CFD and DEM simulation set-up is presented. Section 4 presents simulation results, where the impact of key process parameters on thermal evolution and melt pool dynamics during the single-track laser melting process of CMSX-4 powder material are discussed. Finally, Section 5 presents a summary and conclusions of the current study.
2. Model Equations
As mentioned in Section 1, powder distribution on a solid substrate is modeled with the DEM method. The main governing equations are based on conservation of momentum for translation and rotation [31].
In Equation (1), is mass of powder , is linear velocity, and and are nominal and tangential forces on powder from powder . In Equation (2), is momentum of inertia, is angular velocity, and and are tangential and radial momentums for powder .
The CFD simulation is based on the InterFoam solver available on the open-source software OpenFOAM [29]. Due to the complexity of the single-track laser melting process, some assumptions are made to simplify and solve the fluid-flow behavior during single-track leaser melting. These assumptions include neglecting dynamic mobility of particles, treating the solid powder particles as completely solid and devoid of any pores or voids, and the treatment of fluid as laminar, incompressible, and Newtonian. Further, it is assumed that the kinetic viscosity of the liquid and specific heat in the solid and liquid states are independent of temperature and, hence, constant. The dynamic geometry of the free surface between the metal state and the gas is defined by using the VOF approach [32]. The model equations are summarized below.
First, the metallic phase and gaseous phase are defined as being, respectively, and . Where denotes that the control volume cell consists entirely of metal, while denotes that the cell is covered by gas. A temperature-dependent variable gamma is defined as follows, to reflect the solid and liquid states [24]:
Solidus and liquidus temperatures of metal are represented as and . As a result, the material property (such as density or thermal properties) in each cell is obtained from:
, are material properties of the solid and liquid state of the metal, and is the material property of the gaseous phase.
The conservation equation for the volume fraction of metallic phase according to volume of fluid (VOF) is [33] is given by:
The density of the cell is described as the flow velocity is , and is time.
The kinetic motion of the melt pool is obtained from solving the mass, momentum, and energy conservation equations, which are given below. The mass conservation equation is:
The momentum equation (Navier–Stokes equation) is given by [34]:
Acceleration due to gravity is shown as , and is the dynamic viscosity of liquid metal. shows the amount of energy is lost when the area of partially solidified material moves [30].
is permeability coefficient, and is a small constant to avoid division by zero.
When the liquid of metal is at a temperature beyond [35], three interfacial forces of the liquid become dominant. These forces consist of surface tension force , recoil pressure [29] and Marangoni force (or thermo-capillary force) .
In Equation (9), is the surface tension of the liquid metal. In multiphasic simulations of single-track melting, surface tension is usually assumed to be linear and is calculated based on the liquidus temperature of the metal [10].
is the surface tension of metal at liquidus temperature.
The unit normal vector at metal–gas interface and curvature of the metal–gas interface is described as:
In Equation (10), is latent heat of vaporization, is ambient pressure, is evaporation temperature, M is molar mass, and R is universal gas constant.
Equations (9)–(11) show that the Marangoni force is tangential to the curvature of the metal–gas interface and that recoil pressure and surface tension forces are perpendicular to the free surface liquid phase. These three elements have a direct impact on the development of porosities and balling defects.
The Marangoni effect, also known the thermo-capillary effect, is a surface tension gradient-induced mass movement along the fluid–fluid (molten metal and gas) interface. The fluid is moved from an area of high surface tension to one of lower surface tension because higher surface tension moves the fluid more forcefully than lower surface tension. As a result, melt flow is significantly impacted by the Marangoni effect. The gradient of temperature creates the gradient of surface tension. The surface tension of the majority of metals and alloys reduces as temperature rises. However, in some circumstances, the presence of a surface-active element, such as oxygen in iron [36] or sulfur in steel [37], results in an increase in surface tension as the temperature rises.
The inversed Marangoni effect refers to this situation. A shallow melt pool is formed when the slope of the surface tension–temperature relationship has a negative sign, . If the sign is positive, , a deep, narrow melt pool will emerge with an inward movement of liquid [24]. In CMSX-4, is always negative [24].
The energy conservation equation based on specific enthalpy is given by [30]:
Specific enthalpy shows as , is absorption heat from the laser heat source, and is the thermal diffusion coefficient, which is calculated by:
Thermal conductivity and specific heat are and .
The heat loss term in equation 15 consists of radiation heat loss , evaporation heat loss [30], and convection heat loss , which are described as follows:
In Equation (17), , , and are, respectively, the Stefan Boltzmann constant, emissivity, and ambient temperature. In Equation (18), is the latent heat of evaporation, is the universal gas constant, is the molar mass of metal, is the boiling temperature, and is the ambient pressure. The in Equation (19) is the convection coefficient.
The temperature is described by enthalpy as:
In Equation (20), , are the specific heats of the solid and liquid states of metal, and is the latent heat of melting. Enthalpy at room temperature is set to 0.
The power intensity for the laser beam (I) is assumed to be a Gaussian distribution.
The energy input is determined by the intensity of the laser beam () [30].
CFD Solver Algorithm
A numerical approach is needed to resolve the coupled pressure–momentum system in order to solve the Naiver–Stokes equation. PIMPLE (Pressure Implicit Method of Pressure Linked Equations), which combines the PISO and SIMPLE algorithms, is the pressure–momentum coupling method employed in this work. A dynamic time step based on the Courant number or CFL number is used by the algorithm [38].
The Courant number in Equation (21) depends on , the time step, , the volume size of the cell, and , the face volumetric flux. During the simulation, the Courant number should be always smaller than ; if it exceeds from maximum value due to a change of fluid velocity, the is updated in the next time step.
3. Simulation Setup
3.1. DEM Simulation
The powder bed is generated using LIGGGHTS version 3.8.0 (DCS Computing GmbH, Linz, Austria) [39], which is an open-source software package based on DEM. A powder bed STL file with dimensions of is imported into LIGGGHTS. The thickness of the powder layer ( in the Figure 1) can be varied with various simulation settings. A random cloud of powder is generated within the DEM calculation area, and gravity allows the powder to fall freely on the top surface. The blade then removes the top layer of powder. The blade is rigid and moves at a constant speed of . The boundary walls and the blade are imported into the simulation code as STL files.
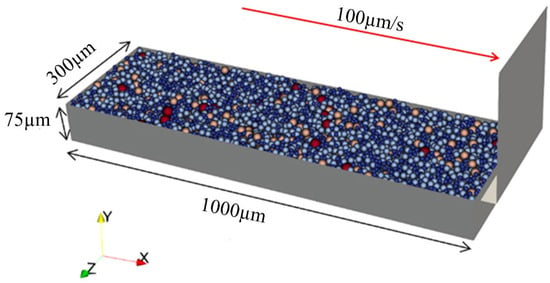
Figure 1.
Generation of powder bed by first allowing the random cloud of powder particles to settle down on the substrate and then removing extra layers of powders.
A Gaussian distribution is used to create the powder size, and the morphology is either spherical or multi-spherical. According to Figure 2A, powders in the multi-spherical model can have satellite or joint powders. Powders with joints linking two or three particles have the same size. Powder with satellites is a powder with a large size to which a smaller powder is attached. The ratio between a powder and its satellite is arbitrary.
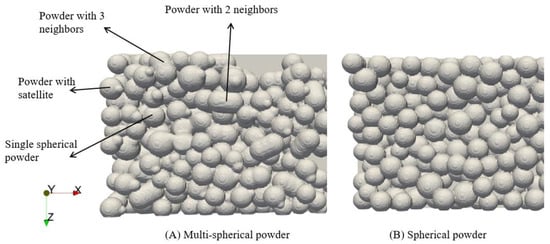
Figure 2.
Top view of powder layers with (A) multi-spherical and (B) spherical powders.
3.2. CFD Simulation Setup
The 3D computational domain in CFD simulation is The domain consists of powder layer of to in thickness, a solid substrate of thickness, and the remaining area is filled with gas domain. The laser starts scanning continuously along x-direction with a constant velocity. The scan length is set to . The simulation’s domain is shown in Figure 3. The red arrow represents the scanning direction. The boundary condition is “zero gradient” that sets the boundary value to the nearest wall cells.
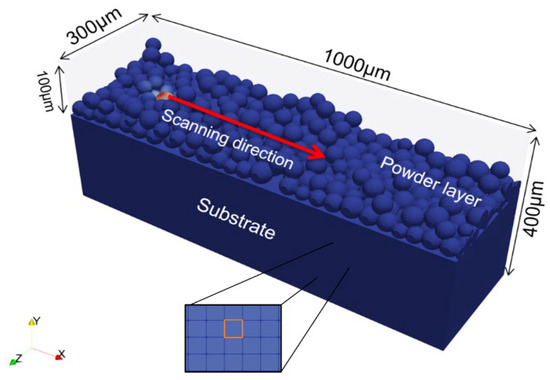
Figure 3.
CFD domain in OpenFOAM with a system size of and a mesh of grid size of . The red arrow represents the direction of laser movement (scanning direction).
The process parameters for CFD simulation are given in Table 1. The material properties, which are obtained from a thermodynamic database, are given in Table 2. The material properties are calculated based on the CMSX-4 composition as given in Reference [40]. Density (), viscosity (), and specific heat () of the metal are considered constant. The heat conductivity (,) and surface tension () are treated as functions of temperature.

Table 1.
Process parameters used for the coupled simulation of the single-track laser melting process.

Table 2.
Material properties of CMSX-4 obtained from a thermodynamic database and the literature.
4. Simulation Results
In Section 4.1, the study focuses on the dynamics of melt pool movement during single-track melting and the insights that can be gained from it. Section 4.1.1, Section 4.1.2 and Section 4.1.3 specifically examine the effects of various process parameters on the size and shape of the melt pool. This information is then used to investigate the occurrence of potential defects, such as balling defects (Section 4.2) and porosity (Section 4.3). The mechanisms behind the formation of these defects are explained in detail.
4.1. Simulation Results Obtained from Single-Track Laser Melting
Figure 4, Figure 5 and Figure 6 display the simulation results obtained for the single pass laser melting process. Figure 4 shows the temperature evolution obtained from the process simulation. Since there is no preheating involved in the procedure, the system start temperature is set to . The laser has a output power, and its scanning speed is . The starting point of the laser is set to . The workpiece is continuously melted across of straight line by a laser traveling at a steady pace.
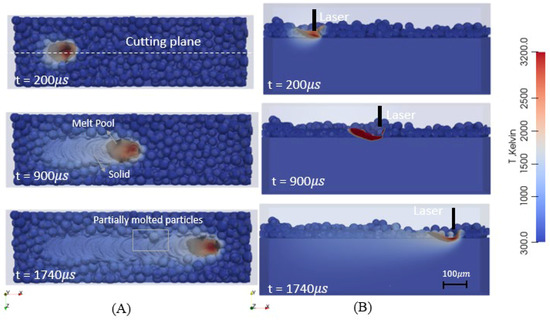
Figure 4.
The evolution of temperature at different time steps obtained from single-track melting. The average radius of powders is 18 μm, and the powder thickness on the laser path is 75 μm. (A) Top views at t = 200 , , t = 900 , and t = 1740 ; (B) longitude cross-section view at t = 200 , t = 900 , and t = 1740 . The cross-section is across the center of the laser beam as shown in the first figure on (A).
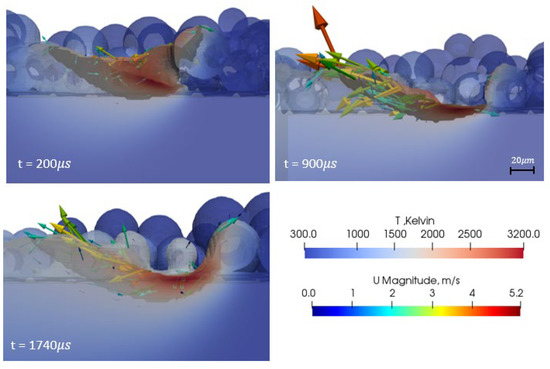
Figure 5.
Enlarged view of melt pool at time steps t = 200 , t = 900 , and t = 1740 . The arrows represent the direction and magnitude of the velocity of the liquid in the melt pool.
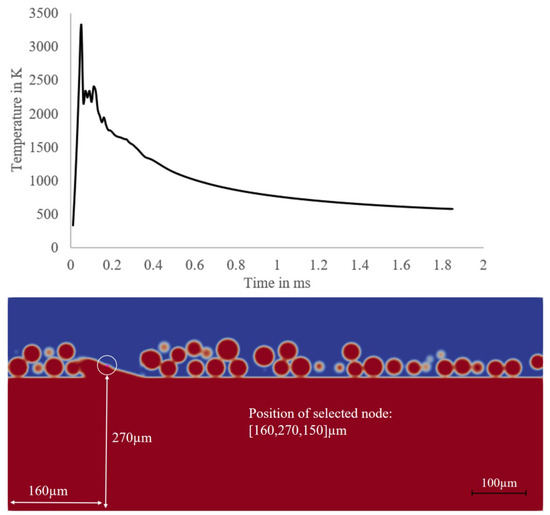
Figure 6.
Temperature evolution of a control volume at a position of [x, y, z] = [160, 270, 150] . The blue region is gaseous phase; the red region is metallic phase.
The metal heats up as a result of the contact between the powder and laser, melting the powder and solid substrate in the process. As seen in Figure 4, the applied laser power is sufficient enough to melt the substrate. The dark cylinder in Figure 4B represents the location of the laser. The melt pool zone, i.e., the area with control volumes having a temperature above liquidus (), is depicted by the grey shadow contour. The assumption of a Gaussian distribution of laser intensity is confirmed by noting that the highest temperature ( is always found at the center of the laser beam. As a result, evaporation and the local recoil pressure at this point are high. Therefore, the primary recoil pressure forces the flowing metal downward and produces a convex profile on top of the workpiece’s free surface. As the laser moves ahead, temperature will decrease and the liquid metal will flow back and fill the convex region.
Figure 5 presents the liquid velocity in the melt pool at various time steps. The surface tension, Marangoni force, and gravity mainly impact the dynamic movement of liquid on the melt pool. In most materials, surface tension and temperature are inversely proportional. Therefore, the temperature gradient leads to a surface tension gradient and eventually creates Marangoni force on the melt pool [29]. According to Figure 5, the temperature on the top free surface of the workpiece falls from the center of the convex zone to the melt pool edge, which causes an increase in surface tension and Marangoni force towards the melt pool edge, resulting in upward flow of the liquid. However, at the lower level of the free surface and towards the melt pool edge, Marangoni force is minimum due to non-significant temperature reduction, and, hence, gravity takes over. As the laser moves to the next location, the cooled liquid fills the melt pool convex region by falling from the top of the convex zone to the center. When the liquid is near the solid portion, the effect of the damping force may be observed at the melt pool edge.
One of the key advantages of the present work is that it can be easily integrated into a multiscale modelling framework to efficiently model the thermal evolution to extract temperature, cooling rate, and thermal gradient at the control volume level, which can act as the thermal boundary conditions for microscopic microstructural models such as phase-filed [41]. Figure 6 displays the temperature of a single chosen control volume at . When the laser is precisely on that location, the metal reaches its maximum temperature (boiling temperature). The temperature reduces to as the laser moves forward, suggesting that the spot is in the steady-state and within the melt pool. The liquid begins to solidify when the temperature drops sharply.
4.1.1. Effect of Laser Power on Melt Pool Morphology
Figure 7 presents the simulated melt pool obtained from a single-track melting process performed with a higher laser power of and a scanning speed of . The powder size and layer thickness are identical to those from the prior simulation. The size of the melt pool grows as the laser power increases, as can be seen by comparing Figure 7 and Figure 4. Because of the increased absorption of laser energy, the laser creates a longer keyhole. In order to prevent balling defects, high laser power is preferred. However, Liu et al. [42] showed that an extremely high laser power might have negative effects on the surface quality. From Figure 8A, one can see that as the laser power increases, the melt pool temperature rises and the metal melts more quickly, which leads to rapid cooling when the laser has passed.
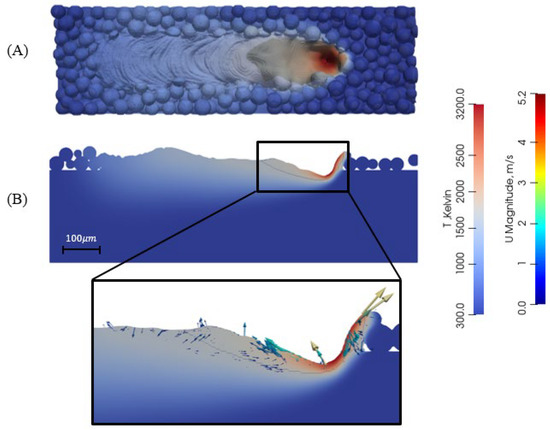
Figure 7.
The Top view (A), and longitude cross-section view (B) of simulation with 18 μm average powder size (Power: 400 W Scanning speed: 0.2 m/s).
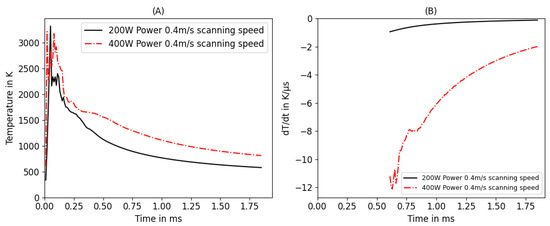
Figure 8.
Effect of laser power on temperature (A) and cooling rate (B). Red curve represents laser power of 400 W while black curve represents a laser power of 200 W. The scanning velocity is kept constant at for both the cases.
4.1.2. Effect of Scanning Speed on Melt Pool Morphology
In L-PBF, a quick scanning speed with no defects is preferred to boost manufacturing output. However, higher scanning speeds have very adverse effects on the build quality [43]. Figure 9 demonstrates how reduced scanning speeds cause the melt pool size to increase as a result of the reduction in absorption laser energy per length. In the meantime, a smaller melt pool intensifies the Marangoni force, and faster-moving liquid metal travels to the melt pool’s lower-temperature areas, increasing its length. In contrast, Figure 9B shows a larger ratio of length to width of the melt pool, which leads to Rayleigh instability and initiates disconnection on the melt pool during scanning [44]. Figure 9 shows that both simulation settings have a same length of molten metal. The Rayleigh effect is seen by the hump development at higher scanning speeds and the steady melt pool track at lower scanning speeds. The generation of the balling defect is projected to occur when scanning speed is increased. Furthermore, a smaller melt pool leads to a faster cooling rate, which can be seen in Figure 10B.
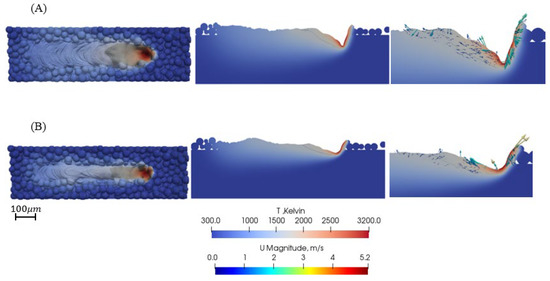
Figure 9.
Top view and longitude cross-section view of simulation with an average powder size of 18 μm and laser power of 400 W; (A) Scanning speed 0.4 m/s, (B) Scanning speed 1 m/s.
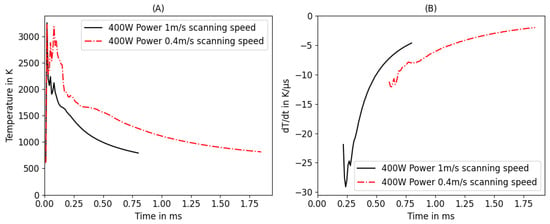
Figure 10.
Comparison of temperature (A) and cooling rate (B) with different scanning speeds. Red curve represents scanning velocity of while black curve represents a scanning velocity of . The laser power is kept constant at 400 W for both the cases.
4.1.3. Effect of Powder Size and Powder Shape
The stability of the melt pool in single-track laser melting is influenced by the size and shape of the powder particles. Due to their increased packing density and less laser energy absorption, smaller particles produce a melt pool track that is more stable and continuous [45]. On the other hand, powder particles of higher diameters lead to a lower packing density and result in increased air gaps between them, which serve as thermal barriers that restrict heat transfer [46]. To understand the effect of powder size on the uniformity of the melt pool track, we extended our simulation to perform a single-track laser melting simulation with reduced powder diameter. Figure 11 shows the morphology of the melt pool track for different powder sizes performed by maintaining the same laser power and scanning speed ( and ). By comparing Figure 11A,B, we can conclude that a smaller particle size increases the melt pool width and length, which leads to the larger melt pool. The effect of the larger melt pool, as discussed in previous section, can also be seen on the slope of the hump on the scanning track [47].
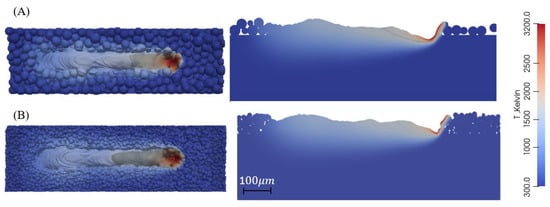
Figure 11.
Top view and longitudinal cross-section view of simulation with different average powder sizes. (A) Average powder radius of 18 µm; (B) Average powder radius of 7 µm.
In addition to the powder size, the powder shape also affects the stability of the melt pool. A single spherical powder particle, powder with joints linking two or three particles, and powder with satellites are the three major types of powder forms that were used in this study (See Figure 2A). The latter two categories can be distinguished by their definition, i.e., in “powders with joints linking two or three particles”, all the powder particles will have the same size. Whereas in “powder with satellites”, a powder with a small size is attached to a powder particle with large size, and the ratio of the sizes is arbitrary. In comparison to powders that solely include spherical particles, powders with a mixture of spherical and multi-spherical particles have a lower packing density and a greater level of powder surface roughness. In contrast to an idealized powder, which would produce a continuous melt pool, this leads to an unstable melt pool with steep humps and elongated gaps [48] (See Figure 12).
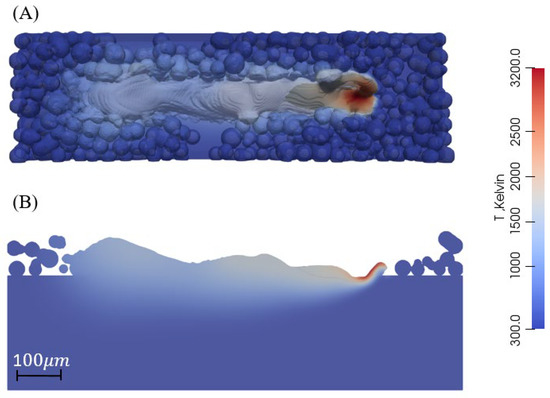
Figure 12.
The Tope view (A) and longitude cross-section view (B) of the simulation with 18 μm average powder size (multi-spherical powder).
Our findings on the effect of powder size and shape agree with the experimental and previous literature studies [49,50]. As reported in [50], higher powder compact densities resulted in a stable and deeper melt pool with a smaller height above the substrate, whereas reduced powder packing density resulted in a lower amount of solid volume available for melting, thereby causing deep melting in the solid substrate.
4.2. Balling Defect
Balling defect is a condition when the molten track cracks and causes spheres to appear on the surface. High surface roughness and the balling defect are related as a secondary source of porosity generation [51]. If the size of the spherical balls is big enough to impede the motion of the roller or blade, it could even compromise the powder-layering procedure [52]. Surface tension and the Marangoni force are the two factors that cause the balling defect to occur. The back of the melt pool develops a unique hump as a result of surface tension pushing the molten metal. Rayleigh’s instabilities develop as the melt pool length to width ratio increases and the surface energy decreases, causing the melt pool to fragment into small islands of molten metal. The instability should begin when the length-to-width ratio is greater than 2.1 [53]. To reduce surface energy, the separated liquid forms sphere-shaped flaws on top of the workpiece surface during solidification.
Surface tension and Marangoni force must be regulated to prevent the balling fault. Marangoni force is influenced by the gradient of surface tension and temperature, as was described in the previous chapter. Faster solidification occurs in smaller melt pools. The Marangoni force is subsequently intensified as a result of the increased temperature gradient. Laser power, scanning speed, and powder size are the three variables that affect the melt pool size. From our studies, we can confirm that low power and high scanning velocity combinations result in predominant balling defect. Figure 13 shows the morphology of the melt track obtained from the chosen process parameters of P = 200 W and v = 0.4 m/s. Due to the lower power intensity and rapid screening, the melt pool reaches a maximum temperature of about 1900 K, thereby resulting in a tiny melt pool, as can be seen in Figure 13.
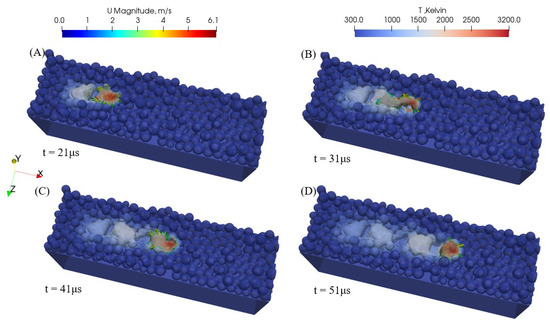
Figure 13.
Evolution of melt pool at different time steps ((A): 21 , (B): 31 , (C): 41 , (D): 51 ) illustrating the formation of the balling defect (laser power: 200 W and scanning speed: 1 m/s).
Another aspect of the balling phenomena in single-track laser melting simulation is shown in Figure 14B. The amount of laser energy absorbed by the workpiece is insufficient to melt the solid substrate. As a result, during the next procedure or post-processing, the molten powder may simply be removed from the surface as it is not bound to the workpiece.
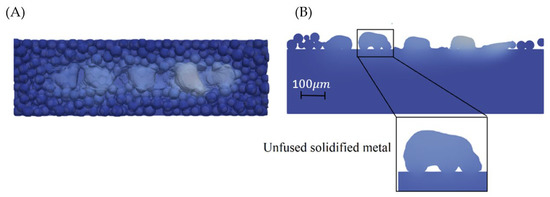
Figure 14.
Top view (A) and longitude (B) cross-section view show the balling defects on workpiece. Some of molten powders are not fused to the solid substrate.
4.3. Porosity Defects
The formation of pores is greatly influenced by the Marangoni force, recoil pressure, and keyhole size. Figure 7 demonstrates how the keyhole length will be extended under the laser process parameters of high power and slow scanning speed. In contrast, porosities are influenced by the keyhole’s diameter. According to Li et al. [52], a smaller and deeper melt pool results from a reduced size of the laser beam. This characteristic increases the possibility of trapping air inside the component and may result in a temperature differential at the keyhole.
Figure 15 presents simulation results obtained for studying the influence of single-track laser melting process parameters on porosity formation. The chosen scanning parameters are 0.4 m/s and 400 W power. The radius of the laser beam is lowered from 35 to 25 m. A powder layer of lower height 30 m and a lower average radius particle size of 7 m is also used to boost the laser’s ability to penetrate solid substrate.
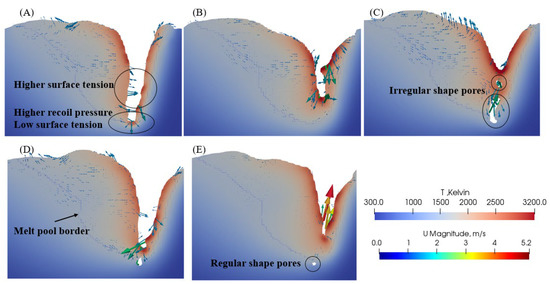
Figure 15.
The formation of pores at different time steps. (A) Formation of long key hole; (B) Closing the key hole; (C) Trapped air bubble inside the melt pool; (D) Movement of the pore to the outside of melt pool; (E) Stable pore outside of the melt pool. Beam diameter: 25 m, scanning speed: 0.4 m/s, and laser power: 400 W.
In Figure 15A, one can see that two temperature-differentiated zones exist in the keyhole. The laser point is located near the bottom of the keyhole, where the temperature is the highest and the surface tension is the lowest. This area experiences higher evaporation than other areas, which increases the rebound pressure in this area. Lower temperature and greater surface tension are present where the temperature is lower in the keyhole. Additionally, a gradient in temperature raises the Marangoni force from the keyhole’s top and bottom to its center. Figure 15A,B show how the combination of these forces causes liquid to start to enclose from the center of the keyhole and trap air within [54]. Eventually, two zones of trapped gas may be seen in Figure 15C. The smaller pore and the majority of the bigger pores are located inside the melt pool; as a result, they disappear with movement of the liquid or laser warming. Inside the solid–liquid phase, as shown in Figure 15D, is the residual pore. The pore progressively assumes a spherical shape to reduce surface energy as a result of hydrostatic pressure inside the pore brought on by trapped gas. However, the influence of scanning speed on pore size is dependent on laser power. The size of the pores may change when the scanning speed is increased [45].
5. Summary and Conclusions
In this study, we performed 3D simulations of thermal evolution and melt pool flow of CMSX-4 under single-track laser melting process conditions using coupled CFD-DEM modelling. From the results presented in Section 4, we can draw following conclusions:
- From the results obtained for the effects of laser power and scanning velocity, we can conclude that the temperature of the melt pool and the resulting cooling rate have a significant impact on the Marangoni force. The magnitude of Marangoni force can be manipulated by varying laser parameters, such as power and scanning rate, which influence the melt pool temperature.
- Absorption energy per length and melt pool temperature is decreased by lowering laser power or, conversely, raising scanning speed. Since the Marangoni effect is stronger and the solidification rate is faster in a smaller melt pool with a lower temperature, a hump with a steep slope eventually forms.
- The simulation results obtained from varying powder size and morphology conclude that the size of the melt pool increases when the size of the powder is reduced. Moreover, the simulation results obtained for different powder sizes and shapes revealed that a powder bed with particles of lower size and higher packing density will have stable and deep melt pool, whereas a powder bed with particles of lower packing density will have deep melting in the substrate due to lower solid material volume. Further, instability in the melt pool may result from variations in powder packing density along the scanning direction. Small-sized particles, however, can mitigate this impact.
- Finally, from the results obtained from the study of the balling effect, we can conclude that there are two potential causes for the balling problem. In the first scenario, an excessive Marangoni force pushes the melt pool to spread out, increasing its length-to-width ratio and triggering Rayleigh’s instability. The second potential cause is insufficient laser energy. As a result, bonding between molten powder and a solid substrate is not possible.
Although the model lacks the ability to provide accurate quantitative predictions, it enhances our understanding of melt pool dynamics during the single-track laser melting process of Ni-based superalloys. Future research will focus on quantitatively validating the simulation model for the CMSX-4 material system and extending the 3D simulations to multi-track laser melting processes to further comprehend melt pool dynamics under more realistic additive manufacturing process conditions.
Author Contributions
Conceptualizations, M.R.A.T. and M.U.; methodology, M.R.A.T., M.U., I.L.-G. and I.S., software, M.R.A.T., and M.U.; formal analysis, M.R.A.T., M.U., I.L.-G. and I.S.; investigation, M.R.A.T., M.U. and I.S.; visualizations, M.R.A.T. and M.U.; supervision, M.U. and I.S.; Project administration, M.U. and I.S.; funding acquisition, I.S. All authors have read and agreed to the published version of the manuscript.
Funding
The research was funded by the Deutsche Forschungsgemeinschaft (DFG) via projects C5, B2, and T4 of the collaborative research center SFB/Transregio 103 ‘From Atoms to Turbine Blades’.
Data Availability Statement
The data presented in this study are available on request from the corresponding author. The data are not publicly available as this is an ongoing study.
Acknowledgments
We are thankful to Tang Chao for his assistance and support in the implementation model equations in OpenFOAM. We are also thankful for the supervision and guidance of Ing. Jan T. Sehrt.
Conflicts of Interest
The authors declare that they have no competing interest.
References
- Lopez-Galilea, I.; Ruttert, B.; He, J.; Hammerschmidt, T.; Drautz, R.; Gault, B.; Theisen, W. Additive manufacturing of CMSX-4 Ni-base superalloy by selective laser melting: Influence of processing parameters and heat treatment. Addit. Manuf. 2019, 30, 100874. [Google Scholar] [CrossRef]
- King, W.E.; Amderson, A.T.; Ferenzch, R.M.; Hodge, N.E.; Kamathc Kheirollah, S.A.; Rubenchik, A.M. Laser powder bed fusion additive manufacturing of metals; physics, computational, and materials challenges. Phys. Comput. Mater. Chall. 2015, 2, 041304. [Google Scholar] [CrossRef]
- Ramsperger, M.; Singer, R.F.; Körner, C. Microstructure of the Nickel-Base Superalloy CMSX-4 Fabricated by Selective Electron Beam Melting. Metall. Mater. Trans. A 2016, 47, 1469–1480. [Google Scholar] [CrossRef]
- Markl, M. Multiscale Modeling of Powder Bed–Based Additive Manufacturing. Annu. Rev. Mater. Res. 2016, 46, 93–123. [Google Scholar] [CrossRef]
- Frazier, W.E. Metal Additive Manufacturing: A Review. J. Mater. Eng. Perform. 2014, 23, 1917–1928. [Google Scholar] [CrossRef]
- Soundararajan, B.; Sofia, D.; Barletta, D.; Poletto, M. Review on modeling techniques for powder bed fusion processes based on physical principles. Addit. Manuf. 2021, 47, 102336. [Google Scholar] [CrossRef]
- Petter, S.C.; Anthony, B.M. Simulation of melt pool behaviour during additive manufacturing: Underlying physics and progress. Addit. Manuf. 2020, 30, 100909. [Google Scholar] [CrossRef]
- Bayat, M.; Thanki, A.; Mohanty, S.; Witvrouw, A.; Yang, S.; Thorborg, J.; Tiedje, N.S.; Hattel, J.H. Keyhole-induced porosities in Laser-based Powder Bed Fusion (L-PBF) of Ti6Al4V: High-fidelity modelling and experimental validation. Addit. Manuf. 2019, 30, 100835. [Google Scholar] [CrossRef]
- Le, K.Q.; Tang, C.; Wong, C.H. A Study on the Influence of Scanning Strategies on the Levelness of the Melt Track in Selective Laser Melting Process of Stainless Steel Powder. JOM J. Miner. Met. Mater. Soc. 2018, 70, 2082–2087. [Google Scholar] [CrossRef]
- Yan, W.; Qian, Y.; Ge, W.; Lin, S.; Liu, W.K.; Lin, F.; Wagner, G.J. Meso-scale modeling of multiple-layer fabrication process in Selective Electron Beam Melting: Inter-layer/track voids formation. Mater. Des. 2018, 141, 210–219. [Google Scholar] [CrossRef]
- Liu, C. Study on the numerical simulation of laying powder for the selective laser melting process. Int. J. Adv. Manuf. Technol. 2019, 105, 2253–2269. [Google Scholar]
- Yu, T.; Zhao, J. Semi-coupled resolved CFD–DEM simulation of powder-based selective laser melting for additive manufacturing. Comput. Methods Appl. Mech. Eng. 2021, 377, 113707. [Google Scholar] [CrossRef]
- Wirth, F.; Tonn, T.; Schöberl, M.; Hermann, S.; Birkhofer, H.; Ploshikhin, V. Implementation of the Marangoni effect in an open-source software environment and the influence of surface tension modeling in the mushy region in laser powder bed fusion (LPBF). Mater. Sci. Eng. 2022, 30, 034001. [Google Scholar] [CrossRef]
- Phua, A.; Cook, P.S.; Davies, C.H.; Delaney, G.W. Powder spreading over realistic laser melted surfaces in metal additive manufacturing. Addit. Manuf. Lett. 2022, 3, 100039. [Google Scholar] [CrossRef]
- Roehling, J.D.; Khairallah, S.A.; Shen, Y.; Bayramian, A.; Boley, C.D.; Rubenchik, A.M.; DeMuth, J.; Duanmu, N.; Matthews, M.J. Physics of large-area pulsed laser powder bed fusion. Addit. Manuf. 2021, 46, 102186. [Google Scholar] [CrossRef]
- Klassen, A.; Scharowsky, T.; Körner, C. Evaporation model for beam based additive manufacturing using free surface lattice Boltzmann methods. J. Phys. D Appl. Phys. 2014, 47, 275303. [Google Scholar] [CrossRef]
- Körner, C.; Attar, E.; Heinl, P. Mesoscopic simulation of selective beam melting processes. J. Mater. Process. Technol. 2011, 211, 978–987. [Google Scholar] [CrossRef]
- Körner, C.; Markl, M.; Koepf, J.A. Modeling and Simulation of Microstructure Evolution for Additive Manufacturing of Metals: A Critical Review. Metall. Mater. Trans. A 2020, 51, 4970–4983. [Google Scholar] [CrossRef]
- Guo, Z.; Chang, S. Lattice Boltzmann Method and Its Applications in Engineering. Adv. Comput. Fluid Dyn. 2013, 3, 420. [Google Scholar]
- Zakirov, A.; Belousov, S.; Bogdanova, M.; Korneev, B.; Stepanov, A.; Perepelkina, A.; Levchenko, V.; Meshkov, A.; Potapkin, B. Predictive modeling of laser and electron beam powder bed fusion additive manufacturing of metals at the mesoscale. Addit. Manuf. 2020, 35, 10123. [Google Scholar] [CrossRef]
- Xia, M.; Gu, D.; Yu, G.; Dai, D.; Chen, H.; Shi, Q. Selective laser melting 3D printing of Ni-based superalloy: Understanding thermodynamic mechanisms. Sci. Bull. 2016, 61, 1013–1022. [Google Scholar] [CrossRef]
- Panwisawas, C.; Gong, Y.; Tang, Y.T.; Reed, R.C.; Shinjo, J. Additive manufacturability of superalloys: Process-induced porosity, cooling rate and metal vapour. Addit. Manuf. 2021, 47, 102339. [Google Scholar] [CrossRef]
- Lam, M.C.; Lim, S.C.; Song, H.; Zhu, Y.; Wu, X.; Huang, A. Scanning strategy induced cracking and anisotropic weakening in grain texture of additively manufactured superalloys. Addit. Manuf. 2022, 52, 102660. [Google Scholar] [CrossRef]
- Ricci, E.; Giuranno, D.; Novakovic, R.; Matsushita, T.; Seetharaman, S.; Brooks, R.; Chapman, L.A.; Quested, P.N. Density, surface tension, and viscosity of CMSX-4® superalloy. Int. J. Thermophys. 2007, 28, 1304–1321. [Google Scholar] [CrossRef]
- Harris, K.; Erickson, G.L.; Sikkenga, S.L.; Brentnall, W.D.; Aurrecoechea, J.M.; Kubarych, K.G. Development of two rhenium- containing superalloys for single- crystal blade and directionally solidified vane applications in advanced turbine engines. J. Mater. Eng. Perform. 1993, 2, 481–487. [Google Scholar] [CrossRef]
- Rai, A.; Markl, M.; Körner, C. A coupled Cellular Automaton–Lattice Boltzmann model for grain structure simulation during additive manufacturing. Comput. Mater. Sci. 2016, 124, 37–48. [Google Scholar] [CrossRef]
- Zinovieva, O.; Romanova, V.; Zinoviev, A.; Nekhorosheva, O.; Balokhonov, R. Elastic properties of additively manufactured steel produced with different scan strategies. Int. J. Mech. Sci. 2023, 244, 108089. [Google Scholar] [CrossRef]
- Lindroos, M.; Pinomaa, T.; Ammar, K.; Laukkanen, A.; Provatas, N.; Forest, S. Dislocation density in cellular rapid solidification using phase field modeling and crystal plasticity. Int. J. Plast. 2022, 148, 103139. [Google Scholar] [CrossRef]
- Tang, C.; Le, K.Q.; Wong, C.H. Physics of humping formation in laser powder bed fusion. Int. J. Heat Mass Transf. 2020, 149, 119172. [Google Scholar] [CrossRef]
- Tang, C.; Tan, J.L.; Wonga, C.H. A numerical investigation on the physical mechanisms of single track defects in selective laser melting. Int. J. Heat Mass Transf. 2018, 126, 957–968. [Google Scholar] [CrossRef]
- Chouhan, A.; Aggarwal, A.; Kumar, A. Role of melt flow dynamics on track surface morphology in the L-PBF additive manufacturing process. Int. J. Heat Mass Transf. 2021, 178, 121602. [Google Scholar] [CrossRef]
- Hirt, C.W.; Nichols, B.D. Volume of fluid (VOF) method for the dynamics of free boundaries. J. Comput. Phys. 1981, 39, 201–225. [Google Scholar] [CrossRef]
- Rosler, F.; Bruggemann, D. Shell-and-tube type latent heat thermal energy storage: Numerical analysis and comparison with experiments. Heat Mass Transf. 2011, 47, 1027–1033. [Google Scholar] [CrossRef]
- Panwisawas, C.; Qiu, C.; Anderson, M.J.; Sovani, Y.; Turner, R.P.; Attallah, M.M.; Brooks, J.W.; Basoalto, H.C. Mesoscale modelling of selective laser melting: Thermal fluid dynamics and microstructural evolution. Comput. Mater. Sci. 2017, 126, 479–490. [Google Scholar] [CrossRef]
- Bayat, M.; Nadimpalli, V.K.; Pedersen, D.B.; Hattel, J.H. A fundamental investigation of thermo-capillarity in laser powder bed fusion of metals and alloys. Int. J. Heat Mass Transf. 2021, 166, 120766. [Google Scholar] [CrossRef]
- Kumar, S. 10.05—Selective Laser Sintering/Melting. Compr. Mater. Process. 2014, 10, 93–134. [Google Scholar]
- Lee, Y.S.; Nordin, M.; Babu, S.S.; Farson, D.F. Influence of Fluid Convection on Weld Pool Formation in Laser Cladding. Welding 2014, 93, 292–300. [Google Scholar]
- Cerminara, M.; Ongaro, T.E.; Berselli, L.C. A compressible, equilibrium–Eulerian model for volcanic ash plumes. Geosci. Model Dev. 2015, 9, 697–730. [Google Scholar] [CrossRef]
- Kloss, C.; Goniva, C.; Hager, A.; Amberger, S.; Pirker, S. Models, algorithms and validation for opensource DEM and CFD–DEM. Prog. Comput. Fluid Dyn. Int. J. 2012, 12, 140–152. [Google Scholar] [CrossRef]
- Abdul Abas, R.; Hayashi, M.; Seetharaman, S. Thermal Diffusivity Measurements of CMSX-4 Alloy by the Laser-Flash Method. Int. J. Thermophys. 2007, 28, 170–176. [Google Scholar]
- Uddagiri, M.; Shchyglo, O.; Steinbach, I. Phase-Field Study of the History-Effect of Remelted Microstructures on Nucleation During Additive Manufacturing of Ni-Based Superalloys. Metall. Mater. Trans. A 2023, 54, 1825–1842. [Google Scholar] [CrossRef]
- Liu, B.; Wildman, R.; Tuck, C.; Ashcroft, I.; Hague, R. Investigation the effect of particle size distribution on processing parameters optimisation in selective laser melting process. In Proceedings of the 2011 International Solid Freeform Fabrication Symposium, Austin, TX, USA, 8–10 August 2011; pp. 227–238. [Google Scholar]
- Wang, D.; Lv, J.; Wei, X.; Lu, D.; Chen Chen, C. Study on Surface Roughness Improvement of Selective Laser Melted Ti6Al4V Alloy. Crystals 2023, 13, 306. [Google Scholar] [CrossRef]
- Kruth, J.P.; Levy, G.; Klocke, F.; Childs, T.H.C. Consolidation phenomena in laser and powder-bed based layered manufacturing. Manuf. Technol. 2007, 56, 730–759. [Google Scholar] [CrossRef]
- Sun, S.; Brandt, M.; Easton, M.J.L.A.M. 2—Powder bed fusion processes: An overview. In Laser Additive Manufacturing; Elsevier: Amsterdam, The Netherlands, 2017; pp. 55–77. [Google Scholar] [CrossRef]
- Spierings, A.; Levy, G. Comparison of density of stainless steel 316L parts produced with selective laser melting using different powder grades. In Proceedings of the Annual International Solid Freeform Fabrication Symposium, Austin, TX, USA, 3–5 August 2009; pp. 342–353. [Google Scholar]
- Gao, X.; Faria, G.A.; Zhang, W.; Wheeler, K.R. Numerical analysis of non-spherical particle effect on molten pool dynamics in laser-powder bed fusion additive manufacturing. Comput. Mater. Sci. 2020, 179, 109648. [Google Scholar] [CrossRef]
- Tan, J.H.; Wong WL, E.; Dalgarno, K.W. An overview of powder granulometry on feedstock and part performance in the selective laser melting process. Addit. Manuf. 2017, 18, 228–255. [Google Scholar] [CrossRef]
- Sanchez, S.; Smith, P.; Xu, Z.; Gaspard, G.; Hyde, C.J.; Wits, W.W.; Ashcroft, I.A.; Chen, H.; Clare, A.T. Powder Bed Fusion of nickel-based superalloys: A review. Int. J. Mach. Tools Manuf. 2021, 165, 103729. [Google Scholar] [CrossRef]
- Cheng, B.; Li, X.; Tuffile, C.; Ilin, A.; Willeck, H.; Hartel, U. Multi-physics modeling of single track scanning in selective laser melting: Powder compaction effect. In Proceedings of the 2018 International Solid Freeform Fabrication Symposium, Austin, TX, USA, 13–15 August 2018. [Google Scholar]
- Khairallah, S.A.; Anderson, A. Mesoscopic simulation model of selective laser melting of stainless steel powder. J. Mater. Process. Technol. 2014, 214, 2627–2636. [Google Scholar] [CrossRef]
- Li, R.; Liu, J.; Shi, Y.; Wang, L.; Jiang, W. Balling behavior of stainless steel and nickel powder during selective laser melting process. Int. J. Adv. Manuf. Technol. 2012, 59, 1025–1035. [Google Scholar] [CrossRef]
- Kruth, J.P.; Froyen, L.; Van Vaerenbergh, J.; Mercelis, P.; Rombouts, M.; Lauwers, B. Selective laser melting of iron-based powder. J. Mater. Process. Technol. 2004, 149, 616–622. [Google Scholar] [CrossRef]
- Shi, W.; Liu, Y.; Shi, X.; Hou, Y.; Wang, P.; Song, G. Beam Diameter Dependence of Performance in Thick-Layer and High-Power Selective Laser Melting of Ti-6Al-4V. Materials 2018, 11, 1237. [Google Scholar] [CrossRef]
Disclaimer/Publisher’s Note: The statements, opinions and data contained in all publications are solely those of the individual author(s) and contributor(s) and not of MDPI and/or the editor(s). MDPI and/or the editor(s) disclaim responsibility for any injury to people or property resulting from any ideas, methods, instructions or products referred to in the content. |
© 2023 by the authors. Licensee MDPI, Basel, Switzerland. This article is an open access article distributed under the terms and conditions of the Creative Commons Attribution (CC BY) license (https://creativecommons.org/licenses/by/4.0/).