Article

Crystallization of Zr-Based Amorphous Alloys in Laser Welding

1
School of Health Science and Engineering, University of Shanghai for Science and Technology, Shanghai 200093, China
2
Institute of Manufacturing Technology, Guangdong University of Technology, Guangzhou 510006, China
*
Author to whom correspondence should be addressed.
Metals 2023, 13(7), 1283; https://doi.org/10.3390/met13071283
Submission received: 14 June 2023 / Revised: 3 July 2023 / Accepted: 13 July 2023 / Published: 17 July 2023
(This article belongs to the Special Issue Advanced Biomedical Materials (2nd Edition))

Abstract

:
Crystallization often occurs in the laser welding of amorphous alloys, reducing the properties of amorphous alloys. Therefore, the research in this thesis focuses on the experimental selection of suitable welding parameters to prevent crystallization of Zr-based amorphous alloys during the laser welding process. As such, it is necessary to simulate the temperature field curve of the welding area by computer and then determine the power and laser moving speed of laser welding. In this paper, the temperature field curve of the Zr41.2Ti13.8Cu12.5Ni10Be22.5 (Vit1) amorphous alloy in laser welding is obtained by finite element analysis. The continuous heating curve (CHT) of Vit1 is fitted by the Vogel–Fulcher–Tammann (VFT) equation and the Kissinger equation. If the temperature field curve intersects with the CHT curve, crystallization occurs. The experiment results show that the VFT equation can be used to predict the crystallization of Vit1 better in laser welding. The temperature and welding time are increased by using a low welding speed. Therefore, the temperature of the weld zone cannot fall in time, resulting in the intersection of the temperature field curve and the CHT curve. Thus, crystallization can be avoided if the welding speed is controlled within a reasonable range, and the highest temperature is kept under the CHT curve. The combination of the CHT curve and the temperature field curve shows that the samples at 300 W-3 mm/s and 300 W-6 mm/s welding parameters all undergo crystallization, while the samples at 300 W-9 mm/s and 300 W-12 mm/s welding parameters do not undergo crystallization. Through the flexural test, it is found that the flexural strength of the welded interface is at its the maximum under 300 W-9 mm/s.

1. Introduction

Amorphous alloys, also known as metallic glasses, have a unique arrangement of short-range ordered and long-range disordered atoms and the absence of defects, such as grain boundaries and dislocations [1,2]. Compared with conventional crystalline materials, amorphous alloys have excellent physical properties, chemical properties and biocompatibility, such as high strength, high hardness, high ductility, and good corrosion resistance [3,4]. These properties earn them application potential in the field of medical devices [5,6,7]. For instance, excellent hardness makes it very suitable for use as various surgical blade (scalpel) materials; excellent biocompatibility and corrosion resistance make it suitable for manufacturing implantable orthopedic prostheses; superplasticity makes it very suitable for forming minimally invasive medical devices with small volumes and complex structures. However, the widespread use of amorphous alloys has been limited by their glass-forming ability. At present, amorphous alloys are generally made by rapid cooling. However, this method can only be used to produce samples in the form of thin plates, powder, filaments, and cylinders. It is difficult to produce complicated and precise shapes. In order to break this limitation, researchers have made many efforts [8,9,10], one of which is welding.
Amorphous alloys have been successfully connected by friction welding [11,12], explosive welding [13,14], electron beam welding [15], and laser welding [16,17]. Compared with other welding methods, laser welding has great advantages [18,19]. Laser welding is a method of welding two parts together by using the radiation energy of a laser to bring the temperature of the welded part to the melting point. Because laser welding produces a small spot area, its influence around the weld is also small, and it does not require the filling of other materials during the welding process; thus, laser welding is highly efficient, fast, and the weld surface is continuous and uniform, with few defects such as porosity and cracks, making it ideal for precision welding and micro welding to obtain complex and precise parts [20]. Therefore, in this study, we use laser welding to connect amorphous alloys. Vit1 is one of the Zr-based amorphous alloys with promising applications. It has a large supercooled liquid region and good glass-forming ability. At a heating rate of 30 K/min, the glass-transition temperature of Vit1 is Tg = 633 K, and the crystallization temperature is Tx = 724 K. Vit1 can be made by a low cooling rate (1–100 K/s) [21,22,23]. In this study, we use Vit1 to produce samples.
It is difficult to obtain the temperature field in the welding area by physical means, which means that it is difficult to set welding parameters such as laser moving speed optimally. Therefore, crystallization often occurs during laser welding of amorphous alloy parts, which reduces the mechanical properties of the welded parts [24,25,26]. The purpose of this study is to discover the relationship between the degree of crystallization of amorphous alloys and the speed of the welding laser movement during the welding process. The temperature field in the welding area was simulated by SYSWELD software to preliminarily determine the appropriate moving speed of laser welding. The heating transformation (CHT) curve of Vit1 was obtained using the Vogel–Fulcher–Tammann (VFT) equation and Kissinger equation to predict the crystallization of amorphous alloys under given welding parameters. During laser welding, the temperature field curve should not intersect the CHT curve, otherwise crystallization will occur in the welding area. In this study, we carried out physical experiments to verify the numerical simulation results, and based on this, determined the best fitting equation. We studied the crystallization laws of amorphous alloys through a combination of two means, numerical simulation and physical experiments. The two means verify each other to ensure that the research results reflect the true laws. The results of this study can provide useful references for the welding and forming of amorphous alloy parts.

2. Materials and Methods

2.1. Preparation of Original Specimens

The amorphous alloy used in this paper is Vit1, in which the purity of Zr is 90% (atomic percentage), and the purities of Ti, Cu, Ni and Be are over 99%. The raw materials were mixed proportionally, put into an ultrasonic cleaning machine to remove impurities from the raw materials, dried, and then put into a vacuum induction arc furnace to repeatedly melt the master alloy ingots four times to obtain a uniform mixture of each element. Then, the master alloy ingots are broken to obtain fragmented master alloy pieces. The master alloy pieces are put into the pressure-casting machine for die-casting to obtain amorphous alloy sample strips. Four sample strips can be obtained in one die-casting, with dimensions of 2 × 100 mm × 10 mm × 1 mm³, 1 × 100 mm × 10 mm × 2 mm³, and 1 × 100 mm × 10 mm × 3 mm³, respectively. The sample strips were continued to be cut to obtain the experimental amorphous alloy sample strips with dimensions of 50 mm × 10 mm × 2 mm³ as shown in Figure 1a. In this paper, the sample strip with the size of 50 mm × 10 mm × 2 mm³ is selected for the experiment.

2.2. Detection Method

First of all, the X-ray diffraction (XRD, Rigaku Corporation, Tokyo, Japan) test should be performed on the experimental amorphous alloy samples to ensure that they are amorphous so as not to interfere with the subsequent experiments. The test is mainly divided into two parts: first, to detect whether the welded part is crystallized; second, to detect the mechanical properties of the welded parts. For detecting whether crystallization occurs, scanning electron microscope (SEM, FEI Company, Hillsboro, OR, USA) observation and XRD inspection are mainly used. After welding, the welded parts are cut into small pieces, and the sample was made as shown in Figure 1b. The surface of the sample was then polished to a mirror finish and the microscopic morphology of the welded area was observed with a scanning electron microscope to see if crystallization was produced. Next, XRD testing was performed to determine whether the welded area was crystallized. For mechanical properties, the maximum flexural strength of the welded part was obtained using a three-point bending test to analyze the effect of changes in welding parameters on the flexural strength of the sample.

3. Simulation

3.1. CHT Curve Fitting

The crystallization temperature and the range of the supercooled liquid region are often used to evaluate the stability of amorphous alloys. However, the crystallization temperature and the range of the supercooled liquid region vary with the change in heating rate, so they cannot be used to describe the crystallization process of amorphous alloys. The CHT curve can be used to describe the crystallization of amorphous alloys [27,28,29]. However, the measurement of the CHT curve takes a long time, so it is necessary to find a simple way to fit the CHT curve.
The Kissinger [30,31] equation and the VFT equation [29,32] are often used to study the phase transition of a material. It is convenient to fit the CHT curve by the Kissinger equation and the VFT equation using the characteristic temperature of amorphous alloys. However, for different alloy systems, the fitting ability of the Kissinger equation and the VFT equation are different [32,33]. Therefore, in this section, we use both the Kissinger equation and the VFT equation to fit the CHT curve of Vit1, and then investigate which equation can be used to better predict crystallization through experiments.
Ding et al. [33] obtained the CHT curve of Cu50.3Zr49.7 by the Kissinger equation. It was found that the fitted CHT curve was in good agreement with the experimental data. The dependence of T on heating rate α is described by [28]
ln T 2 α = E RT + C
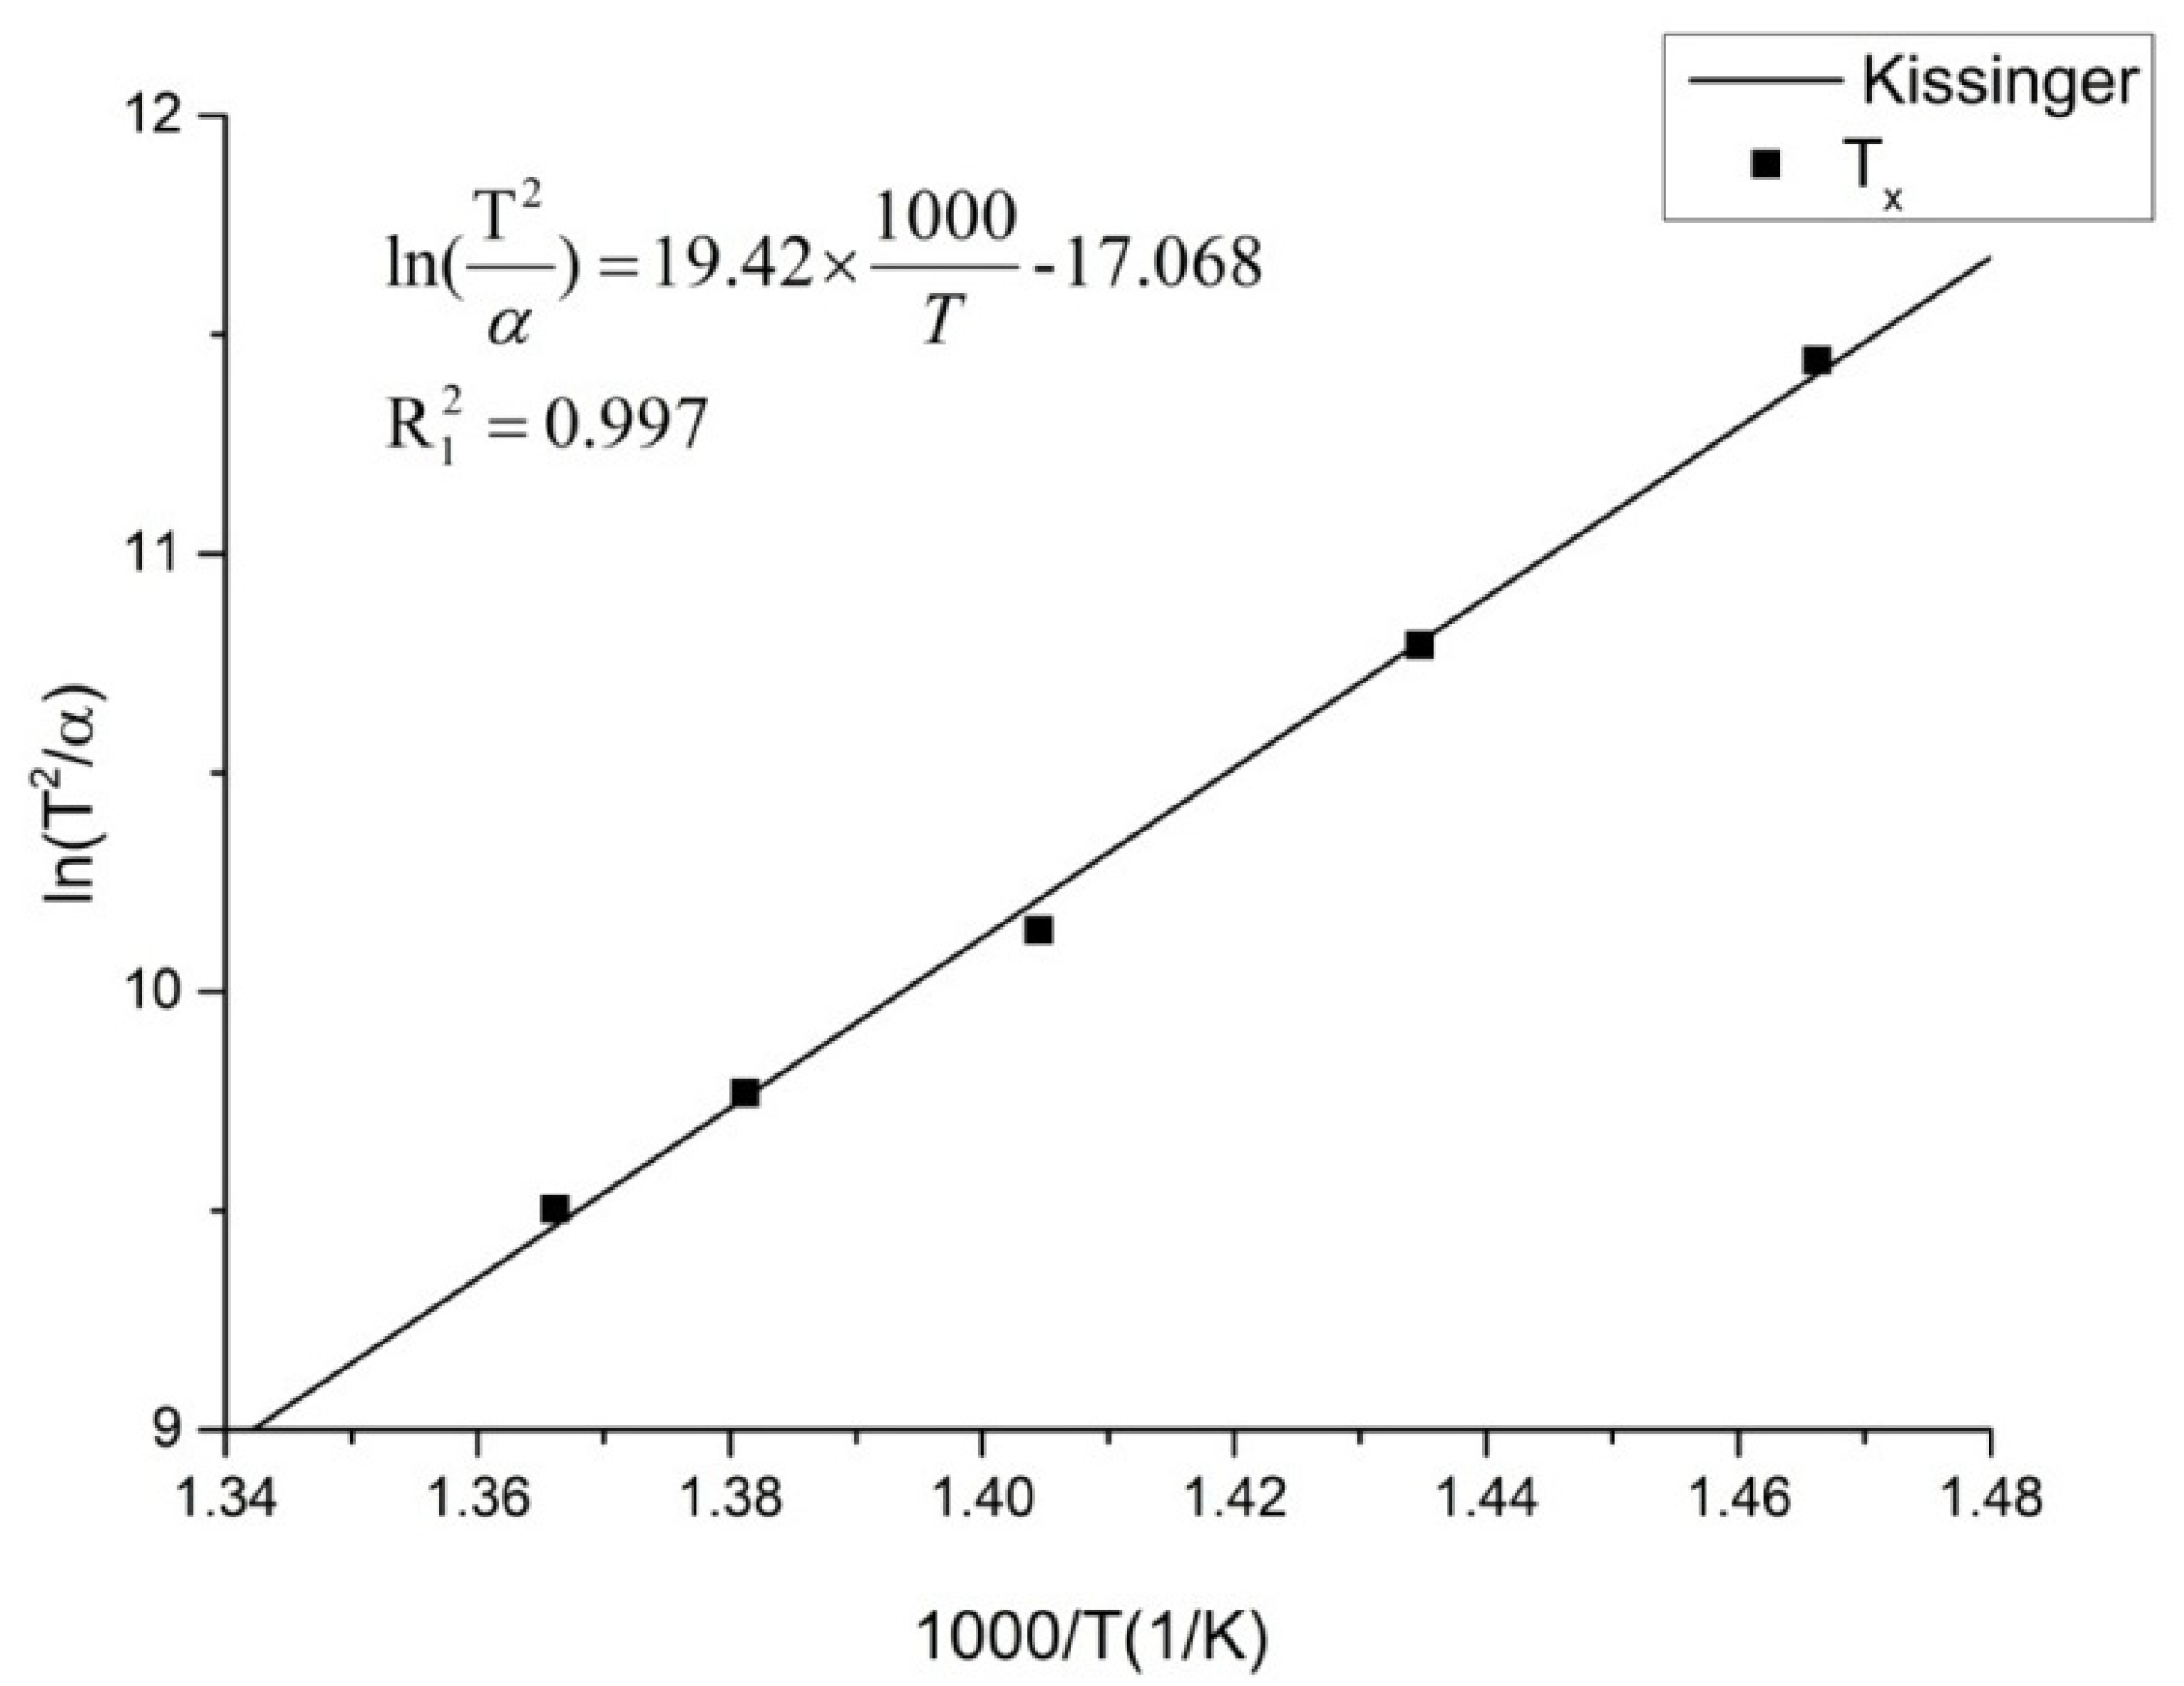
where T is the characteristic temperature, α is the heating rate, R is the gas constant, E is the apparent activation energy, and C is a constant. The Kissinger equation describes the linear relationship between ln(T2/α) and 1/T.
The main characteristic temperatures of Vit1 at different heating rates (5–40 K/min) are shown in Table 1 according to the reference [34], which indicates that the characteristic temperature of Vit1 increases as the heating rate increases. Therefore, we can obtain Kissinger’s linear relationship between ln(T2/α) and 1/T for Tx as follows:
ln T 2 α = 19.42 × 1000 T 17.068
The correlation coefficient R 1 2 = 0.997 indicates that the glass-transition temperature meets the Kissinger fitting well. The fitting line is shown in Figure 2.
Although plotting ln(T2/α) as a function of 1/T enables the estimation of the apparent activation energy E. Some researchers believe that the dependence of T on the heating rate agrees with the nonlinear VFT equation [27,32]:
α = Bexp ( A T 0 T )
where T is the characteristic temperature, α is the heating rate, T0 is the hypothetical value of T at the limit of indefinitely slow cooling and heating rates, and A, B is constant.
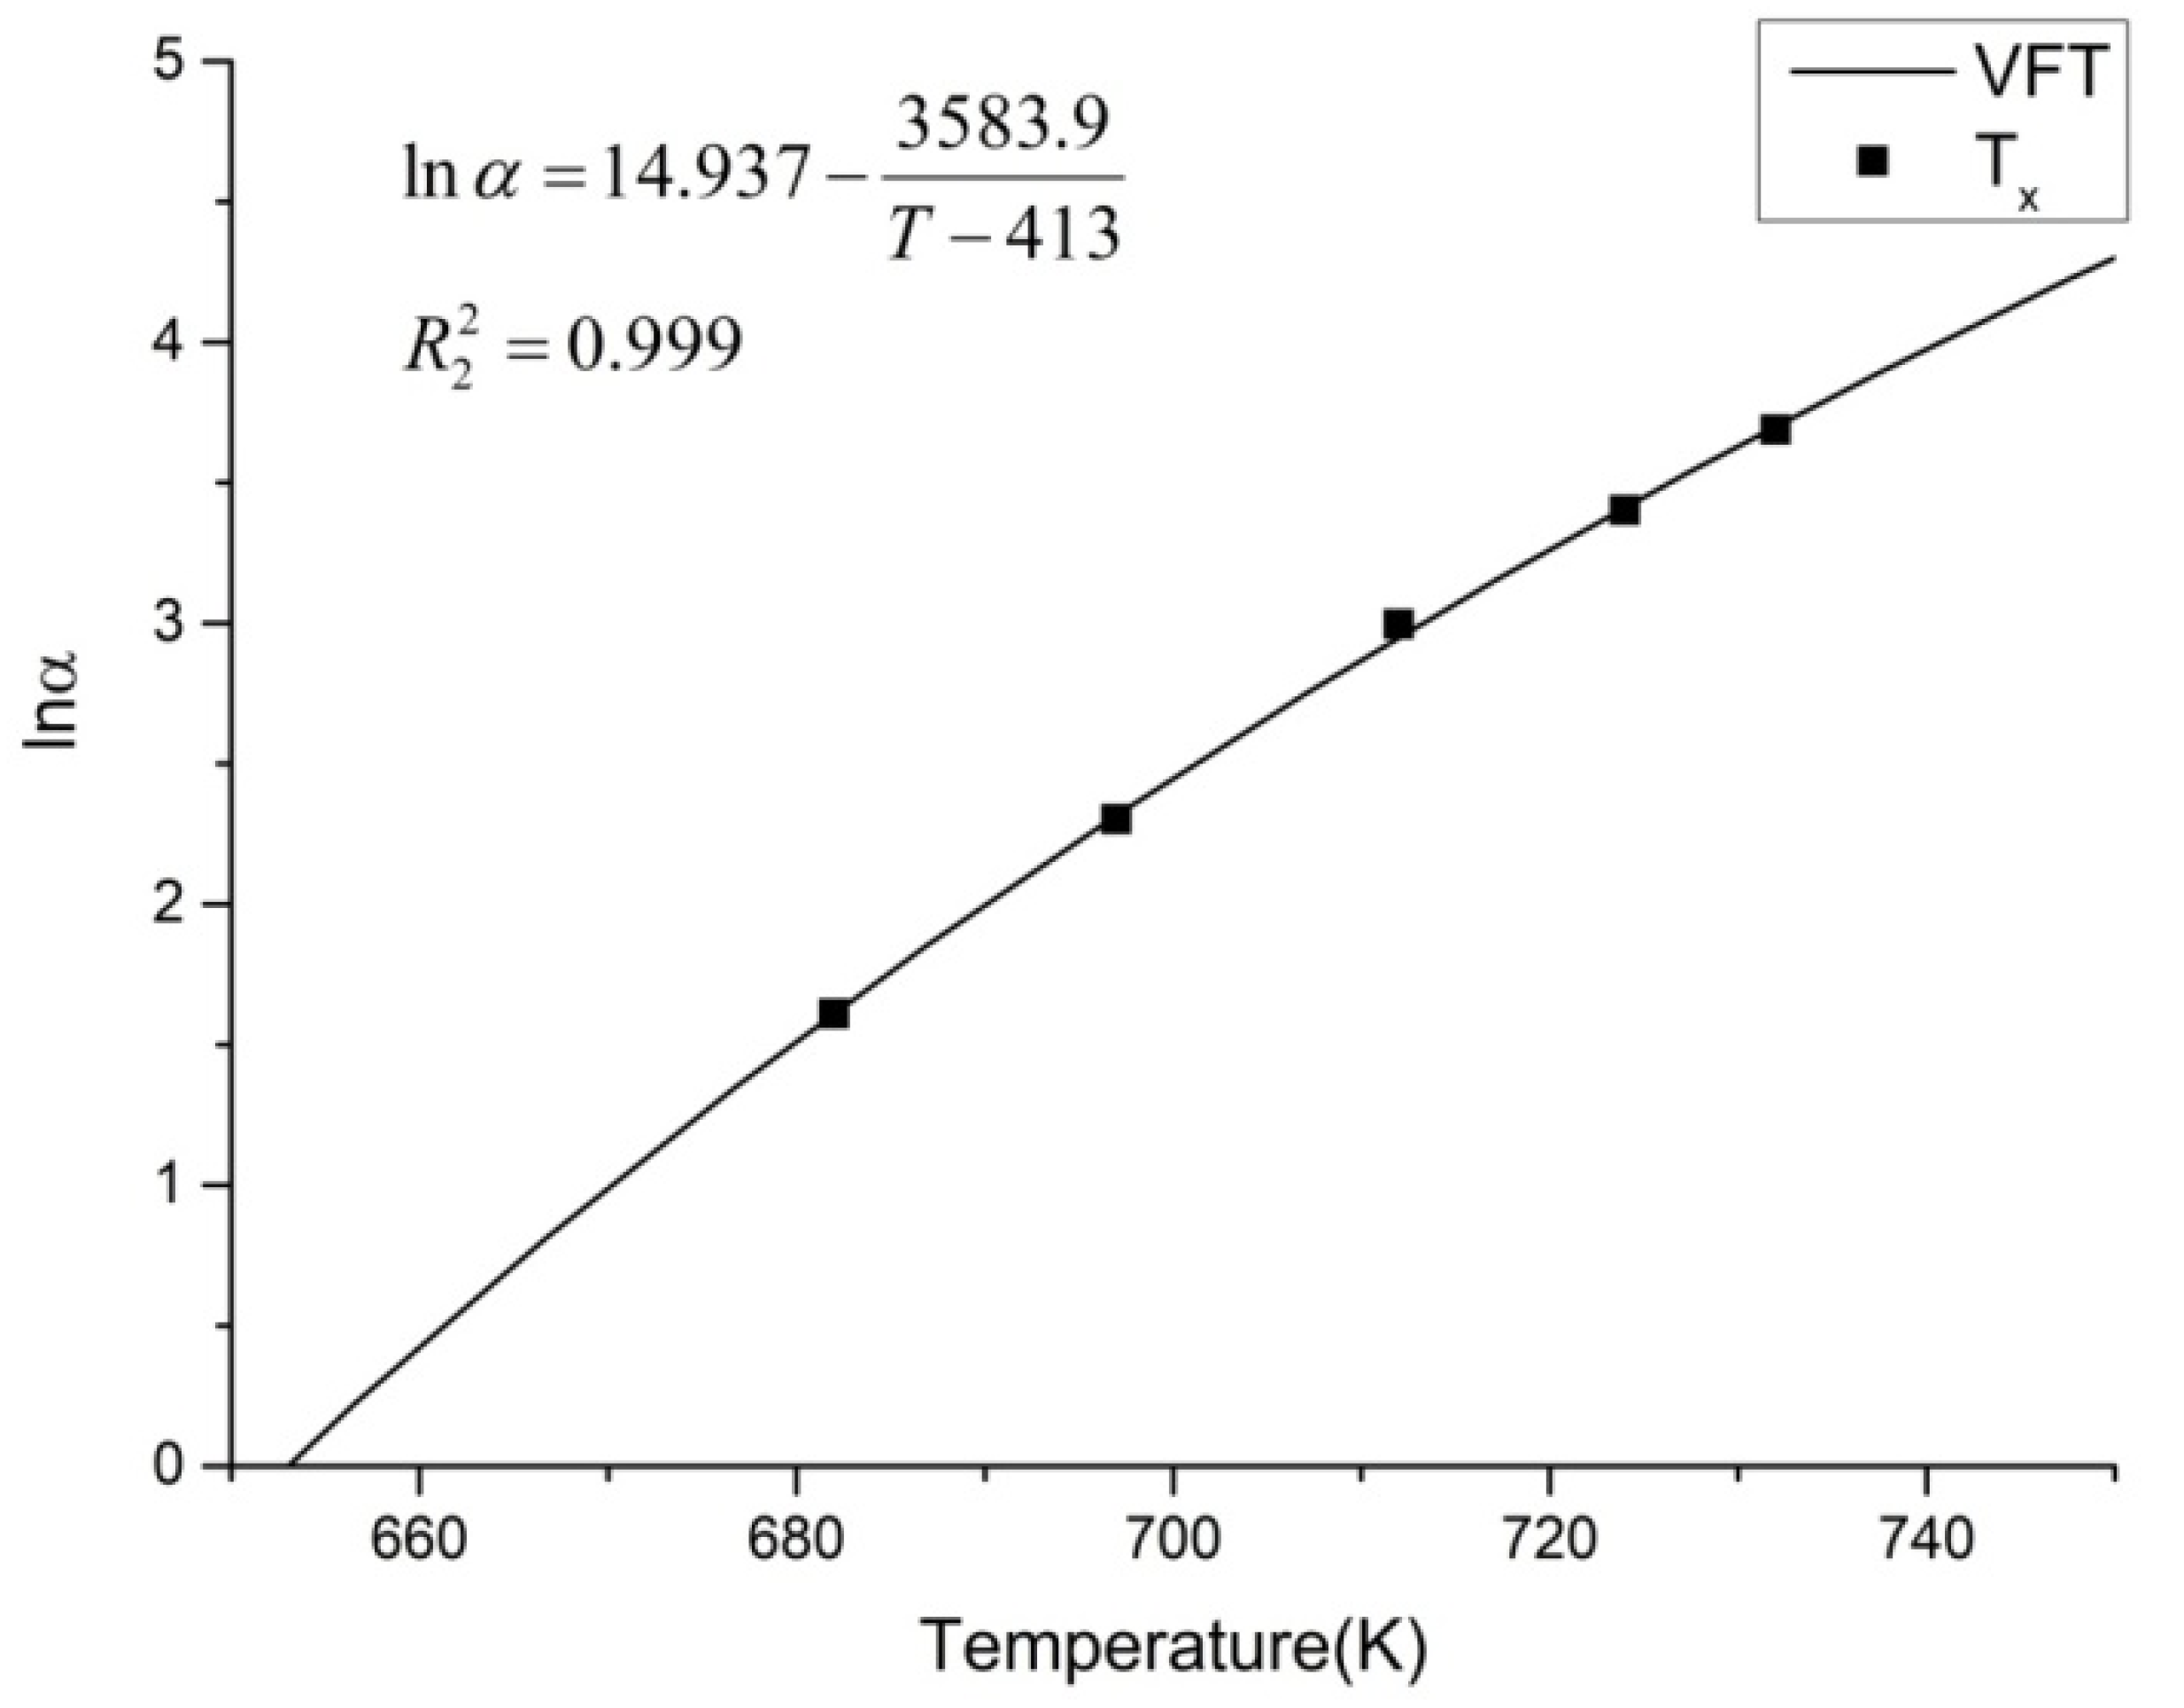
We can obtain VFT’s nonlinear relationship between lnα and T for Tx as follows:
ln α = 14.937 3583.9 T 413
The correlation coefficient R 2 2 = 0.999. The fitting line is shown in Figure 3.
It can be seen that the Tx meets both the Kissinger fitting and the VFT fitting very well at the heating rate of 5–40 K/min. And, the correlation coefficients R 1 2 and R 2 2 are very close.
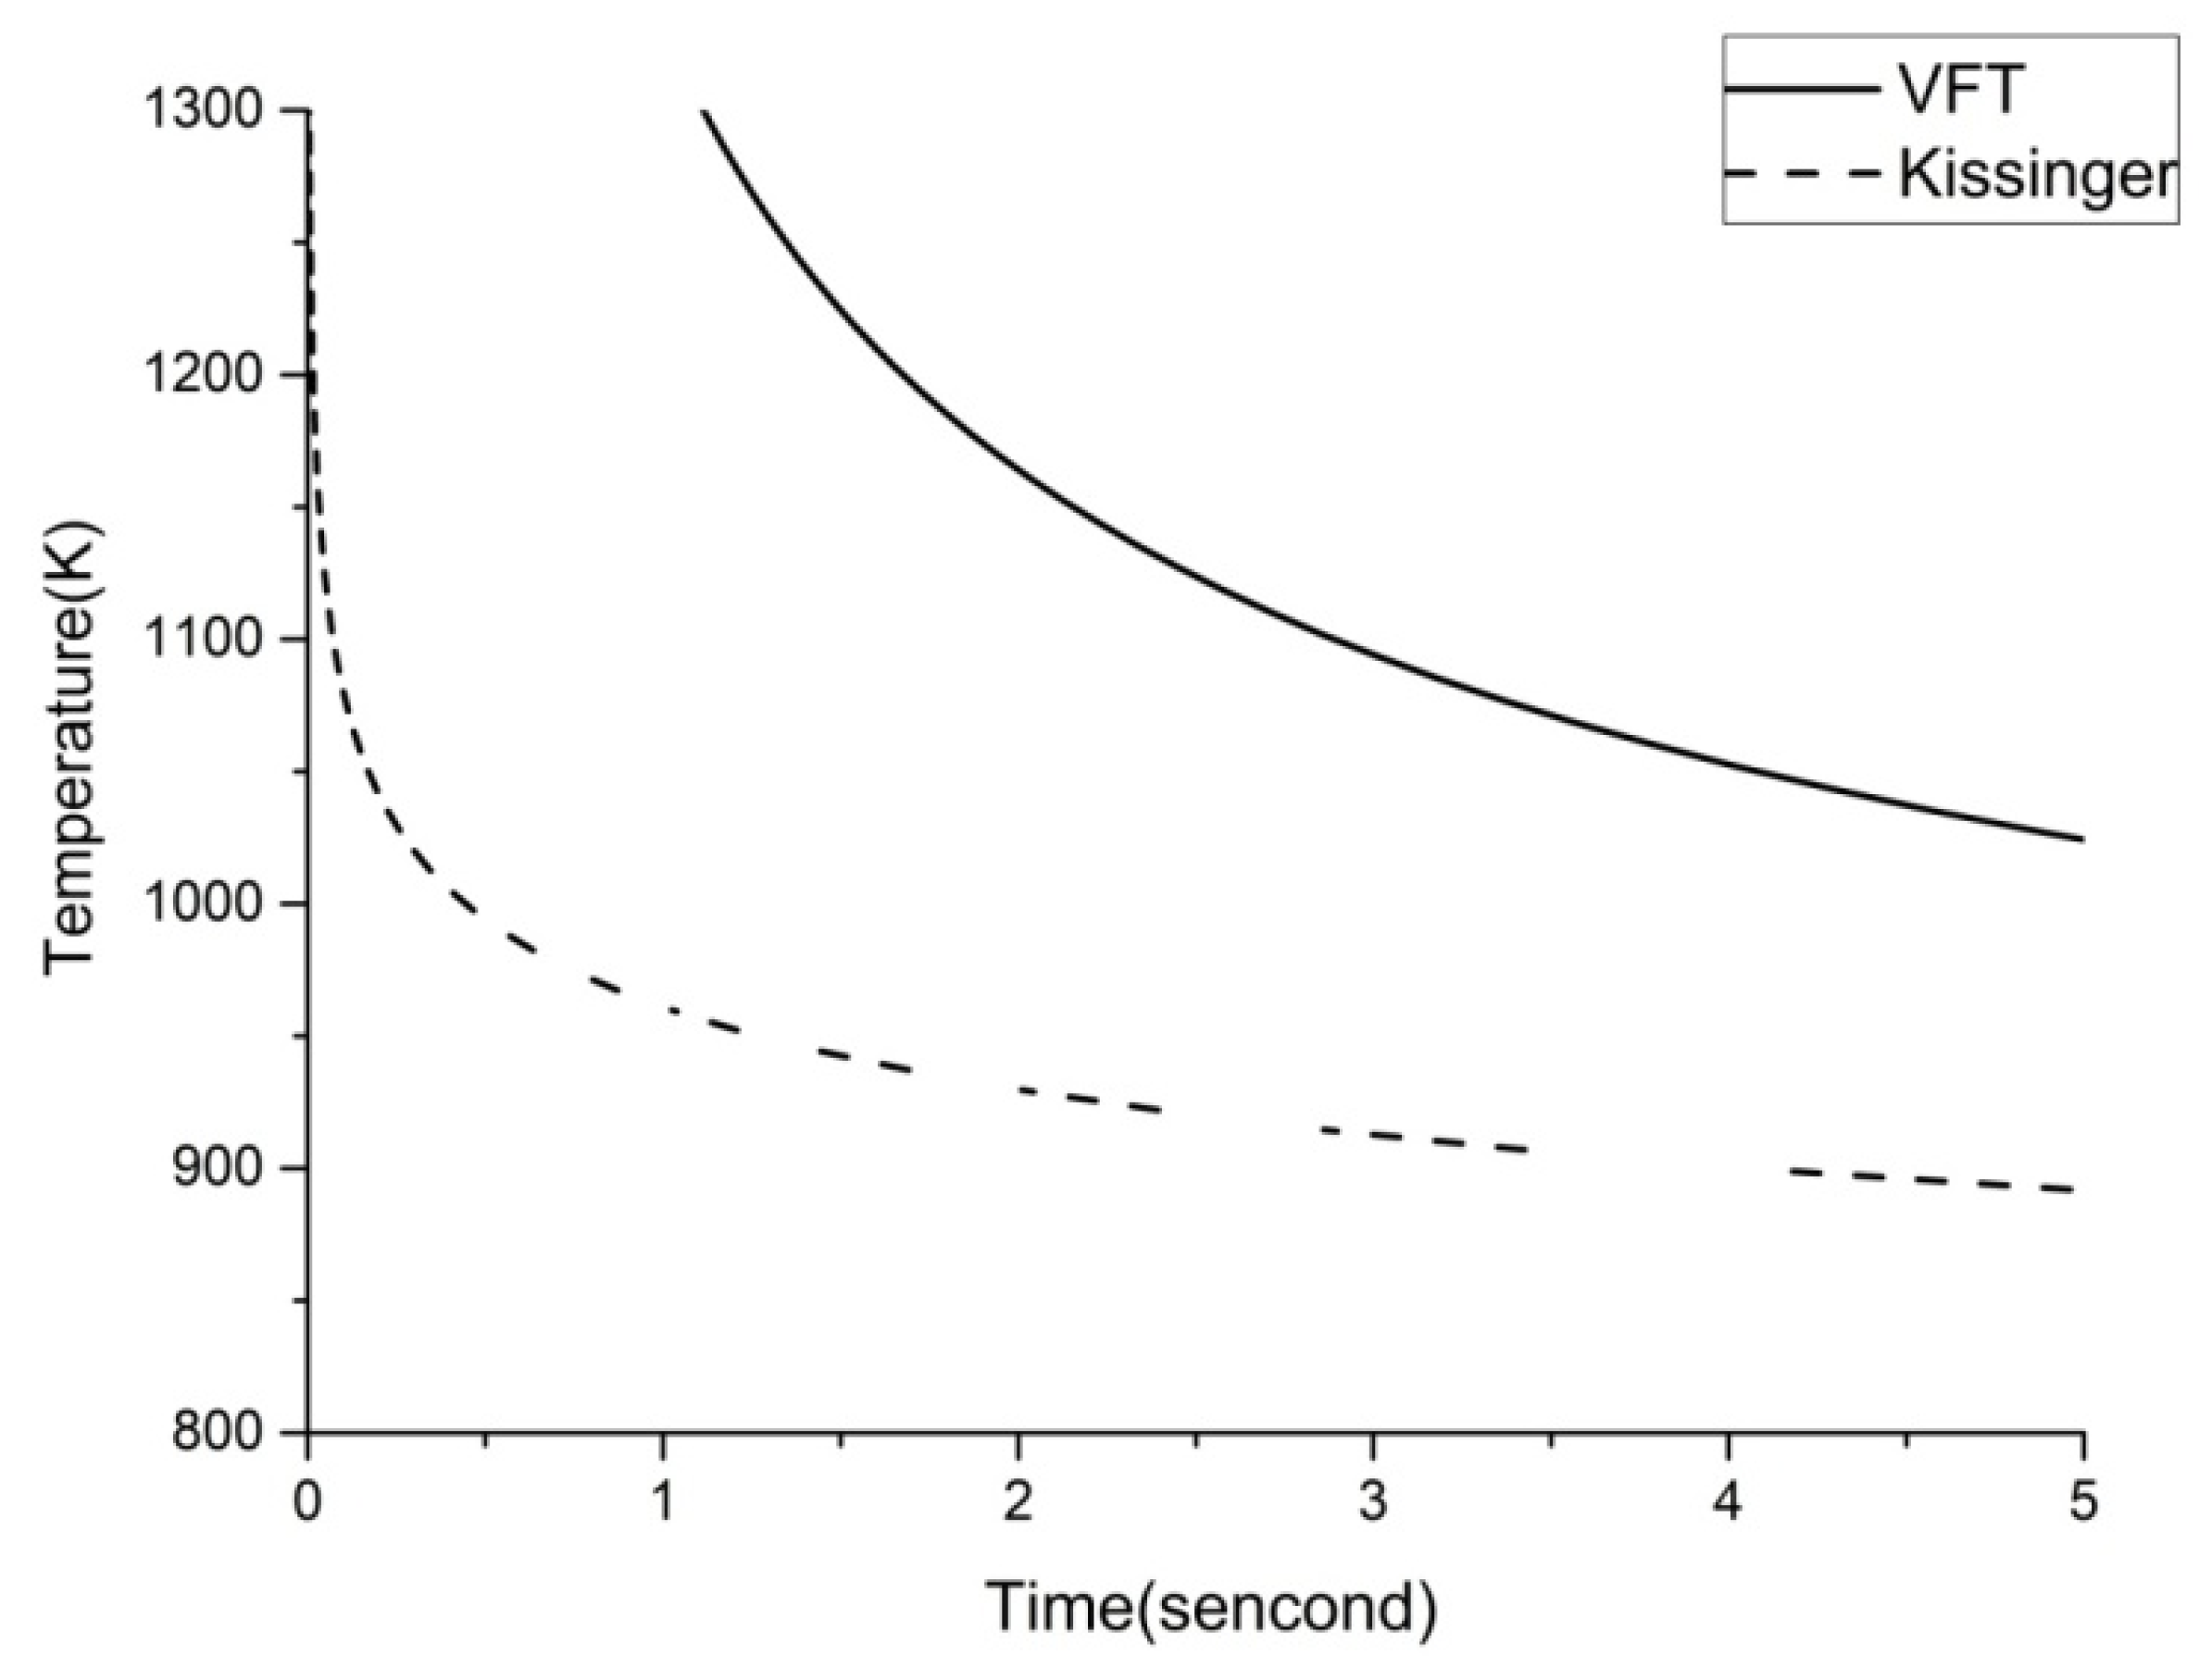
The heating rates can be calculated by (T-293)/t and put into Equations (2) and (4) to construct the CHT curve, as shown in Figure 4.
It can be seen from Figure 4 that the VFT fitting and the Kissinger fitting almost coincide, and the TTT data meets the fittings very well. Thus, there is no significant difference between the VFT equation and the Kissinger equation in the ability of CHT curve fitting of Vit1. In laser welding, the welding speed is high, which leads to a short welding time, no more than one second in one spot. Thus, we reduce the range of time, and the result is shown in Figure 5. It can be seen that the two curves are far apart in the short time interval. Therefore, it is necessary to analyze both the VFT fitting and the Kissinger fitting in laser welding.

3.2. Simulation of Temperature Field

For laser welding, simulating the temperature field in advance can guide the selection of welding parameters and reduce crystallization. We use finite element analysis in this part to simulate the temperature field curve of the welding area with the software SYSWELD (ESI SYSWELD 2019.0, Framatome, France), which has been proven effective in the simulation of the temperature field [26].
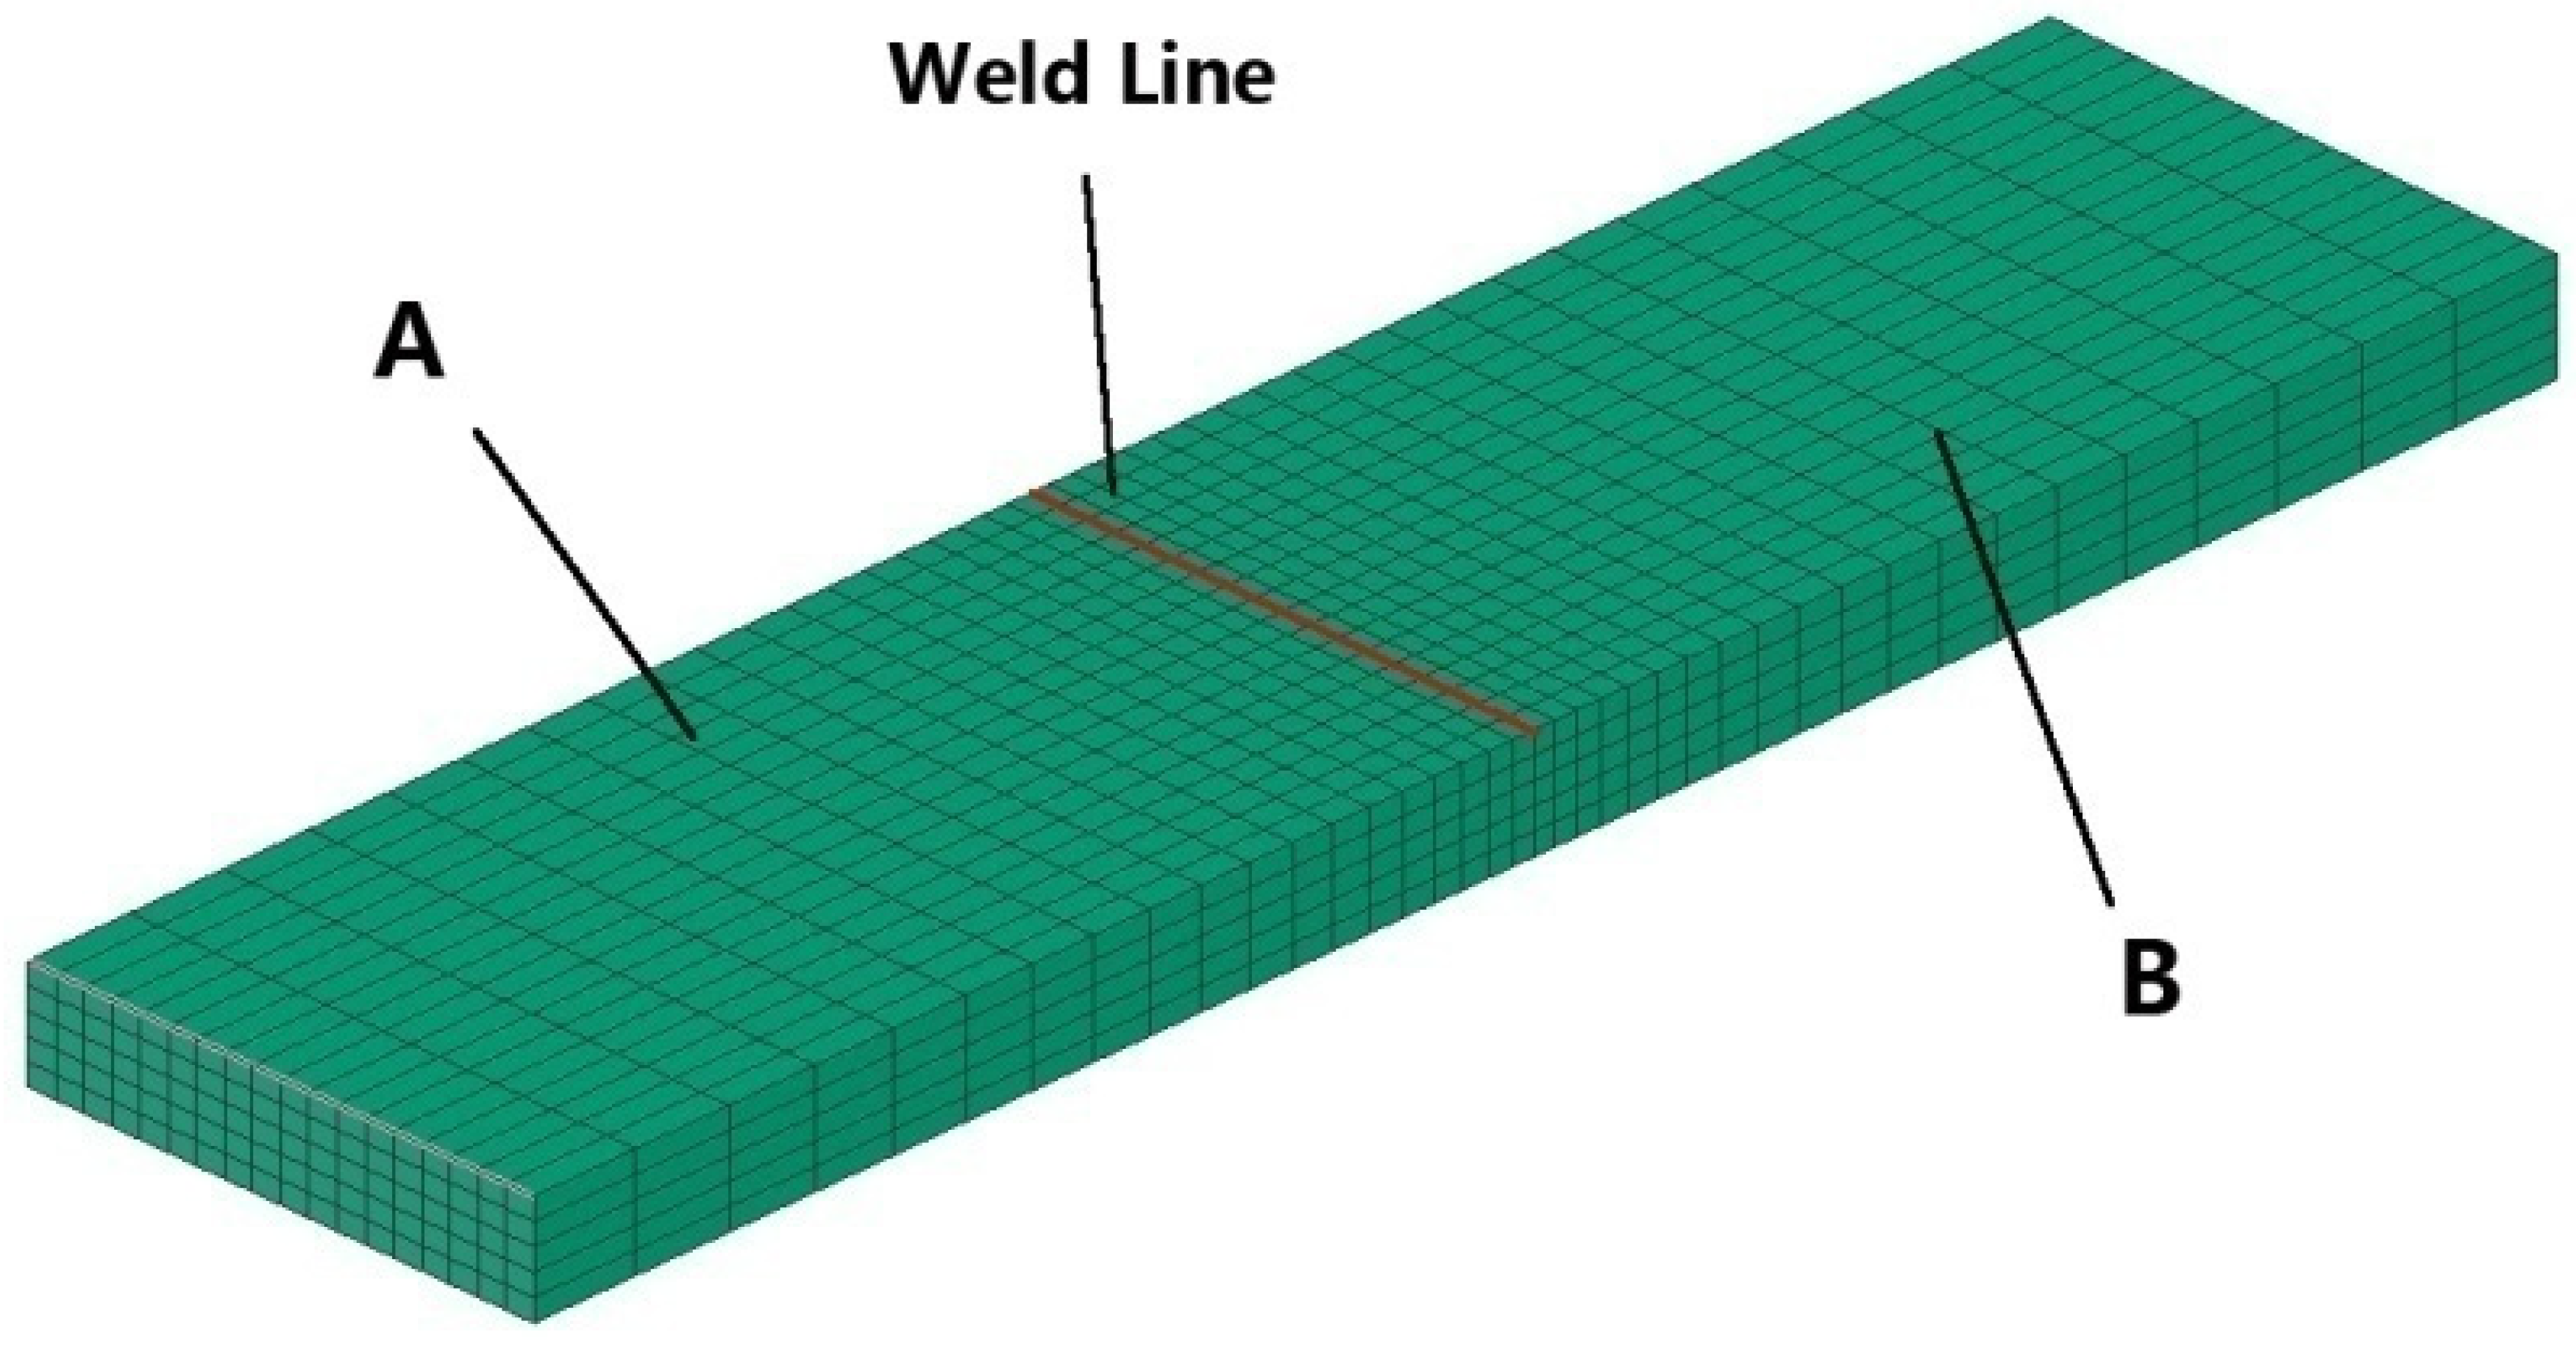
First, the sample was modeled by SYSWELD, as shown in Figure 6. Then, the sample of amorphous alloy A and the sample of amorphous alloy B were welded virtually to obtain the temperature field curve. The dimension of samples A and B are all 50 × 5 × 2 mm3 in size. The material parameters [35] involved in the simulation are shown in Table 2.

3.3. Results and Discussion

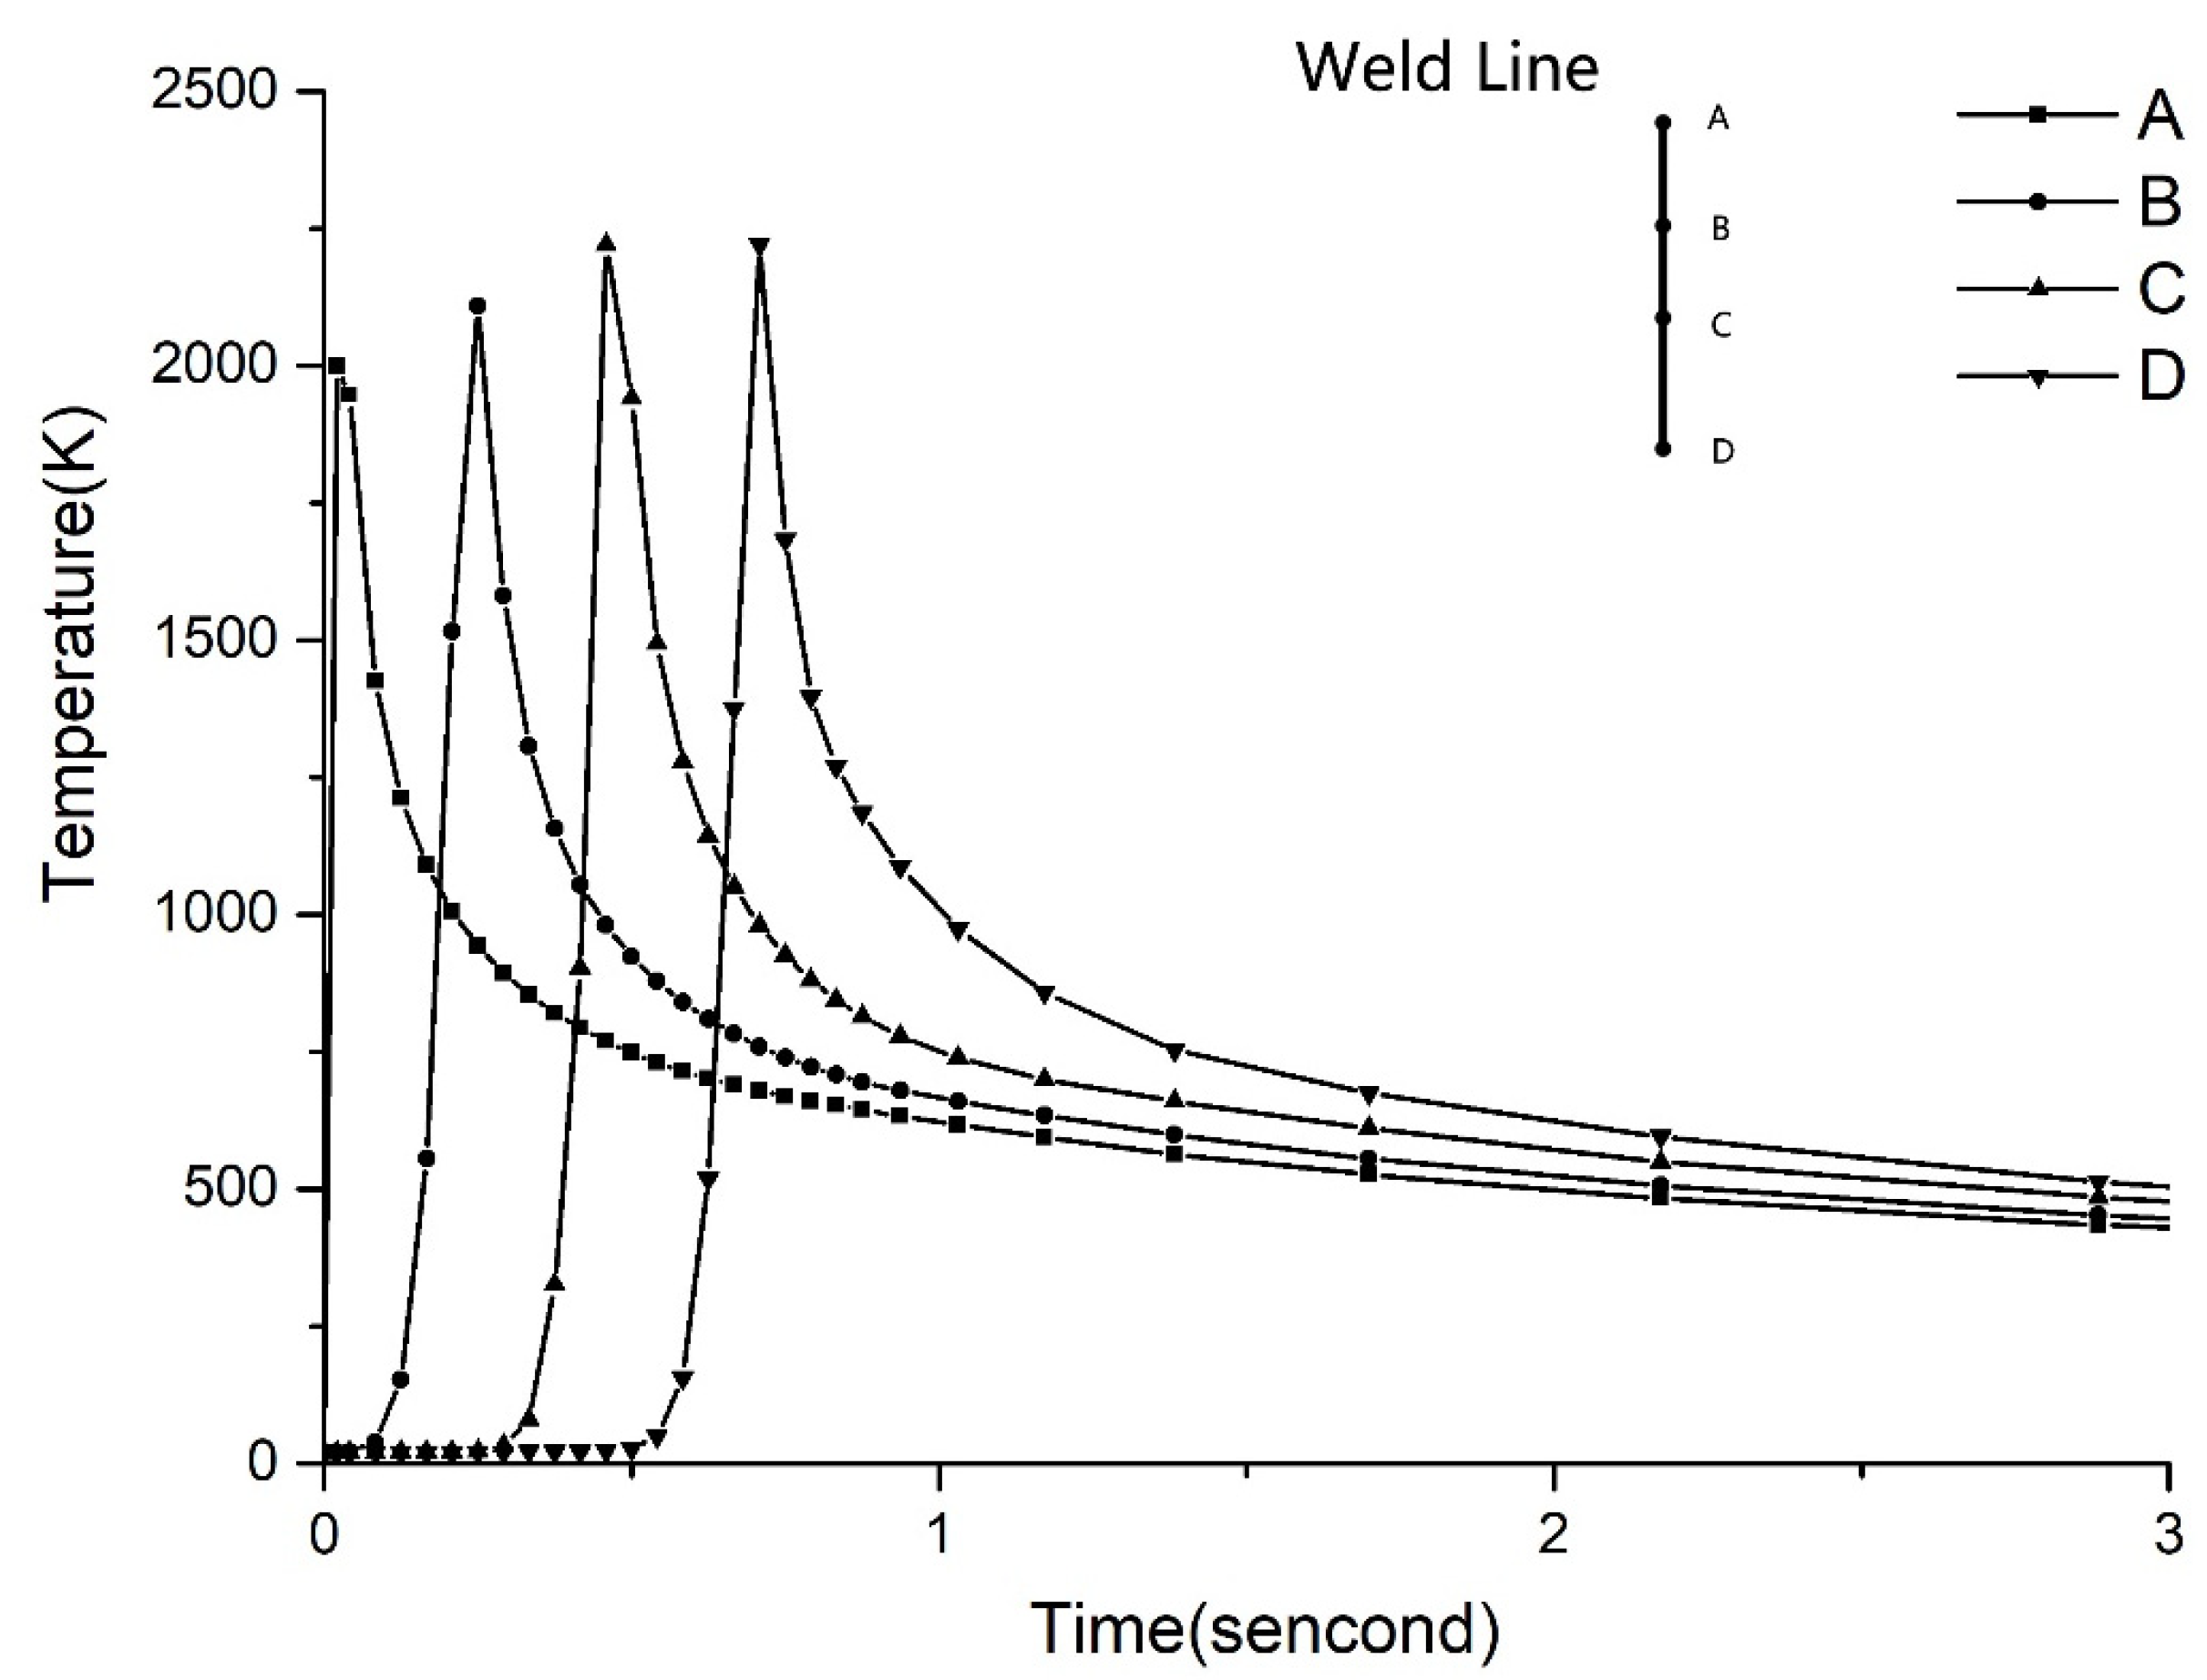
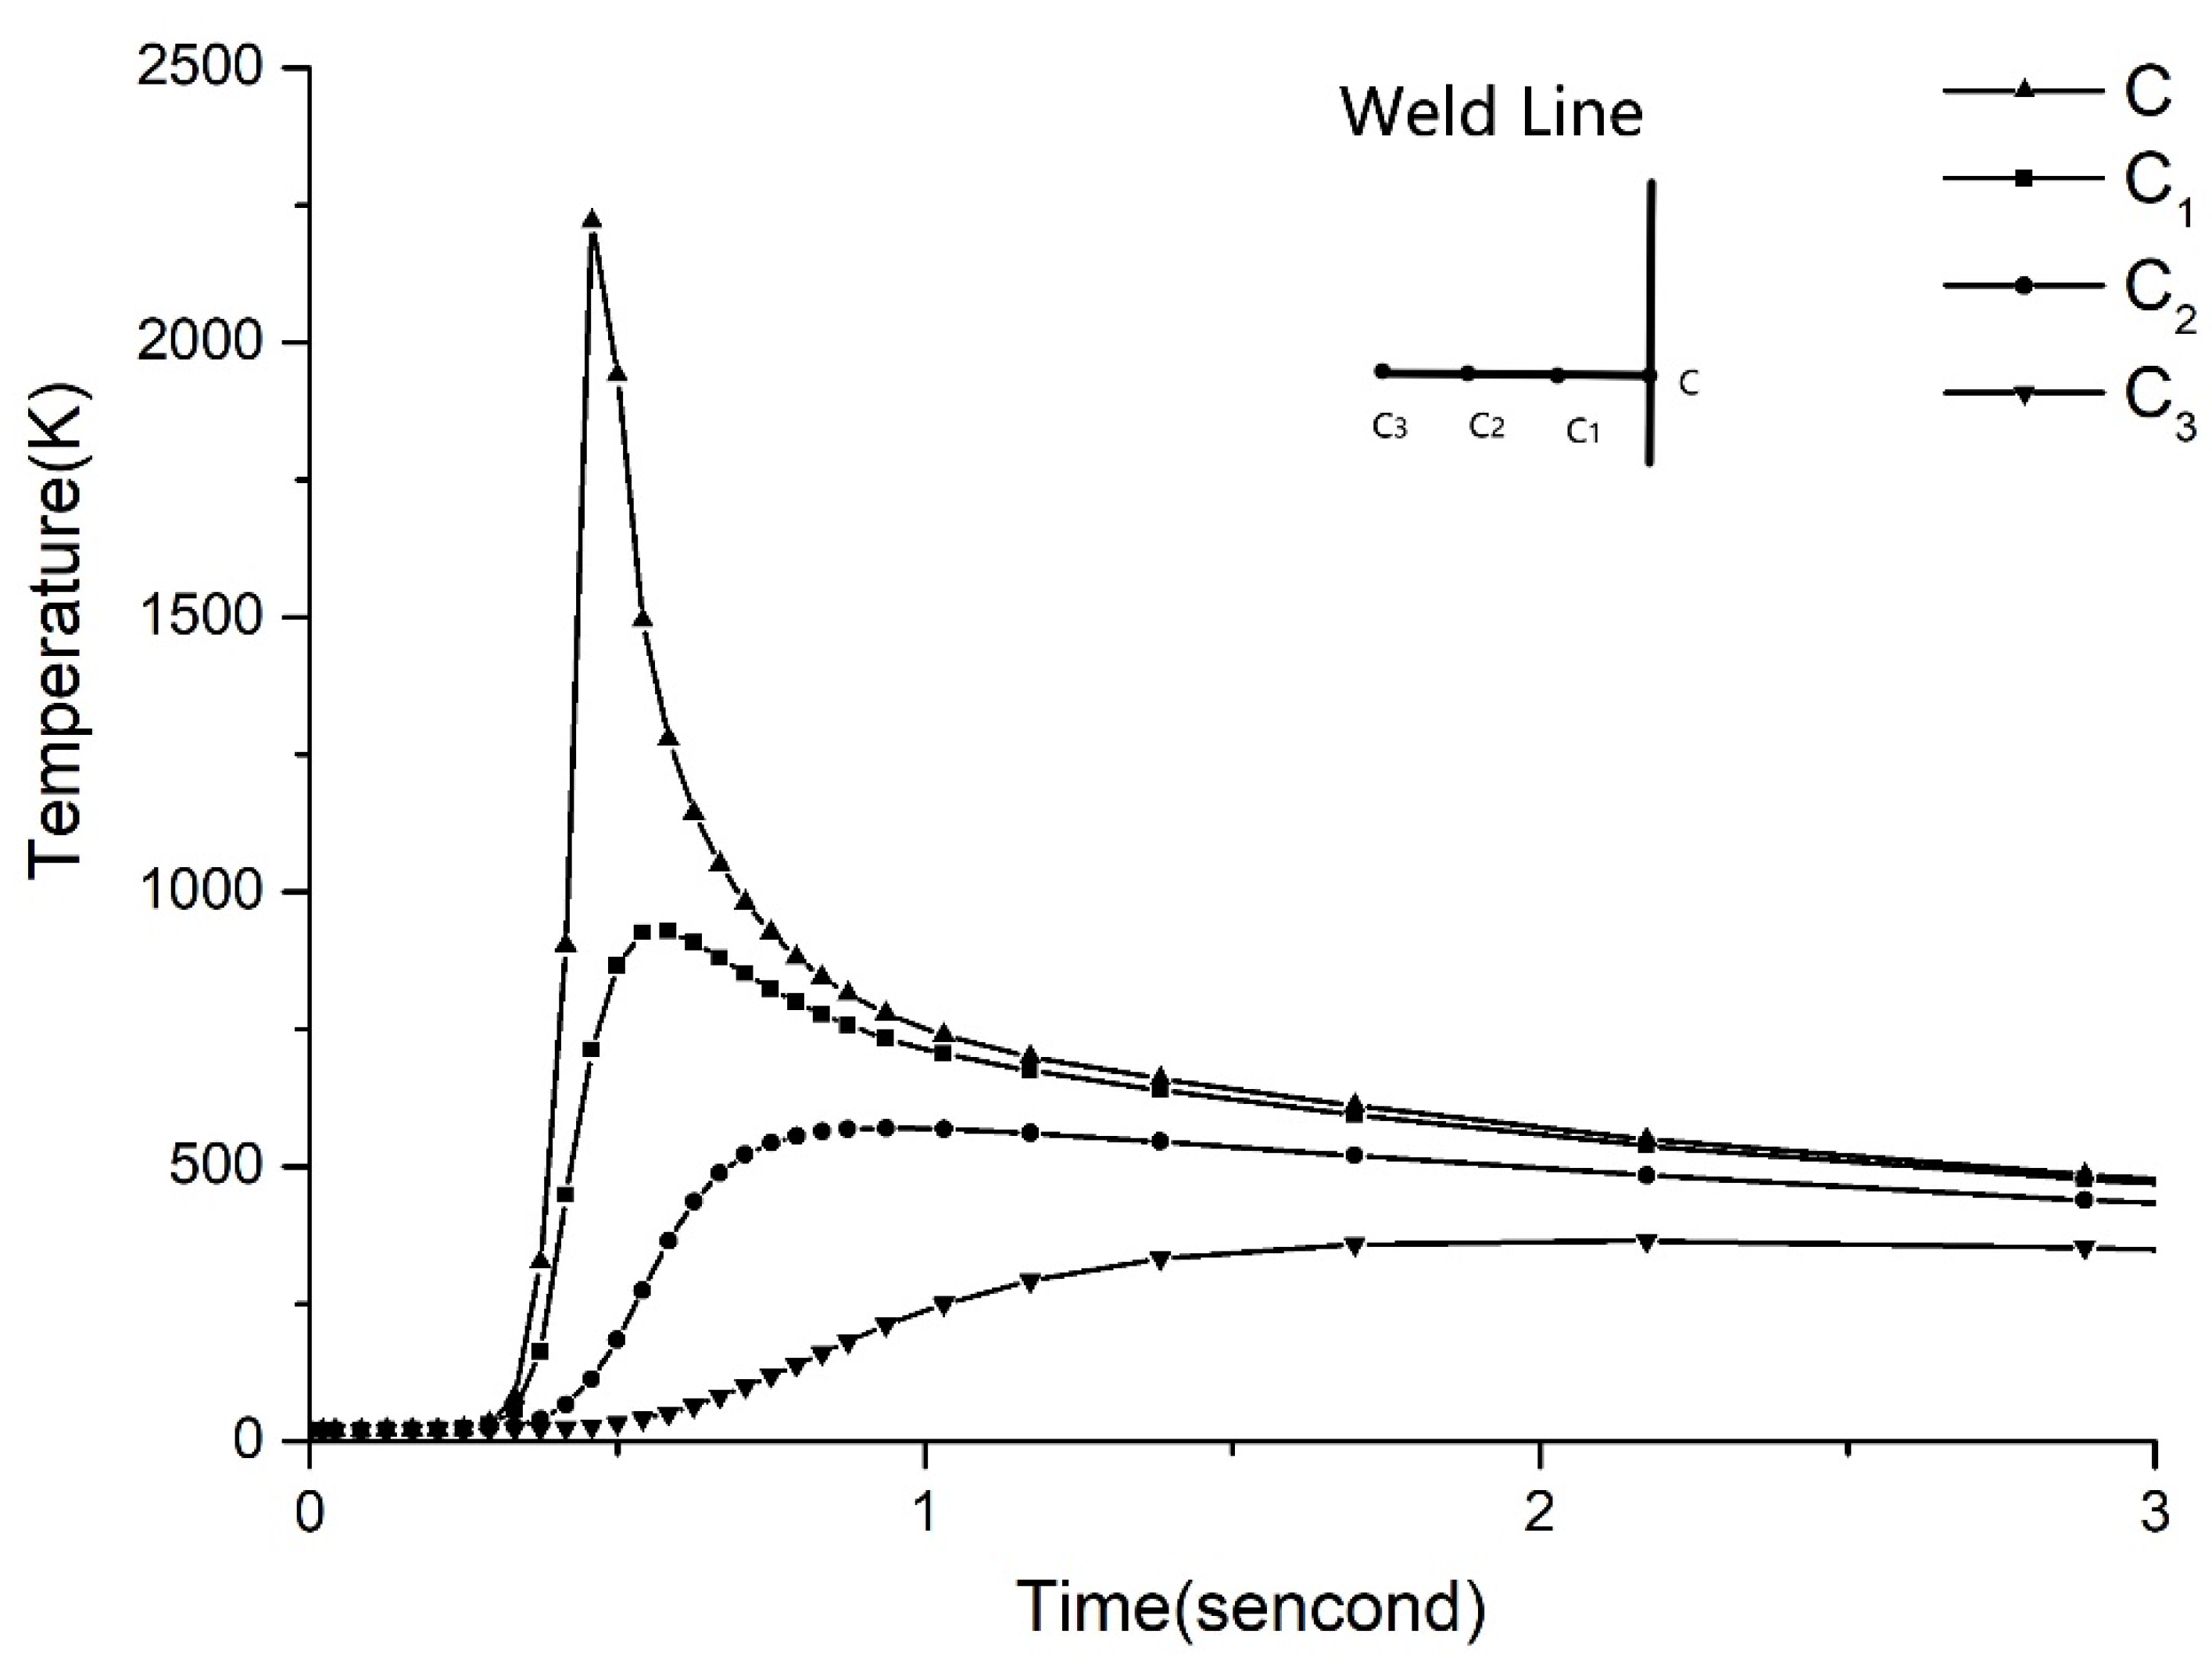
Firstly, the simulated welding runs under the parameter of 300 W-12 mm/s. The temperature field curves of points A, B, C and D, which are distributed evenly along the welding line, are shown in Figure 7. It can be seen that the trends of the temperature field curves at all points are almost the same, and the highest temperature reaches about 2200 K. The maximum temperature at starting point A is about 2000 K, which is lower than 2200 K. The reason for this is that the welding has just started and the temperature field has not been fully established. As the laser moves, the temperature rises rapidly, reaching the maximum temperature, and then decreases quickly. Such a temperature field curve makes it possible to avoid the intersection with the CHT curve, preventing crystallization in laser welding. At the beginning of the welding, the temperature after point C does not change. The reason may be that the temperature field has not affected the point afterward, so it remains at the initial temperature. Figure 8 shows the temperature field curve normal to the welding line at the parameter of 300 W-12 mm/s. It can be seen from Figure 8 that the farther away from the weld line, the lower the maximum temperature and temperature changing rate.
The amorphous alloy is easier to crystallize in the heat-affected zone in laser welding [36], so we chose a point in the heat-affected zone and simulated the temperature field curve of this point at different welding parameters.
The welding power was kept at 300 W while the welding speed was changed to study its influence, as shown in Figure 9. The welding parameters are shown in Table 3. With the decrease in the welding speed, the welding time and the maximum temperature gradually increase, and the temperature field curve moves to the upper right. At the welding speed of 3 mm/s and 6 mm/s, the temperature field curves both intersect with the corresponding VFT fitting and the Kissinger fittings. According to the hypothesis mentioned above, the crystallization occurs in the welding area at 300 W-3 mm/s and 300 W-6 mm/s. At 9 mm/s, the temperature field curve intersects only with the Kissinger fitting, so it is hard to determine whether crystallization will occur or not at 300 W-9 mm/s. In this study, experiments are carried out to investigate which fitting can be used to better predict the crystallization in laser welding.

4. Laser Welding Experiments

4.1. Procedure

In order to verify the accuracy of the crystallization prediction in simulated welding, laser welding tests of the Vit1 amorphous alloy are performed in this section. As-received amorphous alloys were produced in EONTEC Co. Ltd. (Dongguan, Guangdong, China). To be consistent with the simulation, the amorphous alloy samples used for laser welding were 50 × 5 × 2 mm³ in size. Laser welding experiments were conducted by using a WF300 laser welder (Han’s Laser Technology Industry Group Co., Ltd., Shenzhen, China) with a pulse width of 3.0 ms, frequency of 40 Hz, and argon flow rate of 20 L/min. Welding parameters are shown in Table 3. In laser welding, welding areas were protected by argon to reduce welding defects and increase the cooling rate. The surface morphology of the welding area was observed by scanning electron microscope (SEM, FEI Company, Hillsboro, OR, USA), and then X-ray diffraction (XRD, Rigaku Corporation, Tokyo, Japan) experiments were carried out. The bending strength of the welded samples was obtained by bending experiments.

4.2. Results and Discussion

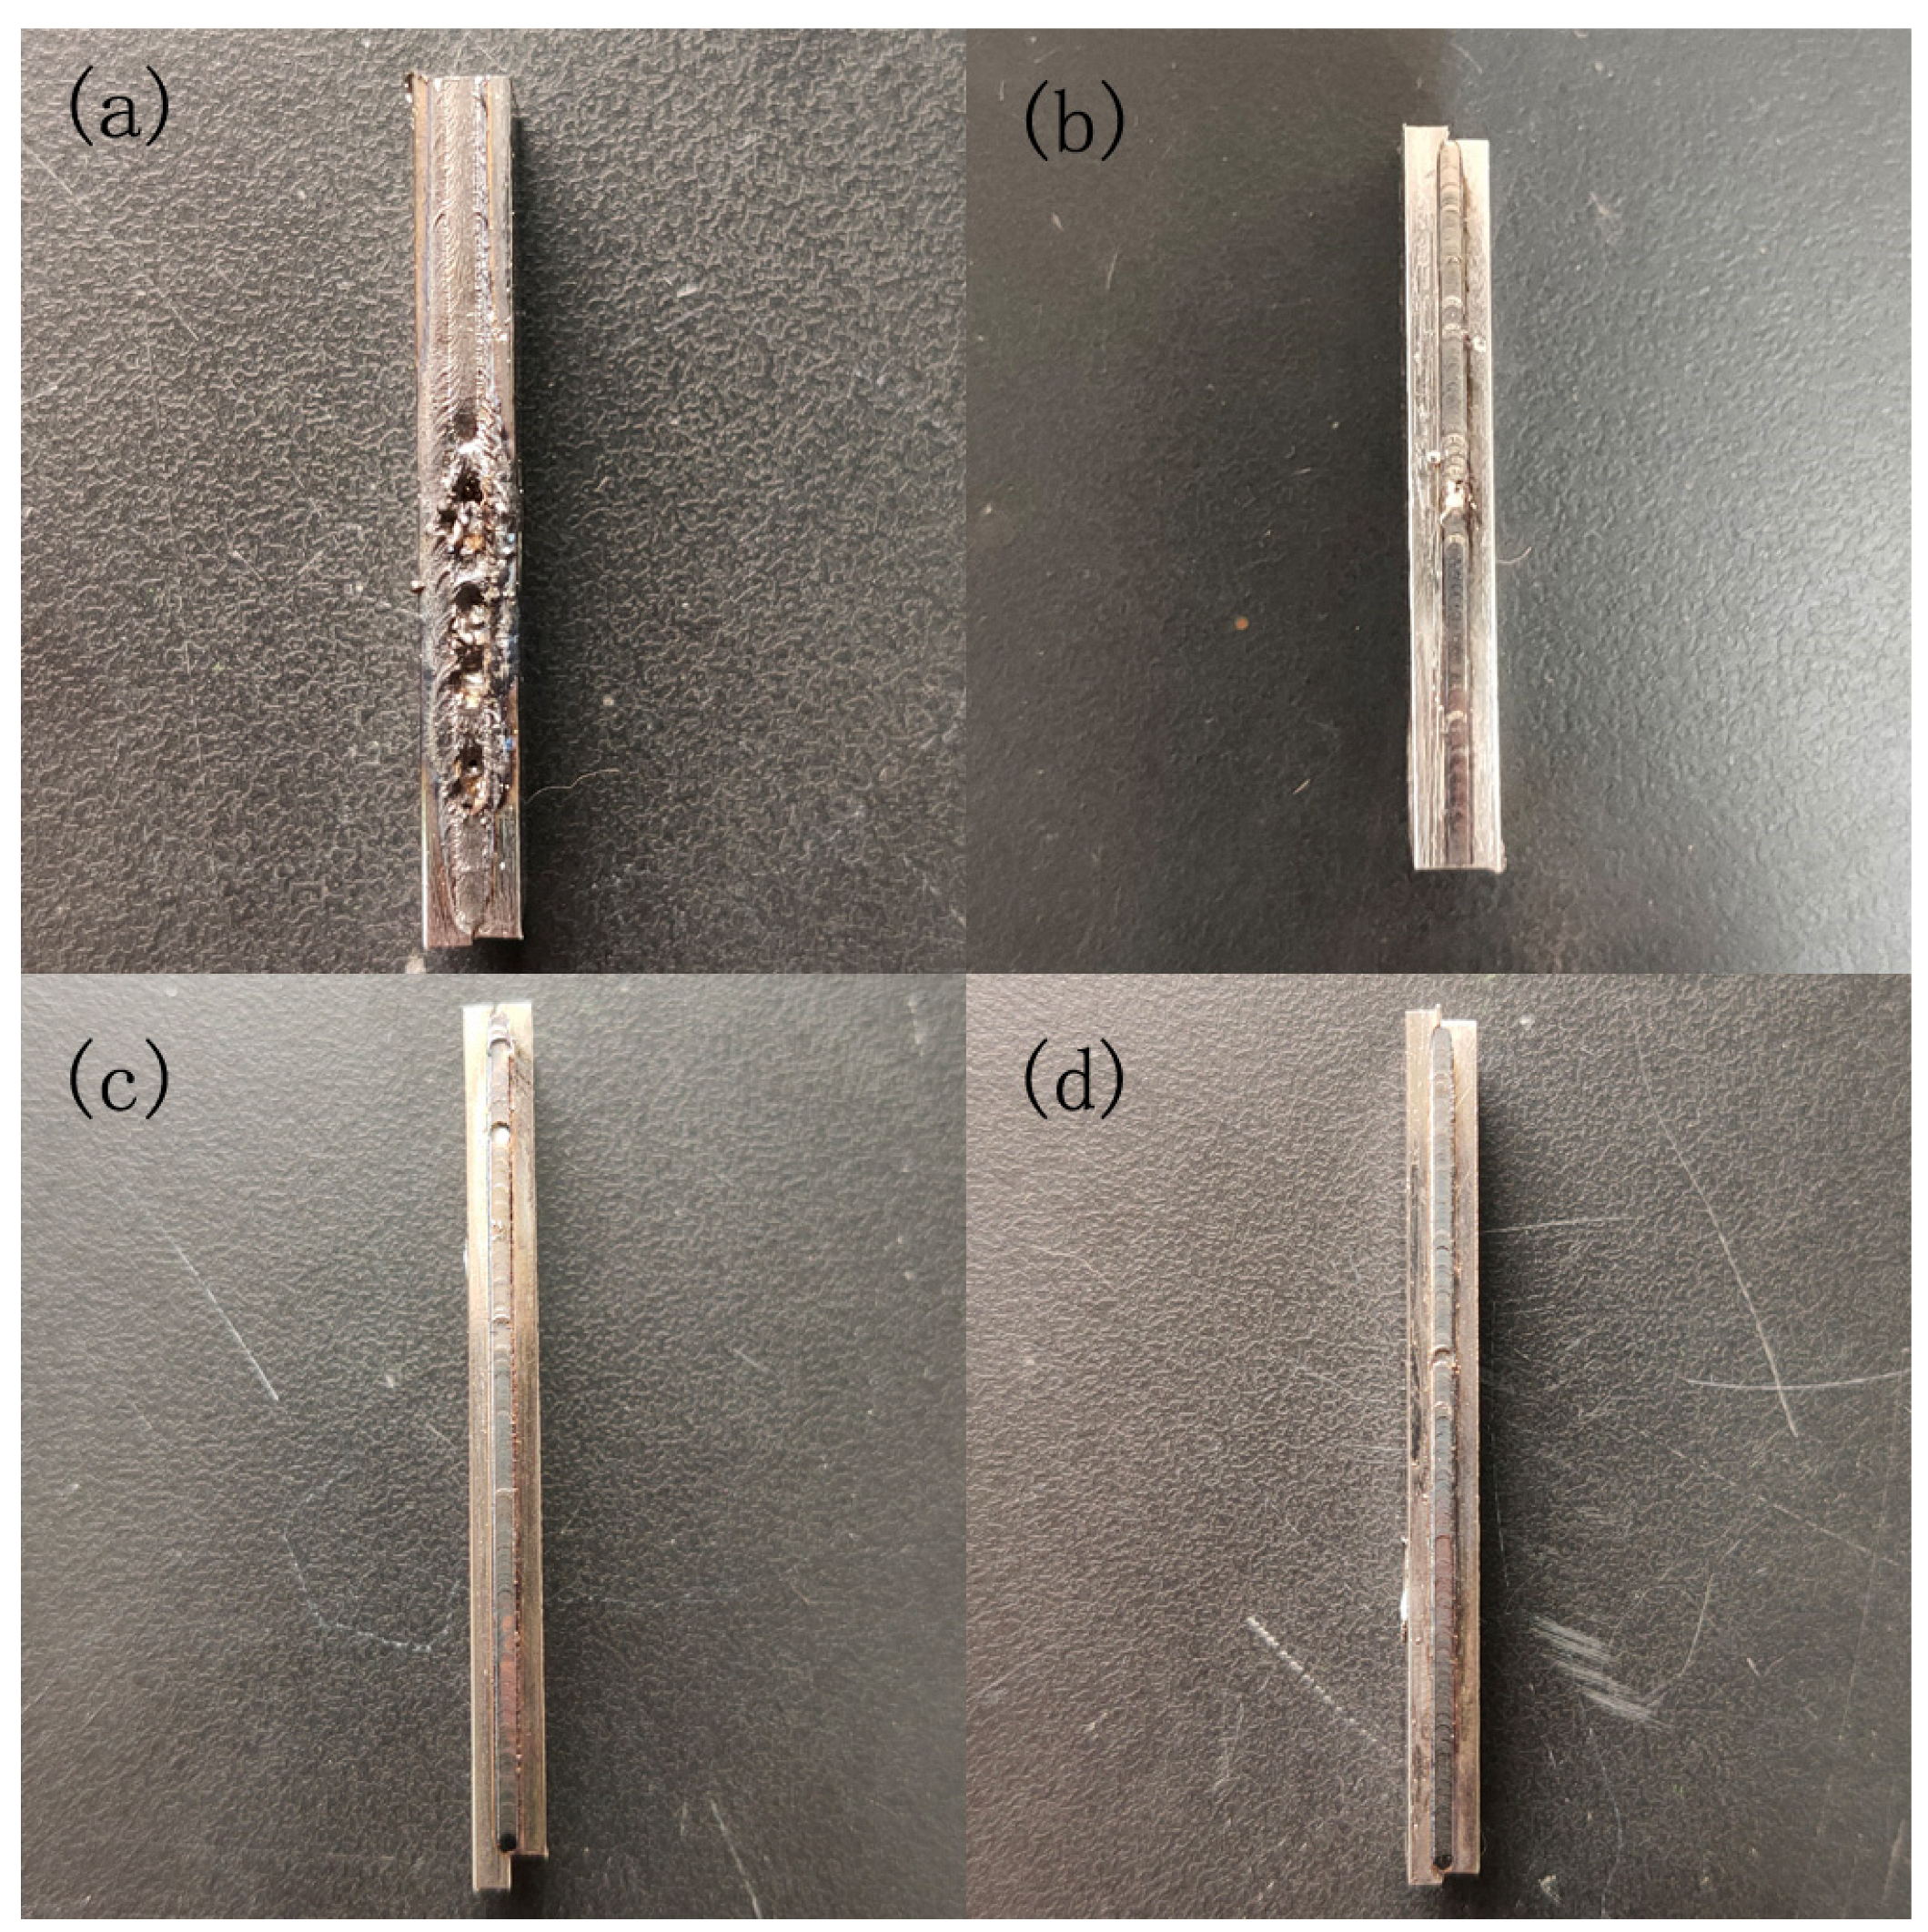
Laser welding results are shown in Figure 10. Samples 1–4 were successfully welded together. Sample 1 was welded too slowly and the laser impacted the same welded part for too long, resulting in severe spattering at some weld locations and affecting the performance of the welded part. The welded parts of Samples 2 and 3 are good, with only a small amount of spatter. Sample 1 has the slowest welding speed, so the temperature of the welding area in the four samples is the largest, and its heat-affected zone area is also the largest; with the increase in welding speed, the area of the heat-affected zone is gradually reduced, until there is no heat-affected zone in Sample 4. Four samples have a varying number of porosity defects, of which Sample 1 is the most serious, which is due to the slow movement of the laser in Sample 1: the laser impact time on the same welding area is too long. With the increase in welding speed, the number of pores gradually decreased.
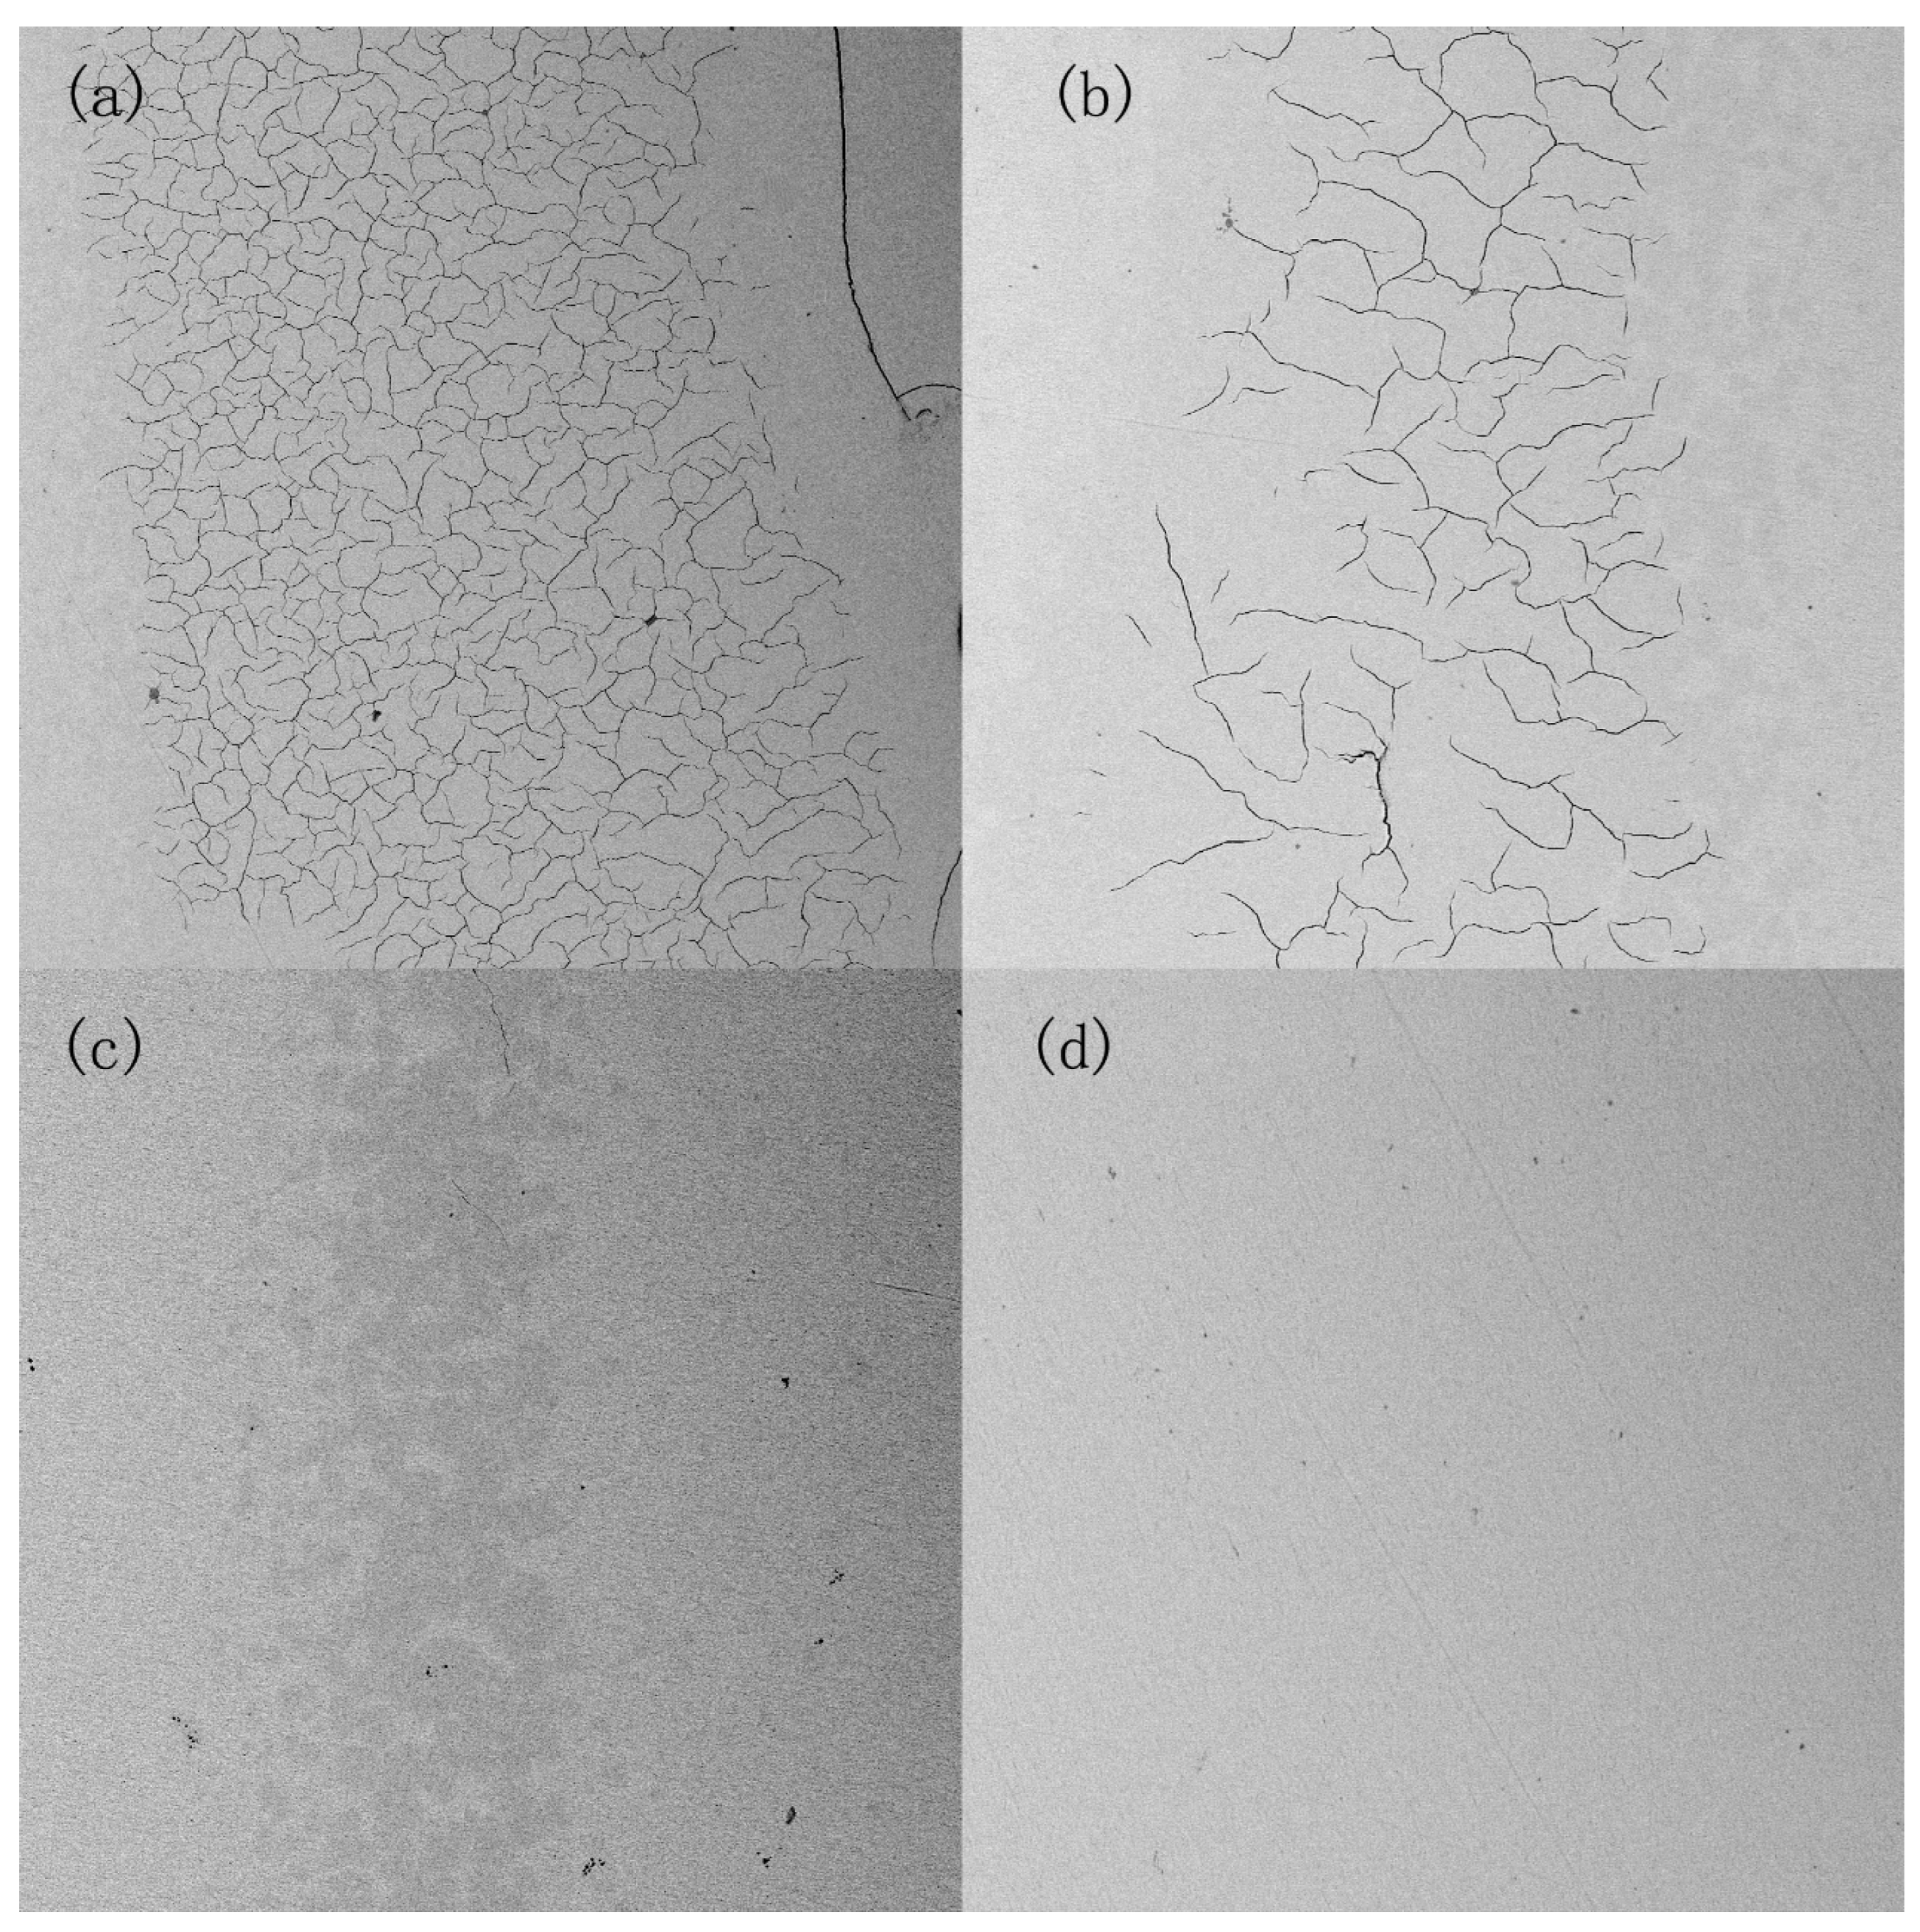
The heat-affected areas of the four samples were magnified to obtain Figure 11. From the figure, it can be seen that a large number of cracks were produced in the heat-affected areas of Sample 1 and Sample 2 by the laser impact, and there were a large number of black spots in the heat-affected areas. The cracks are irregular, staggered like crab claws. The Sample 1 crack range is wide and dense, which is due to excessive laser impact. With the increase in welding speed, the crack density decreased significantly; Sample 3 has been observed with no obvious cracks. As the welding speed of Sample 3 is too small, there was no crack generation, but we also cannot observe the obvious heat-affected zone. Therefore, an appropriate increase in welding speed can reduce the generation of pores, cracks and other defects, increasing the mechanical properties of the welded area. However, when the welding speed is too high, there may be no weld penetration, reducing the performance of the welded area.
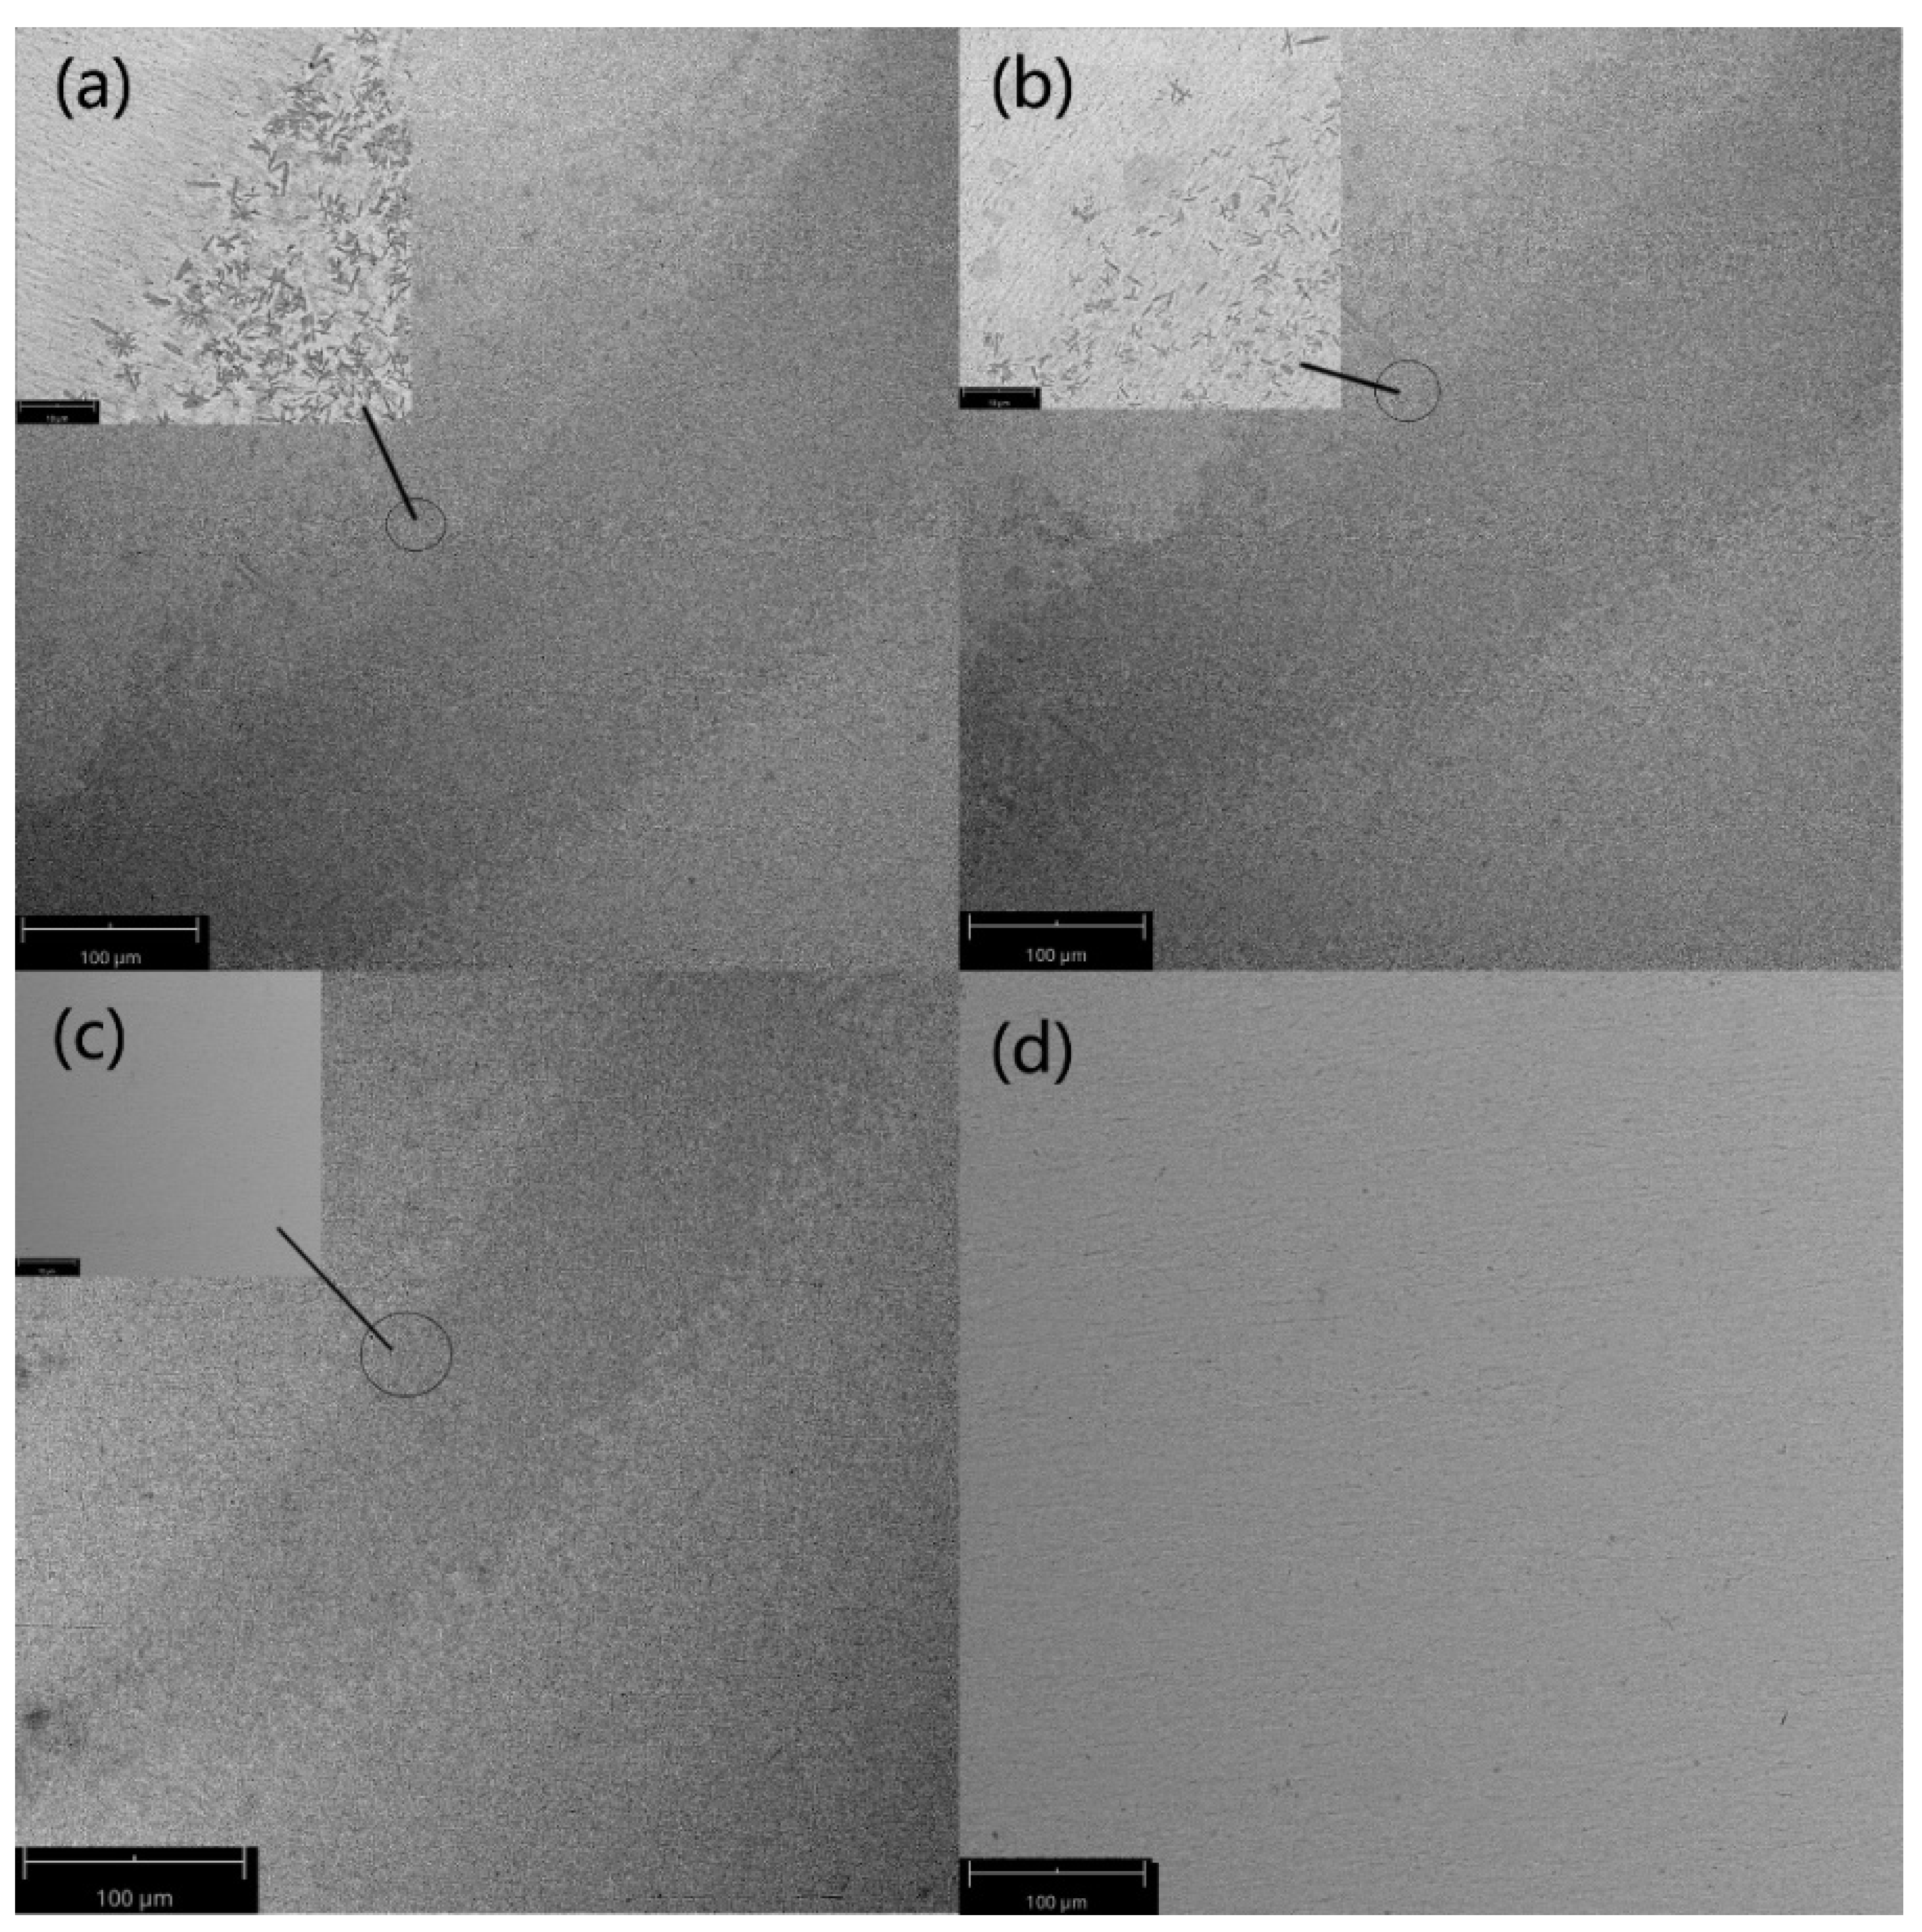
Figure 12 shows SEM images of the cross-section of four laser welding samples. It can be seen that different welding speeds affect the microstructures of the welding area. Samples 1–3 have obvious welding fusion zones, heat-affected zones, and base metal zones. Sample 1 has the largest heat-affected zone, while Sample 4 has no obvious heat-affected zone. The reason may be that the change in welding speed affects the temperature of the welding area, changing the area of the heat-affected zone. For Sample 4, the weld fusion zone, heat-affected zone, and base metal zone cannot be distinguished by SEM because of the high speed of laser welding. It can be seen from Figure 12 that crystallization mainly occurs in the heat-affected zone, and there are no obvious crystals in the welding fusion zone. The results are consistent with the previous research [30]. Grains appeared in the heat-affected zone of Sample 1 and Sample 2, and grains could not be observed by electron microscopy for Sample 3 and Sample 4, so it can be tentatively determined that crystallization occurred in Sample 1 and Sample 2, while no crystallization occurred in Sample 3 and Sample 4, which is consistent with the computer simulation results. To further determine the accuracy of the results, an XRD test was performed.
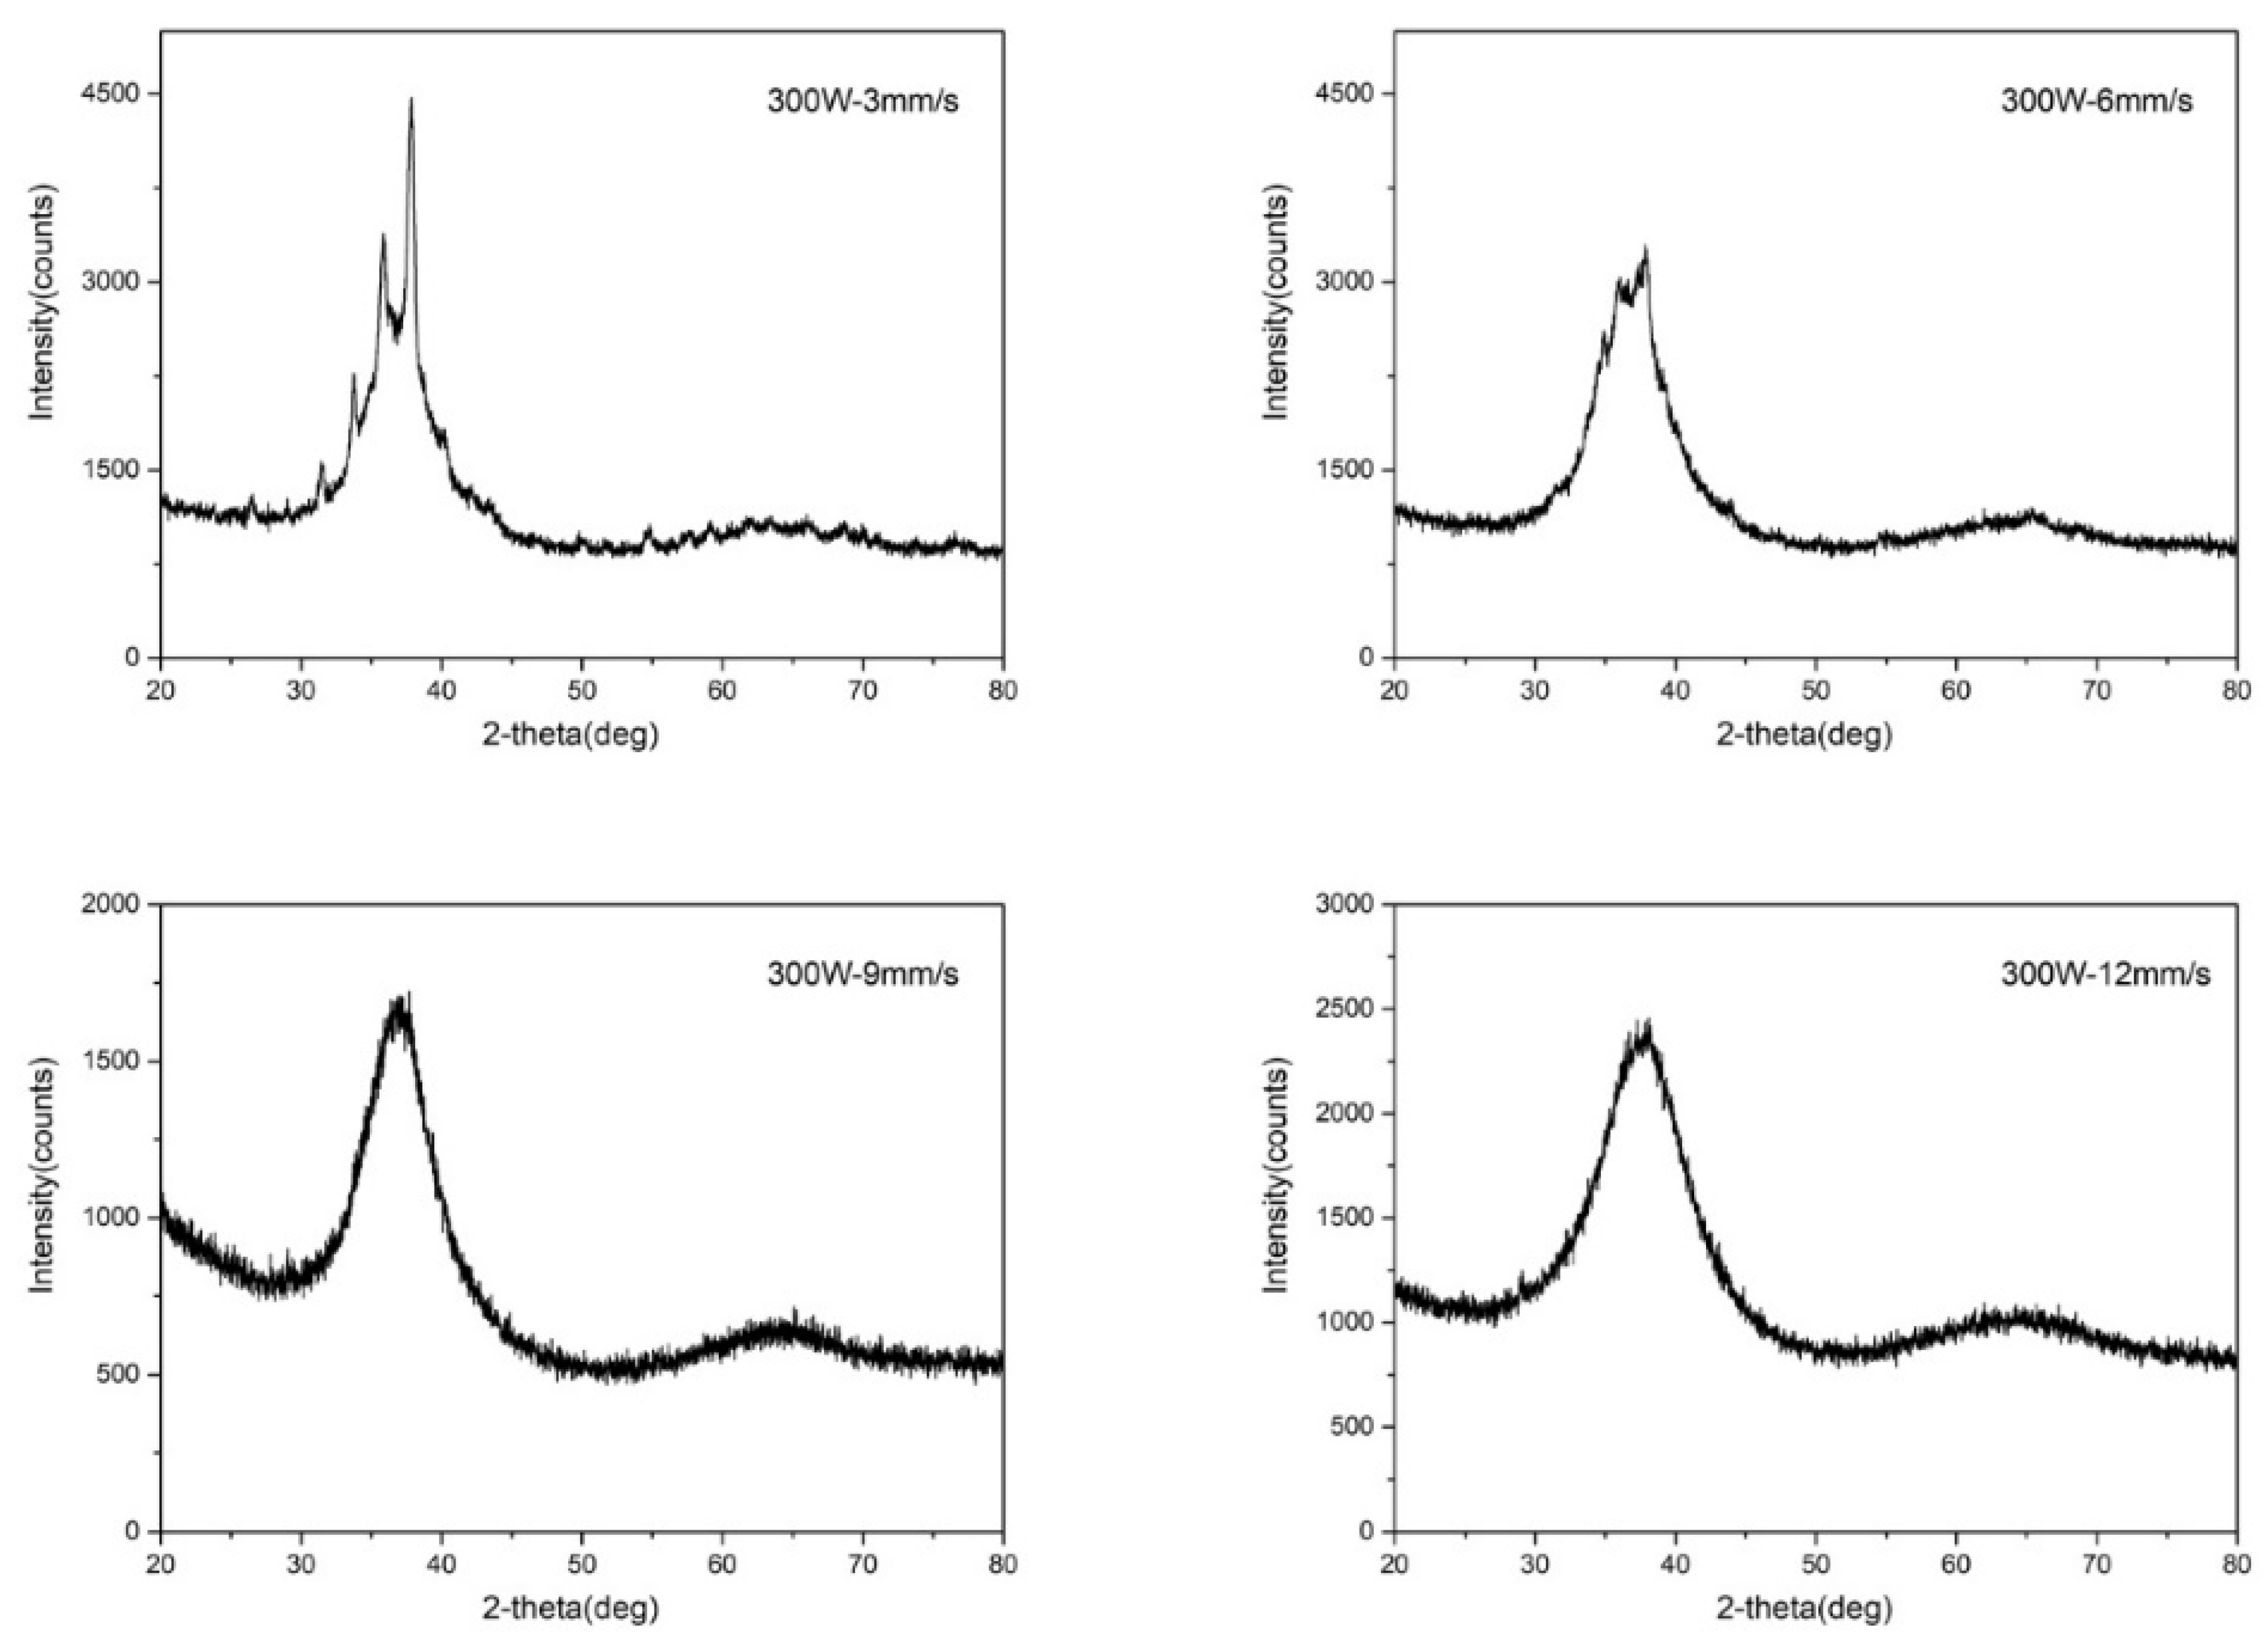
Figure 13 shows the XRD patterns of four welding samples. Sample 1 and Sample 2 have obvious crystalline peaks, indicating that Sample 1 and Sample 2 have crystallized. A low welding speed increases the temperature of the welding area and decreases the temperature drop rate, so the crystallization degree of Sample 1 is the most serious. Either Sample 3 or Sample 4 has only one classic amorphous peak, and no peak corresponding to a crystalline phase is observed, indicating that the structure is still amorphous. Both the SEM images and the XRD patterns prove that Samples 1 and 2 crystallize and Samples 3 and 4 remain amorphous, indicating VFT fitting can be used to predict the crystallization of the Zr41.2Ti13.8Cu12.5Ni10Be22.5 amorphous alloy better in laser welding.
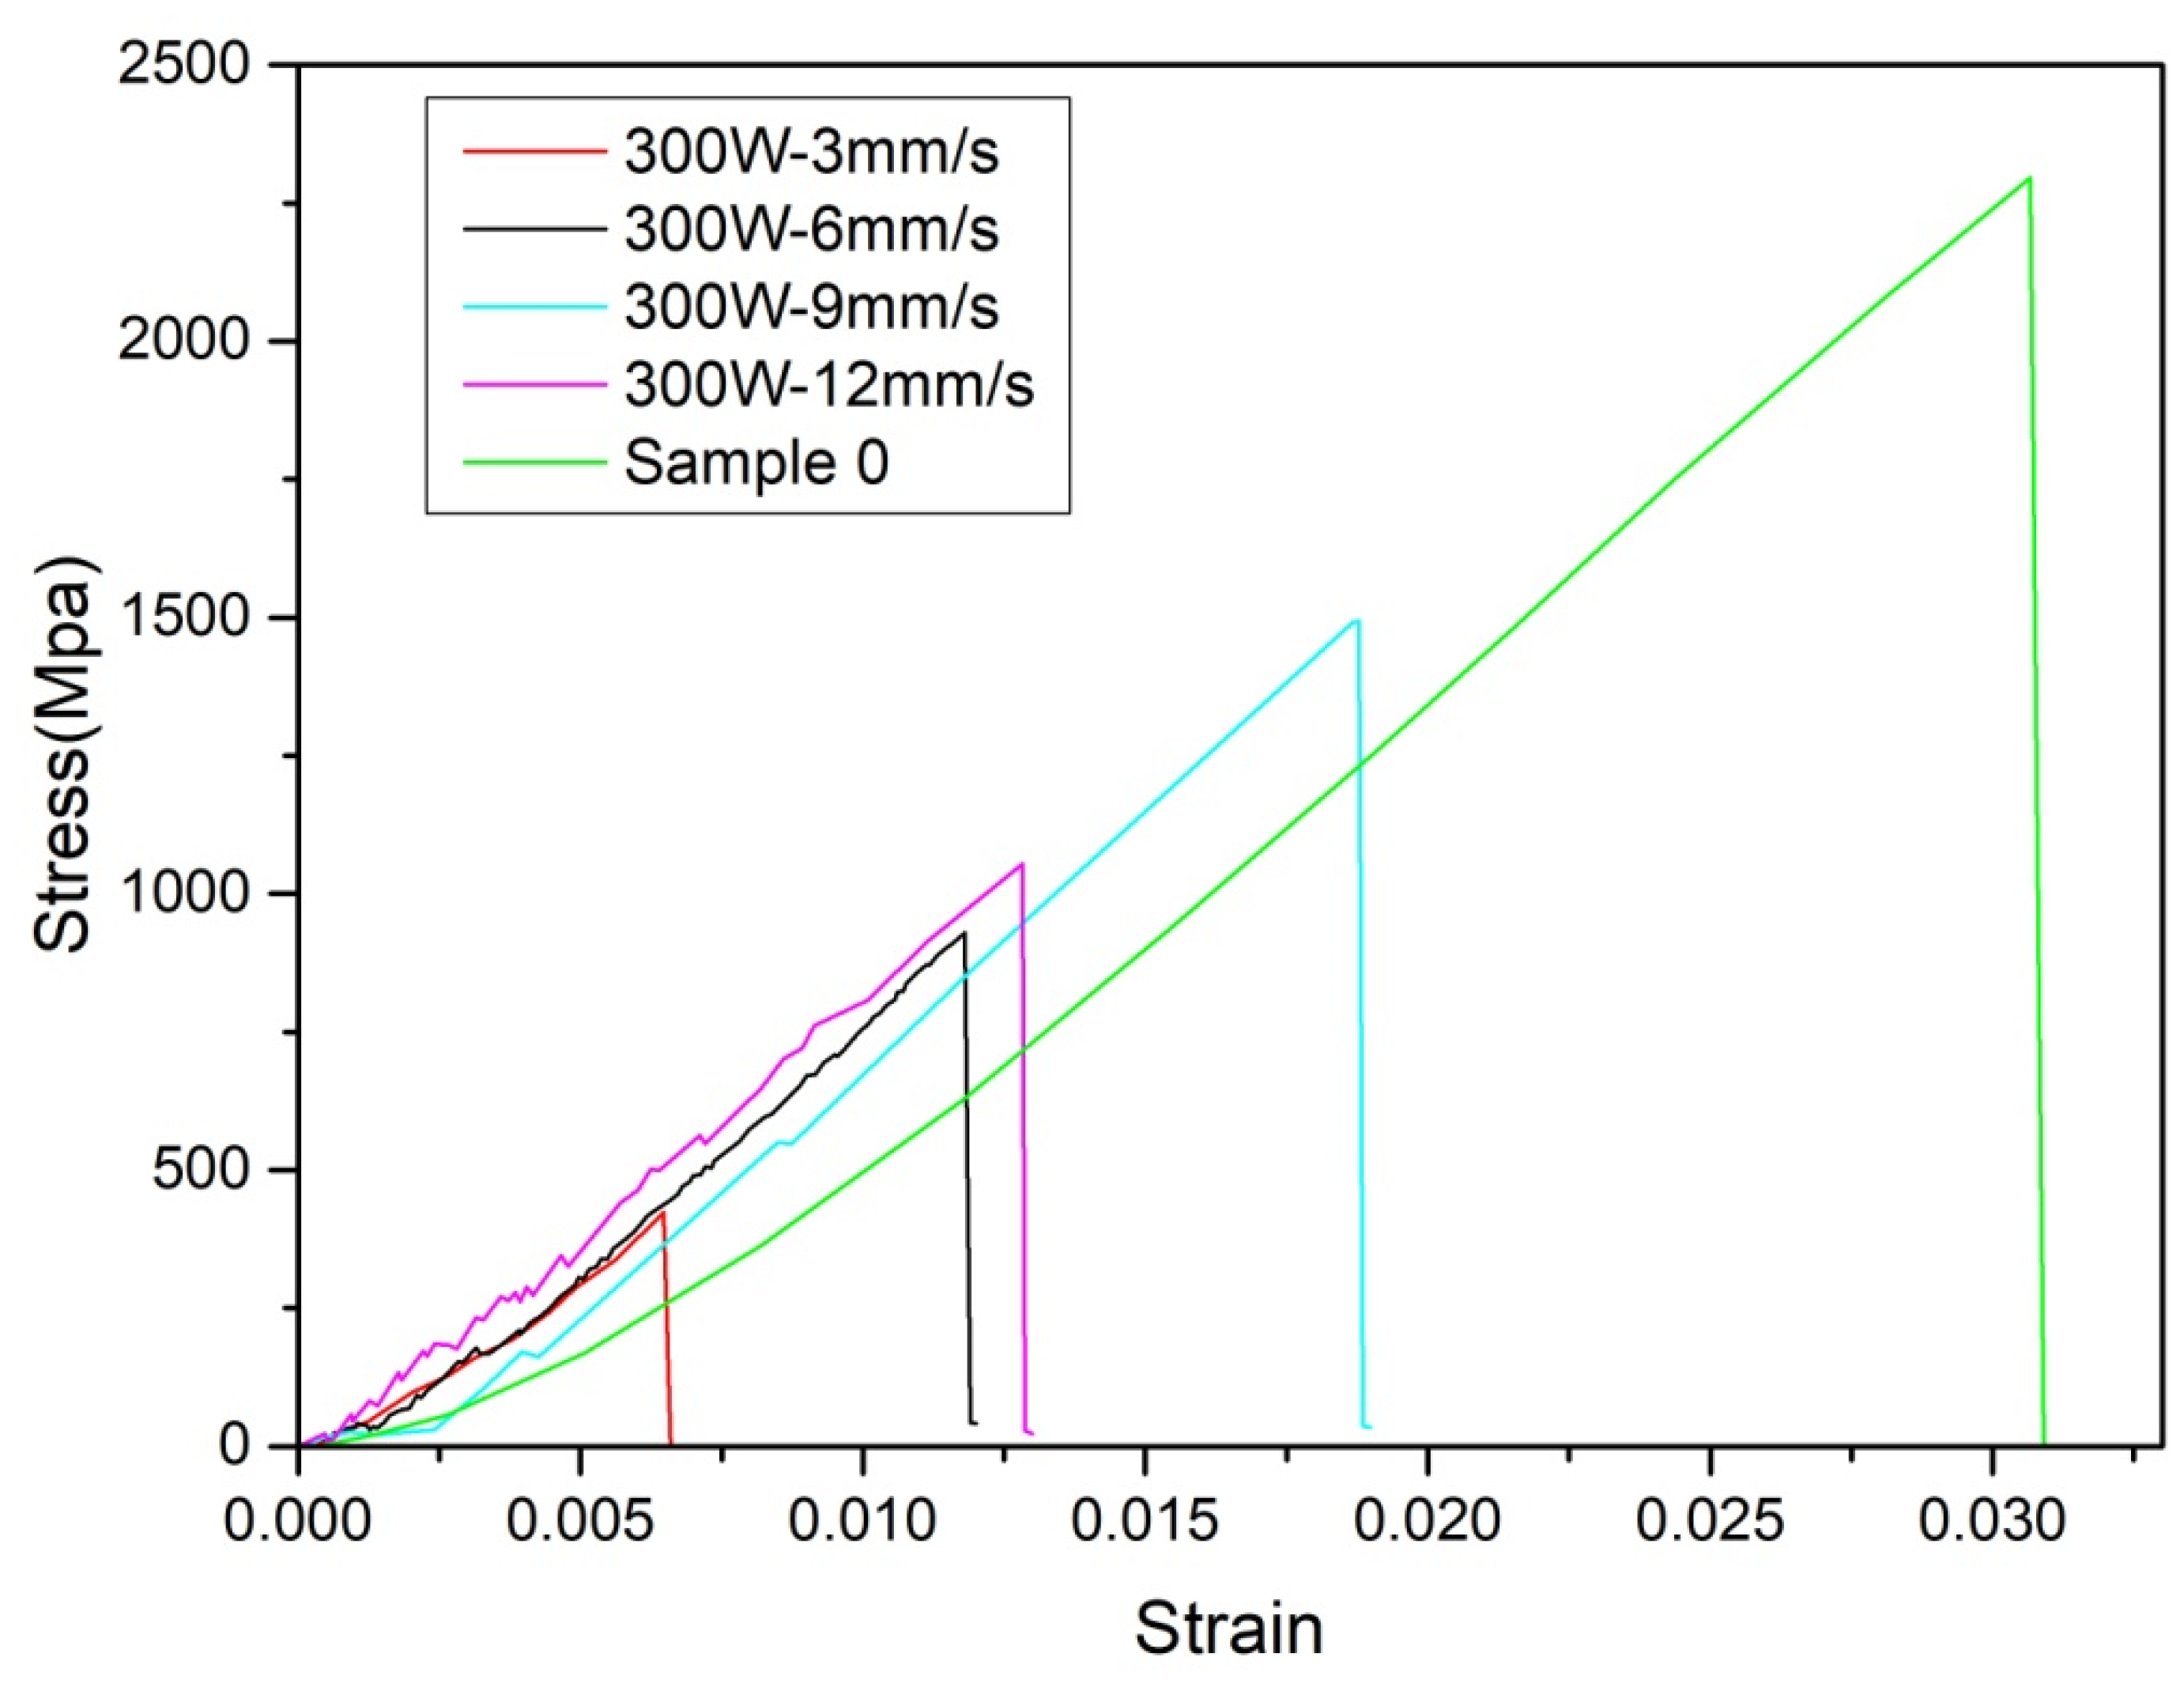
In addition, bending experiments were carried out. Figure 14 shows the stress–strain curves of the samples at different welding parameters. Sample 0 is an unwelded sample of the size 100 × 5 × 2 mm³. With the change in welding speed, the bending strength does not change monotonously. The bending strength at 300 W-3 mm/s is the lowest because the welding area has been seriously crystallized, which greatly reduces its strength. With the increase in welding speed, the crystallization gradually weakens, and the bending strength begins to increase. After 300 W-9 mm/s, the bending strength decreases again, because the welding speed is too high and the sample is not fully welded. As can be seen from Figure 14, the bending strength of sample 0 reaches 2256.25 MPa, while the maximum bending strength of the welding samples is only 1502.1 MPa. Therefore, laser welding can greatly reduce the bending strength of samples.
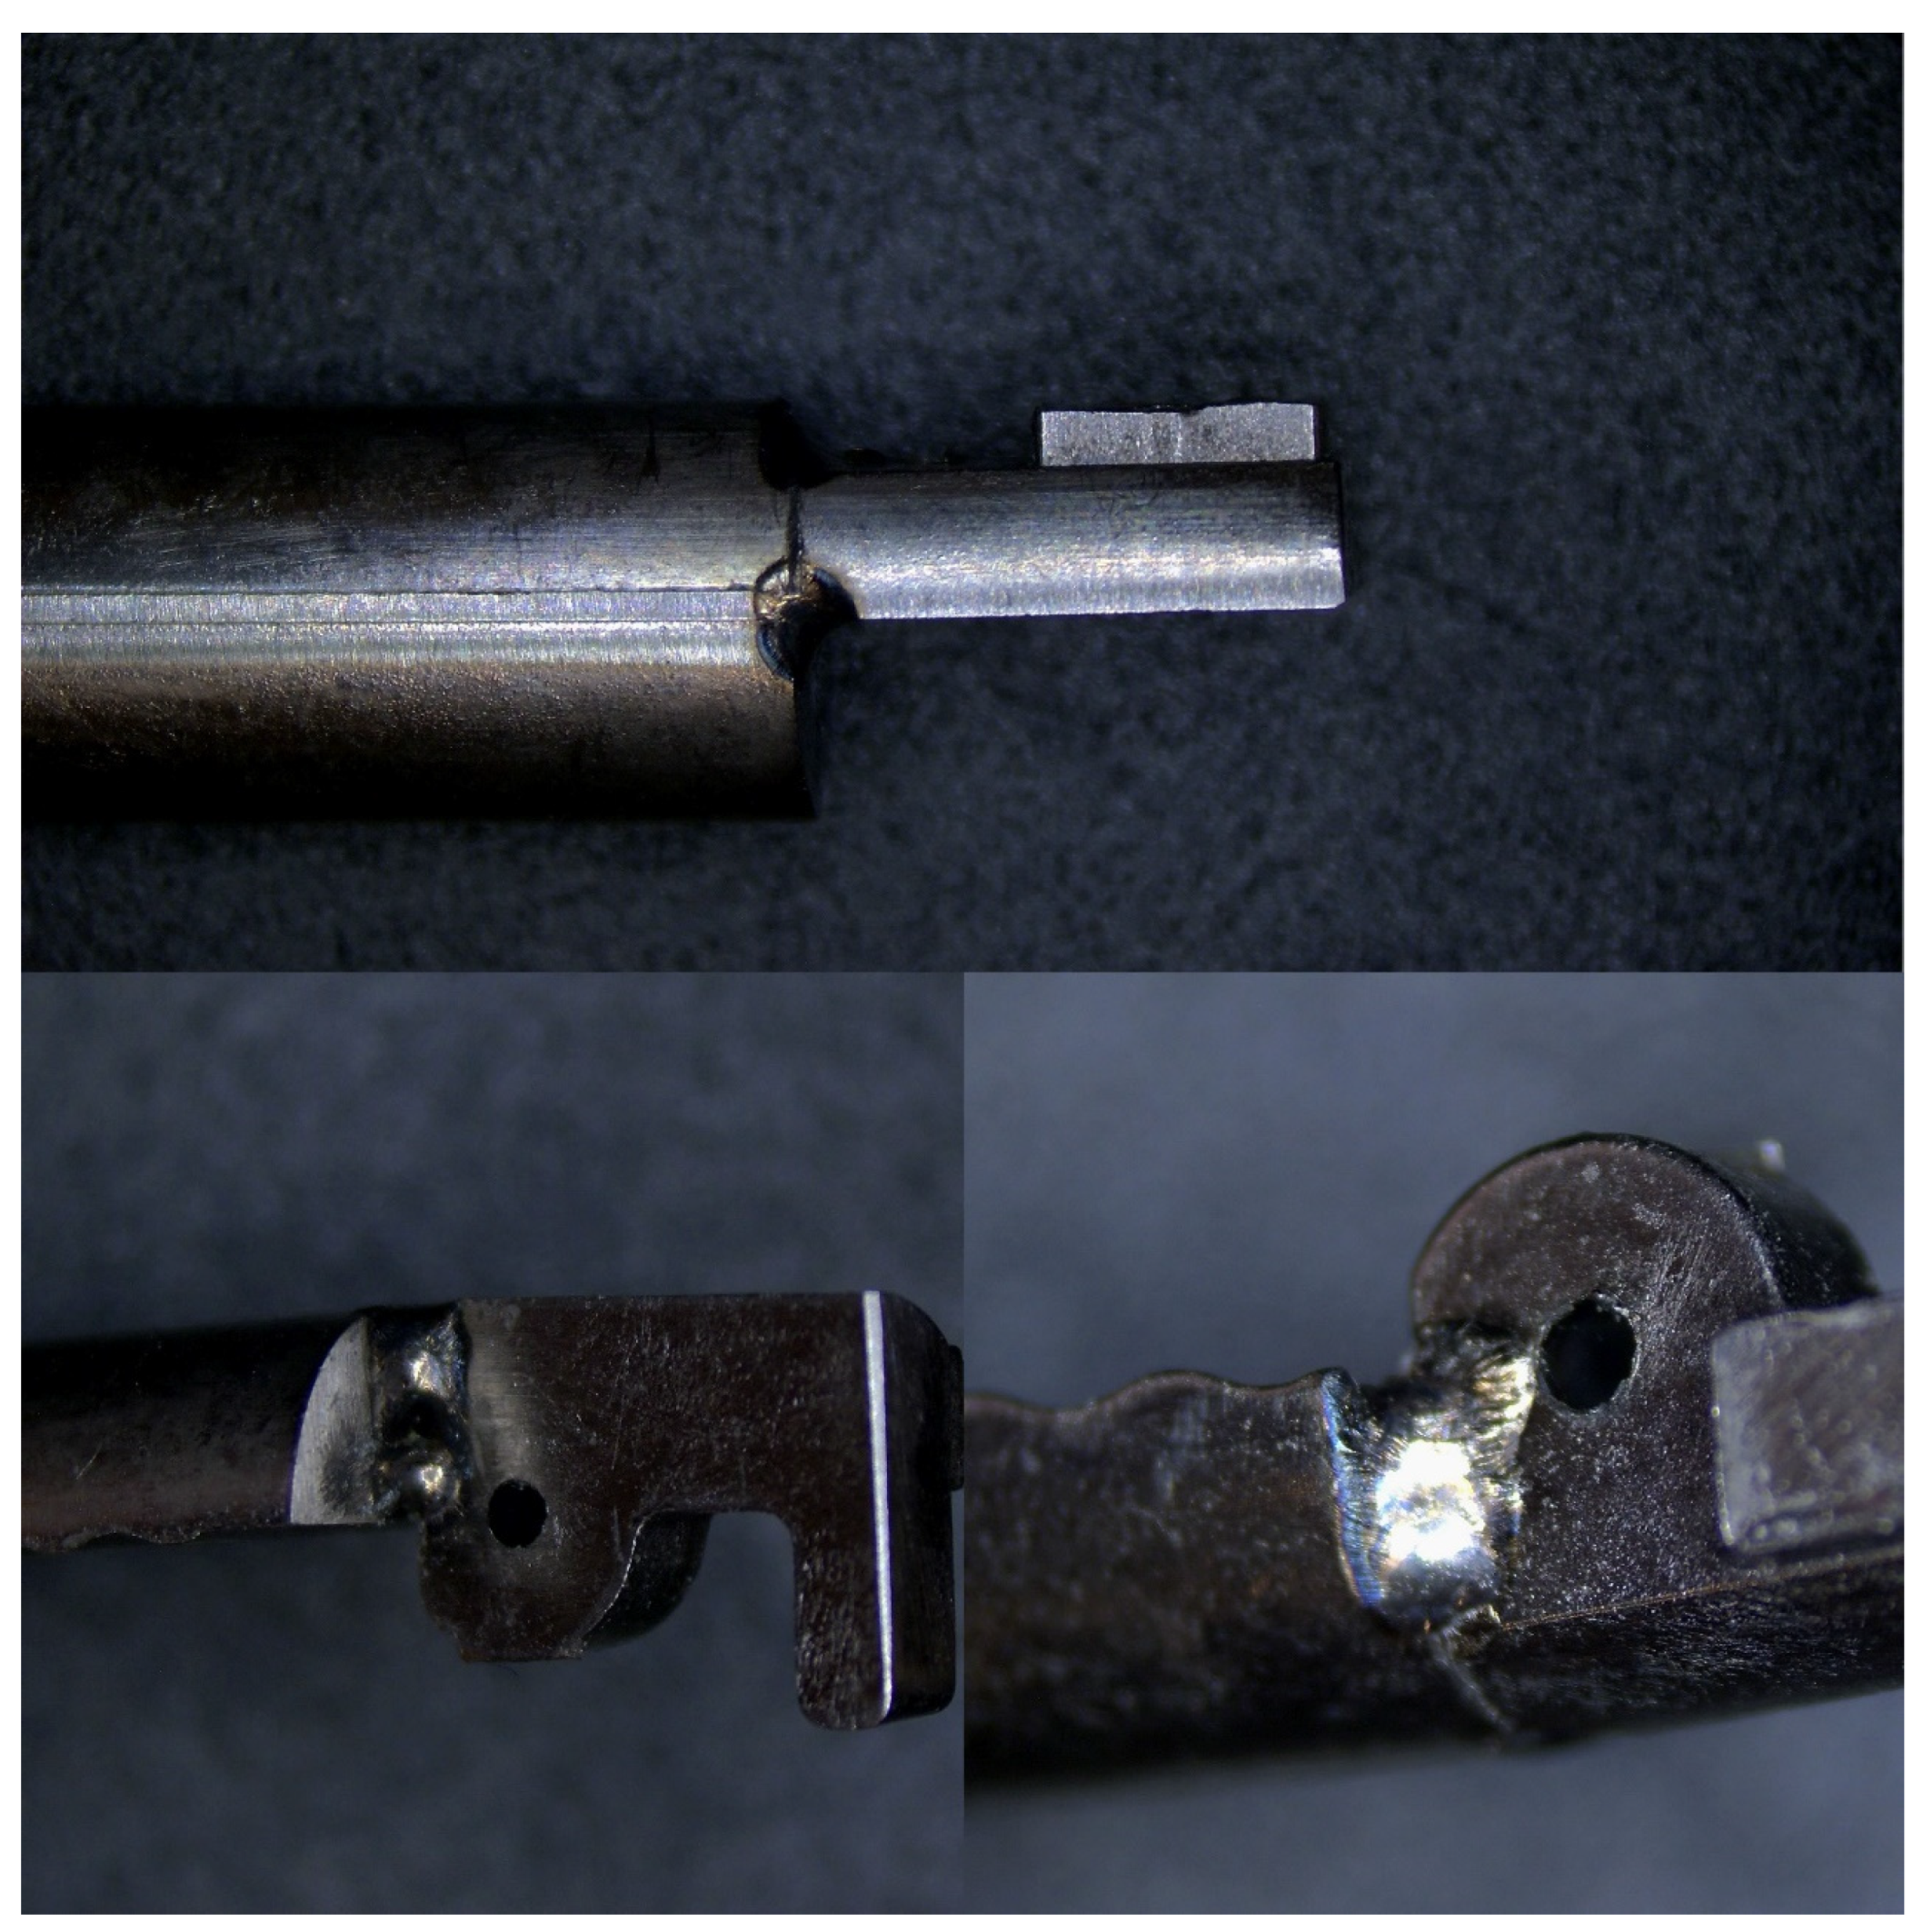
After the above analysis, it is found that the amorphous alloy will not undergo crystallization under the welding parameters of 300 W-9 mm/s and 300 W-12 mm/s. After the bending test, it is found that the maximum bending strength of Vit1 is larger under the welding parameters of 300 W-9 mm/s, so we chose the welding parameters of 300 W-9 mm/s to weld the clamp. The welding results are shown in Figure 15. The top view shows that the grasper is not fully welded, and the grasper around the weld is damaged due to the high temperature, which is mainly caused by the improper selection of laser angle and the slow welding speed. The side view shows that there is a large volume of molten metal at the welding site, which changes the original morphology of the grasping forceps, which will increase the workload of subsequent processing and is not conducive to actual production. It can be seen from the above analysis that although the amorphous alloy does not undergo crystallization and the maximum bending strength is large at 300 W-9 mm/s, the small volume of the grasping forceps cannot withstand the higher temperature generated by this parameter, resulting in damage around the welding line of the grasping forceps and large changes in the morphology. Therefore, in the actual welding process to change the welding parameters, continue to reduce the welding temperature to achieve the desired effect.

5. Conclusions

In this paper, the CHT curves of the Vit1 amorphous alloy are fitted by the Kissinger equation and the VFT equation, respectively, and the temperature field curves are obtained by computer simulation, predicting the crystallization of amorphous alloy during laser welding. Although the VFT fitting and the Kissinger fitting almost coincide in large time intervals, they are far apart in small time intervals. Because the welding speed is fast, which leads to a small time interval, two kinds of CHT curves are fitted to verify their ability of predicting crystallization in laser welding.
To investigate whether the CHT curve can be used to predict the crystallization of the Vit1 amorphous alloy in laser welding, experiments are carried out. It can be seen from SEM images that 300 W-3 mm/s causes serious crystallization and produces large crystals. With the increase in welding speed, the size of the crystals decreases. XRD results show that the samples at 300 W-3 mm/s and 300 W-6 mm/s crystallize, while the samples under 300 W-9 mm/s and 300 W-12 mm/s remain amorphous, which is consistent with the predicted results of the CHT curve fitted by the VFT equation. The results show that the CHT curves fitted by the VFT equation can be used to accurately predict the crystallization of the Vit1 amorphous alloy in laser welding.
In addition to predicting crystallization, physical experiments show that the change of welding parameters will also change the flexural strength of the weldment. With the increase in welding speed, the maximum flexural strength of the specimen increases first and then decreases. In general, laser welding will reduce the bending strength of welded parts. In future work, we will continue to conduct an in-depth study on the effects of welding parameters and crystallization degree on the strength of welded components (including welding seams and substrates). In addition, we may also investigate the effects of welding parameters and crystallization degree on the stiffness, hardness, corrosion resistance, antibacterial properties, and other aspects of the welded components. Both stiffness and strength may affect service performance of the welded components. Hardness may affect the processing performance of the welded parts, especially when it comes to grinding processes. Corrosion resistance and antibacterial properties are the properties that need to be considered when the welded components are applied in specific chemical and healthcare fields. For the potential applications of the results of this study in the fields of science and engineering, we also recommend considering the comprehensive performance of welded components in various aspects such as stiffness, hardness, corrosion resistance, and antibacterial properties to meet their specific application needs.
The results of this study can be used for providing technical support for the production of various amorphous alloy products, especially for the processing and manufacturing of various medical devices. This will facilitate the optimization of relevant process flow and the improvement of product performance.

Author Contributions

S.Y. conceived this project and worked with C.S., L.H. (Lingling Huang), L.H. (Liang Han) and C.W. to set up the project team. S.Y. and C.S. carried out structural design, finite element simulation, experiments for laser welding, microstructure characterizations and degradation measurements. L.H. (Liang Han) performed experiments and collected the relevant data and analyzed. All the authors contributed to the writing of manuscript. All authors have read and agreed to the published version of the manuscript.

Funding

This work was supported by the National Natural Science Foundation of China (Grant No.: 51735003) and the National Key R&D Program of the Ministry of Science and Technology—digital medical equipment R&D (Grant No.: 2019YFC0120402).

Data Availability Statement

Not applicable.

Conflicts of Interest

The authors declare no conflict of interest.

References

  1. Wang, Q.; Han, P.; Yin, S.; Niu, W.-J.; Zhai, L.; Li, X.; Mao, X.; Han, Y. Current Research Status on Cold Sprayed Amorphous Alloy Coatings: A Review. Coatings 2021, 11, 206. [Google Scholar] [CrossRef]
  2. Shen, J.; Lopes, J.G.; Zeng, Z.; Choi, Y.T.; Maawad, E.; Schell, N.; Kim, H.S.; Mishra, R.S.; Oliveira, J.P. Deformation behavior and strengthening effects of an eutectic AlCoCrFeNi2.1 high entropy alloy probed by in-situ synchrotron X-ray diffraction and post-mortem EBSD. Mater. Sci. Eng. A 2023, 872, 144946. [Google Scholar] [CrossRef]
  3. Terekhov, S.V. Single- and Multistage Crystallization of Amorphous Alloys. Phys. Met. Metallogr. 2020, 121, 664–669. [Google Scholar] [CrossRef]
  4. Kuvandikov, O.K.; Subkhankulov, I.; Amonov, B.U.; Imamnazarov, D.H. Physical Properties of High-Cobalt Amorphous Alloys. Metallofiz. I Noveishie Tekhnol. 2021, 43, 1601–1609. [Google Scholar] [CrossRef]
  5. Meagher, P.; O’Cearbhaill, E.D.; Byrne, J.H.; Browne, D.J. Bulk Metallic Glasses for Implantable Medical Devices and Surgical Tools. Adv. Mater. 2016, 28, 5755–5762. [Google Scholar] [CrossRef] [Green Version]
  6. Loye, A.M.; Kwon, H.K.; Dellal, D.; Ojeda, R.; Lee, S.; Davis, R.; Nagle, N.; Doukas, P.G.; Schroers, J.; Lee, F.Y.; et al. Biocompatibility of platinum-based bulk metallic glass in orthopedic applications. Biomed. Mater. 2021, 16, 045018. [Google Scholar] [CrossRef]
  7. Rajan, S.T.; Arockiarajan, A. Thin film metallic glasses for bioimplants and surgical tools: A review. J. Alloys Compd. 2021, 876, 159939. [Google Scholar] [CrossRef]
  8. Rai, N.; Das, P.; Gollapudi, S. Can an amorphous alloy crystallize into a high entropy alloy? Model. Simul. Mater. Sci. Eng. 2022, 30, 025007. [Google Scholar] [CrossRef]
  9. Hasannaeimi, V.; Wang, X.; Salloom, R.; Xia, Z.; Schroers, J.; Mukherjee, S. Nanomanufacturing of Non-Noble Amorphous Alloys for Electrocatalysis. ACS Appl. Energy Mater. 2020, 3, 12099–12107. [Google Scholar] [CrossRef]
  10. Gerstl, S.S.A.; Schaublin, R.; Loffler, J. Nanoscale Clusters and Heterogeneities in Engineering and Amorphous Alloys. Microsc. Microanal. 2022, 28, 712–713. [Google Scholar] [CrossRef]
  11. Karna, S.; Cheepu, M.; Venkateswarulu, D.; Srikanth, V. Recent Developments and Research Progress on Friction Stir Welding of Titanium Alloys: An Overview. IOP Conf. Ser. Mater. Sci. Eng. 2018, 330, 012068. [Google Scholar] [CrossRef]
  12. Shanjeevi, C.; Arputhabalan, J.J.; Dutta, R.; Pradeep. Investigation on the Effect of Friction Welding Parameters on Impact Strength in Dissimilar Joints. IOP Conf. Ser. Mater. Sci. Eng. 2017, 197, 012069. [Google Scholar] [CrossRef]
  13. Jiang, M.Q.; Huang, B.M.; Jiang, Z.J.; Lu, C.; Dai, L.H. Joining of bulk metallic glass to brass by thick-walled cylinder explosion. Scr. Mater. 2015, 97, 17–20. [Google Scholar] [CrossRef]
  14. Yuan, Y.; Chen, P.; An, E.; Feng, J. Experimental Study on the Explosive Welding of Thin Al/Cu Composite Plates. Mater. Sci. Forum 2018, 910, 52–57. [Google Scholar] [CrossRef]
  15. Tariq, N.H.; Shakil, M.; Hasan, B.A.; Akhter, J.I.; Haq, M.A.; Awan, N.A. Electron beam brazing of Zr62Al13Ni7Cu18 bulk metallic glass with Ti metal. Vacuum 2014, 101, 98–101. [Google Scholar] [CrossRef]
  16. Qiao, J.; Yu, P.; Wu, Y.; Chen, T.; Du, Y.; Yang, J. A Compact Review of Laser Welding Technologies for Amorphous Alloys. Metals 2020, 10, 1690. [Google Scholar] [CrossRef]
  17. Yao, Y.; Tang, J.; Zhang, Y.; Hu, Y.; Wu, D. Development of Laser Fabrication Technology for Amorphous Alloys. Chin. J. Lasers-Zhongguo Jiguang 2021, 48, 174–189. [Google Scholar]
  18. Caiazzo, F.; Caggiano, A. Investigation of Laser Welding of Ti Alloys for Cognitive Process Parameters Selection. Materials 2018, 11, 632. [Google Scholar] [CrossRef] [Green Version]
  19. Xiao, R.; Zhao, Y.X.; Liu, H.B.; Oliveira, J.P.; Tan, C.W.; Xia, H.B.; Yang, J. Dissimilar laser spot welding of aluminum alloy to steel in keyhole mode. J. Non-Cryst. Solids 2022, 34, 012009. [Google Scholar] [CrossRef]
  20. Sun, J. Mechanical manufacturing technology and precision machining technology. In Proceedings of the Second International Conference on Cloud Computing and Mechatronic Engineering (I3CME 2022), Chendu, China, 17–19 June 2022; Volume 12339. [Google Scholar] [CrossRef]
  21. Wu, W.F.; Li, Y. Bulk metallic glass formation near intermetallic composition through liquid quenching. Appl. Phys. Lett. 2009, 95, 011906. [Google Scholar] [CrossRef]
  22. Zhang, Y.; Zhao, D.Q.; Pan, M.X.; Wang, W.H. Glass forming properties of Zr-based bulk metallic alloys. J. Non-Cryst. Solids 2003, 315, 206–210. [Google Scholar] [CrossRef]
  23. Zhang, H.R.; Zhang, S.; Shi, Z.L.; Wang, F.L.; Wei, C.; Ma, M.Z.; Liu, R.P. Corrosion behavior and mechanical properties of Vit1 metallic glasses prepared at different cooling rates. J. Alloys Compd. 2023, 934, 167848. [Google Scholar] [CrossRef]
  24. Ghosh, P.S.; Sen, A.; Chattopadhyaya, S.; Sharma, S.; Singh, J.; Dwivedi, S.P.; Saxena, A.; Khan, A.M.; Pimenov, D.Y.; Giasin, K. Prediction of Transient Temperature Distributions for Laser Welding of Dissimilar Metals. Appl. Sci. 2021, 11, 5829. [Google Scholar] [CrossRef]
  25. Liu, W.M.; Guo, C.; Wu, S.S.; Li, Y.; Ying, M.; Kang, T.Y. Influence of Laser Pulse Welding Power on Welding Joints of Zr-Based Amorphous Alloys. Cryst. Res. Technol. 2022, 57, 2200063. [Google Scholar] [CrossRef]
  26. Chen, B.; Shi, T.; Li, M.; Wen, C.; Liao, G. Crystallization of Zr55Cu30Al10Ni5 Bulk Metallic Glass in Laser Welding: Simulation and Experiment. Adv. Eng. Mater. 2015, 17, 483–490. [Google Scholar] [CrossRef]
  27. Xia, L.; Ding, D.; Shan, S.T.; Dong, Y.D. Evaluation of the thermal stability of Nd60Al20Co20 bulk metallic glass. Appl. Phys. Lett. 2007, 90, 111903. [Google Scholar] [CrossRef]
  28. Wei, X.; Wang, X.; Han, F.; Xie, H.; Wen, C.e. Thermal stability of the Al70Ni10Ti10Zr5Ta5 amorphous alloy powder fabricated by mechanical alloying. J. Alloys Compd. 2010, 496, 313–316. [Google Scholar] [CrossRef]
  29. He, M.; Zhang, Y.; Xia, L.; Yu, P. Kinetics and thermal stability of the Ni62Nb38–xTax(x=5, 10, 15, 20 and 25) bulk metallic glasses. Sci. China Phys. Mech. Astron. 2017, 60, 076111. [Google Scholar] [CrossRef]
  30. Shi, J.; Cui, C.; Zhao, L.; Ding, J.; Cui, S.; Liu, S.; Sun, Y. Thermodynamic calculation and thermal stability of Al-Y-Ce-Ni metallic glass. Mater. Res. Express 2018, 5, 025205. [Google Scholar] [CrossRef]
  31. Xu, Y.; Liang, W. Effect of room temperature ageing on structure and thermal stability of as-cast and deformed Pd40Ni40P20 metallic glass. Int. J. Mod. Phys. B 2018, 32, 1850225. [Google Scholar] [CrossRef]
  32. Zhao, Z.; Zhang, Z.; Wen, P.; Pan, M.X.; Zhao, D.; Wang, W.; Wang, W.L. A highly glass-forming alloy with low glass transition temperature. Appl. Phys. Lett. 2003, 82, 4699–4701. [Google Scholar] [CrossRef]
  33. Ding, D.; Xia, L.; Shan, S.-T.; Dong, Y.-D. Long-term thermal stability of binary Cu50.3Zr49.7 bulk metallic glass. Chin. Phys. Lett. 2008, 25, 306–309. [Google Scholar] [CrossRef]
  34. Cheng, S.; Wang, C.; Ma, M.; Shan, D.; Guo, B. Non-isothermal crystallization kinetics of Zr41.2Ti13.8Cu12.5Ni10Be22.5 amorphous alloy. Thermochim. A Acta 2014, 587, 11–17. [Google Scholar] [CrossRef]
  35. Yamasaki, M.; Kagao, S.; Kawamura, Y.; Yoshimura, K. Thermal diffusivity and conductivity of supercooled liquid in Zr41Ti14Cu12Ni10Be23 metallic glass. Appl. Phys. Lett. 2004, 84, 4653–4655. [Google Scholar] [CrossRef]
  36. Chen, B.; Shi, T.L.; Li, M.; Yang, F.; Yan, F.; Liao, G.L. Laser welding of annealed Zr55Cu30Ni5Al10 bulk metallic glass. Intermetallics 2014, 46, 111–117. [Google Scholar] [CrossRef]
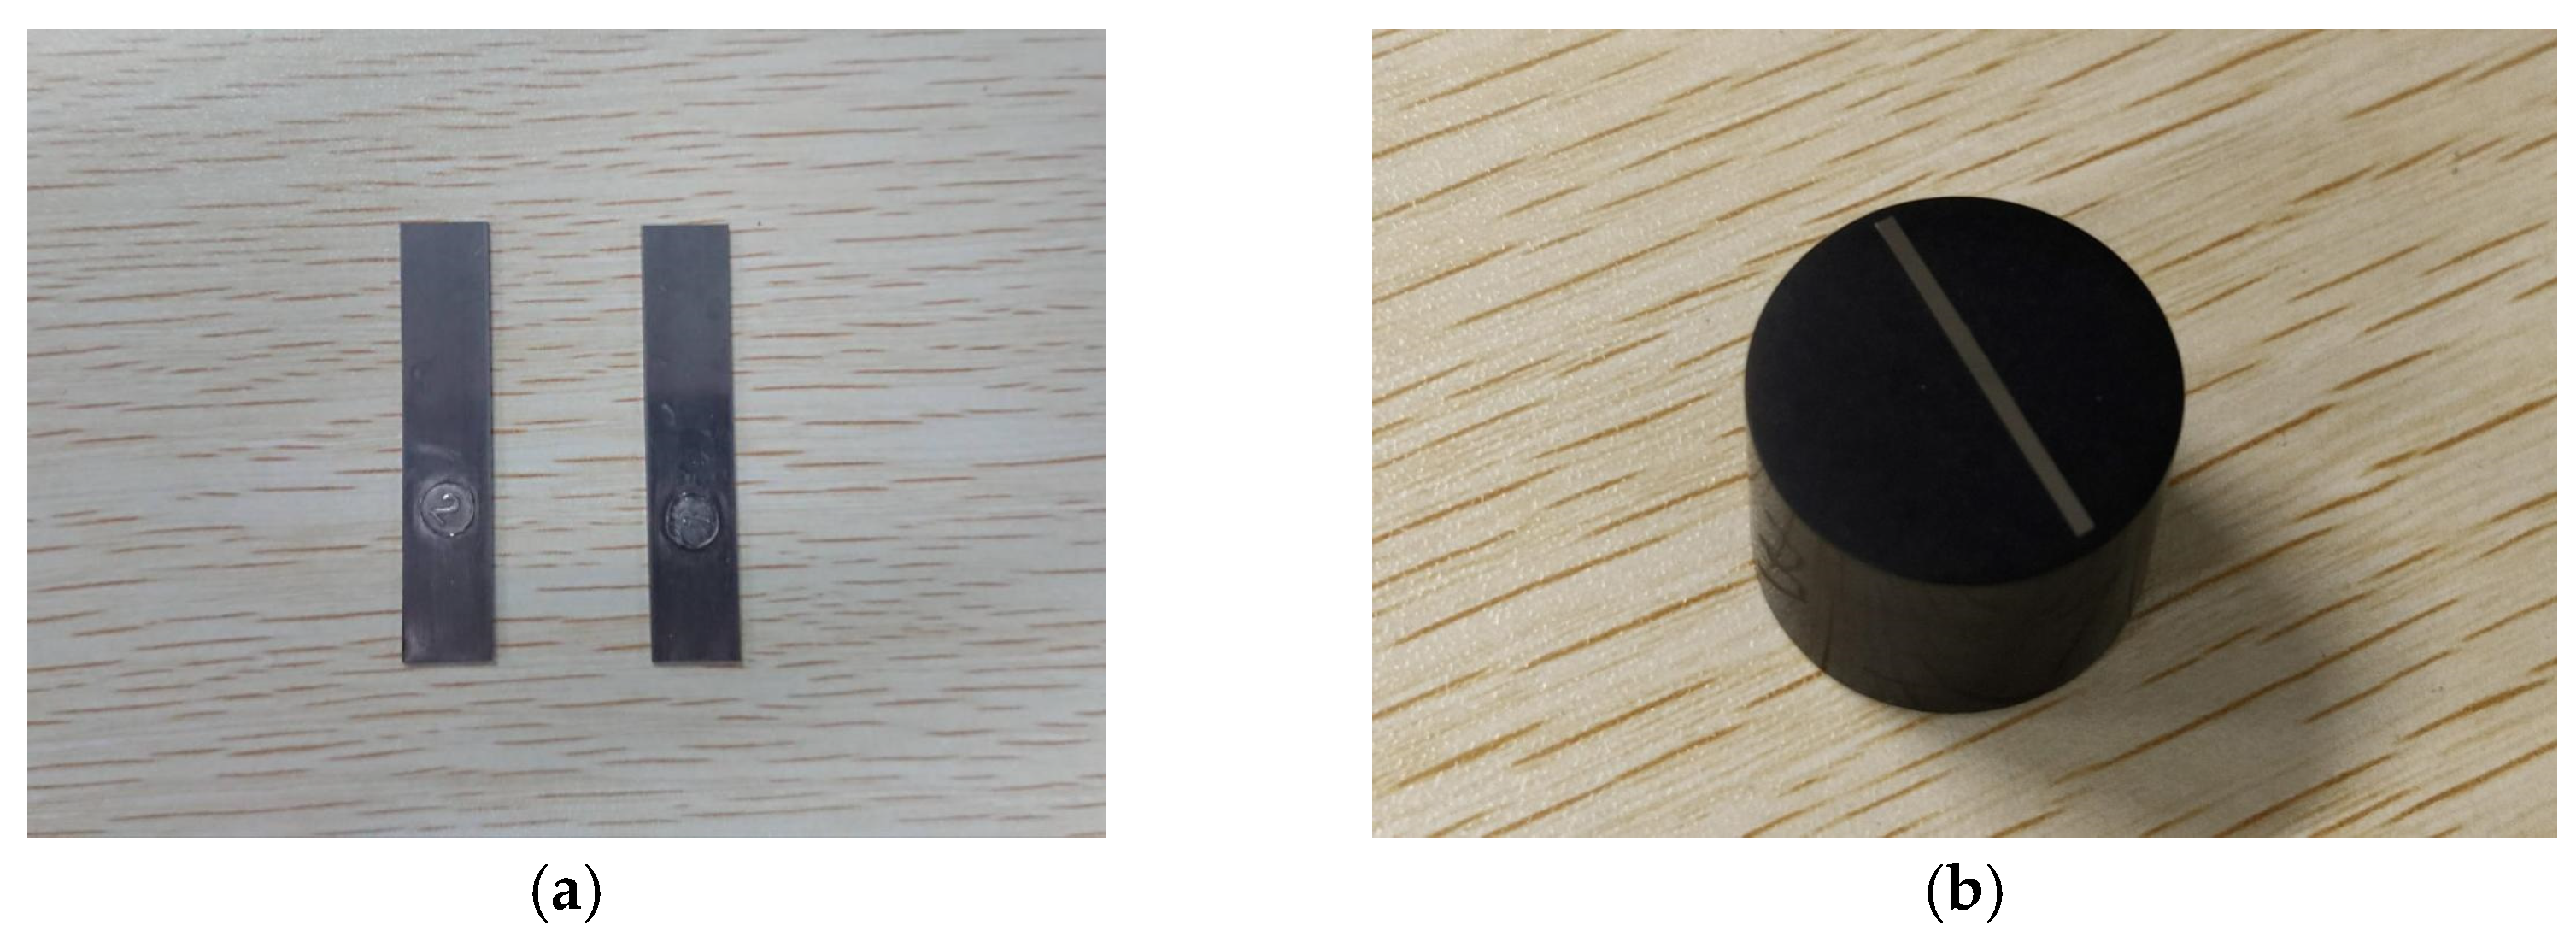
Figure 1. Experimental amorphous alloy sample strips and block to be observed: (a) amorphous alloy sample strips, (b) block to be observed.
Metals 13 01283 g001
Figure 2. Kissinger plot of ln( T x 2 /α) vs. 1000/T for Vit1.
Metals 13 01283 g002
Figure 3. VFT plot of ln(α) vs. T for Vit1.
Metals 13 01283 g003
Figure 4. Plots of VFT fitting and Kissinger fitting.
Metals 13 01283 g004
Figure 5. VFT fitting and Kissinger fitting at a short time interval.
Metals 13 01283 g005
Figure 6. Simulation model for laser welding. Both amorphous alloy sample A and amorphous alloy sample B with dimensions of 50 × 5 × 2 mm3.
Metals 13 01283 g006
Figure 7. The temperature field curves along the weld line at 300 W-12 mm/s.
Metals 13 01283 g007
Figure 8. The temperature field curve is normal to point C at 300 W-12 mm/s.
Metals 13 01283 g008
Figure 9. The CHT curves and the temperature field curves.
Metals 13 01283 g009
Figure 10. Laser welding results, (ad) corresponding to Samples 1–4.
Metals 13 01283 g010
Figure 11. Electron microscopy images of the heat-affected zone, (ad) corresponding to samples 1–4.
Metals 13 01283 g011
Figure 12. SEM images of the welded zone, (ad) correspond to samples 1–4.
Metals 13 01283 g012
Figure 13. XRD patterns of 4 samples.
Metals 13 01283 g013
Figure 14. The stress–strain curves from three-point bend tests.
Metals 13 01283 g014
Figure 15. Gripper laser welding results.
Metals 13 01283 g015
Table 1. The characteristic temperature of Vit1.
Heating
Rate (K/min)
Tg (K)Tx (K)Tp1 (K)Tp2 (K)Tp3 (K)
5 623682-726-
10 627697-735-
20 630712726746802
30 633724736754808
40 636732744759815
Table 2. Parameters required in the simulation.
Temperature (K)Specific Heat
(J·g−1·K−1)
Thermal Conductivity (W·m−1·K−1)Density
(×10−6, kg·mm−3)
3000.3824.56.12
4400.4116.56.12
5800.52310.86.12
6500.72414.66.13
7000.54317.06.19
Table 3. Parameters used in laser welding.
Sample NumberPower (W)Speed (mm/s)
13003
23006
33009
430012
Disclaimer/Publisher’s Note: The statements, opinions and data contained in all publications are solely those of the individual author(s) and contributor(s) and not of MDPI and/or the editor(s). MDPI and/or the editor(s) disclaim responsibility for any injury to people or property resulting from any ideas, methods, instructions or products referred to in the content.