Article

Thermally Activated Crack Growth and Fracture Toughness Evaluation of Pipeline Steels Using Acoustic Emission

by
Oleg G. Perveitalov
1,*,
Viktor V. Nosov
2,
Andrey M. Schipachev
1 and
Alexey I. Alekhin
1
1
Department of Oil and Gas Transportation and Storage, Saint Petersburg Mining University, Saint Petersburg 199106, Russia
2
Department of Metrology, Instrumentation and Quality Management, Saint Petersburg Mining University, Saint Petersburg 199106, Russia
*
Author to whom correspondence should be addressed.
Metals 2023, 13(7), 1272; https://doi.org/10.3390/met13071272
Submission received: 25 May 2023 / Revised: 29 June 2023 / Accepted: 7 July 2023 / Published: 15 July 2023
(This article belongs to the Special Issue Fracture Mechanism and Fatigue Behaviour of Metallic Materials)

Abstract

:
The article presents an approach to assessing the fracture toughness of structural alloys based on thermally activated crack growth and recording acoustic emission signals. The kinetic and structural features of the stable growth of the initiated crack are estimated using a multilevel acoustic emission model based on the time dependence of the logarithm of the cumulative acoustic emission count. The article provides an evaluation of the stable kinetic constants included in the equation of the thermal fluctuation steps of a crack according to literature sources and using the acoustic emission method. It is shown that parameters such as activation energy, activation area before the crack tip, and the rate of non-activation crack growth are stable and show a satisfactory correspondence between the reference literature and real experiments. The approach does not require a set of laboratory experiments to determine the empirical constants of traditional crack growth rate equations, and it also differs in that it takes into account the unique features of the destruction of a particular specimen or technological equipment and allows for a non-destructive assessment of fracture toughness. The values obtained are conservative. The concentration criterion of destruction requires further investigation.

1. Introduction

Engineering approaches to determining the strength parameters [1,2,3] of fracture mechanics occupy an important place in the direction of increasing the service life of technological objects and various materials [4,5]. The modern global oil and gas industry is experiencing a serious upswing in all sectors, and predicting strength and durability is of paramount importance [6,7,8]. A special place is occupied by the issues of the strength and fracture of steels for the pipeline transportation of hydrocarbons [9,10]. A large number of scientific publications are devoted to the methods of evaluating these parameters [11,12], including the use of non-destructive testing methods [13,14,15,16]. The main parameters of fracture mechanics, such as the stress intensity factor and the J-integral, have become generally universal characteristics of structural materials, are listed in many reference books, and are constantly used by practicing engineers. For technical equipment, which from the start of operation has many microdefects and structural heterogeneities, these indicators allow us to predict the remaining service life based on the laws of stable crack growth [17,18,19,20,21,22]. When the critical values of the stress intensity factor (SIF) and the J-integral are reached, the transition to unstable crack growth begins at a speed exceeding the speed of sound. In this sense, most of the models for determining these parameters are phenomenological in nature and require additional physical justification, including in the field of accumulation of microcracks before the initiation of a macro-crack.
In this sense, it is necessary to develop an approach that could predict the critical values of SIF at the stage of subcritical crack growth of pipeline steels using the obtained data on the kinetics of this process. This may occur when operating equipment that already has cracks. During the tests of such objects, the kinetics of the stable growth of active cracks and information about structural features in the defect area can be obtained using some non-destructive testing methods. This article proposes an approach to assessing the fracture toughness of structural steels using the acoustic emission method, which is based on the concept of the thermal fluctuation nature of the processes of the destruction of atomic bonds at the tip of the initiated crack.
The acoustic emission (AE) method, which has proven itself as one of the main methods for monitoring the accumulation of damage in structural materials, has also been used by researchers to predict the formation and growth of cracks [19,20,23]. Despite the predominance of traditional crack growth models [17,24], there is another direction based on the thermal fluctuation nature of crack growth. In this case, time becomes the main parameter of the evolution of destruction [25], containing information about the structural change of the body during the breaking of bonds due to thermal fluctuations in the crystal lattice. The purpose of the article is to calculate the fracture toughness of structural alloys using acoustic emission. The physical basis of the approach is the theory of thermally activated crack growth. In the first part of the article, it describes in detail the thermally activated crack growth and determines the parameters included in the main equation of the Arrhenius type. The logical result of the article is an equation for calculating fracture toughness, with which it is proposed to determine the fracture toughness of structural alloys. This equation includes a structure parameter, whose value is determined during acoustic emission tests. We also propose a tool and other structural steels. However, the principles of destruction and structural features can be taken into account in the proposed approach. The parameters that maintain constant values were calculated using a large set of reference data for a wide variety of steel grades. In addition, the thermally activated form of the equation for the crack growth rate is common for most solids that have a fraction of a brittle fracture, not just pipeline steels.

2. Materials and Methods

2.1. Fracture Mechanics and Thermally Activated Crack Growth

Fracture mechanics and thermal fluctuation theory are two areas that have long been developed in the science of the strength and durability of solids. While fracture mechanics are engaged in calculating the strength of structures in a complex stress-strain state and operate with methods of linear and nonlinear mechanics [26], thermal fluctuation theory is aimed at studying elementary acts of deformation and destruction [27]. Despite the fact that the area of crack development is common to these directions, to date, the relationship between these two directions is poorly understood.
The main equations of fracture mechanics are based on the Griffith energy criterion. According to this, the growth of cracks in brittle bodies is accompanied by the formation of new surfaces that increase the free energy of the body. The energy sources of this process are the work that is performed by external forces and the change in the elastic energy of the body:
F = F F 0 = F e + F s F 0
where F ,     F 0 ,   F e ,     F s are the change in the free energy of a body containing a crack, the free energy of a body without a crack, the decrease in elastic energy, and the change in surface energy, respectively.
In an infinite plate of unit thickness, the growth of a crack with a length of 2 l perpendicular to the plane of tension is accompanied by a decrease in elastic energy:
F e = π l 2 σ 2 E
where E is Young’s modulus.
In the case of a brittle fracture without the formation of dislocations at the crack tip, the energy value of the newly created surface is as follows:
F s = 4 l α
where α is the specific surface energy.
Then, the state of equilibrium is determined by the expression:
F s + F e = π l 2 σ 2 E + 4 l α
According to the Griffith concept, an existing crack will begin to spread avalanche-like if the rate of release of the elastic deformation energy exceeds the increase in the surface energy of the body:
l ( π l 2 σ 2 E 4 l α ) > 0
Hence, the driving force per unit length is as follows:
f = F ( 2 l ) = π l σ 2 E 2 α
The first term on the right is related to the rate of release of elastic energy per unit length. By entering the SIF parameter we can obtain:
f e = F e ( 2 l ) = K 2 E
K = Y σ π l
where Y is the parameter that takes into account the geometric characteristics of the sample and the crack.
However, the Griffith criterion has a number of limitations [28], including in terms of the kinetic nature of strength. Unlike brittle materials such as glass, most structural materials exhibit plastic properties when destroyed. These mechanical energy losses for plastic deformation are many times higher than the free surface energy (the energy required for the propagation of the plasticity zone controls the crack growth). Experimental studies by Irwin and Orovan have confirmed that when α is replaced by the dissipation energy in a thin layer of plastic deformations near the crack surface (several orders of magnitude greater than the surface energy of an ideally brittle separation), the Griffith criterion is valid. In addition, more complex geometric configurations of cracks caused difficulties in calculating the critical stress. Despite the fact that the linear elastic model is a good approximation of some fracture conditions, complex nonlinear elastic and plastic problems are more common in the destruction of structural materials. Irwin [29] proposed a force criterion, according to which, in order to solve the problem of crack growth, it is necessary to find stress intensity factors on the crack tip from a purely elastic (linear) problem, which in turn would describe the local distribution of stresses, displacements, and deformations near the edge. Further analysis would be purely algebraic in nature.
Comments were also made [30] regarding (1) the difficulty of determining physical characteristics such as surface energy or plastic zone that require the assessment of other relevant characteristics; (2) not taking into account the microstructure before the crack tip (formation of micro-voids, pores, microcracks, their coalescence and subsequent connection with the main crack); (3) the absence of a time dependence of destruction, in accordance with which, under the influence of the applied load, damage accumulates at different scale levels, and not when any critical value is reached; (4) taking into account the failure time factor, not only in the area of high crack growth rates, but also in the area of subcritical crack development, where the dynamic effect is insignificant, there is the question of the temperature dependence of the crack formation process. In the case of small crack growth rates corresponding to a wide range of fracture processes, the stress intensity coefficient demonstrates a strong dependence on temperature and loading speed. Therefore, it is obvious that the process of stable crack growth should be described in terms of thermal fluctuation theory [31]. (5) The main condition for the energy transition is formulated from the point of view of the thermodynamic principle, in which the crack development occurs according to a thermodynamically more favorable scenario. The conditions of the general energy balance are insufficient to describe the crack growth; the localization of energy with a greater force component occurs in the area of the crack tip, where active destruction processes occur. This fundamental difference from the thermal fluctuation parameters of fracture, which characterize a different type of phase transition, was also pointed out in works on the kinetic nature of strength [32]. Attempts to answer the question of how exactly the intensity of stress affects the rate of crack formation inevitably run into the need for a kinetic formulation of the problem. Although several equations of thermally activated crack growth have been proposed [17,33,34,35], the question of the choice of the thermodynamic state function remains open [36,37,38,39].
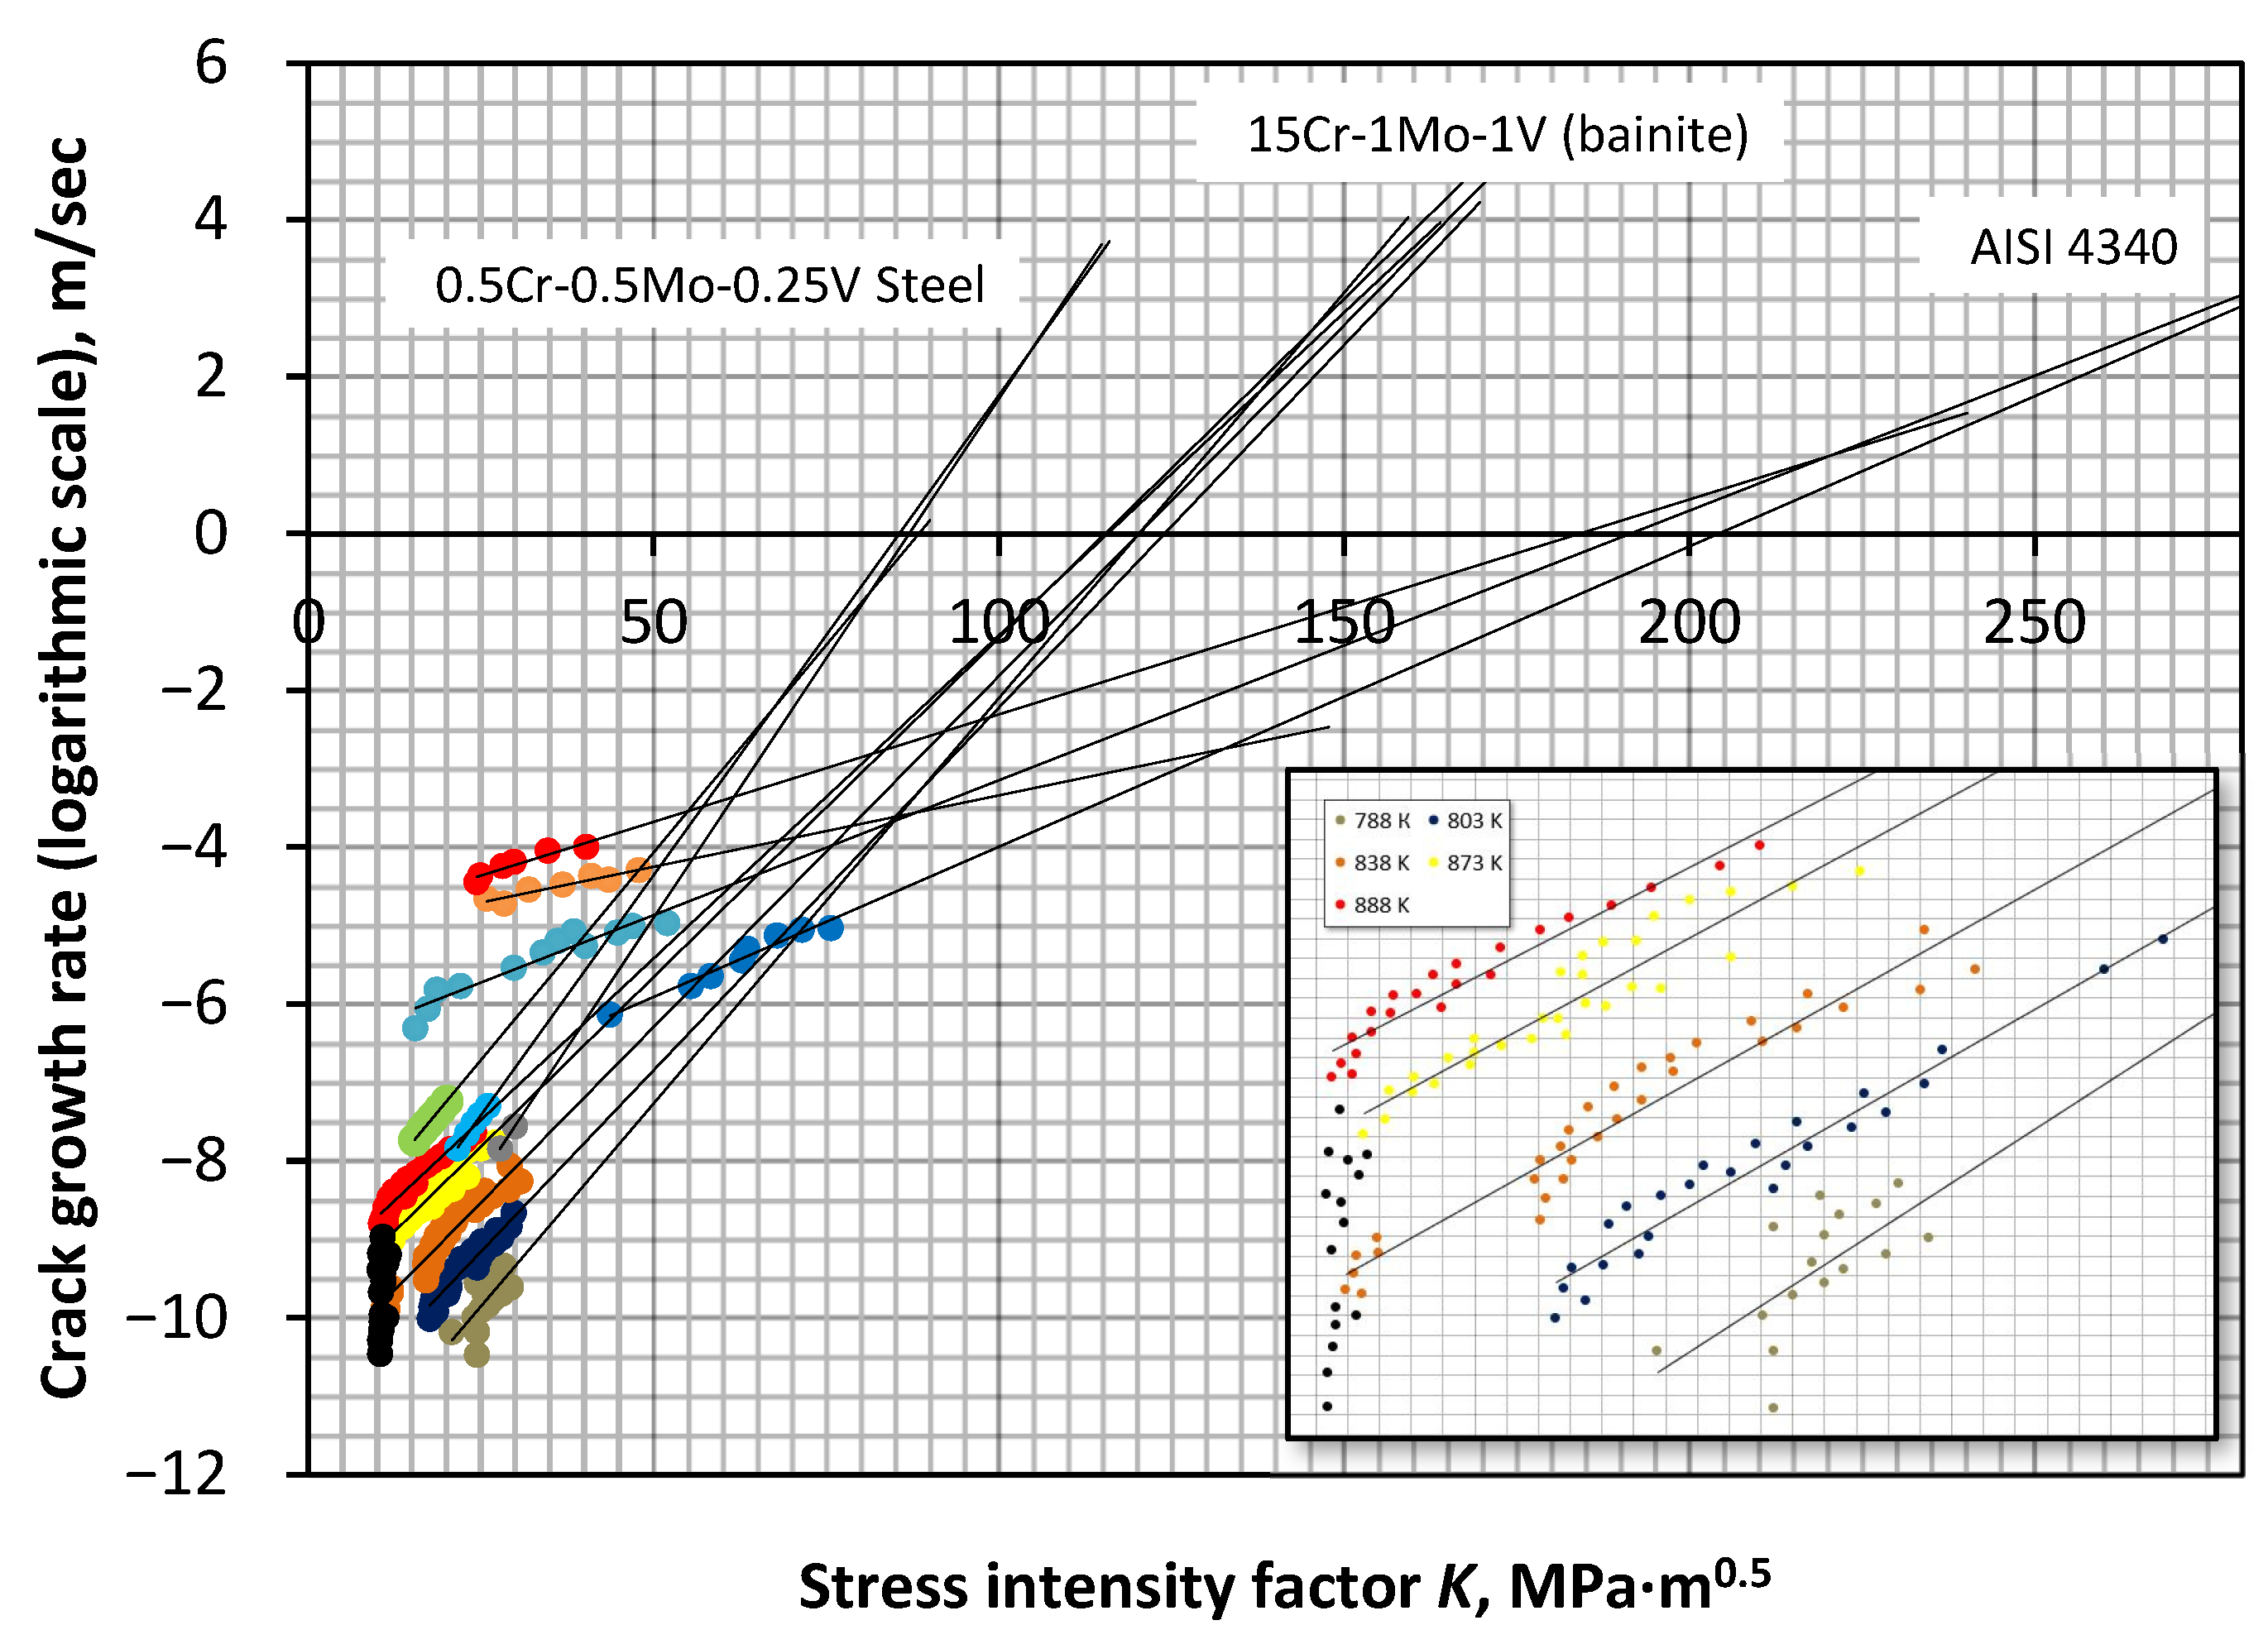
It is well known that the dependence of the crack propagation velocity on the stress intensity factor for real materials generally has several regions (Figure 1). At the first region, the lowest values of the SIF (hence, mechanical fracture work) correspond to large values of the crack growth rate, which are associated with the initial crack rate. The asymptotic increase in the velocity at this site is associated, on the one hand, with a sharp overcoming of the energy barrier, which is responsible for the “healing” and reconnection of atomic bonds, and on the other, by the influence of the external environment and a decrease in the bond energy due to chemical reactions with the surrounding gas or liquid [31]. The high concentration of stresses in the activation volumes of the atomic lattice at the initial regions of the growth of the main crack may be the reason for the rapid growth of the crack until the process of relaxation and the emission of dislocations in the area before the crack transfer the process to the stage of stable growth of SIF. In addition, in the case of exposure to corrosive media at region II, a horizontal plateau of the graph may be observed. This is explained by the fact that the process of substance transfer, such as diffusion to the crack tip (weakly dependent on mechanical load), makes the main contribution to crack growth. In the case of higher values of SIF in the III region or tests in inert media, it is thermal activation that controls the breaking of bonds at the crack tip and controls its speed. The dependence of the crack growth rate on SIF becomes smoother (Figure 1), without clear plateaus in region II, due to the strong exposure to the environment.
On the other hand, examples of energy barriers can be the breaking of bonds in the lattice and molecules in polymers, as well as the diffusion of molecular and atomic segments [40], the diffusion of chemical components into the tip region, and the formation of microcracks that preclude plastic deformation [31]. It follows from this that each individual linear section of the graph is characterized by its speed of overcoming a certain set of energy barriers (which can form sequential or parallel systems [30]) and its individual kinetic parameters, which reflect the contribution of various physical processes to the overall crack growth.
Given Equations (5) and (6), the equilibrium state at which the crack will not grow ( l > l 0 ) and close ( l < l 0 ) corresponds to the maximum value F for the critical half-length of the crack l 0 = 2 α E π σ 2 . From the point of view of the thermal activation of the elementary act of bond breaking, crack stabilization occurs when external forces reach such a value of the bond energy of atoms, after which the interaction between them ceases and the bond is broken. This interpretation of the problem takes into account the local heterogeneity of the body and the discrete atomic structure of the substance. In this case, the rate of breaking the bonds at the tip is activated by temperature and stress. Overcoming such energy barriers is described by a general equation, which is the result of the theory of transition states. A schematic representation of overcoming the energy barrier is shown in Figure 2. The speed of the process is described as follows [31]:
v = v 0 e F k T
where v 0 is the non-activation crack growth rate; F is the difference in free energy between the equilibrium position in front of the barrier and the point that is top of the barrier; k is the Boltzmann constant; T is temperature. The second multiplier represents the probability of the thermal fluctuation transition of the system to a state with free energy greater by F .
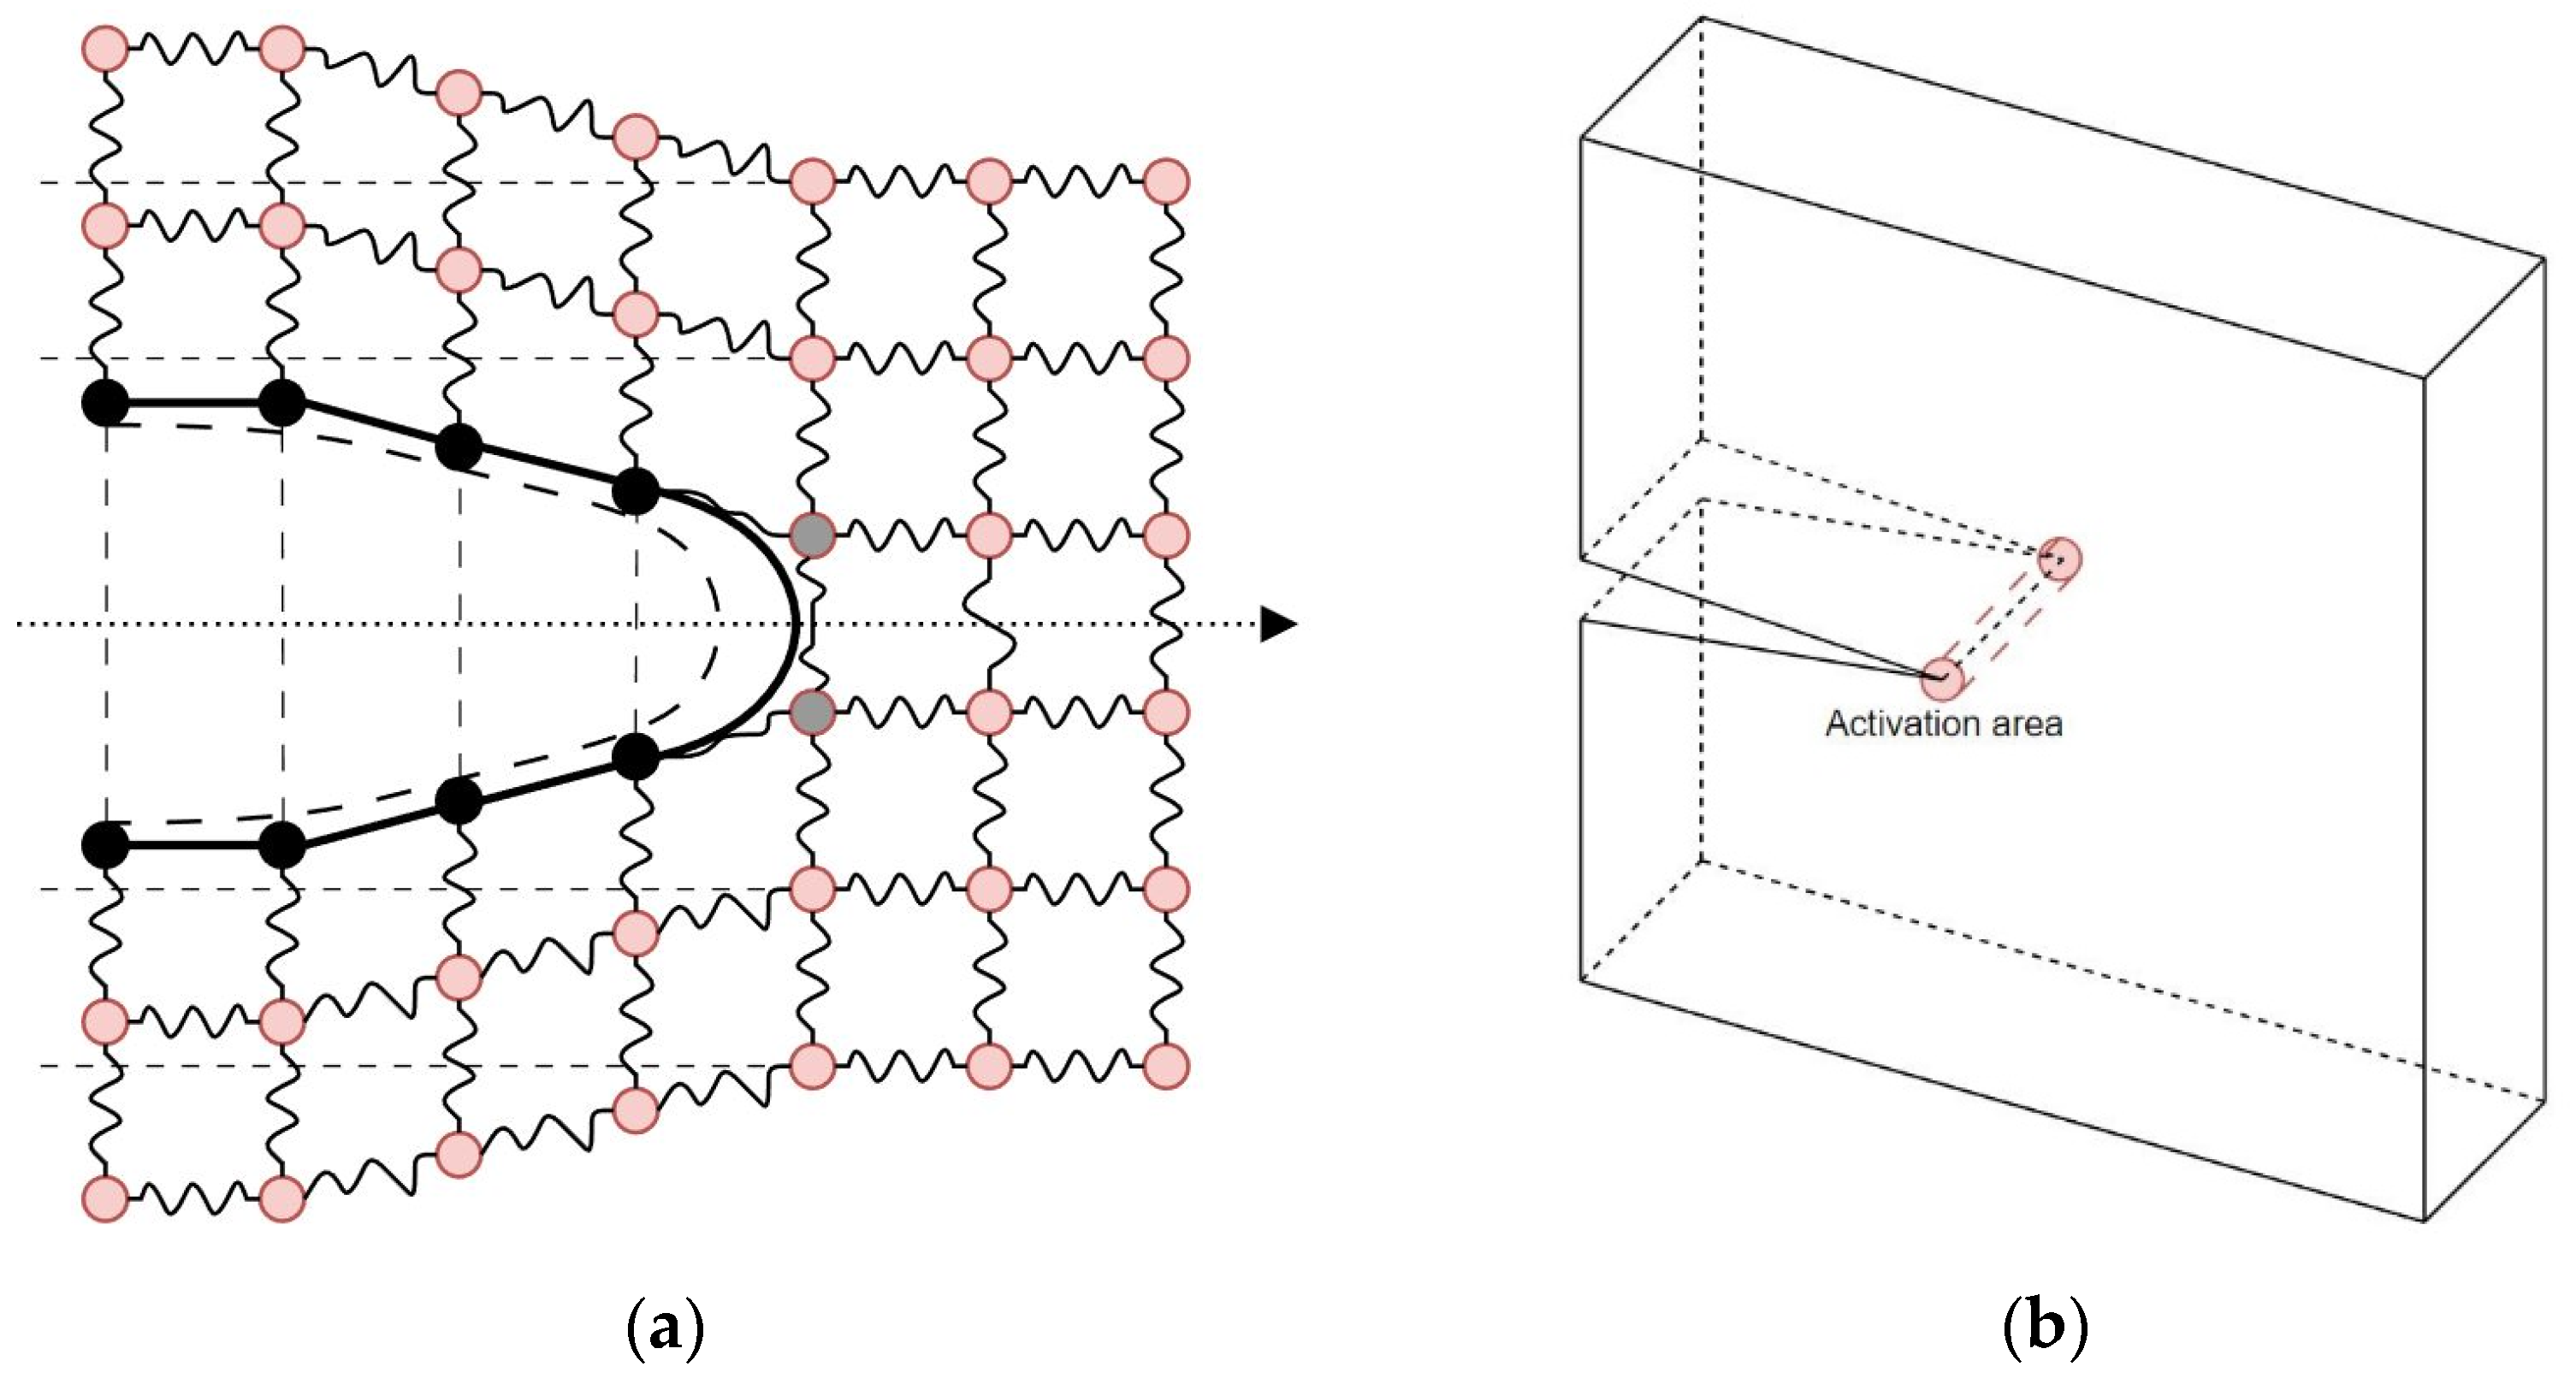
Here, the thermodynamic description of energy balance is generalized to the processes of crack growth at the atomic level, where the crack front interacts with localized obstacles in the form of “energy wells” (Figure 2a). Successive crack jumps are accompanied by a change in the total stored energy in the stressed bonds near the crack tip, depending on the size of the tip displacement within one lattice cell. The localization of the tip is determined by the center of elastic displacement and the stress state away from the crack front [31]. Equation (9) is of a statistical nature, since the waiting time for a destructive thermal fluctuation is determined by the moment when, during the vibrations of the atoms, the position of the atoms will be reached, which, together with the applied force, will provide a bond break.
A number of equations have been proposed linking the waiting time for overcoming the energy barrier with the stress intensity coefficient, the main equations of which differ depending on the specific assumptions made [41]. Despite some formal similarity with thermally activated dislocation motion [42,43,44], there are serious differences in determining the kinetic parameters of both processes and the fact that dislocation is a true lattice defect, whereas a crack is a boundary problem. Therefore, further research is required to link the phenomenological phenomena of activation with the thermal fluctuation mechanism of breaking the bonds of atoms. The brittle fracture region, where the crack velocity depends on the breaking of individual bonds and overcoming local barriers, allows us to give a theoretical explanation of the kinetic parameters of crack growth based on a comparison with an experiment.
The most well-known phenomenological equations, but far from the only ones, the comparison of which was carried out in the paper [45], were proposed by Zhurkov [46]:
τ = τ 0 e U 0 γ σ k T
where τ is the time before the destruction of the body; τ 0 is the pre-exponential multiplier, which corresponds to the period of the attempt to overcome the potential barrier, which corresponds to the period of fluctuations of atoms (10−13 s); U 0 is the activation energy of destruction (a potential barrier that must be overcome during thermal fluctuations of atoms and under the action of tension of the atomic bond); γ is the structural parameter; σ is the applied stress; k is the Boltzmann constant; T is temperature;
Wiederhorn’s phenomenological expression linking crack growth rate and stress intensity factor is shown as follows [47,48]:
v = v 0 exp A 0 + b K k T
where K is the stress intensity factor; v 0 , A 0 , b are experimental constants;
and its theoretical interpretation for brittle fracture is as follows:
v = v 0 exp F k T = v 0 exp H + 2 K V 3 π ρ k T = v 0 exp A 0 + b K k T
where
F = H + P V T S
H is the activation enthalpy (commonly referred to as activation energy A 0 ); P is the pressure at the tip of the crack; V is the activation volume; S is the entropy of activation (after simplification is part of the pre-exponential multiplier v 0 ); b is a coefficient proportional to the activation volume, for an elliptical crack the equation is as follows:
b = 2 V / 3 π ρ
where ρ is the radius of curvature of the crack tip.
The expression proposed by Atkins is shown as follows [33,34]:
v = A 1 exp A 0 + λ f e k T = A 1 exp A 0 + λ K 2 E k T
where A 1 and λ are constants; A 0 is the activation energy.
Kawasaki [49] proposed an equation for creep crack growth:
v = A 1 K δ 1 exp A 0 + 1 m ln K k T
where A 1 and m are constants; δ 1 is the stress-sensitive parameter.
Let us consider a simple case when a thin section is selected at the crack front that corresponds to one energy barrier. As the crack grows, the barriers will be overcome sequentially one at a time. The crack rate will be regulated by the thermal activation of overcoming barriers. With this form of expression, it is necessary to use a parameter that would describe the mechanical effect on the crack as a system, regardless of the geometry of the sample. In Equation (10), such a parameter is γ σ , which takes into account the unique structure of a real body in the barrier region. From the point of view of fracture mechanics, this parameter can be the stress intensity factor or the tensile strength of the crack per unit area. Considerations regarding the thermodynamic explanation of overcoming barriers were presented in Pollet’s paper [39].
The total energy of a thermodynamic system Is represented by the sum of energy terms, which in turn are the product of intensive (independent of the spatial characteristics of the system) and extensive (related to the area or volume of the system) values. Since it is difficult to express mechanical energy as the product of the SIF (intensive variable) by any spatial (extensive) variable due to the l included in the SIF, it is more appropriate to express it using the driving force of crack expansion (intensive) in units of energy per unit area, which would describe the effect of mechanical force on the growing a crack. Then, the product of this multiplier on the area of the activated area is expressed in the form of the work of surface tension forces. At the same time, the specific type of energy barrier, whether it is local obstacles in the way of a crack or processes in the tip region, does not matter, since the energy balance of the entire element is taken into account.
Taking into account the above, Equation (9) is written as follows in general form [39]:
v = v 0 e F ( f e , T , P , σ i , s ) k T
where f e is the driving force of crack expansion per unit length of its profile; P is the hydrostatic pressure; σ i is the external stress that does not affect the crack; s is the structurally sensitive parameter.
Let us assume that the structure (for example, the concentration of local obstacles per unit area of the fracture surface) in the area of interest remains constant throughout this stage of destruction and the pre-exponential multiplier is also a stable parameter within this process. Then, the equation for the Gibbs free energy for a body with a growing crack can be written as follows:
F = U + P V T S f e A i σ i V i
where U is the internal energy; V is the body volume; A is the destruction surface area; S is the entropy of the system.
Since we are only interested in the thermally activated “jumps” of the crack, to simplify, P = c o n s t and σ i = c o n s t . Then, in Equation (17), the crack rate depends only on f e , and T takes the following form:
v = v 0 e F ( f e , T ) k T
From the expression of the full differential of the function we can obtain the following [39]:
ln v f e T · f e T ln a · T ln v f e = 1
The verification of expression (19) is performed in the experimental proof of Equation (20). The differentials for Gibbs energy and Helmholtz energy are equal:
d F = A d f e S d T
d Γ = S d T f e d A
where A is the area of the fracture surface of the crack part, which determines its position along the crack trajectory; f e is the driving force per unit crack length that supports the crack in the equilibrium position. Considering Equation (21) for an isothermal reversible process, the free energy can be found as follows:
F = f e f e C A d f e
where f e is the effective crack expansion force; f e C is the critical value of the crack expansion force at which the crack grows at the rate v 0 ; A is the area of the activation zone.
In the absence of external efforts, the total activation energy can be found as follows:
F 0 = 0 f e C A d f e
This condition requires an equal amount of energy to overcome the energy barrier [39]:
F 0 = Γ
Reverse recombination at high values f e is extremely unlikely [30,39]. Then, taking into account (24) and (25), Equation (19) can be rewritten [39] as:
v = v 0 exp F 0 k T exp 1 k T 0 f e A d f e
Further interest determines the parameters of Equation (26) and establishes quantitative relationships between them using data on the temperature dependence of the crack growth rate on the effective crack expansion force or stress intensity factor. Having determined the fracture kinetics at a certain stage, and, accordingly, the kinetic parameters of Equation (26), it is possible to estimate the fracture toughness. As mentioned earlier, some authors have proposed functional dependences of the Arrhenius type, linking the crack growth rate v and the crack expansion force parameter f e , which can be divided into the following groups according to the form of expression. Thus, having available data on the crack growth rate for a given material, it is possible to determine the relationship between the thermodynamic activation region A (Figure 2b) and the crack expansion force f e , where b is the slope angle of the curve. The most common forms of equations relating the crack growth rate and the driving force of its growth are shown in Table 1.
Equation (9) is a general form of the Arrhenius-type equation, which is used not only for a number of crack growth equations but also for the following processes in fractures: dislocation movement, microcrack formation, destruction of solids, and others. The main parameters are the pre-exponential multiplier, the Boltzmann parameter, and the effective activation energy in the exponent.
Equation (19) is Equation (9) written in terms of energy balance and Gibbs free energy. This is especially important because the traditional calculation of the stress intensity factor is based on the balance between the change in the elastic energy of the body and the surface energy within the framework of the Griffith theory. This equation shows the relationship between two major trends in the science of failure: thermal activation and fracture mechanics.
After recording the energy balance in Equation (18), we leave only those terms that relate to crack growth. This is shown in Equations (21) and (22). These equations are included in four equations of thermodynamic potentials. Thus, the physical connection of crack growth with thermal activation is shown.
The main difference between the proposed models is how they consider the dependence of the free activation energy and stress, which can be a linear or quadratic function of the stress intensity factor.
The development of a large system is taking place in the direction of reducing free energy. In order to reproduce the energy balance at the atomic level, it is necessary to have information about the structural atomic displacements and the values of atomic potential. The comparison of the displacements of atoms at the crack tip with the displacements leading to this SIF value is expressed in the restriction of the atomistic region to the splitting plane in front of the crack. When each atomic bond is broken, atomic energy increases by the amount of bond energy per unit length and is also subject to periodic fluctuations of atomic energy. The stress intensity calculation implies the presence of two regions, one of which surrounds the crack tip (nonlinear energy behavior) and the other in which the condition of linear elasticity is preserved. Thus, the change in elastic energy in the region surrounding the crack when its tip is shifted by an atomic distance x , taking into account Equation (21), is defined as follows [39]:
F e = f e x = K 2 E x
Accordingly, the state of equilibrium in front of the barrier and “above” it can be if the forces holding the atoms together are equal to the elastic force f e . Then, in order to determine the change in the total energy by the crack expansion force, we introduce the value of the thermodynamic activation region from Equation (27):
A = d F d f e
In the article [39], it is shown that when integrating Equation (28), the atomic energy does not depend on the crack expansion force and the thermodynamic activation region is equal to the following:
A = d F d f e = l x
where l is a crack segment that moves over a distance when overcoming the barrier x (Figure 2a). It follows that A has the dimension of the area of the atomistic activation region, and the activation volume in thermally activated bond breaking is a function of the stress intensity factor.
The models that establish a linear relationship between the free activation energy and SIF are formulated by analogy with the thermodynamic state of a gas, where the work performed by pressure corresponds to the multiplier P V . From this point of view, the crack growth with a constant SIF acts on the critically loaded bond at the tip, and the activation volume is associated with the tension of this atomic bond. The main inaccuracy is that during the crack development, not only does the SIF change, but the displacement at the site of the critically loaded bond also changes, which leads to a crack expansion force proportional to K 2 [31]. Therefore, the design of experimental curves is most correctly constructed in the coordinate system ln v ~ K 2 , where the angle of inclination of the curve corresponds to the activation area A , comparable to the size of the atomic area. With this interpretation of the crack advance, it is possible to determine the kinetic parameters of various stages of thermal fluctuation macroscopic fracture.
Given the above Equation (26), proposed by Atkins [33], it can be rewritten as:
v = v 0 e F 0 λ f e k T = v 0 e F 0 β x 2 K 2 E k T
where x is the atomic size of the activation area; F 0 is the crack step activation energy; β is the proportionality coefficient between the atomic and thermodynamic activation region (in Atkins’ paper, β is called the fraction of work that is spent on breaking atomic bonds).
Therefore, the following can be obtained:
k T · ln v v 0 = F 0 + β x 2 K 2 E = F 0 + b K 2
Then, by plotting experimental curves of the dependence of the stress intensity factor on the crack velocity at different temperatures in the axes ln v ~ K or ln v ~ K 2 , we can find the value of the pre-exponential multiplier v 0 that is common to the entire fan of curves, where the condition of fully activated fracture is met:
F 0 = β x 2 K 2 E
Having received the value v 0 , the curves are plotted in the system k T · ln v v 0 ~ K 2 , where the intersection with the ordinate axis at the point K 2 = 0 gives the value of the total activation energy of the crack step. The slope angle of the curve in this coordinate system b includes information about the modulus of elasticity of the material and the actual activation area of the crack step. Considering that Equation (26) describes the crack growth rate, and not the waiting time for the jump at the point K 2 = 0 :
k T · ln v v 0 = F 0
However, in order to predict crack growth and the moment when fracture toughness values are reached, it is necessary to compare the obtained kinetic parameters with similar ones obtained using non-destructive testing methods of a real object or samples. For this purpose, a multilevel acoustic emission model based on a similar thermally activated mechanism for the formation of microcracks and the growth of the main crack was used.

2.2. Multilevel Acoustic Emission Model

The kinetic approach to destruction implies knowledge of the time characteristics of damage accumulation at various scale levels. Traditional destructive methods of damage monitoring based on the study of the number of microfractures, such as transmission and scanning microscopy, X-ray scattering, and precision density measurement, due to their nature and complexity, have limitations in application to real objects [51]. The acoustic emission method, which is a direct passive method of monitoring the accumulation of damage, is based on the registration of elastic waves emitted by the source of the change of the continuity of the body [52,53,54]. To solve the problem of thermally activated crack growth, each act of AE should be considered as containing information about a collective act of destruction, where time is the main parameter [25,55]. Therefore, the analysis of cumulative AE parameters allows us to obtain information about the kinetics of crack growth.
The study of the accumulation of microcracks with the help of AE before the initiation of a macrocrack is the subject of many scientific papers [18,25,56,57,58]. However, the AE method is still often used only as an indicator of the catastrophic destruction of real bodies, and the diagnostic results are compared with some standards. This, together with the hardware difficulties of diagnostics, limits the use of AE to identify the stages of destruction and to predict the destruction of real objects. The presented paper describes an approach to predicting the critical value of the stress intensity factor when the stage of stable crack growth transitions to avalanche-like destruction. There are a number of papers in the modern literature in which the results of AE tests for fracture toughness are presented [18,59,60,61,62]. In order to evaluate the critical parameters of fracture mechanics, it is necessary to describe the source of AE pulses at different stages of crack growth from the standpoint of thermally activated crack growth. For this purpose, a multilevel model of acoustic emission is proposed, where the time of the process of origin or growth of the defect is associated with the time of arrival of the signal. This makes it possible to distinguish different stages of damage accumulation by kinetic signs.
Regel [27], when developing the kinetic concept of strength, proposed an equation for describing thermally activated crack growth based on the same kinetic parameters as the Zhurkov formula. It can be written as:
d l d t = v = v 0 e U 0 γ σ k T
where U 0 and γ are parameters close in value to the parameters included in Equation (10), and v 0 is the rate without activation of crack growth, several orders of magnitude higher than the speed of sound in metal.
In the papers of Botvina [63,64], the criteria for the transition of destruction to the next large-scale level were discussed in detail. As indicated in the paper, for the case of the growth of a main crack, the area of damage that activates AE signals is located in front of the crack tip, and the sample damage increases due to the formation of microcracks and their coalescence with the main crack, while the area where the damage is taken into account shifts along with the tip of the crack. Similar assumptions have been revealed by a number of authors in works devoted to the interaction of microcracks with macro-cracks and the relationship of the concentration of microcracks in the area before the tip of the macro-crack with the stress intensity factor [65,66,67,68].
Then, the change in the concentration of microcracks and the waiting time for the main crack to advance during one thermally fluctuation step can be expressed as follows:
d C ( t ) d t = C 0 C ( t ) τ ( t ) = v ( t ) ( C 0 C ( t ) ) l
where C 0 is the initial concentration of structural elements (potential number of microcracks); C ( t ) is the time dependence of microcrack concentration; τ ( t ) is the crack step waiting time; v ( t ) is the time dependence of the crack growth rate; l is the length of the elementary step of the crack when overcoming the barrier, close to the interatomic distance (2−3·10−10 m).
Integrating the expression (32):
0 t f l d C ( t ) C 0 C ( t ) = 0 t f v ( t ) d t
l ( ln C 0 C t + D ) = 0 t f v ( t ) d t
C 0 C ( t ) = D 1 exp 1 l 0 t f v ( t ) d t
where D 1 = exp D . Considering this, as well as the fact that at the initial moment of time C 0 = 0 , we can obtain the equation of the time dependence of the growth of the volume concentration of microcracks in the area before the tip of macrocrack, where D 1 = C 0 , as follows:
C t = C 0 1 exp 1 l 0 t f v ( t ) d t
For values C ( t ) < 1 , the exponent can be decomposed into a series exp x 1 + x
C t = C 0 l 0 t f v ( t ) d t = C 0 l 0 t f v ˙ 0 e U 0 γ σ k T d t
Then, for uniform loading with a constant rate of stress growth ( σ ˙ t = σ ):
C t = C 0 l 0 t f v ( t ) d t = C 0 l 0 t f v ˙ 0 e U 0 γ σ ˙ t k T d t
Integrating the right part, we can obtain the following:
C t = C 0 v ˙ 0 k T l γ σ ˙ exp U 0 γ σ ˙ t k T
In view of the fact that real bodies have structural heterogeneity, the waiting time for the formation of microcracks and the crack step will not be the same and generally has a stochastic character. The parameter γ is sensitive to the structure, and it is necessary to take into account its distribution over all structural elements. Therefore, by introducing the distribution of γ over structural elements at this stage of destruction, the rate of growth of the concentration of microcracks can be obtained as follows:
C ( t ) = C 0 ω ω + ω Ψ ( ω ) 1 exp 1 l 0 t f v ( t ) d t d ω
where ω = γ σ k T is a strength state parameter expressing the heterogeneity of the structure and the stress state; Ψ ( ω ) is the density function of the parameter distribution ω ; ω is the confidence interval of the spread of structural parameter values. The type of function Ψ ( ω ) depends on the stresses and structural heterogeneity of the sample.
The source of acoustic emission signals can be both microcracks formed in the area before the tip and the growth of macro-cracks; therefore, by linking the growing concentration of microcracks with the total parameters of AE, various stages of destruction can be characterized. Then, the general equation for the time dependence of cumulative AE parameters (AE count, total energy, and amplitude), as the characteristics of damage, can be written as follows:
N A E t = k A E C 0 ω ω + ω Ψ ( ω ) 1 exp 1 l 0 t f v ( t ) d t d ω
where k A E is the acoustic emission coefficient linking the damage characteristic with the parameters of AE signals.
For the stages of destruction, where the structure near the active defect remains constant ( γ c o n s t ) , the kinetics of damage accumulation by the thermal fluctuation mechanism can be described using the parameters obtained from Equation (41):
X A E = d ln N A E t d t = σ ˙ γ k T
Y A E = d ln N A E d σ = γ k T
The above parameters make it possible to distinguish damage accumulation zones with characteristic kinetic parameters on the curves of cumulative AE parameters. Therefore, knowing the moment of initiation of a macro-crack in fracture toughness tests, it is possible to evaluate the characteristics of initiation, accumulation and coalescence of microcracks in the stage of stable growth of a macro-crack. Having information about the critical value of the concentration of microcracks corresponding to the transition to unstable crack development, it is possible to predict the magnitude of the fracture mechanic parameters.

2.3. Experimental Data

In the presented work, experimental data contained in scientific sources were used and can be divided into two groups: information about the kinetic curves of the crack growth rate depending on the stress intensity factor and the results of AE fracture toughness tests of a number of structural alloys.
The v K curves used in the work were taken from sources for the creep testing of samples when monitoring the crack growth rate, as well as a number of sources with the study of crack growth under the influence of the environment. At the same time, the amount of data on crack growth during corrosion (CCG) and in an aggressive environment was limited to several sources on the effects of distilled water and hydrogen vapor. These conditions represent a different direction of research, since the effect of an aggressive environment on the type of curves is very large and the calculation of thermal fluctuation parameters can be complicated by the contribution of corrosion processes, which are also thermally activated. This explains the clearer division into stages and the formation of plateaus in the area of stable crack propagation (Figure 1). Most data sets represent common structural alloys. According to Equation (30), the curves were rearranged so that experimental values of kinetic parameters could be determined. As a stable crack growth area, the second stage on the curves was chosen, which follows the almost vertical initial stage. The initial data are given in Table 2.
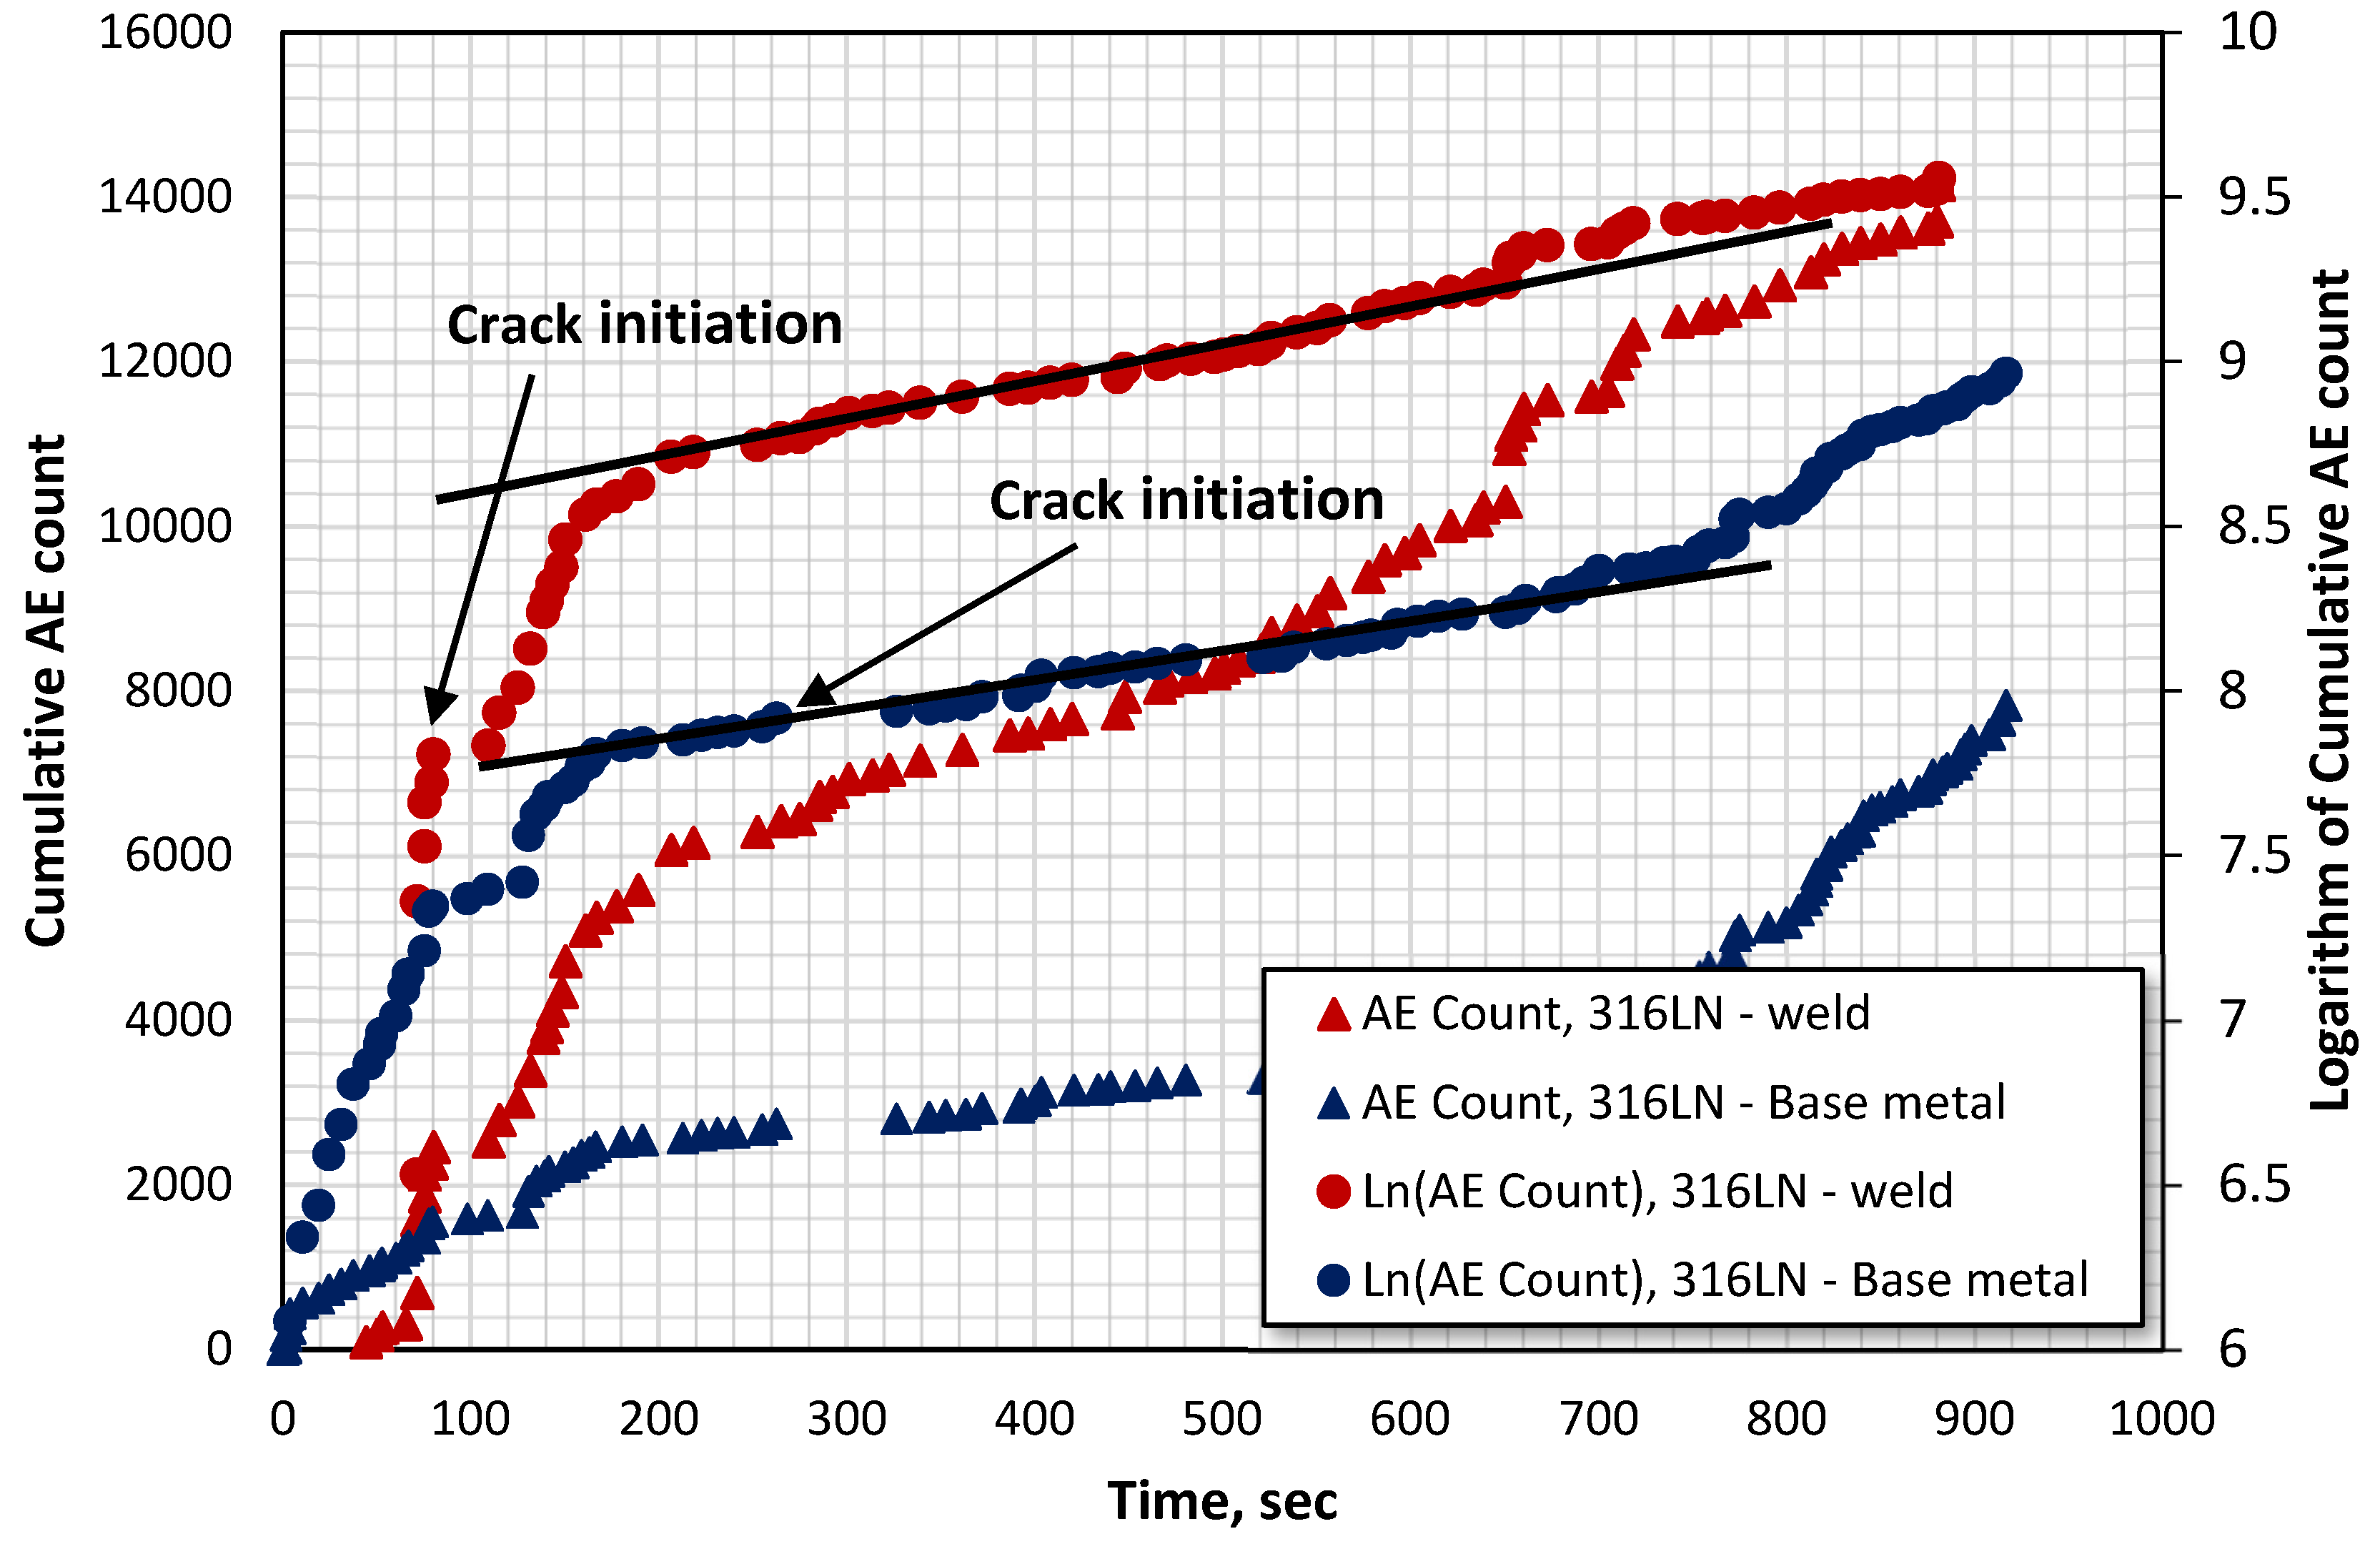
To calculate the kinetic parameters using AE tests, the results of fracture toughness tests were used. To apply parameters (42) and (43), cumulative AE curves (total AE count) were processed, and graphs of the logarithmic dependence of the AE count were constructed. The sources used are summarized in Table 3.
The work [60] presents the results of the unilateral bending of AISI 1080 steel samples with a width of 25 mm to determine the fracture toughness. Preliminary fatigue cracking with a frequency of 15 Hz to the degree of a / w = 0.5 was carried out before the formation of the initial crack. To control the crack opening, a sensor was used to control the displacement of the mouth. The traverse speed was 0.003 mm/s. The CMOD data for the samples were used to calculate the fracture toughness.
For AISI D2 steel [61], compact tensile tests were carried out with dimensions of 36 mm and a thickness of 8 mm at room temperature. The initial crack was also formed by fatigue loading up to a / w = 0.5 after preparation and heat treatment. The loading rate in the fracture toughness tests was 0.2 mm/min. CMOD data were also recorded to assess fracture toughness. Acoustic emission signals were recorded using three piezoelectric sensors with a gain of 40 dB and a frequency spectrum from 100 to 300 kHz. One sensor was attached to the surface of the sample, the other two to the clamps of the tension machine.
The results of the evaluation of the fracture toughness of 316LN steel and welds were given in [18]. The welds were formed by arc welding with a voltage of 25.2 V, 130 A, and 2.5 mm/s. Welding was followed by treatment in solution at a temperature of 1323 K for 2 h and quenching. The tests were carried out with one-side bending with a thickness of 9 mm samples. Crack preparation was carried out in the same way as in the previous data sets, with a frequency of 100 Hz and R = 0.1. The displacement rate of the traverse was 0.5 mm/min, and the displacement of the crack mouth at room temperature was recorded to assess the fracture toughness.
In the work, another data set with 316L N steel, presented in [79], was also used. The material of the base metal and the weld was tested for three-point bending. Preliminary preparation consisted of creating a crack of an initial length equal to half the thickness of the sample. The samples were 20 mm thick and of the same configuration for both welded joints and base metals. A system of 24 channels with a resonant sensor was used to record AE signals. The duration of crack propagation was controlled by the method of determining the DC potential. To measure the crack displacement, a clamping extensometer was used, the loading speed was 0.5 mm/min, and two sensors were installed on the sample from both sides.
The possibilities of determining the fracture toughness of G20Mn5QT steel using acoustic emission were studied in [80]. The tests were carried out in a compact tension mode with samples that were 75 mm thick. The total initial length of the fatigue crack was prepared from 0.45 to 0.75 of the sample thickness in accordance with ASTM E1820 [81]. The preloading frequency was 20 Hz, R = 0.1. The loading rate during the fracture toughness tests was 2 mm/min at ambient temperature. A COD sensor was installed to register the crack displacement. A recording of AE signals was provided by four narrowband sensors, signals with a gain of 40 dB.
Table 3. Results of the calculation of acoustic emission parameters and fracture mechanics.
Material X A E ,
s 1
Y A E ,
M P a 1
γ ,
c m 3
U 0 A E ,
J m o l e
t i n ,
s
t f ,
s
σ f e x p ,
M P a
σ f c a l c ,
M P a
E ,
M P a
K I C e x p , MPa · m 0.5 K I C A E ,
M P a · m 0.5
A A E * ,
c m 2
AISI 1080 [60]0.00390.00311.26 × 10−2396,562155202439948205,00046.045.55.38× 10−21
AISI 316LN
(base metal) [18]
0.00060.00103.96× 10−24101,130102104613181028205,00085.444.11.47× 10−21
AISI 316LN
(weld metal) [18]
0.00120.00351.43× 10−23105,461758801091506205,00081.076.14.86× 10−21
AISI 316LN
(base metal) [79]
0.00090.00145.84× 10−24101,02425591611901023205,000144.150.31.52× 10−21
AISI 316LN
(weld metal) [79]
0.00120.00207.95× 10−24100,808409766986909205,000111.558.76.70× 10−22
AISI D2
(E3 sample) [61]
0.01630.00401.63× 10−23100,76727334611241090200,00050.281.51.45× 10−20
AISI D2
(C2 sample) [61]
0.01730.00351.42× 10−23101,11227030913411262200,00036.283.38.72× 10−21
G20Mn5QT
(1 sample) [80]
0.01720.03431.39× 10−22134,431294434537530205,752259.81672.26× 10−21
G20Mn5QT
(2 sample) [80]
0.02180.06662.69× 10−22178,741274405553270205,752260.12364.53× 10−21
G20Mn5QT
(3 sample) [80]
0.01880.03261.32× 10−22133,325208413553546205,752279.21651.92× 10−21

3. Results

3.1. Kinetic Parameters of Crack Growth Rate

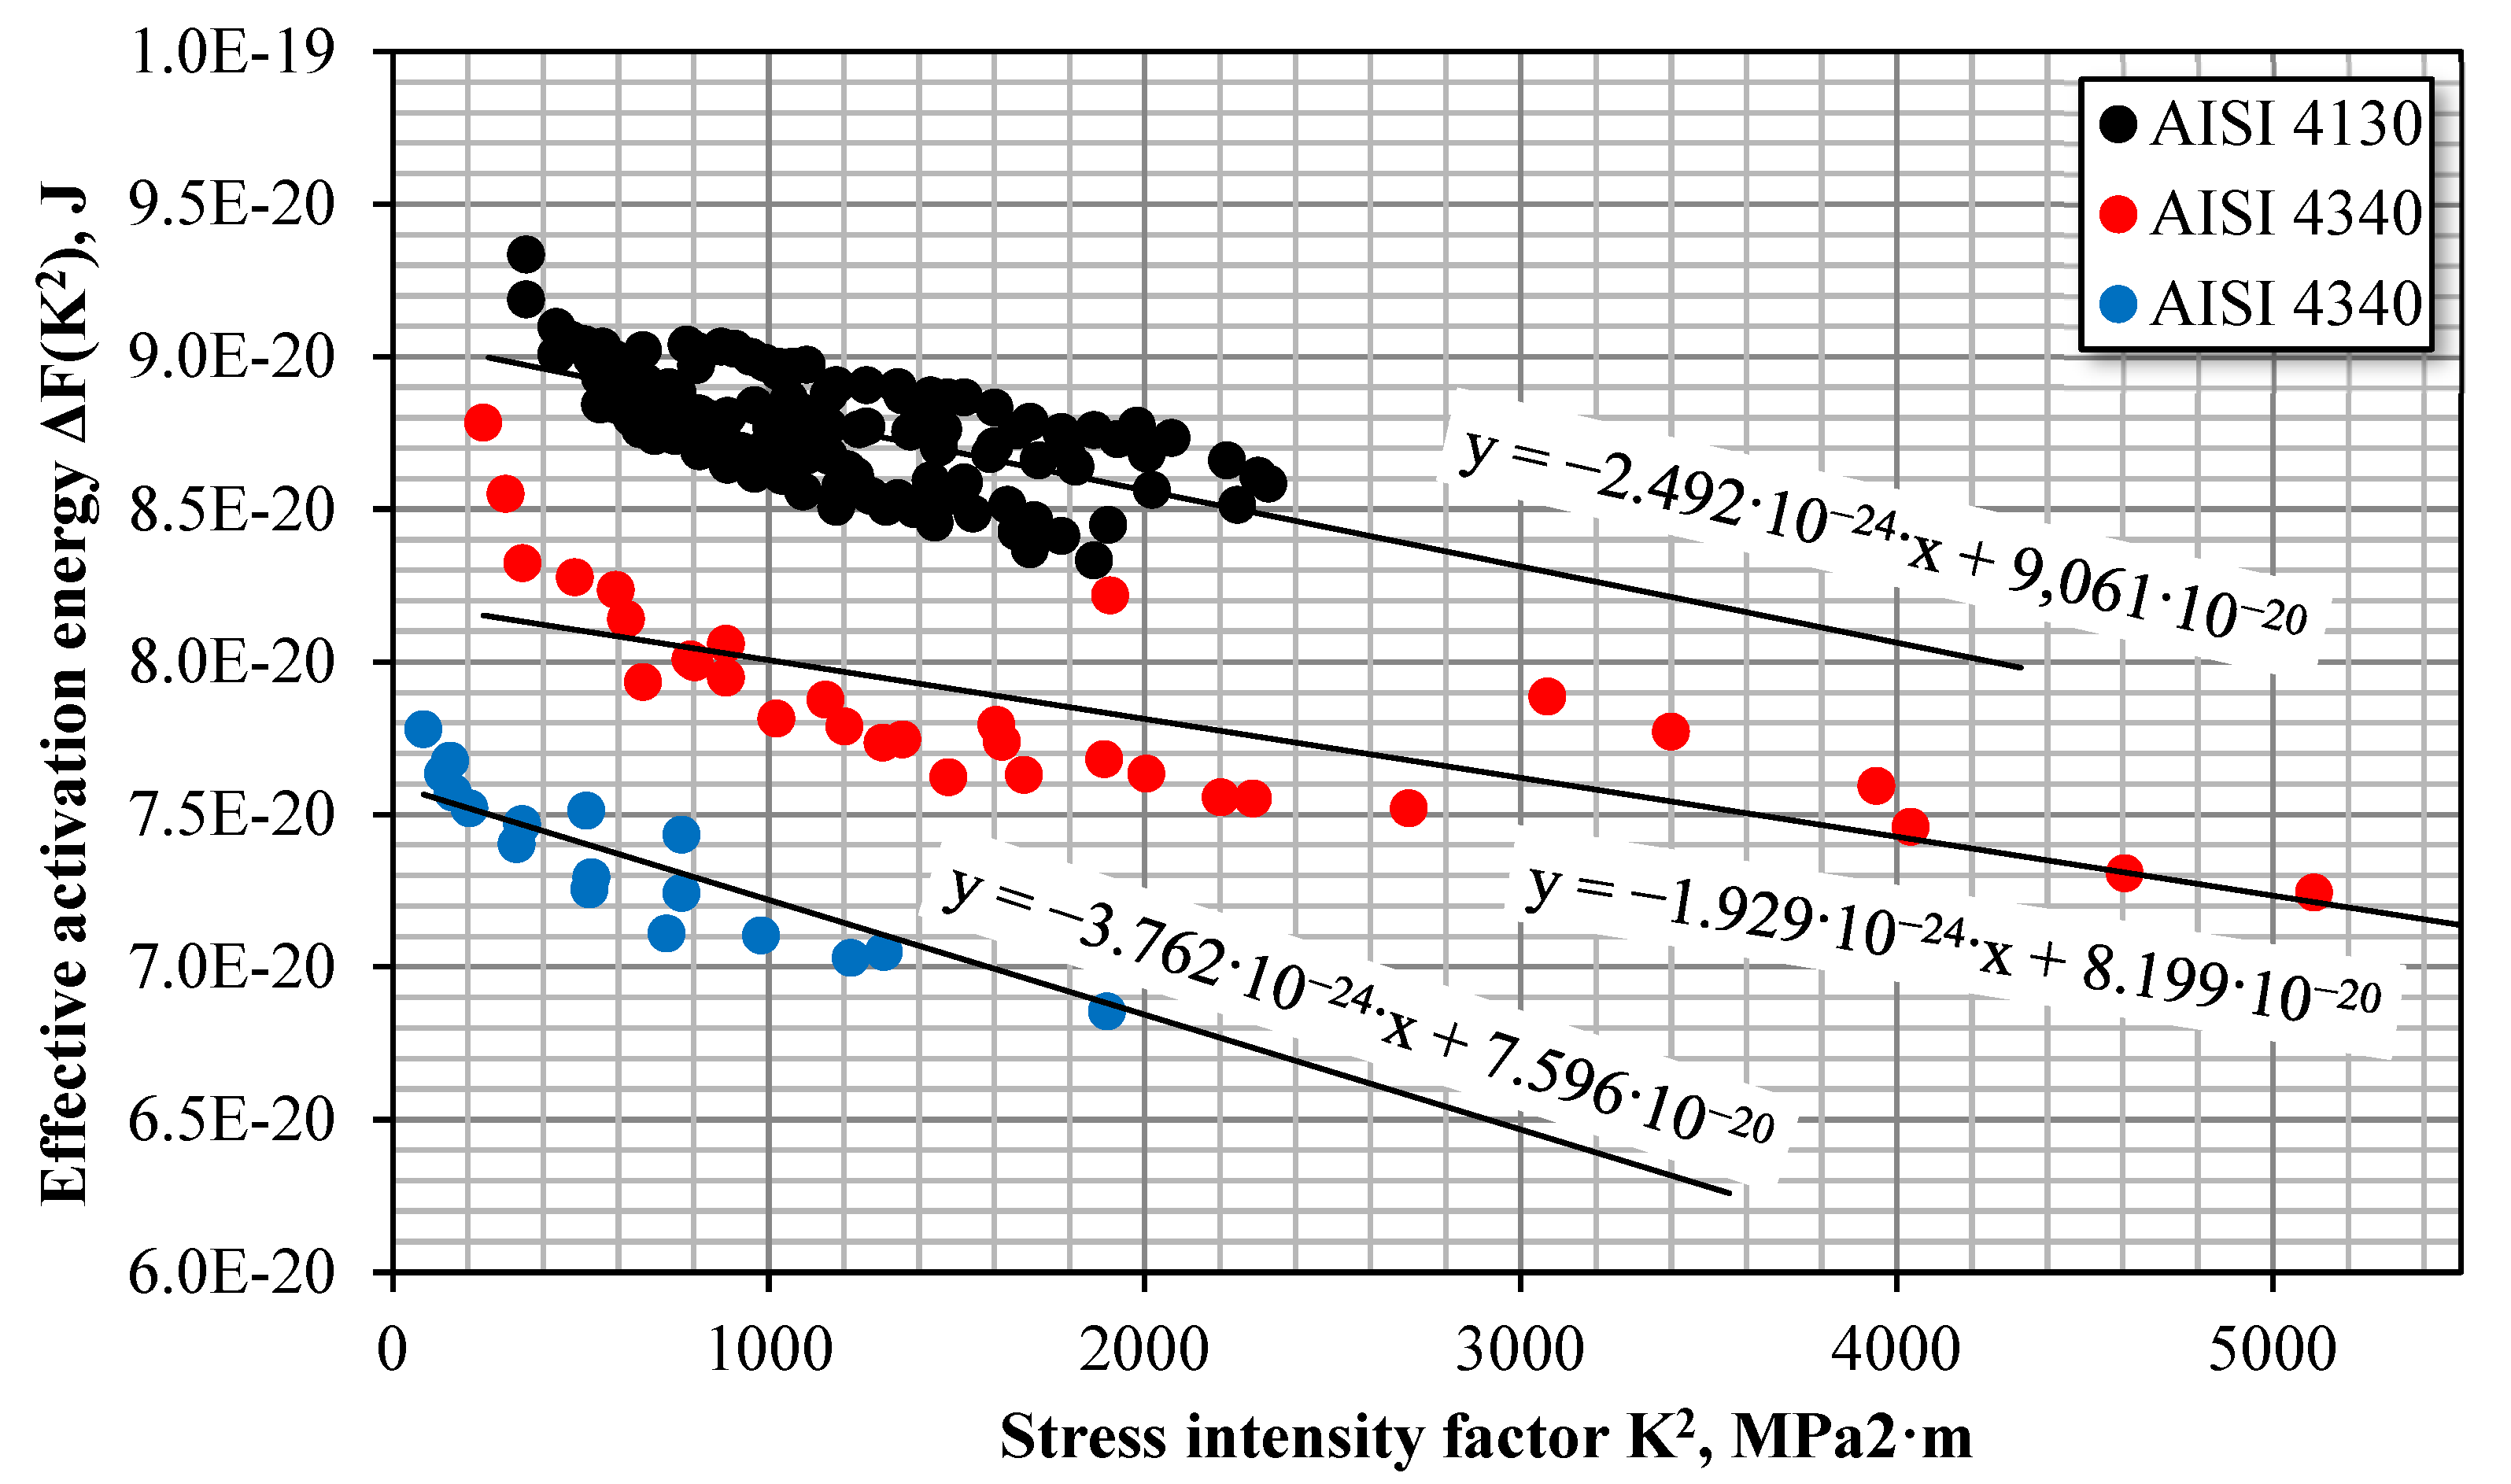
Using the data shown in the Table 2 and expressions (42) and (43), the parameters included in the kinetic equation of crack growth were calculated. The results are summarized in Table 2. First, the pre-exponential multiplier v 0 was estimated. In the works on the kinetic concept of strength [45,82], similar parameters corresponded to the period of atomic oscillations with logarithmic accuracy ( τ 0 = 10 13   ±   1 s ) . Due to the large interpolation, the spread of the value is two orders of magnitude. In this case, the fan of curves related to the section of the curve of stable crack propagation, where the growth of the stress intensity factor was small at different temperatures, showed convergence at points close to v 0 = 10 4   ±   1   m s (Figure 3). This value is close to the propagation velocity of the sound wave in solids [39]. Some authors have proposed descriptions and dependencies for determining the pre-exponential multiplier both from the point of view of the dislocation mechanism of crack growth [42,83], and from the standpoint of breaking individual bonds at the tip of the crack [27,41,84]. In [85], it was pointed out that the temperature dependence of the activation energy U 0 and that its temperature coefficient is also included in the expression for the pre-exponential multiplier. Regel et al. [27] also noted that, for the pre-exponential multiplier, there was an excess of the speed of sound in polymers by several orders of magnitude, which may indicate the group nature of the rupture of interatomic bonds at the tip of the crack. Pollet wrote an expression for v 0 as a function of temperature, stress, driving force, and structural parameter. If the exact influence of one of these factors cannot be detected, v 0 is assumed to be constant for this process and is determined from the interpolation of the ln v v 0 term, as shown in Figure 3.
Next, by obtaining the value v 0 , curves are plotted in the axes k T · ln v v 0 ~ K 2 . As can be seen from Equation (30), the angle of slope of the graph can be obtained as follows:
b = β x 2 E
The following is the true activation area before the crack tip:
A = b E
The calculation results b and F 0 are summarized in Table 2. The point where this curve intersects the ordinate axis corresponds to the value of the activation energy of the crack step. As you can see in Figure 4, the experimental points corresponding to different temperature values fit on one straight line.

3.2. AE Fracture Toughness Tests

Based on the results presented in scientific sources, values of the time dependence on the logarithm of the total AE count were plotted (Figure 5). With the help of the authors’ information about the moments of crack initiation and the period of stable crack development, linear sections on the curves of the logarithm of the total count were determined.
In order to calculate the parameters of the equation of thermally activated crack development at this stage, the parameters X A E and Y A E were calculated using Formulas (42) and (43). Knowing the value of the absolute temperature and the rate of stress growth, it is easy to determine the value of the structural parameter γ , which is written as follows:
γ = k T Y A E = q V a
where q = σ r σ is the overstress coefficient (equal to the ratio of the true local stress to the applied one); V a is the activation volume. For a large number of materials, according to the kinetic nature of strength, the value of the overstressed coefficient is approximately 101 ÷ 102, and the activation volume corresponds to the size of one atomic bond and is approximately equal to 10−23 cm3 [86].
The results of the calculation of AE parameters, the structural parameter γ , and the temperature are given in Table 3. The parameter Y A E , obtained from samples from five sets of data, was in the range of 0.001 to 0.072   c m 3 J , which corresponds to the values γ of 3.96 24 to 2.92 22   c m 3 . Such a spread may be acceptable, given the differences in the structure of the alloys and the overstress coefficients included in the structural parameter. The obtained values do not contradict the values of the activation volume obtained by researchers in various works [45,87,88].

4. Discussion

To assess the applicability of the approach based on AE signal registration, to calculate fracture toughness and other critical transition points in crack growth, it is necessary to compare the calculated values obtained with the data available in the sources. To calculate the activation energy, an expression for the time dependence of AE signals at constant γ was used, from where the following can be obtained:
U 0 A E = k T ln k T C 0 v 0 l γ σ ˙ C + γ σ k T = k T ln C 0 v 0 l C ln Y A E σ ˙ + Y A E σ
where v 0 is the rate of non-activation crack growth; σ is critical stress; C is the critical value of the damage parameter before the beginning of unstable crack growth (the concentration of microcracks in the area before the tip of the main crack).
Kinetic representations of destruction are based on the principle of the multilevel accumulation of damage and concentration criteria for the transition to the next large-scale level [89,90]. Each stage of this process is characterized by a special form of activation parameter and micro-mechanism. In addition, the crack growth process is influenced by loading conditions, material structure features, dislocation behavior, and temperature range. The established correlation between different scale levels, as shown in [27], indicates the simultaneous occurrence of destruction processes at several scale levels. In [64], within the framework of the hierarchy of the accumulation of microcracks, the importance of knowing the critical parameters at transition points from one level of destruction to another and the information that these parameters consist of was noted.
The initial heterogeneous structure of the material, due to the presence of a certain initial number of germinal defects, determines the stress-strain state of the body, which in turn affects the further accumulation and localization of zones of increased defect concentration [91]. The initial stage includes the delocalized accumulation of irreversible single germinal defects, which, under an inhomogeneous stress state under the action of thermal fluctuations, combine into an ensembles of closely spaced microcracks [55,92]. Further interaction and the fusion of cracks in ensembles lead to the formation of defects comparable to the structure of an inhomogeneous material, which is an active source of destruction [93]. This is followed by the stage of localized development of the fracture focus, which continues until the initiation of the main crack [90]. Stable crack growth is short relative to the preceding fracture phases, and it ends with the achievement of the fracture toughness value and the destruction of the sample. The transition points to the next phases of destruction are the points of change in the properties of the material—nonequilibrium phase transitions (bifurcation points). The occurrence of a crack of each next level occurs after a certain period of accumulation of cracks of a smaller level, while each new stage is accompanied by a decrease in the number of cracks with the size of the previous level [64]. This suggests that each period in the destruction of the body is associated with unique activation parameters that need to be considered in detail.
Each transition point must correspond to a certain value of the concentration criterion [90,94]. The growth of main cracks does not contradict the further accumulation of microcracks in the stressed area in front of the tip and coalescence with the tip of the main crack. Under the influence of critical stresses, microcracks grow towards the main crack. This is confirmed by the results of the fractographic analysis of polycrystalline materials [95] and the proposed models of microcrack formation [24,96]. Thus, the system of microcracks is able to develop up to a critical state, when the formation of another microcrack during fluctuation does not trigger cascade connection both with each other and with the main crack [91].
The issue the of clustering of microcracks was considered in [94], where it was noted that the part of solitary cracks decreases with the development of the fracture and at the time of critical localization is several percent of all structural elements. At the same time, the distribution of the parameter γ by elements indicates the influence of structural heterogeneity on the clustering process. At the initial stage of clustering, the weak statistical character of coalescence is explained by the destruction of less-durable elements with a high value of γ , while elements with a low γ are destroyed last. As the growth of the destruction center accelerates, the overstressing on the boundary structural elements increases, the process is limited by the need to destroy durable elements (with low γ ), and consequently, it is accompanied by the delocalization of destruction and expansion of the area of statistical destruction of elements [94]. The fact that an increase in damage is accompanied by a decrease in the activation volume was mentioned in [97].
The magnitude of critical damage after which avalanche-like destruction begins was discussed in a number of works [94,97,98]. However, this problem, due to the difference in approaches and the large error of the obtained values of the critical concentration of defects, requires further investigation. In [97], the volume damage at elevated temperatures for aluminum alloy samples were in the range of 5–10%. The results of the computer modeling of damage accumulation in the cross-section of the sample showed that the critical concentration of discontinuities before an avalanche-like merger is 8–10% [99]. In [64,100], the relative fracture surface area was used as a measure of damage, which for different alloys reached 30–40% by the beginning of unstable crack growth. Zaitsev [94] in his work came to the conclusion that the lower limit of the concentration of microcracks after which instabilities occur in the union of microcracks corresponds to 15–50% of the number of all potentially destructible structural elements. At the same time, the question of choosing the most appropriate and reasonable value of the concentration criterion for the stable growth of the main crack remains open.
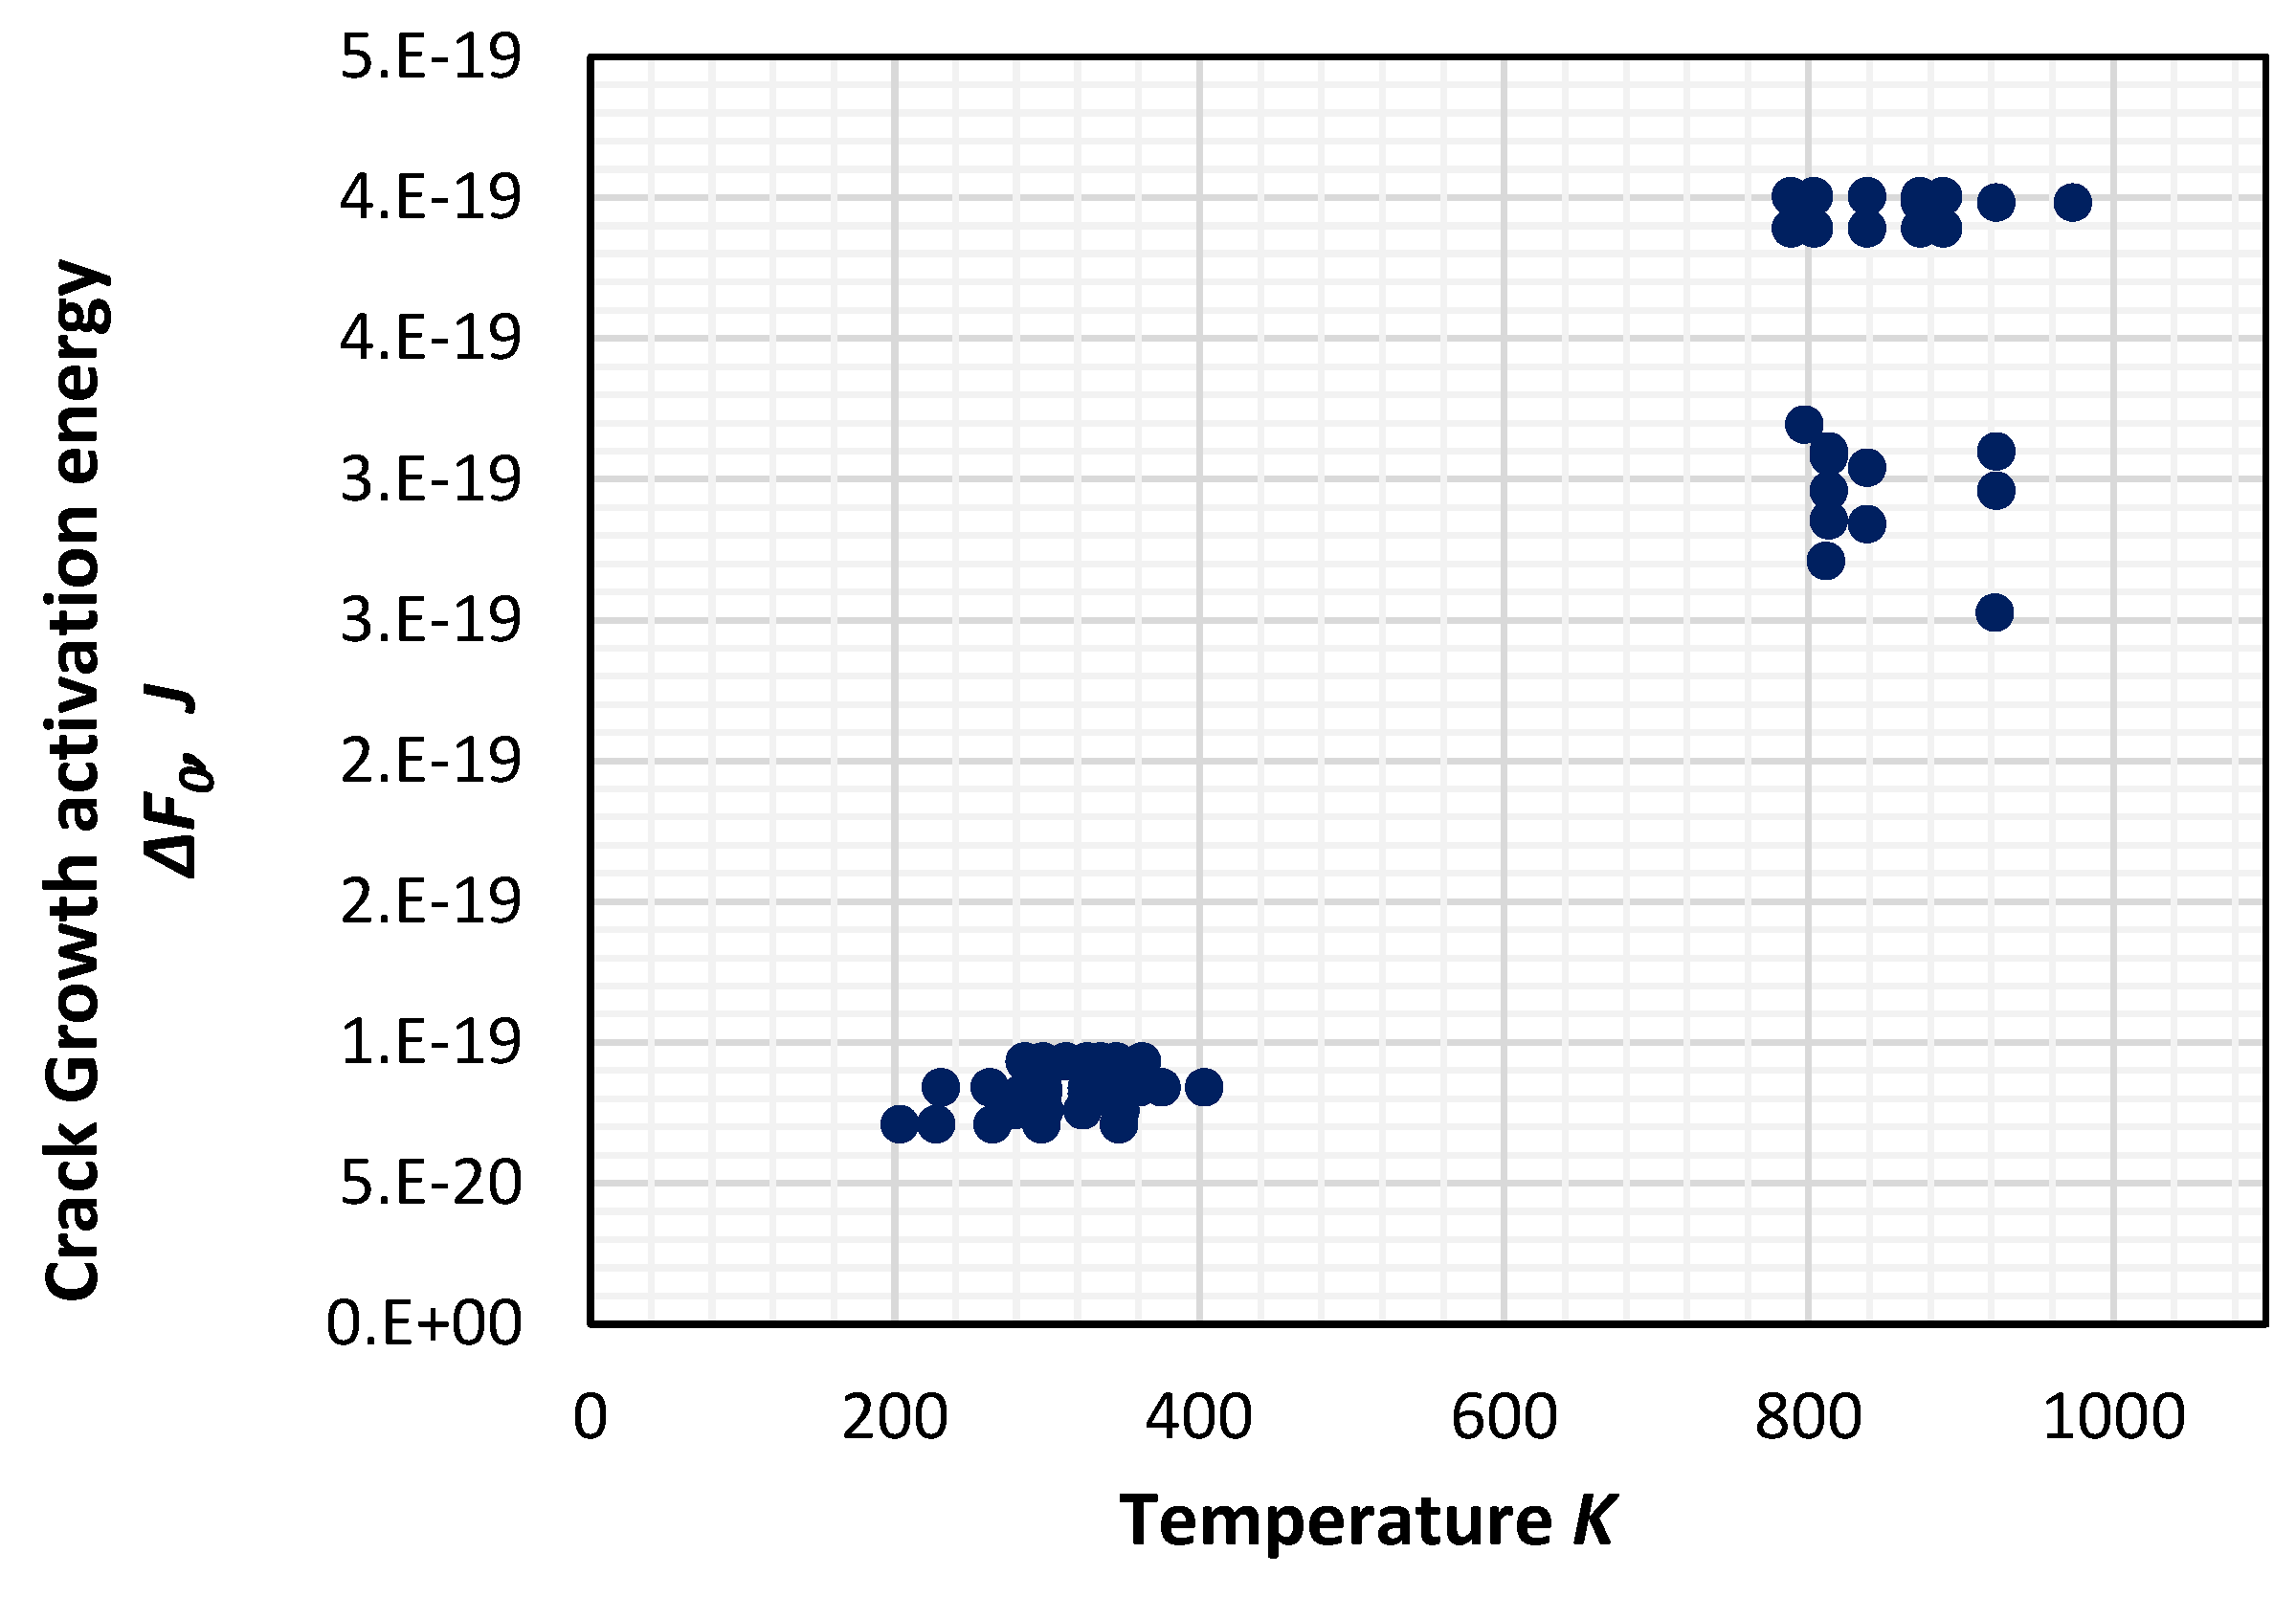
It can be seen from Table 2 and Table 3 that the activation energy of crack growth obtained from reference sources varies within the same order and numerically corresponds to the calculated value according to the acoustic emission model. However, its values from the crack velocity curves are subject to temperature influence (Figure 6). The temperature dependence of the activation energy and its physical meaning have been mentioned in a number of papers [101,102,103,104,105].
The average value F 0 for various alloys corresponds to 120 130 k J m o l e . The activation energy U 0 A E for all samples turned out to be close to this value and is in the range of 97 to 179 k J m o l e . Regel [27] also pointed out that the activation energy of the fracture coincides in magnitude with the crack growth energy, although the values differed from those proposed in this paper. Then, by comparing Equations (10) and (30) we can write:
v 0 exp U 0 + γ σ k T = A 1 exp U + λ K 2 E k T
Since the pre-exponential multipliers v 0 and A 1 have the same reference value, and the activation energy values obtained from the crack growth curves and with the help of AE tests gave values close to each other, we can write:
γ σ = β x 2 K 2 E = A K 2 E
Therefore,
K C = γ σ C E A
K C   A E = Y A E σ C E k T A
The value of the crack step activation region A was also shown to depend on temperature, and for experimental conditions, the values lie within the same order with the average values within 5 6 · 10 21   c m 2 . The calculated values of fracture toughness according to Equation (49) are summarized in Table 3 and Figure 7b. The highest experimental values were for samples of 316LN and G20Mn5QT, which generally correspond to the values from the reference literature. Since, in the sources, the fracture toughness is written in terms of the J-integral or the maximum crack opening, the recalculation in terms of K C was carried out according to well-known formulas [106]:
K C = E M σ y s δ C
K C = E J C
where M is the coefficient ( 1 M 2 ); σ y s is the yield strength; δ C is the maximum crack expansion; J C is the critical value of the J-integral.
As noted by some authors [18,80], in some cases, the values calculated according to the ASTM 1820 standard [81] significantly exceed the fracture toughness determined by the results of AE tests, which was associated with a sharp increase in AE signals per unit of time. In order to take into account the temperature dependence of the Young’s modulus (Figure 8), the universal dependence proposed in [107] was used:
E ( T ) E 0 = 1 0.2 T T m 0.25 T T m 2
where T m is the melting point temperature of alloy.
A comparison of the calculated and experimental values of fracture toughness is shown in Figure 7b. The greatest difference in the results was in the samples of 316LN steel, where the values calculated according to AE data were less than experimental. The reverse result was with the steel samples D2. However, an increase in the fracture toughness of G20Mn5QT steel was accompanied by an increase in K C   A E . The possible deviation may be due to the fact that the stresses corresponding to the moment of the beginning of unstable crack propagation were recalculated using equations from the standards, and there was no possibility to compare the data with the true values of K C in units of M P a · m 0.5 . This will be the goal of future research. However, so far, it is possible to note the general correspondence of the results and the correlation coefficient of 0.84. On the other hand, the lack of additional reference data for each alloy makes it impossible to accurately estimate the activation energy of the crack step and the activation area in front of it and forces the use of averaged values.
Atkins [33], in Equation (30), showed that the stress intensity factor uses the work proportionality coefficient, which corresponds to the part of the work going to break atomic bonds to all applied mechanical work. The values of this coefficient for metal samples are given in Table 2 and are similar to the values mentioned by Atkins [33]. If, for polymers, the remaining part of the work was associated with the formation of craze, for metals it can be assumed that it is associated with mechanical action on the zone surrounding the cracks and the movement of dislocations during plastic deformation. Moreover, this parameter characterizes the main mechanism of destruction. On the other hand, the size of the activation area A of the crack step when compared to the activation volume should be considered only together with the length of the crack segment, which shifts one step forward when overcoming the barrier. According to Equation (47), the values of the crack activation region were calculated according to the AE model and the actual values of fracture toughness. The values of A A E were within the same order and correspond to the experimental data of the curves from the crack growth rate curves.
Using the value from the crack rate curves, it is possible to calculate the stress that corresponds to the fracture toughness:
σ C = F 0 k T + ln l C C 0 v 0 + ln X A E σ ˙ X A E
The results of the critical stresses calculation are shown in Table 2 and Figure 8.
Substituting Equation (53) into (49), we can obtain an expression for calculating the critical value of the stress intensity factor at which the unstable fracture begins:
K C A E = Y A E σ C E k T A = E k T A F 0 k T + ln l C C 0 v 0 + ln X A E
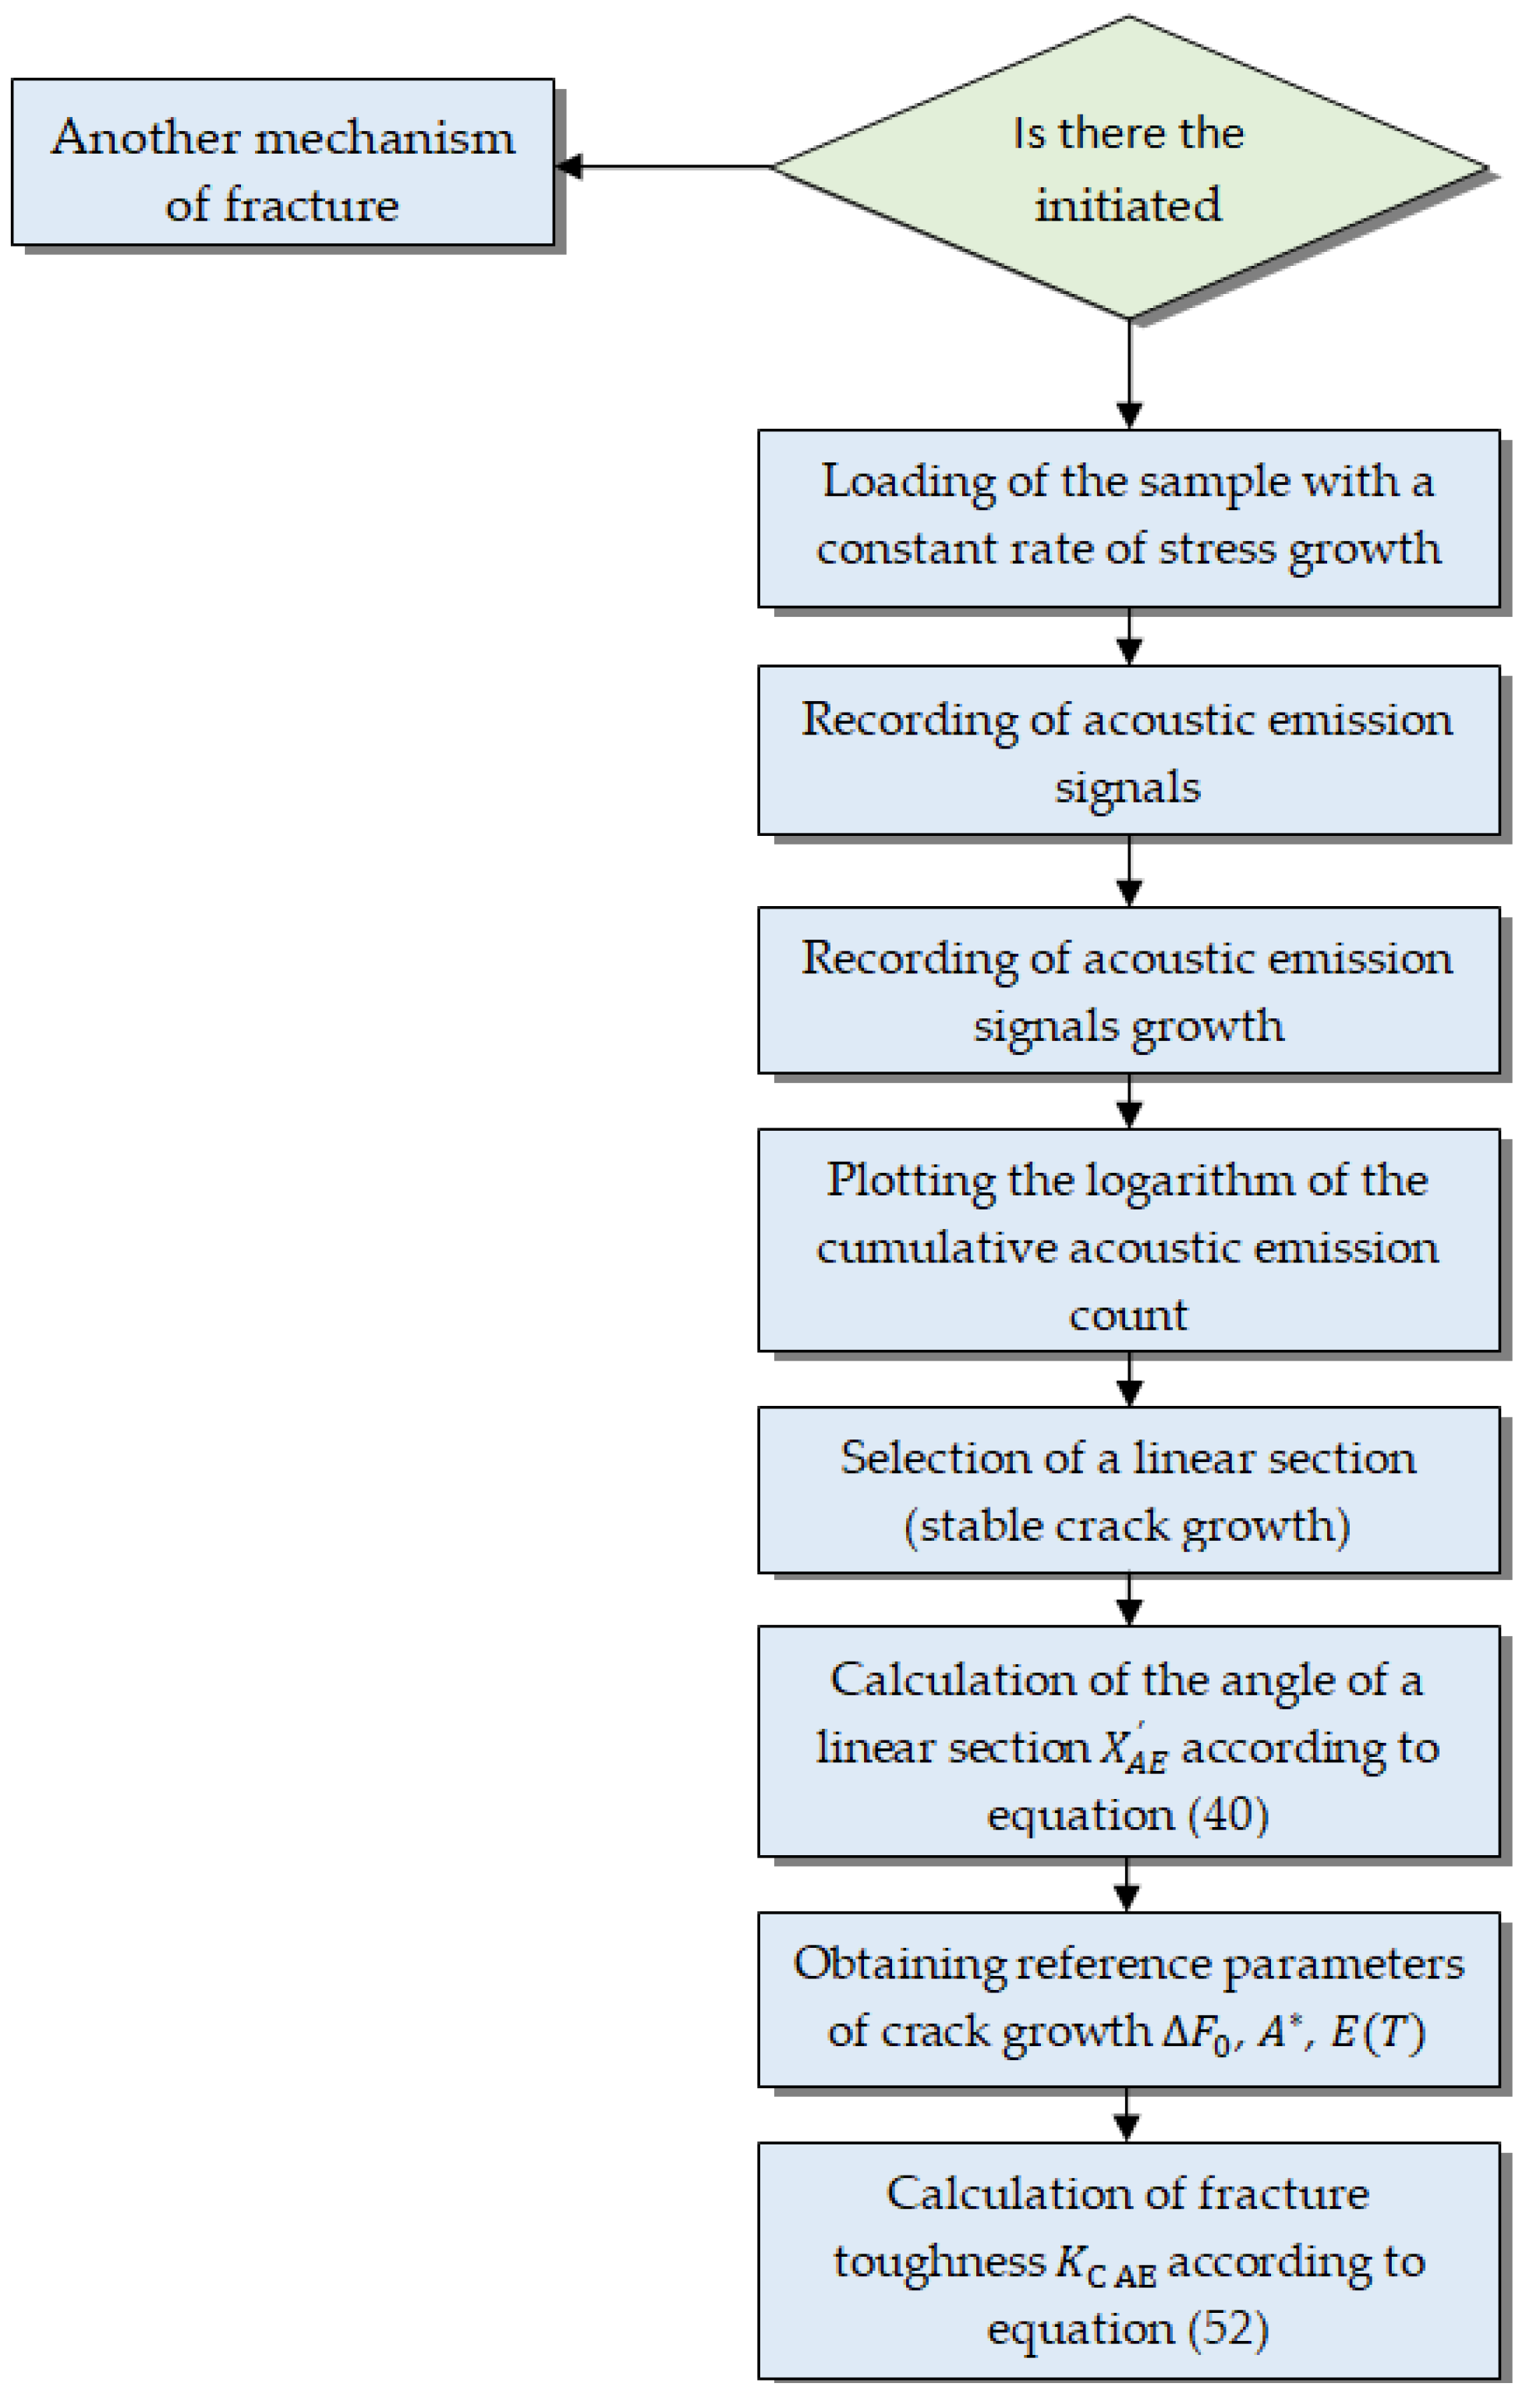
where A is the activation region of the elementary crack step; F 0 is the activation energy of the fracture step of the crack; C C 0 is the critical value of the part of damaged structural elements before the onset of instability during the fusion of microcracks (according to Zaitsev, on average corresponds to 0.3 [94]), as mentioned earlier. The value of the activation energy is a relatively stable value and can be obtained from the crack growth rate curves for this structural alloy; however, careful adjustment of the threshold values of the AE equipment is required to calculate the kinetic parameters X A E and Y A E . The block-chart of the calculation is shown in Figure 9.
From the standpoint of the kinetic nature of fracture, crack growth is (a) a group bond break in the crack tip region, where stresses are highest and the probability of destructive fluctuations is highest [27]; (b) a multilevel process developing both on the scale of atomic bond breaks and on the macroscopic scale in the form of the coalescence of microcracks with the main crack; (c) the process of accumulation of damage over time, which occurs when low load levels are applied. Thus, the connection of the two main directions of the science of strength and fracture of materials is provided with a theoretical basis, but it requires further study and refinement in application to various operating and loading conditions.

5. Conclusions

The article presents an approach to assessing the fracture toughness of structural alloys based on thermally activated crack growth and the registration of acoustic emission signals, the arrival time of which is associated with the speed of overcoming energy barriers at the tip of the macro-crack and microcracks. The proposed multilevel acoustic emission model uses strength indicators that carry information about the unique structure of this defect and material. The curves of the dependence of the cumulative acoustic emission count on time that were obtained from the results of testing samples for fracture toughness make it possible to identify the stage of stable growth of the initiated crack using the proposed parameters Y A E , the values of which were in the range of 0.001 to 0.072   c m 3 J and thereby make it possible to describe individual features of the kinetics of damage accumulation. This paper proposes the calculation of the critical value of the stress intensity factor, which requires knowledge of the presence of an initiated crack and strictly takes into account the loading mode of the samples. The correlation coefficient of the obtained values with the experimental values is equal to 0.84. The calculated values of the activation energy of crack growth (from 97 to 179 k J m o l e ) correspond to reference data obtained from scientific sources containing curves of the dependence of the crack growth rate on the stress intensity factor. In addition to the activation energy, a pre-exponential multiplier and the average size of the crack growth activation area were determined for a number of structural alloys, which were used to link the Regel expression for the crack growth rate and the well-known Atkins expression. The proposed approach suggests assessing the fracture toughness without making destructive tests and using empirical coefficients that cannot adequately describe the real structure of a particular sample or technical object. The difference and novelty of the approach is that the cumulative number of acoustic emission signals is introduced not into the phenomenological equations of crack growth, but into the equation for thermally activated crack growth, where the number of AE signals is proportional to the number of “jumps” through the energy barriers at the crack tip. Since the approach requires knowledge about the presence of a crack, data from the total acoustic emission count, and information about the loading mode, it can be applied not only to standard samples but also to equipment. In most cases, the estimated value of the fracture toughness is conservative and thus has an additional advantage.

Author Contributions

Conceptualization, O.G.P. and V.V.N.; Methodology, O.G.P. and V.V.N.; Validation, O.G.P., A.M.S. and A.I.A.; Formal analysis, A.I.A.; Investigation, V.V.N. and A.M.S.; Resources, A.M.S.; Data curation, A.I.A.; Writing—original draft, A.I.A.; Writing—review & editing, A.I.A.; Supervision, O.G.P., A.M.S. and A.I.A. All authors have read and agreed to the published version of the manuscript.

Funding

This research received no external funding.

Data Availability Statement

All the data used can be found in the corresponding cited references.

Conflicts of Interest

The authors declare no conflict of interest.

Abbreviations

SymbolMeaning
K Stress intensity factor (SIF)
K t h Stress intensity coefficient at the start of crack growth
K C Fracture toughness
f e Driving force of crack expansion per unit length of its profile
f e Effective force of crack expansion
E Young’s modulus
σ Applied stress
σ ˙ Rate of stress growth
F Change in the free energy of a body containing a crack
F e Change in elastic energy
F s Change in surface energy
F 0 Free energy of a body without a crack
F 0 Total activation energy (energy equal to overcome the energy barrier at crack tip)
α Specific surface energy
v 0 Non-activation crack growth rate
U 0 Activation energy of destruction (kinetic nature of fracture)
γ Structural parameter included in equation of time dependent fracture (kinetic nature of fracture)
A Fracture surface area
A Area of the activation zone
A Thermodynamic activation region
b Coefficient proportional to the activation volume and activation area
β Fraction of work that is spent on breaking atomic bonds
x Atomic size of the activation area
U Internal energy
S Entropy of a system consisting of a solid body with a crack
Γ Helmholtz energy
V Body volume
l Length of the elementary step of the crack during overcoming the barrier
C 0 Initial concentration of structural elements (potential number of microcracks)
C Critical value of the damage parameter before the beginning of unstable crack growth
A 1 Pre-exponential factor in the phenomenological equations of crack growth rate
P Pressure
U 0 Activation energy of crack growth (kinetic nature of fracture)
γ Structural parameter included in the crack growth rate equation (kinetic nature of fracture)
X A E ,   Y A E Acoustic emission parameters of damage accumulation during crack growth

References

  1. Rozumek, D.; Macha, E. A survey of failure criteria and parameters in mixed-mode fatigue crack growth. Mater. Sci. 2009, 45, 190–210. [Google Scholar] [CrossRef]
  2. Karyakina, E.; Shammazov, I.; Voronov, V.; Shalygin, A. The Simulation of Ultra-High Molecular Weight Polyethylene Cryogenic Pipeline Stress-Strain State. Mater. Sci. Forum 2021, 1031, 132–140. [Google Scholar] [CrossRef]
  3. Dzhemilev, E.; Shammazov, I.; Sidorkin, D.; Mastobaev, B.; Gumerov, A.; Arctic, S.C. Developing technology and device for the main pipelines repair with cutting out their defective sections. Neft. Khozyaystvo Oil Ind. 2022, 10, 78–82. [Google Scholar] [CrossRef]
  4. Nasonov, M.; Lykov, Y.; Trong, D.D. The study of the resource and durability of metal structures of excavators after the expiration of the service life. Ugol 2020, 2, 13–17. [Google Scholar] [CrossRef]
  5. Belyakov, N.; Smirnova, O.; Alekseev, A.; Tan, H. Numerical Simulation of the Mechanical Behavior of Fiber-Reinforced Cement Composites Subjected Dynamic Loading. Appl. Sci. 2021, 11, 1112. [Google Scholar] [CrossRef]
  6. Korobov, G.Y.; Nguyen Van, T.; Parfenov, D.V. Mechanisms of the formationof asphalt-resin and paraffin deposits and factors influencing their intensity. Bulletin of the Tomsk Polytechnic University. Geo Assets Eng. 2023, 334, 103–116. [Google Scholar] [CrossRef]
  7. Karasev, M.A.; Buslova, M.A.; Vilner, M.A.; Nguyen, T.T. Method for predicting the stress-strain state of the vertical shaft lining at the drift landing section in saliferous rocks. J. Min. Inst. 2019, 240, 628–637. [Google Scholar] [CrossRef] [Green Version]
  8. Bolobov, V.I.; Latipov, I.U.; Popov, G.G.; Buslaev, G.V.; Martynenko, Y.V. Estimation of the Influence of Compressed Hydrogen on the Mechanical Properties of Pipeline Steels. Energies 2021, 14, 6085. [Google Scholar] [CrossRef]
  9. Zemenkova, M.Y.; Chizhevskaya, E.L.; Zemenkov, Y.D. Intelligent monitoring of the condition of hydrocarbon pipeline transport facilities using neural network technologies. J. Min. Inst. 2022, 258, 933–944. [Google Scholar] [CrossRef]
  10. Shammazov, I.A.; Sidorkin, D.I.; Batyrov, A.M. Ensuring the stability of above-ground main pipelines in areas of continuous distribution of permafrost. Eng. Georesources. 2022, 333, 200–207. [Google Scholar] [CrossRef]
  11. Said, G.; Aytekin, H. A new method for determining the fracture toughness of main pipeline steels. Fatigue Fract. Eng. Mater. Struct. 2013, 36, 640–649. [Google Scholar] [CrossRef]
  12. Li, C.-J. Effects of temperature and loading rate on fracture toughness of structural steels. Mater. Des. 2000, 21, 27–30. [Google Scholar] [CrossRef]
  13. Kotoul, M.; Bílek, Z. Acoustic emission during deformation and crack loading in structural steels. Int. J. Press. Vessel. Pip. 1990, 44, 291–307. [Google Scholar] [CrossRef]
  14. Baek, J.-H.; Kim, C.-M.; Kim, W.-S.; Kho, Y.-T. Fatigue crack growth and fracture toughness properties of 304 stainless steel pipe for LNG transmission. Met. Mater. Int. 2001, 7, 579–585. [Google Scholar] [CrossRef]
  15. Zárate, B.A.; Caicedo, J.M.; Yu, J.; Ziehl, P. Deterministic and probabilistic fatigue prognosis of cracked specimens using acoustic emissions. J. Constr. Steel Res. 2012, 76, 68–74. [Google Scholar] [CrossRef]
  16. Han, Z.; Luo, H.; Sun, C.; Li, J.; Papaelias, M.; Davis, C. Acoustic emission study of fatigue crack propagation in extruded AZ31 magnesium alloy. Mater. Sci. Eng. A 2014, 597, 270–278. [Google Scholar] [CrossRef] [Green Version]
  17. Erdogan, F. Stress Intensity Factors. Trans. ASME 1983, 50, 992–1002. [Google Scholar] [CrossRef]
  18. Chai, M.; Duan, Q.; Hou, X.; Zhang, Z.; Li, L. Fracture Toughness Evaluation of 316LN Stainless Steel and Weld Using Acoustic Emission Technique. ISIJ Int. 2016, 56, 875–882. [Google Scholar] [CrossRef] [Green Version]
  19. Nemati, N.; Metrovich, B.; Nanni, A. Acoustic Emission Assessment of Fatigue Crack Growth from a Transverse Weld Toe. J. Mater. Civ. Eng. 2016, 28, 83. [Google Scholar] [CrossRef]
  20. Zhang, Z.; Yang, G.; Hu, K. Prediction of Fatigue Crack Growth in Gas Turbine Engine Blades Using Acoustic Emission. Sensors 2018, 18, 1321. [Google Scholar] [CrossRef] [Green Version]
  21. Chai, M.; Zhang, J.; Zhang, Z.; Duan, Q.; Cheng, G. Acoustic emission studies for characterization of fatigue crack growth in 316LN stainless steel and welds. Appl. Acoust. 2017, 126, 101–113. [Google Scholar] [CrossRef]
  22. Baram, J.; Rosen, M. Fatigue life prediction by distribution analysis of acoustic emission signals. Mater. Sci. Eng. 1979, 41, 25–30. [Google Scholar] [CrossRef]
  23. Yu, J.; Ziehl, P. Stable and unstable fatigue prediction for A572 structural steel using acoustic emission. J. Constr. Steel Res. 2012, 77, 173–179. [Google Scholar] [CrossRef]
  24. Ritchie, R.O.; Knott, J.F.; Rice, J.R. On the relationship between critical tensile stress and fracture toughness in mild steel. J. Mech. Phys. Solids 1973, 21, 395–410. [Google Scholar] [CrossRef]
  25. Ciliberto, S.; Deschanel, S.; Guarino, A.; Santucci, S.; Scorretti, R.; Vanel, L. Failure time, critical behaviour and activation processes in crack formation. In Proceedings of the 11th International Conference on Fracture, Turin, Italy, 20–25 March 2005; pp. 1–6. [Google Scholar] [CrossRef] [Green Version]
  26. Cherepanov, G.P. Fracture mechanics and the kinetic theory of strength. Strength Mater. 1989, 21, 1431–1438. [Google Scholar] [CrossRef]
  27. Regel, V.R.; Leksovskii, A.M.; Sakiev, S.N. The kinetics of the thermofluctuation-Induced micro- and macrocrack growth in plastic metals. Int. J. Fract. 1975, 11, 841–850. [Google Scholar] [CrossRef]
  28. Bertenev, G.M. Kriterii Griffita i termofluktuatsionnaya teoriya razrusheniya polimerov. Vysokomol. Soedin. 1988, 30, 787–791. [Google Scholar]
  29. Irwin, G.R.; Paris, P.C. Fundamental Aspects of Crack Growth and Fracture. Engineering Fundamentals and Environmental Effects; Academic Press: New York, NY, USA, 1971; pp. 1–46. [Google Scholar]
  30. Krausz, A.S.; Krausz, K. Fracture Kinetics of Crack Growth; Springer Science & Business Media: Berlin/Heidelberg, Germany, 1988; ISBN 978-94-010-7116-1. [Google Scholar]
  31. Schoeck, G. Thermally activated crack-propagation in brittle materials. Int. J. Fract. 1990, 44, 1–14. [Google Scholar] [CrossRef]
  32. Petrov, V.A. K dilatonnoi modeli termofluktuatsionnogo zarozhdeniya treshchiny. Dokl. AN SSSR 1988, 301, 1107–1110. [Google Scholar]
  33. Atkins, A.G.; Lee, C.S.; Caddell, R.M. Time-temperature dependent fracture toughness of PMMA: Part 1. Journal of materials science. 1975, 10, 1381–1393. [Google Scholar] [CrossRef] [Green Version]
  34. Atkins, A.G.; Lee, C.S.; Caddell, R.M. Time-temperature dependent fracture toughness of PMMA: Part 2. J. Mater. Sci. 1975, 10, 1394–1404. [Google Scholar] [CrossRef] [Green Version]
  35. Brenner, S.S. Mechanical Behavior of Sapphire Whiskers at Elevated Temperatures. J. Appl. Phys. 1962, 33, 33–39. [Google Scholar] [CrossRef]
  36. Hsieh, C.; Thomson, R. Lattice theory of fracture and crack creep. J. Appl. Phys. 1973, 44, 2051–2063. [Google Scholar] [CrossRef]
  37. Mai, Y.W. Temperature and rate dependent fracture in glass-filled polystyrene. Polym. Eng. Sci. 1976, 16, 400–405. [Google Scholar] [CrossRef] [Green Version]
  38. Pisarenko, G.S.; Krasowsky, A.J.; Vainshtock, V.A. The combined micro- and macro-fracture mechanics approach to engineering problems of strength. Eng. Fract. Mech. 1987, 28, 539–554. [Google Scholar] [CrossRef]
  39. Pollet, J.C.; Burns, S.J. Thermally activated crack propagation? Theory. Int. J. Fract. 1977, 13, 667–679. [Google Scholar] [CrossRef]
  40. Bezyazychnyi, V.F.; Szczerek, M.; Pervov, M.L.; Timofeev, M.V.; Prokofiev, M.A. The study of the effect of temperature on the ability of metals to accumulate energy during their plastic deformation. J. Min. Inst. 2019, 235, 55–59. [Google Scholar] [CrossRef] [Green Version]
  41. Santucci, S.; Vanel, L.; Guarino, A.; Scorretti, R.; Ciliberto, S. Thermal activation of rupture and slow crack growth in a model of homogeneous brittle materials. EPL Europhys. Lett. 2003, 62, 320–326. [Google Scholar] [CrossRef] [Green Version]
  42. Rice, J.R.; Beltz, G.E. The activation energy for dislocation nucleation at a crack. J. Mech. Phys. Solids 1994, 42, 333–360. [Google Scholar] [CrossRef] [Green Version]
  43. Hartmaier, A.; Gumbsch, P. Thermal activation of crack-tip plasticity: The brittle or ductile response of a stationary crack loaded to failure. Phys. Rev. B 2005, 71, 24108. [Google Scholar] [CrossRef]
  44. Cherepanov, G.P.; Richter, A.; Verijenko, V.E.; Adali, S.; Sutyrin, V. Dislocation generation and crack growth under monotonic loading. J. Appl. Phys. 1995, 78, 6249–6264. [Google Scholar] [CrossRef]
  45. Regel, V.; Slutsker, A.; Tomashevskii, É.E. The kinetic nature of the strength of solids. Uspekhi Fizicheskih Nauk. 1972, 106, 193–228. [Google Scholar] [CrossRef]
  46. Regel, V.R. Kinetic theory of strength as a scientific basis for predicting the lifetime of polymers under load. Polym. Mech. 1973, 7, 82–93. [Google Scholar] [CrossRef]
  47. Wiederhorn, S.M.; Fuller, E.R.; Thomson, R. Micromechanisms of crack growth in ceramics and glasses in corrosive environments. Met. Sci. 1980, 14, 450–458. [Google Scholar] [CrossRef]
  48. Wiederhorn, S.M.; Johnson, H.; Diness, A.M. Fracture of Glass in Vacuum. J. Am. Ceram. Soc. 1974, 57, 336–341. [Google Scholar] [CrossRef]
  49. Kawasaki, T.; Nakanishi, S.; Sawaki, Y.; Hatanaka, K.; Yokobori, T. Fracture toughness and fatigue crack propagation in high strength steel from room temperature to −180 °C. Eng. Fract. Mech. 1975, 7, 465–472. [Google Scholar] [CrossRef]
  50. Zhang, S.; Zhu, T.; Belytschko, T. Atomistic and multiscale analyses of brittle fracture in crystal lattices. Phys. Rev. B 2007, 76, 94114. [Google Scholar] [CrossRef] [Green Version]
  51. Kozinkina, A.I.; Kozinkina, E.A. Opredelenie kontsentratsii deformatsionnykh defektov. Prikl. Mekhanika Tekhnicheskaya Fiz. 2010, 51, 164–170. [Google Scholar]
  52. Novikov, E.A.; National University of Science and Technology «MISiS»; Shkuratnik, V.I.; Zaytsev, M.G. Manifestations of Acoustic Emission in Frozen Soils with Simultaneous Influence of Variable Mechanical and Thermal Effects on Them. J. Min. Inst. 2019, 238, 383–391. [Google Scholar] [CrossRef] [Green Version]
  53. Clark, G.; Corderoy, D.J.H.; Ringshall, N.W.; Knott, J.F. Acoustic emissions associated with fracture processes in structural steels. Met. Sci. 1981, 15, 481–491. [Google Scholar] [CrossRef]
  54. Šofer, M.; Šofer, P.; Pagáč, M.; Volodarskaja, A.; Babiuch, M.; Gruň, F. Acoustic Emission Signal Characterisation of Failure Mechanisms in CFRP Composites Using Dual-Sensor Approach and Spectral Clustering Technique. Polymers 2022, 15, 47. [Google Scholar] [CrossRef] [PubMed]
  55. Kuksenko, V.S. Diagnostika i prognozirovanie razrusheniya krupnomasshtabnykh ob’ektov. Fiz. Tverd. Tela 2005, 47, 788–792. [Google Scholar]
  56. Zhang, Y.; Wang, Z.X.; Liu, A.L.; Gao, H. Based on Micromechanical Damage of Experimental Study on 20 Steel Notched Specimen’s Acoustic Emission Characteristics. Adv. Mater. Res. 2013, 712–715, 1084–1089. [Google Scholar] [CrossRef]
  57. Botvina, L.R.; Tyutin, M.R.; Petersen, T.B.; Levin, V.P.; Soldatenkov, A.P.; Prosvirnin, D.V. Residual Strength, Microhardness, and Acoustic Properties of Low-Carbon Steel after Cyclic Loading. J. Mach. Manuf. Reliab. 2018, 47, 516–524. [Google Scholar] [CrossRef]
  58. Takanori, O.; Pao, Y.-H. Microcrack initiation and acoustic emission during fracture toughness tests of A533B steel. Metall. Trans. A 1986, 17A, 843–852. [Google Scholar]
  59. Mostafavi, S.; Fotouhi, M.; Motasemi, A.; Ahmadi, M.; Sindi, C.T. Acoustic Emission Methodology to Evaluate the Fracture Toughness in Heat Treated AISI D2 Tool Steel. J. Mater. Eng. Perform. 2012, 21, 2106–2116. [Google Scholar] [CrossRef]
  60. Roy, H.; Parida, N.; Sivaprasad, S.; Tarafder, S.; Ray, K. Acoustic emissions during fracture toughness tests of steels exhibiting varying ductility. Mater. Sci. Eng. A 2008, 486, 562–571. [Google Scholar] [CrossRef]
  61. Sindi, C.T.; Najafabadi, M.A.; Ebrahimian, S.A. Fracture Toughness Determination of Heat Treated AISI D2 Tool Steel Using AE Technique. ISIJ Int. 2011, 51, 305–312. [Google Scholar] [CrossRef] [Green Version]
  62. Smirnov, V.G.; Solntsev, Y.F. The use of acoustic emission for determination of fracture toughness at cryogenic temperatures. Strength Mater. 1990, 22, 1582–1586. [Google Scholar] [CrossRef]
  63. Botvina, L.R. Damage evolution on different scale levels. Izv. Phys. Solid Earth 2011, 47, 859–872. [Google Scholar] [CrossRef]
  64. Botvina, L.R.; Bolotnikov, A.I.; Sinev, I.O. Hierarchical microcracking under cyclic and static loading. Phys. Mesomech. 2019, 22, 24–36. [Google Scholar] [CrossRef]
  65. Chudnovsky, A.; Shaofu, W. Evaluation of energy release rate in the crack-microcrack interaction problem. Int. J. Solids Struct. 1992, 29, 1699–1709. [Google Scholar] [CrossRef]
  66. Ortiz, M. Microcrack coalescence and macroscopic crack growth initiation in brittle solids. Int. J. Solids Struct. 1988, 24, 231–250. [Google Scholar] [CrossRef]
  67. Dyskin, A.V. Macrocrack propagation in materials with multi-scale microcracking. In Fracture and Damage of Concrete and Rock—FDCR-2; CRC Press: Boca Raton, FL, USA, 1993; pp. 324–333. [Google Scholar]
  68. Naimark, O.; Davydova, M. Crack Initiation and Crack Growth as the Problem of Localized Instability in Microcrack Ensemble. J. Phys. Colloq. 1996, 6, C6–259. [Google Scholar] [CrossRef] [Green Version]
  69. Bugai, N.V.; Berezina, T.V.; Trunin, I.I. Rabotosposobnost’ i Dolgovechnost’ Metalla Energeticheskogo Oborudovaniya; Energoatoizdat: Moscow, Russia, 1994; 272p. [Google Scholar]
  70. Ramamurthy, S.; Atrens, A. Stress corrosion cracking of high-strength steels. Corros. Rev. 2013, 31, 1–31. [Google Scholar] [CrossRef] [Green Version]
  71. Landes, J.D.; Wei, R.P. The kinetics of subcritical crack growth under sustained loading. Int. J. Fract. 1973, 9, 277–293. [Google Scholar] [CrossRef]
  72. Cherepanov, G.P. On the crack growth owing to hydrogen embrittlement. Eng. Fract. Mech. 1973, 5, 1041–1050. [Google Scholar] [CrossRef]
  73. Hippsley, C.; DeVan, J. A study of high temperature crack growth in nickel-aluminide. Acta Met. 1989, 37, 1485–1496. [Google Scholar] [CrossRef]
  74. Fontana, G.; Staehle, R. (Eds.) Dostizheniya Nauki o Korrozii i Tekhnologii Zashchity ot Nee. Korrozionnoe Rastreskivanie Metallov; Metallurgiya Publisher: Moscow, Russia, 1985; p. 487. [Google Scholar]
  75. Gooch, D. Creep crack growth in variously tempered bainitic and martensitic 0.5r 0.5Mo 0.25V steel. Mater. Sci. Eng. 1977, 29, 227–240. [Google Scholar] [CrossRef]
  76. Sadananda, K.S.P. Creep crack growth in alloy 718. Metall. Trans. A 1977, 8A, 439–449. [Google Scholar] [CrossRef]
  77. Sadananda, K.; Shahinian, P. Creep crack growth behavior of several structural alloys. Met. Trans. A 1983, 14, 1467–1480. [Google Scholar] [CrossRef]
  78. Kawasaki, T.; Horiguchi, M. Creep crack propagation in austenitic stainless steel at elevated temperatures. Eng. Fract. Mech. 1977, 9, 879–889. [Google Scholar]
  79. Zhang, J.; Chai, M.; Xiang, J.; Duan, Q.; Li, L. Characteristics of Acoustic Emission Signal from Fracture Process of 316LN Stainless Steel. Chin. J. Mater. Res. 2018, 32, 415–422. [Google Scholar]
  80. Xu, J.; Sun, T.; Xu, Y.; Han, Q. Fracture toughness research of G20Mn5QT cast steel based on the acoustic emission technique. Constr. Build. Mater. 2019, 230, 116904. [Google Scholar] [CrossRef]
  81. ASTM E 1820 01; Standard Test Method for Measurement of Fracture Toughness. ASTM International: West Conshohocken, PA, USA, 2003.
  82. Petrov, M.G. Investigation of the longevity of materials on the basis of the kinetic concept of fracture. J. Appl. Mech. Technol. Phys. 2021, 62, 145–156. [Google Scholar] [CrossRef]
  83. Glebovsky, V. Steady-State Creep and Dislocation Structure of Molybdenum Single Crystals. Phys. Met. Metallogr. 1976, 41, 621–629. [Google Scholar]
  84. Bartenev, G.M. Relationship of the preexponential function in the equation of life to the length of the failure crack. Mater. Sci. 1984, 20, 59–62. [Google Scholar] [CrossRef]
  85. Razumovskaya, I.V.; Zaitsev, M.G. The question of the thermal fluctuation growth of a brittle crack. Mater. Sci. 1978, 14, 123–126. [Google Scholar] [CrossRef]
  86. Zhurkov, S.N.; Petrov, V.A.; Kondyrev, A.M.; Chmel, A.E. Thermofluctuation nature of optical resistance of transparent solids. Philos. Mag. B 1988, 57, 307–317. [Google Scholar] [CrossRef]
  87. Bershtein, V.; Yemel’Yanov, Y.; Stepanov, V. Activation and activation volumes of relaxational processes in polymers under quasi-elastic strain. Polym. Sci. USSR 1984, 26, 2539–2546. [Google Scholar] [CrossRef]
  88. Plotnikov, V.A.; Makarov, S.V. Activation volume and acoustic emission at high-temperature deformation of aluminum. Tomsk. State Univ. J. 2010, 15, 1068–1071. [Google Scholar]
  89. Botvina, L.R.; Soldatenkov, A.P. On the Concentration Criterion of Fracture. Met. I Noveishie Tekhnologii 2017, 39, 477–490. [Google Scholar] [CrossRef] [Green Version]
  90. Berezin, A.V.; Kozinkina, A.I.; Rybakova, L.M. Acoustic Emission and Destruction of Inelastically Strained Metal. Russ. J. Nondestruct. Test. 2004, 40, 152–156. [Google Scholar] [CrossRef]
  91. Lu, C.; Mai, Y.-W.; Bai, Y. Fractals and scaling in fracture induced by microcrack coalescence. Philos. Mag. Lett. 2005, 85, 67–75. [Google Scholar] [CrossRef] [Green Version]
  92. Betekhtin, V.I.; Kadomtsev, A.G. Evolution of Microscopic Cracks and Pores in Solids under Loading. Phys. Solid State 2005, 47, 825–831. [Google Scholar] [CrossRef]
  93. Zav’yalov, L.D.; Nikitin, Y.V. Parametr kontsentratsii treshchin pri podgotovke razrusheniya na raznykh masshtabnykh urovnyakh. Vulkanol. Seismol. 1997, 1, 65–79. [Google Scholar]
  94. Zaitsev, M.G. Statisticheskoe modelirovanie klasterizatsii stabil’nykh mikrotreshchin v tverdykh telakh. Fiz. Tverd. Tela 1985, 27, 3653–3661. [Google Scholar]
  95. Pisarenko, G.S.; Krasowsky, A.J. Analysis of Kinetics of Quasibrittle Fracture of Crystalline Materials. In Proceedings of the International Conference Mechanical Behaviour Materials, Kyoto, Japan, 15–20 August 1972; Volume 1, pp. 421–432. [Google Scholar]
  96. Petrova, V.; Tamuzs, V.; Romalis, N. A Survey of Macro-Microcrack Interaction Problems. Appl. Mech. Rev. 2000, 53, 117. [Google Scholar] [CrossRef]
  97. Petrov, M.G.; Ravikovich, A.I. Damage Accumulation in Aluminum Alloys under Plastic Deformation and Creep. J. Appl. Mech. Technol. Phys. 2006, 47, 143–151. [Google Scholar] [CrossRef]
  98. Schipachev, A.M.; Alzhadly, M. Magnetic-pulsed treatment to improve the strength properties of defective sections of oil and gas pipelines. Bull. Tomsk. Polytech. Univ. Geo Assets Eng. 2023, 334, 7–16. [Google Scholar] [CrossRef]
  99. Ovchinskii, A.S.; Gusev, Y.S. Modelirovanie na EVM protsessov nakopleniya povrezhdenii v tverdykh telakh pod na-gruzkoi. Fiz. Tverd. Tela 1981, 23, 3308–3314. [Google Scholar]
  100. Botvina, L.R.; Tyutin, M.R.; Bolotnikov, A.I.; Petersen, T.B. Effect of Preliminary Cycling on the Acoustic Emission Characteristics of Structural 15Kh2GMF Steel. Russ. Met. 2021, 2021, 32–41. [Google Scholar] [CrossRef]
  101. Valishin, A.A. On the temperature factor of activation energy of fracture. Polym. Sci. 1993, 35, 35–40. [Google Scholar]
  102. Krul, L.P.; Matusevich, Y.I.; Prokopchuk, N.R. Mechanical properties of graft copolymers of polyethylene and acrylonitrile obtained by the inhibited graft polymerization method. J. Polym. Sci. Polym. Lett. Ed. 1984, 22, 611–615. [Google Scholar] [CrossRef]
  103. Morris, D.G. Strengthening Mechanisms in Nanocrystalline Metals; Woodhead Publishing: Cambridge, UK, 2011; Volume 53, pp. 299–328. [Google Scholar] [CrossRef]
  104. Van Krevelen, D.; Nijenhuis, K.T. Mechanical Properties of Solid Polymers; John Wiley & Sons: Hoboken, NJ, USA, 2009; Volume 48, pp. 383–503. [Google Scholar] [CrossRef]
  105. Zhang, Y.W.; Wang, T.C.; Tang, Q.H. The effect of thermal activation on dislocation processes at an atomistic crack tip. J. Phys. D Appl. Phys. 1995, 28, 748–754. [Google Scholar] [CrossRef] [Green Version]
  106. Tunnicliffe, M.C. The Fracture Toughness of Low Carbon Steels; The Effects of Grain Size and Temperature; University of Canterbury: Christchurch, New Zealand, 1991. [Google Scholar]
  107. Zakarian, D.; Khachatrian, A.; Firstov, S. Universal temperature dependence of Young’s modulus. Met. Powder Rep. 2019, 74, 204–206. [Google Scholar] [CrossRef]
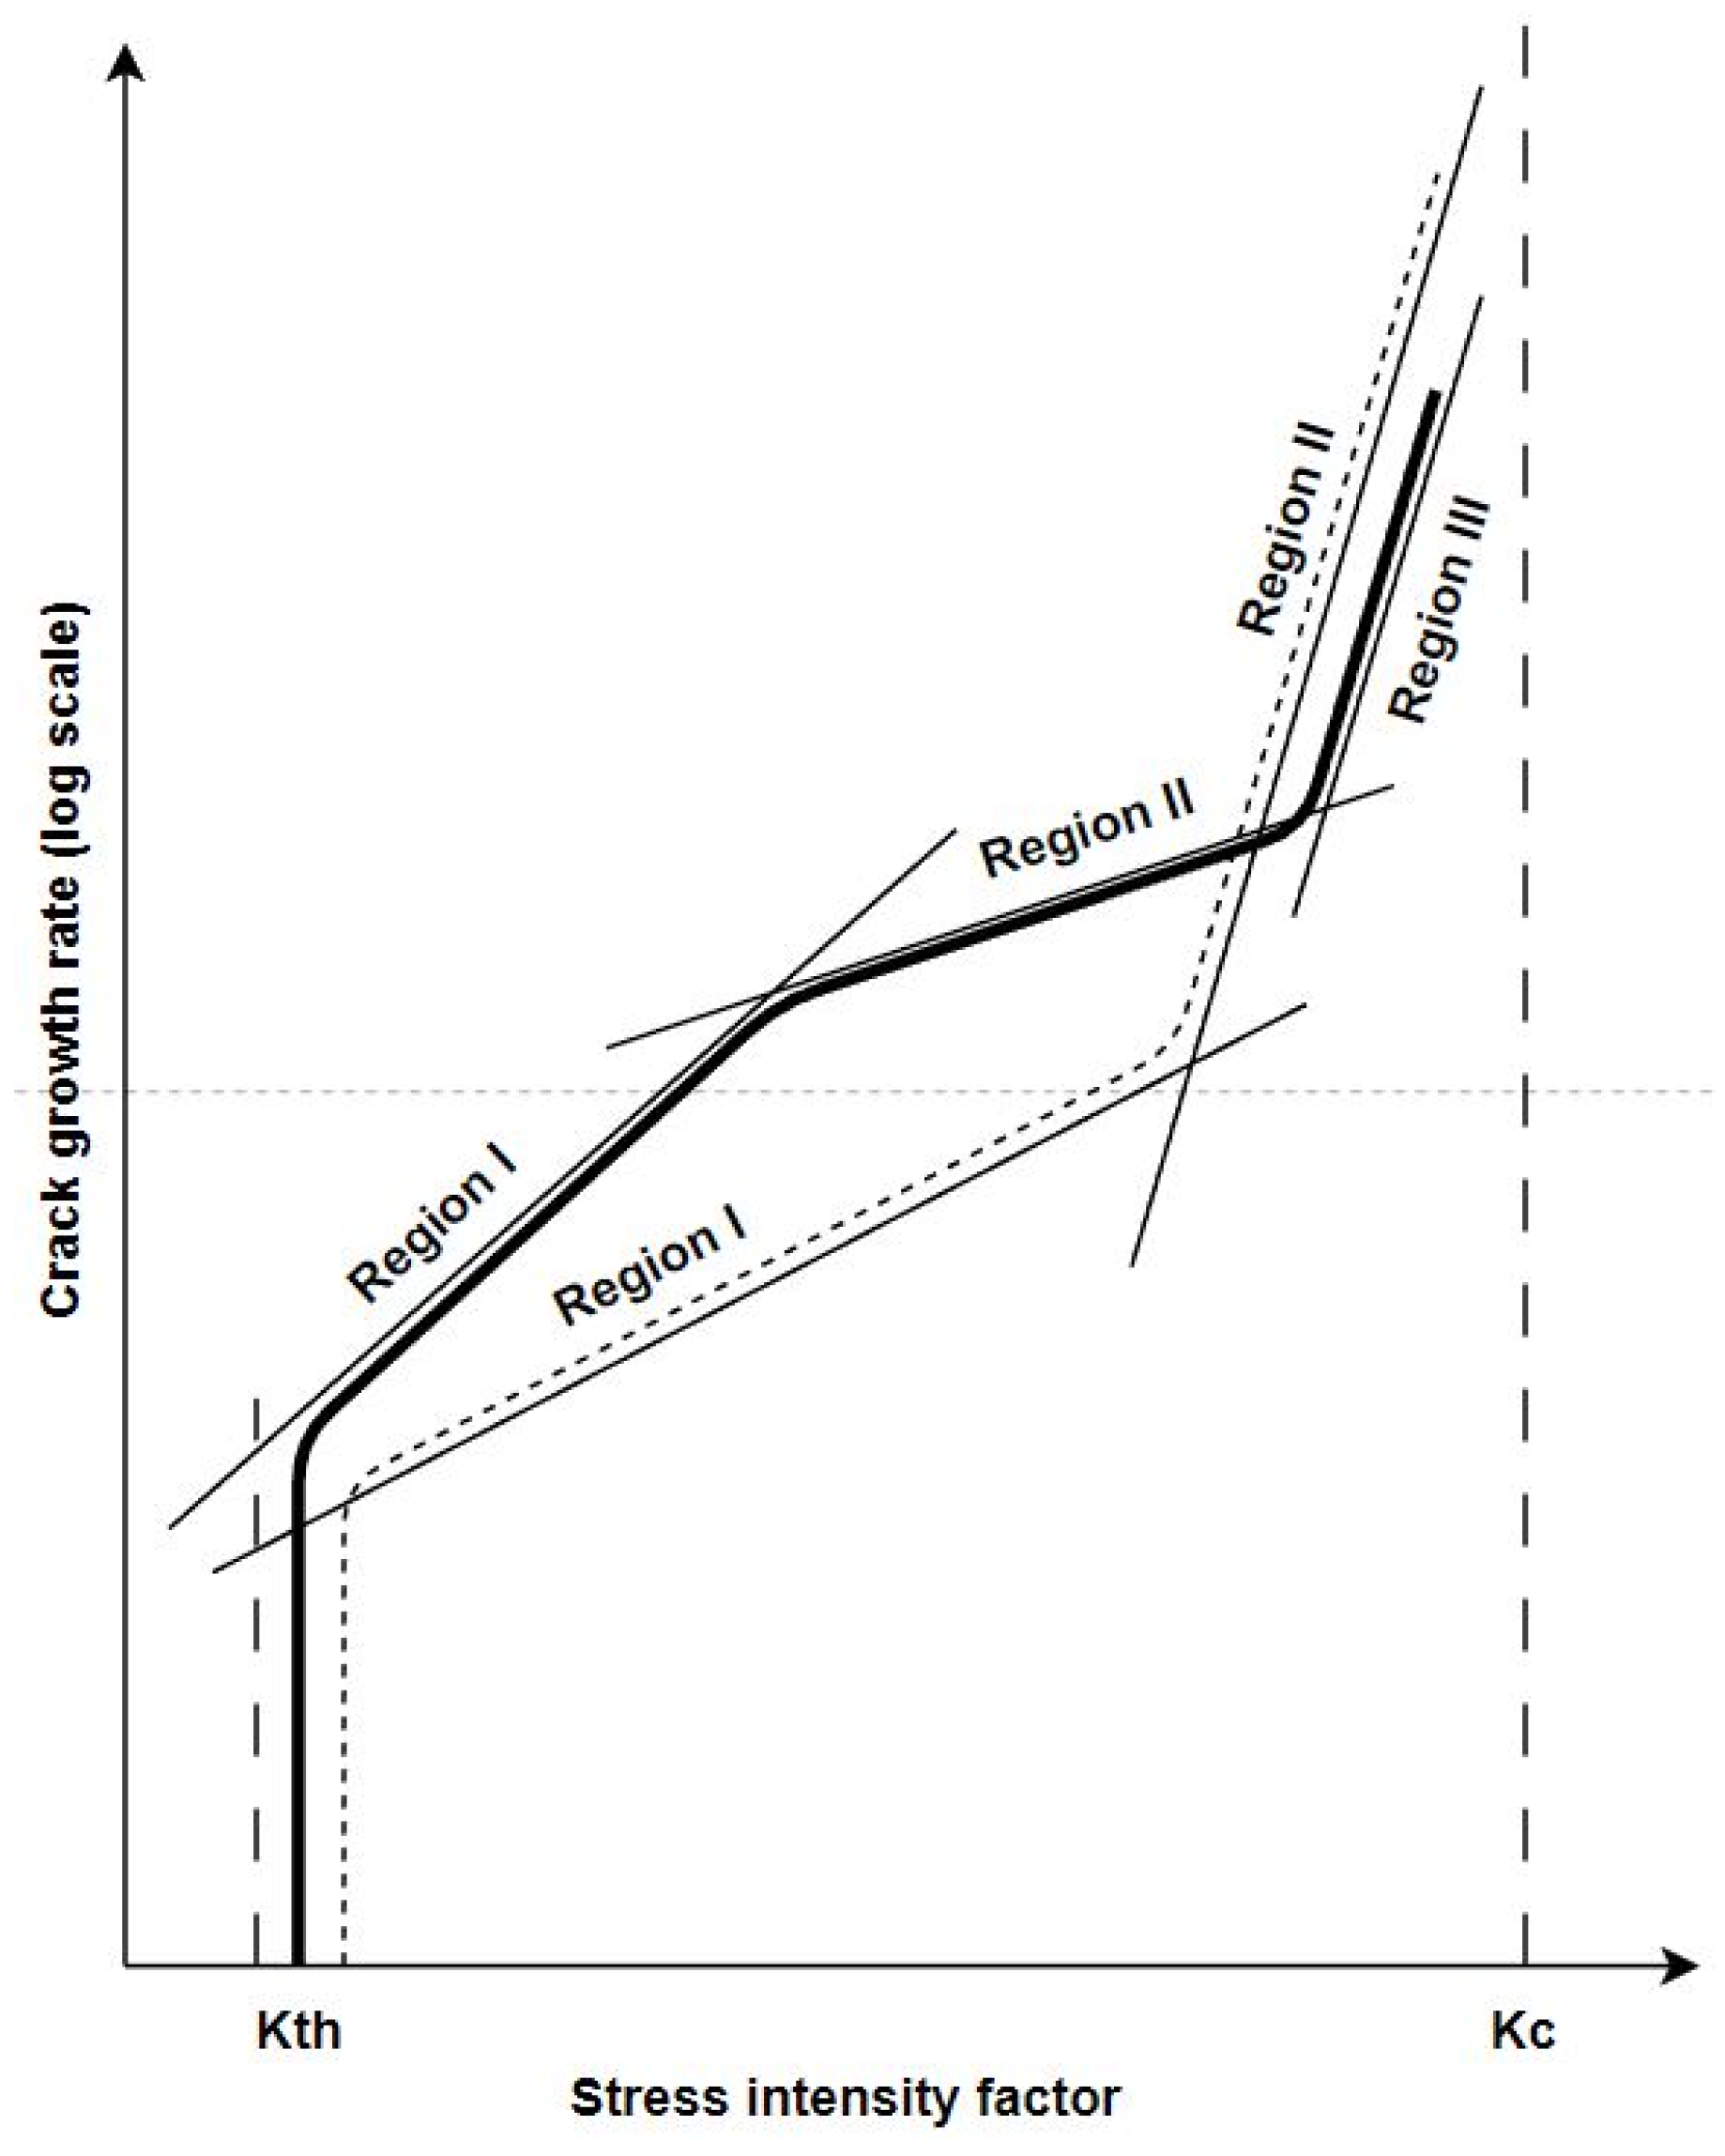
Figure 1. Areas on the crack growth rate curves with different kinetic parameters included in the formula of thermally activated crack growth.
Metals 13 01272 g001
Figure 2. (a) Schematic representation of overcoming energy barriers during crack growth; (b) activation region and crack front in terms of fracture mechanics.
Metals 13 01272 g002
Figure 3. Interpolation of the crack growth rate curves and determination of the pre-exponential parameter v 0 .
Metals 13 01272 g003
Figure 4. Determination of crack growth activation energy.
Metals 13 01272 g004
Figure 5. Values of time dependence of the total AE count and the logarithm of the AE count with selected areas of stable crack growth.
Metals 13 01272 g005
Figure 6. Temperature dependence of crack growth activation energy.
Metals 13 01272 g006
Figure 7. Charts of the dependence of: (a) fracture toughness calculated using the AE model on the parameter X A E ; (b) experimental fracture toughness from the AE model calculated; (c) fracture load calculated using the AE model from the experimental values.
Metals 13 01272 g007
Figure 8. Temperature dependence of the elastic modulus.
Metals 13 01272 g008
Figure 9. The calculation block-chart of fracture toughness.
Metals 13 01272 g009
Table 1. Examples of the types of dependencies ln v and F at a constant temperature (taking into account the dependence A and f e ) [39].
Effective Activation EnergyActivation Area FunctionParameter on the GraphSources
F = F 0 b · f e * A * = b The angle of the curve on the graph ln v f e * equal to b k T [33,34]
F = F 0 b · ln f e * A * = b f e * The angle of the curve (power law) on the graph ln v ln f e * equal to b k T [41,49]
F = F 0 b · f e * A * = b f e * The angle of the curve on the graph ln v f e equal to 2 b k T [37,47,48,50]
Table 2. The results of the calculation of kinetic parameters according to the data of the crack growth rate curves.
MaterialEnvironment b · 10 23 E 0 ,
G P a
T m ,
K
A * · 10 20 ,
c m 2
β · 10 5 T ,   K v 0 ,
m / s
F 0 · 10 19 ,
J
15Cr-1Mo-1V (ferrite and
carbides) [69]
Air2.4321417584.427.06788–888 10 5 4.01
15Cr-1Mo-1V (bainite) [69]Air4.1521417587.5312.05788–888 10 5 3.89
AISI 4130 [70]Distilled
water
0.420516890.791.26285–362 10 4 0.93
AISI 4130 [70]Gaseous
hydrogen
0.6420516891.262.01230–403 10 3 0.84
AISI 4340 [71]Distilled
water
0.1920517000.380.6283–348 10 3 0.82
AISI 4340 [72]Distilled
water
0.3820517000.741.18278–348 10 3 0.76
Ni-22.9Al-0.5Hf-0.24B Alloy [73]Air16.03168166821.9535.11773–1033 10 4 2.88
Ti-5Al-2.5Sn [74]Gaseous
hydrogen
0.08110.318630.090.14203–347 10 4 0.71
0.5Cr-0.5Mo-0.25V Steel [75]Air5.81190169310.6817.08797–838 10 3 3.11
6.22
7.92
0.5Cr-0.5Mo-0.25V Steel [75]Air3.7719016937.5312.04813–838 10 3 2.85
5.64
Inconel 718 [76]Air0.4120812980.610.98811–922 10 3 1.94
0.36
Inconel X-750 [77]Air0.41213.714100.691.1813–923 10 4 3.1
Incoloy 800 [77]Air0.52196.513710.81.27196.5 10 3 2.96
AISI 304 [78]Air4.3119317236.8310.93193 10 4 3.98
b , angle of slope in coordinates k T · ln v v 0 ~ K 2 ; E 0 , Young’s modulus at room temperature; T m , melting point of the alloy; A , the average activation area before the crack tip for the alloy; β , the proportionality coefficient, expressing the part of work going to break bonds [33]; T , test temperature; v 0 , the rate of non-activation crack growth; F 0 , crack growth activation energy.
Disclaimer/Publisher’s Note: The statements, opinions and data contained in all publications are solely those of the individual author(s) and contributor(s) and not of MDPI and/or the editor(s). MDPI and/or the editor(s) disclaim responsibility for any injury to people or property resulting from any ideas, methods, instructions or products referred to in the content.