Article

Process Parameter Optimization for Selective Laser-Melted High-Nitrogen Steel and the Effects on Microstructure and Properties

1
School of Metallurgy and Energy, North China University of Science and Technology, Tangshan 063009, China
2
Ji Hua Laboratory, Institute of Advanced Additive Manufacturing, Foshan 528200, China
*
Authors to whom correspondence should be addressed.
Metals 2023, 13(7), 1242; https://doi.org/10.3390/met13071242
Submission received: 7 June 2023 / Revised: 2 July 2023 / Accepted: 5 July 2023 / Published: 7 July 2023
(This article belongs to the Special Issue Additive Manufacturing in Alloy Design and Development)

Abstract

:
Chromium nitride powder is blended with pre-alloyed powder to make an overmatched powder with a high nitrogen concentration in order to manufacture high-nitrogen steel by selective laser melting. By employing a wider range of process parameters, the impact of process parameters on the relative density, nitrogen concentration, microstructure, and mechanical properties of high-nitrogen steel is investigated. In simulated human body fluid conditions, the corrosion resistance of high-nitrogen steel, pure titanium, and 316L was compared and evaluated. The findings demonstrate that the relative density of high-nitrogen steel initially rises and then falls with the increase in energy density, reaching a high value of 98.8% at 148.8 J/mm3. With rising energy density, the nitrogen concentration falls. The microstructure of high-nitrogen steel is mainly composed of columnar and cellular grains. Both grain sizes steadily grow, but their mechanical characteristics initially rise and then fall as the energy density rises from 83.3 to 187.3 J/mm3. With yield strength, tensile strength, and elongation reaching 921.9 MPa, 1205.1 MPa, and 27%, respectively, the alloy exhibits outstanding mechanical characteristics when the laser power is 250 W, the scanning speed is 700 mm/s, and the associated energy density is 148.8 J/cm3. The high-nitrogen steel at an energy density of 148.8 J/mm3 has the lowest corrosion rate when compared to pure titanium and 316L steel, which suggests that the HNS alloy will have good corrosion resistance in human body fluid conditions.

1. Introduction

High-nitrogen steel is a novel form of stainless steel with outstanding all-around properties [1]. Adding nitrogen as interstitial atoms to stainless steel can improve the solid solution, increasing material strength, toughness, and corrosion resistance. High nitrogen stainless steel performs well in a variety of severe conditions and is frequently employed in industries such as aerospace and biomedical applications [2]. Paton et al. [3] proposed that a steel can be referred to as high-nitrogen steel as long as its nitrogen content in the molten state reaches the equilibrium concentration at that state. Speidel et al. [4] suggested that austenitic steel with a nitrogen content exceeding 0.4 wt.% can be classified as high-nitrogen steel. However, the solubility of nitrogen in stainless steel is restricted, making high nitrogen stainless steel difficult to create using conventional smelting procedures [5]. Furthermore, high nitrogen stainless steel generated by pressure casting has a high hardness and is sometimes difficult to process, making complicated components impossible to get by standard machining [6].
The metal additive manufacturing method layers metal powder using a laser or electron beam as a heat source to produce complicated shaped workpieces [7]. This technique provides benefits over traditional processing methods such as high efficiency, high accuracy, and near final shaping in one pass [8]. Metal additive manufacturing has developed into various shaping techniques, classified by different heat sources. These include laser engineered net shaping (LENS), electron beam selective melting (EBSM), selective laser sintering (SLS), and selective laser melting (SLM) [9]. The materials for metal additive manufacturing have several uses and may be used with practically any metal [10]. H.R. Abedi et al. [11] conducted research on the fabrication of Inconel 625 superalloy using metal additive manufacturing technology. M. Ahmadi et al. [12] provided an overview of the advantages, microstructure, and applications of selective laser melting (SLM) in the preparation of magnesium alloys. Mohammad Azami et al. [13] employed laser powder bed fusion technology to study the preparation of alumina/Fe-Ni ceramic matrix particulate composites impregnated. And thus, this is a novel method for preparing and applying high-nitrogen stainless steel. Wu et al. [14] used a TIG arc additive and wire powder to make a high-nitrogen steel straight wall. Adding Cr2N powder during the additive manufacturing process can considerably enhance the nitrogen concentration in the sample, resulting in the final sample with a nitrogen content of up to 1.04%. However, arc additive is performed directly in the air, which is prone to impurities and oxidation throughout the process.
The selective laser melting (SLM) has a protective chamber, and high-purity nitrogen or argon gas can be selected as the protective gas to fully reduce oxygen content and effectively reduce inclusions and oxidation [15]. Sun et al. [16] used pressured SLM to create 1.05 wt.% high-nitrogen steel. However, the preparation procedure is quite complicated, making sample fabrication challenging. Lv et al. [17] investigated the strengthening and toughening mechanisms of SLMed high-nitrogen steel using self-made aerosolized high-nitrogen steel powder, offering guidance for improving the process for SLMed high-nitrogen steel. However, since the technique of directly creating aerosolized high-nitrogen steel powder is complicated and expensive, progress in related research has been modest. Sun et al. [18] prepared high-nitrogen steel samples with a nitrogen content exceeding 0.4 wt.% using both elemental mixed powder (EMP) and alloy mixed powder (AMP), with the latter demonstrating superior performance. This indicates the feasibility of fabricating high-nitrogen steel using alloy mixed powder through selective laser melting (SLM).
In this work, chromium nitride powder is blended with pre-alloyed powder to make an overmatched powder with a high-nitrogen concentration in order to manufacture high-nitrogen steel by selective laser melting. By employing a wider range of process parameters, the impact of process parameters on the relative density, nitrogen concentration, microstructure, and mechanical properties of high-nitrogen steel is investigated. Additionally, preliminary exploration of the corrosion resistance of the high-nitrogen steel in a physiological environment is conducted, comparing it with commonly used medical materials such as Ti and 316L for corrosion resistance. The findings of the study will be used to guide the use of high nitrogen stainless steel in selective laser melting shaping.

2. Experimental Materials and Methods

Chromium nitride powder with a purity level of at least 99.0% is added as a nitrogen-increasing agent to stainless-steel alloy powder, which has particles that range in size from 15 to 53 microns. To create the prepared powder, ball mill and combine 98 g of stainless-steel alloy powder with 2 g of chromium nitride. The powder is completely mixed in a planetary ball mill over the course of four hours at a speed of 400 rpm. Figure 1 depicts the morphology of the powder before and after mixing, and Table 1 depicts the powder’s significant parameters. Stainless steel alloy powder, which is a spherical powder, is created by atomization; while the chromium nitride powder is a non-spherical powder. Table 2 shows the chemical composition of stainless-steel alloy powder and mixed powder.
The EOS M290 equipment is used for selective laser melting forming, with a substrate preheating temperature of 150 °C and a nitrogen environment in the forming chamber. Table 3 shows the forming process characteristics of selected laser melted block specimens and tensile specimens. The block forming size is 5 × 5 × 5 mm, and the sample is formed as indicated in Figure 2a; the room temperature tensile test should be performed in accordance with the standard GB/T 228.1-2021, and the sample size is displayed in Figure 2b. The scanning spacing and powder thickness stay stable at 80 microns and 30 microns, respectively, while the power and scanning speed are adjusted to ensure energy density control.
Prior to the density test, the block samples are polished and the density measured using a high-precision electronic balance and the Archimedes drainage technique. To determine the nitrogen content in high-nitrogen steel samples, use the LECO oxygen nitrogen hydrogen analyzer. Examine the surface pores of the uncorroded sample before corroding it using aqua regia (concentrated hydrochloric acid:concentrated nitric acid = 3:1). Optical microscopy, electron scanning microscopy, and EBSD are used to examine and assess the sample’s microstructure and grain size. Tensile testing is performed on the alloy to determine its room temperature mechanical properties using the CMT4204 static hydraulic universal testing equipment. The testing is carried out at a tensile rate of 1 mm/min, with an accuracy grade of 0.5.
Three human-simulated liquids were developed to perform corrosion resistance tests on high-nitrogen steel samples and were compared with pure titanium and 316L alloy in order to explore the corrosion resistance of high-nitrogen steel in the human body. Table 4 lists the compositions of the three human-inspired liquids: Hank’s solution, 0.9% NaCl solution, and simulated plasma. A 1 mm sheet sample was machined and polished on the surface, and corrosion resistance testing was carried out using a CHI660E electrochemical workstation. The block sample was cut into 10 × 10 × 1 mm pieces.

3. Results and Discussion

3.1. Relative Density of the High-Nitrogen Steel

Figure 3 displays the relative density findings for high-nitrogen steel specimens. The specimen’s relative density spans from 93.3% to 98.8%, and the general pattern shows that relative density initially rises and then falls as laser energy density rises. When the energy density is 148.8 J/mm³, the sample exhibits the highest relative density of 98.8%.
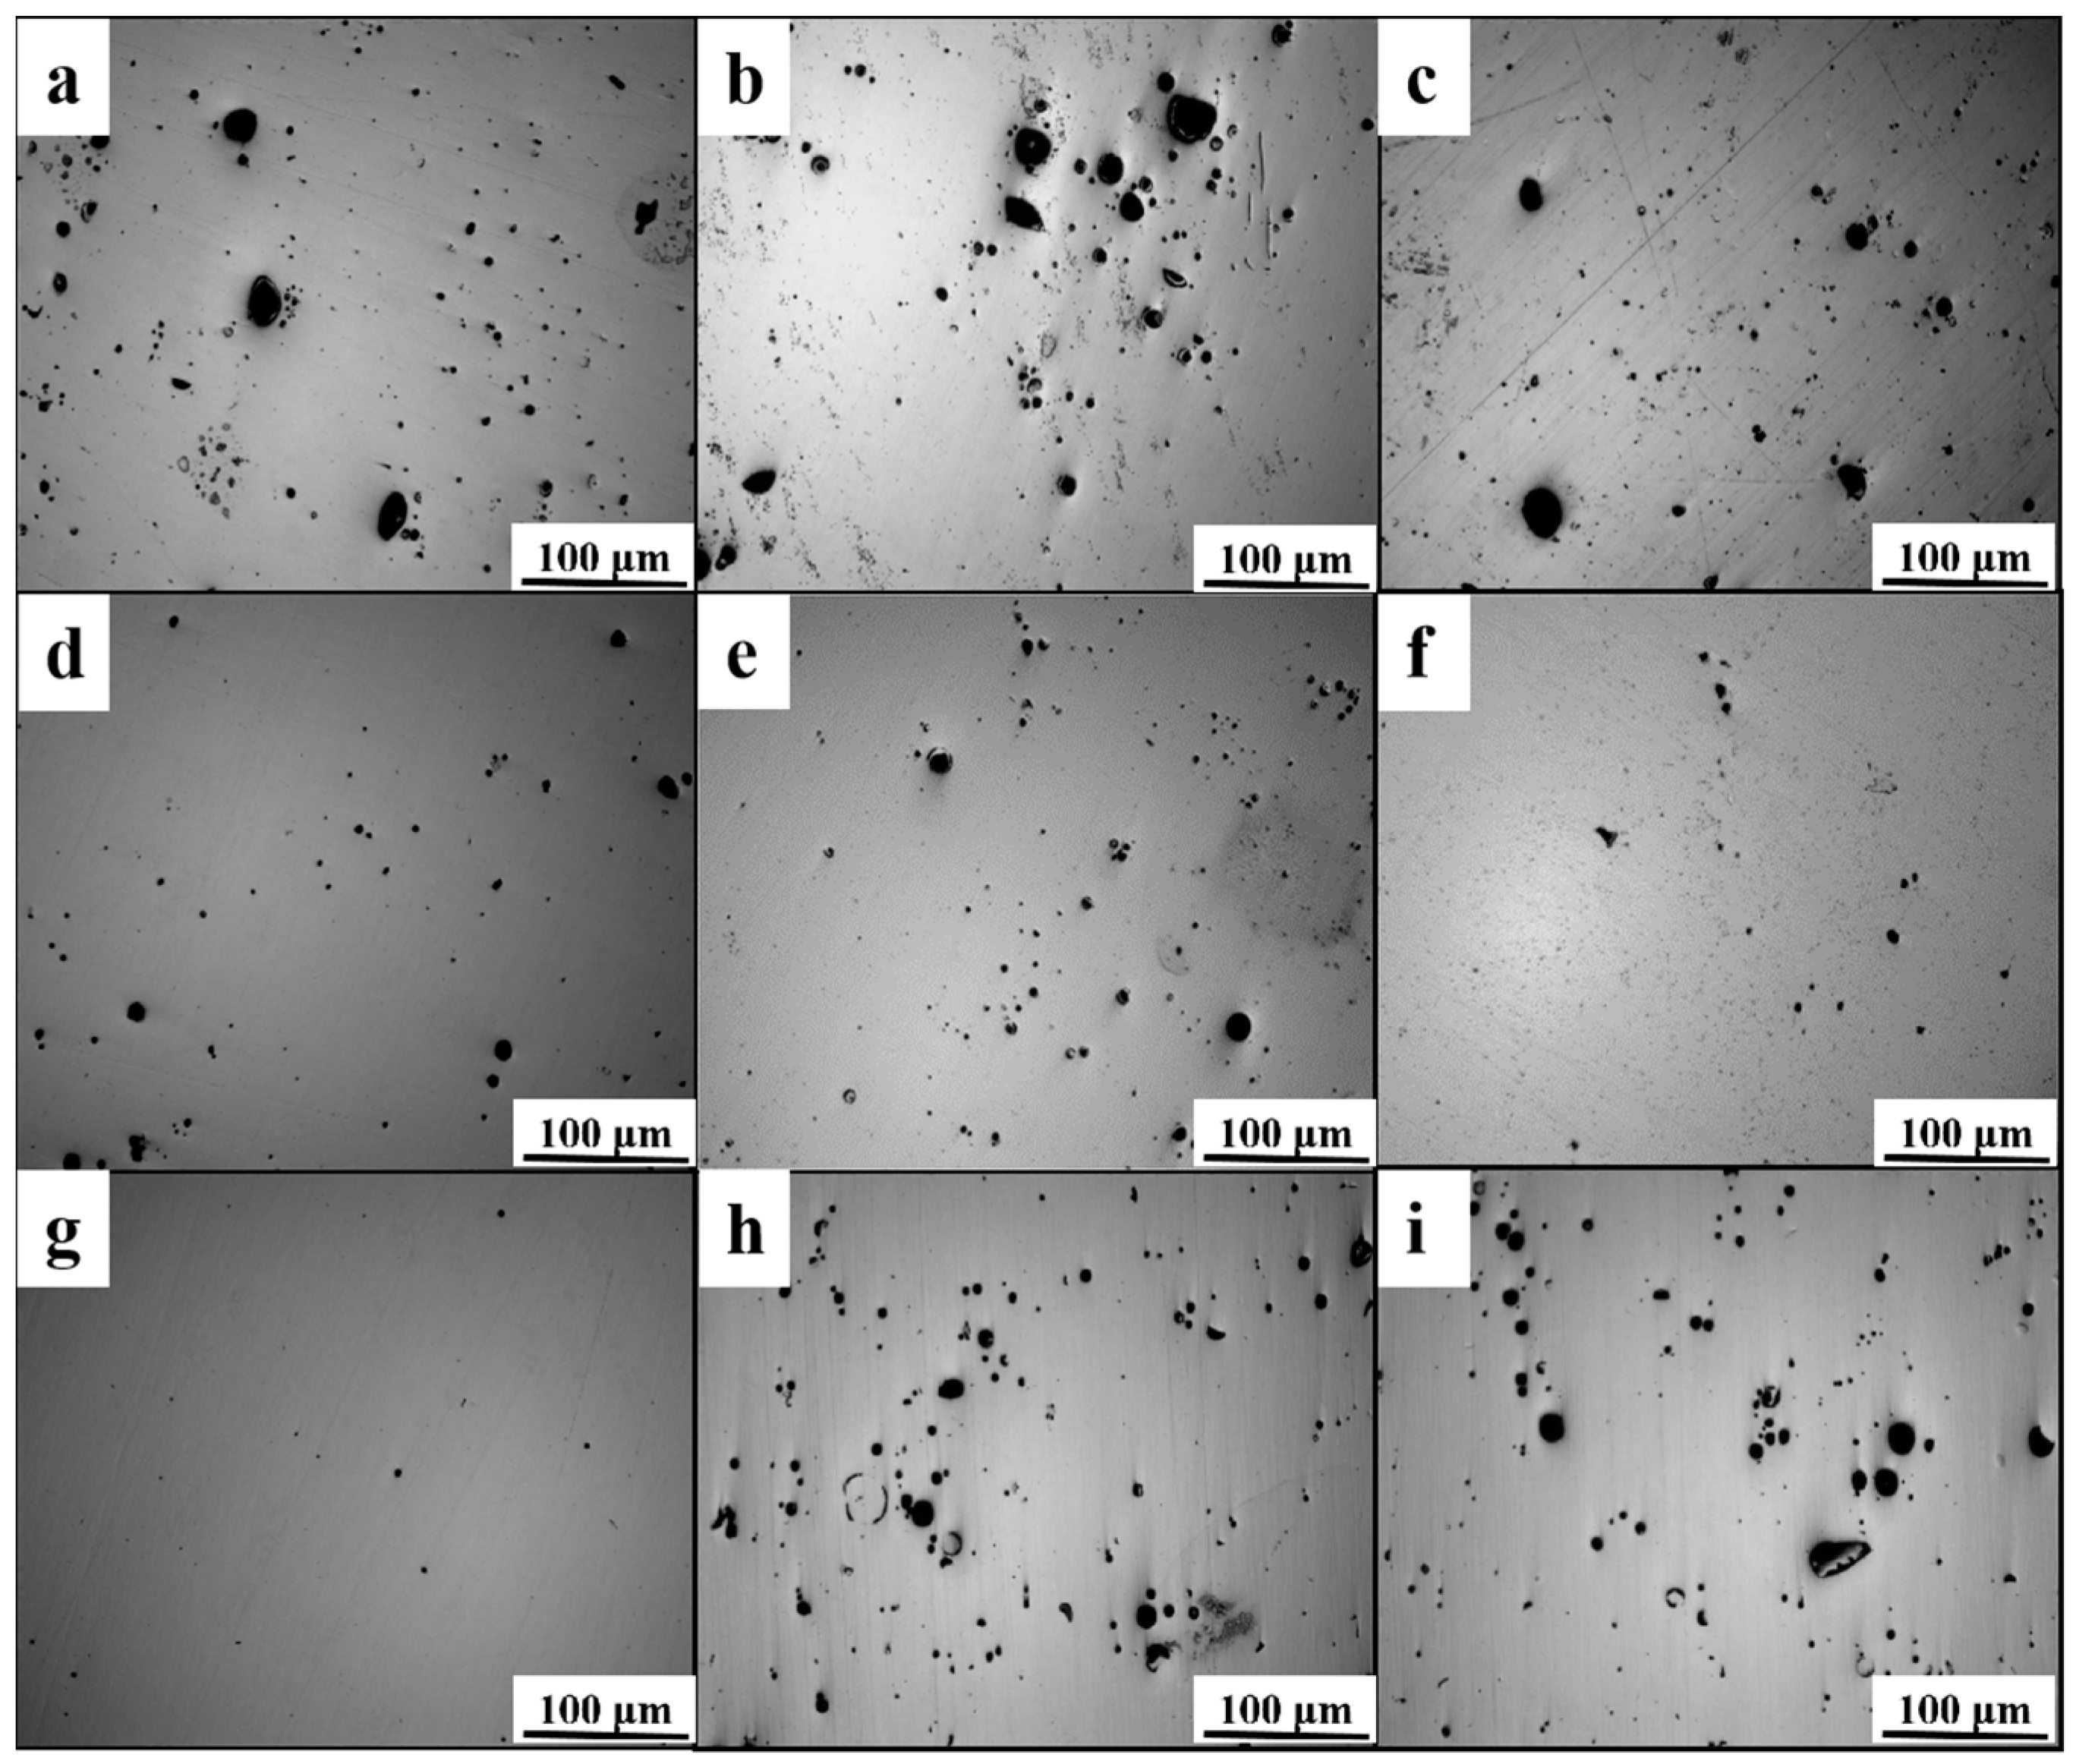
The microstructure (under optical microscopy) of high-nitrogen steel specimens at various energy densities is seen in Figure 4. The graphic shows that the sample exhibits a higher number of unfused flaws and a small number of gas pores while the energy density is low. As the energy density increases, the unfused flaws decrease, while the number of small gas pores initially increases and then decreases. At an energy density of 148.8 J/mm³, both the unfused flaws and gas pores are relatively low in number. However, when the energy density becomes too high, although the small gas pores almost disappear, irregular voids, spheroidized particles, and spatters occur. This phenomenon is attributed to the fact that at lower energy densities, the temperature of the melt pool is low, resulting in more unfused flaws in the sample, and slow gas escapes, leading to fewer gas pores. As the energy density increases, the temperature of the melt pool rises, prolonging the presence of the melt pool and increasing the time for gas escape, thereby reducing the unfused flaws and gas pores [19,20]. However, excessively high energy density can result in keyholes, spatters, and spheroidization as well [21].
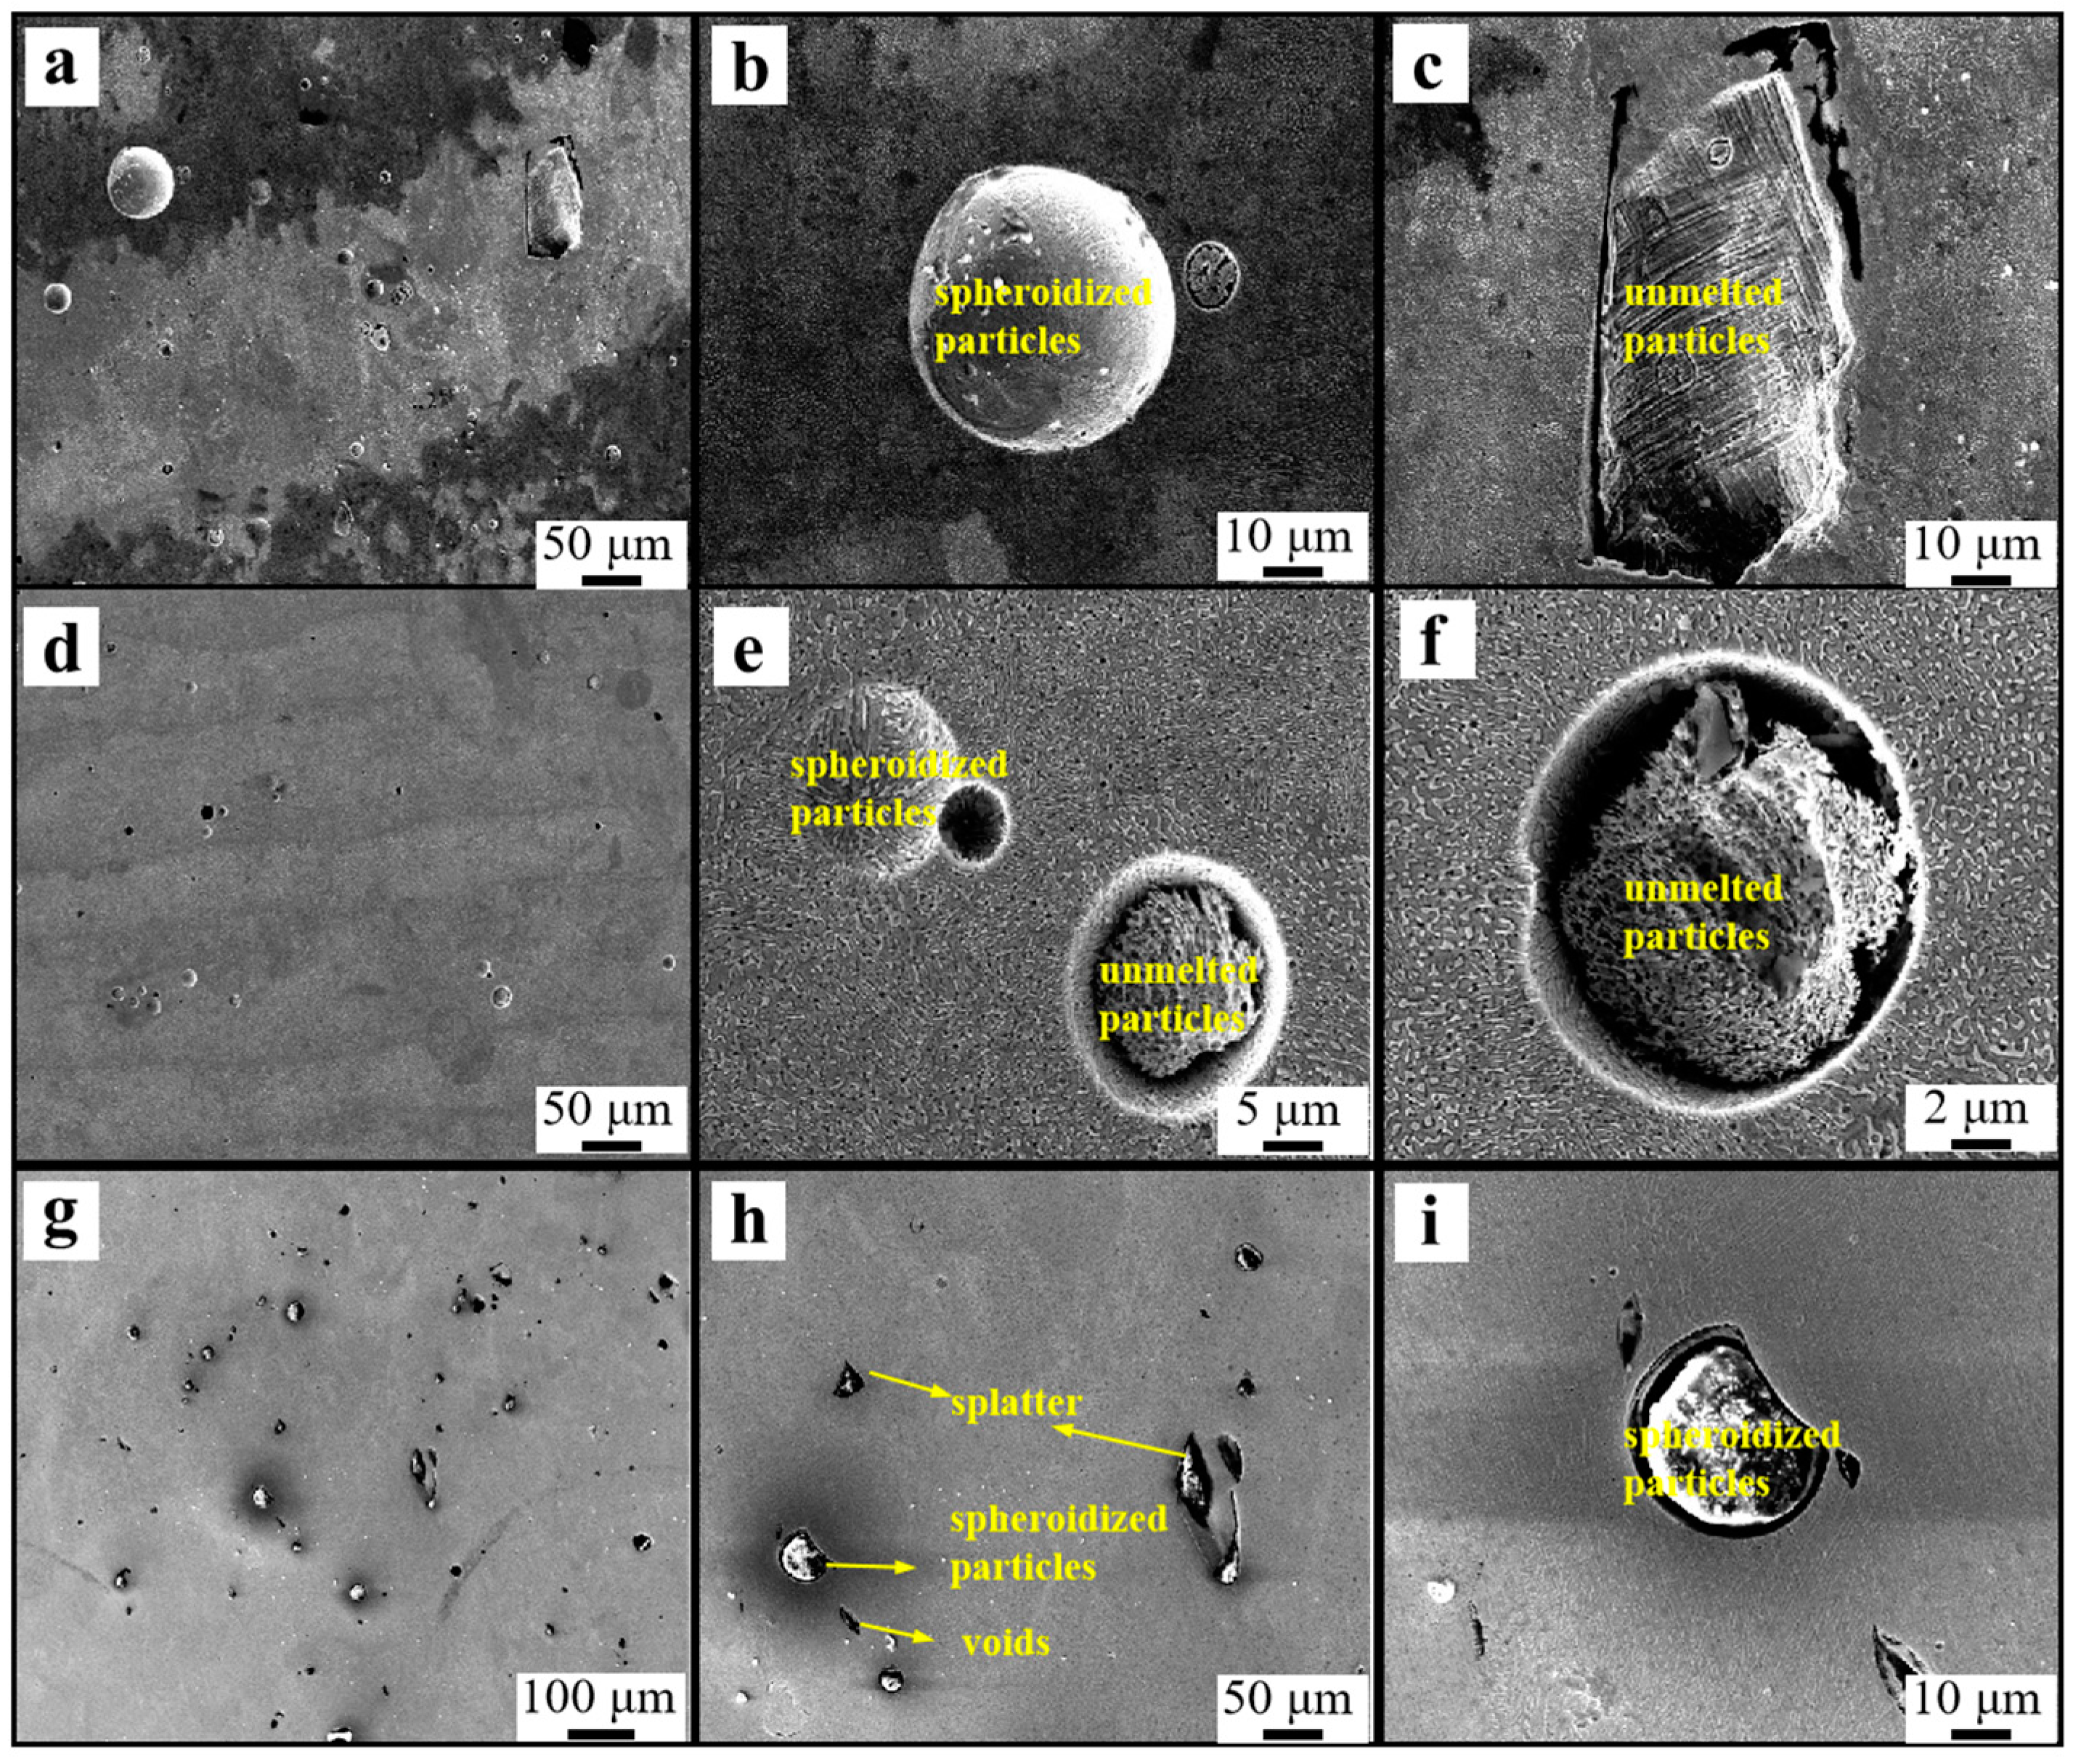
To further investigate the association between lack of fusion and energy density in samples, the microstructural defects of the samples under typical energy density were examined using a scanning electron microscope (SEM). Figure 5 depicts the sample’s particle at three distinct energy densities, illustrating the existence of spheroidized, unmelted, and splashing particles. The size of spheroidized particles and unmelted particles decreases as energy density increases. When the energy density is too great, however, irregular pores, spheroidized particles, and splashes may form. This is due to the fact that when the energy density is low, the temperature of the molten pool is low, and the fluidity and wettability of the liquid phase are poor, resulting in a large number of unmelted and spheroidized substances in the sample. As the energy density increases, the temperature of the molten pool increases, and the fluidity and wettability of the liquid phase improve, resulting in a decrease in the size and quantity of unmelted and spheroidized.

3.2. Nitrogen Concentration and Phase Evolution

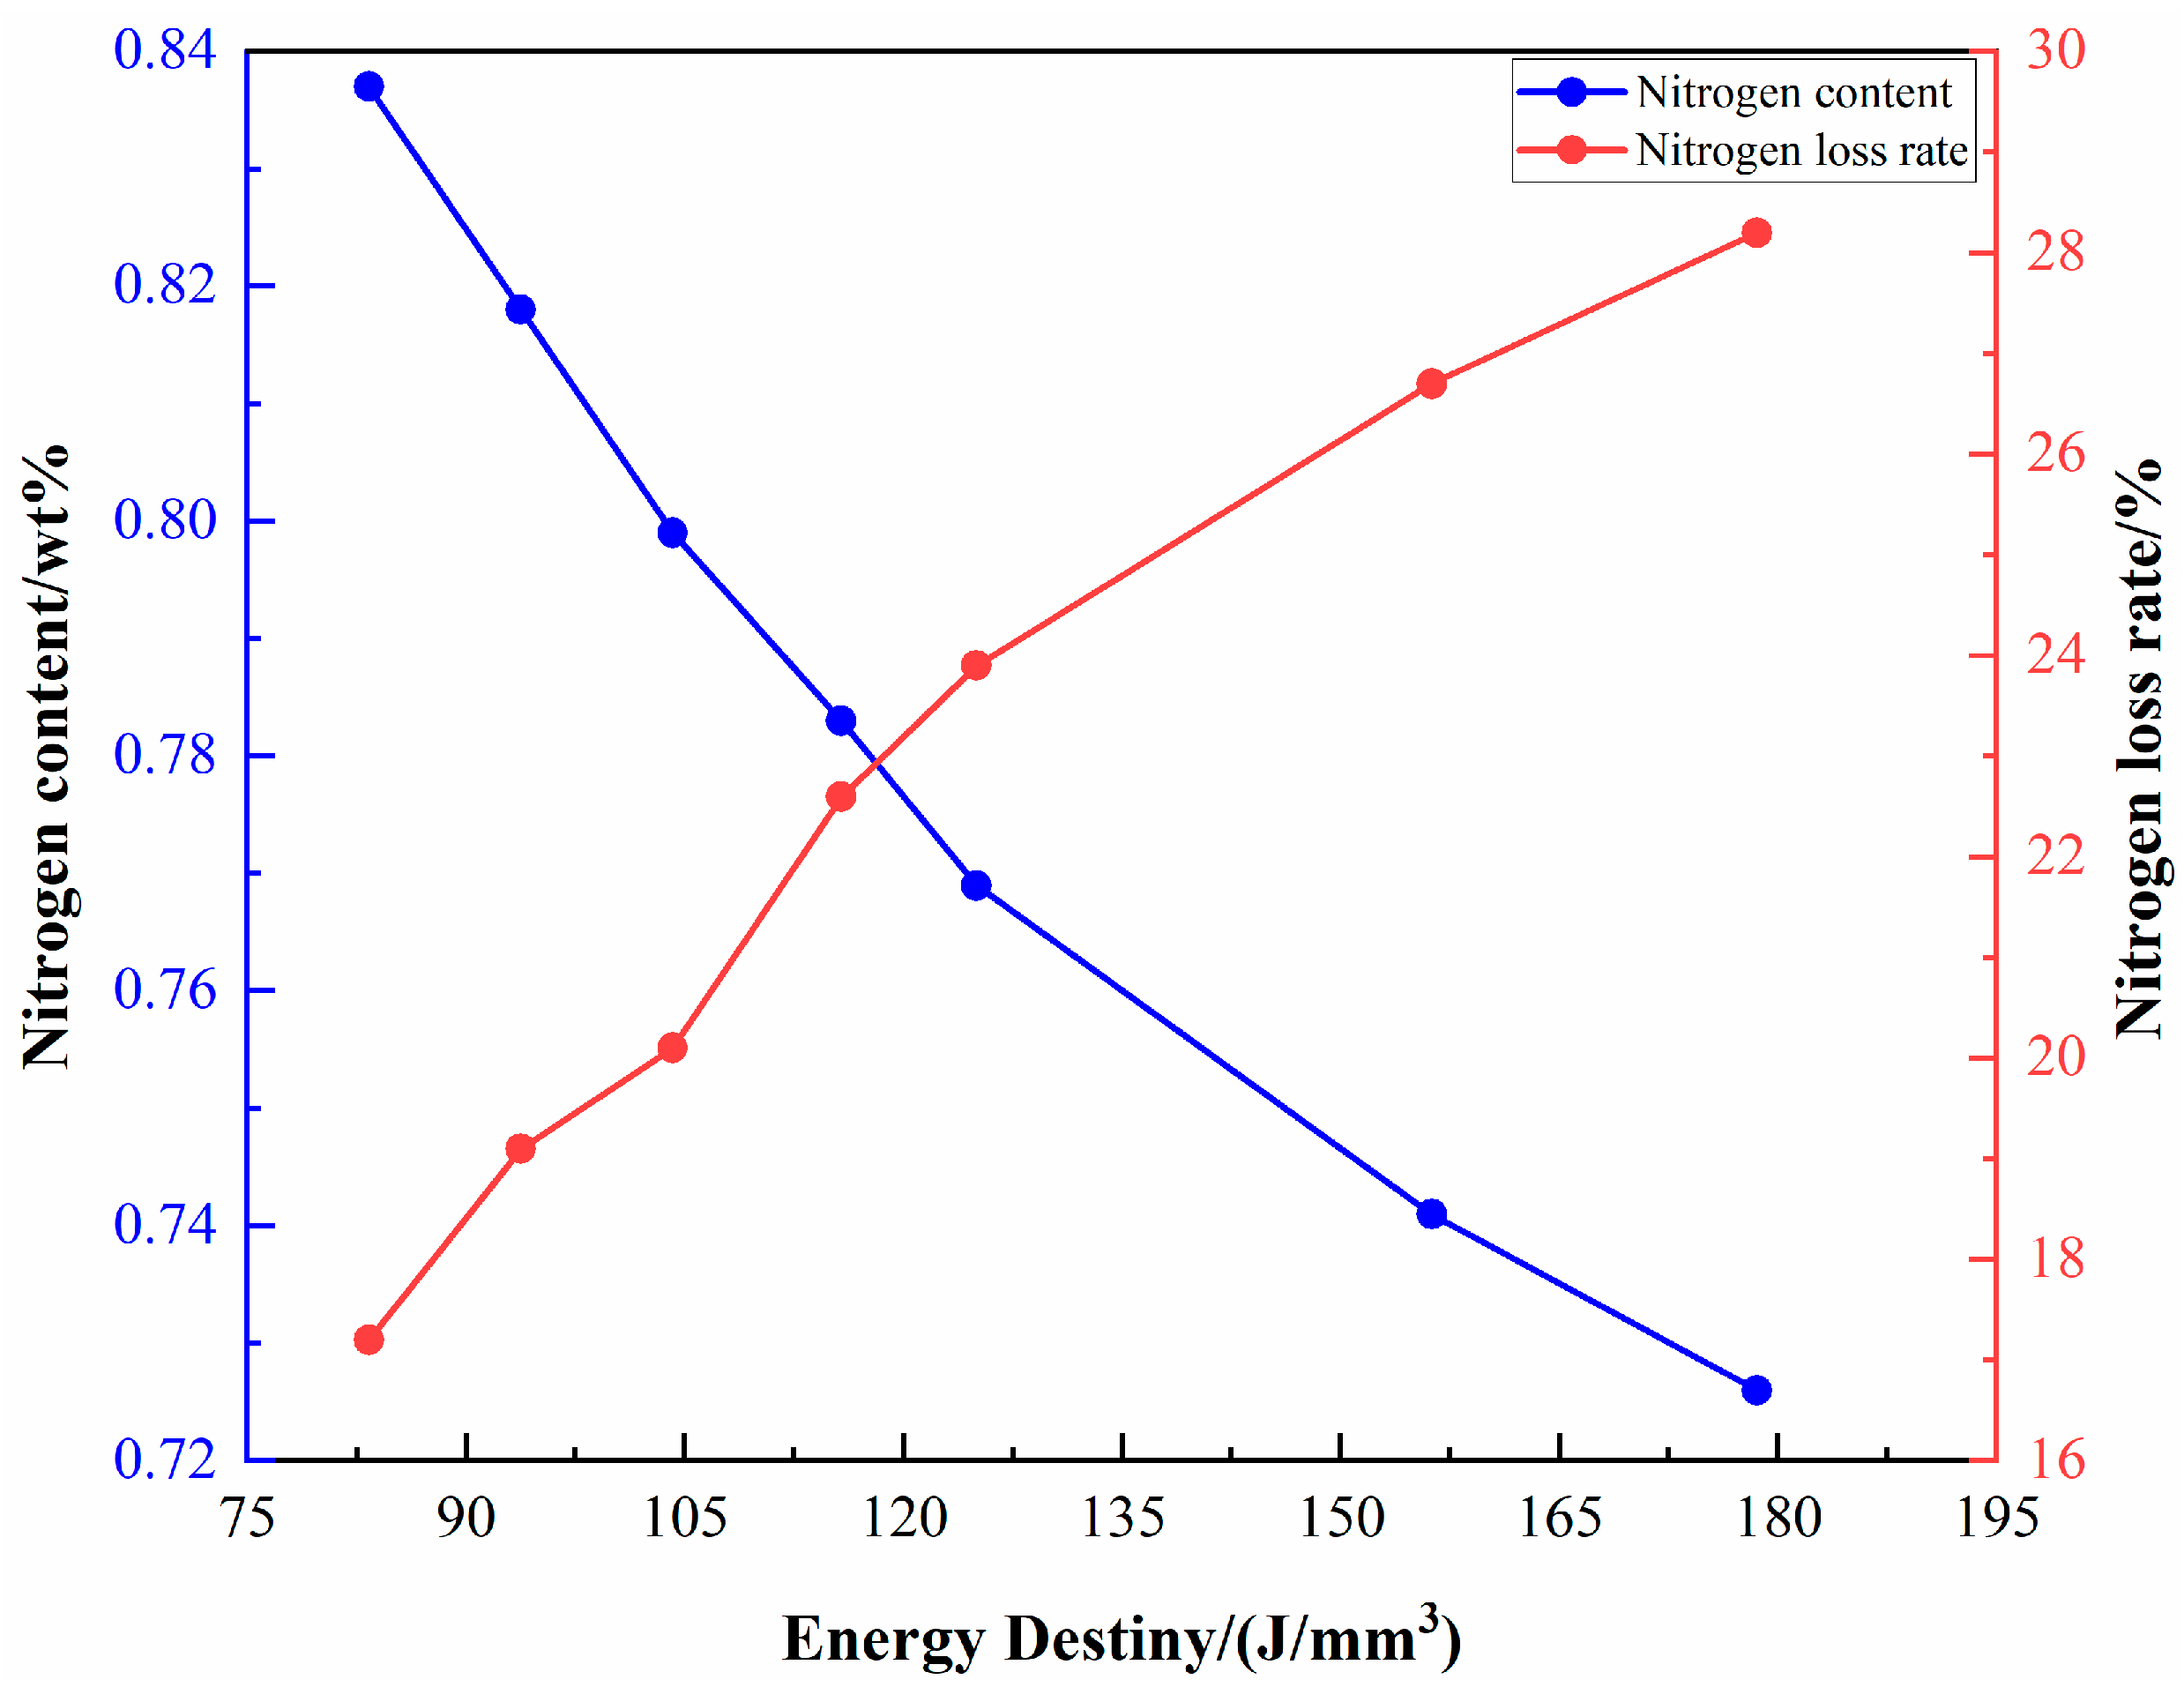
Figure 6 displays the results of studies on the nitrogen content and nitrogen loss of high-nitrogen steel samples produced under various processing conditions. The nitrogen content of the sample steadily drops and the nitrogen loss rate gradually rises as the energy density rises. It is hypothesized that the rise in energy density hastens nitrogen evaporation. Related research has demonstrated that when the energy density is low, the molten pool solidifies quickly, and the nitrogen produced cannot escape in a timely way [17]. The dynamic viscosity of the melt decreases as the temperature of the molten pool rises when the energy density is high, and at the same time, the recoil effect of the laser beam on the molten pool is enhanced. This enhances the disturbance effect of the high-temperature molten pool and encourages nitrogen escape [22].
Further analysis reveals that the selective laser melting is occurring at a pressure that is relatively close to that of ambient air (about 25 mbar higher than ambient pressure). At a standard atmospheric pressure, the solubility of nitrogen in steel is only 0.045 wt.% [23], while the initial nitrogen content of the powder is 1.01 wt%. The nitrogen content in the micro melting pool has exceeded its saturation solubility, resulting in nitrogen escape and nitrogen loss. When the energy density is low, the powder absorbs less energy, and the relative existence time of the molten pool is decreased, which inhibits nitrogen atom escape and lowers nitrogen loss. As the energy density rises, the energy absorbed by the powder rises, and the relative amount of existence time for the molten pool formation rises, encouraging nitrogen atoms to flee and escalating nitrogen loss. As a result, the sample’s nitrogen concentration falls and nitrogen loss rises as energy density rises.
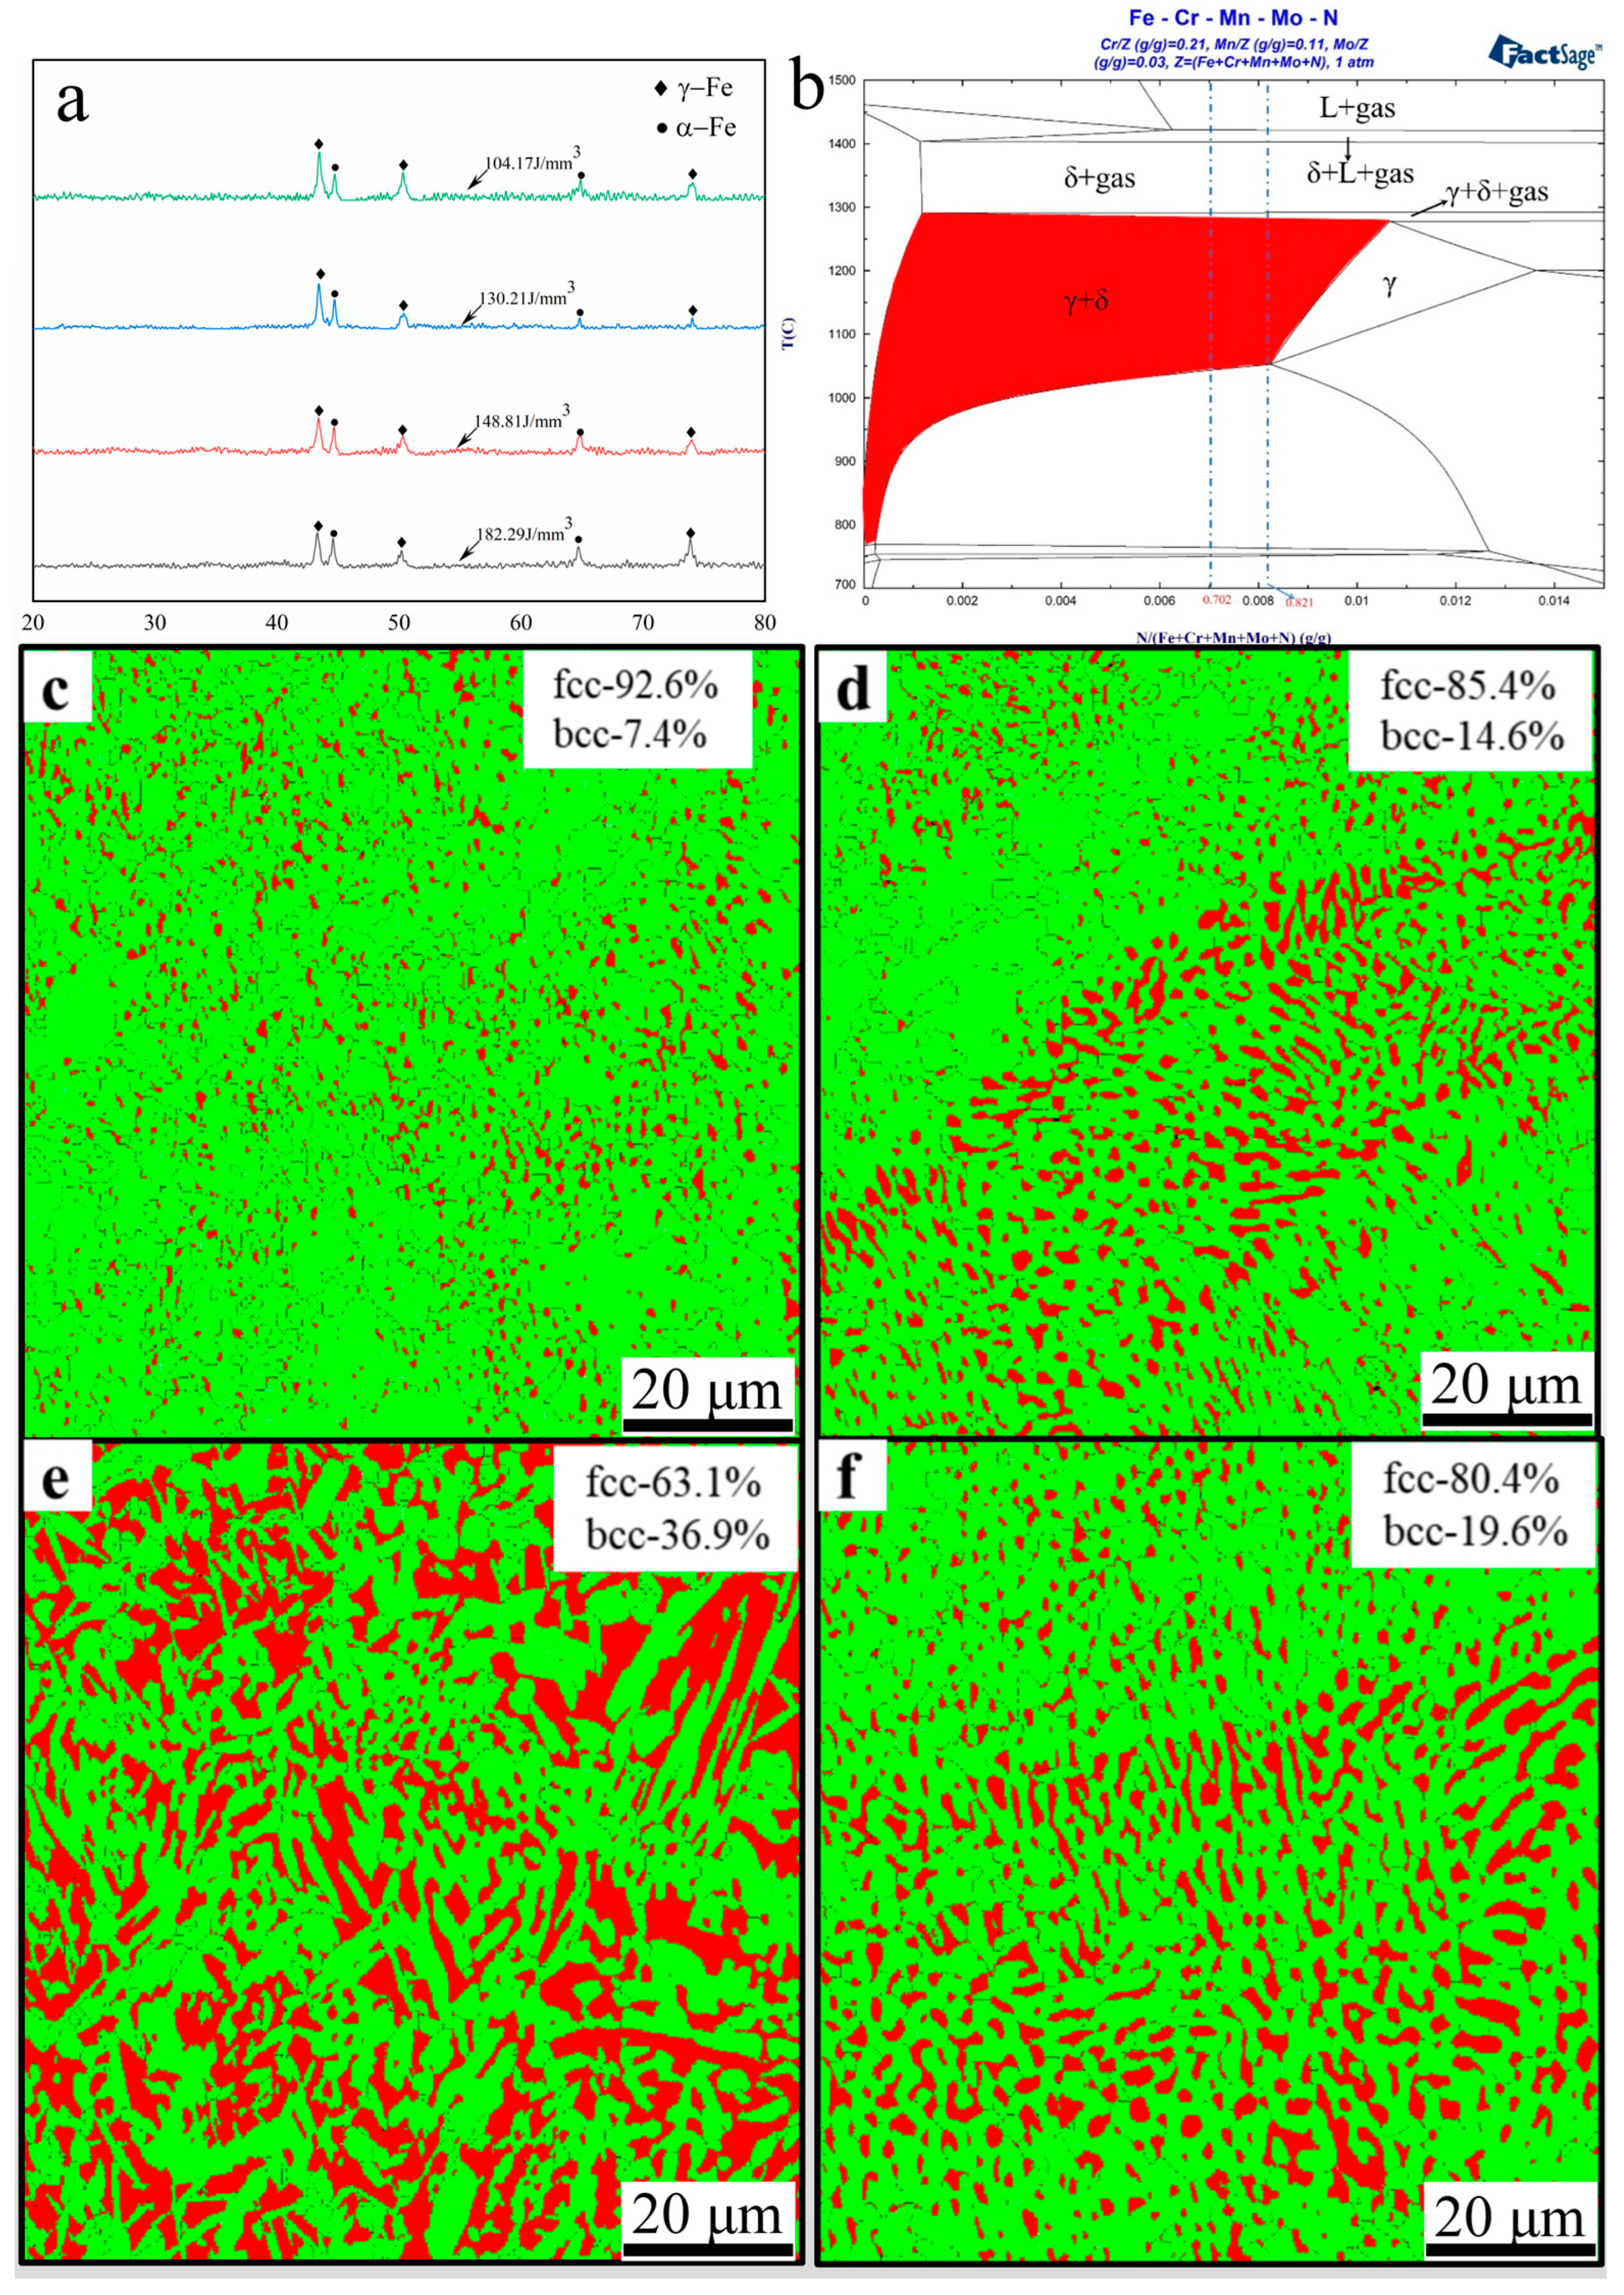
Figure 7 displays the phase composition in high-nitrogen steel samples. Figure 7a shows the XRD test results; Figure 7b shows the Fe-N binary phase diagram; and Figure 7c–f show the EBSD phase ratio distribution of the samples. The results demonstrate that the high-nitrogen steel sample is predominantly made of austenite (α-Fe) and ferrite (γ-Fe), and that as energy density increases, the intensity ratio of the sharpest diffraction peak of Fe steadily declines and does not move. The austenite phase in the sample is continuously dropping as the energy density rises, whereas the ferrite phase is constantly rising. Phase of austenite, which makes up the majority of the phase, has a γ-Fe content that ranges from 92.6% to 63.1%.
The condensation phase transition process of high nitrogen stainless steel is as follows, according to the phase diagram analysis: Liquid phase + gas (N2) → Ferrite phase (δ-Fe) + Liquid phase + gas (N2) → Ferrite phase (δ-Fe) + Liquid phase → Liquid phase + Ferrite phase (δ-Fe) + Austenite phase (γ-Fe) → Ferrite phase (δ-Fe) + Austenite phase (γ-Fe). Nitrogen, as austenite phase (γ-Fe) stable element, is solidly dissolved in the austenite lattice during rapid condensation. When the energy density is low, nitrogen escapes less, and the transformation of austenite phase into ferrite phase occurs less frequently. On the other hand, as the energy density rises, the molten pool’s lifetime lengthens, and nitrogen escapes more frequently.

3.3. Microstructural Evolution

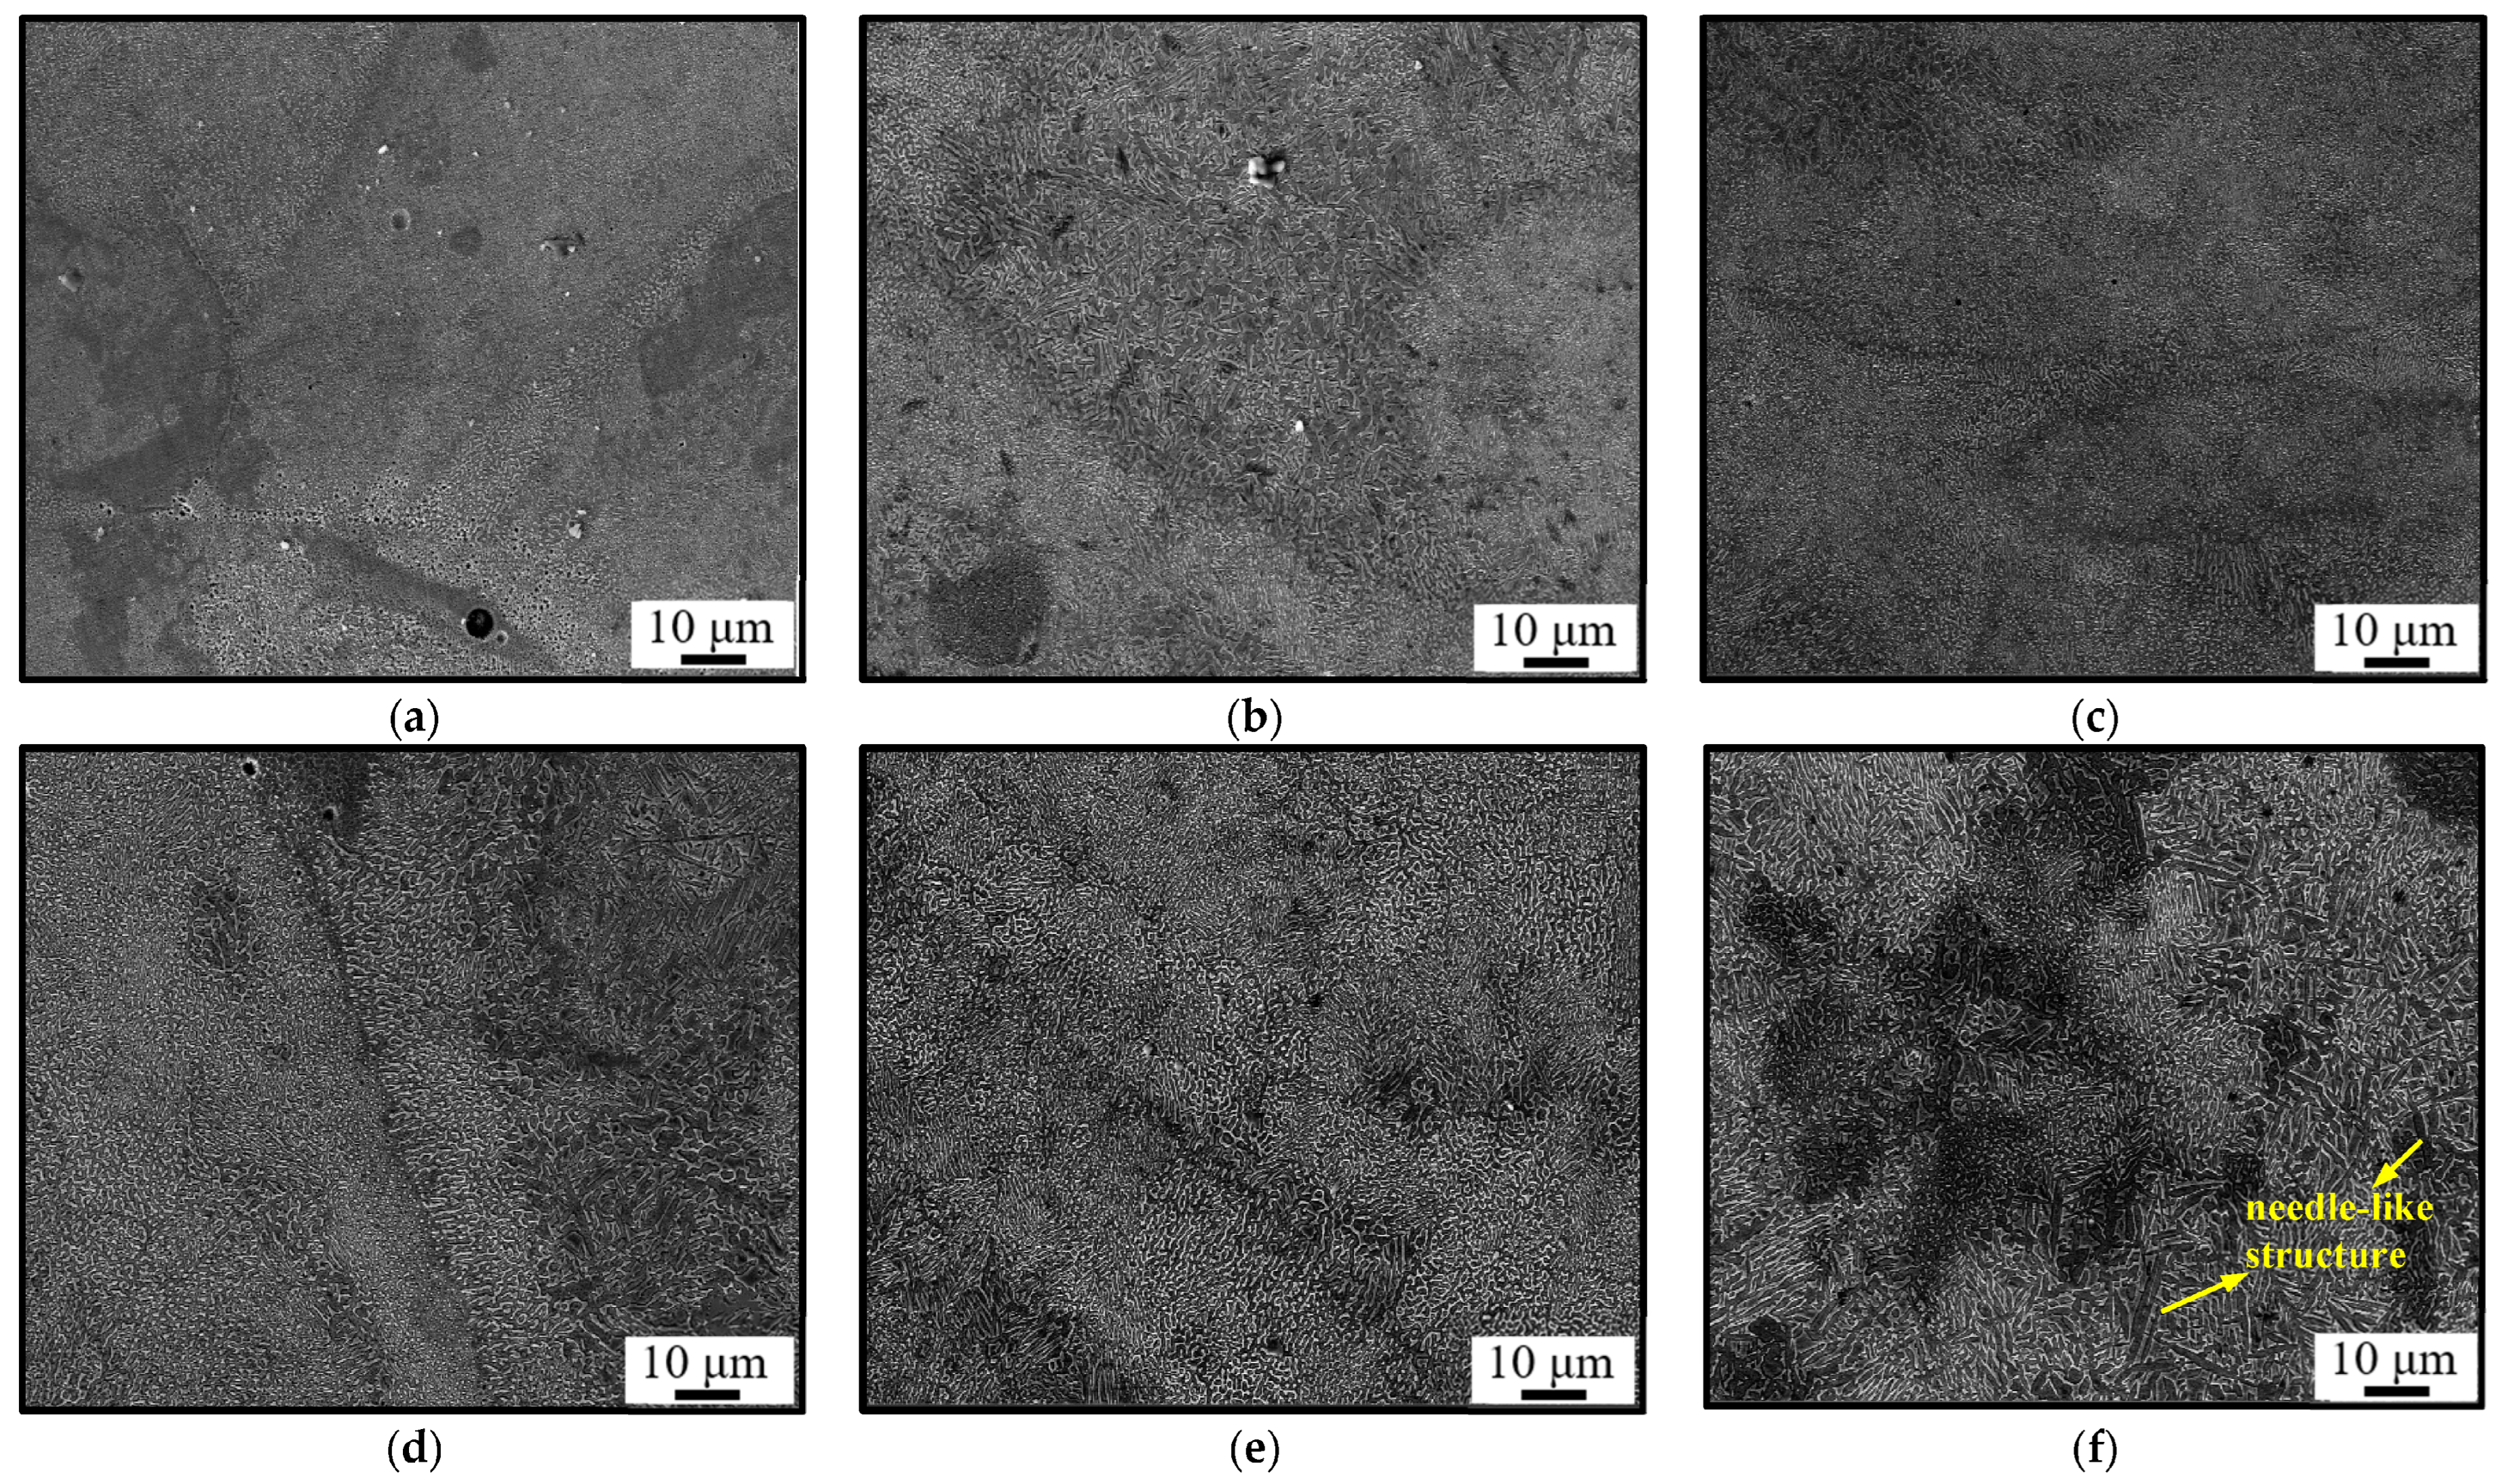
The microstructure (under electron scanning microscopy) of high-nitrogen steel specimens at various energy densities is seen in Figure 8. The sample is mostly made up of columnar and cellular crystals, as seen in the image. The size of the cellular grains tends to become larger as the energy density rises, and the columnar grains progressively become coarser, especially when the energy density reaches 182.3 J/mm3, which has a needle-like structure that is readily apparent. It is hypothesized that when energy density rises, the laser heat source’s heat input to the powder rises, the temperature of the molten pool rises, and these factors all favor grain development and coarsening. According to the research, a higher energy density during SLM will slow the melt pool’s cooling rate, lessen undercooling, and encourage the formation of crystal nuclei [24]. The biggest temperature gradient and the power of heat diffusion are found at the interface between the molten pool and the formed metal. The direction perpendicular to the molten pool’s border is where the grains in the pool tend to grow [25]. As a result, the crystals rapidly form columnar crystals that develop in the opposite direction of heat dissipation [26].
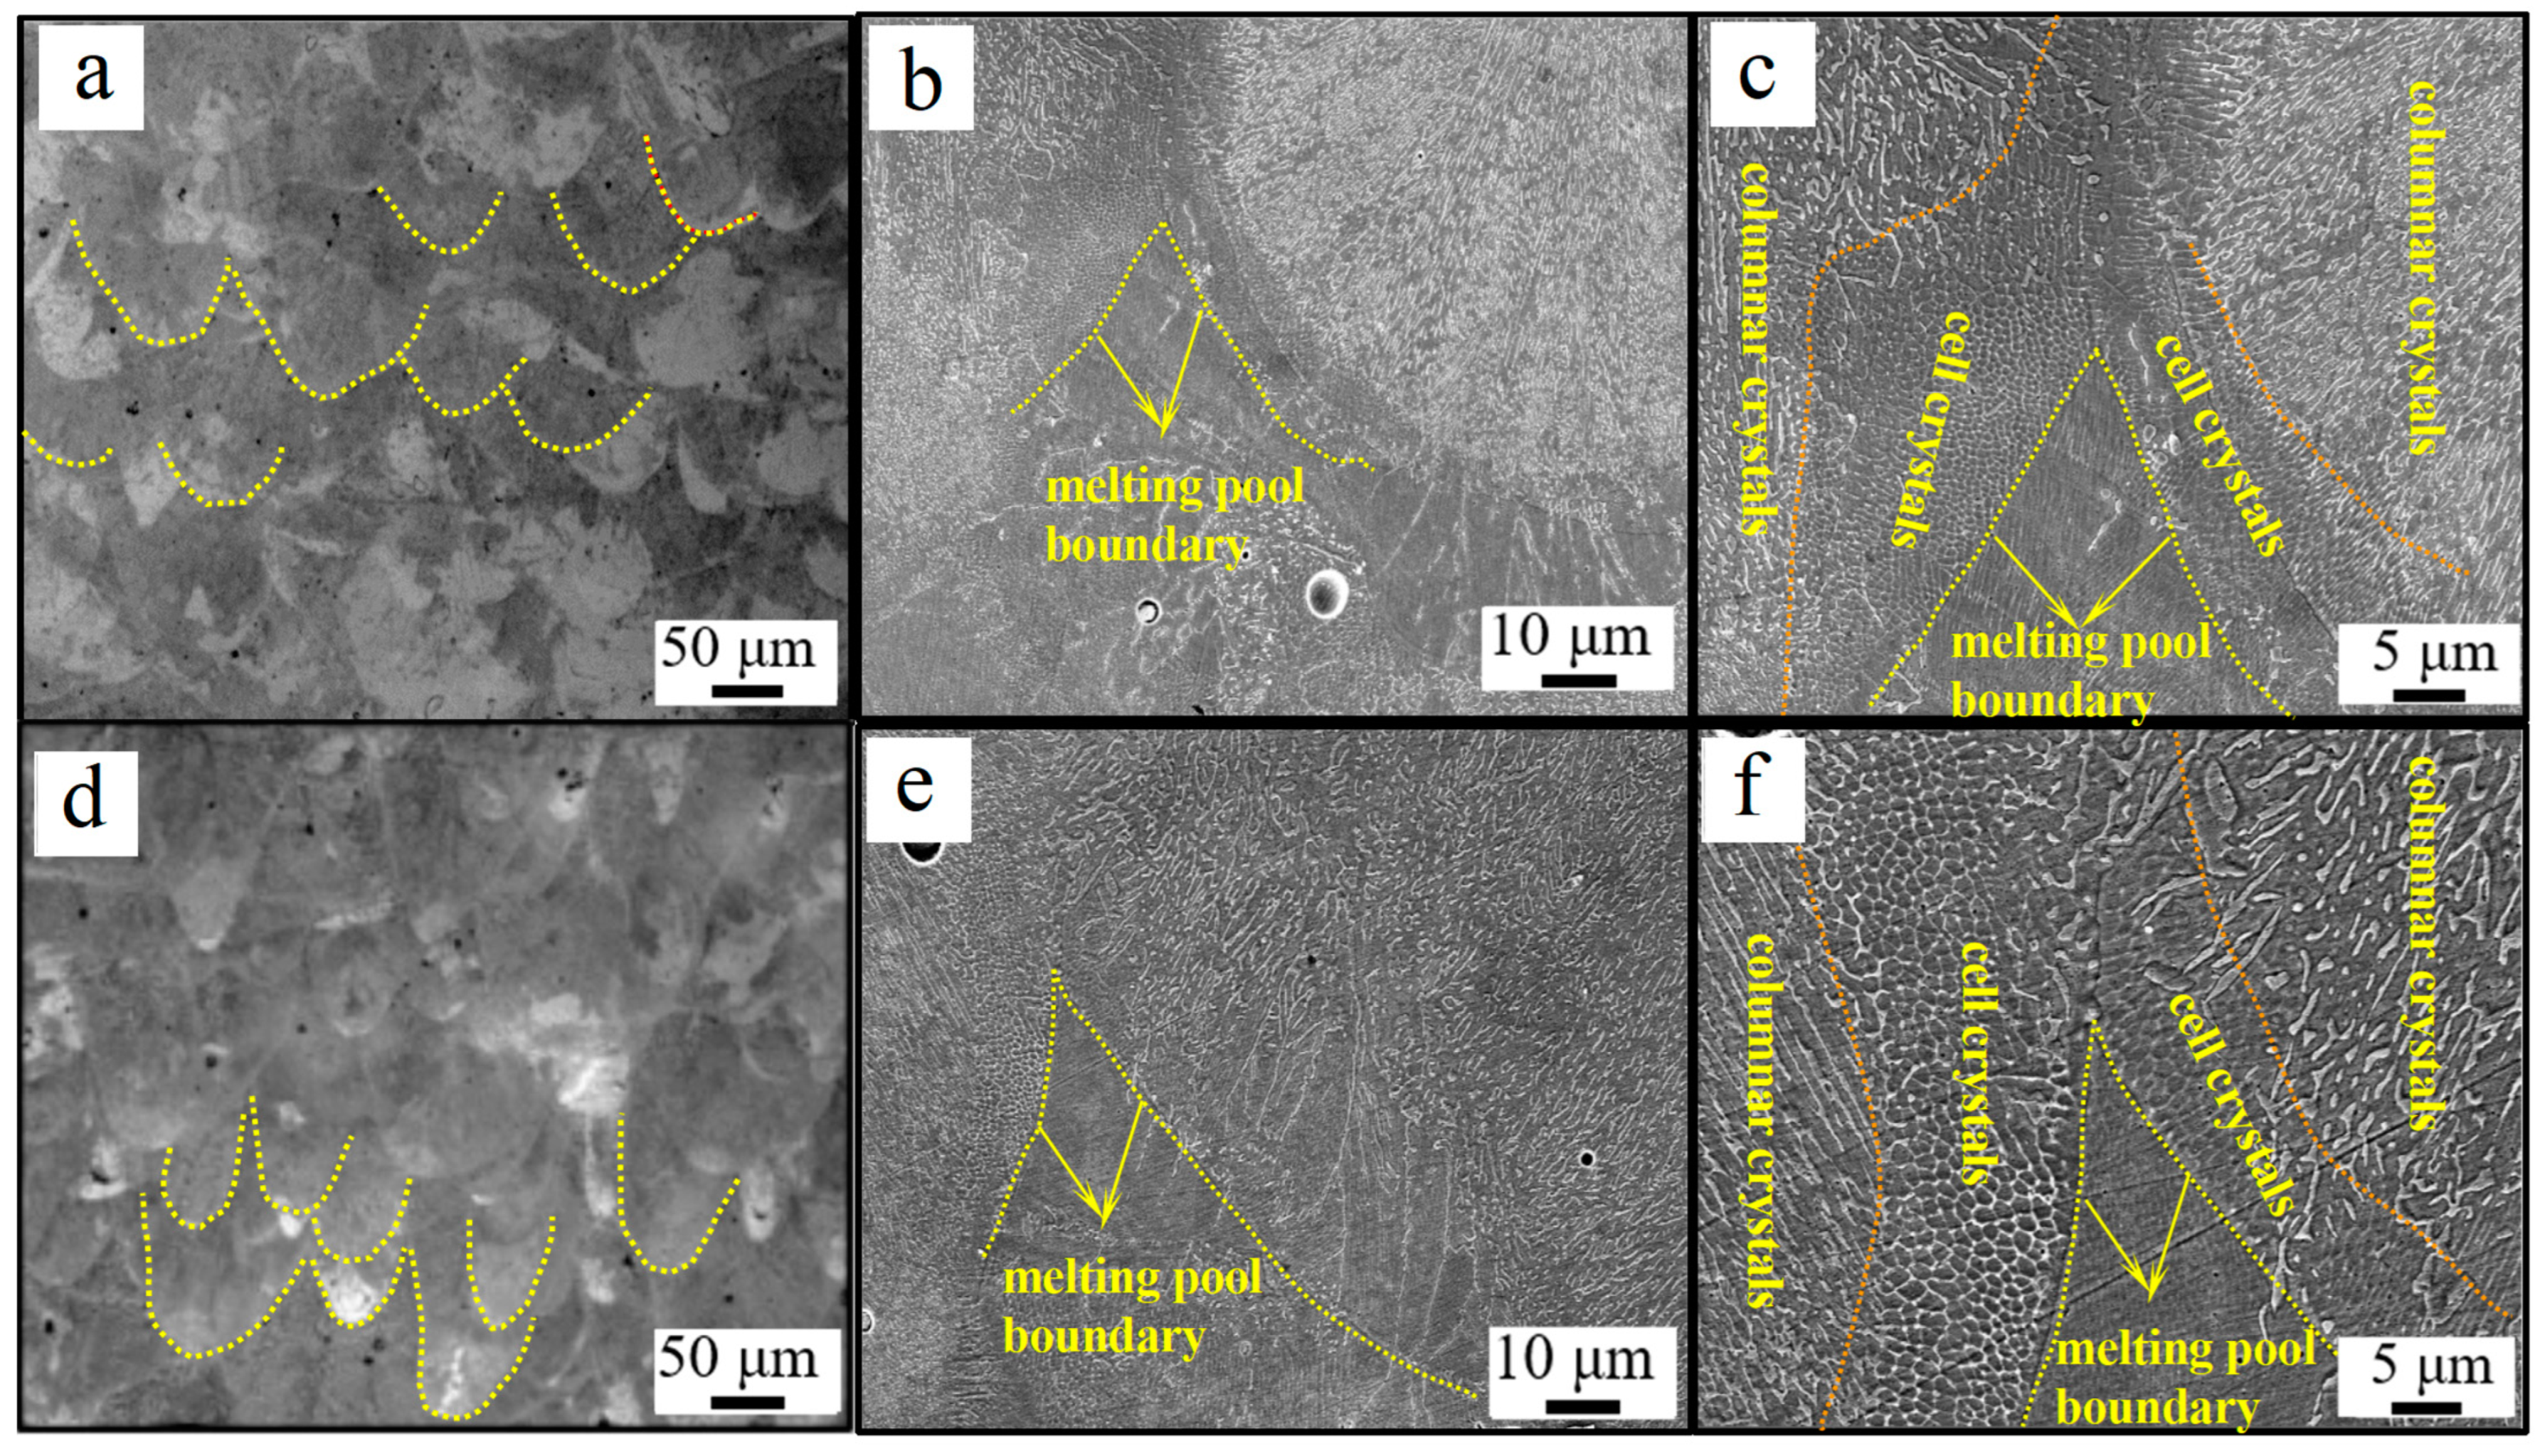
Figure 9 depicts SEM observations of the shape of the molten pool of high nitrogen samples generated at 104.2 J/mm3 and 156.3 J/mm3. The molten pool’s contour line is visible, with the red dashed line marking the bottom edge of the molten pool, which includes two sorts of structures: tiny columnar crystals and cellular crystals. A cellular crystal region with minute grains exists at the molten pool’s border. The nucleation rate of the bottom boundary of the molten pool is higher than that of other positions in the molten pool. The grains gradually change into columnar crystal areas along the bottom boundary of the molten pool towards the inside, and the growth direction faces the center of the molten pool. The bottom of the molten pool assumes a flaky-like structure with smoother edges at a laser energy density of 104.2 J/mm3. The bottom of the molten pool takes on the form of a finger-like structure with a greater degree of edge curvature at a laser energy density of 156.3 J/mm3. The depth of the molten pool deepens and the grain size likewise grows as the energy density rises.

3.4. Mechanical Properties

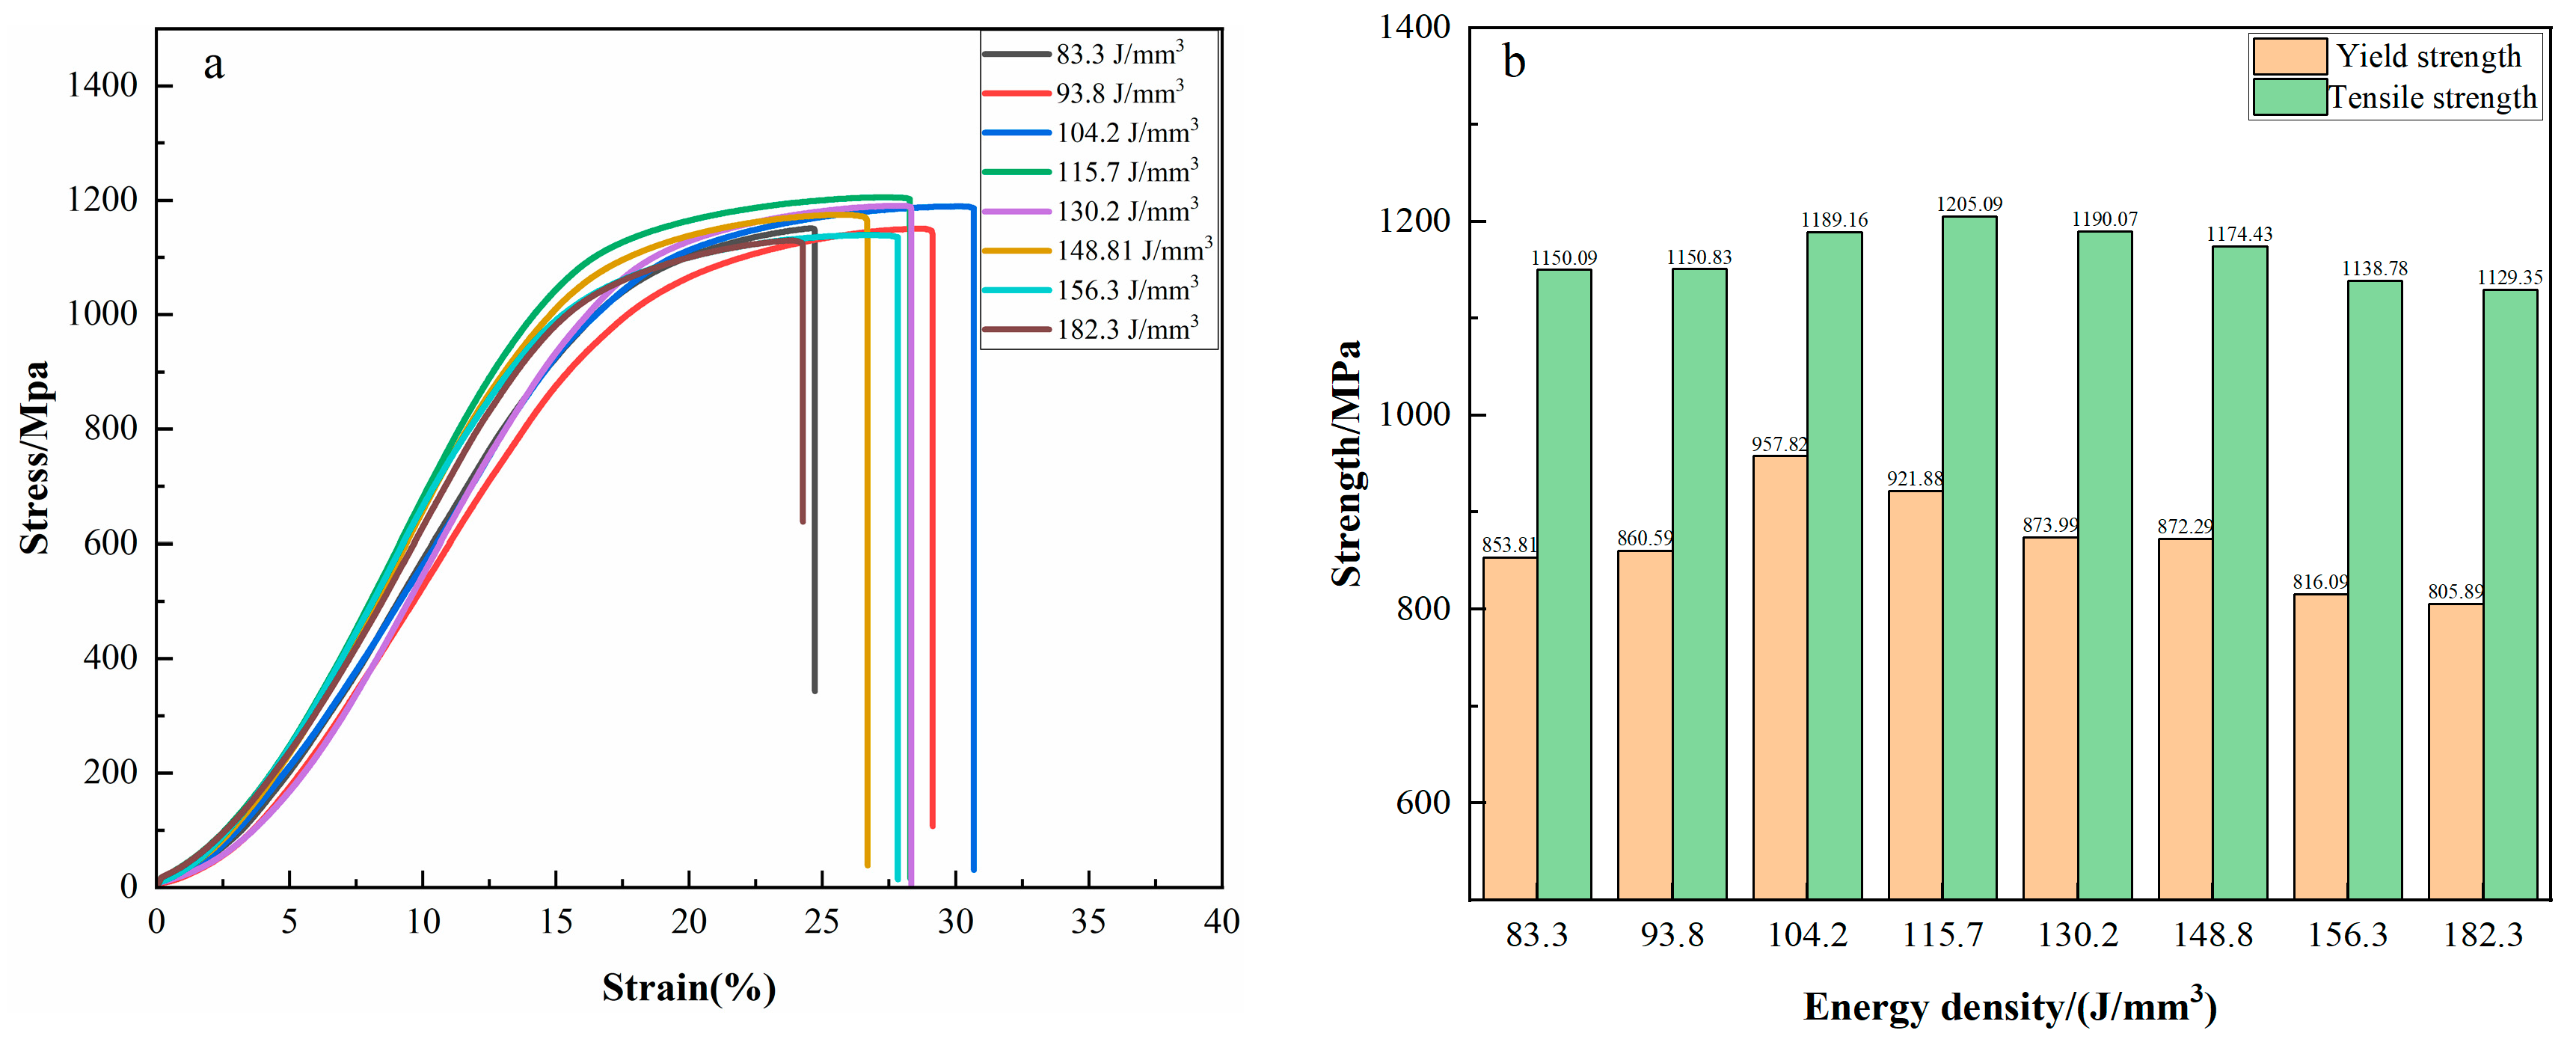
The tensile test results of high-nitrogen steel specimens conducted under various energy density are shown in Figure 10. It is obvious that when the energy density rises, the tensile strength and yield strength initially rise and subsequently fall. The high-nitrogen steel has the best overall mechanical characteristics when the laser power is 250 W, the scanning speed is 700 mm/s, and the corresponding energy density is 148.8 J/cm3. The yield strength, tensile strength, and elongation are 921.9 MPa, 1205.1 MPa, and 27%, respectively. Numerous influencing factors, including nitrogen concentration, relative density, microstructure, etc., have an impact on the mechanical characteristics of high-nitrogen stainless steel. According to the results of nitrogen content and relative density testing, when the energy density is low, the number of unfused defects significantly decreases as the energy density increases, the density rises, and the nitrogen loss rate decreases, resulting in a slight improvement in mechanical properties. When the energy density is too high, the nitrogen loss rate gradually rises as the energy density rises; the increase in density is not significant, and the improvement in mechanical properties is minimal.
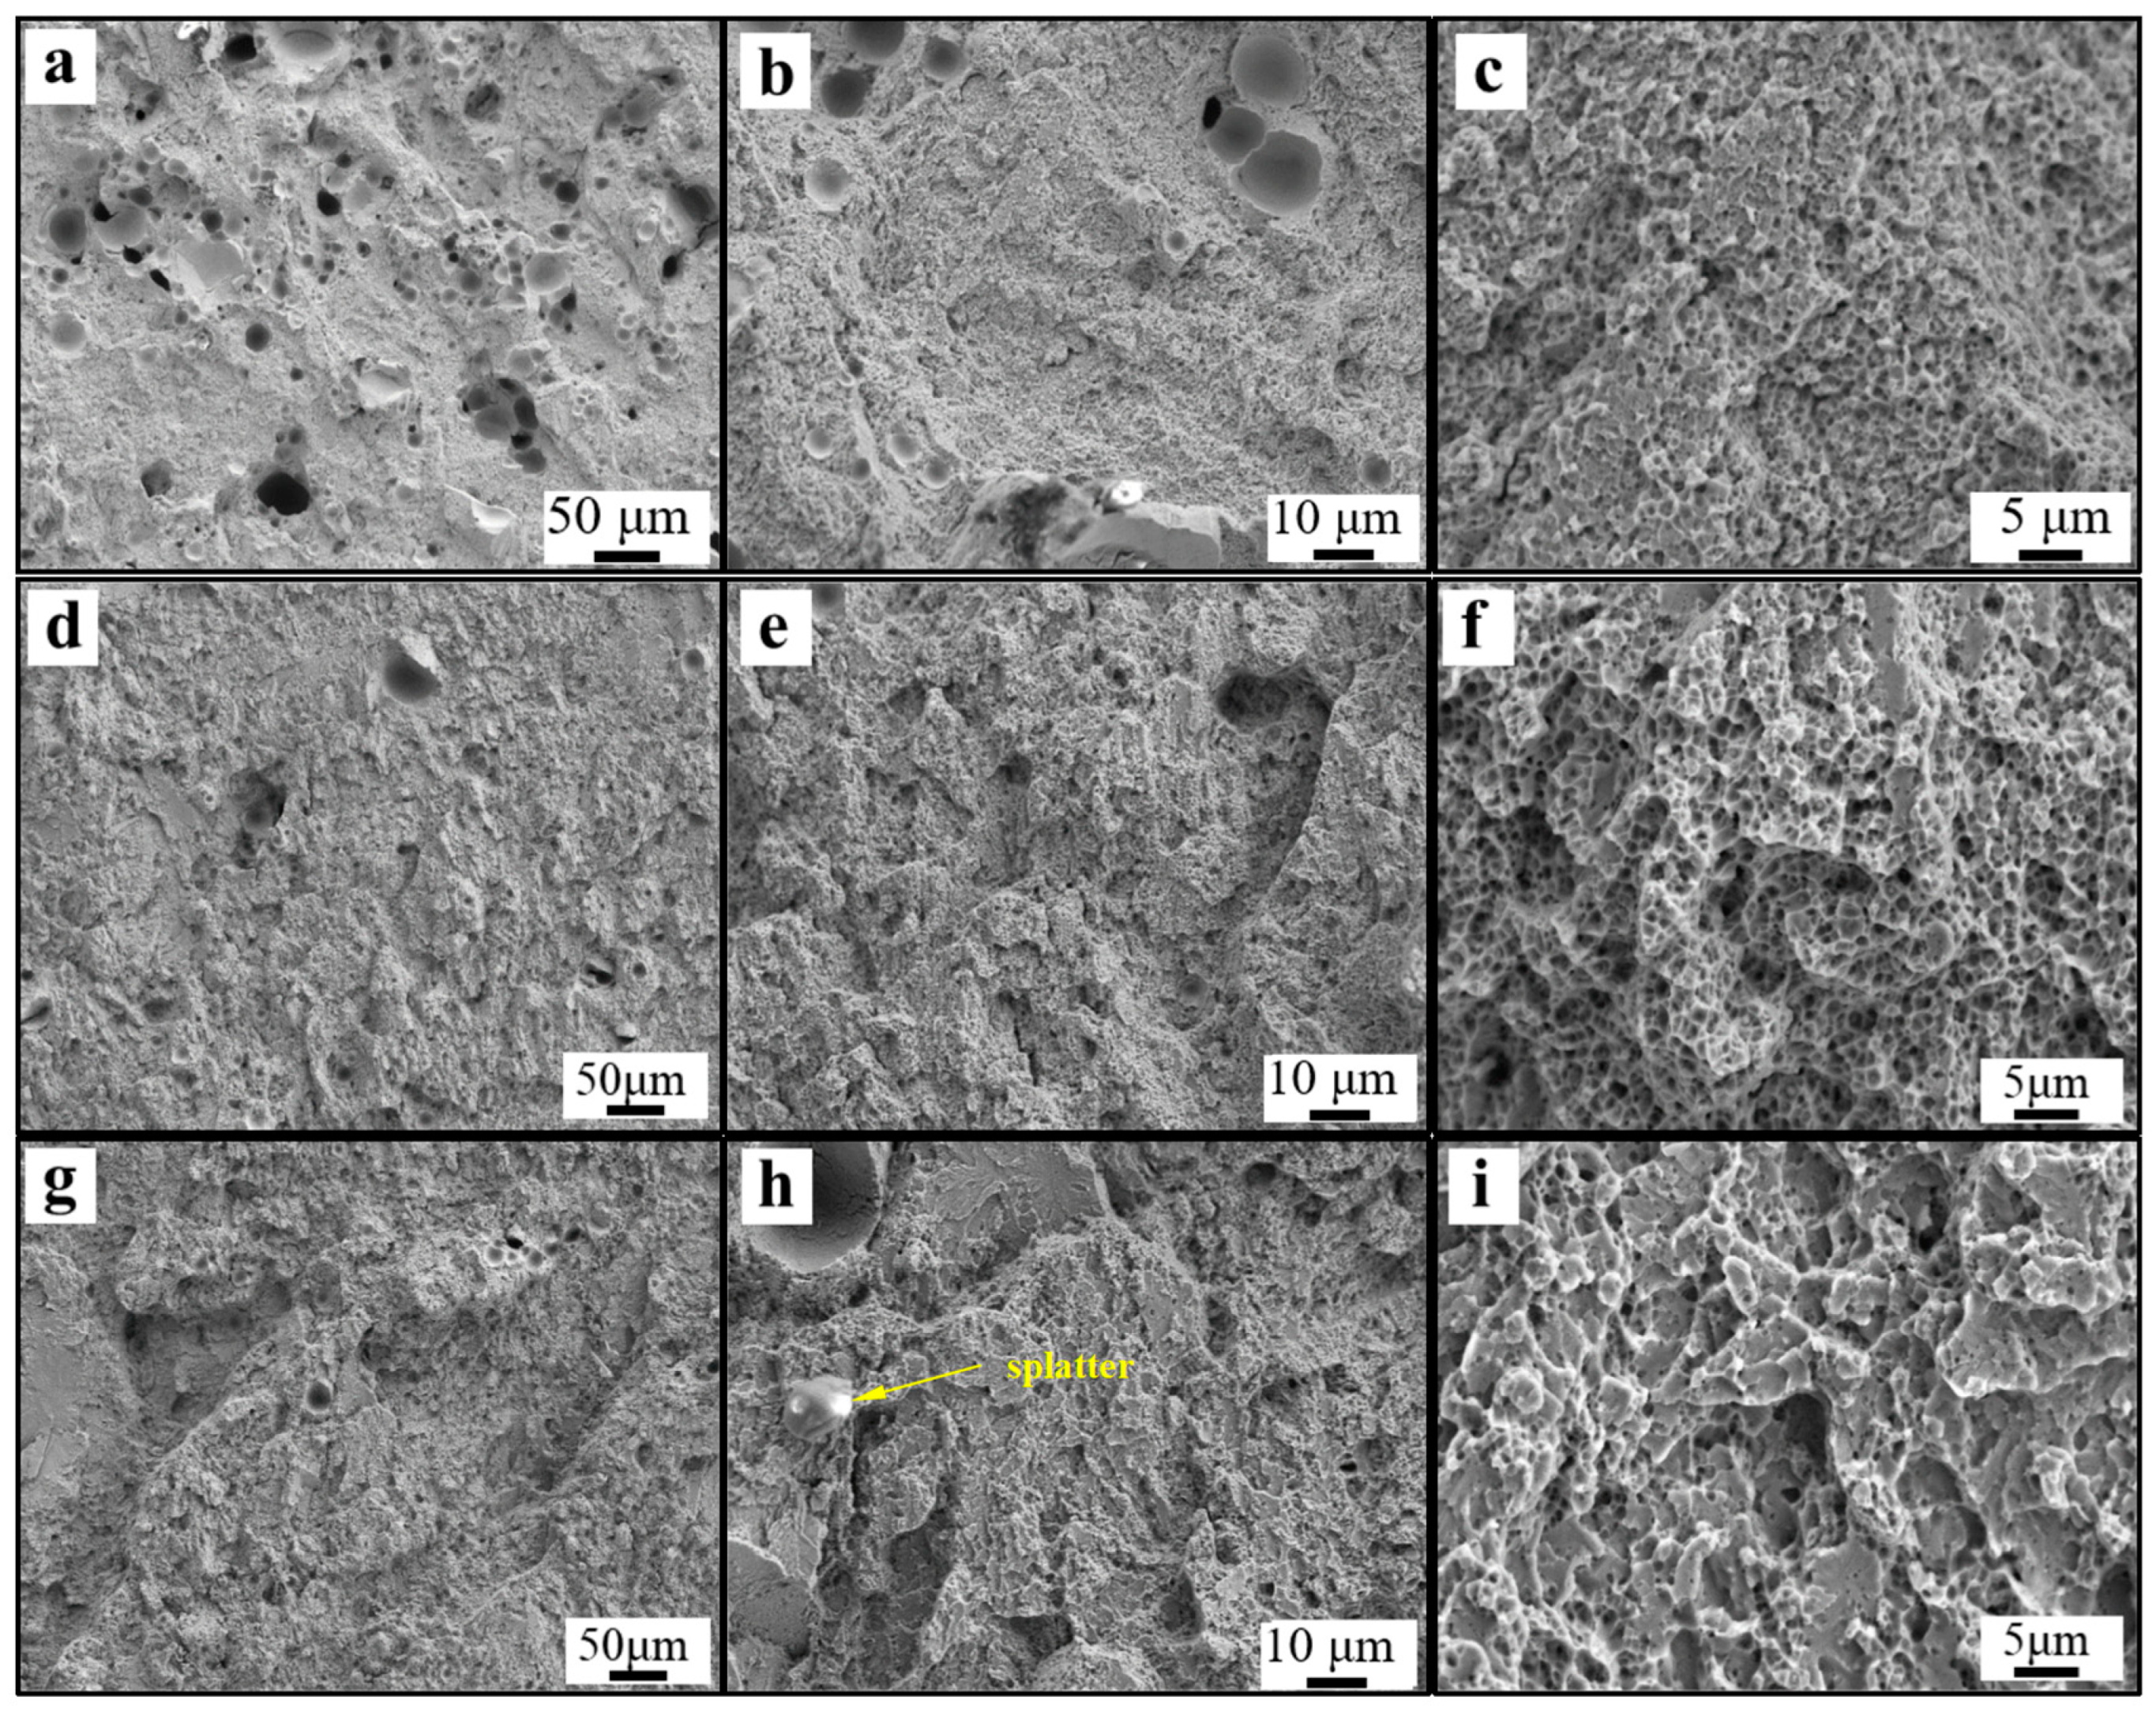
The fracture morphology of high-nitrogen steel specimens at various energy densities is shown in Figure 11. There are numerous internal faults in the sample that are vulnerable to stress concentration and fracture when the laser energy density is low, leading to fewer and shallower dimples (Figure 11a–c). There are more deeper dimples and fewer internal flaws when the laser energy density is moderate (Figure 11d–f). When the laser energy density is too high, molten droplet splashes will remain inside the sample (Figure 11g–i), resulting in a high surface glossiness with very few dimples and mostly brittle fracture surfaces.

3.5. Corrosion Resistance

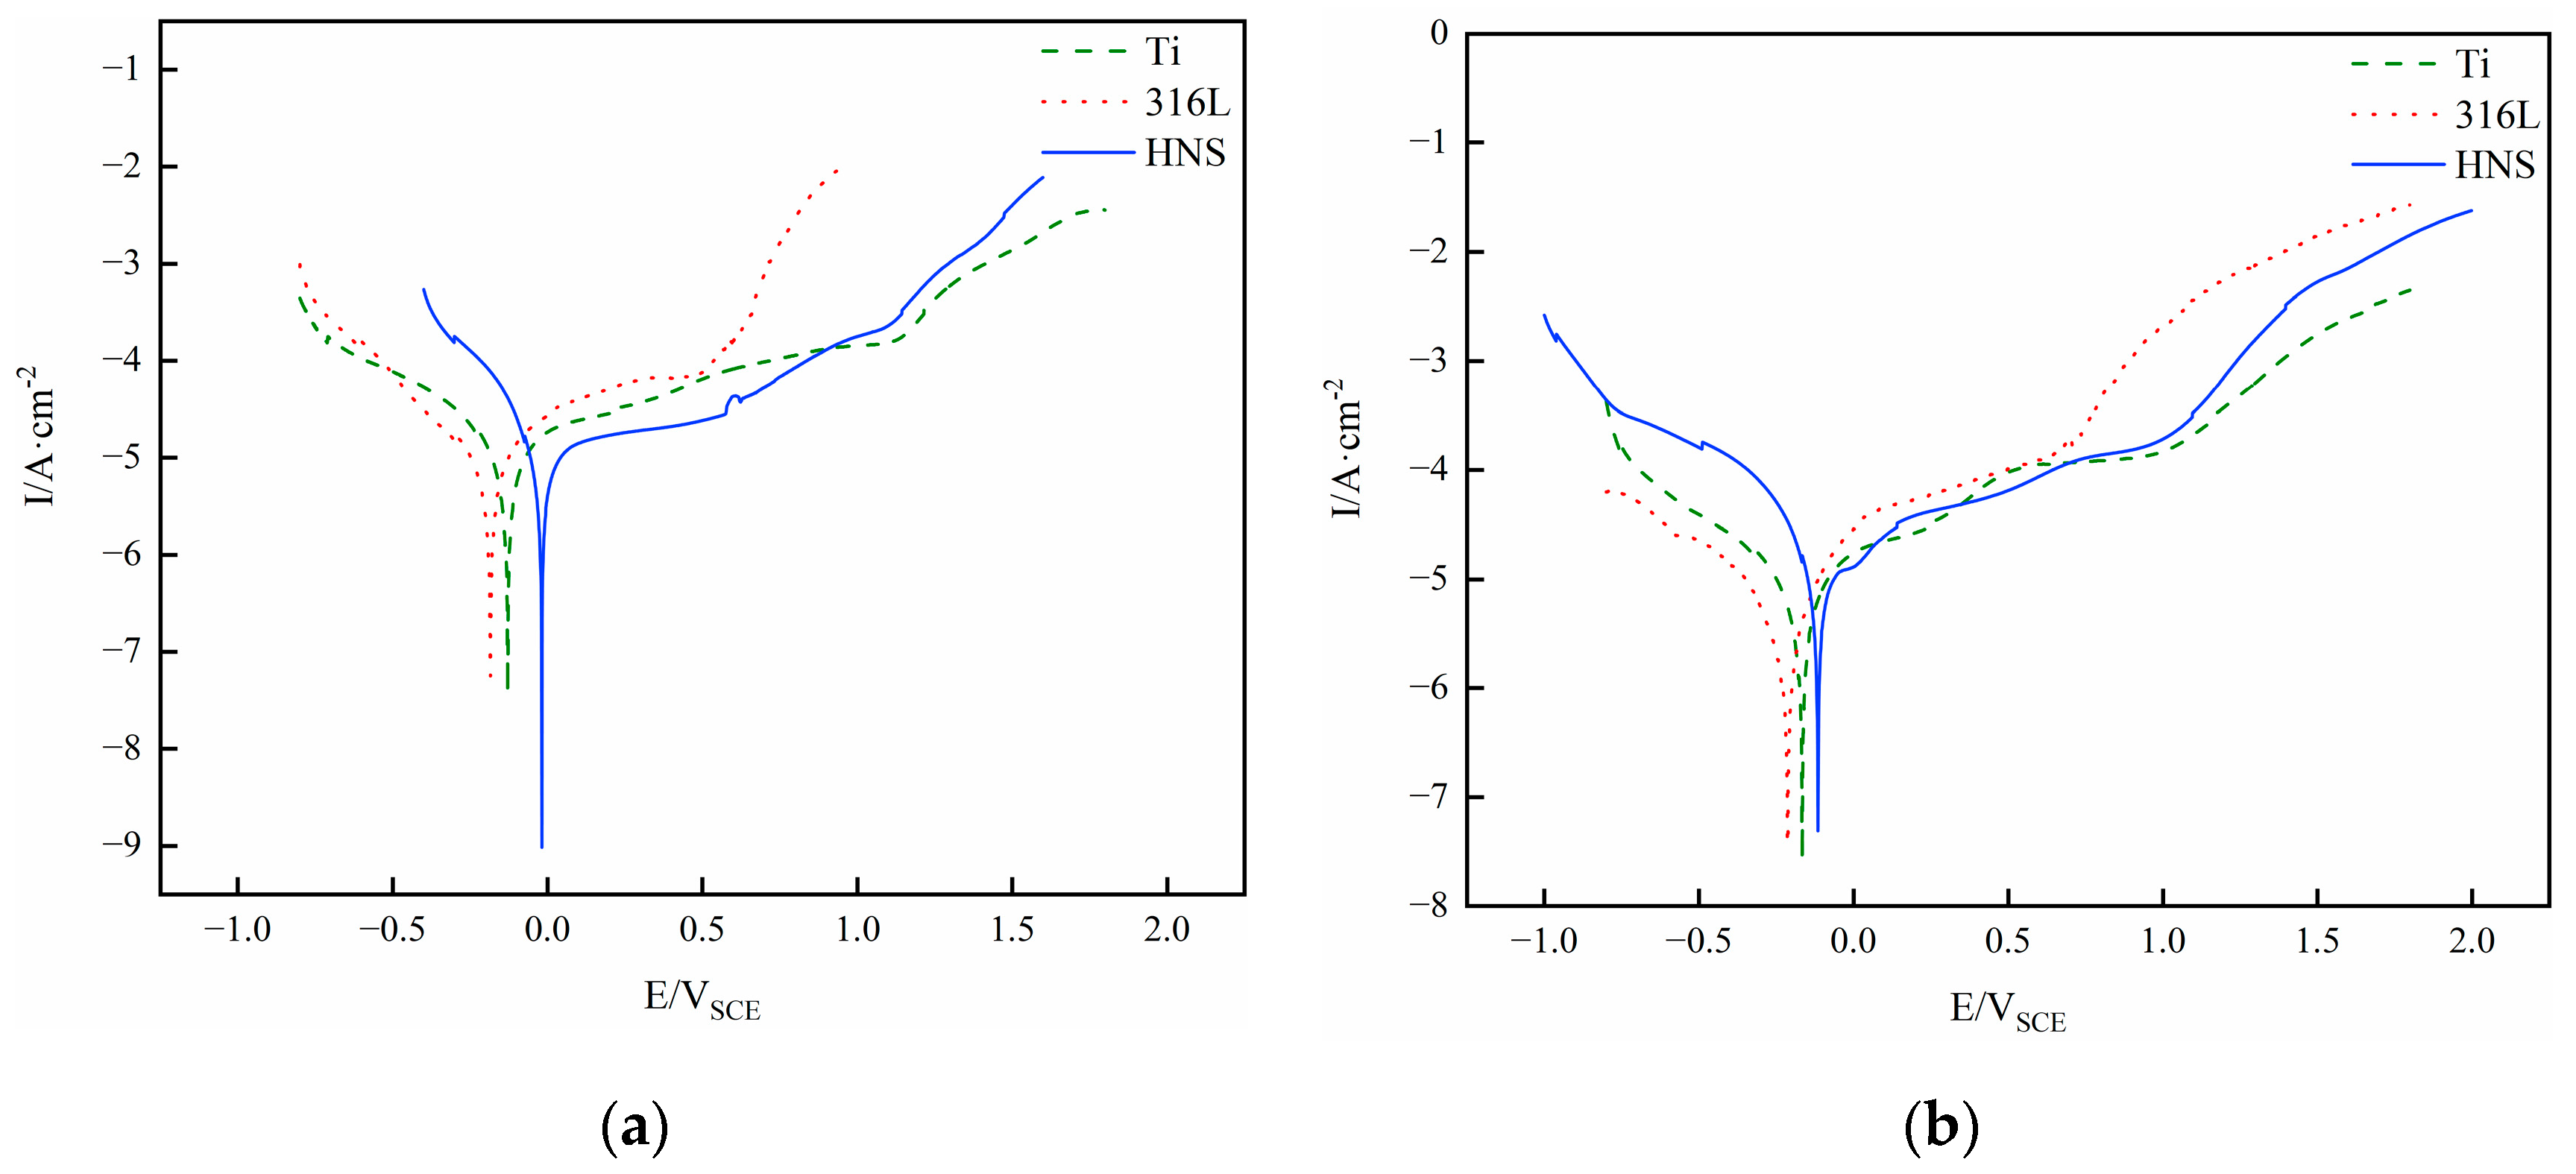
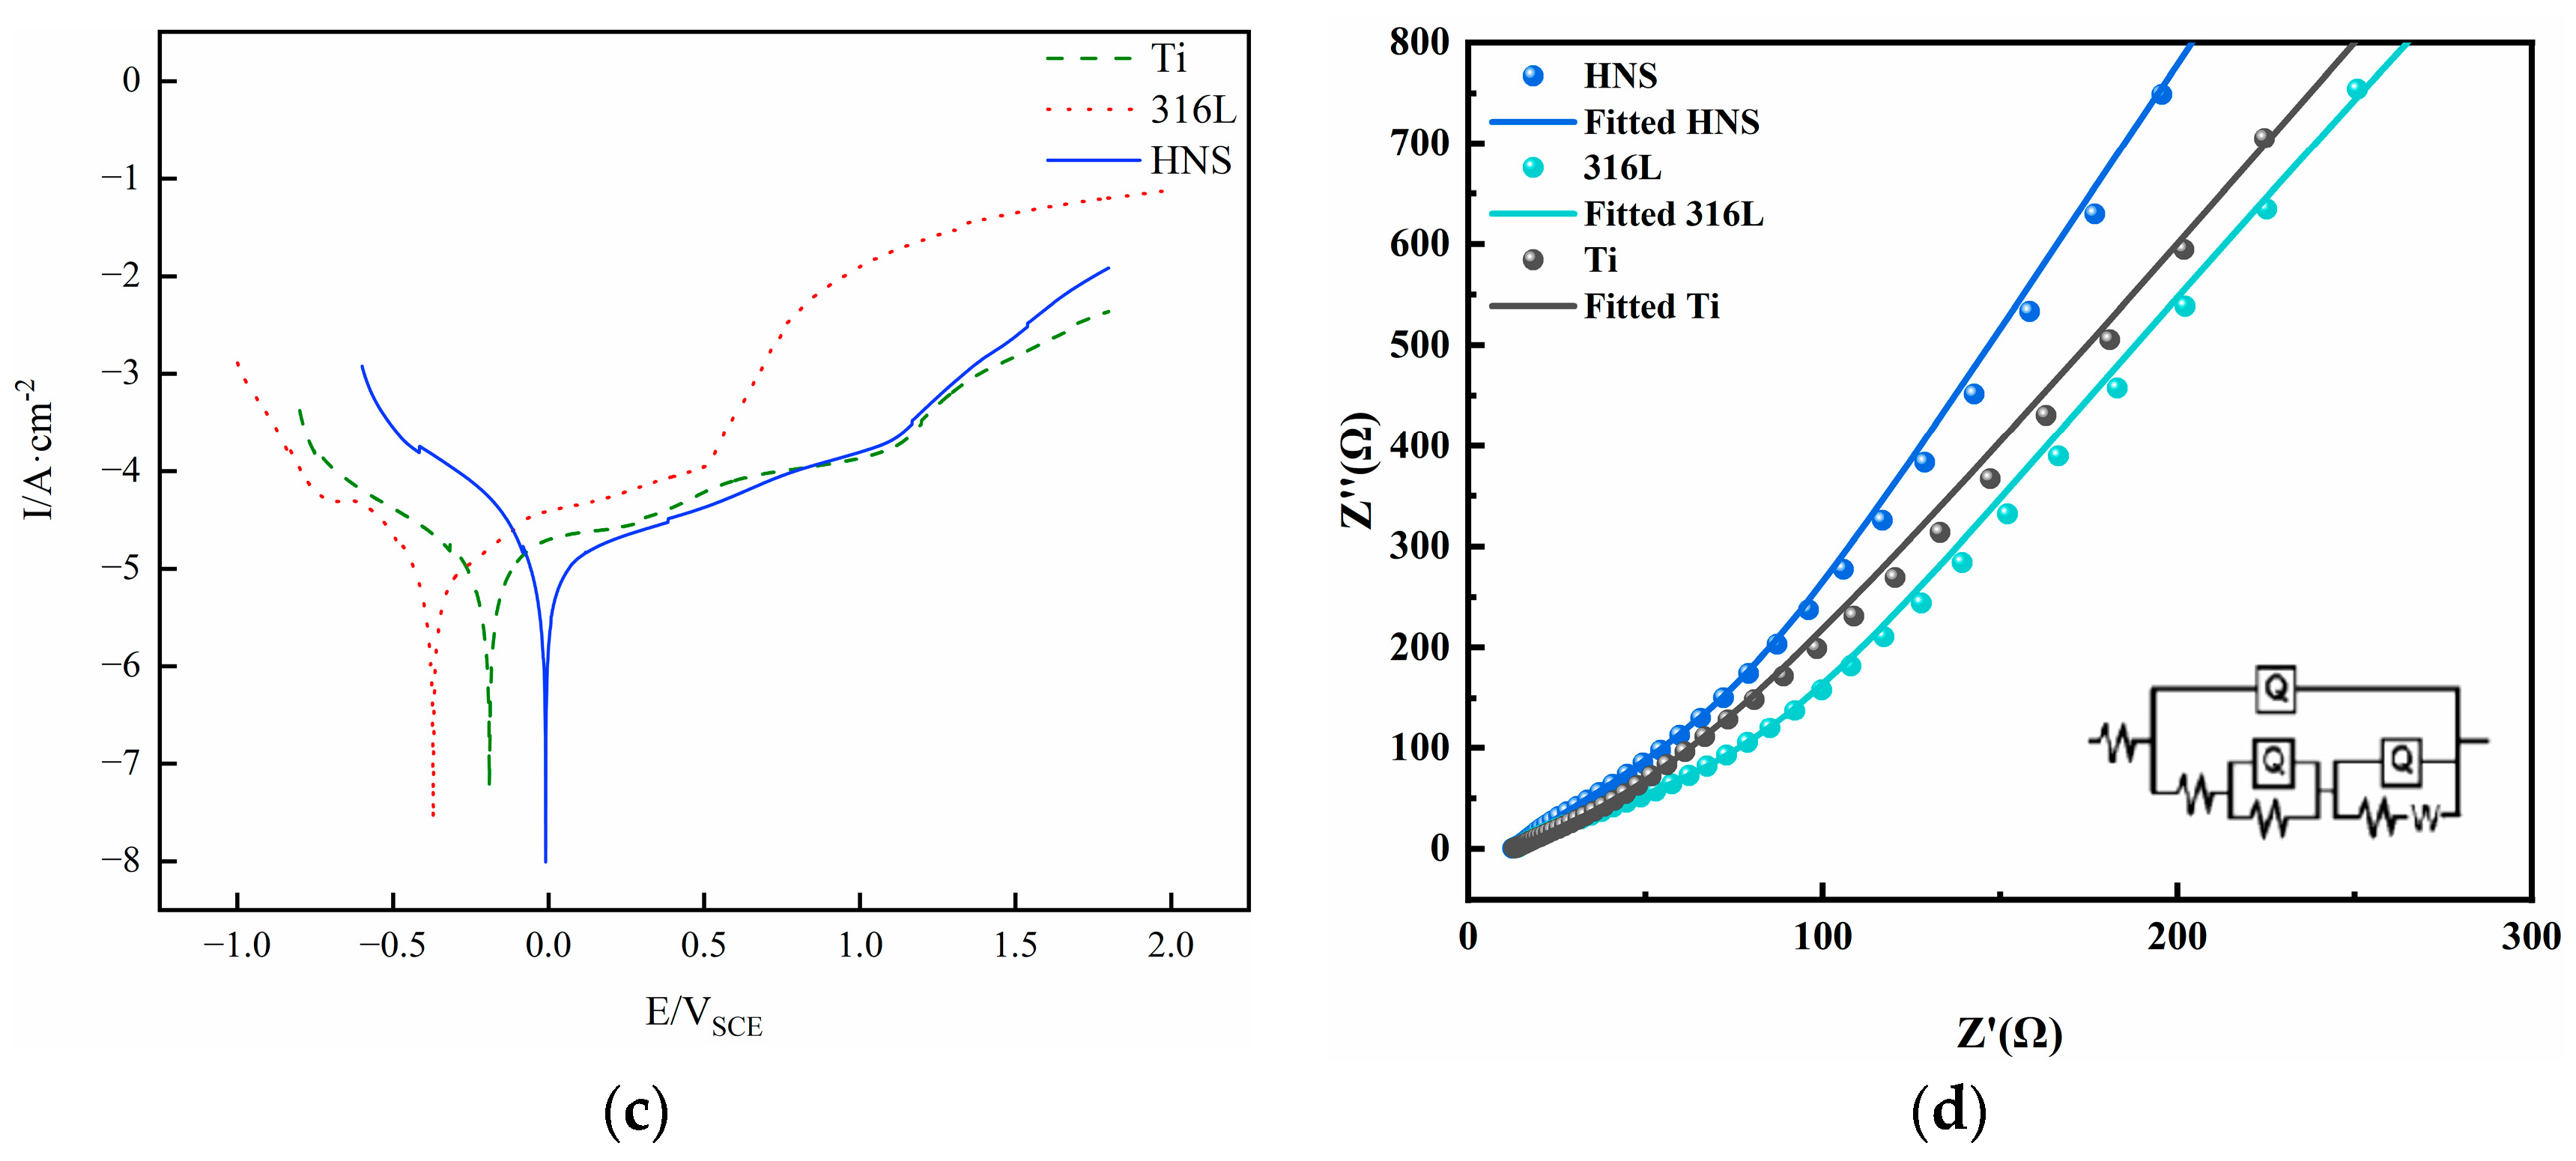
In general, materials with higher relative density tend to exhibit better corrosion resistance [27]. This is because higher density materials can reduce the presence of pores and defects, thereby reducing the likelihood of penetration by corrosive media [28]. Therefore, the sample with the highest density (with a relative density of 98.8%) was selected for corrosion resistance testing (at an energy density of 148.8 J/mm³). Three alloy samples’ anodic polarization curves in 0.9% NaCl solution, simulated plasma, and Hank’s solution are displayed in Figure 12. High-nitrogen steel has the highest open circuit corrosion potential (−0.019 V) and maximum pitting potential (Ep) in a 0.9% NaCl solution (Figure 12a). Furthermore, 316L has the lowest open circuit corrosion potential (−0.185 V) and the lowest pitting potential (0.499 V). High-nitrogen steel has a shorter passivation range than pure titanium and a larger range than 316L. Moreover, the high-nitrogen steel exhibits the lowest corrosion current density, whereas 316L exhibits the greatest corrosion current density. This suggests that steel with a high nitrogen content resists corrosion better in a 0.9% NaCl solution. High-nitrogen steel has a passivation range between pure titanium and 316L, and its corrosion rate is at its lowest. The open circuit corrosion potential of high-nitrogen steel was the highest in Hank’s solution (Figure 12c) and simulated plasma (Figure 12b), with values of −0.115 V and −0.011 V, respectively. The propensity for pitting corrosion was comparable to that of pure titanium. The passivation range is somewhat broader than 316L and slightly narrower than pure titanium. The corrosion current densities of the three samples were comparable in the simulated plasma solution. High-nitrogen steel has the lowest corrosion current density in Hank’s solution, whereas pure Ti has the highest corrosion current density. As a result, Ti corrodes at the highest pace whereas high-nitrogen steel corrodes at the slowest rate. From the impedance curve (Figure 12d), it can be observed that the high-nitrogen steel has the highest slope, followed by Ti, and 316L has the lowest slope. Basically, larger diameters and slope refer to better corrosion resistance [29,30]. This indicates that high-nitrogen steel exhibits the best corrosion resistance.
The above research indicates that high-nitrogen steel demonstrates strong corrosion resistance in all three simulated solutions, with greater corrosion resistance than 316L. The passivation range is shorter than that of Ti, and the corrosion rate is the slowest. This suggests that SLMed high-nitrogen steel is corrosion resistant in complicated human settings.

4. Conclusions

This study used alloy pre-alloyed powders to fabricate high-nitrogen steel through selective laser melting. By controlling the laser power and scanning speed, high-nitrogen steel samples with different energy densities were obtained. The effects of energy density on sample density, nitrogen content, microstructure, mechanical properties, and corrosion resistance in a human environment were tested and analyzed. The specific conclusions are as follows:
  • With increasing energy density, the relative density of high-nitrogen steel first increases and subsequently drops. The best process parameters are 250 W laser power, 700 mm/s scanning speed, with 148.8 J/cm3 energy density. The alloy had the maximum density at this period, reaching 98.8%. The amount of unmelted particles and spheroidized flaws reduces as the energy density increases, increasing the relative density.
  • The high-nitrogen steel has a microstructure that is mostly made up of columnar and cellular crystals. The size of cellular and columnar grains steadily grow as energy density rises.
  • The mechanical characteristics of high-nitrogen steel first rise and then fall as energy density rises. The mechanical characteristics are the highest when the process parameters are 250 W and 700 mm/s, with yield strength, tensile strength, and elongation values reaching 921.9 MPa, 1205.1 MPa, and 27%, respectively.
  • The high-nitrogen steel sample at an energy density of 148.8 J/mm³ has superior corrosion resistance in human simulated liquids when compared to pure titanium and 316L steel. In human simulated liquids (0.9% NaCl solution, simulated plasma, and Hank’s solution), high-nitrogen steel has the highest open circuit corrosion potential and the slowest corrosion rate, and its passivation film stability is slightly worse than pure titanium.

Author Contributions

Conceptualization, D.Z.; methodology, S.W.; formal analysis, X.S.; investigation, J.R.; writing—original draft preparation, X.S.; writing—review and editing, X.X. and J.H.R. All authors have read and agreed to the published version of the manuscript.

Funding

The current work was supported by the Central Guidance on Local Science and Technology Development Fund of Hebei Province (226Z1008G), the National Natural Science Foundation of China (No. 52274336), Research project of basic scientific research expenses of Hebei Province (No. JYG2021004).

Data Availability Statement

No new data were created or analyzed in this study. Data sharing is not applicable to this article.

Conflicts of Interest

The authors declare no conflict of interest.

References

  1. Wang, L.; Li, Y.; Ding, J.; Xie, Q.; Zhang, X.; Wang, K. Problems in Welding of High Nitrogen Steel: A Review. Metals 2022, 12, 1273. [Google Scholar] [CrossRef]
  2. Luo, X.; Lou, J.; He, H.; Wu, C.; Huang, Y.; Su, N.; Li, S. Effects of Carbon Content on the Properties of Novel Nitrogen-Free Austenitic Stainless Steel with High Hardness Prepared via Metal Injection Molding. Metals 2023, 13, 403. [Google Scholar] [CrossRef]
  3. Paton, B.E.; Medovar, B.I.; Saenko, V. Role of Electroslag Technology in Production of Massively Nitrogen-Alloyed Steels [Previously Titled: The Place of Electroslag Technology in Production of Super-High- Nitrogen Steels]. Adv. Spec. Electrometall. 1990, 6, 193–200. [Google Scholar]
  4. Mudali, U.K. High Nitrogen Steels and Stainless Steels: Manufacturing, Properties and Applications; Alpha Science: Rowland Heights, CA, USA, 2004. [Google Scholar]
  5. Yang, D.; Huang, Y.; Fan, J.; Jin, M.; Peng, Y.; Wang, K. Effect of N2 Content in Shielding Gas on Formation Quality and Microstructure of High Nitrogen Austenitic Stainless Steel Fabricated by Wire and Arc Additive Manufacturing. J. Manuf. Process. 2021, 61, 261–269. [Google Scholar] [CrossRef]
  6. Wang, Y.; Wang, Y.; Wang, Z. Enhancing Yield Strength of High Nitrogen Austenitic Stainless Steel. J. Constr. Steel Res. 2021, 187, 106927. [Google Scholar] [CrossRef]
  7. Wang, M.; You, B.; Wu, Y.; Liang, B.; Gao, X.; Li, W.; Wei, Q. Effect of Cr, Mo, and V Elements on the Microstructure and Thermal Fatigue Properties of the Chromium Hot-Work Steels Processed by Selective Laser Melting. Metals 2022, 12, 735. [Google Scholar] [CrossRef]
  8. Fang, X.; Xia, W.; Wei, Q.; Wu, Y.; Lv, W.; Guo, W. Preparation of Cu-Cr-Zr Alloy by Laser Powder Bed Fusion: Parameter Optimization, Microstructure, Mechanical and Thermal Properties for Microelectronic Applications. Metals 2021, 11, 1410. [Google Scholar] [CrossRef]
  9. Frazier, W.E. Metal Additive Manufacturing: A Review. J. Mater. Eng. Perform. 2014, 23, 1917–1928. [Google Scholar] [CrossRef]
  10. Murr, L.E.; Martinez, E.; Amato, K.N.; Gaytan, S.M.; Hernandez, J.; Ramirez, D.A.; Shindo, P.W.; Medina, F.; Wicker, R.B. Fabrication of Metal and Alloy Components by Additive Manufacturing: Examples of 3D Materials Science. J. Mater. Res. Technol. 2012, 1, 42–54. [Google Scholar] [CrossRef] [Green Version]
  11. The High Temperature Flow Behavior of Additively Manufactured Inconel 625 Superalloy—IOPscience. Available online: https://iopscience.iop.org/article/10.1088/2053-1591/ab44f6/meta (accessed on 2 July 2023).
  12. Ahmadi, M.; Tabary, S.A.A.B.; Rahmatabadi, D.; Ebrahimi, M.S.; Abrinia, K.; Hashemi, R. Review of Selective Laser Melting of Magnesium Alloys: Advantages, Microstructure and Mechanical Characterizations, Defects, Challenges, and Applications. J. Mater. Res. Technol. 2022, 19, 1537–1562. [Google Scholar] [CrossRef]
  13. Azami, M.; Siahsarani, A.; Hadian, A.; Kazemi, Z.; Rahmatabadi, D.; Kashani-Bozorg, S.F.; Abrinia, K. Laser Powder Bed Fusion of Alumina/Fe–Ni Ceramic Matrix Particulate Composites Impregnated with a Polymeric Resin. J. Mater. Res. Technol. 2023, 24, 3133–3144. [Google Scholar] [CrossRef]
  14. Wu, T.; Liu, J.; Wang, K.; Wang, L.; Zhang, X. Microstructure and Mechanical Properties of Wire-Powder Hybrid Additive Manufacturing for High Nitrogen Steel. J. Manuf. Process. 2021, 70, 248–258. [Google Scholar] [CrossRef]
  15. Yang, Y.; Chen, Z.; Liu, Z.; Wang, H.; Zhang, Y.; Wang, D. Influence of Shielding Gas Flow Consistency on Parts Quality Consistency during Large-Scale Laser Powder Bed Fusion. Opt. Laser Technol. 2023, 158, 108899. [Google Scholar] [CrossRef]
  16. Sun, X.; Ren, J.; Wang, Y.; Zhao, D.; Wang, S.; Xiong, X.; Rao, J.H. Nitriding Behaviour and Microstructure of High-Nitrogen Stainless Steel during Selective Laser Melting. Materials 2023, 16, 2505. [Google Scholar] [CrossRef]
  17. Lü, Y.; Tao, L.; Jie, L.; Kehong, W. Microstructure and Mechanical Properties of High-Nitrogen Stainless Steel Manufactured by Selective Laser Melting. Chin. J. Lasers 2022, 49, 2202021. [Google Scholar] [CrossRef]
  18. Sun, X.; Ren, J.; Wang, S.; Zhao, D. Effect of Powder Formulation and Energy Density on the Nitrogen Content, Microstructure, and Mechanical Properties of SLMed High-Nitrogen Steel. Processes 2023, 11, 1937. [Google Scholar] [CrossRef]
  19. Cepeda-Jiménez, C.M.; Potenza, F.; Magalini, E.; Luchin, V.; Molinari, A.; Pérez-Prado, M.T. Effect of Energy Density on the Microstructure and Texture Evolution of Ti-6Al-4V Manufactured by Laser Powder Bed Fusion. Mater. Charact. 2020, 163, 110238. [Google Scholar] [CrossRef]
  20. Schwanekamp, T.; Müller, A.; Reuber, M.; Gobran, H.; Gdoura, N.; von Cetto, S. Investigations on Laser Powder Bed Fusion of Tungsten Heavy Alloys. Int. J. Refract. Met. Hard Mater. 2022, 109, 105959. [Google Scholar] [CrossRef]
  21. Wang, D.; Wu, S.; Fu, F.; Mai, S.; Yang, Y.; Liu, Y.; Song, C. Mechanisms and Characteristics of Spatter Generation in SLM Processing and Its Effect on the Properties. Mater. Des. 2017, 117, 121–130. [Google Scholar] [CrossRef]
  22. Svyazhin, A.; Kaputkina, L.; Smarygina, I.; Kaputkin, D. Nitrogen Steels and High-Nitrogen Steels: Industrial Technologies and Properties. Steel Res. Int. 2022, 93, 2200160. [Google Scholar] [CrossRef]
  23. Simmons, J.W. Overview: High-Nitrogen Alloying of Stainless Steels. Mater. Sci. Eng. A 1996, 207, 159–169. [Google Scholar] [CrossRef]
  24. Luo, X.; Yang, C.; Fu, Z.Q.; Liu, L.H.; Lu, H.Z.; Ma, H.W.; Wang, Z.; Li, D.D.; Zhang, L.C.; Li, Y.Y. Achieving Ultrahigh-Strength in Beta-Type Titanium Alloy by Controlling the Melt Pool Mode in Selective Laser Melting. Mater. Sci. Eng. A 2021, 823, 141731. [Google Scholar] [CrossRef]
  25. Shifeng, W.; Shuai, L.; Qingsong, W.; Yan, C.; Sheng, Z.; Yusheng, S. Effect of Molten Pool Boundaries on the Mechanical Properties of Selective Laser Melting Parts. J. Mater. Process. Technol. 2014, 214, 2660–2667. [Google Scholar] [CrossRef]
  26. Chen, J.; Xiao, X.; Yuan, D.; Guo, C.; Huang, H.; Yang, B. Microstructure and Properties of Cu-Cr-Zr Alloy with Columnar Crystal Structure Processed by Upward Continuous Casting. J. Alloys Compd. 2021, 889, 161700. [Google Scholar] [CrossRef]
  27. Nyby, C.; Guo, X.; Saal, J.E.; Chien, S.-C.; Gerard, A.Y.; Ke, H.; Li, T.; Lu, P.; Oberdorfer, C.; Sahu, S.; et al. Electrochemical Metrics for Corrosion Resistant Alloys. Sci. Data 2021, 8, 58. [Google Scholar] [CrossRef]
  28. Effect of Relative Density on Microstructure, Corrosion Resistance and Mechanical Performance of Porous Ti–20Zr Alloys Fabricated by Powder Metallurgy|SpringerLink. Available online: https://link.springer.com/article/10.1007/s13369-023-07889-4 (accessed on 2 July 2023).
  29. Liao, L.; Wan, Q.; Wang, H.; Yang, B.; Mei, Q. Irradiation Enhanced Corrosion Resistance of CrN/TiSiN Multilayers Synthesized by Cathodic Arc Ion Plating. Mater. Today Commun. 2023, 35, 106155. [Google Scholar] [CrossRef]
  30. Liu, C.; Bi, Q.; Leyland, A.; Matthews, A. An Electrochemical Impedance Spectroscopy Study of the Corrosion Behaviour of PVD Coated Steels in 0.5 N NaCl Aqueous Solution: Part II.: EIS Interpretation of Corrosion Behaviour. Corros. Sci. 2003, 45, 1257–1273. [Google Scholar] [CrossRef]
Figure 1. Morphology of (a) the original powders, (b) Cr2N powder, and (c) the mixed powder.
Metals 13 01242 g001
Figure 2. Samples: (a) The SLMed samples and (b) the dimensions of tensile specimen.
Metals 13 01242 g002
Figure 3. The change of relative density for the SLMed specimens with energy density.
Metals 13 01242 g003
Figure 4. Defects of the SLMed samples under different energy density: (a) 83.3 J/mm3 (1000 mm/s, 200 W); (b) 93.8 J/mm3 (1000 mm/s, 225 W); (c) 104.2 J/mm3 (800 mm/s, 200 W); (d) 119.1 J/mm3 (700 mm/s, 200 W); (e) 125 J/mm3 (1000 mm/s, 300 W); (f) 130.2 J/mm3 (800 mm/s, 250 W); (g) 148.8 J/mm3 (700 mm/s, 250 W); (h) 162 J/mm3 (900 mm/s, 350 W) and (i) 182.3 J/mm3 (800 mm/s, 350 W).
Metals 13 01242 g004
Figure 5. Lack of fusion in the SLMed samples under different energy density (ac) 93.8 J/mm3; (df) 130.2 J/mm3; and (gi) 182.3 J/mm3.
Metals 13 01242 g005
Figure 6. Nitrogen content and nitrogen loss rate of the SLMed samples with different energy densities.
Metals 13 01242 g006
Figure 7. Phase composition of SLM samples under different energy densities: (a) the result of XRD analysis; (b) the Phase Diagram of Fe-N; (cf) EBSD analysis showing phase composition: (c) 104.2 J/mm3 (800 mm/s, 200 W); (d) 130.2 J/mm3 (800 mm/s, 250 W); (e) 148.8 J/mm3 (700 mm/s, 250 W); (f) 182.3 J/mm3 (800 mm/s, 350 W). The red area represents bcc, and the green area represents fcc.
Metals 13 01242 g007
Figure 8. Microstructure of the SLMed samples under different energy density (a) 104.2 J/mm3; (b) 119.1 J/mm3; (c) 130.2 J/mm3; (d) 148.8 J/mm3; (e) 156.3 J/mm3; and (f) 182.3 J/mm3.
Metals 13 01242 g008
Figure 9. Molten pool morphology of the SLMed samples with different energy densities (ac) 104.2 J/mm3 and (df)156.3 J/mm3.
Metals 13 01242 g009
Figure 10. Mechanical properties of the SLMed samples under different energy densities (a) typical tensile curves and (b) the corresponding yield strength and tensile strength.
Metals 13 01242 g010
Figure 11. Fracture morphology of the SLMed samples with different energy densities (ac) 83.3 J/mm3; (df) 148.8 J/mm3; (gi) 182.3 J/mm3.
Metals 13 01242 g011
Figure 12. Anodic polarization curves of different alloy samples in (a) 0.9% NaCl solution, (b) simulated plasma, and (c) Hank’s solution and (d) Impedance curve in 0.9% NaCl.
Metals 13 01242 g012aMetals 13 01242 g012b
Table 1. Chemical composition of the original powders and mixed powders (wt.%).
ElementCrNMnMoCFe
Original powders18.290.2911.813.210.04Bal
Mixed powders21.121.0111.223.040.04Bal
Table 2. Properties of the original powders and mixed powders.
PowdersSize
(μm)
Fluidity
(s/50 g)
Apparent Density (g/cm3)Tap Density (g/cm3)
Original powder15–5321.114.244.56
Mixed powder15–5329.914.164.37
Table 3. Process parameters of the SLMed samples.
NumberLaser Power
(W)
Scanning Speed
(mm/s)
Energy Density (J/mm3)
1200100083.3
2225100093.8
3200800104.2
4250900115.7
5200700119.1
63001000125.0
7250800130.2
8300900138.9
9250700148.8
10300800156.3
11350900162.0
12300700178.6
13350800182.3
Table 4. Composition of the simulated body fluid components (g/L).
Solute0.9% NaCl SolutionSimulated PlasmaHank’s Solution
NaCl0.906.808.00
KCl-0.400.40
CaCl2-0.200.14
NaHCO3-2.200.35
Mg4SO·7H2O-0.200.06
Na2HPO4-0.13-
Na2HPO4·2H2O-0.03-
MgCl2·6H2O--0.10
Na2HPO4·12H2O--0.06
KH2PO4--0.06
D-glucose--1.00
Disclaimer/Publisher’s Note: The statements, opinions and data contained in all publications are solely those of the individual author(s) and contributor(s) and not of MDPI and/or the editor(s). MDPI and/or the editor(s) disclaim responsibility for any injury to people or property resulting from any ideas, methods, instructions or products referred to in the content.