Abstract
A new prediction method was proposed based on the positive feedback relationship between tool geometry and tool wear rate. Dry orthogonal cutting of Inconel 718 was used as a case study. Firstly, tool wear rate models and a tool wear prediction flowchart were proposed. Secondly, the evolution of the tool geometry during tool wear was analyzed considering the combined effect of tool crater wear and tool flank wear. Thirdly, the evolution of the cutting temperature, normal stress and tool–chip relative sliding velocity on the tool wear surface was studied, the evolution of the tool wear rate during tool wear was revealed. Finally, the evolution of the tool geometry and tool wear rate during tool wear were applied to the tool wear prediction method to accurately predict the tool wear. The prediction error of KT is less than 15% in comparison with the experimental results. The tool wear prediction method in this paper is helpful to improve the prediction accuracy of tool crater wear.
1. Introduction
Tool wear is serious in the machining process. If the tool is not replaced in time during the machining process, serious tool wear will deteriorate the surface quality of the workpiece. However, replacing the tool too early will cause the tool failure to give full play to the machining performance, leading to an increase in machining cost. Therefore, it is necessary to accurately predict the tool wear and tool life in the machining process to ensure the quality of the workpiece and reduce the machining cost.
Since Taylor [] developed the empirical wear life equation in 1906, there have been a variety of attempts to develop unified wear models which can accurately predict tool wear. A large number of experiments are needed to establish an empirical model of tool wear rate, and it is not universal. Tool wear is the result of multiple mechanisms, such as adhesion and diffusion. The change in cutting parameters changes the temperature field and stress field of the tool–workpiece contact zone, affects the degree of adhesion and diffusion, and indirectly changes the tool wear rate. A universal tool wear rate model can be developed by revealing the relationship between tool wear rate and cutting temperature, stress and relative sliding speed. Li [] designed polycrystalline cubic boron nitride (PCBN) tools embedded with thin film thermocouples to test the relationship between cutting temperature and tool wear. The results have shown that the increase in the cutting temperature can reflect the progress of flank wear. Sharma [] observed from the CRITIC method that a strong correlation exists between the output response tool flank wear width VB and the cutting temperature. Thangarasu [] has found that when the tool wear increased, the tool–workpiece contact was increased, which increased the cutting force. Therefore, the tool wear increases with the increase in the load. The tool wear behavior of PCD and PCBN tools in high speed turning equi-atomic NiTi shape memory alloys was studied by Kay’s experiments []. The cutting speeds were 70 m/min, 130 m/min, 190 m/min and 250 m/min. The experimental results have shown that the tool wear caused by the adhesive Is sensitive to the cutting speed. Olander [] has found that higher cutting speeds result in crater wear of the rake face.
A variety of tool wear rate models have been proposed based on different tool wear mechanisms. Archard [] proposed basic wear models based on the adhesion wear between the friction pairs. Usui [] introduced the influence of diffusion in adhesion wear models. The tool wear rate models were revised several times in subsequent studies. Amir [] considered tool flank wear to be independent of normal stress, the effect of normal stress was ignored in the revised Usui tool wear rate model. Lung [] revised the Usui tool wear rate model to relate to shear stress considering the high stress in metal cutting. Haddag [] revised the Usui tool wear rate model for usage in a finite element simulation. The tool wear rate model established the relationship between tool wear rate and state variables (cutting temperature T, normal stress and relative sliding velocity ). The tool wear rate model is the basis of tool wear prediction.
In the cutting process, tool wear usually occurs on the tool rake face and tool flank face. The tool rake wear is crater-shaped, and the tool flank wear usually keep flat, as shown in Figure 1. The tool crater wear depth KT and the tool flank wear width VB is usually used as a standard to measure the degree of tool wear. The tool wear rate model is usually transformed into the change rate of the tool crater wear depth KT or tool flank wear width VB to realize the prediction of tool wear.
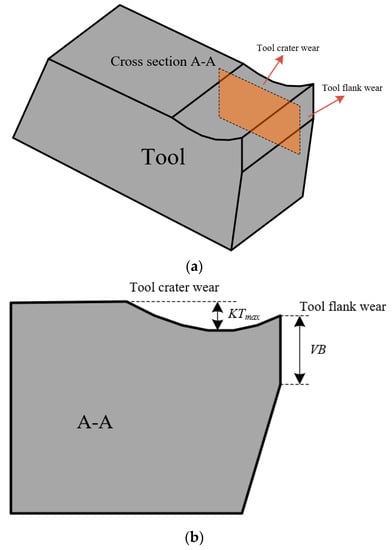
Figure 1.
Tool crater wear and tool flank wear. (a) Geometry of the worn tool; (b) cross section of the worn tool.
The evolution process of tool flank wear is simpler than the tool crater wear, so the prediction of tool flank wear is the most common. Matsumura [] and Zhao [] analyzed the geometry evolution of tool flank wear. A theoretical model of tool flank wear rate for orthogonal cutting was proposed based on the Usui tool wear rate model, and the theoretical prediction of tool flank wear was realized. Sugar [] compared the tool flank wear rate model proposed by Matsumura and Zhao, and the result shows that Zhao’s model has a lower prediction error. Elias [] believes that the angle between the flank wear surface and the cutting speed (tool flank rolling angle) affects the prediction accuracy of the tool flank wear. The tool flank rolling angle was introduced to optimize Matsumura’s model. Amir et al. [] have also found the existence of the tool flank rolling angle via experimental results of machining Inconel 718. Nooraie [] found that the tool flank rolling decreases with the increase in cutting time, and the evolution of the tool flank rolling angle was introduced in the tool flank wear prediction. Huang [] analyzed the evolution of the three-dimensional geometry at the tool tip during the tool wear process. A prediction model of the tool flank wear rate was established considering the influence of the tool tip radius, and the prediction of the tool flank wear was extended to three dimensions. Yue [] developed a tool flank wear prediction model based on three main mechanisms: abrasive wear, adhesive wear and diffusive wear. A normal stress model and a temperature field model of the tool flank wear surface were established, and these two models were incorporated in the tool flank wear model to obtain the tool flank wear rate.
The prediction of the tool crater wear Is less due to the evolution of the tool crater wear geometry being more complex. In the prediction of tool crater wear, the crater profile is usually simplified. For instance, Huang [] and Zhuang [] simplified the tool crater wear profile as an arc, and the tool–chip contact length was assumed unchanged as the tool wear progresses under the same cutting conditions. Olortegui-Yume [] discretized the tool crater wear profile into multiple micro-elements. Mishra [] considered the effect of crater wear geometry on the variation of local state variables such as normal stress. Experimentally determined crater profiles at progressive wear stages were geometrically replicated on the cutting tool models and used for FEM analysis. The prediction of tool crater wear has been achieved by combining the evolution of the tool geometry and the tool wear rate basic model.
However, the existing research only focuses on the tool crater wear or tool flank wear, ignoring the interaction between the two, which deteriorates the prediction accuracy of tool wear. Hence, it is necessary to analysis the interaction between the tool crater wear and tool flank wear. Dry orthogonal cutting of Inconel 718 is used as a case study in this paper. The tool wear rate model was developed by analyzing the node motion on the tool wear surface. Considering the interaction between the tool crater wear and tool flank wear, the evolution of the tool geometry during tool wear is studied, and the evolution of the tool wear rate during tool wear is revealed by analyzing the evolution of the cutting temperature, stress and tool–chip relative sliding speed, which is applied to the prediction of tool wear. An accurate prediction of tool wear is achieved.
2. Tool Wear Rate and Tool Wear Prediction Method
2.1. Tool Wear Rate
According to the results reported by Kursuncu [] and Banda [], adhesion and diffuse wear mechanisms were found to be the main wear mechanisms during the machining of Inconel 718 in TiAlN-coated carbide tools. The Usui model was used to calculate the tool nodal wear rate. The nodes are the projection points of a straight line perpendicular to the relative sliding velocity direction of the tool–chip (tool–workpiece) on the tool wear surface, as shown in Figure 2. The movement direction of the node is perpendicular to the wear surface. On the tool wear surface, the motion length of the node per unit time was defined as the nodal wear rate , which was represented by the Usui tool wear rate model, as shown in Equation (1).
where is the normal stress, is the relative sliding velocity between tool and workpiece, and T is the cutting temperature. A and B are constants determined by the combination of the tool–workpiece contact pairs.
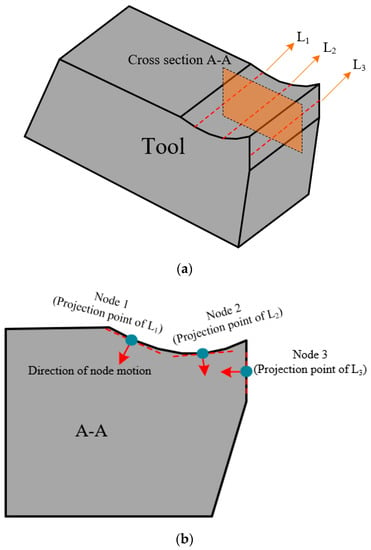
Figure 2.
Schematic diagram of tool wear surface node and node movement. (a) Tool wear surface node; (b) node movement.
By analyzing the node motion on the tool wear surface, the relationship between the nodal wear rate and the evolution of the tool geometry is established. The tool wear rate models of rake face and flank face were established.
- (1)
- Tool crater wear rate model
The crater wear occurs on the tool rake face. The nodal wear rate of each node on the wear surface is different, and the motion of each node needs to be analyzed separately. In this paper, the motion direction of the rake face node was simplified to be perpendicular to the initial rake face, as shown in Figure 3.
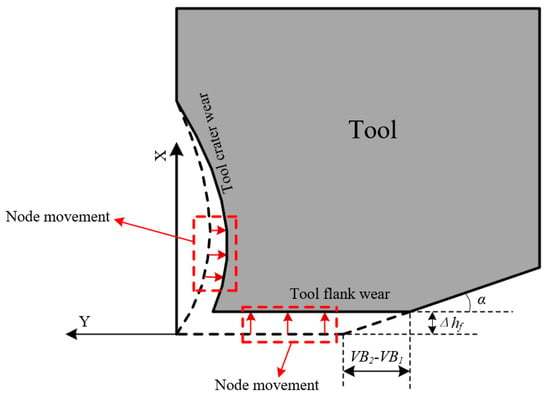
Figure 3.
Node movement on tool rake face and tool flank face.
In Figure 3, the dotted line is the tool wear profile at cutting time , and the solid line is the wear shape at cutting time . The coordinate system X-Y was established with the tool tip at cutting time as the origin, and the X-axis direction was parallel to the tool initial rake face. In coordinate system X-Y, the tool crater wear rate at cutting time can be expressed as the function shown in Equation (2).
In Equation (2), x is the abscissa of the nodes on the tool crater wear surface in the X-Y coordinate system. is the nodal wear rate of the tool crater wear surface., and are normal stress, tool–chip relative sliding velocity and cutting temperature on the tool crater wear surface. The tool crater wear rate can be calculated via Equation (2).
- (2)
- Tool flank wear rate model
In general, the tool flank wear face is flat. It can be assumed that the nodal wear rate of the tool flank wear surface only has an equal distribution state based on the wear morphology of the tool flank face. If the nodal wear rate is not equal, the tool flank wear surface cannot remain flat, as shown in Figure 4.
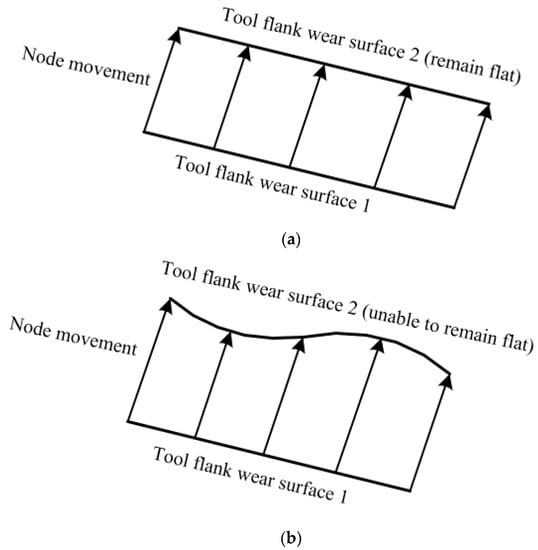
Figure 4.
Distribution of the tool nodal wear rate of tool flank wear surface: (a) equal distribution; (b) uneven distribution.
Based on the nodal wear rate distribution on the tool flank wear surface, it was obtained that each node on the tool flank surface moves the same length in the direction perpendicular to the tool flank wear surface during the cutting time to (Figure 3). In the process of cutting time to , the moving length of the flank node is , and the tool flank wear width increased , according to the geometric relationship shown in Figure 3. The geometric relationship between the tool flank wear width increment and the node moving length was obtained, as shown in Equation (3).
where is the tool relief angle, is the tool flank rolling angle at cutting time , and tool flank rolling angle means the angle between the tool flank wear surface and cutting speed, as shown in Figure 5. The tool flank wear rate model was obtained via the differential operation of Equation (3).
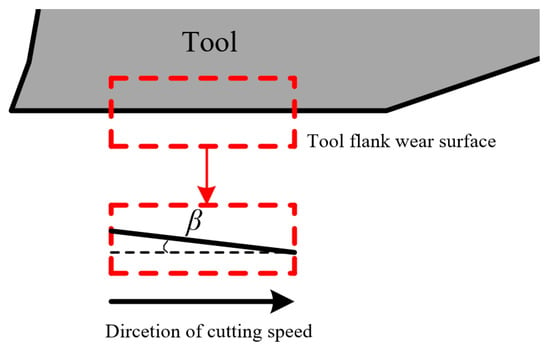
Figure 5.
Tool flank rolling angle.
In Equation (4), is the nodal wear rate of the tool crater wear surface, is the average normal stress on tool flank wear surface, is the cutting speed, and is the average cutting temperature on the tool flank wear surface. The average normal stress of the flank wear surface and the average cutting temperature are used to calculate the flank node wear rate.
2.2. Tool Wear Prediction
Tool wear is a real-time evolution process. In the process of tool wear, the tool geometry is constantly updated, and the temperature field and stress field of the tool wear surface are constantly changed. The temperature field and stress field determine the tool wear rate and further determine the tool geometry. Therefore, a positive feedback relationship exists between the tool geometry and the predicted tool wear rate. Figure 6 describes the positive feedback relationship.
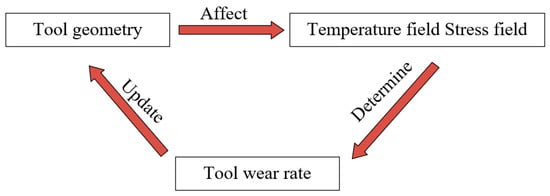
Figure 6.
Positive feedback relationship between the predicted tool wear rate and tool geometry.
A new tool wear prediction method was proposed by using the positive feedback relationship between the tool geometry and tool wear rate. Taking the process of tool flank wear width from to in Figure 3 as an example, the process is shown in Figure 7.
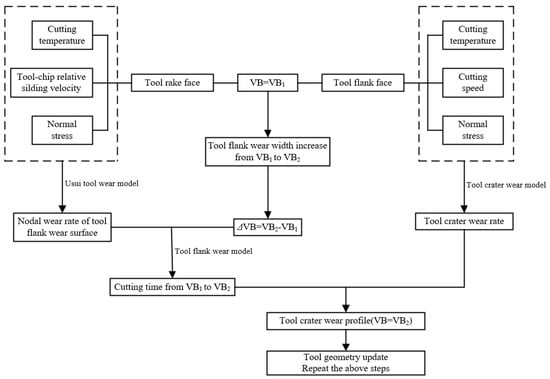
Figure 7.
Flow chart of tool wear prediction method.
Firstly, the distributions of the cutting temperature, normal stress and tool–chip relative sliding velocity on the tool crater wear surface and tool flank wear surface were solved through theoretical modeling when VB = VB1. The tool crater wear rate was calculated via Equation (2), and the nodal wear rate of tool flank wear surface () was calculated via the Usui tool wear rate model. Secondly, the cutting time () of tool flank wear width increasing from VB1 to VB2 was calculated via Equation (5).
Finally, the tool crater wear profile when VB = VB2 was obtained, and the tool geometry was updated. The tool crater wear rate and tool flank wear rate can also be solved when VB = VB2, and the steps in Figure 7 can be repeated to calculate the time required to reach the next wear state. Then, the tool wear profile of the next wear state can be obtained.
The tool wear prediction method can be extended to the whole tool wear process, as shown in Figure 8. The tool wear process can be divided into several tool wear stages: taking the fresh tool as the initial state (the fresh tool can be regarded as a special worn tool with VB = 0), the tool wear geometry of the first wear state can be obtained by using the flowchart shown in Figure 7, and the tool wear profiles at different wear state can be further obtained via stepwise iteration of the flowchart shown in Figure 7 until the tool reaches blunting standards. Finally, the tool wear prediction can be achieved.

Figure 8.
Tool wear prediction of the whole tool wear process.
3. Evolution of Tool Geometry during Tool Wear Progress
3.1. Evolution of Tool Tip Position
It is observed in Figure 3 that the tool tip position constantly changes during tool wear. The change in the tool tip position affects the tool–chip contact behavior; therefore, the influence of tool tip position change cannot be ignored in the tool wear prediction. The tool flank wear caused the tool tip moving up in the X-axis direction. When the cutting time is , the nodes less than from the tool tip on the tool crater wear surface can be regarded as the part removed by the tool flank wear, as shown in Figure 9.
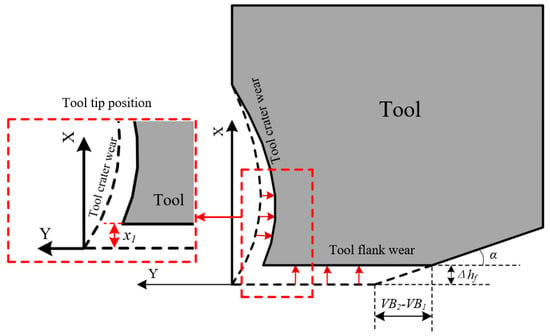
Figure 9.
Evolution of tool tip position.
can be expressed as:
Considering the change in the tool tip position, the evolution of the tool crater wear between cutting time and can be expressed as:
where KT1 and KT2 are the tool crater wear depth at cutting time and . is the length of tool–chip contact zone.
3.2. Tool Rake Angle
In the tool wear process, the tool rake angle increases with the deepening of the tool crater wear. The tool rake angle of worn tool is shown in Figure 10, and the tool rake angle of worn tool can be expressed as Equation (8).
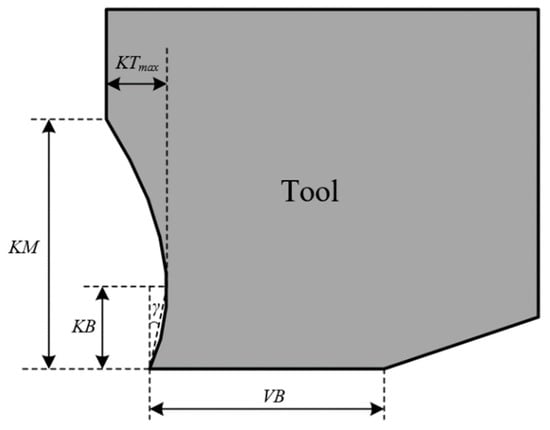
Figure 10.
The rake angle of the worn tool.
3.3. Tool Flank Rolling Angle
The tool flank rolling angle is the angle between the tool flank wear surface and the cutting speed, as shown in Figure 5. Malakizadi et al. [] found the existence of the tool flank rolling angle in the experimental results of machining Inconel 718. Nooraie [] found the tool flank rolling decreases with the increase in cutting time. At present, there is a lack of a prediction model for the tool flank rolling angle. In this paper, the tool flank rolling angle was measured by conducting an orthogonal cutting experiment.
4. Evolution of Tool Wear Rate
By analyzing the distribution of the cutting temperature, normal stress and tool–chip relative sliding velocity on the tool wear surface, the distribution of the nodal wear rate on the tool wear surface was obtained, and the evolution of the tool wear rate during the machining process was revealed.
4.1. Normal Stress Distribution on Tool Wear Surface
- (1)
- Normal stress distribution on the tool crater wear surface
The distribution of normal stress and shear stress on the tool crater wear surface is shown in Figure 11 as Zorev’s model []. In Figure 11, is the length of tool–chip contact zone, and is the length of the sticking zone on the tool crater wear surface.
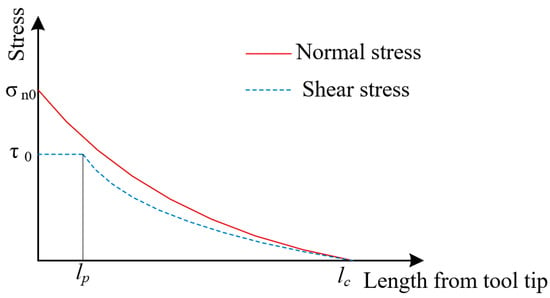
Figure 11.
Distribution of normal stress and shear stress on tool crater wear surface.
The Zorev [] model shows that the normal stress is exponentially distributed on the tool rake face:
In Equation (9), x is the abscissa of the nodes on the tool crater wear surface in the X-Y coordinate system, is normal stress at the tool tip, and is a constant.
The tool–chip contact zone can be divided into two parts: sticking zone and tool–chip relative sliding zone. The friction behavior of sticking zone is different from tool–chip relative sliding zone, and the shear stress has different distribution in sticking zone and tool–chip relative sliding zone. The tool–chip friction behavior does not follow the Coulomb friction law in the sticking zone, and the shear stress is always equal to the shear flow stress k at the primary shear band. The shear stress of the tool–chip relative sliding zone can be directly calculated via the Coulomb friction law. In addition, the distribution of shear stress on tool–chip contact zone can be expressed as:
where is the tool–chip friction coefficient. In order to obtain the distribution of normal stress on the tool crater wear surface, and need to be further calculated. Constant can be calculated by combining Equations (11) and (12) [].
In Equations (13) and (14), Φ is the shear angle, is the friction angle of the tool crater wear surface, and is the shear stress at tool tip. According to Equation (10), is equal to the shear flow stress k. The shear angle Φ can be calculated via Lee’s model []:
The length of tool–chip contact zone and the length of sticking zone can also be solved:
where is the undeformed chip thickness. In Equations (11) and (12), the normal stress at the tool tip is unknown. can be solved by analyzing the slip line field of the primary shear band.
The slip line field of the primary shear band was established [], as shown in Figure 12. The profile of tool crater wear was simplified as an arc. The geometric relationship in the slip line field and the equilibrium relation of force and torque were analyzed. The normal stress at the tool tip expressed by shear flow stress k was obtained.
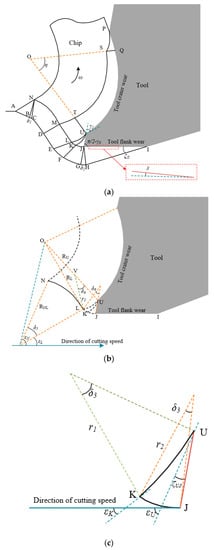
Figure 12.
(a) Slip line field of primary shear zone; (b) slip line field velocity vector diagram; (c) geometric relationship diagram of region KJU.
In Figure 12, J is the chip separation point. JU is a short edge near the tip, which can be regarded as a built-up edge. According to Childs and Long’s results, the geometric relationship in the slip line field can be expressed as:
In Figure 12 and Equations (16)–(24), ζJI and ζUJ are the friction angles of the tool flank wear surface BUE; and are the fan-zone angles under points N and J; , , and are the slip line angles of UK, UL, NL and LJ; , , , , and are the angles of points J, L, K, N and U with respect to the cutting direction; and are the radius values of slip lines UK and KJ; is the velocity jump across the slip line NL; and and are hydrostatic stress of points N and U. The hydrostatic stress of point U can be regarded as being equal to the normal stress at the tool tip, as shown in Equation (25).
The force and torque balance in the main shear zone were analyzed to solve the hydrostatic stress of point U, as shown in Figure 13.
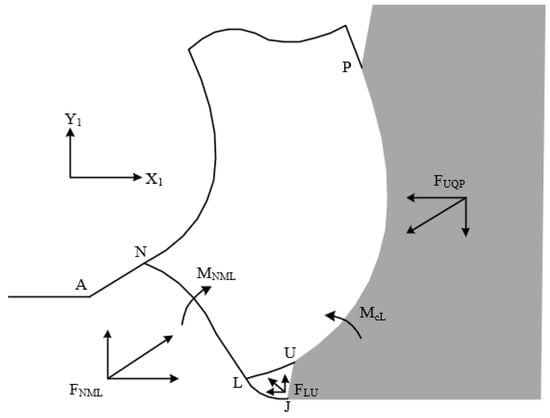
Figure 13.
Schematic diagram of force and bending moment in the primary shear zone of the worn tool.
The force in the main shear zone of the worn tool is balanced with the force + in the tool–chip contact zone. The forces and + were decomposed into two directions of the X1 axis and Y1 axis. The X1 axis is parallel to the cutting direction. The torque in the main shear zone is balanced with the torque + + in the tool–chip contact zone. The reference point of the torque is point L. Equilibrium equations are listed according to Figure 13. The calculations of forces and momentum are listed in reference [].
The distribution of normal stress on the tool crater wear surface (expressed by shear flow stress k) can be solved, and the flowchart is shown in Figure 14. The fresh tool can be regarded as a special worn stage KT = 0.
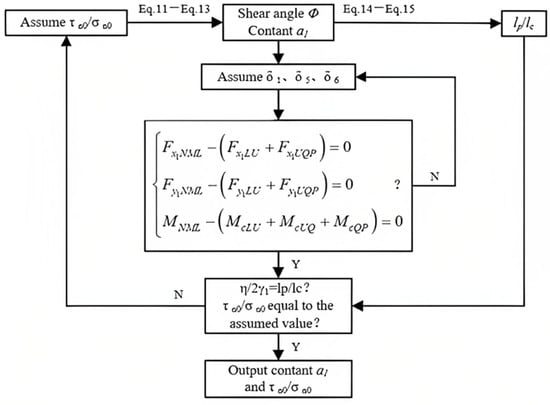
Figure 14.
Flow chart for solving normal stress distribution on tool crater wear surface.
Shear flow stress k is an independent variable. The shear flow stress k needs to be further calculated to determine the normal stress on the tool crater wear surface. The shear flow stress was calculated via the J-C constitutive model.
The J-C constitutive parameters of Inconel 718 are listed in Table 1 [].

Table 1.
J-C constitutive model parameters of Inconel 718, data from [].
In Equation (27), is the strain of the main shear band, and is the strain rate. and were calculated via Equations (28) and (29) [].
where c is strain rate constant, is the length of shear band, is the shear velocity, and is the average temperature of shear band., and were calculated via Equations (30)–(32).
In Equation (32), is the environment temperature, and = 20 ; W is the cutting width; Λm is the thermal conductivity of workpiece material; is the shear band heat distribution coefficient; and is the shear band heat flux density. The calculations of and are shown in Equations (33) and (34).
In Equations (33) and (34), is the temperature coefficient of workpiece material, and is the shear force. The shear force is expressed by Equation (35).
All in all, the solution of shear flow stress k and is shown in Figure 15.
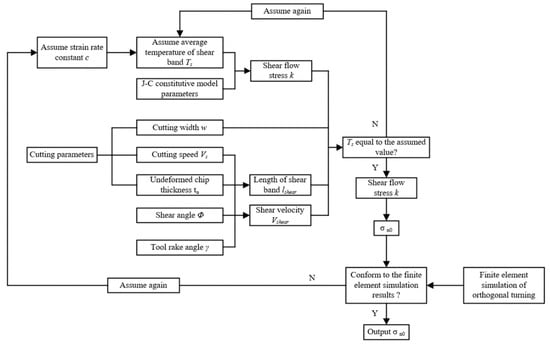
Figure 15.
Flow chart for solving shear flow stress k and .
- (2)
- Normal stress distribution on the tool flank wear surface
At present, there is no unified calculation method for the normal stress of the tool flank wear surface. Waldorf et al. [] considered the normal stress of the tool flank wear surface as an exponential distribution without considering the tool flank roll angle. As shown in Figure 16a, the maximum normal stress of the tool flank wear surface is located at the tool tip. Zhou [] introduced the influence of the tool tip radius and considered that the normal stress of the tool flank wear surface is evenly distributed, as shown in Figure 16b. Therefore, the finite element simulation was used to analyze the normal stress distribution of the tool flank wear surface in the orthogonal cutting of Inconel 718 with a TiAlN-coated carbide tool. In this paper, finite element modeling based on orthogonal cutting experimental results is presented (Section 6).
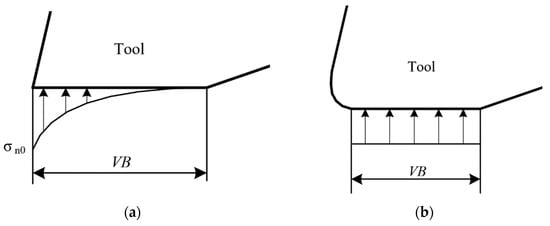
Figure 16.
Distribution of normal stress on tool flank wear surface: (a) Waldorf; (b) ZHOU.
4.2. Tool–Chip Relative Sliding Velocity
The tool–chip relative sliding velocity of the tool flank wear surface is equal to the cutting speed; therefore, only the tool–chip relative sliding velocity distribution needs to be studied. The tool–chip relative sliding velocity distribution is affected by the length of the sticking zone. The results of Zorev [] and Tay [] found that in the tool–chip contact zone, the tool–chip relative sliding velocity in the sticking zone is exponentially related to the length from the tool tip, as shown in Figure 17.
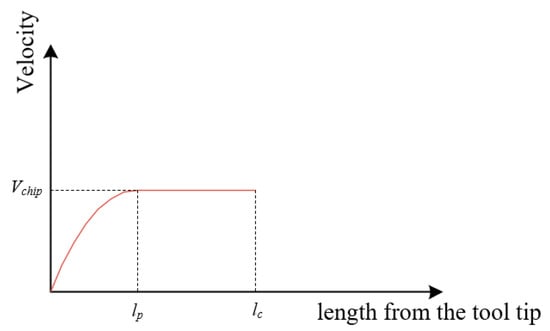
Figure 17.
Distribution of tool–chip relative sliding velocity.
The tool–chip relative sliding velocity can be expressed as:
where x is the abscissa of the nodes on the tool crater wear surface in the X-Y coordinate system. is the chip flow velocity, as shown in Equation (37).
4.3. Cutting Temperature Distribution on Tool Wear Surface
The cutting temperature of the tool surface comes from three heat sources: the primary shear heat source, the tool–chip friction heat source and the tool–workpiece friction heat source. The distribution of the heat source in the tool–workpiece contact zone is shown in Figure 18.
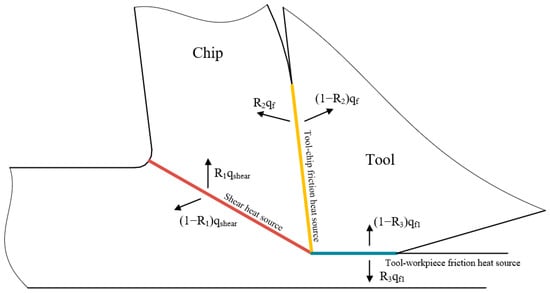
Figure 18.
Heat source distribution in tool–workpiece contact zone.
- (1)
- Cutting temperature distribution on the tool crater wear surface
The tool–chip friction heat source on the tool crater wear surface was simplified as a plane heat source, and the change in tool–chip contact length caused by the deepening of the tool crater wear was considered. The temperature rise in the tool crater wear zone was mainly due to tool–chip friction and shear, and the tool–workpiece friction of the tool flank wear surface also affected the cutting temperature of the tool crater wear surface. The cutting temperature of the tool crater wear surface is shown in Equation (38).
, and are the temperature rise caused by the tool–chip friction heat source, the primary shear heat source and the tool–workpiece friction heat source, respectively. Assuming that the boundary is adiabatic, the heat cannot be dispersed into the air. The coordinate system of the tool–chip and tool–workpiece contact zone was established as shown in Figure 19.
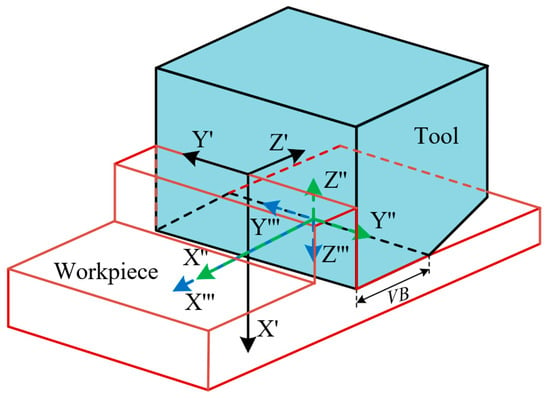
Figure 19.
Schematic diagram of tool–chip friction interface/tool–workpiece friction interface coordinate system.
The temperature rise in any point (,,) in the tool crater wear surface caused by the tool–chip friction heat source is shown in Equations (39)–(41) [].
where is the heat distribution coefficient of the tool–chip contact zone. Λm is the thermal conductivity of the tool material. is the tool–chip friction heat flux density, as shown in Equation (42).
The temperature rise caused by the tool–chip friction heat source was obtained via Equations (39)–(42). Zhao [] found that the tool–chip heat distribution coefficient between carbide and Inconel 718 () is 0.45. The temperature rise in the tool crater wear surface caused by the tool–workpiece friction () was further solved by analyzing the tool–workpiece friction behavior of the tool flank wear surface. The temperature rise caused by the tool–workpiece friction heat source needs to be calculated to obtain . The tool crater wear surface and the tool flank wear surface are in different coordinate systems, and the coordinate system transformation shown in Equation (43) was required.
Using the relationship between the tool crater wear surface coordinate system and the tool flank wear surface coordinate system, the can be obtained, as shown in Equation (44) [].
is the temperature rise in the tool flank surface caused by the tool–workpiece friction heat source, which can be calculated via Equations (45)–(47) [].
is the tool–chip friction heat flux density, as shown in Equation (48).
is the tool–workpiece heat distribution coefficient between carbide and Inconel 718. At present, there is a lack of research on the tool–workpiece heat distribution coefficient between carbide and Inconel 718. It is necessary to determine the by calculating the temperature rise in the workpiece. The temperature rise in the workpiece is due to the primary shear band and the tool–workpiece friction, as shown in Equation (49).
is the temperature rise in the workpiece caused by tool–workpiece friction heat source, which can be calculated via Equation (50) [].
is the temperature rise in the workpiece caused by primary shear heat source, which can be calculated via Equation (51) [].
In Equation (51), is the temperature coefficient of tool material, and is the zero-order Bessel function of the second kind.
The relationship between and is shown in Equation (52). The temperature rise in the tool flank wear surface can be solved based on Equation (52), and the can also be calculated.
- (2)
- Cutting temperature distribution on the tool flank wear surface
The temperature rise in tool flank wear surface is due to the tool–workpiece friction heat source and tool–chip friction heat source, as shown in Equation (53).
In Equation (53), is the temperature rise in the tool flank wear surface caused by the tool–chip friction, as shown in Equation (54).
Based on the relationship between and , the can be calculated by combining Equations (53) and (54). Finally, the cutting temperature distribution on the tool crater wear surface and tool flank wear surface can be solved, and the flow chart is shown in Figure 20.
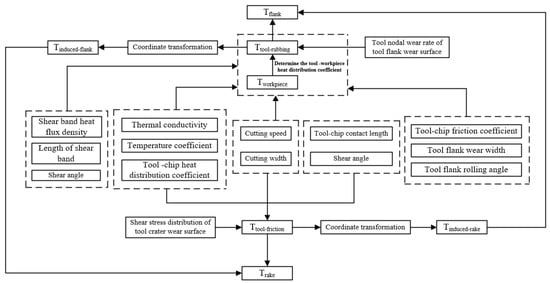
Figure 20.
Flow chart for solving the cutting temperature of tool rake face and tool flank face.
5. Orthogonal Cutting Experiment
Inconel 718 was used as the workpiece material. Inconel 718 was processed into disc workpieces (Φ 125 mm, thickness of 2 mm). The physical properties of Inconel 718 are shown in Table 2.

Table 2.
Physical properties of Inconel 718.
The tools were PVD TiAlN-coated carbide tools with a rake angle of 0° and 11 relief angles. The tool width is 4 mm. The tool matrix material is WC-Co-cemented carbide. The physical properties of WC are shown in Table 3. The thickness of TiAlN coating is 2 μm [], and the physical properties of TiAlN are shown in Table 4.

Table 3.
Physical properties of WC.

Table 4.
Physical properties of TiAlN.
Inconel 718 disc workpieces were subjected to an orthogonal cutting test at the CNC turning center. The cutting speeds were = 50 m/min and 70 m/min. The radial feed f = 0.1 mm/r was equal to the thickness of the undeformed chip. The experimental setup was illustrated in Figure 21. The outer edge of the disc workpieces were de-surfaced to reduce the influence of the radial circular runout before the experiment, and the end of the fixture was fixed by a thimble.
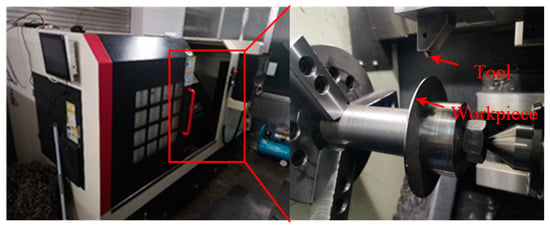
Figure 21.
Equipment for orthogonal cutting experiments.
Tools with different wear states were obtained by changing the cutting time. The relationship between cutting time and cutting parameters and the size of the disc workpieces is shown in Equation (55).
In Equation (55), t is cutting time, is the diameter removal amount of the disc workpieces, D is the diameter of the disc workpieces, and is the thickness of undeformed chip. The schematic diagram of the orthogonal cutting of the disc workpieces is shown in Figure 22.
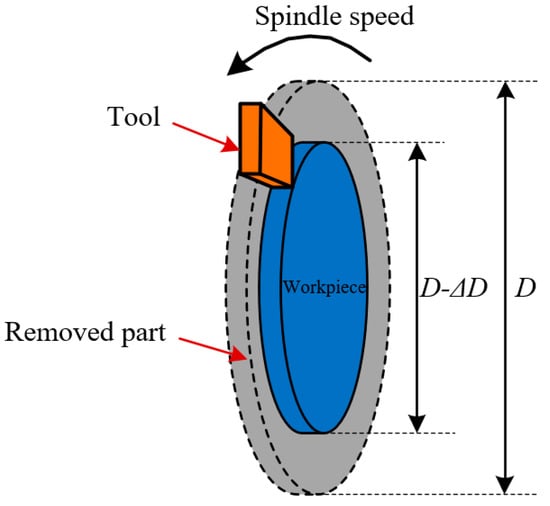
Figure 22.
Schematic diagram of orthogonal cutting process with disc workpiece.
Under the two sets of cutting parameters, five groups of orthogonal cutting processes with different cutting time were carried out. The cutting time is shown in Table 5.

Table 5.
Cutting time under different cutting process parameters.
The diameter of the disc workpiece decreases during the orthogonal turning process. Due to the constant spindle speed of the lathe, the linear speed (cutting speed) on the surface of the disc workpiece is reduced. Therefore, intermittent turning was adopted to make the diameter removal of once single turning disc workpiece less than 10 mm. The spindle speed of the lathe was constantly changed to ensure that the linear velocity (cutting speed) on the surface of the disc workpiece was constant. The experimental error caused by the decrease in the cutting speed can be reduced.
The tool crater wear morphology and the tool flank wear morphology were measured using a laser confocal microscope and handheld microscope. The multi-file analysis function of the laser confocal microscope was used to measure the tool crater wear, and the tool crater wear profile was drawn based on the measurement results. The relationship between the tool flank wear width and the cutting time was obtained by measuring the tool flank wear width VB with a handheld microscope.
The tool flank rolling angle was measured using a laser confocal microscope. The value of the tool flank rolling angle was obtained by considering the profile of the longitudinal section of the tool flank face. The angle between the tool flank face and the tool wear zone can be obtained from the profile of the tool flank face (Figure 23). The relationship between the angle and tool flank rolling angle and tool clearance angle can be described as:
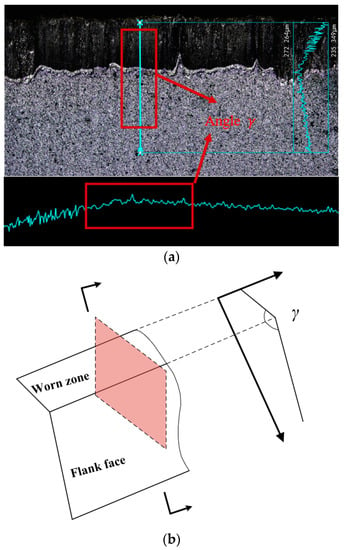
Figure 23.
(a) Profile of the longitudinal section of the tool flank wear zone and included angle . (b) Angle γ′ (schematic).
Five sections were selected equidistantly on the tool flank wear zone to reduce risk, and the obtained results were averaged to obtain the tool flank rolling angle for this group of tool flank wear widths VB.
6. Finite Element Simulation of Orthogonal Cutting
FE simulation of orthogonal cutting was carried out using the AdvantEdge software version 7.0 (ThirdWave, Minneapolis, MN, USA) package. The transient orthogonal cutting simulation of worn tool was carried out to obtain the cutting temperature and normal stress of the wear surface. Firstly, the finite element modeling of the tool was carried out. The worn tool was modeled based on the tool wear profile obtained from the orthogonal cutting experiment, as shown in Figure 24. The tool crater wear profile was simplified to an arc In the finite element modeling. The rounded corners were set at the front of the tool wear zone to prevent mesh distortions. The corner radius = VB/8. Due to the thin coating thickness of the tool used in the experiment, the coating peels off quickly in the orthogonal cutting process. In the tool wear zone, the tool matrix material is usually in direct contact with the workpiece, so the influence of the coating is not considered in the modeling of the worn tool.
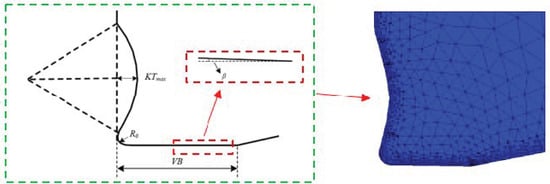
Figure 24.
FE modeling of worn tool.
Secondly, the workpiece was modeled. Set the size of the workpiece, including the height of the workpiece and the length of the workpiece. The height of the workpiece was set to 3 mm, and the length of the workpiece was set to 5 mm. Figure 25 is the finite element model of the TiAlN-coated carbide tool for the orthogonal cutting of Inconel 718.
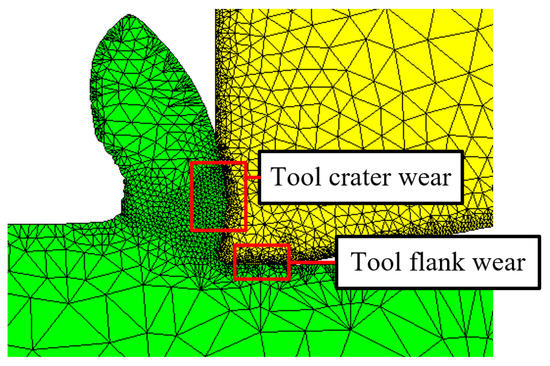
Figure 25.
FE model of TiAlN-coated carbide tool orthogonal cutting of Inconel 718.
The cutting process parameters include cutting speed, feed rate, cutting width, cutting length and ambient temperature. The cutting speed and feed rate were set based on the orthogonal cutting experiment. The cutting speed was set to 50 m/min and 70 m/min, and the feed rate was set to 0.1 mm/r. The cutting width in orthogonal cutting was equal to the thickness of the disc workpieces (2 mm). The cutting length was set to 3 mm. The ambient temperature was set to 20 °C. The material parameters of tool and workpiece were taken from the online database of AdvantEdge.
The tool–workpiece friction coefficient is an important parameter in finite element simulation. The tool–workpiece friction coefficient between WC and Inconel 718 was affected by temperature, contact surface load and relative sliding speed of contact surface, as shown in Figure 26 [].

Figure 26.
Tool–workpiece friction coefficient between WC and Inconel 718. (a) Friction coefficient in different temperature; (b) friction coefficient in different load; (c) friction coefficient in different relative sliding velocity.
It is observed in Figure 26 that the friction coefficient between WC and Inconel 718 decreases with the increase in temperature and load, and it increases with the increase in sliding speed. The sensitivity of the friction coefficient to contact surface load and relative sliding speed is low at room temperature, and the range of variation is limited to 0.5–0.55. The sensitivity of friction coefficient to temperature is high. Therefore, the analysis of friction coefficient in the process of tool wear only considers the influence of the cutting temperature. Finite element modeling requires a preset friction coefficient. According to the output cutting temperature, the rationality of the preset friction coefficient can be further judged.
7. Results and Discussion
7.1. Results of Orthogonal Cutting Experiment
The tool crater wear was measured using the multi-file analysis function of the laser confocal microscope. The tool crater wear measurement results are shown in Figure 27. It can be observed from the measurement results that under the two cutting conditions, with the extension of cutting time, the tool crater wear profile deepens, and the deepest point of the tool crater wear profile continues to approach the tool tip.
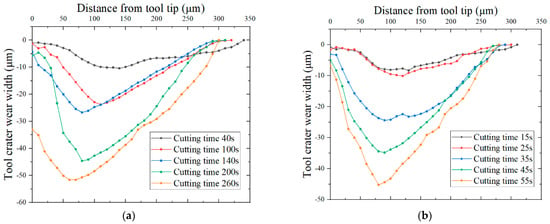
Figure 27.
Measurement results of tool crater wear: (a) cutting speed 50 m/min; (b) cutting speed 70 m/min.
Using a hand-held microscope (magnification 250 times) to measure the tool flank wear width VB of worn tools, the relationship between the tool flank wear width VB and the cutting time was obtained, as shown in Figure 28.
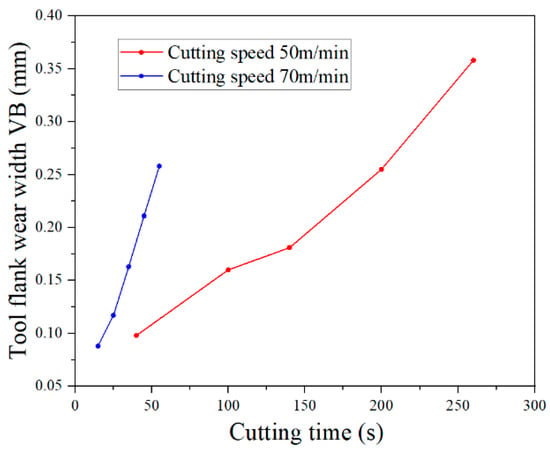
Figure 28.
Tool flank wear curve.
The tool flank wear rate is the derivative of the tool wear curve. The polynomial fitting method was used to fit the tool flank wear curve shown in Figure 28. The derivative operation of the fitted curve was carried out to obtain the tool flank wear rate at different times of the orthogonal cutting experiment, as shown in Figure 29. The tool flank wear width VB was 0.358 mm after cutting at 50 m/min for 260 s, which exceeded the blunt standard VB = 0.3 mm, so this group was eliminated.
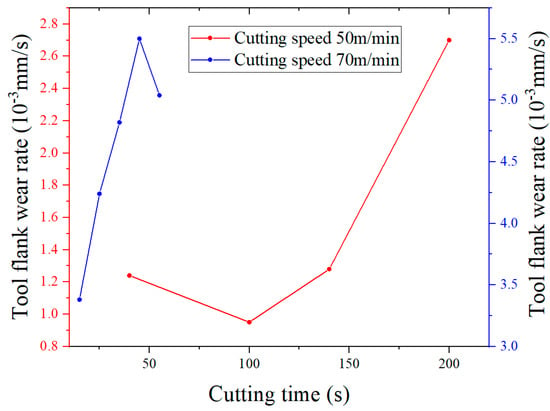
Figure 29.
Tool flank wear rate.
The measurement results of the tool flank rolling angle are shown in Table 6 and Table 7. It can be observed that the tool flank rolling angle decreases with the extension of cutting time, and finally it approaches zero.

Table 6.
Tool flank rolling angle of different worn tool (Vs = 50 m/min f = 0.1 mm/r).

Table 7.
Tool flank rolling angle of different worn tool (Vs = 70 m/min f = 0.1 mm/r).
7.2. Results of Finite Element Simulation
The cutting temperature and normal stress of the tool flank wear surface cannot be measured via the orthogonal cutting experiment. The wear state of each group was simulated by finite element simulation, and the cutting temperature and normal stress of the tool flank wear surface were obtained. The extraction of the cutting temperature and normal stress on the tool flank wear surface is shown in Figure 30. In the middle section of the tool flank wear surface, five nodes were selected at equal intervals, the cutting temperature and normal pressure at each node were extracted, and the average value was calculated to reduce the contingency. The tool–workpiece relative sliding velocity is equal to the cutting speed.
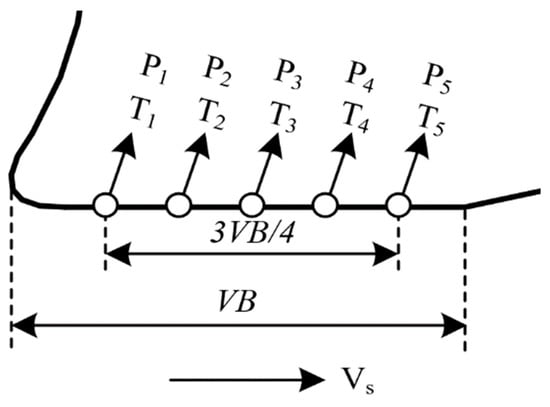
Figure 30.
Extraction method of cutting temperature and normal stress on tool flank wear surface.
Figure 31 shows the extraction results of the cutting temperature and normal stress on the tool flank wear surface of each worn tool at a cutting speed of 50 m/min and 70 m/min. It can be observed that the smaller the node number, the closer it is to the tip. It can be observed from the FE simulation results of Figure 31 that the cutting temperature of the tool flank wear surface increases greatly with the increase in cutting speed, and the normal stress of the flank changes less with the increase in cutting speed. At the same cutting speed, with the extension of cutting time, the cutting temperature of the tool flank wear surface increases continuously, and the normal stress of the flank surface decreases.
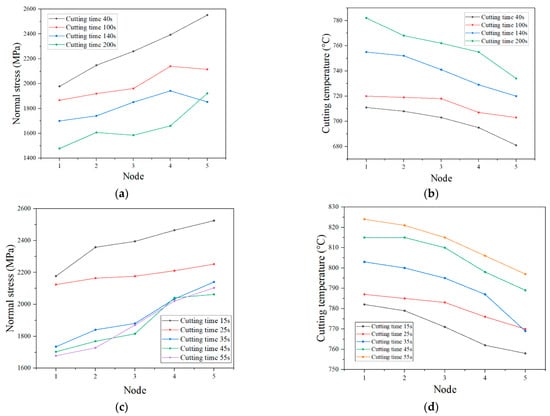
Figure 31.
Cutting temperature and normal stress of tool flank wear zone. (a) Normal stress distribution on tool flank wear surface at cutting speed of 50 m/min. (b) Cutting temperature distribution on tool flank wear surface at cutting speed of 50 m/min. (c) Normal stress distribution on tool flank wear surface at cutting speed of 70 m/min. (d) Cutting temperature distribution on tool flank wear surface at cutting speed of 70 m/min.
The normal stress of the tool flank wear surface shows a tiny growth trend from the tool tip. Therefore, the normal stress distribution of the tool flank wear surface can be approximated as a uniform distribution. The average normal stress of tool flank wear surface was calculated, and the finite element simulation cloud map was further observed, as shown in Figure 32.
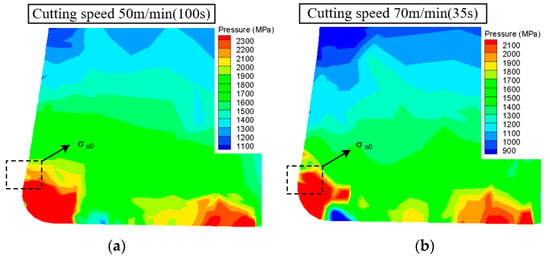
Figure 32.
Cloud diagram of normal stress distribution of worn tool. (a) Cutting speed 50 m/min and cutting time 100 s; (b) cutting speed 70 m/min and cutting time 35 s.
It can be observed from the normal stress cloud map that the average normal stress of the flank wear surface is equal to the . The was extracted and compared with the average normal stress of tool flank wear surface, as shown in Figure 33. Figure 33 shows that the gap between average normal stress of the flank wear surface and the is small. Therefore, the value of average normal stress of the flank wear surface was approximated as being equal to .
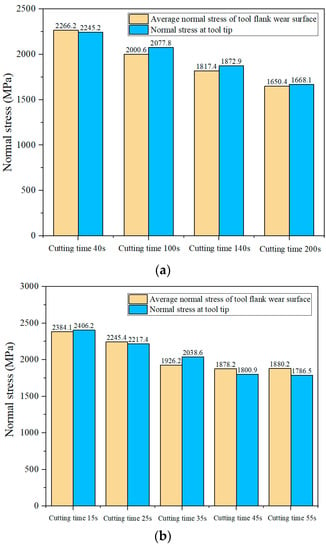
Figure 33.
The comparison diagram of the normal stress at the tool tip (starting point of the tool crater wear profile) and the average normal stress of the tool flank wear surface. Cutting speed: (a) 50 m/min; (b) 70 m/min.
7.3. Solution of Usui Model Constants
The Usui tool wear rate model was logarithmically calculated, as shown in Equation (57).
Equation (57) represents the linear relationship between and , and the constants A and B of the Usui tool wear rate model were obtained by solving the slope and intercept of Equation (57). The tool flank wear rate at different times was obtained via the orthogonal cutting experiment, and the tool flank wear rate was transformed into the nodal wear rate by Equation (4). The cutting temperature and normal stress of the tool flank wear surface were obtained via FE simulation.
The tool flank wear rate and the tool flank rolling angle at different times were obtained from the results of the orthogonal cutting experiment, and the tool nodal wear rate of the tool flank wear surface was calculated. The tool flank wear rate and tool flank rolling angle obtained from the orthogonal cutting experiment were substituted into Equation (4), and the nodal wear rate of tool flank wear surface was calculated. The calculation results are shown in Figure 34.
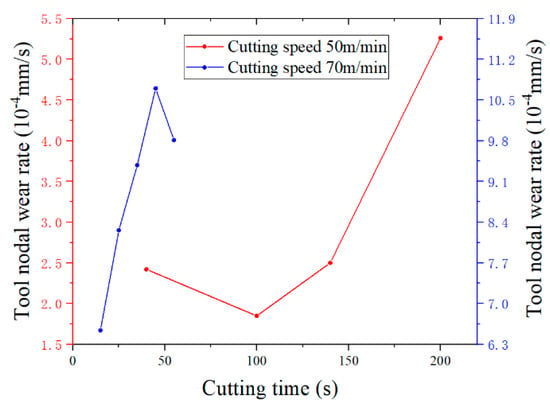
Figure 34.
Nodal wear rate of tool flank wear surface.
The cutting speed, nodal wear rate, cutting temperature and normal stress were substituted into Equation (4). The scatter plot between and was obtained, and the scatter plot was linearly fitted, as shown in Figure 35.
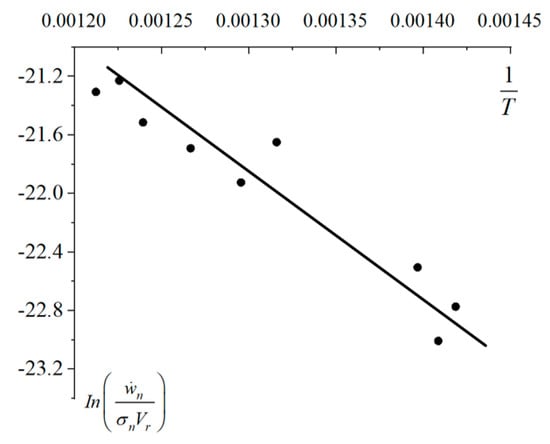
Figure 35.
Linear fitting of and .
The slope and intercept of the regression line were obtained via linear fitting, and the constant of the Usui tool wear rate model under the condition of orthogonal cutting of Inconel 718 using the TiAlN-coated carbide tool was calculated: A = 7.8 × 10⁻⁸, B = 4186.
7.4. Predicted Results of Tool Wear
The tool wear of the TiAlN-coated carbide tool in the orthogonal cutting of Inconel 718 was predicted using the proposed prediction method. The cutting parameters are the same as those of the orthogonal cutting experiment.
In the prediction of tool wear, the tool wear process was discretized into six wear states (the tool flank wear width VB = 0.04 mm, 0.08 mm, 0.12 mm, 0.16 mm, 0.20 mm and 0.24 mm), and the tool wear was predicted by calculating the time length between each wear state. The tool wear prediction results include the tool crater wear profile and the tool flank wear curve.
The predicted tool crater profiles are shown in Figure 36, and the predicted tool flank wear curves are shown in Figure 37.
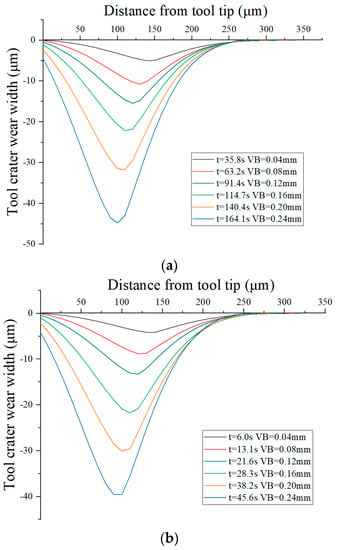
Figure 36.
Prediction results of tool crater wear. (a) Cutting speed of 50 m/min and feed rate of 0.1 mm/r. (b) Cutting speed 70 m/min and feed rate 0.1 mm/r.
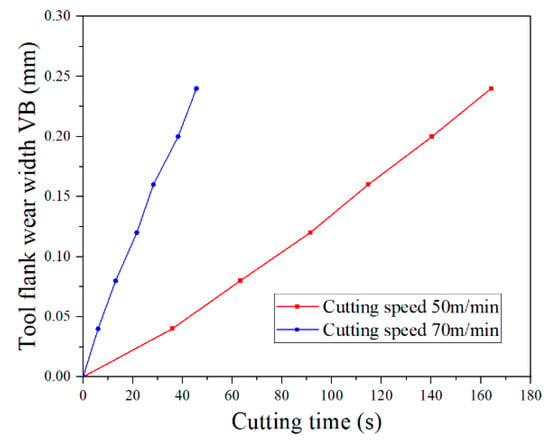
Figure 37.
Prediction results of tool flank wear.
It can be observed from Figure 36 that the width of the tool crater wear profile decreases continuously with the increase in tool wear, and the deepest point of the tool crater wear profile is close to the tool tip. The evolution trend of the tool crater wear is consistent with the experimental results.
The evolution of the tool crater wear profile is determined by the nodal wear rate distribution of the tool crater wear surface, as shown in Figure 38. Figure 38 shows that the highest point of the nodal wear rate coincides with the deepest point of the tool crater wear surface. The highest point of the nodal wear rate is constantly close to the tool tip with the increase in tool wear, which is the same as the evolution trend of the tool crater wear.
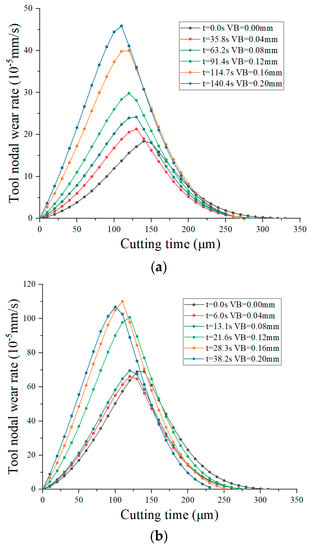
Figure 38.
Tool nodal wear rate distribution on tool crater wear surface. (a) Cutting speed of 50 m/min and feed rate of 0.1 mm/r (b). Cutting speed of 70 m/min and feed rate of 0.1 mm/r.
The distribution of the nodal wear rate is the combined effect of the evolution of the tool tip position, tool–chip contact length and the length of the sticking zone. The shear angle of the main shear area increases with the increase in tool wear, as shown in Table 8 and Table 9. The increase in the shear angle leads to the decrease in the tool–chip contact length and the length of the sticking zone, and the inflection point of the tool–chip relative sliding velocity is close to the tool tip. The inflection point of the tool–chip relative sliding velocity determines the highest cutting temperature of the tool crater wear surface, as shown in Figure 39. Figure 39 show that the highest point of the cutting temperature coincides with the highest point of the nodal wear rate, and the forward movement of the inflection point of tool–chip relative sliding velocity drives the highest point of node wear rate close to the tool tip.

Table 8.
Evolution of shear angle, length of sticking zone, length of tool–chip contact zone and actual rake angle (cutting speed of 50 m/min and feed rate of 0.1 mm/r).

Table 9.
Evolution of shear angle, length of sticking zone, length of tool–chip contact zone and actual rake angle (cutting speed of 70 m/min and feed rate of 0.1 mm/r).
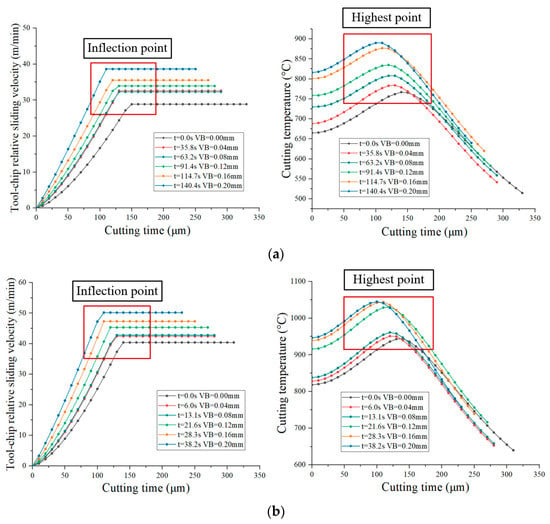
Figure 39.
Distribution of tool–chip relative sliding velocity and cutting temperature on tool crater wear surface. (a) Cutting speed of 50 m/min and feed rate of 0.1 mm/r. (b) Cutting speed of 70 m/min and feed rate of 0.1 mm/r.
The maximum nodal wear rate of the tool crater wear surface increases continuously during the tool wear process. However, when the cutting speed is 50 m/min, the maximum value of the nodal wear rate of the tool crater wear surface is in a state of uniform rise. When the cutting speed is 70 m/min, the maximum value of the nodal wear rate of the tool crater wear surface rises sharply in the cutting time range of 13.1–21.6 s. It can be observed from Figure 39 that the maximum cutting temperature of the tool crater wear surface increases with the increase in tool wear, and its growth trend is the same as that of the maximum nodal wear rate. When the cutting speed is 50 m/min, the cutting temperature of the tool crater wear surface increases continuously. When the cutting speed is 70 m/min, the cutting temperature of the tool crater wear surface rises sharply in the range of 13.1–21.6 s, which is the same as the evolution trend of the nodal wear rate. The evolution of the cutting temperature caused by tool wear is the decisive factor for the increase in the nodal wear rate. In the tool wear process, the deepening of the tool crater wear profile increases the tool rake angle, which leads to the increase in the tool–chip relative sliding velocity, as shown in Table 8 and Table 9. The increase in the tool–chip relative sliding velocity increases the cutting temperature of the tool crater wear surface.
The normal stress of the tool–chip contact zone is exponentially distributed. The normal stress in the sticking zone is larger than that in the tool–chip relative sliding zone, as shown in Figure 40. The normal stress distribution caused the nodal wear rate to be approximately symmetrical to the highest cutting temperature as the symmetry axis. The normal stress decreases slowly with the increase in tool wear, and the influence on the tool wear rate is weak.
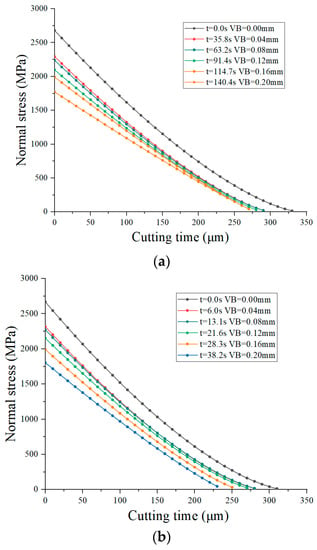
Figure 40.
Distribution of normal stress on tool crater wear surface. (a) Cutting speed of 50 m/min and feed rate of 0.1 mm/r. (b) Cutting speed of 70 m/min and feed rate of 0.1 mm/r.
The tool crater wear profile of some experimental groups in the wear state was predicted using the proposed tool wear prediction method, and the results of the orthogonal cutting experiments were compared to verify the reliability of the prediction method. The cutting speed = 50 m/min, the tool flank wear width VB = 0.160 mm, 0.255 mm and = 70 m/min, and the tool flank wear width VB = 0.117 mm, 0.211 mm were selected to predict the tool crater profile.
The existing research on tool wear prediction only focuses on tool crater wear or tool flank wear, and the analysis of tool wear geometry evolution is less researched. In the theoretical prediction of tool crater wear, Huang [] simplified the tool–chip contact length as a constant and ignored the evolution of the shear angle. Therefore, the tool wear prediction results, without considering the evolution of the tool–chip contact length and shear angle, were taken as the control group to prove the superiority of the proposed tool wear prediction method.
It can be observed from Figure 41 that the two prediction methods can accurately predict the maximum value of the tool crater wear depth. The prediction error of two prediction methods is shown in Table 10. Error 1 is the prediction error of control group, and Error 2 is the prediction error of the prediction results in this paper. Under the tool wear state of cutting speed = 50 m/min and VB = 0.160 mm/0.255 mm, and cutting speed = 70 m/min and VB = 0.211 mm, the prediction error of the tool crater wear maximum depth predicted by the two methods is less than 15%. Under the tool wear condition of cutting speed = 50 m/min and VB = 0.117 mm, the prediction error of the tool wear prediction method proposed in this paper is 32.46%, which is 19.48% lower than that of the control group. The prediction method proposed in this paper is consistent with the experimental results in the prediction of the deepest point of the tool crater wear profile, and the prediction error is less than 20%. The prediction results of the control group have a large error in the prediction of the deepest point of the tool crater wear profile. The tool wear prediction method proposed in this paper is helpful to improve the prediction accuracy of tool crater wear.
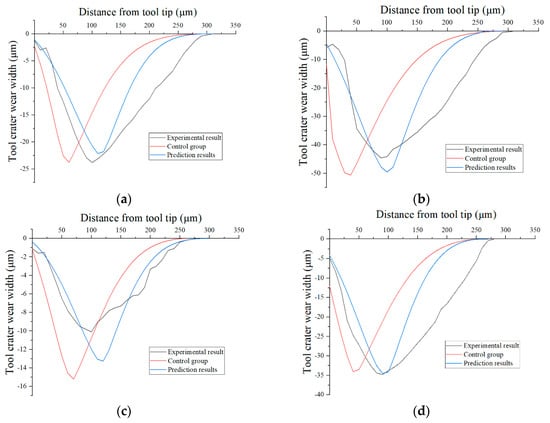
Figure 41.
Comparison of prediction results. (a) Cutting speed of 50 m/min and feed rate of 0.1 mm/r; VB = 0.160 mm. (b) Cutting speed of 50 m/min and feed rate of 0.1 mm/r; VB = 0.255 mm. (c) Cutting speed of 70 m/min and feed rate of 0.1 mm/r; VB = 0.117 mm. (d) Cutting speed of 70 m/min and feed rate of 0.1 mm/r; VB = 0.211 mm.

Table 10.
Comparison of prediction errors.
In particular, it can be observed from Figure 36 and Figure 37 that the tool crater wear depth KT and the tool flank wear width VB have a mapping relationship, as shown in Figure 42. Therefore, the empirical model (orthogonal cutting of Inconel 718 using the TiAlN-coated carbide tool) can be proposed. The empirical model adopts an exponential function. KT = f(VB) can be described as:
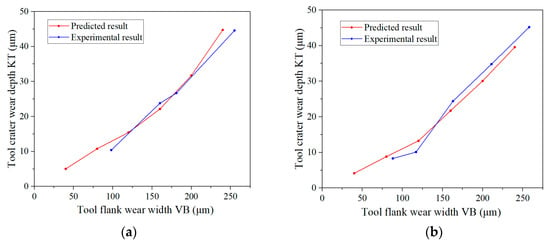
Figure 42.
Relationship between tool crater wear depth and tool flank wear width. (a) Cutting speed of 50 m/min and feed rate of 0.1 mm/r. (b) Cutting speed of 70 m/min and feed rate of 0.1 mm/r.
The prediction results of the tool flank wear are shown in Figure 43. It can be observed from Figure 43 that two prediction methods can accurately predict the tool flank wear. In addition, the tool flank wear in different cutting parameters can be predicted using the method in this paper, and the tool crater wear can be further predicted combining Equation (58). However, the predicted tool flank wear curves did not follow a conventional tool wear pattern (rapid wear at the beginning and end of tool life), the tool wear rate model needs to be further optimized according to the specific machining conditions.
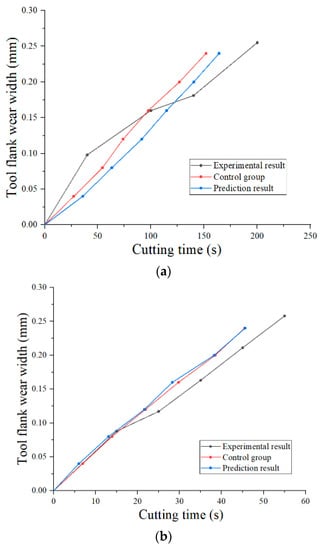
Figure 43.
Results of tool flank wear prediction. (a) Cutting speed of 50 m/min and feed rate of 0.1 mm/r. (b) Cutting speed of 70 m/min and feed rate of 0.1 mm/r.
8. Conclusions
In this study, a tool wear prediction method was proposed based on the positive feedback relationship between the tool geometry and the predicted tool wear rate. The evolution of the tool geometry during tool wear was analyzed by considering the combined effect of the tool crater wear and tool flank wear, including the evolution of the tool tip position, tool rake angle and tool flank rolling angle. The evolution of the cutting temperature, normal stress and tool–chip relative sliding velocity on the tool wear surface were studied. The evolution of the tool wear rate during tool wear was revealed. Based the evolution of the tool geometry and tool wear rate in the tool wear process, the tool crater wear and tool flank wear of TiAlN-coated carbide tool orthogonal cutting of Inconel 718 were predicted using the tool wear prediction method. The results of the tool wear prediction were verified by experiments. The following conclusions were drawn:
- (1)
- The predicted maximum depth of the tool crater wear profile and the deepest point of tool crater wear profile are consistent with the experimental results. Considering the real-time evolution of shear angle and tool–chip contact length with tool wear is helpful to improve the prediction accuracy of rake face wear profile. The prediction method proposed in this paper is consistent with the experimental results in the prediction of the deepest point of tool crater wear profile, and the prediction error is less than 20%. The prediction results of control group have a large error in the prediction of the deepest point of the tool crater wear profile. The predicted results of the tool flank wear are also consistent with the experimental results. The predicted tool flank wear curves did not follow a conventional tool wear pattern, and the tool wear rate model needs to be further optimized according to the specific machining conditions.
- (2)
- The nodal wear rate distribution of the tool crater wear surface determines the evolution of the tool crater wear profile. The distribution of the nodal wear rate of the tool crater wear surface depends on the distribution of the cutting temperature and the tool–chip relative sliding velocity. The highest point of the cutting temperature and the inflection point of the tool–chip relative sliding velocity coincide with the highest point of the nodal wear rate of the tool crater wear surface.
- (3)
- The forward movement of the deepest point of tool crater wear profile is attributed to the increase in tool wear. The consideration of the interaction between the tool crater wear and tool flank wear can describe the evolution of the tool–chip contact length and rake angle. The tool–chip contact length decreases with the increase in tool flank wear, resulting in a decrease in the length of the sticking zone. The inflection point of the tool–chip relative sliding velocity moves forward, and the highest point of the nodal wear rate of the tool crater wear surface moves forward. The increase in the tool shear angle and tool rake angle leads to the increase in the tool–chip relative sliding velocity. The increase in the tool–chip relative sliding velocity increases the cutting temperature of the tool crater wear surface, the highest point of the cutting temperature coincides with the highest point of the nodal wear rate of the tool crater wear surface, and the nodal wear rate increases. Therefore, the tool crater wear profile deepens.
The positive feedback relationship between the tool geometry and the predicted tool wear rate was adopted in the prediction method. The attention to the real-time process of tool wear further improved the accuracy of the tool wear prediction, including the tool geometry and tool wear rate. This method fits in different machining conditions, with only some cutting parameters and material parameters needing to be changed. This prediction method can be used to guide the development of the tool wear database. However, part of theoretical model can be further optimized according to the specific machining conditions in the next step.
Author Contributions
Conceptualization, Z.Z. and Z.L.; data curation, Z.Z., X.R. and J.Z.; formal analysis, Z.Z.; funding acquisition, Z.L.; investigation, Z.Z., X.R. and J.Z.; methodology, Z.Z. and Z.L.; project administration, Z.L., X.R. and J.Z.; resources, Z.L., X.R. and J.Z.; software, Z.Z.; supervision, Z.L.; validation, Z.Z.; visualization, Z.Z.; writing—original draft preparation, Z.Z.; writing—review and editing, Z.L., X.R. and J.Z. All authors have read and agreed to the published version of the manuscript.
Funding
The project is supported by the grants from National Natural Science Foundation of China (No. 52275444), Shandong Provincial Key Research and Development Program (Major Scientific and Technological Innovation Project) (No. 2020CXGC010204) and Taishan Scholar Foundation.
Data Availability Statement
No data was used for the research described in the article.
Conflicts of Interest
The authors declare that they have no known competing financial interests or personal relationships that could have appeared to have influenced the work reported in this paper.
References
- Taylor, F.W. On the art of cutting metals. Metall. Res. Technol. 1907, 4, 39–65. Available online: http://hdl.handle.net/1957/21006 (accessed on 10 May 2023).
- Li, T.; Shi, T.; Tang, Z. Real-time tool wear monitoring using thin-film thermocouple. J. Mater. Process. Technol. 2020, 288, 116901. [Google Scholar] [CrossRef]
- Sharma, V.K.; Singh, T.; Singh, K.; Kaur, G. MQL assisted face milling of EN-31: Tool wear optimization and its correlation with cutting temperature. Mater. Today Proc. 2022, 71, 346–351. [Google Scholar] [CrossRef]
- Sk, T.; Shankar, S.; Mohanraj, T.; Devendran, K. Tool wear prediction in hard turning of en8 steel using cutting force and surface roughness with artificial neural network. Proc. Inst. Mech. Eng. Part C J. Mech. Eng. Sci. 2020, 234, 329–342. [Google Scholar] [CrossRef]
- Kaya, E.; Kaya, İ. Tool wear progression of PCD and PCBN cutting tools in high speed machining of NiTi shape memory alloy under various cutting speeds. Diam. Relat. Mater. 2020, 105, 107810. [Google Scholar] [CrossRef]
- Olander, P.; Heinrichs, J. On wear of WC–Co cutting inserts in turning of Ti6Al4V—A study of wear surfaces. Tribol.-Mater. Surf. Interfaces 2020, 15, 181–192. [Google Scholar] [CrossRef]
- Archard, J.F. Contact and rubbing of flat surfaces. J. Appl. Phys. 1953, 24, 981–988. [Google Scholar] [CrossRef]
- Usui, E.; Shirakashi, T.; Kitagawa, T. Analytical prediction of cutting tool wear. Wear 1984, 100, 129–151. [Google Scholar] [CrossRef]
- Malakizadi, A.; Gruber, H.; Sadik, I.; Nyborg, L. An FEM-based approach for tool wear estimation in machining. Wear 2016, 368, 10–24. [Google Scholar] [CrossRef]
- Binder, M.; Klocke, F.; Lung, D. Tool wear simulation of complex shaped coated cutting tools. Wear 2015, 330, 600–607. [Google Scholar] [CrossRef]
- Haddag, B.; Nouari, M. Tool wear and heat transfer analyses in dry machining based on multi-steps numerical modelling and experimental validation. Wear 2013, 302, 1158–1170. [Google Scholar] [CrossRef]
- Matsumura, T.; Shirakashi, T.; Usui, E. Identification of wear characteristics in tool wear model of cutting process. Int. J. Mater. Form. 2008, 1, 555–558. [Google Scholar] [CrossRef]
- Zhao, H.; Barber, G.C.; Zou, Q. A study of flank wear in orthogonal cutting with internal cooling. Wear 2002, 253, 957–962. [Google Scholar] [CrossRef]
- Sagar, C.K.; Priyadarshini, A.; Gupta, A.K. Experimental investigation of tool wear characteristics and analytical prediction of tool life using a modified tool wear rate model while machining 90 tungsten heavy alloys. Proc. Inst. Mech. Eng. Part B J. Eng. Manuf. 2021, 253, 242–254. [Google Scholar] [CrossRef]
- Elias, J.V.; Asams, S.; Mathew, J. Worn tool geometry–based flank wear prediction in micro turning. Proc. Inst. Mech. Eng. Part B J. Eng. Manuf. 2020, 234, 710–719. [Google Scholar] [CrossRef]
- Nooraie, R.Y.; Safari, M.; Pak, A. Tool wear estimation in machining based on the flank wear inclination angle changes using the FE method. Mach. Sci. Technol. 2019, 24, 425–445. [Google Scholar] [CrossRef]
- Huang, Y.; Chou, Y.K.; Liang, S.Y. CBN tool wear in hard turning: A survey on research progresses. Int. J. Adv. Manuf. Technol. 2007, 35, 443–453. [Google Scholar] [CrossRef]
- Yue, C.; Li, X.; Liu, X.; Du, J.; Liang, S.Y.; Wang, L.; Sun, Y. Wear behavior of tool flank in the side milling of Ti6Al4V: An analytical model and experimental validation. Proc. Inst. Mech. Eng. Part C J. Mech. Eng. Sci. 2022, 236, 1631–1644. [Google Scholar] [CrossRef]
- Huang, Y.; Dawson, T.G. Tool crater wear depth modeling in CBN hard turning. Wear 2005, 258, 1455–1461. [Google Scholar] [CrossRef]
- Zhuang, K.; Li, M.; Lin, F.; Hu, C.; Weng, J.; Gao, Z.; Wu, C. Crater wear prediction in turning Ti6Al4V considering cutting temperature effect. Int. J. Adv. Manuf. Technol. 2022, 121, 6763–6781. [Google Scholar] [CrossRef]
- Olortegui-Yume, J.A.; Kwon, P.Y. Local crater wear prediction using physics-based models. J. Manuf. Sci. Eng 2010, 132, 051007. [Google Scholar] [CrossRef]
- Mishra, S.K.; Ghosh, S.; Aravindan, S. Temporal and spatial crater wear prediction of WC/Co tools during dry turning of Ti6Al4V alloy. Wear 2020, 448, 203229. [Google Scholar] [CrossRef]
- Kursuncu, B.; Caliskan, H.; Guven, S.Y.; Panjan, P. Wear behavior of multilayer nanocomposite TiAlSiN/TiSiN/TiAlN coated carbide cutting tool during face milling of inconel 718 superalloy. J. Nano Res. 2017, 47, 11–16. [Google Scholar] [CrossRef]
- Banda, T.; Ho, K.Y.; Akhavan Farid, A.; Lim, C.S. Characterization of tool wear mechanisms and failure modes of TiAlN-NbN coated carbide inserts in face milling of Inconel 718. J. Mater. Eng. Perform. 2022, 31, 2309–2320. [Google Scholar] [CrossRef]
- Zorev, N.N. Inter-relationship between shear processes occurring along tool face and shear plane in metal cutting. Int. J. Prod. Res. 1963, 49, 143–152. [Google Scholar] [CrossRef]
- Ozlu, E.; Molinari, A.; Budak, E. Two-zone analytical contact model applied to orthogonal cutting. Mach. Sci. Technol. 2010, 14, 323–343. [Google Scholar] [CrossRef]
- Lee, E.H.; Shaffer, B.W. The theory of plasticity applied to a problem of machining. J. Appl. Mech 1951, 18, 405–413. [Google Scholar] [CrossRef]
- Long, Y.; Huang, Y. Combined effects of flank and crater wear on cutting force modeling in orthogonal machining—Part I: Model development. Mach. Sci. Technol. 2010, 14, 1–23. [Google Scholar] [CrossRef]
- Wang, B.; Liu, Z.; Hou, X.; Zhao, J. Influences of cutting speed and material mechanical properties on chip deformation and fracture during high-speed cutting of Inconel 718. Materials 2018, 11, 461. [Google Scholar] [CrossRef]
- Karpat, Y.; Özel, T. Predictive analytical and thermal modeling of orthogonal cutting process—Part I: Predictions of tool forces, stresses, and temperature distributions. J. Manuf. Sci. Eng. 2006, 128, 435–444. [Google Scholar] [CrossRef]
- Waldorf, D.J. Shearing, Ploughing, and Wear in Orthogonal Machining; University of Illinois at Urbana-Champaign: Champaign County, IL, USA, 1996. [Google Scholar]
- Zhou, J.M.; Andersson, M.; Ståhl, J.E. Cutting tool fracture prediction and strength evaluation by stress identification, part i: Stress model. Int. J. Mach. Tool Manuf. 1997, 37, 1691–1714. [Google Scholar] [CrossRef]
- Zorev, N.N. Metal Cutting Mechanics; Pergamon: London, UK, 1966. [Google Scholar]
- Tay, A.O.; Stevenson, M.G.; de Vahl Davis, G. Using the finite element method to determine temperature distributions in orthogonal machining. Proc. Inst. Mech. Eng. 1974, 188, 627–638. [Google Scholar] [CrossRef]
- Zhao, J.; Liu, Z.; Wang, B.; Hu, J. PVD AlTiN coating effects on tool-chip heat partition coefficient and cutting temperature rise in orthogonal cutting Inconel 718. Int. J. Heat Mass Transf. 2020, 163, 120449. [Google Scholar] [CrossRef]
- Huang, C.; Zou, B.; Guo, P.; Liu, Y.; Huang, C.; Wang, J. Sliding behavior and wear mechanism of iron and cobalt-based high-temperature alloys against WC and SiC balls. Int. J. Refract. Met. Hard Mater. 2016, 59, 40–55. [Google Scholar] [CrossRef]
Disclaimer/Publisher’s Note: The statements, opinions and data contained in all publications are solely those of the individual author(s) and contributor(s) and not of MDPI and/or the editor(s). MDPI and/or the editor(s) disclaim responsibility for any injury to people or property resulting from any ideas, methods, instructions or products referred to in the content. |
© 2023 by the authors. Licensee MDPI, Basel, Switzerland. This article is an open access article distributed under the terms and conditions of the Creative Commons Attribution (CC BY) license (https://creativecommons.org/licenses/by/4.0/).