Abstract
The development of high-efficiency multi-wire submerged arc welding technology in bridge engineering has been limited due to the high mechanical performance standards required. In this paper, weld metal was obtained by welding at three different high heat inputs with the laboratory-developed high-efficiency submerged arc welding wire for bridges. The effect of changing different high heat inputs on the microstructure and impact toughness of high efficiency submerged arc weld metal was systematically investigated by cutting and Charpy V-notch impact tests at −40 °C, using optical microscopy, scanning electron microscopy, energy-dispersive electron spectroscopy, electron backscatter diffraction, and transmission electron microscopy to characterize and analyze. With the increase in heat input from 50 kJ/cm to 100 kJ/cm, the impact absorption energy decreased significantly from 130 J to 38 J. The number of inclusions in the weld metal significantly decreased and the size increased, which led to a significant decrease in the number of inclusions that effectively promote acicular ferrite nucleation, further leading to a decrease in the proportion of acicular ferrite in the weld metal. At the same time, the microstructure of the weld metal was significantly coarsened, the percentage of high-angle grain boundaries was decreased, and the size of martensite/austenite constituents was significantly increased monotonically. The crack initiation energy was reduced by the coarsened martensite/austenite constituents and inclusions, which produced larger local stress concentrations, and the crack propagation was easier due to the coarsened microstructure and lower critical stress for crack instability propagation. The martensite/austenite constituents and inclusions in large sizes worked together to cause premature cleavage fracture of the impact specimen, which significantly deteriorated the impact toughness. The heat input should not exceed 75 kJ/cm for high-efficiency submerged arc welding wires for bridges.
1. Introduction
As the modern steel structure industry continues to develop in the direction of large-scale and high mechanical properties, it is increasingly important to use high-efficiency welding methods for production. For high-efficiency welding methods, researchers all over the world have carried out in-depth research and exploration. Among them, Lincoln Electric Co. (Cleveland, OH, USA) of the United States has made very important contributions in the research and development and manufacturing of high-efficiency welding materials, high-efficiency welding power sources, and high-efficiency welding robots, especially to promote the development of high-efficiency welding technology in the shipbuilding industry. The FCB submerged arc welding line developed by Ogden Engineering Co. for shipbuilding has promoted the development of shipbuilding. The company Canada Weld Process developed the T.I.M.E. welding technology, which increases the wire feeding speed with high current and is added to the special shielding gas to improve welding efficiency. The laser-arc composite welding technology, which was first developed by British scholars, has the advantages of large penetration, high efficiency, and small welding deformation and has been widely used in many countries in Europe and the United States in the manufacture of shipbuilding and marine engineering steel [1]. In the field of bridge steel structures, submerged arc welding is one of the most important welding methods. At the same time, multi-wire, high-heat input submerged arc welding is one of the most common high-efficiency welding methods.
Compared to single-wire submerged arc welding (20 kJ/cm ≤ heat input ≤ 50 kJ/cm), the heat input (Ej) of double-wire submerged arc welding (heat input ≥ 50 kJ/cm) has a large amount of deposited metal per unit time, which can significantly save production time and cost and reduce the labor intensity of workers. However, with higher Ej, severe coarsening of the microstructure occurs, which deteriorates the mechanical properties of weld metal [2,3]. The weld metal composed of a large amount of acicular ferrite (AF) has a higher impact toughness due to a higher proportion of high-angle grain boundaries (HAGBs) and a precise interlocking structure [4,5,6]. However, as the Ej increases, the proportion of HAGBs in the weld metal decreases, while the coarse weissite-ferrite appears, leading to a deterioration of the impact toughness [7,8,9]. At the same time, the volume fraction of coarse martensite/austenite (M/A) constituents increases significantly while the HAGB spacing increases, thus deteriorating the impact toughness [10,11]. When the Ej is too low, the impact toughness is reduced because of the formation of a large number of bainite and martensite in weld metal [12].
The relationship between Ej and the size or amount of inclusions in the weld metal has also been extensively investigated by researchers [7,8,13,14,15]. Among them, Kluke et al. [13] proposed that the inclusions diameter was proportional to the cube root of the Ej, supported by the Ostwald ripening theory. Large inclusions tend to have a stronger ability to promote ferrite nucleation than small inclusions; however, they also act as initiation points for cleavage fracture [16]. According to these two opposite effects, the size of the inclusions should neither be too large nor too small; otherwise, they will have a negative impact on the impact toughness of the weld metal.
Due to the high mechanical performance standards required in bridge engineering, single-wire submerged arc welding and gas shielded welding have been the main production welding methods, and the development of high-efficiency submerged arc welding technology has been slow in the bridge field. In this regard, to promote the application of high-efficiency welding in the field of bridges, our team developed a submerged arc welding wire by adding some micro-alloy elements based on the C-Si-Mn alloy and using a combination of mechanisms such as fine grain strengthening, phase transformation strengthening, and solid solution strengthening to ensure the weld metal can meet the mechanical properties of bridges under high-heat input. This work systematically investigated the relationship between the microstructure and impact toughness of the weld metal obtained by high-efficiency submerged arc welding wires under different high-heat inputs from the perspectives of microstructure transformation, HAGB ratio, M/A constituents, and inclusions. Thus, the applicable range of high-efficiency welding Ej was obtained by this work to satisfy high-efficiency welding on bridge steel, and a reference basis for high-efficiency welding in the field of bridges was provided by this work.
2. Experimental Procedure
The purpose of this work is to investigate the changes in the microstructure and mechanical properties of the weld metal with heat input changes and to derive the applicable heat input for the high-efficiency submerged arc welding wire. Therefore, high efficiency submerged arc welding wires were used for submerged arc welding with high heat input, followed by sampling of the weld metal and testing the mechanical properties of the weld metal at different high-heat inputs. Finally, the welded metal under different heat inputs was observed and analyzed.
2.1. Welding Tests
Three bridge steel plates were used in the sizes of 300 × 150 × 32 mm and welded using self-developed high-efficiency submerged arc welding wires for Ej = 50, 75, and 100 kJ/cm, respectively. The high-efficiency submerged arc welding steel was melted by a vacuum induction furnace and then underwent forging of the welding wire ingot, hot rolling of the wire rod, rough drawing, fine drawing to φ5.0 mm, and copper plating. The welding parameters are shown in Table 1, and the chemical compositions of the base metal, weld wire, weld metal, and flux are shown in Table 2.

Table 1.
Welding parameters.
Table 2.
The chemical composition of welding flux, base metal, weld wire, and weld metal.
2.2. Mechanical Tests
Three impact specimens were taken for each kind of heat input weld metal and processed into 55 × 10 × 10 mm impact specimens in accordance with the ASTM standard E2298, as shown in Figure 1. The weld metal impact test was performed by the JBN-300B impact tester (Jinan Marxtest Technolggy Co., Ltd, Jinan, China) at a temperature of −40 °C. Three sets of impact tests were conducted on each Ej specimen and averaged to reduce the error.
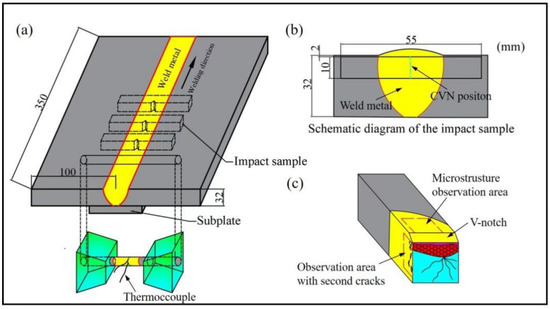
Figure 1.
Schematic diagram of weld joints with welding thermal simulation and standard impact samples (a,b), and microstructure observation area (c).
2.3. Fracture Observation
The fracture surfaces of the impact samples were observed via a scanning electron microscopy (SEM SU5000, HITACHI, Tokyo, Japan). Subsequently, the samples were cut along the cross-section perpendicular to the V-notch as shown in Figure 1c, and the distribution and propagation path of the secondary cracks near the main fracture were observed under the SEM.
2.4. The Determination of Phase Transition Temperature
In order to measure the effect of Ej on the γ→α phase transition temperature Ar3, the thermal expansion curve was recorded using a C-strain gauge, and the beginning and end temperatures of the phase transition from austenite to ferrite at the corresponding cold rate were determined using the tangent method. Figure 1a gives a schematic diagram of the sampling of the specimen for determining the phase change point of the weld metal. One round bar-type sample was taken for each heat input specimen. After the sampling was completed, the weld microstructure of the specimen was etched with a 4% nitric acid alcohol solution. Subsequently, the thermocouple wires were spot welded to the weld metal, as shown in Figure 1a. The Gleeble-3500 thermal simulation tester (Dynamic Systems Inc., New York, NY, USA) was used to conduct the welding thermal cycle from Ej = 50 kJ/cm to 100 kJ/cm on the specimens. Afterwards, the phase transition temperature Ar3 was measured for each Ej sample.
2.5. Microstructure Characterization
The remaining impact samples of three kinds of heat inputs were first cut in the cross-section perpendicular to the fracture surface. Then the specimens were sanded and polished, then etched with a 4% nitric acid alcohol solution. The microstructure was observed by an Olympus BX51M (Olympus, Aizu, Japan). The percentage of the microstructures was calculated using Image-Pro Plus software (Image-Pro ® Plus, Media Cybernetics, Bethesda, MD, USA). The specimens were repolished and etched with LePera solution for 120 s, then the M/A constituents of the specimens were observed under the metallographic microscope. The size and area fraction were statistically calculated by Image-Pro Plus software. TEM slices parallel to the metallographic specimens were obtained by cutting and sanding to 40–50 μm thickness. Small discs of φ3 mm were pressed out of the slices and subsequently thinned using double-jet electrolytic polishing. After the thinning was completed, the typical microstructure of the weld metal was observed by a JEM-2010 high-resolution transmission electron microscopy (TEM, Japan Electronics optics Corporation, Tokyo, Japan). The metallographic specimens were polished again and electrolytically polished using perchloric acid (20%) and methanol (80%) solutions, followed by scanning using the SEM with an electron backscatter diffraction detector in 0.25 μm steps to quantify the crystal orientation of the weld metal. The reported mean equivalent diameter (MED) statistics were the average values of at least 8 electron backscatter diffraction images used. The specimens were sanded and polished again, and then the inclusions in the weld metal were observed via the SEM.
3. Results
3.1. Microstructure Observations of the Weld Metal
The microstructural metallographs and the microstructure percentage under different high-heat inputs are given in Figure 2. Under Ej = 50 kJ/cm, the microstructure was mainly composed of AF and some grain boundary ferrite (GBF), granular bainite (GB), and polygonal ferrite (PF). With increasing Ej, microstructures underwent significant coarsening, and the ferrite side plate (FSP) appeared. This kind of jagged microstructure along the GBF growth toward the interior of the prior austenite grain is very detrimental to the toughness of weld metal. At the same time, with increasing Ej, the percentages of GBF, GB, and PF increased, and the percentage of AF decreased, as shown in Figure 2d.
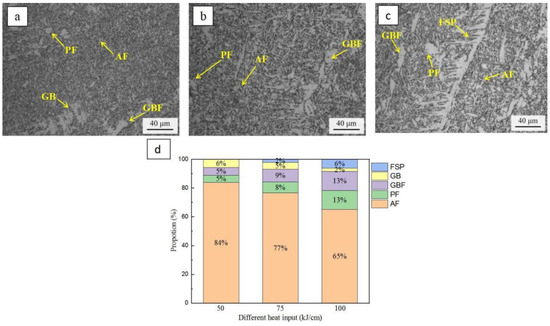
Figure 2.
Microstructure morphologies of 50 kJ/cm (a), 75 kJ/cm (b), 100 kJ/cm (c), and a schematic diagram of the percentage of microstructures (d).
The M/A constituents of the weld metal are shown in Figure 3. Separately, under 10 fields of view, the size and area proportion of more than 300 M/A constituents were statistically calculated by Image-Pro Plus software to minimize local statistics. The statistical results are shown in Table 3. The M/A constituents were small, with an average size of 0.92 μm, and the area proportion was 2.2% under Ej = 50 kJ/cm. However, the average size of inclusions increased significantly to 2.36 μm, and the area proportion increased to 8.3% with the Ej increasing to 100 kJ/cm. At the same time, it can be found that with the increase in Ej, the number of stripy M/A constituents increased.
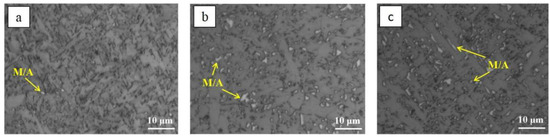
Figure 3.
Four percent LePera’s reagent-etched samples of 50 kJ/cm (a), 75 kJ/cm (b), and 100 kJ/cm (c), where the matrix is gray and the M/A constituents are white.
Table 3.
Quantification results of microstructures in each sample.
The TEM images of the weld metal are presented in Figure 4. As shown in Figure 4, the main microstructure of the weld metal was AF with a little PF. As Ej increased, the size of AF increased significantly, and the number of inclusions decreased while its size increased. By comparison, it was found that not all inclusions produced effective promotion of AF nucleation, and the small-sized inclusions shown in Figure 4a (indicated by the blue arrows) were engulfed by the growth of ferrite. The larger inclusions (indicated by the yellow arrows) had a stronger tendency to stimulate the nucleation of AF. Ferrite laths nucleated on larger-sized inclusions and grew radiologically. Subsequently, neighboring ferrite laths nucleated on the previously existing laths by mutual induction, similar to the previous study [17].
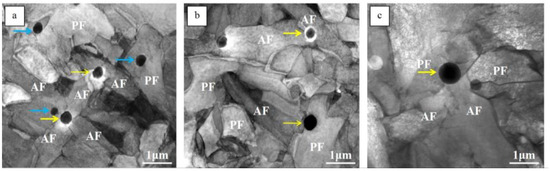
Figure 4.
TEM micrographs of 50 kJ/cm (a), 75 kJ/cm (b), and 100 kJ/cm samples (c).
The EDS mapping image of a typical inclusion, as shown in Figure 5, revealed that the inclusions were composite oxide and sulfide composed of Al, Ti, Si, and Mn.
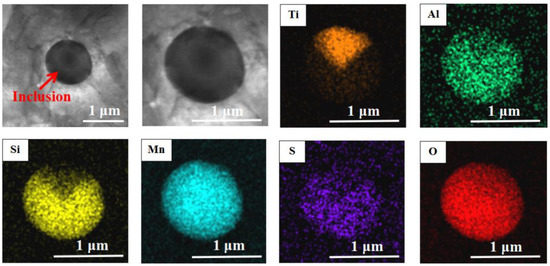
Figure 5.
Element distribution by EDS of inclusions in weld metal.
The distribution of inclusions in the weld metal is shown in Figure 6, where the inclusions that stimulate AF nucleation are circled in yellow. All inclusions were counted under 25 fields of scanning electron microscopy using Image-Pro Plus software to minimize errors. With Ej increasing from 50 kJ/cm to 100 kJ/cm, the total number of inclusions decreased significantly. The average size of inclusions increased from 0.59 to 1.26 μm, and the number of large-sized inclusions increased, with the maximum size reaching about 2.5 μm.
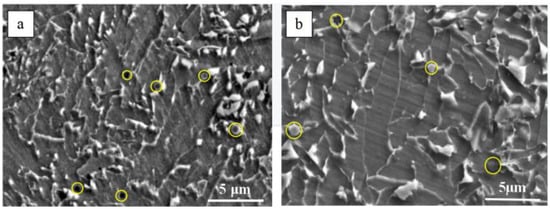
Figure 6.
Observations on the inclusion of a 50 kJ/cm sample (a) and a 100 kJ/cm sample (b).
3.2. Crystallographic Characteristics of the Weld Metal
Inverse pole figures (IPF) were obtained using electron backscatter diffraction, as shown in Figure 7a–c. Previous studies [18,19,20] usually defined the threshold of HAGB at 15° because grain boundaries with misorientation tolerance angles (MTA) greater than 15° have higher energy to effectively force the deflection or termination of crack propagation. Therefore, in this paper, grain boundaries with an MTA less than 15° between adjacent grains were defined as low-angle grain boundaries (LAGBs), while grain boundaries were defined as high-angle grain boundaries (HAGBs) when the MTA was higher than 15°. The HAGBs were marked with black lines in Figure 7. As shown in Figure 7, HAGBs were formed between adjacent AF or PF, which could effectively hinder crack propagation [21].
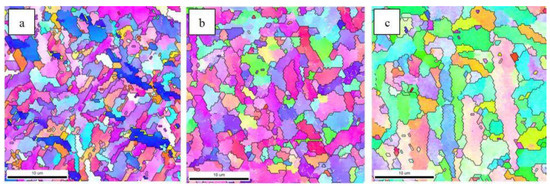
Figure 7.
Inverse pole figures of 50 kJ/cm (a), 75 kJ/cm (b), and 100 kJ/cm sample (c).
As shown in Figure 8a, the MED defined by different MTAs increased with the increase in MTA. With the increase in Ej, the MED defined by MTA ≥ 15° (MEDMTA ≥ 15°) increased from 3.13 μm to 5.28 μm. Figure 8b gives the percentage of HAGBs. It can be found that with the increase in Ej, the percentage of HAGBs decreased from 46.3% to 24.1%.
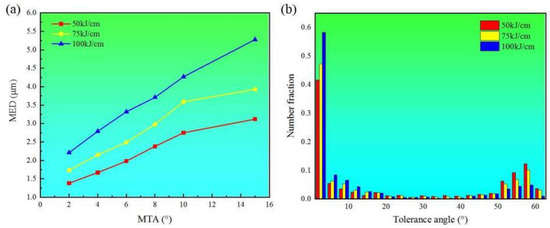
Figure 8.
MED varied with MTA (a) and the distribution of boundary misorientation (b).
3.3. Impact Toughness and Fracture Behavior of the Weld Metal
Table 4 gives the impact energy of the weld metal samples, and the average value decreased from 130 J to 38 J with Ej increasing from 50 kJ/cm to 100 kJ/cm. As shown in Figure 9, the fibrous zone was more dominant under Ej = 50 kJ/cm, and this zone corresponds to the ductile crack with a higher energy consumption. Accordingly, the cleavage surfaces were found to exist in the region away from the Charpy V-notch, i.e., the cleavage fracture occurred later under Ej = 50 kJ/cm. The cleavage fracture corresponds to the stage of crack instability propagation, and the energy consumed is low. With the increase in Ej, the area of the fibrous zone was significantly reduced, and the cleavage surfaces were found close to the V-notch, i.e., the onset of cleavage fracture was significantly advanced. Meanwhile, the fracture surface was very flat, which corresponded to the lower impact energy.
Table 4.
CVN impact energy at −40 °C of weld metal under different Ej.
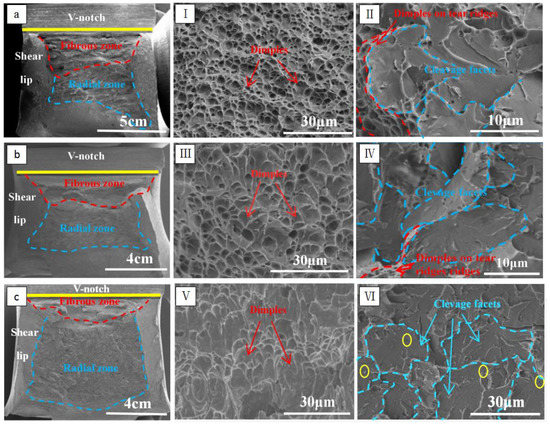
Figure 9.
Fracture surfaces of the weld metal with Ej = 50 kJ/cm (a), 75 kJ/cm (b), 100 kJ/cm (c), and a high magnification image of the fibrous zone (I/III/V) and radial zone (II/IV/VI).
The fibrous and radial zones of the three specimens were further observed separately by magnification, as shown in Figure 9I–VI. For the sample of Ej = 50 kJ/cm, the fiber zone consisted of small, uniform, and deep dimples, while the radial zone had small cleavage surfaces, and the cleavage surfaces extended from the cleavage crack to the periphery, forming a cleavage step when encountering HAGBs. Tear ridges were found at the edges of the cleavage surface, indicating a higher impediment to crack propagation. With the increase in Ej, the dimples in the fiber zone became shallower and larger and developed into a parabolic shape, which means that the degree of plastic deformation during the ductile fracture stage was reduced. At the same time, the sizes of the cleavage surfaces in the radial zone significantly increased, and the tear ridges were almost invisible, implying that crack propagation became easier during the cleavage fracture [22]. It was worth noting that when Ej increased to 100 kJ/cm, many large-size inclusions, or M/A constituents, were formed and acted as crack initiation sources for the various cleavage surfaces. Accordingly, it could be inferred that the generation of these coarse M/A constituents and inclusions was inextricably linked to the reduction in impact toughness of the specimens, which will be discussed later.
In order to further observe and analyze the initiation and propagation of cracks under different Ej, specimens were cut from the impact fracture section to observe the morphology and distribution of secondary cracks.
As shown in Figure 10a, a small number of microvoids were observed in the fracture cross-section of the 50 kJ/cm sample in the fibrous region. The growth and coalescence of the microvoids were limited by the HAGBs, such as the surrounding AF. Meanwhile, as the large M/A constituents and inclusions that promoted the nucleation of microvoids were less, the distance between microvoids was larger, and the energy required for microvoid coalescence was correspondingly higher. As a result, the size of the microvoids was relatively small under Ej = 50 kJ/cm, and the coalescence and growth of microvoids were hardly seen. For the 100 kJ/cm sample, at the fiber zone, as shown in Figure 10b, it was found that many microvoids were nucleated at the interface of M/A constituents or inclusions and matrix, and the microvoids were close to each other and appeared to grow and coalesce.
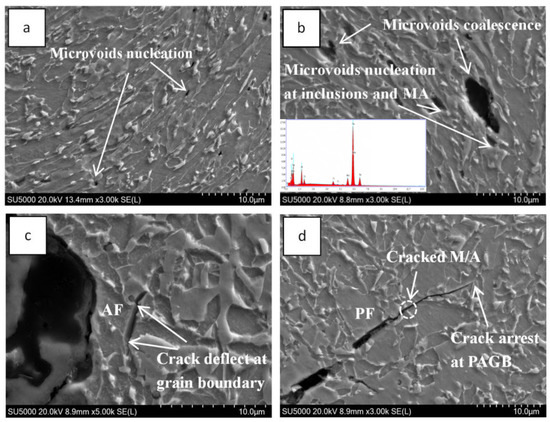
Figure 10.
SEM observations of microvoids and crack morphologies at Ej = 50 kJ/cm (a,c) and 100 kJ/cm (b,d).
Under 50 kJ/cm, the radiation zone was relatively small, and the propagation paths of secondary cracks were short, as shown in Figure 10c. When secondary cracks propagated on the fine AF, there was blunting and deflection at the grain boundaries, indicating that large amounts of AF have a strong arresting effect on crack propagation [23]. Under 100 kJ/cm, the number and size of secondary cracks in the radial zone increased significantly. As shown in Figure 10d, the long strip crack nucleated along the interface between the ferrite matrix and M/A constituents. The secondary crack propagated straight through the ferrite grain and the elongated M/A, eventually deflecting at the grain boundary and arresting at the prior austenite grain boundary. The overall straightness of the cracks indicated that the surrounding microstructures had a weak hindering effect on the cracks propagation.
4. Discussion
4.1. Effect of Ej on the Inclusions of the Weld Metal
The presence of convective flow of liquid in the melt pool leads to collisions and aggregation between the inclusions, which are called gradient collisions, resulting in coarse inclusions. Therefore, with the increase in Ej, the convective flow of fluid in the weld pool was enhanced. Accordingly, the velocity gradient in the weld pool was increased, increasing the possibility of collision and aggregation of inclusions. That is the main reason why the number of inclusions in the weld metal decreased significantly, and the size coarsened obviously as Ej increased from 50 kJ/cm to 100 kJ/cm.
Ostwald ripening may occur during the final stages of cooling in the weld pool, allowing further coarsening of the inclusions [16,24,25]. Kluken et al. [24] divided the melt pool into two regions, i.e., the “hot” and “cold” parts, as shown in Figure 11. The collision and aggregation of inclusions and the floating processes mainly occurred in the hot part of the weld pool. In contrast, in the cold part, collisions and aggregation of inclusions were less likely to occur due to the low temperature gradient and the low convective intensity of the weld pool. Therefore, in the cold part, Ostwald ripening was the main way for the growth of inclusions. The growth of large inclusions was at the expense of small inclusions during Ostwald ripening, and there was a decrease in the density of inclusions. The kinetics of Oswald ripening can be calculated as shown in Equation (1).
where dini is the average initial diameter; d is the average diameter of inclusions after a time t; VM is the molar volume of oxide; DO is the diffusivity of oxygen; and CO is the nominal oxygen concentration of the liquid.
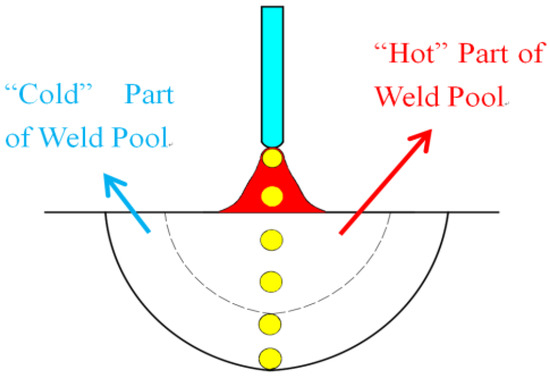
Figure 11.
Schematic diagram of two main reaction zones in the weld pool.
At the same time, with the increase in Ej, the cooling rate of the weld pool became slower, and the nucleation rate of the first formed oxide inclusions was very low due to the low subcooling. Since the oxides formed first grew to larger sizes at high temperatures and acted as heterogeneous sites for subsequent oxide nucleation, their reduced number further led to a lower number of inclusions. At the same time, with the increase of Ej, the growth of inclusions was also promoted at high temperatures, so that the number of inclusions decreased with the increase of Ej but the size coarsened.
In order to further analyze the relationship between inclusions and AF nucleation, the rates of ferrite nucleation promoted by inclusions at different sizes were calculated, as shown in Figure 12. (Inclusions smaller than 0.2 μm were neglected). The increase in the size of inclusions increased their ability to stimulate AF nucleation, which is consistent with the results of previous studies [16,26,27]. However, an interesting phenomenon is that the size of inclusions in the weld metal of a 50 kJ/cm sample could stimulate AF nucleation at almost 100% when reaching about 1 μm, while the size of inclusions needed to reach about 1.6 μm to stimulate AF nucleation at almost 100% with the Ej up to 100 kJ/cm. That means the ability to stimulate AF nucleation of inclusions in the weld metal decreased with the increase in Ej. With the increase in Ej, the increased transformation temperature from austenite to ferrite made the formation of GBF and PF in the weld metal easier than AF. At the same time, as the size of the inclusion increases, there will be relaxation of stress around the interface between large-size inclusions and austenite [28,29,30,31]. These factors all lead to a decrease in the ability of AF nucleation induced by inclusions in weld metal and an increase in Ej.
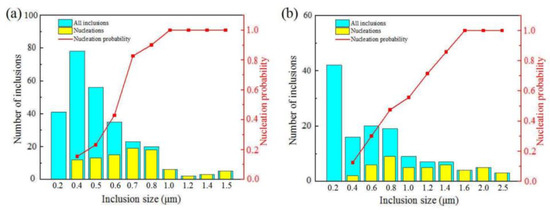
Figure 12.
Size and number distribution of inclusions and statistics of nucleation rate of AF promoted by inclusions with different sizes under different Ej: (a) 50 kJ/cm and (b) 100 kJ/cm.
The inclusions formed in the weld metal can either contribute to the nucleation of AF, increasing the percentage of HAGB, thus improving the impact toughness [23], or they can act as crack sources for the cleavage fracture, which makes the cleavage fracture occur prematurely and reduce the impact toughness [16,32,33], especially when the inclusions are larger than 1 μm [34], which will be discussed further in the subsequent sections.
4.2. Effect of Ej on the Microstructures of the Weld Metal
To better understand the influence of various Ej on final microstructures, the continuous cooling expansion curves of each specimen were measured. Subsequently, the phase transition temperatures (Ar3) from austenite to ferrite were measured using the tangent method, as shown in Figure 13. As Ej increased from 50 kJ/cm to 100 kJ/cm, Ar3 decreased from 701 °C to 572 °C.
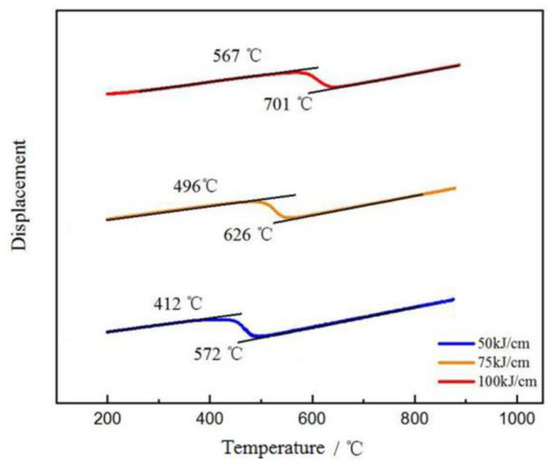
Figure 13.
Dilatometric curves of the weld metal obtained at different Ej.
The phase transition from austenite to ferrite began with the formation of grain boundary ferrite (GBF) along the austenite grain boundaries at a higher transition temperature. The increase in Ej led to a coarsening of GBF, and the volume fraction of GBF in the weld metal increased [7]. Due to the high formation temperature of GBF, its C atoms were diffused more sufficiently into the surrounding environment, and the GBF was soft. Under the impact load, GBF deformed firstly resulting in stress concentration. At the same time, because GBF was continuously distributed in a network along the prior austenite grain boundary, it often promoted crack propagation [35]. So, the increase in its size and proportion deteriorates the impact toughness of the weld metal. With the increase in Ej, the ferrite sideplate (FSP) from the GBF side grew in a pickaxe shape toward the austenite interior. This kind of coarse microstructure cuts the grains apart and has a very negative effect on the toughness of the weld metal.
With further cooling, PF, AF, and GB were formed in austenite. The formation of PF is a diffusion phase transition controlled by the diffusion and migration of solute atoms near the phase interface. When welded at 50 kJ/cm, the lower transformation temperature (572 °C) hindered the diffusion of carbon atoms and inhibited the formation of PF. The higher undercooling was conducive to the transformation of AF and GB. The expression of the AF nucleation rate is shown in Equation (2) [29,36].
where C3 is related to the number of AF nucleation sites, and C2 and C4 are constants based on experimental measurements. In this work, for the AF phase transition, C3 is related to the number density of effective inclusions. T is the temperature in Kelvin, and is the driving force of the transformation from austenite to ferrite. At lower Ej, the number of inclusions was large and the value of C3 was high, which favored AF nucleation. Therefore, the AF content was higher at a lower Ej of 50 kJ/cm. As the Ej increased, phase transition temperatures (Ar3) increased, and the C atoms diffused more fully, leading to a significant increase in the PF content. At the same time, the various microstructures also underwent significant coarsening with sufficient diffusion of C atoms [37]. The microstructure of AF is small, and AF has a precise interlocking structure, forming HAGBs between each other. Therefore, the reduction of AF content and the coarsening of the microstructure reduced the hindering effect of weld metal on crack propagation.
During the cooling process of the welding thermal cycle, with the transformation from austenite to ferrite, C diffuses from AF, PF, and GBF to the residual austenite γ′, thus causing the enrichment of C in γ′ and improving the stability of γ′ [38]. On further cooling to near room temperature, γ′ transformed into M/A constituents. When Ej was low, the diffusion distance of C was shorter because of the decreased diffusion coefficient due to the faster cooling rate [37]. Accordingly, the size of the M/A constituents formed at the grain boundaries was small and mainly point M/A. With the increase of Ej, C atoms had sufficient time and dynamics to diffuse; thus, the number and size of M/A constituents increased, while more elongated M/A constituents were formed along the grain boundaries between the ferrite [39,40]. The corresponding schematic representation of the microstructural transformation is shown in Figure 14.
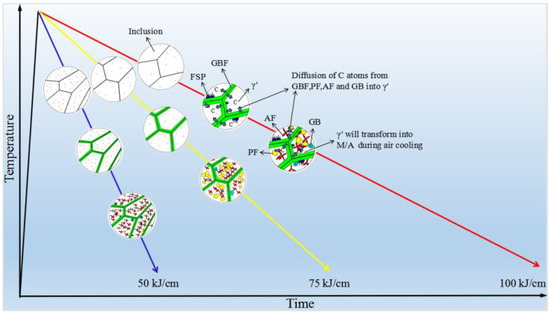
Figure 14.
Schematically illustrating microstructural transformation under different Ej.
4.3. Effects of Ej on the Impact Toughness and Fracture Behaviors of the Weld Metal
Due to the obvious hardness difference between the M/A constituents, inclusions, and the ferrite matrix, when the stress was conducted, the ferrite matrix with less hardness deformed plastically first, and a large number of dislocations accumulated at the M/A constituents and inclusions or near their interfaces with the surrounding ferrite matrix, resulting in stress concentration and thus causing microcrack initiation. The kernel average misorientation map could be used to evaluate the dislocation density and estimate the stress distribution state of the material [41]. In this paper, it was mainly used to analyze the magnitude of local stress. The band contrast maps and kernel average misorientation maps are shown in Figure 15, which means that the stress concentration mainly occurred at M/A constituents or at the M/A–matrix interface in the 100 kJ/cm sample. The M/A constituents of the 50 kJ/cm sample were small, and there was rarely a high stress concentration. The degree of stress concentration increased significantly with the size of the M/A constituents. Long-strip M/A constituents produced high stress concentrations, as did large-sized blocky M/A constituents.
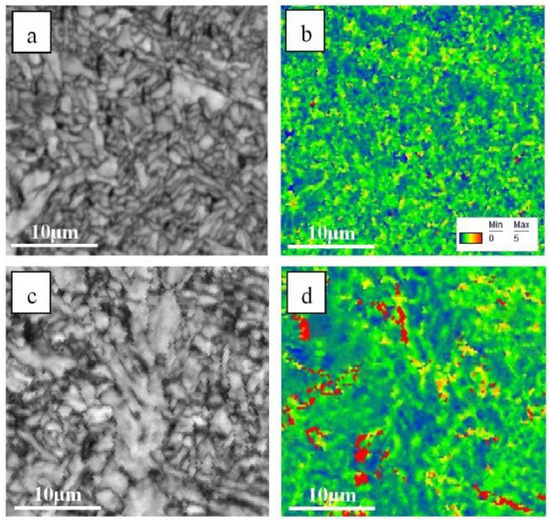
Figure 15.
Band contrast map and kernel average misorientation map of the 50 kJ/cm (a,b) and 100 kJ/cm (c,d) samples.
As shown in Figure 10, with the increase in Ej, the cleavage fracture occurred near the V-notch, i.e., the occurrence of the cleavage fracture was advanced. At the same time, it was observed that a large number of cleavage surfaces of the 100 kJ/cm sample nucleated at the large size inclusions and M/A constituents as shown in Figure 16. The bulging of the M/A constituent at the origin of the cleavage surface indicated that crack initiation should be due to the debonding of the M/A constituent at the interface with the ferrite matrix [11]. Therefore, with the increase in Ej, the coarsening of inclusions and M/A constituents significantly reduced the cleavage crack initiation energy.
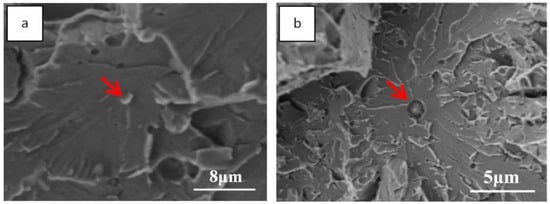
Figure 16.
M/A constituents (a) and inclusions (b) acting as the nucleation site for cleavage fracture on the 100 kJ/cm sample.
According to Griffith’s theory [42], the critical stress for cleavage crack instability propagation can be expressed by the following equation.
where σ′c is the critical stress, E is the Young’s modulus, γ′ is the effective surface energy of the fracture, υ is the Poisson’s ratio, and d is the microcrack size, where d0 can be regarded as the maximum width of the M/A constituents or inclusions [43]. From Equation (3), it can be seen that the critical stress is mainly related to the effective surface energy of ferrite and the size of M/A constituents or inclusions. The smaller the size of M/A constituents or inclusions, the larger the critical stress for cleavage cracks and instability propagation. With the increase of Ej, the stress concentration at the large-size M/A constituents and inclusions increased significantly, and crack initiation as well as propagation became easier.
At the same time, the microstructure coarsening caused by the increase in Ej also played an important role in deteriorating the impact toughness. The research results of Cao and Martín-Meizoso A et al. [44,45,46] show that the cleavage fracture can be divided into the following processes: First, microcracks nucleate at the hardening phase or at the interface between the hardening phase and the matrix and then pass through the hardening phase or the interface between the hardening phase and the matrix. Second, microcracks propagate in the matrix and reach the HAGBs of the matrix. Finally, the microcracks pass through the HAGBs and coalesce, leading to the final, complete fracture.
Based on the previous studies and combined with the experimental results of this work, the schematic diagram of cleavage crack initiation and propagation of the impact samples is shown in Figure 17.
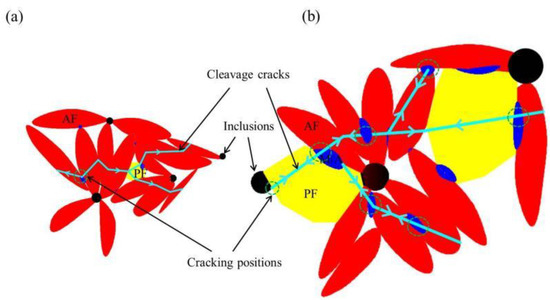
Figure 17.
Schematic diagram of cleavage microcrack initiation and propagation in the weld metal under 50 kJ/cm (a) and 100 kJ/cm (b).
When the specimen was subjected to the impact load, a large number of dislocations were generated that were easier to slip in AF, which was conducive to stress release [47]. AF reduces stress concentration and crack initiation tendency due to its fine structure and superior deformation ability. The size of M/A constituents and inclusions was small under Ej = 50 kJ/cm, and the nucleation of microcracks was difficult. At the same time, the grain size of AF was small, and the HAGBs accounted for a high proportion. Therefore, in the subsequent process of microcrack propagation, the number of times that cracks met with the HAGBs increased, which consumed more energy.
However, with the increase of Ej to 100 kJ/cm, the proportion of AF decreased and the size of M/A constituents and inclusions increased, which makes the initiation and propagation of cleavage cracks very easy. This was crucial because it directly determined that the ductile fracture zone was very small, as shown in Figure 10, which means that the cleavage fracture occurred much earlier. At the same time, a serious weakening of the arresting effect on crack propagation occurred as the grain size of the weld metal coarsened and the proportion of HAGBs decreased. As the external force was applied, a large number of microcracks nucleated on many large hardening phases and propagated at the same time. These cracks interconnected without going through many HAGBs, leading to the catastrophic failure of the sample.
5. Conclusions
In general, the influence of Ej on the microstructure and impact toughness in the weld metal of high-efficiency submerged arc welding wires has been studied with the following conclusions:
- The increase in Ej from 50 kJ/cm to 100 kJ/cm led to a significant reduction in the number of inclusions in the weld metal and a significant increase in their size from 0.59 to 1.26 μm. The ability to stimulate AF nucleation of inclusions was decreased with the increase of Ej due to the increased transformation temperature from austenite to ferrite and the relaxation of stress around the interface between large-size inclusions and austenite;
- The microstructure of the weld metal welded by the high-efficiency submerged arc welding wires included GBF, FSP, PF, AF, GB, and M/A constituents. With the Ej increasing from 50 kJ/cm to 100 kJ/cm, the MEDMTA ≥ 15° of the weld metal increased from 3.1 to 5.3 μm. At the same time, AF content decreased from 84% to 65%, with an increase in PF from 5% to 13%. The average size of M/A constituents increased from 0.92 to 2.36 μm.
- The high-efficiency submerged arc welding wires studied in this work are suitable for Ej ≤ 75 kJ/cm. With the increase in Ej from 50 kJ/cm to 100 kJ/cm, the impact absorption energy decreased significantly from 130 J to 38 J. The fracture behavior of weld metal changed from mainly ductile fracture to mainly brittle fracture. With the increase in Ej, the local stress around the large size inclusions and M/A constituents was greatly improved, while the fraction of HAGBs decreased from 46.3% to 24.1%. These two factors led to the premature cleavage fracture of weld metal, and the impact energy decreased significantly.
Author Contributions
Conceptualization, Q.W. and J.L.; software, B.H.; validation, L.Z.; formal analysis, F.L.; investigation, J.H.; resources, Q.W.; data curation, J.L.; writing—original draft preparation, J.L.; writing—review and editing, J.L. and Q.W.; visualization, J.L.; supervision, Q.W.; project administration, Q.W.; funding acquisition, Q.W. and R.L. All authors have read and agreed to the published version of the manuscript.
Funding
This work was funded by the National Natural Science Foundation of China (52127808), the Innovation Ability Promotion Program of Hebei (22567609H), and the National Key Research and Development Program of China (Grant No. 2017YFB0304800 and Grant No. 2017YFB0304802 for the second subproject).
Institutional Review Board Statement
Not applicable.
Informed Consent Statement
Not applicable.
Data Availability Statement
Not applicable.
Conflicts of Interest
The authors declare no conflict of interest.
References
- Ribic, B.; Palmer, T.A.; DebRoy, T. Problems and Issues in Laser-Arc Hybrid Welding. Int. Mater. Rev. 2009, 54, 223–244. [Google Scholar] [CrossRef]
- Evans, G.M. The Effect of Heat Input on the Microstructure and Properties of C-Mn All-Weld-Metal Deposits. Met. Constr. 1982, 61, 125S–132S. [Google Scholar]
- Qiao, M.; Fan, H.; Shi, G.; Wang, L.; Wang, Q.; Wang, Q.; Liu, R. Effect of Welding Heat Input on Microstructure and Impact Toughness in the Simulated CGHAZ of Low Carbon Mo-V-Ti-N-B Steel. Metals 2021, 11, 1997. [Google Scholar] [CrossRef]
- Wu, H.; Xia, D.; Ma, H.; Du, Y.; Gao, C.; Gao, X.; Du, L. Study on Microstructure Characterization and Impact Toughness in the Reheated Coarse-Grained Heat Affected Zone of V-Microalloyed Steel. J. Mater. Eng. Perform. 2022, 31, 376–382. [Google Scholar] [CrossRef]
- Stornelli, G.; Tselikova, A.; Mirabile Gattia, D.; Mortello, M.; Schmidt, R.; Sgambetterra, M.; Testani, C.; Zucca, G.; Di Schino, A. Influence of Vanadium Micro-Alloying on the Microstructure of Structural High Strength Steels Welded Joints. Materials 2023, 16, 2897. [Google Scholar] [CrossRef]
- Narimani, M.; Hajjari, E.; Eskandari, M.; Szpunar, J.A. Electron Backscattered Diffraction Characterization of S900 HSLA Steel Welded Joints and Evolution of Mechanical Properties. J. Mater. Eng. Perform. 2022, 31, 3985–3997. [Google Scholar] [CrossRef]
- Viano, D.M.; Ahmed, N.U.; Schumann, G.O. Influence of Heat Input and Travel Speed on Microstructure and Mechanical Properties of Double Tandem Submerged Arc High Strength Low Alloy Steel Weldments. Sci. Technol. Weld. Join. 2000, 5, 26–34. [Google Scholar] [CrossRef]
- Wen, C.; Wang, Z.; Deng, X.; Wang, G.; Misra, R.D.K. Effect of Heat Input on the Microstructure and Mechanical Properties of Low Alloy Ultra-High Strength Structural Steel Welded Joint. Steel Res. Int. 2018, 89, 1700500. [Google Scholar] [CrossRef]
- Li, W.; Cao, R.; Zhu, W.; Guo, X.; Jiang, Y.; Chen, J. Microstructure Evolution and Impact Toughness Variation for High Strength Steel Multi-Pass Weld Metals with Various Cooling Rates. J. Manuf. Process. 2021, 65, 245–257. [Google Scholar] [CrossRef]
- Wang, X.L.; Tsai, Y.T.; Yang, J.R.; Wang, Z.Q.; Li, X.C.; Shang, C.J.; Misra, R.D.K. Effect of Interpass Temperature on the Microstructure and Mechanical Properties of Multi-Pass Weld Metal in a 550-MPa-Grade Offshore Engineering Steel. Weld World 2017, 61, 1155–1168. [Google Scholar] [CrossRef]
- Lan, L.; Qiu, C.; Song, H.; Zhao, D. Correlation of Martensite–Austenite Constituent and Cleavage Crack Initiation in Welding Heat Affected Zone of Low Carbon Bainitic Steel. Mater. Lett. 2014, 125, 86–88. [Google Scholar] [CrossRef]
- Mao, G.; Cayron, C.; Cao, R.; Logé, R.; Chen, J. The Relationship between Low-Temperature Toughness and Secondary Crack in Low-Carbon Bainitic Weld Metals. Mater. Charact. 2018, 145, 516–526. [Google Scholar] [CrossRef]
- Kluken, A.O. Grong Mechanisms of Inclusion Formation in Al−Ti−Si−Mn Deoxidized Steel Weld Metals. Metall. Trans. A 1989, 20, 1335–1349. [Google Scholar] [CrossRef]
- Lan, L.; Qiu, C.; Zhao, D.; Gao, X.; Du, L. Analysis of Martensite–Austenite Constituent and Its Effect on Toughness in Submerged Arc Welded Joint of Low Carbon Bainitic Steel. J. Mater. Sci. 2012, 47, 4732–4742. [Google Scholar] [CrossRef]
- Chu, Q.; Xu, S.; Tong, X.; Li, J.; Zhang, M.; Yan, F.; Zhang, W.; Bi, Z.; Yan, C. Comparative Study of Microstructure and Mechanical Properties of X80 SAW Welds Prepared Using Different Wires and Heat Inputs. J. Mater. Eng Perform. 2020, 29, 4322–4338. [Google Scholar] [CrossRef]
- Lan, L.; Kong, X.; Qiu, C.; Zhao, D. Influence of Microstructural Aspects on Impact Toughness of Multi-Pass Submerged Arc Welded HSLA Steel Joints. Mater. Des. 2016, 90, 488–498. [Google Scholar] [CrossRef]
- Bhadeshia, H.K.D.H.; Christian, J.W. Bainite in Steels. MTA 1990, 21, 767–797. [Google Scholar] [CrossRef]
- Fan, H.; Shi, G.; Peng, T.; Wang, Q.; Wang, L.; Wang, Q.; Zhang, F. N-Induced Microstructure Refinement and Toughness Improvement in the Coarse Grain Heat-Affected Zone of a Low Carbon Mo–V–Ti–B Steel Subjected to a High Heat Input Welding Thermal Cycle. Mater. Sci. Eng. A 2021, 824, 141799. [Google Scholar] [CrossRef]
- Shi, G.; Zhao, H.; Zhang, S.; Wang, Q.; Zhang, F. Microstructural Characteristics and Impact Fracture Behaviors of Low-Carbon Vanadium-Microalloyed Steel with Different Nitrogen Contents. Mater. Sci. Eng. A 2020, 769, 138501. [Google Scholar] [CrossRef]
- Zhang, Y.; Shi, G.; Sun, R.; Guo, K.; Zhang, C.; Wang, Q. Effect of Si Content on the Microstructures and the Impact Properties in the Coarse-Grained Heat-Affected Zone (CGHAZ) of Typical Weathering Steel. Mater. Sci. Eng. A 2019, 762, 138082. [Google Scholar] [CrossRef]
- Zhang, J.; Xin, W.; Ge, Z.; Luo, G.; Peng, J. Effect of High Heat Input Welding on the Microstructures, Precipitates and Mechanical Properties in the Simulated Coarse Grained Heat Affected Zone of a Low Carbon Nb-V-Ti-N Microalloyed Steel. Mater. Charact. 2023, 199, 112849. [Google Scholar] [CrossRef]
- Lan, L.; Qiu, C.; Zhao, D.; Gao, X.; Du, L. Microstructural Characteristics and Toughness of the Simulated Coarse Grained Heat Affected Zone of High Strength Low Carbon Bainitic Steel. Mater. Sci. Eng. A 2011, 529, 192–200. [Google Scholar] [CrossRef]
- Lan, L.; Qiu, C.; Zhao, D.; Gao, X.; Du, L. Analysis of Microstructural Variation and Mechanical Behaviors in Submerged Arc Welded Joint of High Strength Low Carbon Bainitic Steel. Mater. Sci. Eng. A 2012, 558, 592–601. [Google Scholar] [CrossRef]
- Babu, S.S.; David, S.A.; DebRoy, T. Coarsening of Oxide Inclusions in Low Alloy Steel Welds. Sci. Technol. Weld. Join. 1996, 1, 17–27. [Google Scholar] [CrossRef]
- Lindborg, U.; Torssell, K. A Collision Model for the Growth and Separation of Deoxidation Products. Trans. Metall. Soc. AIME 1968, 242, 94–102. [Google Scholar]
- Ricks, R.A.; Howell, P.R.; Barritte, G.S. The nature of acicular ferrite in HSLA steel weld metals. J. Mater. Sci. 1982, 17, 732–740. [Google Scholar] [CrossRef]
- Lee, T.-K.; Kim, H.J.; Kang, B.Y.; Hwang, S.K. Effect of Inclusion Size on the Nucleation of Acicular Ferrite in Welds. ISIJ Int. 2000, 40, 1260–1268. [Google Scholar] [CrossRef]
- Sarma, D.S.; Karasev, A.V.; Jönsson, P.G. On the Role of Non-Metallic Inclusions in the Nucleation of Acicular Ferrite in Steels. ISIJ Int. 2009, 49, 1063–1074. [Google Scholar] [CrossRef]
- Babu, S.S. The Mechanism of Acicular Ferrite in Weld Deposits. Curr. Opin. Solid State Mater. Sci. 2004, 8, 267–278. [Google Scholar] [CrossRef]
- Gregg, J.M.; Bhadeshia, H. Solid-State Nucleation of Acicular Ferrite on Minerals Added to Molten Steel. Acta Mater. 1997, 45, 739–748. [Google Scholar] [CrossRef]
- Pan, T.; Yang, Z.G.; Bai, B.Z.; Fang, H.S. Study of thermal stress and strain energy in γ-fe matrix around inclusion caused by thermal coefficient difference. Acta Met. Sin. 2003, 39, 1037–1042. [Google Scholar]
- Tweed, J.H.; Knott, J.F. Micromechanisms of failure in C Mn weld metals. Acta Metall. 1987, 35, 1401–1414. [Google Scholar] [CrossRef]
- Stone, V.; Cox, T.B.; Low, J.R.; Psioda, J.S. Microstructural Aspects of Fracture by Dimpled Rupture. Int. Mater. Rev. 1985, 30, 157–180. [Google Scholar] [CrossRef]
- Avazkonandeh-Gharavol, M.H.; Haddad-Sabzevar, M.; Haerian, A. Effect of Copper Content on the Microstructure and Mechanical Properties of Multipass MMA, Low Alloy Steel Weld Metal Deposits. J. Mater. Sci. 2009, 30, 1902–1912. [Google Scholar] [CrossRef]
- Wang, X.L.; Nan, Y.R.; Xie, Z.J.; Tsai, Y.T.; Yang, J.R.; Shang, C.J. Influence of Welding Pass on Microstructure and Toughness in the Reheated Zone of Multi-Pass Weld Metal of 550 MPa Offshore Engineering Steel. Mater. Sci. Eng. A 2017, 702, 196–205. [Google Scholar] [CrossRef]
- Rees, G.I.; Bhadeshia, H.K.D.H. Bainite Transformation Kinetics Part 1 Modified Model. Mater. Sci. Technol. 1992, 8, 985–993. [Google Scholar] [CrossRef]
- Wang, L.; Fan, H.; Shi, G.; Wang, Q.; Wang, Q.; Zhang, F. Effect of Ferritic Morphology on Yield Strength of CGHAZ in a Low Carbon Mo-V-N-Ti-B Steel. Metals 2021, 11, 1863. [Google Scholar] [CrossRef]
- Zhang, S.; Liu, K.; Chen, H.; Xiao, X.; Wang, Q.; Zhang, F. Effect of Increased N Content on Microstructure and Tensile Properties of Low-C V-Microalloyed Steels. Mater. Sci. Eng. A 2016, 651, 951–960. [Google Scholar] [CrossRef]
- Wang, Z.; Shi, M.; Tang, S.; Wang, G. Effect of Heat Input and M-A Constituent on Microstructure Evolution and Mechanical Properties of Heat Affected Zone in Low Carbon Steel. J. Wuhan Univ. Technol.-Mat. Sci. Edit. 2017, 32, 1163–1170. [Google Scholar] [CrossRef]
- Luo, X.; Chen, X.; Wang, T.; Pan, S.; Wang, Z. Effect of Morphologies of Martensite–Austenite Constituents on Impact Toughness in Intercritically Reheated Coarse-Grained Heat-Affected Zone of HSLA Steel. Mater. Sci. Eng. A 2018, 710, 192–199. [Google Scholar] [CrossRef]
- Shi, Z.; Wang, R.; Su, H.; Chai, F.; Wang, Q.; Yang, C. Effect of Nitrogen Content on the Second Phase Particles in V–Ti Microalloyed Shipbuilding Steel during Weld Thermal Cycling. Mater. Des. 2016, 96, 241–250. [Google Scholar] [CrossRef]
- Babu, S.S.; David, S.A.; Vitek, J.M.; Mundra, K.; DebRoy, T. Development of Macro- and Microstructures of Carbon–Manganese Low Alloy Steel Welds: Inclusion Formation. Mater. Sci. Technol. 1995, 11, 186–199. [Google Scholar] [CrossRef]
- Zhao, J.; Hu, W.; Wang, X.; Kang, J.; Yuan, G.; Di, H.; Misra, R.D.K. Effect of Microstructure on the Crack Propagation Behavior of Microalloyed 560MPa (X80) Strip during Ultra-Fast Cooling. Mater. Sci. Eng. A 2016, 666, 214–224. [Google Scholar] [CrossRef]
- Cao, R.; Li, J.; Liu, D.S.; Ma, J.Y.; Chen, J.H. Micromechanism of Decrease of Impact Toughness in Coarse-Grain Heat-Affected Zone of HSLA Steel with Increasing Welding Heat Input. Metall. Mater. Trans. A 2015, 46, 2999–3014. [Google Scholar] [CrossRef]
- Martín-Meizoso, A.; Ocaña-Arizcorreta, I.; Gil-Sevillano, J.; Fuentes-Pérez, M. Modelling Cleavage Fracture of Bainitic Steels. Acta Metall. Et Mater. 1994, 42, 2057–2068. [Google Scholar] [CrossRef]
- Lambert-Perlade, A.; Gourgues, A.F.; Besson, J.; Sturel, T.; Pineau, A. Mechanisms and Modeling of Cleavage Fracture in Simulated Heat-Affected Zone Microstructures of a High-Strength Low Alloy Steel. Metall. Mater. Trans. A 2004, 35, 1039–1053. [Google Scholar] [CrossRef]
- Xiong, Z.; Liu, S.; Wang, X.; Shang, C.; Li, X.; Misra, R.D.K. The Contribution of Intragranular Acicular Ferrite Microstructural Constituent on Impact Toughness and Impeding Crack Initiation and Propagation in the Heat-Affected Zone (HAZ) of Low-Carbon Steels. Mater. Sci. Eng. A 2015, 636, 117–123. [Google Scholar] [CrossRef]


Disclaimer/Publisher’s Note: The statements, opinions and data contained in all publications are solely those of the individual author(s) and contributor(s) and not of MDPI and/or the editor(s). MDPI and/or the editor(s) disclaim responsibility for any injury to people or property resulting from any ideas, methods, instructions or products referred to in the content. |
© 2023 by the authors. Licensee MDPI, Basel, Switzerland. This article is an open access article distributed under the terms and conditions of the Creative Commons Attribution (CC BY) license (https://creativecommons.org/licenses/by/4.0/).