Article

Correlation between Mechanical Properties—Structural Characteristics and Cavitation Resistance of Rolled Aluminum Alloy Type 5083

by
Dionisie Istrate
1,
Ilare Bordeasu
2,*,
Brândușa Ghiban
1,*,
Bogdan Istrate
3,
Beatrice-Gabriela Sbarcea
4,*,
Cristian Ghera
2,*,
Alexandru Nicolae Luca
2,
Petrisor Ovidiu Odagiu
1,
Bogdan Florea
1 and
Dinu Gubencu
2,*
1
Metallic Materials Science and Physical Metallurgy Department, University Politehnica Bucharest, 060042 Bucharest, Romania
2
Mechanical Machinery Equipment and Transport Department, University Politehnica of Timisoara, 300006 Timisoara, Romania
3
Department of Mechatronics and Robotics Mechanical Engineering, Tehnical University Gheorghe Asachi of Iasi, 700050 Iasi, Romania
4
Department of Materials and Products Characterization for Electrical and Energy Engineering, National Institute for R&D in Electrical Engineering ICPE-CA, 030138 Bucharest, Romania
*
Authors to whom correspondence should be addressed.
Metals 2023, 13(6), 1067; https://doi.org/10.3390/met13061067
Submission received: 4 May 2023 / Revised: 22 May 2023 / Accepted: 26 May 2023 / Published: 1 June 2023
(This article belongs to the Section Metal Casting, Forming and Heat Treatment)

Abstract

:
The 5000 series aluminum alloy 5083 is distinguished by excellent processability, excellent welding characteristics, and a strong resilience to corrosion, particularly in maritime environments. It is employed in the manufacture of ships, automobiles, spacecraft, and industrial buildings. The goal of the current study is to determine whether there is any relationship between the mechanical properties, structural characteristics, and cavitation erosion properties of aluminum alloy 5083 in the H111 state (rolled from 454 °C to 399 °C and annealed at 343 °C by holding in cooled air), followed by artificial ageing at (180 °C) with three maintenance periods of 1 h, 12 h, and 24 h, and at (140 °C) with three maintenance periods of 1 h, 12 h, and 24 h. The cavitation resistance experiments of the experimental samples were performed in accordance with ASTM G32-2016. The resistance to cavitation erosion was determined by making mean erosion penetration rate (MDER) or mean depth of erosion (MDE) analytical diagrams according to the duration of the cavitation attack and by measuring the maximum depth of cavitation erosion in the samples analyzed by stereomicroscopy and scanning electron microscopy. Finally, a structural correlation between the condition of the artificially aged laminate alloy and its resistance to cavitation erosion could be achieved: ageing at 180 °C, maintained for 24 h, could lead to a maximum depth of cavitation erosion MDEmax of about 5 µm.

1. Introduction

One of the most adaptable metals, aluminum is used in a variety of compounds that are continuously being researched. Due to their combination of simultaneous characteristics—low density, high specific strength, and excellent corrosion resistance—alloys in the 5xxx series are used in the shipbuilding, automotive, aerospace, and transportation industries as well as in the production of some hydraulic system components [1,2,3,4,5,6,7,8,9]. There are well known characteristics of the 5083 aluminum alloy, either after post-solution cooling or after welding [4]. Magnesium is the primary alloying component in aluminum alloy 5083, and EN 373-3 states that its concentration ranges from 4.0 to 4.9%, showing significant impact after quenching solutions. Its comparatively high mechanical strength and excellent qualities for resisting rust make it useful in corrosive environments [3]. The mechanism of quenching solutions of type 5083 aluminum alloys is due to the formation of the β-phase (Mg5Al8). The extra Mg atoms in the matrix are supersaturated atoms, while the remaining Mg atoms continue to reside in the β-phase [10,11,12,13,14,15]. The size of the grains in fusion welding is a significant issue that develops after the 5083 metal is welded [12]. According to Liu Y et al. [13], grain development causes a significant weakening of the welds of alloy 5083. Ma et al. [14] showed in their research that the grain size in the fusion zone increased up to 200 µm and the base metal grain size was about 50 µm, which resulted in a 15% decrease in tensile strength. Corigliano et al. [15] also showed that 5 mm Al 5083 joints by single-pass GMAW could fail in the heat-affected zone due to stress concentration. Ma et al. [16] demonstrated the discrepancies of lattice strain evolution between virgin and fire-exposed material in order to provide insight into mechanical property degradation. Li et al. [17] discussed the manner of changing the structure of the 5083 alloy in comparison with 5182 alloy by applying different heat treatments. On the other hand, some components, during operation, such as the radiators and rotors of vehicle cooling pumps, as well as the propellers of fishing and pleasure boats, are affected by the corrosive, abrasive, chemical and cavitation action of water [9,18,19,20,21,22,23,24,25,26,27,28,29,30,31,32,33,34,35,36,37,38,39,40,41,42,43,44,45,46,47]. For certain hydrodynamic flow regimes, cavitation corrosion becomes the most dangerous. Operation in such regimes inevitably leads to structural damage due to cyclic microjet stresses and shock waves produced by imploding cavitation bubbles. Although the chemical constitution and alloying with other chemical elements improves the mechanical properties, lifetime is still limited when operating in high-intensity cavitation flows. In terms of the use of aluminum alloy 5083 for pressure vessels and products which are used in special temperature conditions and in areas with increased aggression, it is required to have special properties. Istrate et al. [9] studied the cavitation behavior of cast 5083 alloy subjected to different heat treatments of artificial ageing. The final conclusion of the experimental research was that the best combination of heat treatments applied to cast products from alloy 5083 is homogenization at 350 °C followed by artificial ageing at 180 °C, at which the highest mechanical characteristics are obtained, a resilience of 25 J/cm2, a grain size of 140–180 μm, and a maximum depth of the erosion MDEm around 14–17 μm. The present work aims to define the best combination between the heat treatments of artificial ageing applied to the 5083 alloy in the rolled state and the resistance to cavitation erosion, considering that there are sufficient uses of the alloy in this state.

2. Materials and Experimental Procedure

The samples from aluminum alloy type 5083 (Color Metal, Odorheiu Secuiesc, Romania) were taken in the H111 condition (rolled from 454 °C to 399 °C and annealed at 343 °C maintaining in cooling air), as is given by the producer [40], having the chemical composition indicated in Table 1.
Next, heat treatments were performed on experimental samples with dimensions 10 × 10 × 50 (mm): artificial ageing at 140 °C, with three maintenance periods, 1 h, 12 h and 24 h; artificial ageing at 180 °C, with three holding periods, 1 h, 12 h and 24 h. In order to identify the samples, a symbolization of the experimental samples was used as indicated in Table 2.
The heat treatments were carried out in a Nabertherm furnace (Nabertherm Company, Lilienthal, Germany), within the Laboratory of Metallic Materials Science and Physical Metallurgy Department of the Polytechnic University of Bucharest. For each type of heat treatment, six tests were performed to determine the mechanical properties: tensile strength, yielding strength, elongation, toughness, hardness and microhardness. Grain size was determined according to ASTM E3, ASTM E 407, ASTM E 112, using Barker’s electrolytic reagent to a power of 100× size. The structural investigations were carried out on an OLYMPUS microscope (Olympus LS, Tokyo, Japan).
The determination of the mechanical characteristics of the test samples subjected to different ageing heat treatments was carried out on a universal testing machine model LFV 300 (Walter + Bai AG, Schaffhausen, Switzerland). Impact toughness was made determining KCV values on the Charpy Pendulum Hammer type Walter Bai with (300 J).
The macroscopic structural analysis was performed on an OLYMPUS SZX stereomicroscope, equipped with QuickMicroPhoto 2.2 software, and the microscopic analysis on a REICHERT UnivaR type optical microscope (Reichert, Munich, Germany) equipped with Image Pro Plus software 6.0 [36,37].
The analysis of the samples by X-ray diffraction was carried out with the D8 Advance diffractometer (Bruker, Mannheim, Germany), Cu anode tube (λ = 1.540598 Å), scintillation detector. The diffractograms were recorded with an angular increment of 0.040 at a scanning speed of (0.5 s/step) angular measuring range 2θ = 20–100° [38].
The experiments regarding the resistance to cavitation of the experimental samples were carried out in the Cavitation Erosion Research Laboratory [18] of the Politehnica University of Timișoara, on a vibrating device with piezoceramic crystals, using the indirect method of testing (with a stationary sample), cylindrical samples with a diameter of 15.8 mm and a length of 16 mm [8,20,30,33]. The distance between the sonotrode vortex and the sample surface, subject to cavitation erosion, in these tests was 1.5 mm, which is laboratory courtesy, as other authors have tested at 0.5 mm [39] and others at 1.0 mm [40]. The research conditions—total duration of 165 min, intermediate periods used, the processing and interpretation of the recorded results, according to laboratory custom [5,10,16,17,20]—comply with the procedural and quality requirements of the international standard ASTM G32-2016 [41]. Functional parameters of the vibration device (vibration amplitude 50 µm, vibration frequency 20 ± 0.2 kHz, distilled water temperature 22 ± 1 °C, electrical power of the electronic ultrasound generator 500 W), on which the hydrodynamic intensity of vibrating cavitation, are monitored by a special Mathcad software [20,21,22].
The scanning electron microscope was the Thermo Fisher Quattro S model (Thermo Fisher Scientific, Waltham, MA, USA).

3. Experimental Results and Discussion

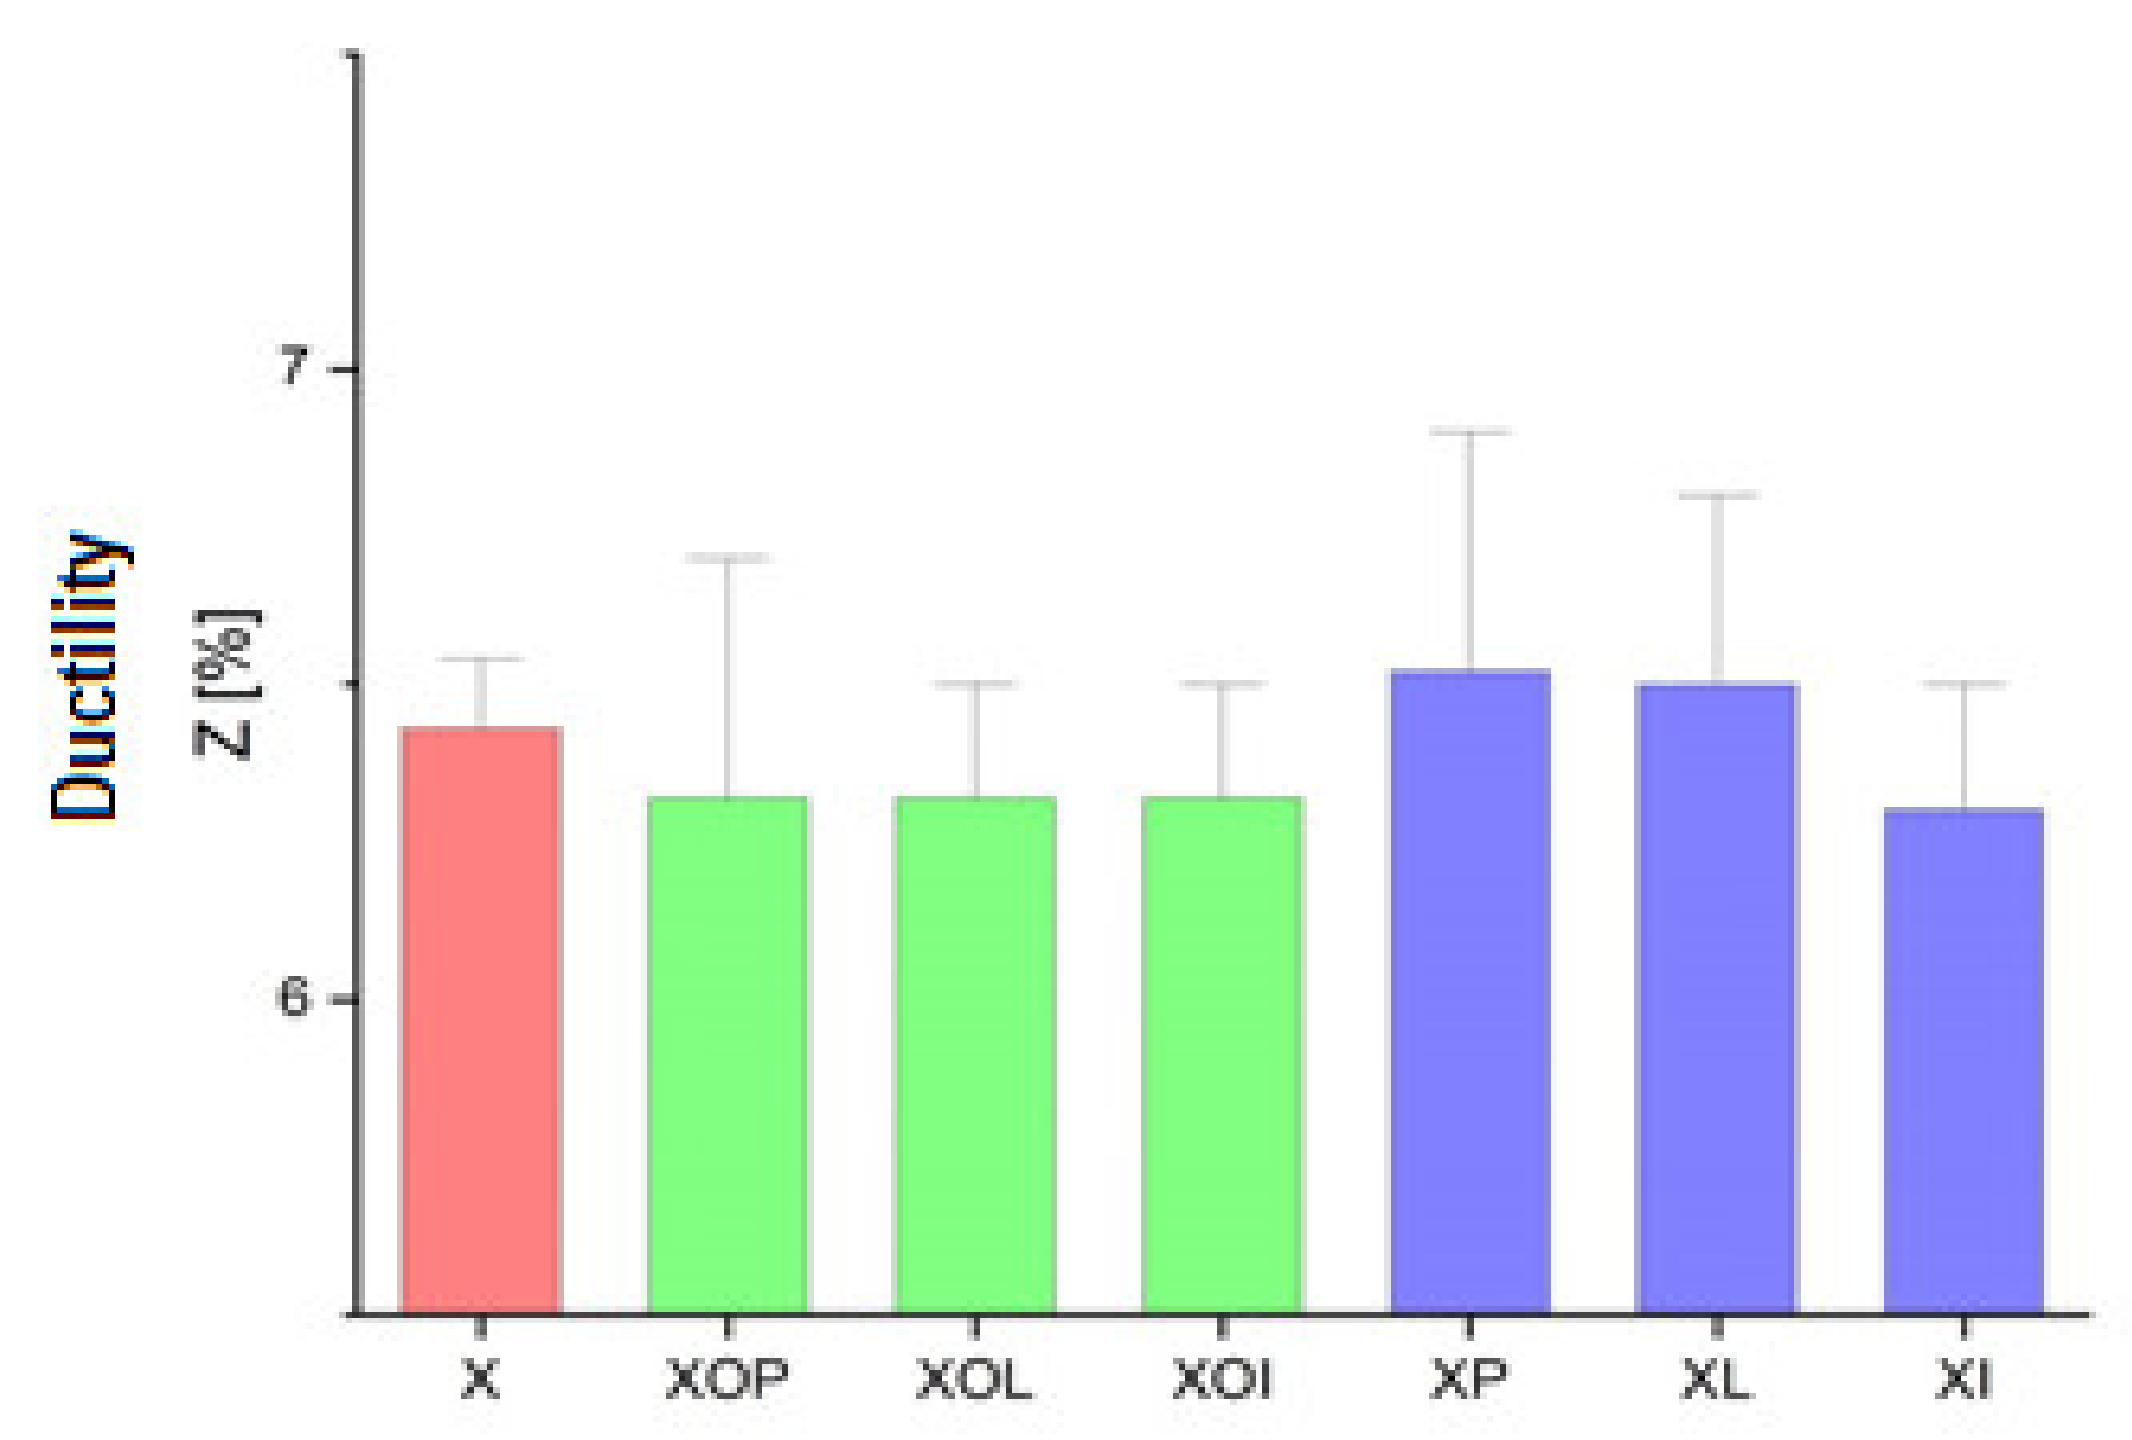
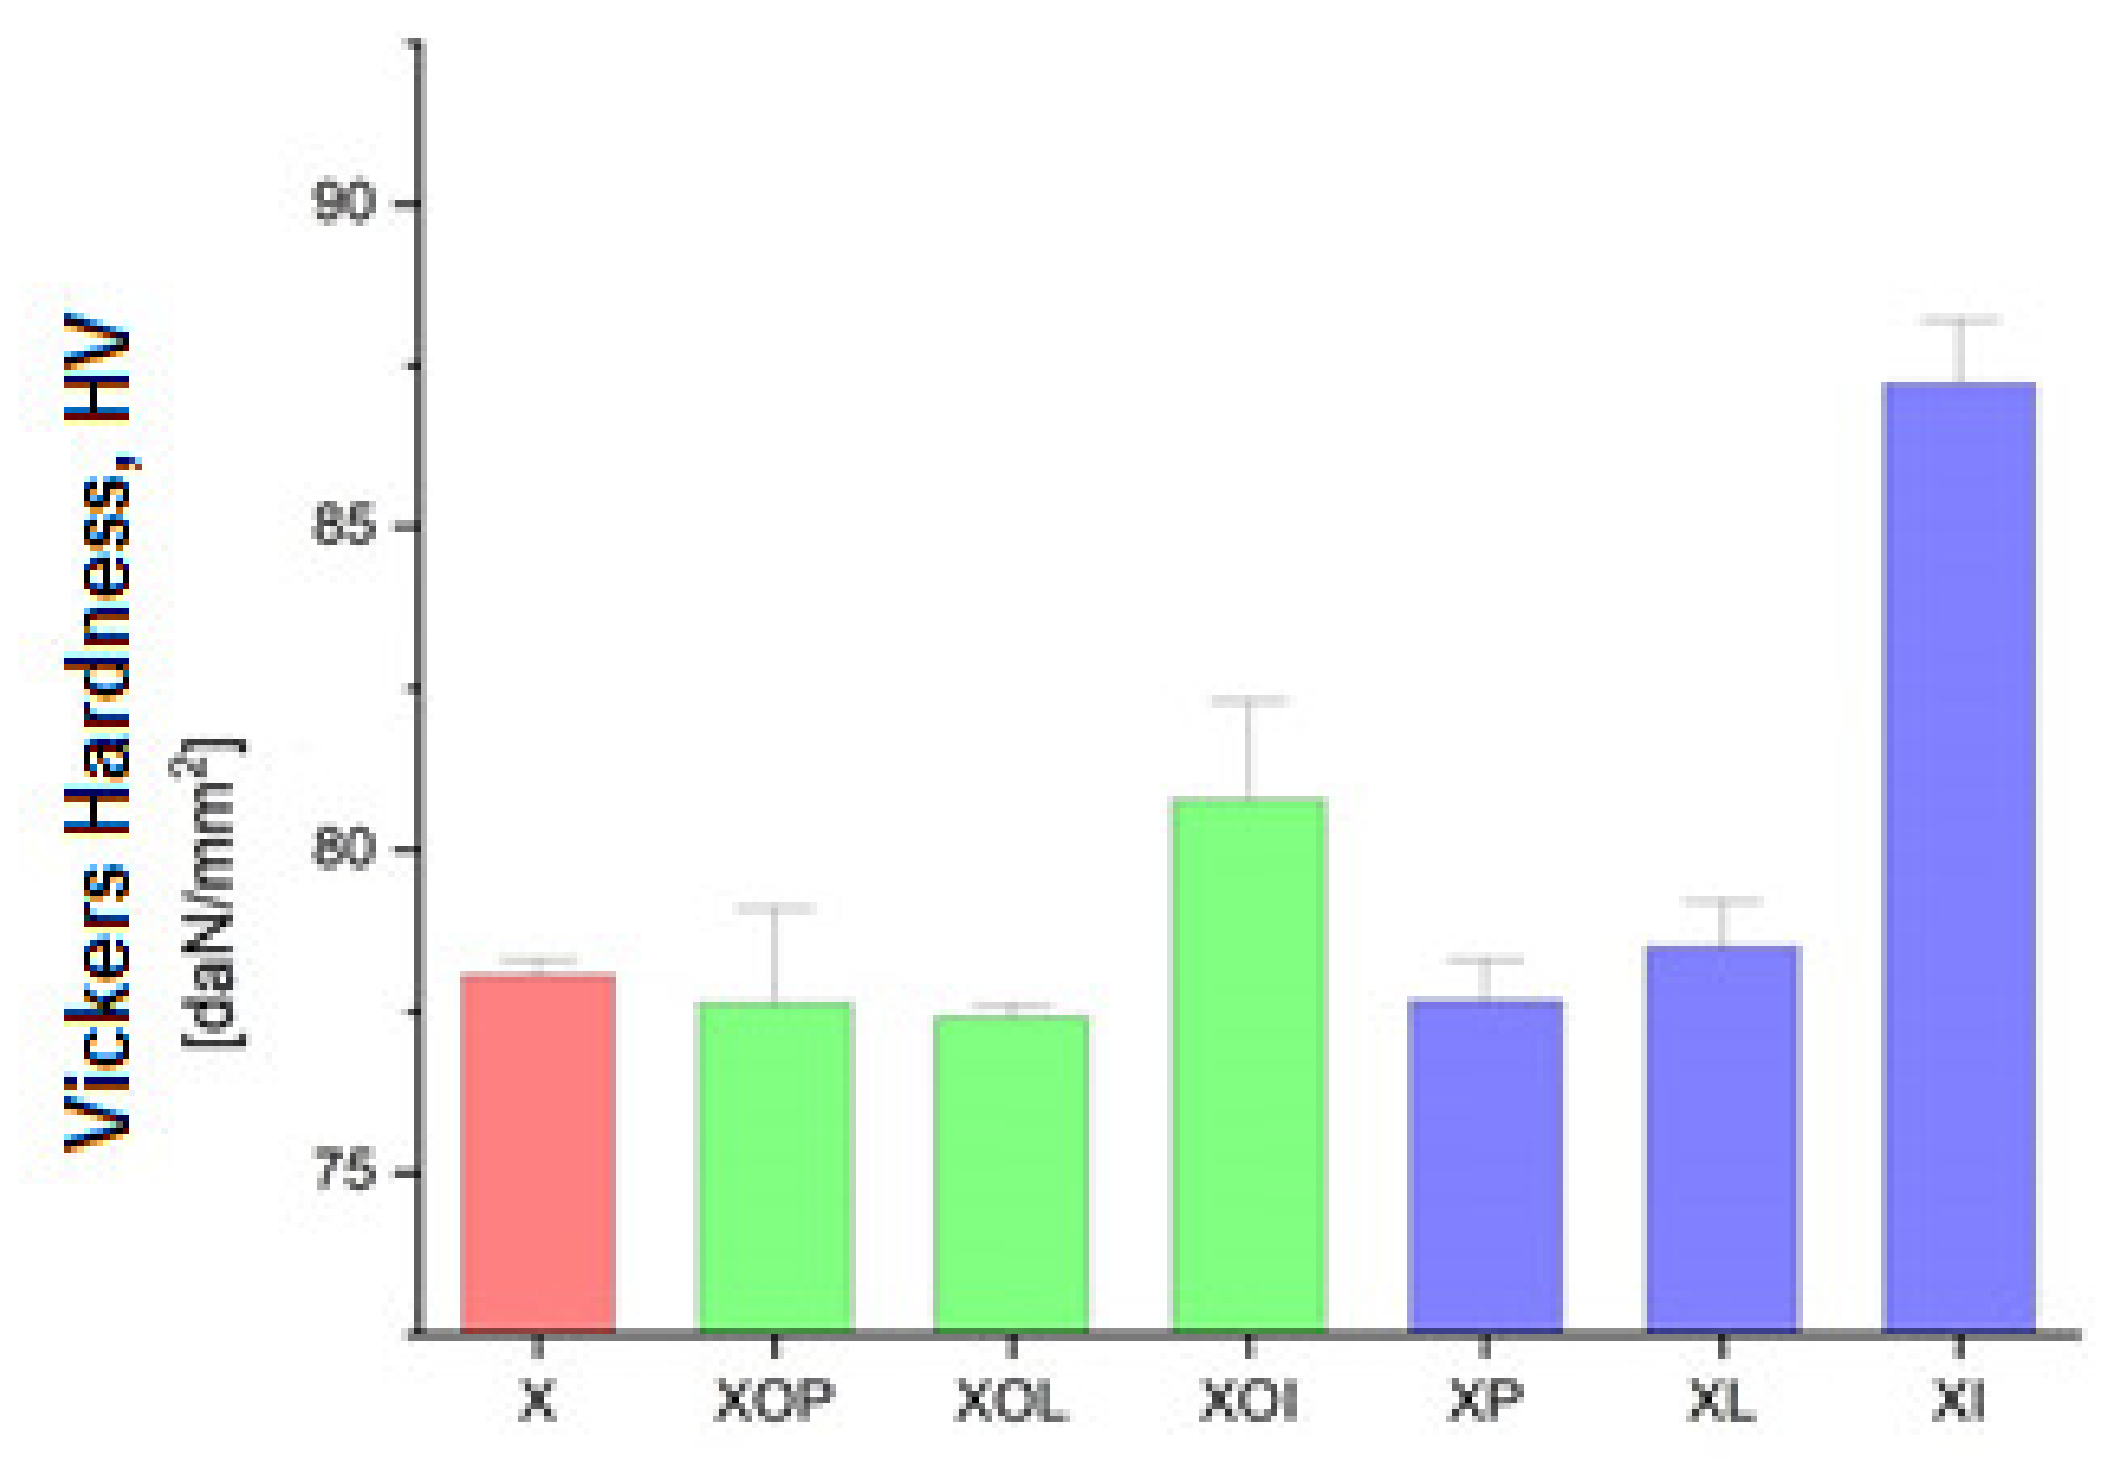
3.1. Results Regarding the Mechanical Behavior of the Experimental Samples

The experimental results regarding the determination of the mechanical characteristics are presented in Table 3 and Figure 1, Figure 2, Figure 3, Figure 4, Figure 5 and Figure 6, including the analysis of the evolution of the values of the mechanical characteristics, compared for each type of experiment, with the presentation of the standard deviation, which is around 1% for all the tests performed.
From the graph in Figure 1 it can be seen that the ultimate strength values increase after a completed ageing process at (180 °C), at different holding times, allowing the highest values to be obtained: 276 MPa for holding at 1 h (17% higher than the value of the control sample), followed by 317 MPa, at 12 h of maintenance, (an increase of 28%) and the highest value after 24 h was 324 MPa (an increase of about 30%). From the analysis of the ultimate strength values (Table 1, Figure 1), it can be observed, first of all, that the application of ageing heat treatment can increase this value by about 17–30% compared to the value of the control sample. The increase is smaller for ageing at 140 °C/1, 12, 24 h (maximum 9%) and more significant for ageing at 180 °C/1, 12, 24 h (reaching up to 30%). At the same time, during the same ageing, the maintenance time also determines the increase in the resistance to breaking. Consequently, the greatest increase in mechanical resistance is recorded after applying an ageing at 180 °C/24 h (with an increase of 30% compared to the value of the ultimate strength of the sample in the rolled state, the control sample).
Similar considerations can be made in the case of the evolution of the yield strength values (Table 1, Figure 2). Thus, by applying the thermal ageing treatment to the rolled 5083 alloy products, the yield strength can increase by about 10–21%. When ageing at 140 °C/1, 12, 24 h, the maximum yield strength increase reaches up to 14%, while after ageing at 180 °C/1, 12, 24 h the yield strength increase can reach up to 21%. Consequently, the greatest increase in the yield strength is recorded after the application of an artificial ageing at 180 °C/24 h (an increase of about 21% compared to the value of the yield strength of the control sample). These modifications of the mechanical characteristics are due to a slight hardening precipitation of the particles inside the metallic matrix.
The evolution of the ductility values presented in Table 1, Figure 3 indicates that they are very little influenced by the application of the ageing treatment. These values are in the narrow range of (6.3–6.5)%.
Figure 4 shows the influence of the artificial ageing heat treatment on the impact toughness. Thus, the impact toughness increases through artificial ageing regardless of the temperature value or the holding time by about 9%, the values being in the range of 5.2–5.3 J.
In Figure 5 it is observed that by applying the heat treatment of ageing, the ageing at 180 °C/12, or 24 h leads to an increase in the hardness values by about 10%; in all other situations, the hardness increases (1–2%).
The analysis of the Vickers hardness values from Table 1, Figure 6, indicates a similar variation to that of the Brinell hardness values. In this situation, when ageing at 180 °C/24 h, there is an increase in Vickers hardness values of about 10%, while in all other situations the increase is 4–5%.

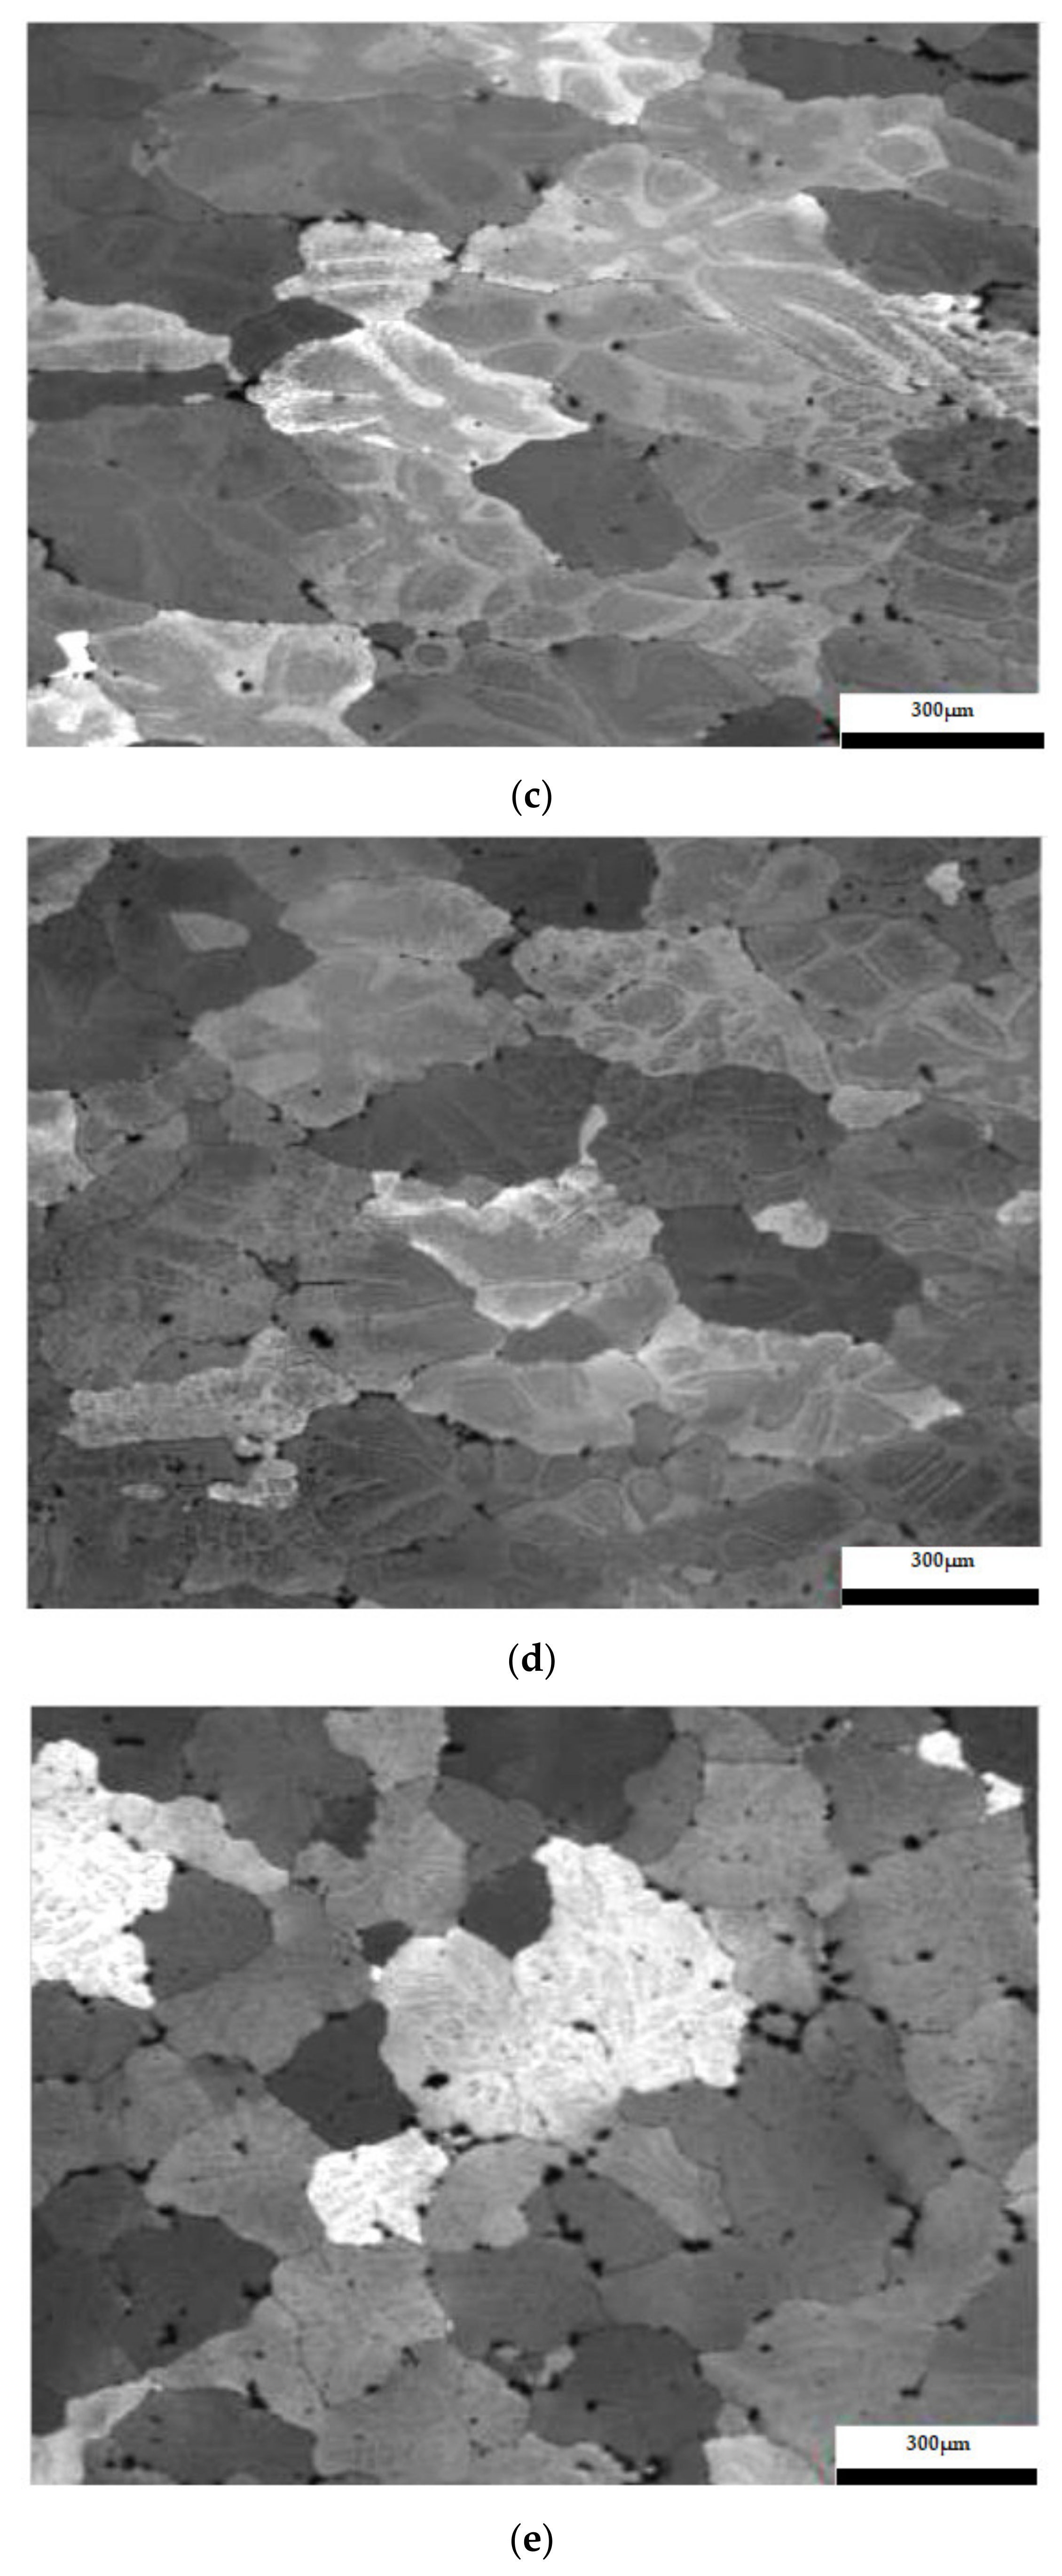
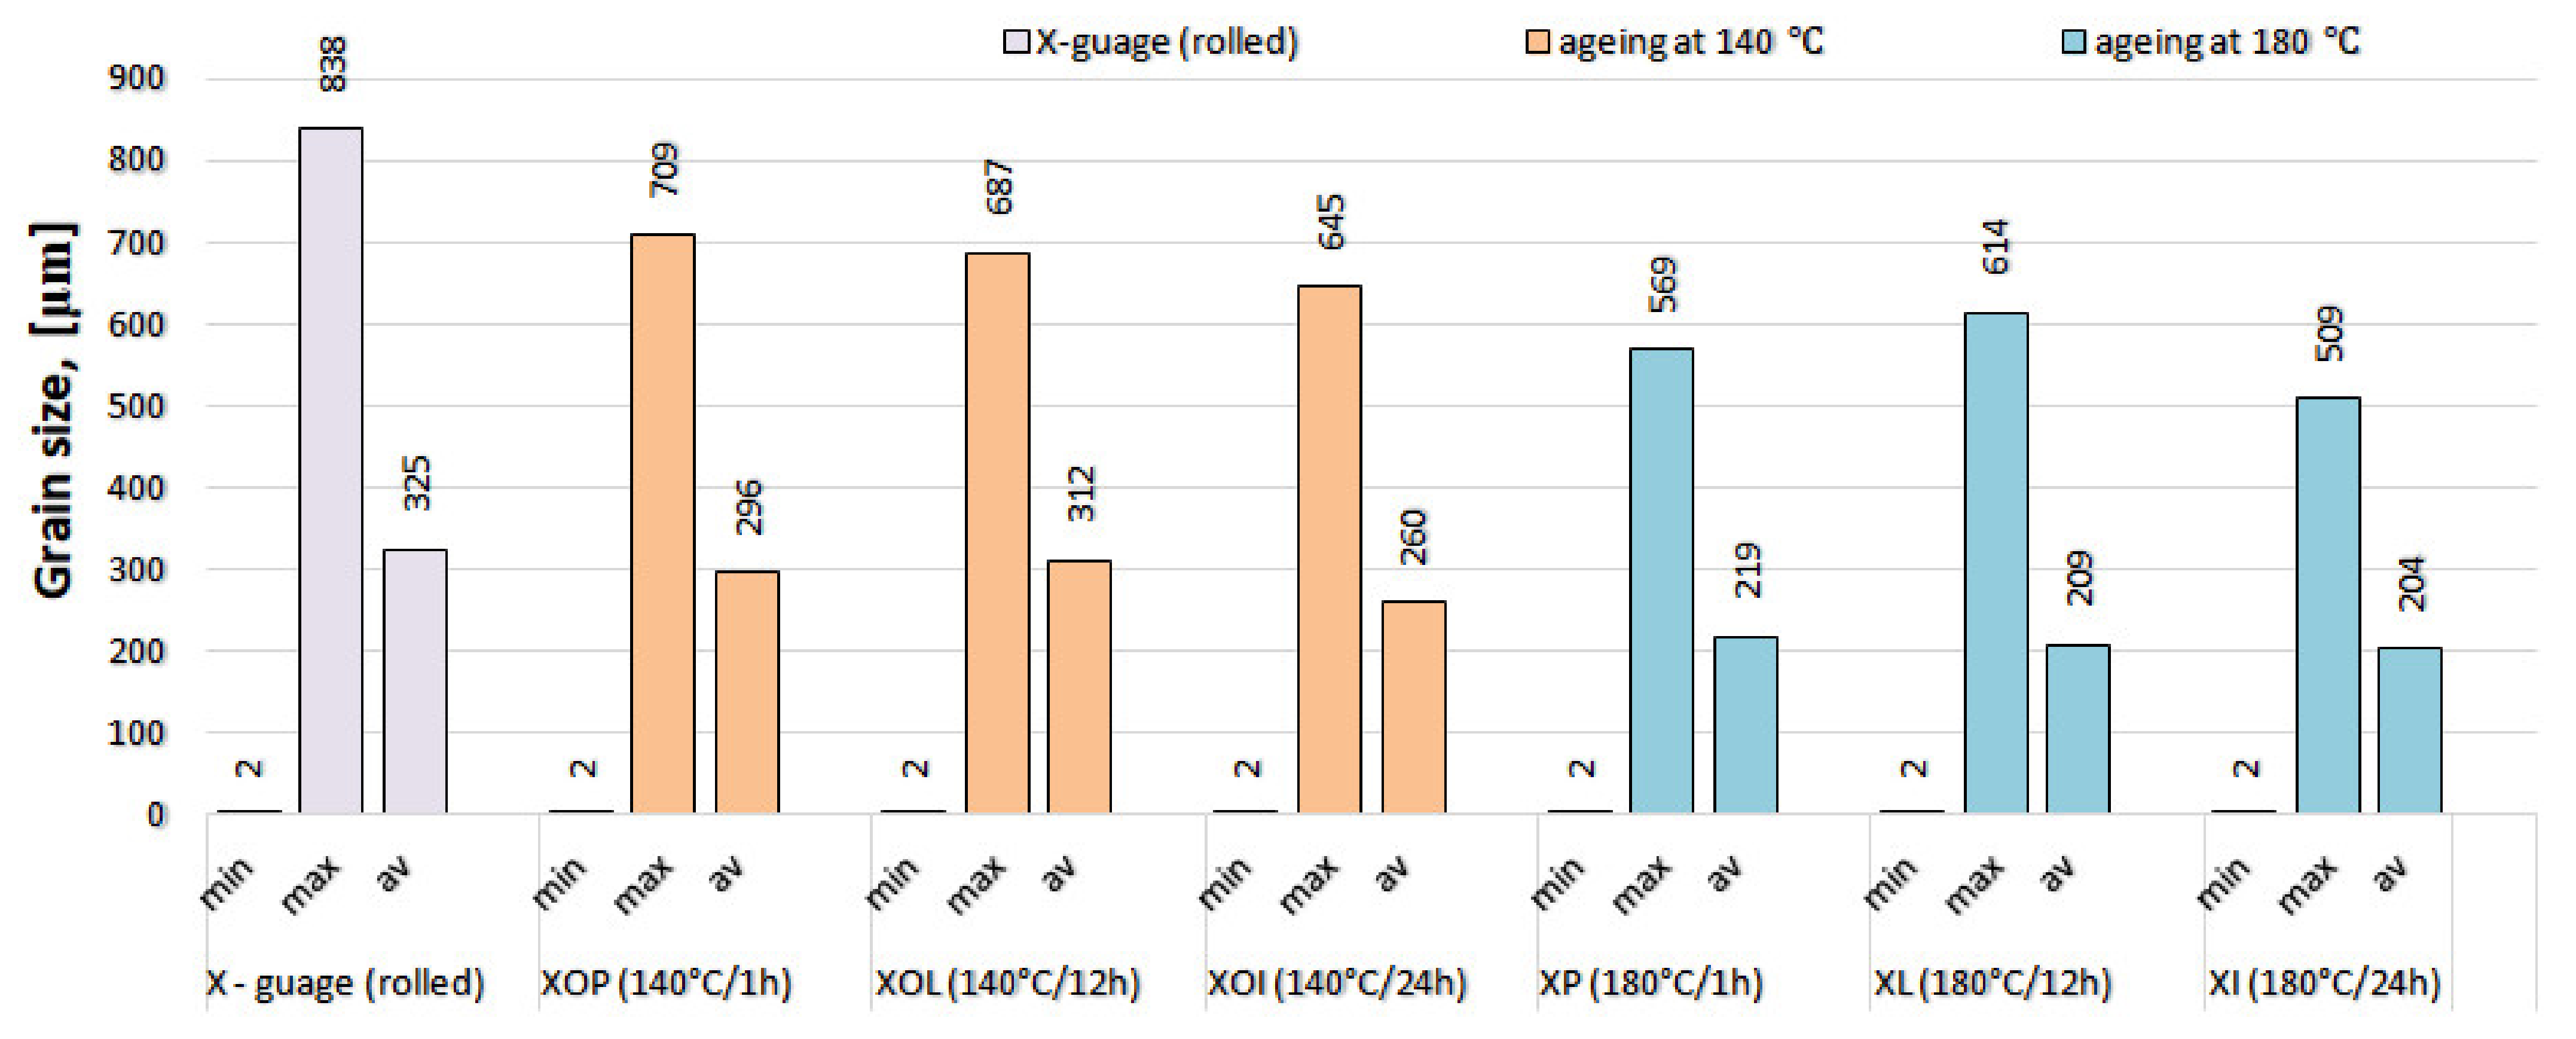
3.2. Results Regarding the Structural Characterization of the Experimental Samples

The results considering the structural analysis of the experimental samples regarding the metallographic aspects after the application of different heat treatments of the 5083 rolled aluminum samples are presented in Figure 7. It can be noted that in the control sample there is a dendritic aspect of the sample (Figure 7a), with small amounts of dendritically precipitated particles. By applying ageing, homogenization of the matrix takes place, the particles still being in dendritic separation (Figure 7b–g). All the images are taken from the center part of each sample.
The experimental results regarding the determination of grain size after statistical analysis of the experimental samples are presented in Table 4. It is observed that in the control sample the average grain size is at the highest level, around 325 μm. By applying heat treatments of ageing, granulation is reduced. In the artificial ageing heat treatment at 140 °C, the average grain size is generally larger than at 180 °C. The grain size histogram according to the heat ageing treatment applied to the experimental samples is presented in Figure 8. This behavior of different hardening in according with ageing temperature could be explained by secondary recrystallization which may appear during ageing at (140 °C), in contrast with ageing at (180 °C).

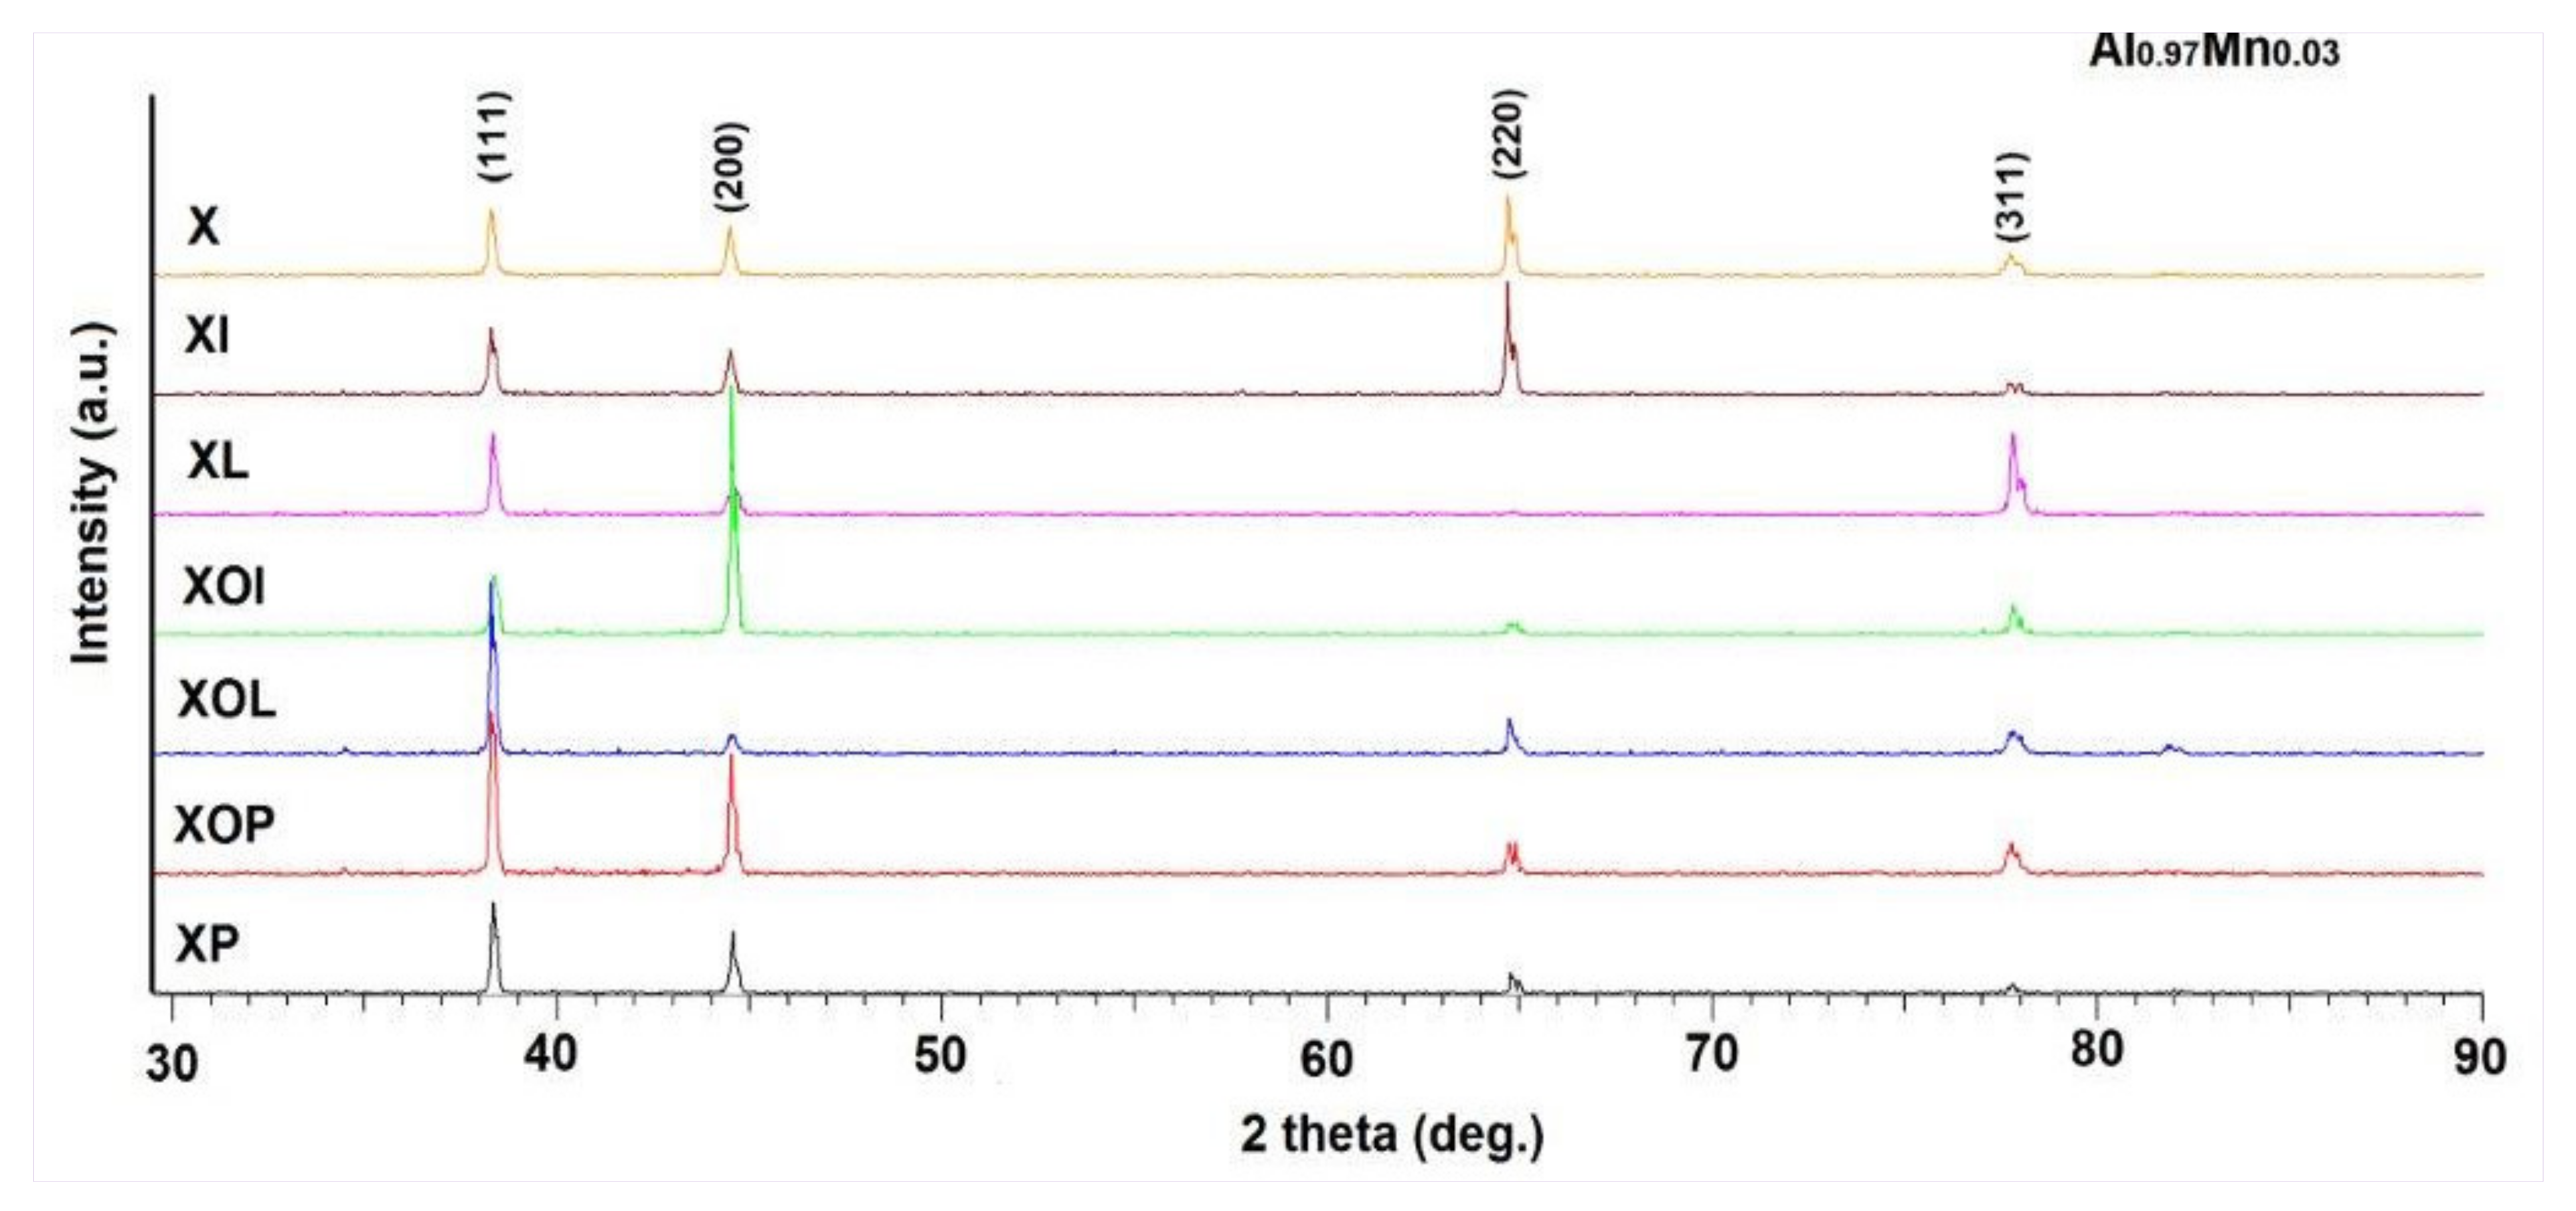
3.3. X-ray Diffraction Analysis

The qualitative analysis of the phases by X-ray diffraction revealed the polycrystalline nature of the analyzed samples. The appearance of the diffractograms for the samples subjected to heat treatments of artificial ageing is presented in Figure 9.
The crystallographic phases were identified according to the International Center Diffraction Data Release 2015 database, PDF 01-074-5237. The parameters of the elementary cell, which correspond to the size of the crystallites, were calculated by the Rietveld method and correspond to Al0.95Mg0.05, being represented in Table 5. The proportion of Mg5Al8 secondary phases is very small, their better identification can be achieved through scanning electron microscope analysis. A careful analysis of the values of the elements in the elementary cell highlighted the fact that by applying heat treatments of ageing it is possible to change this parameter compared to the control sample. An increase in the network parameter can be observed, in the range of (4.073–4.079) [Å] when applying heat treatments of ageing at (140 °C)/(180 °C); at 24 h durations, ageing at 140 °C, the network parameter increases by 0.05%, while at increasing holding durations at 24 h, ageing at 180 °C, there is an increase in the network parameter of 0.2%.

3.4. Determination of the Behavior of the Experimental Samples in Cavitation Erosion

3.4.1. Analysis of Cavitation Resistance Based on Curves and Specific Parameters vs. Penetration Depth

The cavitation erosion behavior and resistance tests were conducted on the standard vibrating apparatus with piezoceramic crystals of the Cavitation Erosion Research Laboratory from the Politehnica University of Timișoara [20]. The process parameters are consistent with the requirements of the international standard ASTM G32-2016 [32] (vibration frequency of 20 ± 0.1 kHz, vibration amplitude of 50 µm, power of the electronic ultrasound generator of 500 W, distilled water temperature of 22 ± 1 °C). During the process these parameters are kept at constant value due to the control of the experimental process through software specially built for this purpose [20,21,22].
The results regarding the cavitation erosion behavior are expressed in three ways: as graphs (Figure 10), which show the variation with the duration of the cavitation attack of the cumulative mean depth of erosion (MDE) and the mean erosion penetration rate (MDER), as required by the international standard ASTM G32-2016 [8,9,19,20,21,30,33,39]; through images obtained from the optical/stereomicroscopic analysis (Figure 11, Figure 12 and Figure 13); or through scanning electron microscope images, Figure 14 and Figure 15. Both MDE and MDER are calculated based on the mass losses obtained in the intermediate periods of the total test duration (one each of 5 and 10 min and 10 of 15 min each), knowing that the surface diameter of the samples is 15.8 mm. In our experience, from the point of view of the accuracy of the test run, depending on the size of the structural beads and the nature of the material, the tolerance range corresponding to the band of dissimilarity of the experimental values, recorded on the tested samples, has the tolerance range of (90–98)%, and the standard deviation σ can reach from 0.1 to 4.0. In the case of this article the tolerance range is (95–98)%, and for σ the range was (0.2–3.4).
The diagrams from Figure 10 show the experimental values obtained by the algebraic averaging of the values recorded on the three samples tested from each type of treatment and from the control alloy (rolled semi-finished product). These values are averaged by the curves built with the analytical relations established by Bordeașu et al. [28,29]. Analytical forms of these curves are:
MDE(t) = A · t · (1 − e−B·t)
MDER(t) = A · (1 − e−B·t) + A · B · t · e−B·t
where A and B, whose values are mentioned below the graphs, are the scale and shape parameters obtained statistically by the method of least squares based on the experimental data.
A careful analysis of these graphs, the comparative results of which are illustrated in Table 6 and Table 7, shows the following aspects: rolled alloy type 5083 has similar behavior to other class of aluminum alloys and at the same time shows a very different behavior in comparison with other types of materials. This behavior is caused by the precipitation hardening process in aluminum alloys in comparison with erosion mechanisms found in other classes of hardening metallic materials through solid state transformations.
The dispersion mode of the experimental values compared to the MDE(t) and MDER(t) mediation curves, as well as the evolution of the two curves, shown by the diagrams in Figure 10, shows similar and distinct/specific elements of the behavior of the surface structure to the erosion created by the cyclic stresses of the microjets produced by the vibrating cavitation. Basically, these diagrams show the effect of the volumetric heat treatment regime (temperature and holding time) on the mechanical response to cyclic fatigue stresses, through the structures and values of the mechanical properties obtained.
The following findings can be made:
-
for each sample, regardless of whether it is blank or heat treated, during the first 30 min of vibratory cavitation, the erosive mechanism specific to it is observed; in the attacked surface, more elasto-plastic deformations and crack networks are produced and the roughness tips and dust are removed abrasively. Material ejections, with the creation of pitting, are significantly reduced in the mass values recorded by weighing. For this reason, the appearance of the surface resembles a polished/brushed one;
-
with the exception of samples XOP (Figure 10c) and XOL (Figure 10e), in the rest of the samples there is a time interval in which material losses are high and the differences between the values of velocities are also high. This aspect shows a low resistance to cavitation and, as a result, the number of cavities created by the expulsion of material increases, and those already created increase in area and depth (see images in Figure 11, Figure 12 and Figure 13);
-
in all samples, starting from the 105th (120th) min and until the end of the test, the losses are of close order, which is why the MDE(t) curve becomes linear, the differences between the experimental values of the speeds are small and the MDER(t) curve decreases asymptotically towards the value of stabilization of MDERs;
-
the evolutions of the MDER(t) mediation curves—with the exception of the one for sample XP (Figure 10j), where the curve asymptotically tends to stabilize at the maximum value (MDERmax,m)—tend to decrease asymptotically towards the value of MDERs. Based on previous experience [16,17,18,19,20,21,22,23,24,28,29,30,31] we believe that this way of evolution is the effect of the mechanical properties, the hardening over time, the applied layer and the reduction of the stress/impact force, as a result of the damping effect of the air penetrating into formed caverns;
-
although the cavitation erosion of the surface is initiated as early as 15–30 min, substantial large losses—with the creation of deep caverns in the form of trenches, which greatly increase in geometric dimensions—occur in the 60–120 min interval. Starting with the 135th min, the caverns develop less, for the reasons mentioned (the air entering the caverns dump the impact pressure);
-
from the point of view of the influence of the holding time at the artificial ageing temperature at 140 °C, the structure with the highest resistance to cavitation erosion is obtained for the duration of 24 h (XOI), of close order to that for the duration of 12 h (XOL), and the lowest for 1 h durations (XOP);
-
from the point of view of the influence of the holding time at the artificial ageing temperature at 180 °C, the structure with the highest resistance to cavitation erosion is obtained for the duration of 24 h (sample XI), and the lowest for the duration of one hour (XP).
The data from Table 6 highlight the differences between the maximum experimentally obtained values (MDERmax,exp) and the maximum (MDERmax,m) and stabilization values (MDERs), defined by the MDER(t) curves. The high values of these differences can create the impression that we have a structure with poor resistance to cavitation, specific to materials with large grain sizes, with a high number of structural defects (such as intermetallic compounds) and with low values of mechanical properties, especially hardness. In this case, we believe that these differences cannot be attributed to the strength of the structure, but rather to the dumping effect of the air in the caverns and to the hardening of the layer under the repetitive impacts of the cavitation microjets.
Instead, the high values of the speeds, whatever they are, are indicators of the resistance to cavitation and correspond to the appearance of the microscopic images in Figure 11, Figure 12 and Figure 13. Therefore, we appreciate that, according to the value of the speeds defined by the curves, the highest resistance is of the structure of sample XI (treated at 180 °C for 24 h) and the lowest of sample XOP (treated at 140 °C for one hour).
From the point of view of the difference in values, we believe that the samples (X, XOP, XOL and XOI) have cavitation resistances of the same order, clearly inferior to the XL and XI samples, the XP sample being of intermediate resistance. Therefore, the data in Table 6 are expressions of the influence of the structure on the resistance to cavitation by the regime parameters of the heat treatment, by the microstructural changes and by the values of the mechanical properties.
The data in Table 7 provide similar conclusions to those recorded in Table 6. From here we find that sample XI has the best resistance to cavitation erosion, the average depth after 165 min of cavitation being clearly inferior to the others. Compared to what was stated in Table 6, it follows from Table 7 that the control sample (X) has the lowest resistance to cavitation erosion. In addition to this, it follows that samples X, XOP, XOL and XOI have the structures with the lowest resistance to cavitation stresses.
Both the data in Table 6 and those in Table 7 show that with the temperature of 180 °C, regardless of the holding time, the obtained structures have superior resistances to those obtained by the ageing treatment at (140 °C), of the order of (2–13) times.

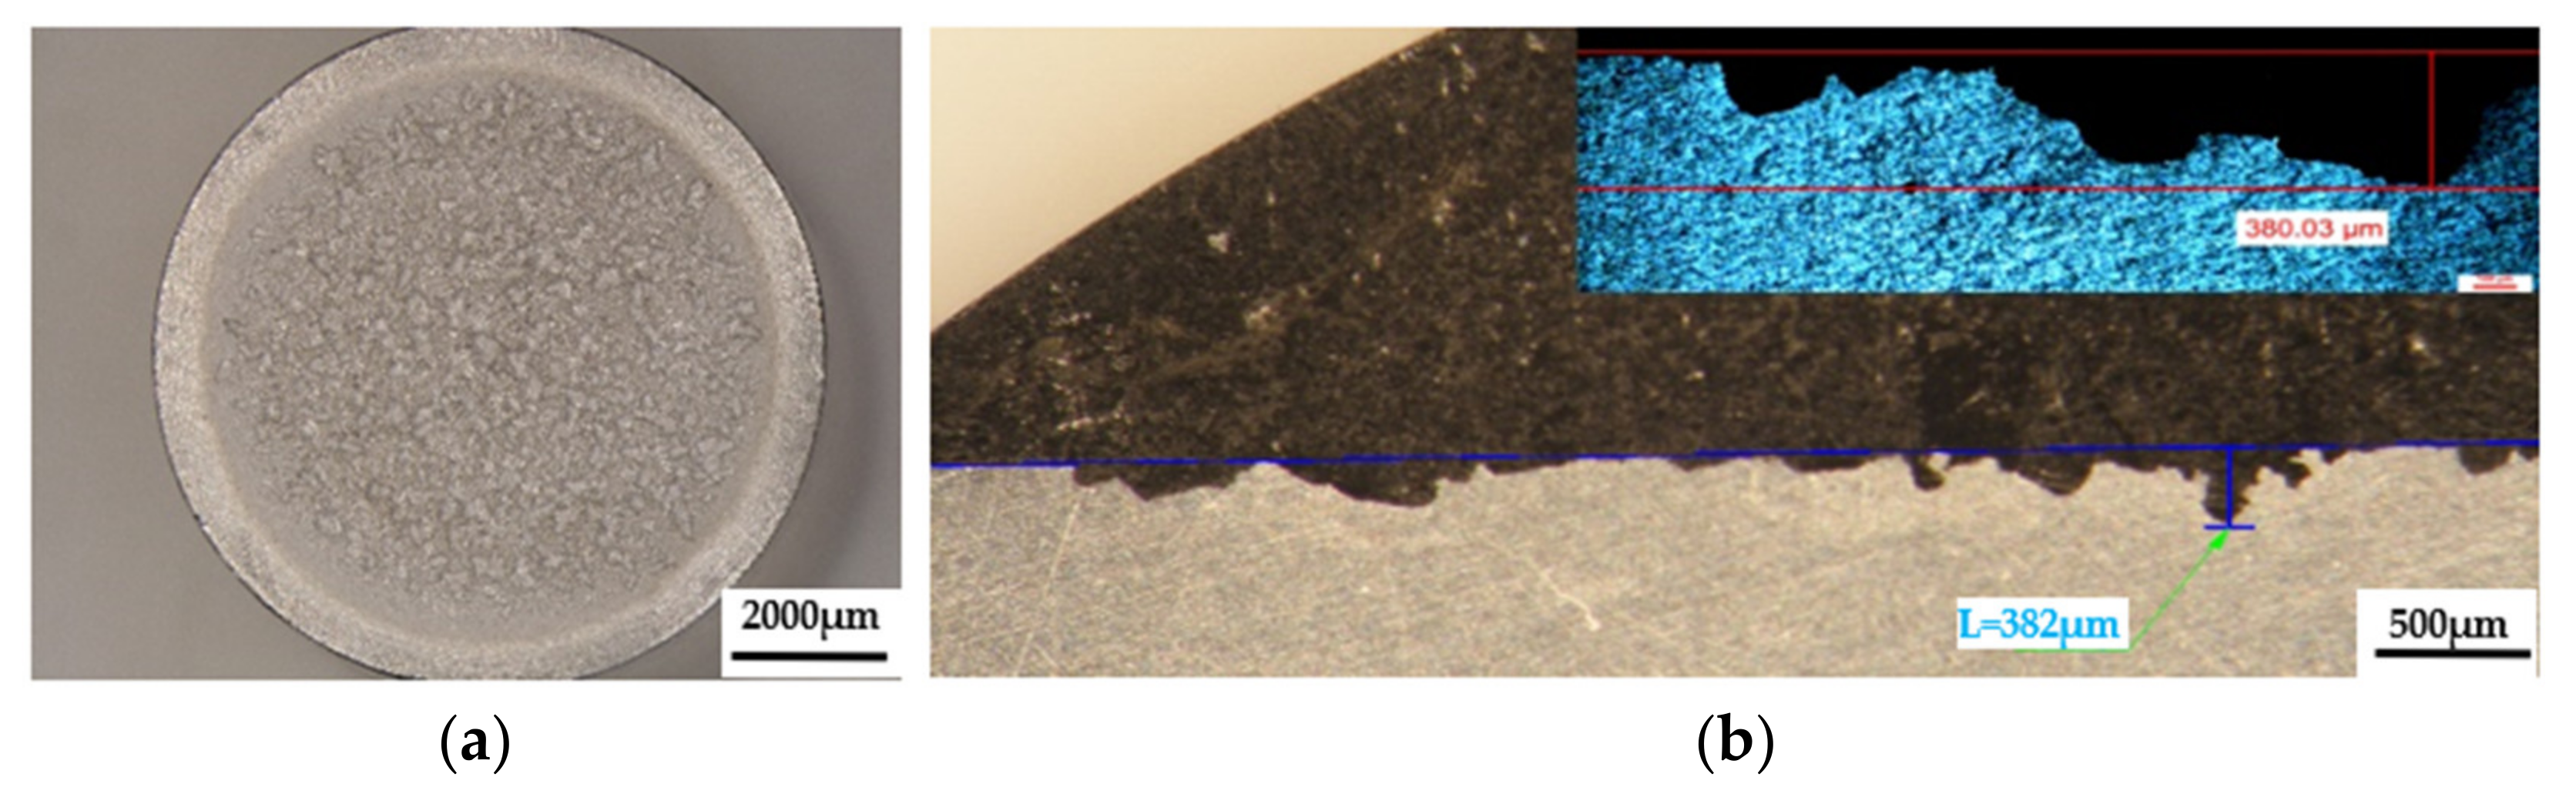
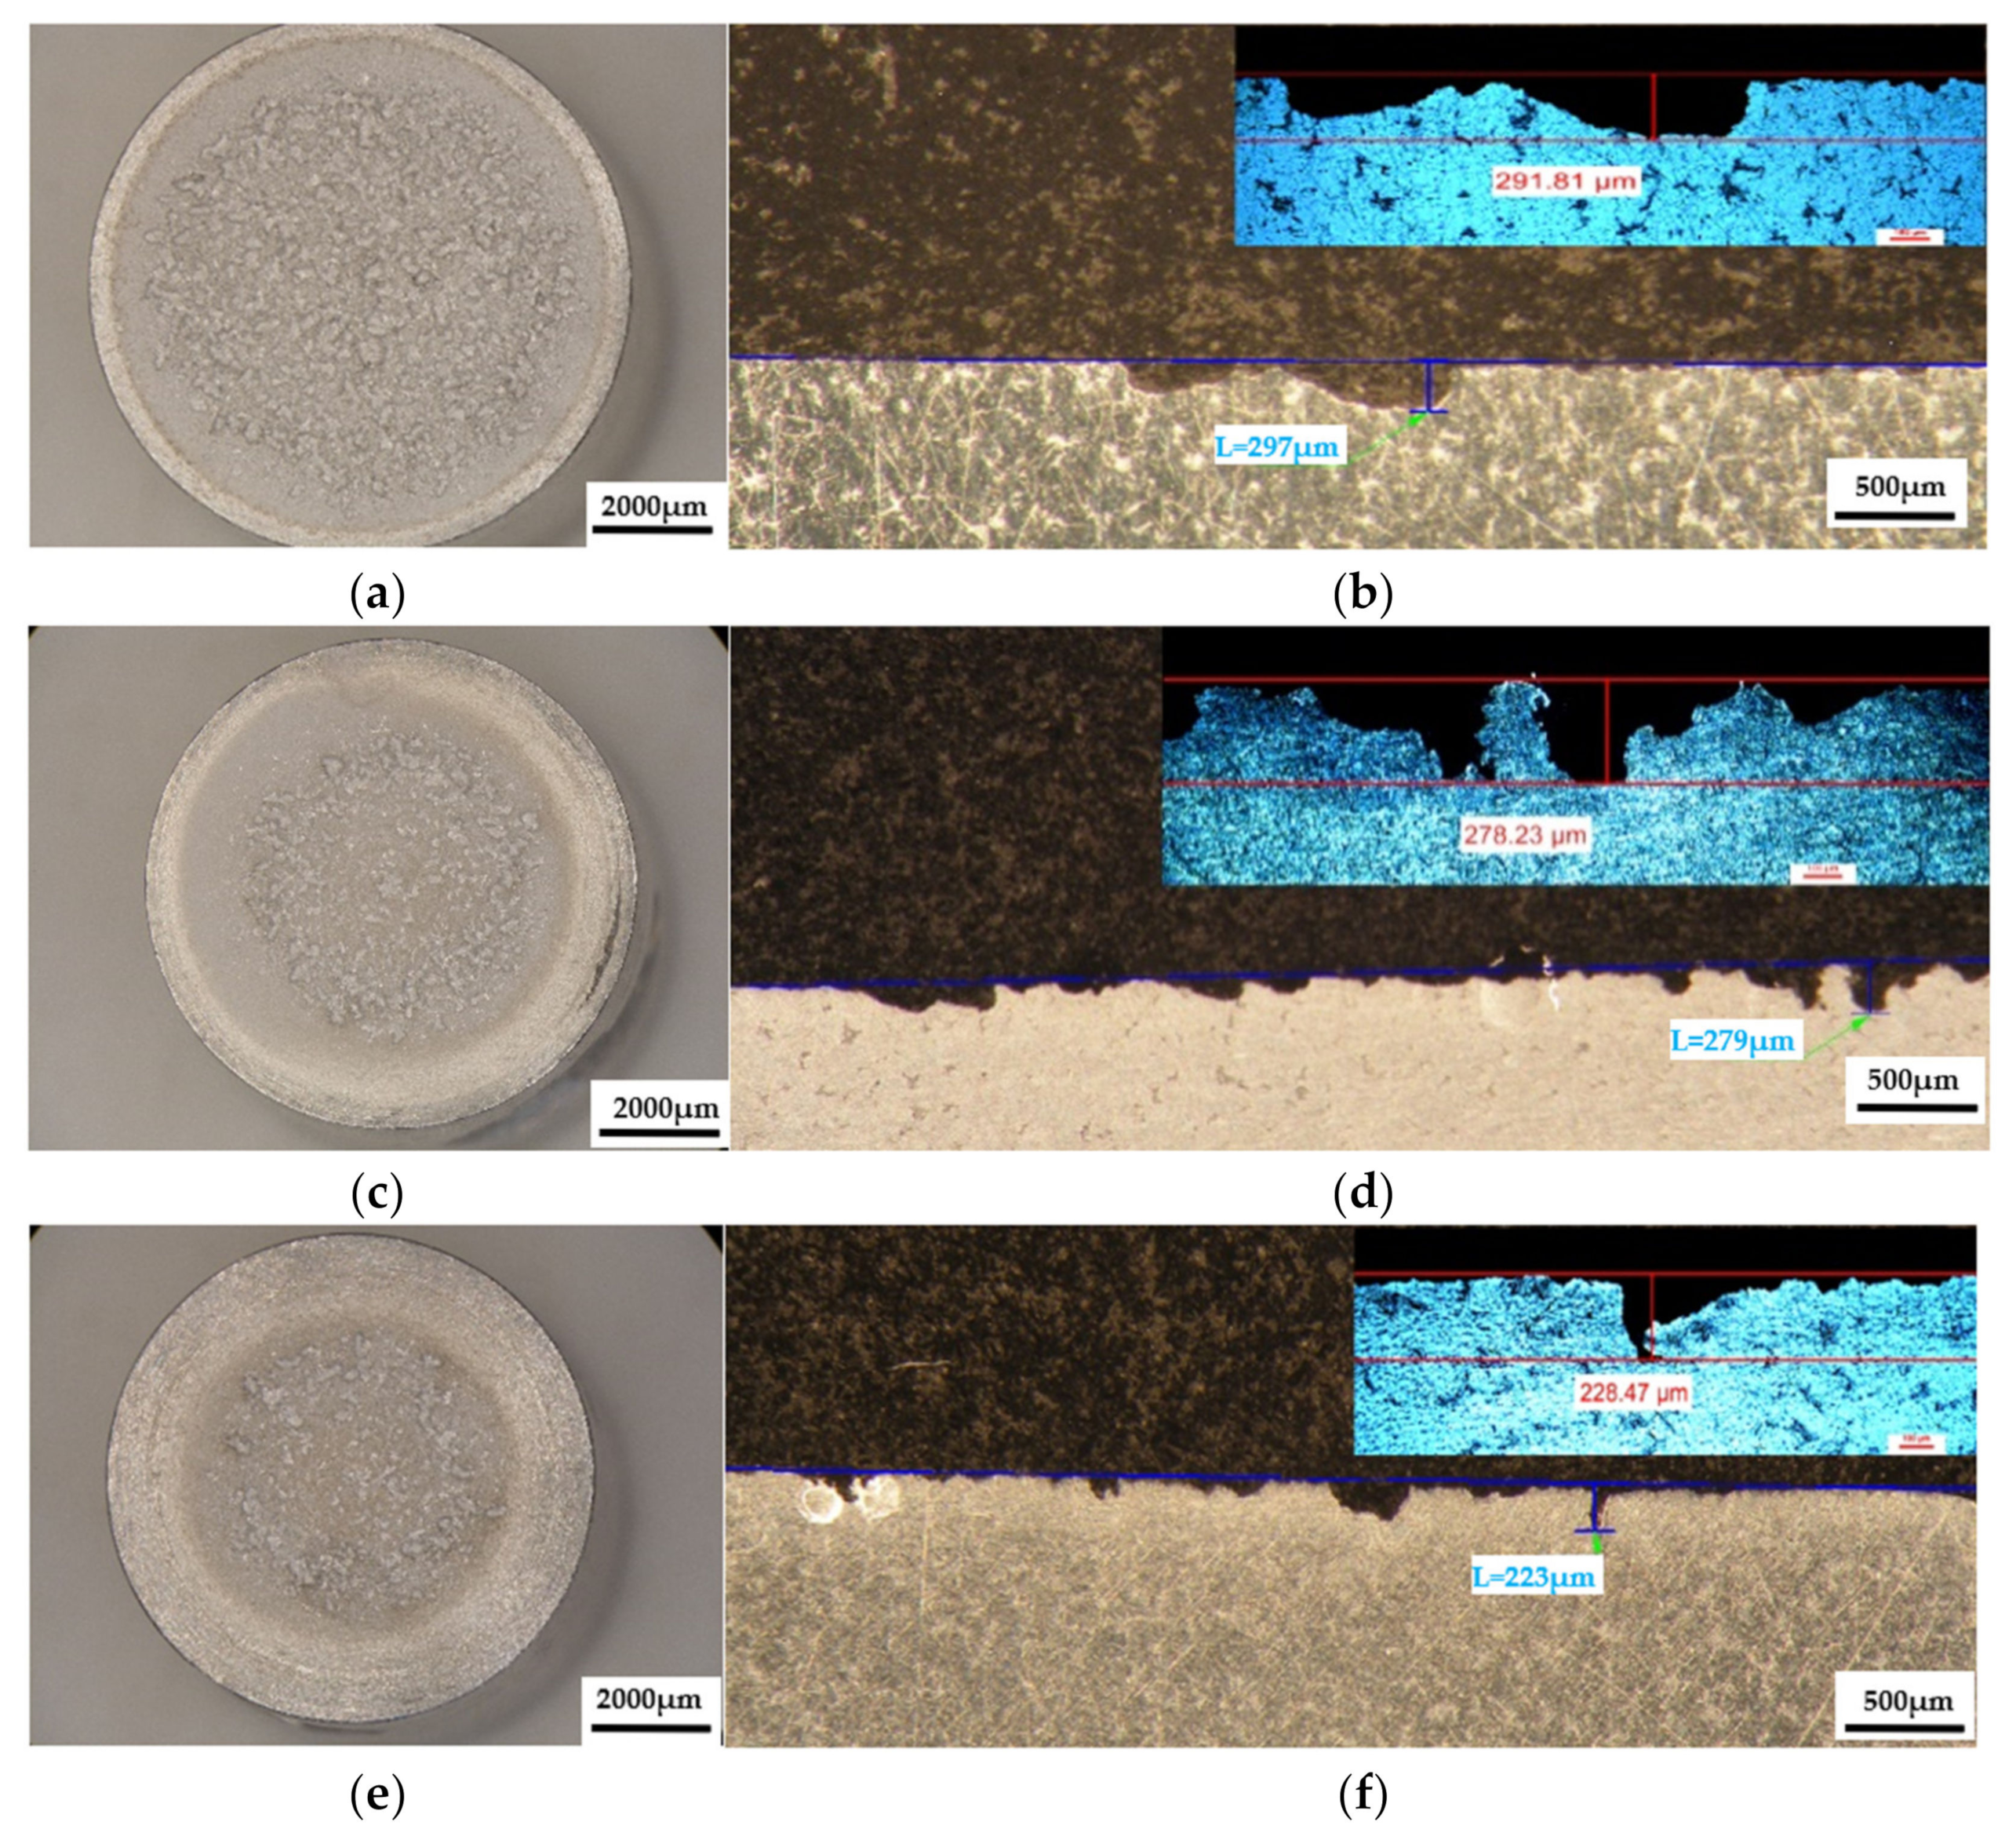
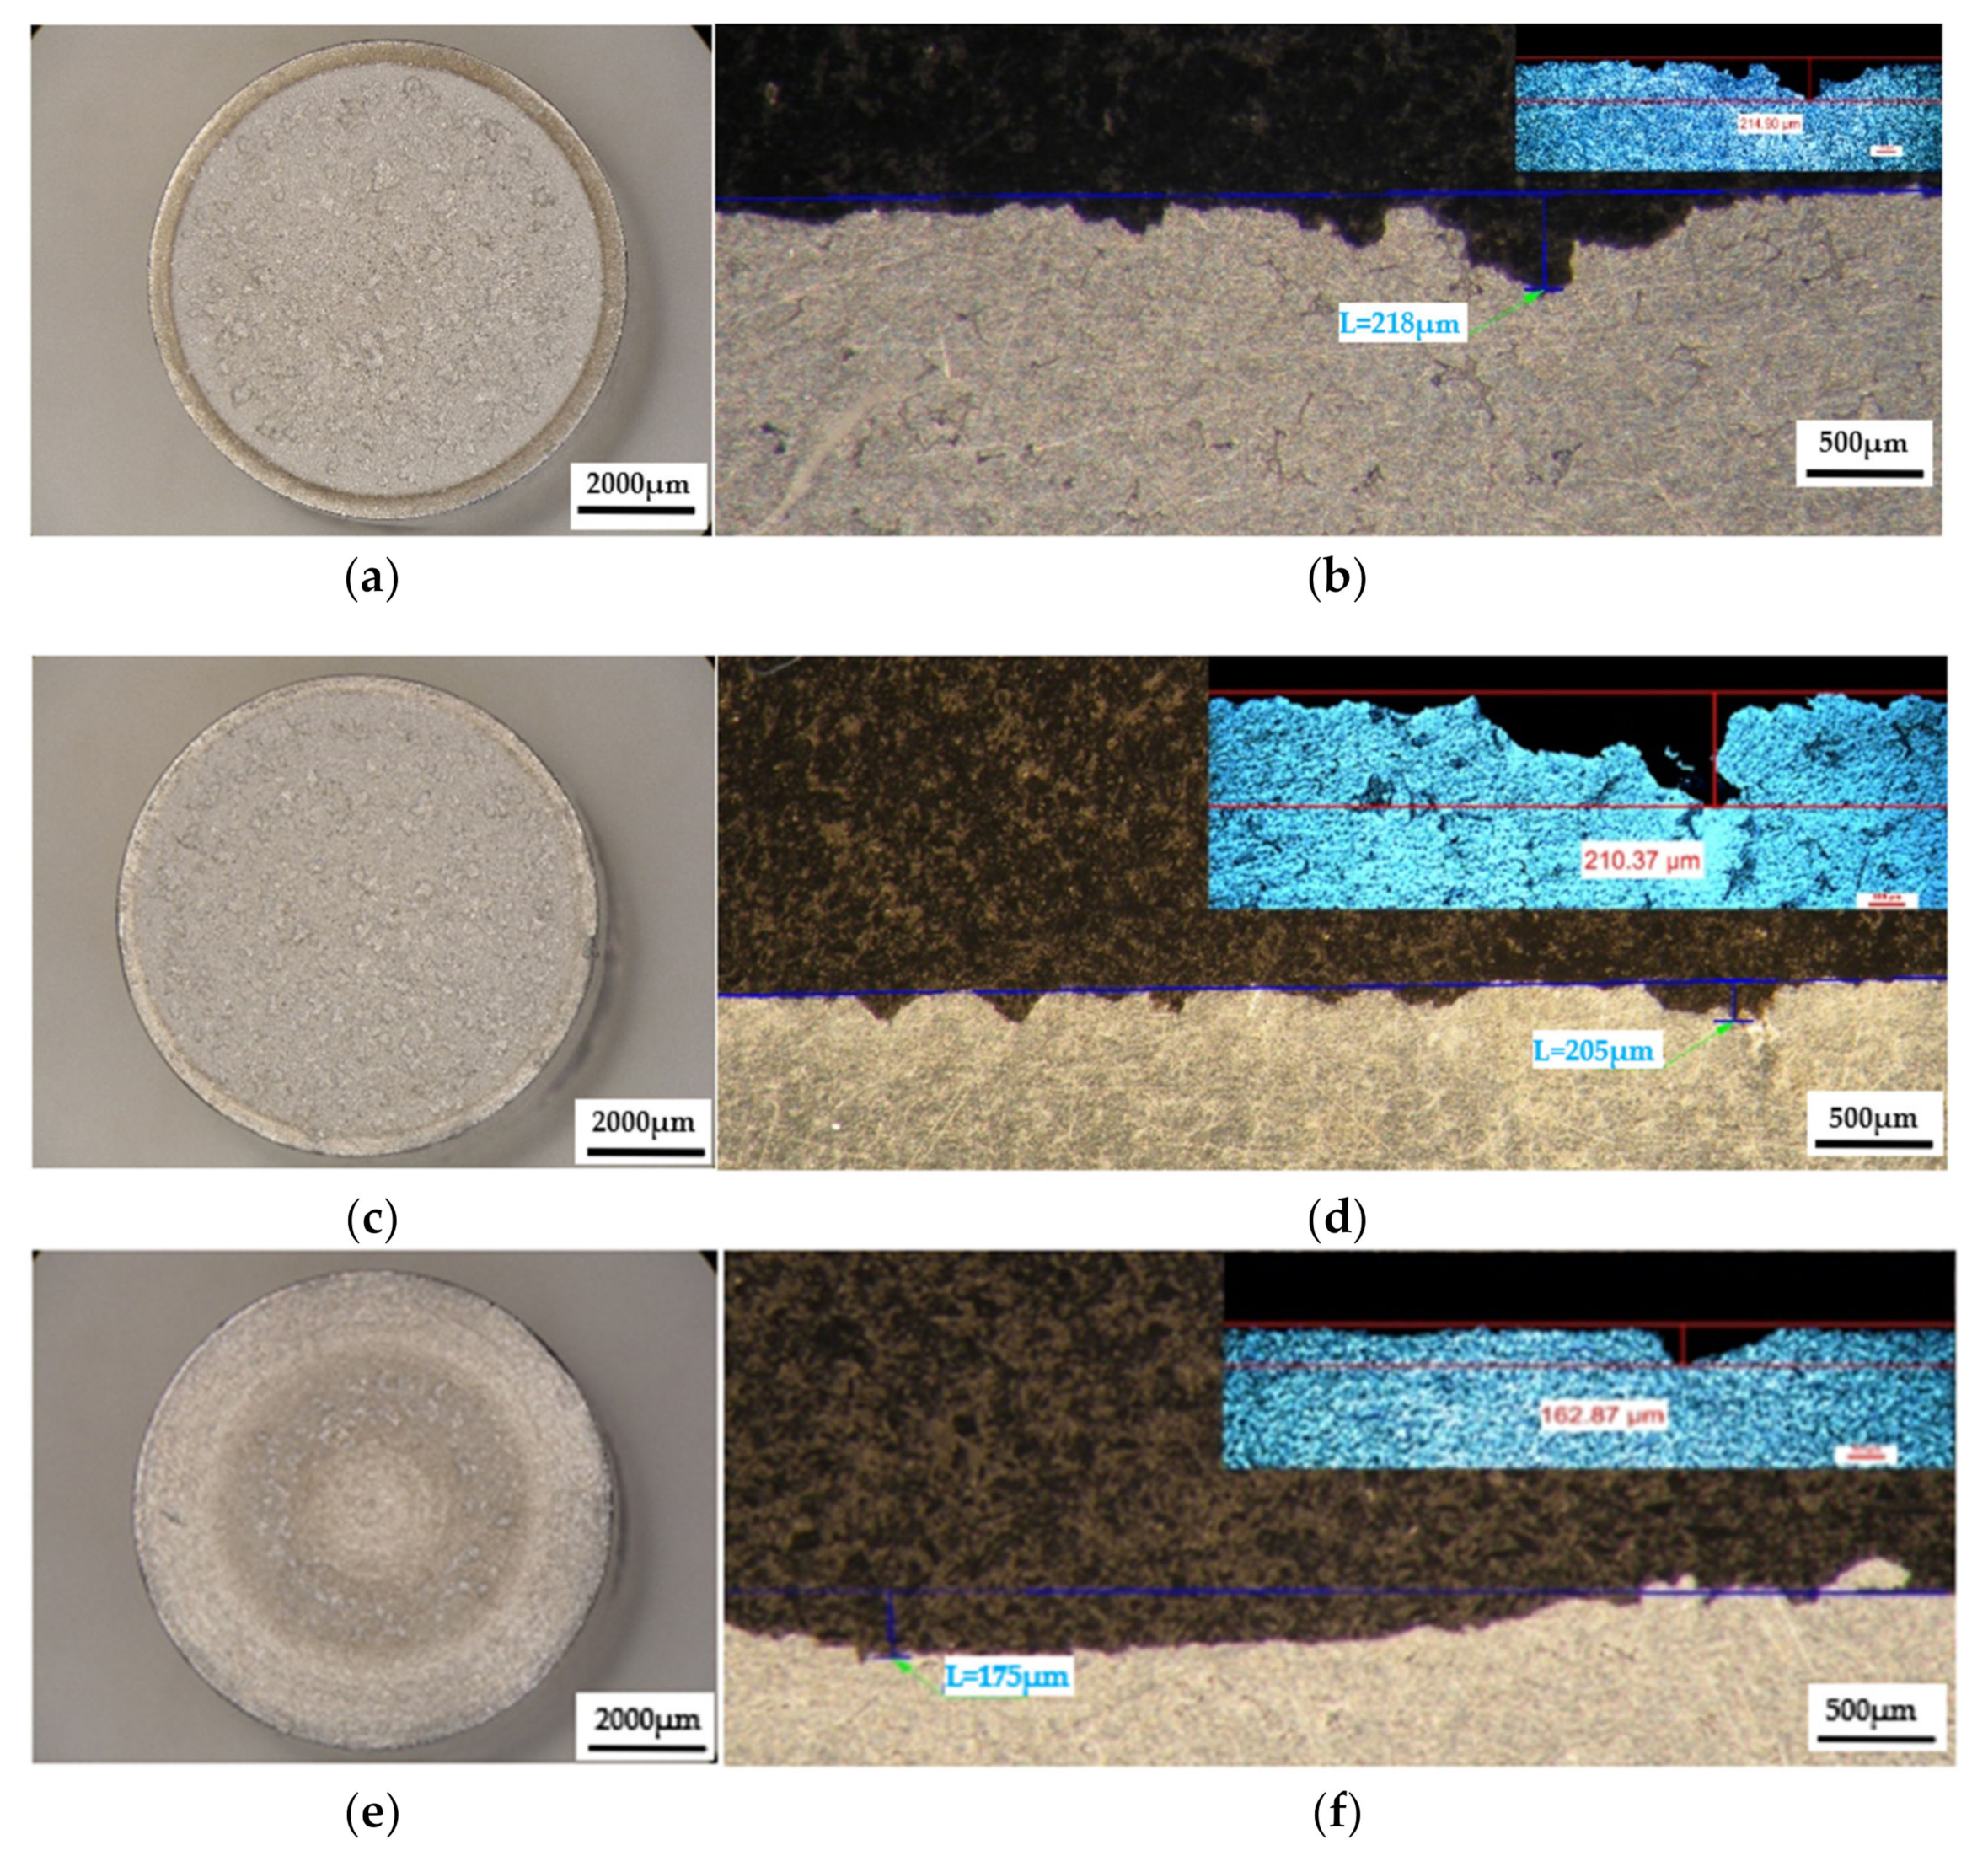
3.4.2. Determination of Resistance to Cavitation Erosion by Stereomacrostructural Analysis

The results of the macrostructural analysis of the cavitation attack after 165 h carried out in the Physical Metallurgy laboratory—UPB are shown after the stereomicroscope analysis in Figure 11, Figure 12 and Figure 13. The morphological analysis of the eroded structure is rendered comparatively after the metallographic analysis as follows: either by stereomacrostructural analysis, or by measuring the penetration depths of the cavitation attack in cross-section, comparative stereo analysis—microscopic analysis.
The macrostructural aspects highlighted in the stereomicroscope capture the extension of the cavitation attack in the frontal section. The gauge sample (Figure 11) has the most extensive surface affected by the cavitation attack, while the samples aged by heat-treatment at 140 °C/180 °C have the smallest surfaces affected by the cavitation attack. The detailed cross-sectional analysis of the surfaces subjected to cavitation (the right-hand images of Figure 11, Figure 12 and Figure 13) allowed both the visualization of the profile and the determination of the maximum penetration depth of the cavitation attack. Note the difference between the value of the maximum measured depth of the cavern trapped in the sectioning plane (in the range of 175–382 µm, Figure 11, Figure 12 and Figure 13) and the maximum cumulative average calculated after 165 min (in the range of 5–65 µm, Figure 10), which is about 3–35 times. It is reconfirmed that for the evaluation of the behavior and resistance of a structure to cavitation stress, it is recommended to use the average MDEmax surface value calculated at the end of the test and not the maximum of a cavern, from an arbitrary area. However, the very high value of pit trapped in the section plane raises a big question mark of the degree of fineness and constitution of the structure of an aluminum alloy with or without preliminary heat treatment. This behavior can give clues about the mechanism of the cavitation phenomenon between different structural classes of metallic materials. If the surface hardening mechanism takes place in the volume, following a solid-state transformation, the differences are minimal [32,33]. If the surface hardening mechanism occurs only through solid solution hardening (such as is the case of aluminum alloys), then the differences are particularly high, due to the formation of deep local caverns around the hardening particles in a solid solution mass unaffected by cavitation attack.
  • stereomacrostructural image in section parallel to the eroded surface,
  • cross-section images (background—stereomicroscope image, upper left detail—optical microscope image).
An interesting quantitative analysis can be made by measuring the surfaces affected area by cavitation corrosion, the surface in section parallel to the erosion plane (outer-initial surface), the intermediate surface (the total surface affected by cavitation erosion) and the inner surface (the surface that more affected by cavitation erosion). Table 8 shows the results of the measurements of the various surfaces affected by corrosion, as well as the ratio between the surface most affected by corrosion and the initial surface of the sample. The macrostructural quantitative analysis allows formulating the following aspects:
-
by applying thermal ageing treatments, the ratio between the surface most affected by cavitation erosion and the initial surface of the sample decreases from the average value of the control sample (about 85%), to an average value of about 80% after ageing at 140 °C, reaching a much lower value of 55–60%, for the samples subjected to ageing at 180 °C;
-
within the same ageing temperature, there is a significant decrease in the ratio between the surface most affected by cavitation erosion and the initial surface of the specimen. Thus, after ageing at 140 °C and holding for 1 h the ratio is 81%; after holding for 12 h the ratio drops to 80%, and after 24 h the ratio becomes 78%. After ageing at 180 °C, the ratio is 61% after holding for 1 h; this decreases to 57% after holding for 12 h, and reaches 56% after holding for 24 h.

3.5. Scanning Electron Microscope Analysis

The scanning electron microscope analysis of the cavitation-eroded surfaces, shown in Figure 14 and Figure 15, completes the information on the morphology of the surfaces, as well as on the propagation mechanism of cavitation cracks in this class of metallic materials. Thus, as can be seen in Figure 14, in the situation of a sample not subjected to heat treatment, in a rolled state, on a macroscopic scale the surface appears eroded almost uniformly with numerous cavitations extended over large surfaces, with polygonal shapes (Figure 14a), In the microscopic analysis (Figure 14b) the bottom surface of the cavitation has a cleavage appearance, fragile, faceted and delimited by numerous secondary cracks.
For the samples heat-treated by ageing, the aspects of the cavitation-eroded surfaces are approximately similar, with a difference in the frequency of cavitation, as well as the microscopic aspect. Thus, for example, on a surface thermally treated by ageing at 140 °C/12 h/air (Figure 15a) on a macroscopic scale, the surface shows a high frequency of cavitations, with rounded edges, of relatively small sizes (0.1–0.5 mm). On microscopic analysis (Figure 15b), the surface has a fragile appearance, with cleavage, faceted, with numerous secondary intragranular cracks.
SEM analysis confirms a brittle behavior of the 5083 aluminum alloy after cavitation erosion, the cavitation produced being generated by the secondary particles of the alloy, around which the structural integrity is destroyed. There is no volume hardening of the material through the formation of a hard phase, with high mechanical properties (such as martensite), but only a hardening of the solid solution by the precipitation of secondary phases (as in the case of aluminum alloy 5083 with the hardening phase Mg5Al8). Following the interaction of the jet with the surface, dislocation of the particles takes place, leaving an eroded surface with numerous cracks secondary intragranular.

4. Conclusions

The complex structural analysis of aluminum alloy samples type 5083, subjected to artificial ageing treatments at 140 °C/1 h, 12 h, 24 h and artificial ageing at 180 °C/1 h, 12 h, 24 h allowed the formulation of the following conclusions:
-
The application of the artificial ageing heat treatments at 140 °C (1 h, 12 h, 24 h) and 180 °C (1 h, 12 h, 24 h) can lead to changes in the mechanical and structural characteristics of the rolled aluminum alloy type 5083 products, in different proportions, in comparison with gauge sample, such as: the ultimate strength values increasing up to 30%, yielding strength values increasing up to 21%, ductility values being located in the narrow range of (6.3–6.5)%, without modification of resilience values [only in the range of 5.2–5.3], and slightly increased the hardness values. The resistance to cavitation corrosion can be increased, in the sense of decreasing penetration depths and erosion penetration speed, obtaining after ageing at 180 °C, the maximum penetration depth of the MDEmax cavity is 22.204 µm (at 1 h maintenance), 12.406 µm (at 12 h maintenance), and 5.062 µm (at 24 h maintenance).
-
The differences between the maximum values of the maximum depths measured in the axial plane of sectioning and the approximation curves, after the completion of the test (165 min), are of the order of 4–6 times. This observation reconfirms that the maximum depth measured in an axial section (dependent on the place of sectioning) is not an indicator that serves to compare the strength of the surface after the applied treatment.
-
The attack times at which the highest values are recorded for the experimentally determined velocity and that defined by the averaging curve MDER(t) are different. The explanation is related to the mass of grains (intermetallic compounds) expelled in certain phases of cavitation stress.
-
The shapes of the caverns, from pinched to united caverns, with different depths, are mainly determined by the shape of the microstructure resulting from the heat treatment regime applied.
-
Considering a quantitative parameter obtained during the stereomacrostructural analysis, the value of the ratio between the diameter of the area most affected by cavitation erosion and the initial diameter, it is observed that the value of this parameter is very high in the control sample, about 85%; it is lower after artificial ageing at 140 °C, at about 80%, reaching much lower values after applying an artificial ageing at 180 °C (up to 56%).
-
The best results regarding heat treatment of ageing applied to type 5083 aluminum rolled products are obtained after artificial ageing at 180 °C/24 h hold, with the best mechanical characteristics: ultimate strength 324.53 [MPa], yielding strength 155.43 [MPa], Brinell hardness of 87.4 [daN/mm2], an average grain size of 203.85 µm, a maximum depth of cavitation erosion MDEmax of 5 µm and the smallest ratio between the diameter of the most affected area and the initial diameter of the test sample, of approximately 55%.

Author Contributions

D.I.: Conceptualization, Methodology; I.B.: Methodology, Writing—Original draft preparation; B.G.: Conceptualization, Writing—Original draft preparation, Writing—Reviewing and Editing; B.I.: Data curation, Writing-Original draft preparation; B.-G.S., Conceptualization; Formal analysis; C.G.: Software, Data curation; A.N.L.: Methodology, Data curation; P.O.O.: Writing—Reviewing and Editing, Data curation; B.F.: Methodology, Conceptualization; D.G.: Data curation, Software. All authors have read and agreed to the published version of the manuscript.

Funding

This research was funded by European Social Fund from the Sectoral Operational Programme Human Capital 2014–2020, through the Financial Agreement with the title “Training of PhD students and postdoctoral researchers in order to acquire applied research skills—SMART”, Contract no. 13530/16.06.2022—SMIS code: 153734.

Data Availability Statement

Not applicable.

Conflicts of Interest

The authors declare no conflict of interest.

References

  1. Huang, K.; Lui, T.; Chen, L. Effect of microstructural feature on the tensile properties and vibration fracture resistance of friction stirred 5083 Alloy. J. Alloys Compd. 2011, 509, 7466–7472. [Google Scholar] [CrossRef]
  2. Bauri, R.; Yadav, D.; Kumar, C.N.S.; Balaji, B. Tungsten particle reinforced Al 5083 composite with high strength and ductility. Mater. Sci. Eng. A 2015, 620, 67–75. [Google Scholar] [CrossRef]
  3. Newbery, A.P.; Nutt, S.R.; Lavernia, E.J. Multi-scale Al 5083 for military vehicles with improved performance. Jom 2006, 58, 56–61. [Google Scholar] [CrossRef]
  4. Ke, W.; Bu, X.; Oliveira, J.; Xu, W.; Wang, Z.; Zeng, Z. Modeling and numerical study of keyhole-induced porosity formation in laser beam oscillating welding of 5A06 aluminum alloy. Opt. Laser Technol. 2021, 133, 106540. [Google Scholar] [CrossRef]
  5. Pereira, D.; Oliveira, J.; Santos, T.; Miranda, R.; Lourenço, F.; Gumpinger, J.; Bellarosa, R. Aluminium to Carbon Fibre Reinforced Polymer tubes joints produced by magnetic pulse welding. Compos. Struct. 2019, 230, 111512. [Google Scholar] [CrossRef]
  6. Torzewski, J.; Grzelak, K.; Wachowski, M.; Kosturek, R. Microstructure and Low Cycle Fatigue Properties of AA5083 H111 Friction Stir Welded Joint. Materials 2020, 13, 2381. [Google Scholar] [CrossRef] [PubMed]
  7. Bordeasu, D.; Proștean, O.; Hatiegan, C. Contributions to Modeling, Simulation and Controlling of a Pumping System Powered by a Wind Energy Conversion System. Energies 2021, 14, 7696. [Google Scholar] [CrossRef]
  8. Bordeasu, I.; Popoviciu, M.O.; Mitelea, I.; Salcianu, L.; Bordeasu, D.; Duma, S.T.; Iosif, A. Researches upon the cavitation erosion behaviour of austenite steels. IOP Conf. Ser. Mater. Sci. Eng. 2016, 106, 012001. [Google Scholar] [CrossRef]
  9. Istrate, I.; Sarcea, B.G.; Demian, A.M.; Buzatu, A.D.; Salcianu, L.; Bordeasu, I.; Micu, L.M.; Chera, C.; Florea, B.; Ghiban, B. Correlation between Mechanical Properties—Structural Characteristics and Cavitation Resistance of Cast Aluminum Alloy type 5083. Crystals 2022, 12, 1538. [Google Scholar] [CrossRef]
  10. Tian, N.; Wang, G.; Zhou, Y.; Liu, K.; Zhao, G.; Zuo, L. Study of the Portevin-Le Chatelier (PLC) Characteristics of a 5083 Aluminum Alloy Sheet in Two Heat Treatment States. Materials 2018, 11, 1533. [Google Scholar] [CrossRef] [PubMed]
  11. Nakamura, T.; Obikawa, T.; Nishizaki, I.; Enomoto, M.; Fang, Z. Friction Stir Welding of Non-Heat-Treatable High-Strength Alloy 5083-O. Metals 2018, 8, 208. [Google Scholar] [CrossRef]
  12. Tamasgavabari, R.; Ebrahimi, A.; Abbasi, S.; Yazdipour, A. The effect of harmonic vibration with a frequency below the resonant range on the mechanical properties of AA-5083-H321 aluminum alloy GMAW welded parts. Mater. Sci. Eng. A 2018, 736, 248. [Google Scholar] [CrossRef]
  13. Liu, Y.; Wang, W.; Xie, J.; Sun, S.; Wang, L.; Qian, Y.; Meng, Y.; Wei, Y. Microstructure and mechanical properties of aluminum 5083 weldments by gas tungsten arc and gas metal arc welding. Mater. Sci. 2012, 549, 7–13. [Google Scholar] [CrossRef]
  14. Ma, M.; Lai, R.; Qin, J.; Wang, B.; Liu, H.; Yi, D. Effect of weld reinforcement on tensile and fatigue properties of 5083 aluminum metal inert gas (MIG) welded joint: Experiments and numerical simulations. Int. J. Fatigue 2021, 144, 106046. [Google Scholar] [CrossRef]
  15. Corigliano, P.; Crupi, V.; Pei, X.; Dong, P. DIC-based structural strain approach for low-cycle fatigue assessment of AA 5083 welded joints. Theor. Appl. Fract. Mech. 2021, 116, 103090. [Google Scholar] [CrossRef]
  16. Ma, R.; Truster, T.J.; Puplampu, S.B.; Penumadu, D. Investigating mechanical degradation due to fire exposure of aluminum alloy 5083 using crystal plasticity finite element method. Int. J. Solids Struct. 2018, 134, 151–160. [Google Scholar] [CrossRef]
  17. Li, J.; Liu, W.C.; Zhai, T.; Kenik, W.A. Comparison of recrystallization texture in cold-rolled continuous cast AA5083 and 5182 aluminum alloys. Scr. Mater. 2005, 52, 163–168. [Google Scholar] [CrossRef]
  18. Mânzână, M.E. Experimental Studies and Investigations Regarding the Structural Modifications Produced through Cavitation-Erosion in Different Metallic Materials. Ph.D. Thesis, Universitatea Politehnica Bucuresti, București, Romania, 2012. (In Romanian). [Google Scholar]
  19. Guragata, M.C. Studies and Experimental Researches Concerning Plastic Forming and Erosion-Cavitation Behavior of Superalloy Type INCONEL 718. Ph.D. Thesis, University Politehnica Bucharest, București, Romania, 2021. (In Romanian). [Google Scholar]
  20. Bordeasu, I. Monografia Laboratorului de Cercetare a Eroziunii prin Cavitatie al Universitatii Polirehnica Timisoara (1960–2020); Editura Politehnica: Timişoara, Romania, 2020. [Google Scholar]
  21. Man, H.C.; Kwok, C.T.; Yue, T.M. Cavitation erosion and corrosion behaviour of laser surface alloyed MMC of SiC and Si3N4 on Al alloy AA6061. Surf. Coat. Technol. 2000, 132, 11–20. [Google Scholar] [CrossRef]
  22. Oanca, V.O. Techniques for Optimizing the Resistance to Cavitation Erosion of Some CuAlNiFeMn Alloys Intended for the Execution of Naval Propellers. Ph.D. Thesis, University Politehnica of Timisoara, Timisoara, Romania, 2014. (In Romanian). [Google Scholar]
  23. Garcia, R. Comprehensive Cavitation Damage Data for Water and Various Liquid Metals Including Correlation with Material and Fluid Properties; Technical Report No. 6; University of Michigan: Ann Arbor, MI, USA, 1966. [Google Scholar]
  24. Hobbs, J.M. Experience with a 20-kc Cavitation Erosion Test. In Erosion by Cavitation or Impingement; ASTM International: West Conshohocken, PA, USA, 1967; pp. 159–185. [Google Scholar]
  25. Jean-Pierre, F.; Jean-Louis, K.; Karimi, A.; Fruman, D.-H.; Fréchou, D.; Briançon-Marjollet, L.; Billard, J.-Y.; Belahadji, B.; Avellan, F.; Michel, J.M. Physical Mechanisms and Industrial Aspects; Presses Universitaires de Grenoble: Grenoble, France, 1995. [Google Scholar]
  26. Steller, K.; Reymann, Z.; Krzysztoowicz, T. Evaluation of the resistance of materials to cavitational erosion. In Proceedings of the Fifth Conference on Fluid Machinery, Akad Kiado, Budapest, 15–20 September 1975; Volume 2. [Google Scholar]
  27. Sakai, I.; Shima, A. On a New Representative Equation for Cavitation Damage Resistance of Materials; Report, No. 385; Magazine of Hydraulics, Pneumatics, Tribology, Ecology, Sensorics, Mechatronics 24: Tokyo, Japan, 1987. [Google Scholar]
  28. Bordeaşu, I.; Patrascoiu, C.; Badarau, R.; Sucitu, L.; Popoviciu, M.O.; Balasoiu, V. New contributions to cavitation erosion curves modeling. FME Trans. 2006, 34, 39–43. [Google Scholar]
  29. Micu, L.M.; Bordeasu, I.; Popoviciu, M.O. A New Model for the Equation Describing the Cavitation Mean Depth Erosion Rate Curve. Rev. Chim. 2017, 68, 894–898. [Google Scholar] [CrossRef]
  30. Tomlinson, W.J.; Matthews, S.J. Cavitation erosion of aluminium alloys. J. Mater. Sci. 1994, 29, 1101–1108. [Google Scholar] [CrossRef]
  31. Istrate, D.; Ghera, C.; Salcianu, L.; Bordeasu, I.; Ghiban, B.; Bazavan, D.V.; Micu, L.M.; Stroita, D.-C.; Ostoia, D. Heat Treatment Influence of Alloy 5083 on Cavitational Erosion Resistance. Hydraulica 2021, 3, 15–25. [Google Scholar]
  32. Bordeasu, I.; Ghera, C.; Istrate, D.; Salcianu, L.; Ghiban, B.; Bazavan, D.V.; Micu, L.M.; Stroita, D.-C.; Suta, A.; Tomoiaga, I.; et al. Resistance and Behavior to Cavitation Erosion of Semi-Finished Aluminum Alloy 5083. Hidraulica 2021, 4, 17–24. [Google Scholar]
  33. Tong, Z.; Jiao, J.; Zhou, W.; Yang, Y.; Chen, L.; Liu, H.; Sun, Y.; Ren, X. Improvement in cavitation erosion resistance of AA5083 aluminum alloy by laser shock processing. Surf. Coat. Technol. 2019, 377, 124799. [Google Scholar] [CrossRef]
  34. Bordeasu, I.; Popoviciu, M.O.; Mitelea, I.; Balasoiu, V.; Ghiban, B.; Tucu, D. Chemical and mechanical aspects of the cavitation phenomena. Rev. Chim. 2007, 58, 1300–1304. [Google Scholar]
  35. Bordeasu, D.; Proștean, O.; Filip, I.; Drăgan, F.; Vașar, C. Modelling, Simulation and Controlling of a Multi-Pump System with Water Storage Powered by a Fluctuating and Intermittent Power Source. Mathematics 2022, 10, 4019. [Google Scholar] [CrossRef]
  36. Geru, N.; Bane, M. Analiza Structurii Materialelor Metalice; Editura Tehnică: București, Romania, 1991. [Google Scholar]
  37. Bojin, D.; Miculescu, F.; Miculescu, M. Microscopie Electronică de Baleiaj și Aplicații; Editura Agir: București, Romania, 2005. [Google Scholar]
  38. Michette, A.; Pfauntsch, S. X-Ray: The First Hundred Years; John Wiley & Sons Inc.: New York, NY, USA, 1996. [Google Scholar]
  39. Szala, M.; Łatka, L.; Walczak, M.; Winnicki, M. Comparative Study on the Cavitation Erosion and Sliding Wear of Cold-Sprayed Al/Al2O3 and Cu/Al2O3 Coatings, and Stainless Steel, Aluminium Alloy, Copper and Brass. Metals 2020, 10, 856. [Google Scholar] [CrossRef]
  40. Tocci, M.; Pola, A.; Girelli, L.; Lollio, F.; Montesano, L.; Gelfi, M. Wear and Cavitation Erosion Resistance of an AlMgSc Alloy Produced by DMLS. Metals 2019, 9, 308. [Google Scholar] [CrossRef]
  41. ASTM-G32-16; Standard Method of Vibratory Cavitation Erosion Test. ASTM International: West Conshohocken, PA, USA, 2016.
  42. He, J.; Liu, X.; Li, B.; Zhai, J.; Song, J. Cavitation Erosion Characteristics for Different Metal Surface and Influencing Factors in Water Flowing System. Appl. Sci. 2022, 12, 5840. [Google Scholar] [CrossRef]
  43. Lv, Z.; Hou, R.; Zhang, Z.; Fan, Z. Effect of ultrasonic vibration on cavitation erosion of aluminum oxide in fluid jet machining. Int. J. Adv. Manuf. Technol. 2020, 111, 2911–2918. [Google Scholar] [CrossRef]
  44. Hegde, M.; Kavanagh, Y.; Duffy, B.; Tobin, E.F. Abrasion and Cavitation Erosion Resistance of Multi-Layer Dip Coated Sol-Gel Coatings on AA2024-T3. Corros. Mater. Degrad. 2022, 3, 661–671. [Google Scholar] [CrossRef]
  45. Mitelea, I.; Bordeasu, I.; Frant, F.; Utu, I.D.; Craciunescu, C.M.; Ghera, C. Cavitation Erosion Characteristics of the EN AW-6082 Aluminum Alloy by TIG Surface Remelting. Materials 2023, 16, 2563. [Google Scholar] [CrossRef] [PubMed]
  46. Mitelea, I.; Bordeasu, I.; Cosma, D.; Utu, I.D.; Craciunescu, C.M. Microstructure and Cavitation Damage Characteristics of GX40CrNiSi25-20 Cast Stainless Steel by TIG Surface Remelting. Materials 2023, 16, 1423. [Google Scholar] [CrossRef] [PubMed]
  47. Wu, L.; Yang, B.; Han, X.; Ma, G.; Xu, B.; Liu, Y.; Song, X.; Tan, C. The Microstructure and Mechanical Properties of 5083, 6005A and 7N01 Aluminum Alloy Gas Metal Arc-Welded Joints for High-Speed Train: A Comparative Study. Metals 2022, 12, 213. [Google Scholar] [CrossRef]
Figure 1. Ultimate strength experimental values of rolled alloy 5083, in different structural states. Red means gauge sample, green mean treatment at 140 °C, violet treatment at 180 °C.
Metals 13 01067 g001
Figure 2. Yield strength experimental values of rolled alloy 5083, in different structural states. Red means gauge sample, green mean treatment at 140 °C, violet treatment at 180 °C.
Metals 13 01067 g002
Figure 3. Ductility values experimental values of rolled alloy 5083, in different structural states. Red means gauge sample, green mean treatment at 140 °C, violet treatment at 180 °C.
Metals 13 01067 g003
Figure 4. Impact toughness experimental values of rolled alloy 5083, in different structural states. Red means gauge sample, green mean treatment at 140 °C, violet treatment at 180 °C.
Metals 13 01067 g004
Figure 5. Brinell hardness experimental values of rolled alloy 5083, in different structural states. Red means gauge sample, green mean treatment at 140 °C, violet treatment at 180 °C.
Metals 13 01067 g005
Figure 6. Vickers hardness experimental values of rolled alloy 5083, in different structural states. Red means gauge sample, green mean treatment at 140 °C, violet treatment at 180 °C.
Metals 13 01067 g006
Figure 7. Structural analysis of experimental rolled samples of aluminum alloy 5083: (a) gauge sample (X), (bd) ageing at 140 °C; (eg) ageing at 180 °C; (b,e) 1 h; (c,f) 12 h; (d,g) 24 h.
Metals 13 01067 g007aMetals 13 01067 g007bMetals 13 01067 g007c
Figure 8. Grain size histogram of the experimental rolled 5083 alloy samples, in different structural states.
Metals 13 01067 g008
Figure 9. X-ray diffractograms of rolled 5083 aluminum alloy samples in different structural states.
Metals 13 01067 g009
Figure 10. Average erosion depth (a,c,eg,i,k,m) and average erosion rate (b,d,f,h,i,l,n) vs. cavitation exposure time of experimental samples of aluminum 5083 alloy: (a,b)—gauge sample; (ch) ageing at 140 °C; (in) ageing at 180 °C; Holding times: (c,d,i,j)—1 h; (e,f,k,l)—12 h; (g,h,m,n)—24 h.
Metals 13 01067 g010aMetals 13 01067 g010b
Figure 11. The appearance of surfaces subjected to cavitation erosion from rolled alloy 5083, H111 (gauge sample) (piercer X). (a)—stereo macrostructural images in parallel section with the eroded surface, (b)—in cross section (background—stereomicroscope image, upper left detail—optical microscope image).
Metals 13 01067 g011
Figure 12. The appearance of the surfaces subjected to cavitation erosion from alloy 5083, rolled state H111 followed by artificial ageing at (140 °C) and different holding times: (a,c,e)—stereo macrostructural images in parallel section with the eroded surface, (b,d,f)—in cross section (background—stereomicroscope image, upper left detail—optical microscope image); (a,b)—1 h (piercer XOP); (c,d)—12 h (piercer XOL); (e,f)—24 h (piercer XOI).
Metals 13 01067 g012
Figure 13. The appearance of the surfaces subjected to cavitation erosion from rolled alloy 5083, state H111 followed by artificial ageing at 180 °C and different holding times: (a,c,e)—stereo macrostructural images in parallel section with the eroded surface, (b,d,f)—in cross section (background—stereomicroscope image, upper left detail—optical microscope image); (a,b)—1 h (piercer XP); (c,d)—12 h (piercer XL); (e,f)—24 h (piercer XI).
Metals 13 01067 g013
Figure 14. Scanning electron microscope (SEM) analysis of eroded surfaces from rolled alloy 5083 samples, state H111 (control sample), at different magnification powers of the microscope: (a)—25× (macroscopic appearance), (b)—200×, (c)—500×, (d)—2000× (microscopic appearance).
Metals 13 01067 g014aMetals 13 01067 g014b
Figure 15. Scanning electron microscope (SEM) analysis of the eroded surfaces from the alloy 5083 samples, H111, artificial ageing at 140 °C/12 h, at different microscope magnifications: (a)—25× (macroscopic appearance), (b)—200×, (c)—500×, (d)—2000× (microscopic appearance).
Metals 13 01067 g015
Table 1. Chemical composition of experimental samples of alloy 5083.
SampleChemical Composition, % wt
SiFeCuMnMgCrZnTiAl
Experimental0.380.360.0520.494.590.060.0450.01Rest
SR EN 573-3Max 0.40Max 0.40Max 0.100.4–1.04.0–4.90.05–0.25Max 0.25Max 0.15Rest
Table 2. Symbolization of the experimental samples.
Test Sample SymbolHeat Treatment Condition
XGauge sample
XOP140 °C/1 h
XOL140 °C/12 h
XOI140 °C/24 h
XP180 °C/1 h
XL180 °C/12 h
XI180 °C/24 h
Table 3. The values of the mechanical characteristics of the experimental samples type 5083 in different structural states.
Sample SymbolStateMechanical Characteristics
Ultimate Strength [UTS]Yielding StrengthDuctilityBrinell Hardness Vickers Hardness Impact Toughness
[MPa]Std
Dev
[MPa]Std
Dev
[%]Std
Dev
[daN]Std
Dev
HVStd
Dev
[J]Std
Dev
XGauge sample229.65±1.16122.68±0.816.3±0.1679.0±0.5678.11±0.604.8±0.19
XOP140 °C/1 h235.37±1.49135.78±1.116.4±0.3079.0±0.7477.44±1.015.2±0.19
XOL140 °C/12 h249.52±0.80142.19±0.836.3±0.1380.1±0.5177.92±0.575.3±0.19
XOI140 °C/24 h252.35±0.95153.34±1.206.3±0.1381.9±0.8681.30±1.325.2±0.08
XP180 °C/1 h276.14±0.89146.60±1.486.5±0.3182.5±0.7077.38±0.535.3±0.11
XL180 °C/12 h317.09±1.08147.51±0.776.5±0.2286.1±0.7781.10±0.215.3±0.21
XI180 °C/24 h324.53±1.03155.43±1.696.5±0.1287.4±1.0987.10±0.745.3±0.24
Table 4. Analysis of grain size of the experimental alloy type 5083.
CodeStateParameters of the Statistical Analysis
Grain Size
Minimum
Grain Size MaximumGrain Size MediumStandard Deviation95% Confidence Interval
[μm][μm][μm][μm][μm]
XGuage sample 2.1883832516637.81
XOP140 °C/1 h2.1870929619240.54
XOL140 °C/12 h2.1668731213132.09
XOI140 °C/24 h2.1564526014010.78
XP180 °C/1 h2.1556921911719.37
XL180 °C/12 h2.1761420911515.49
XI180 °C/24 h2.095092049812.83
Table 5. Cell parameters and crystallite size of the analyzed samples.
Test CodeCrystallographic PhaseElementary Cell Parameters,
a [Å]
Crystallite Size
D (nm)
XAl0.97Mn0.034.071141.4
XOP4.079138.9
XOL4.074148.8
XOI4.073172.6
XP4.073104.5
XL4.076162.2
XI4.079155.9
Table 6. Parameters of the erosion–cavitation process of the rolled 5083 aluminum samples.
Sample M D E R max , m M D E R max , e x p M D E R s Δ
M D E R max , m M D E R max , e x p M D E R max , m M D E R max , s
μm / min % μm / min %
X0.4570.6490.4190.19245.820.0389.07
XOP0.4650.4700.4530.0051.100.0122.65
XOL0.4260.5040.3880.07820.100.0389.79
XOI0.4170.5560.3750.13937.070.04211.20
XP0.1700.2410.1700.07141.760-
XL0.0810.0950.0790.01417.720.0022.53
XI0.0350.0610.0320.02681.250.0039.38
Table 7. The maximum penetration depth of the cavitation attack of the rolled 5083 aluminum alloy specimens, in different structural states.
SampleMaximum Penetration Depth of the Cavitation Attack
M D E m a x   μ m δ m e a s u r e d   μ m δ M D E m a x
X65.0583826
XOP63.8692975
XOL61.7212795
XOI61.0692234
XP22.20421810
XL12.40620517
XI5.06217535
Table 8. Measurement values of diameters affected by cavitation erosion, in section parallel to the surface.
SampleStateTotal Diameter
(D initially)
Total Affected Erosion Diameter
(D erosion)
Most Affected Erosion Diameter,
(D inside)
D   i n s i d e D   i n i t i a l l y
µmStd
Dev
µmStd
Dev
µmStd
Dev
[%]
XGauge sample14,293±7.713,252±8.712,257±8.785
XOP140 °C/1 h14,224±8.112,908±8.211,611±8.581
XOL140 °C/12 h14,234±7.513,062±8.611,486±8.280
XOI140 °C/24 h14,316±7.212,327±8.011,172±7.978
XP180 °C/1 h14,241±8.411,358±8.48725±7.461
XL180 °C/12 h14,281±7.99600±7.98105±7.857
XI180 °C/24 h14,179±7.39466±7.47969±7.956
Disclaimer/Publisher’s Note: The statements, opinions and data contained in all publications are solely those of the individual author(s) and contributor(s) and not of MDPI and/or the editor(s). MDPI and/or the editor(s) disclaim responsibility for any injury to people or property resulting from any ideas, methods, instructions or products referred to in the content.

