Abstract
Flanging is a key process in the forming of automobile parts and is influenced by the cutting process before it. In this paper, a set of self-designed tools is adopted. The flanging height and flanging radius are specified as the indexes to investigate the influence of the cutting process on the flanging formability of DP980 steel. Microstructure, microhardness, and tensile properties are tested to evaluate the formability of cut edges. The results show that the flanging formability is positively correlated with an increase in flanging height and a decrease in flanging radius. The flanging formability of six cut edges can be ranked as: LC-L > LC-H > WEDM-HS > WEDM-LS > CNC milling > WJC. In the LC process, acicular martensite is formed and the microhardness of the cut edge significantly increases, with a heat-affected zone of about 150 μm. More and larger microvoids are found on the edge of WEDM-LS than WEDM-HS, which reduces the formability to a certain extent. Plastic deformation of the edges is the reason for the decrease in the formability of CNC milling. For WJC, the formation of irregular edge damage and the generation of burrs are the main reasons for the unstable performance. This research is helpful in guiding the selection of the cutting process, and it may contribute to a high part formability for DP980 steel.
1. Introduction
With the increasing demand for lightweight parts in the automobile industry, ultra-high strength steel (UHSS, abbreviations are summarized in Abbreviation. The same below) is widely used in automobile structural parts; however, despite its good performance, the plate also appears to crack in the actual stamping process, which seriously affects the wide application of UHSS. Studies have shown that the main cause of sheet-edge cracking is the pre-damage defects left over from the cutting process [1,2]. However, UHSS plates usually show an obvious sensitivity to edge cracks; thus, in order to solve the problem of material cracking, researchers have studied the plates cracking from multiple sides. Khalilabad et al. [3,4] used a novel in-plane bending test to characterize the edge ductility of dual-phase steels and investigate the influence of material orientation, cutting parameters, and the global strain gradient on edge-fracture strain of DP800. Based on the modified Mohr–Coulomb fracture surface, Sandin et al. [5] developed a numerical model for the shearing and cutting process of advanced high-strength steel blanks, which could predict the edge morphology in the shear-affected zone (SAZ). Basak et al. [6] used the Hosford–Coulomb (HC) fracture model to predict the fracture initiation, and a hybrid experimental–numerical technique was adopted to calibrate the HC parameters. Based on this model, the influences of shear angle, shear gap, and punch radius on the shear edge characteristics of a DP980 sheet were investigated. Ben et al. [7,8] developed a variational formulation for predicting structure behavior and accounting for damage mechanics in metallic materials and verified the accuracy of these models in predicting ductile damage in forming and cutting processes. Feistle et al. [9] used the edge-fracture-tensile test to identify the residual formability of the un-deformed and pre-formed specimens, confirming that the type and amount of pre-forming had different effects on the sensitivity of material edge cracks. During the cutting process, the residual damage at the cut edges would reduce the formability of the material and make it prone to edge cracking [10].
Regarding dual-phase steel, it is more sensitive to edge properties, and blanking may lead to premature crack formation at the edge. Therefore, the academic community began to explore the use of alternative cutting processes, such as laser cutting, water-jet cutting, wire electrical discharge machining (WEDM), and CNC milling, besides mechanical shearing. Qian et al. [11] studied hole-expansion tests under mechanical shearing and low-speed WEDM and proved that the damage caused by low-speed WEDM to the hole edge could be negligible. Tahir et al. [12] studied the effects of different process parameters including laser power, cutting speed, auxiliary gas type, and auxiliary gas pressure on the cutting performance of UHSS in laser cutting. Thomas [13,14] studied laser edging of DP600 and found that the right balance between microstructure and optimal surface properties could be achieved by adjusting the combination of laser power and cutting speed. Zhou et al. [15] conducted tensile tests on the cut edge of a QP980 sheet and proved that the tensile properties of the oblique edge blanking could be similar to those edges manufactured by WEDM or laser cutting. Goshert et al. [16] showed through the tensile test results of QP980 and DP600 that the properties of the samples processed by WEDM and milling were similar, while the yield and tensile strengths of the samples cut by laser were higher. Water-jet cutting is another popular cutting process. Supriya et al. [17] studied the influence of an abrasive water-jet machining (AWJM) process on material processing by changing the transverse velocity, abrasive mass flow rate, water-jet pressure, material thickness, etc. However, the forming effect of water-jet cutting was not clearly stated, and the reason for the difference was still unclear. Miraoui et al. [18] proposed that an increase in laser-cutting speed and a reduction in laser power and beam diameter could reduce the depths of the melt zone and heat-affected zone (HAZ). Izmailov et al. [19] proved that a gas laser-cutting process provided an optimal combination of microgeometry and mechanical properties of the cut surface, which made it possible to reduce or eliminate subsequent processing. Li et al. [20] found that laser cutting also had an effect on the magnetic properties of the edge, which was manifested as a decrease in the relative magnetic permeability of the overall sample. Krajewski et al. [21] observed the cut edge after laser cutting with confocal microscopy and confirmed that the laser cutting speed had a significant impact on the cut-edge quality. Chang et al. [22] analyzed the effects of mechanical shearing, laser cutting, and WEDM on the straight-edge cutting performance of medium-Mn steel. The samples treated by the three processes showed different microstructures, and the WEDM samples showed the best tensile properties.
Moreover, flanging, as a subsequent step of cutting, can be used to process three-dimensional parts with more complex shapes, with good stiffness and reasonable spatial shape. At present, there are also many studies aimed at the improvement of the tensile flanging property of materials. Udhayakumar et al. [23] investigated the effects of different process conditions and different microstructure and tensile properties on the hole-expanding characteristics, confirming the importance of the hole-expanding ratio (HER) in the selection of AHSS grade in the manufacture of complex parts. Syafiq et al. [24] demonstrated that hot stamping of the material before flanging prevented the occurrence of springback and cracks, transforming the microstructure of the sheet into martensite, thereby increasing its hardness and strength. Wang et al. [25] designed a new punch with notches that could accomplish multiple flanging steps in a single stroke, improving the tensile flanging capacity of AHSSs. Li et al. [26] studied the effect of annealing process on the flanging formability of C-Mn series 590 MPa galvanized dual-phase steel. Habibi et al. [27] studied the influence of SAZ on the prediction of edge cracks and HER. Compared with WEDM, mechanical shearing introduced greater damage and a lower HER. Balisetty et al. [28] studied the influence of four different hole preparation techniques, including electrical discharge machining, drilling, drilling and reaming, and punching on the hole-expansion ratios. The above studies established a good foundation for research of the cutting and flanging process. Currently, there is still a lack of research for DP980 steel focused on systematically evaluating the quality of the cut edge, understanding the effect of the cutting process on the subsequent flanging process, and improving the formability of flanging after cutting.
Therefore, this paper is focused on the flanging process of the DP980 steel plate. A set of flanging tools is designed and manufactured to perform the flanging deformation after cutting. Different cutting processes such as WEDM, laser cutting, water-jet cutting, and CNC milling are investigated. The cracks, microstructure, and micro-hardness of the cut edge are compared to explore the effect of the cutting process on the flanging formability of the tested material. This research is helpful to understand the microstructural evolution mechanism of the cut edge and provide practical support for the selection of the optimal cutting–flanging process.
2. Material and Methods
2.1. Material and Cutting Process
DP980 steel is mainly used for high-grade automobile exterior plate, structural plate, and anti-collision components. It has the comprehensive competitive advantages of a good impact resistance, excellent formability, and low cost. Under the current development trend of lightweight parts in automobiles, DP980 steel has broad application prospects. In this paper, 1.6-mm-thick DP980 steel plates were selected as the tested material. The dimension of the plate was designed as 190 × 190 mm. Four cutting processes, namely laser cutting, WEDM, water-jet cutting, and CNC milling, were used to process the steel plates. In the experiments, the specific cutting process is summarized as follows. (i) Two WEDM processes were adopted, namely high-speed WEDM (WEDM-HS) and low-speed WEDM (WEDM-LS). A DK7732-type wire cutting machine with a recyclable molybdenum wire as the electrode wire was used in the WEDM-HS, and the cutting speed was 3200 mm2/h. A HWC43C-type wire cutting machine with a disposable copper wire as the electrode wire was used in the WEDM-LS, and the cutting speed was set as 650 mm2/h. (ii) A G4020F-type laser cutting machine, manufactured by Shenzhen Hans Co., Ltd., was adopted for laser cutting. Two different cutting processes by changing the cutting speed and cutting power were designed. One was under the condition of high speed (6000 m2/h) and high power (2000 W), and another was under the condition of low speed (3500 m2/h) and low power (1000 W), which were called LC-H and LC-L, respectively. (iii) Water-jet cutting (WJC) with an abrasive water jet was conducted on a JS-225S-4-type water-jet cutting machine manufactured by Jiangmen Jiangsheng Co., Ltd. The cutting speed was 600 mm2/min, and the water pressure was 380 MPa. (iv) CNC milling was performed on the GRM-850S-type machining center by Taiwan Gromax Co., Ltd. The steel plate was first the roughly machined and then machined by precision milling. The feed rates for the two stages were 2000 mm/min and 700 mm/min, respectively. In general, the cutting process was expanded into six types: WEDM-HS, WEDM-LS, LC-H, LC-L, WJC, and CNC milling. The specimen size after cutting is shown in the gray area in Figure 1.
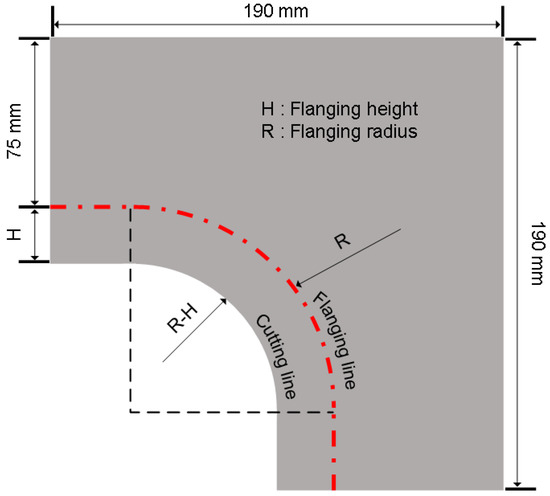
Figure 1.
Dimension of cutting-flanging specimens.
2.2. Flanging Test
Parts which are flanged after cutting are widely used in automobile components, such as doors, hood, trunk lid, roof, and chassis. Therefore, flanging tests of cut specimens were conducted. A set of flanging tools was self-designed to realize flanging tests on the SHPH27-200-type servo hydraulic press, as shown in Figure 2. The used tool is mainly composed of an upper flanging die, lower flanging die, blank holder, upper die pad, and lower die pad (Figure 2a,b). The guiding components including a guide sleeve and guide pillar were designed to control the testing direction, and nitrogen springs were added to provide the supporting force to the blank holder (Figure 2c). The upper/lower flanging dies and upper/lower die pads were replaceable in order to adjust the flanging parameters, as shown in Figure 2d.
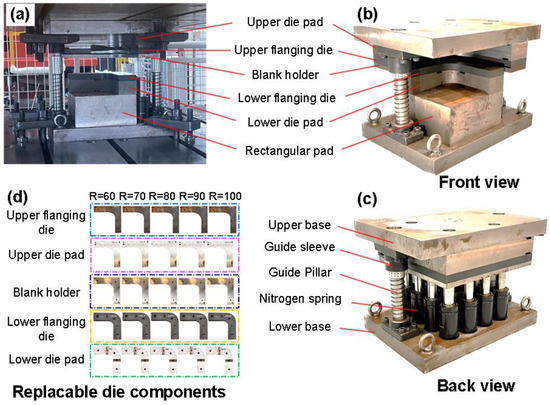
Figure 2.
Testing equipment. (a) Installation; (b) front view of the tool; (c) back view of the tool; (d) replaceable die components.
The flanging dies were used to realize the flanging tests after different cutting processes. The flanging radius and flanging height acted as the controlled process parameters. In this paper, the flanging radius R was selected as 60, 70, 80, 90, and 100 (mm) according to the conditions of the tool, respectively. Under the condition of the same flanging radius, the flanging height H was set as 10, 20, 30, 40, and 50 (mm), respectively. In the test, the flanging height gradually increased from H10 until obvious cracks occurred under a certain flanging height.
2.3. Uniaxial Tensile Test of the Cut Edge
Uniaxial tensile tests of cut edges were conducted on the Sansi UTM5105X-type universal testing machine. Tensile tests followed the Chinese National Standard GB/T228.1-2010 “Metallic materials—Tensile testing—Part 1: Method of test at room temperature”, and the specimen dimension is shown in Figure 3. The tensile specimens were manufactured along the rolling direction by using different cutting processes including WEDM-HS, WEDM-LS, LC-H, LC-L, WJC, and CNC milling. The tensile speed was 1.5 mm/min at a quasi-static state. The tensile results were compared to explore the effect of cutting process on the basic mechanical properties of the material after cutting. Each test was conducted three times to ensure reliability.
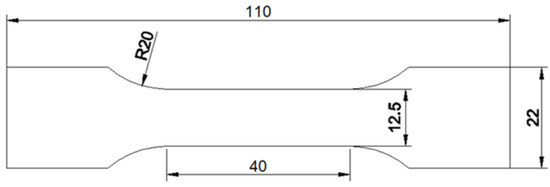
Figure 3.
Specimen dimension of uniaxial tensile test (mm).
2.4. Microstructure Observation
In order to investigate the damage and impact of the cutting process on the cut edge, a HITACHI S-4800 scanning electron microscope (SEM) was used to observe the morphology of the cut edge after cutting from the side. Samples for SEM were ground with 200 #, 400 #, 800 #, and 1200 # sandpaper one after another, then polished with the polishing cloth, and finally corroded in a 4% nitric acid alcohol solution. SEM observation was divided into two stages. The overall morphology of the cut edge was observed under a low magnification condition, and then the focused areas were observed using a high magnification.
2.5. Microhardness Test
Hardness reflects the ability of a material to locally resist plastic deformation and can effectively reflect its local performance. Therefore, the microhardness distribution of the cut edge after the cutting process was selected as the evaluation index of the local formability of the cut edge. The microhardness samples were ground and polished to achieve parallelism between the upper and lower surfaces of the samples, as well as clear material indentation. A 200HVS-5 type digital low-load Vickers hardness tester produced by Laizhou Huayin was used. The test load was set to 200 g (1.961 N), and maintained for 10 s. The indentation sizes were measured to calculate the microhardness values.
3. Results
3.1. Flanging Formability Evaluation under Different Cutting Processes
3.1.1. Flanging Formability under the WEDM Process
The flanging results of the high-speed WEDM (WEDM-HS) process are shown in Table 1. It can be seen that R70H30 is the critical condition for material cracking. With an increase in R value and a decrease in H value, the formability of flanged specimens becomes better; conversely, with a decrease in R value and an increase in H value, the formability becomes worse. Under the condition of the flanging height H30, the flanged specimens with different flanging radius R values are shown in Figure 4. When R is 60 mm or 70 mm (Figure 4a,b), significant cracking can be found at the cut edge. Although the crack number in Figure 4b is greater than that in Figure 4a, the crack length in Figure 4b is significantly shortened; this is because the plastic deformation was shared into a greater number of cracks. When R is 80 mm (Figure 4c), necking occurs at the cut edge but no crack occurs, meaning further plastic deformation will result in cracking. Furthermore, when R is increased to 90 mm (Figure 4d), no cracks are observed and the cut edge is even and smooth, which indicates that the flanging process is successfully finished.

Table 1.
Flanging results of the WEDM-HS process.
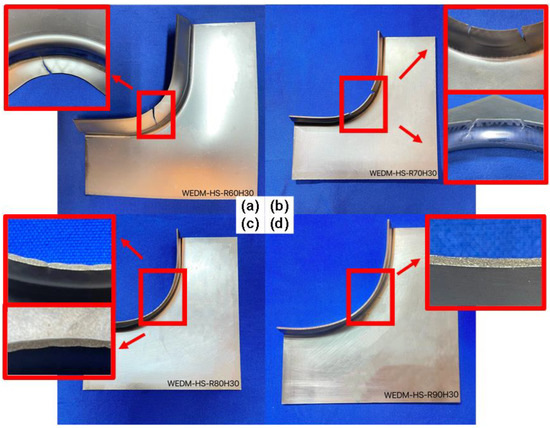
Figure 4.
Cut edges after flanging under H30 and different R values of the WEDM-HS process. (a) R60H30; (b) R70H30; (c) R80H30; (d) R90H30.
The WEDM process was conducted at a low speed in another working condition, namely WEDM-LS; the flanging results are shown in Table 2. The trends in formability dependent on R and H values are the same as those under WEDM-HS in Table 1. In contrast with the critical condition of R70H30 under WEDM-HS, R80H30 is the critical condition of cracking under WEDM-LS. The flanged specimens with R and H values around the critical condition are shown in Figure 5. When R is 80 mm (Figure 5a), the cut edge significantly cracks. Under the condition of R90 or R100 (Figure 5b,c), no cracks are found and the cutting–flanging process is successful.
Table 2.
Flanging results of the WEDM-LS process.
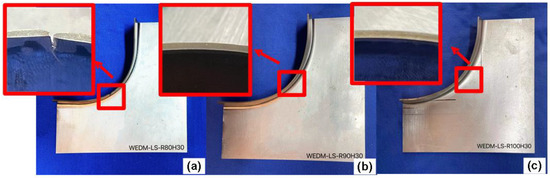
Figure 5.
Cut edges after flanging under H30 and different R values of the WEDM-LS process. (a) R80H30; (b) R90H30; (c) R100H30.
3.1.2. Flanging Formability under the Laser-Cutting Process
The flanging results under two laser-cutting types are shown in Table 3 and Table 4. Under low-power and low-speed cutting conditions (Table 3), R70H30 was selected as the critical condition of material cracking. Three flanging radii, R70, R80, and R90, were selected for comparison, as shown in Figure 6. When the flanging height H30 remains constant, there is a clear experimental phenomenon on the cut edge from cracking to successful flanging as the flanging radius increases from R70 to R90, as shown in Figure 6a,c.
Table 3.
Flanging results of the LC-L process.
Table 4.
Flanging results of the LC-H process.
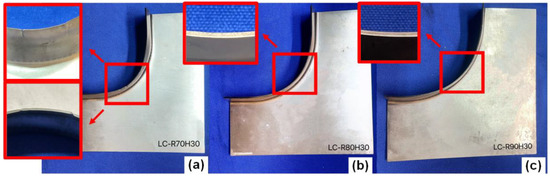
Figure 6.
Cut edges after flanging under H30 and different R values of the LC-L process. (a) R70H30; (b) R80H30; (c) R90H30.
By contrast, at high power and high speed, as listed in Table 4, the critical condition of material cracking is also R70H30. Images of cut edges after flanging under H30 and R70-R100 of the LC-H process are shown in Figure 7. The cut-edge crack can be observed under R70H30. When R is equal to 80 mm or 90 mm, the necking phenomenon can be found, while the necking degree under R90 is smaller than that under R80. This means that a larger flanging radius can contribute to a relatively better formability, even if their flanging results are both in a necking state. In general, compared with the LC-L process, the high speed and high power of the LC-H process can easily cause local damage and local large deformation on the cut edge and reduce the formability.
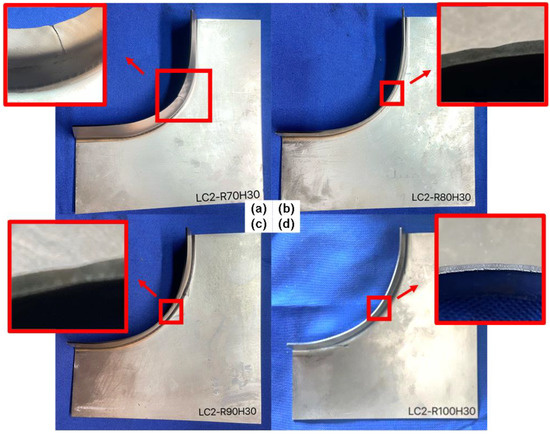
Figure 7.
Cut edges after flanging under H30 and different R values of the LC-H process. (a) R70H30; (b) R80H30; (c) R90H30; (d) R100H30.
3.1.3. Flanging Formability under the WJC Process
The flanging results under the WJC process are shown in Table 5. The changing trend of formability dependent on R and H values is basically the same as that under the WEDM process in Section 3.1.1. However, under the condition of R100H30, a crack was generated on the cut edge. Under H30, four flanging radii, R70, R80, R90, and R100, were selected for analysis, as shown in Figure 8. It can be found that at R70, the material exhibits significant cracking (Figure 8a). At R80, two relatively small cracks are formed on the cut edge (Figure 8b). At R90, necking occurs on the cut edge but no cracking occurs (Figure 8c). At R100, the material experiences slight cracking again (Figure 8d), which means that the WJC process is a relatively unstable process and the specific critical condition cannot be determined stably.
Table 5.
Flanging results of the WJC process.
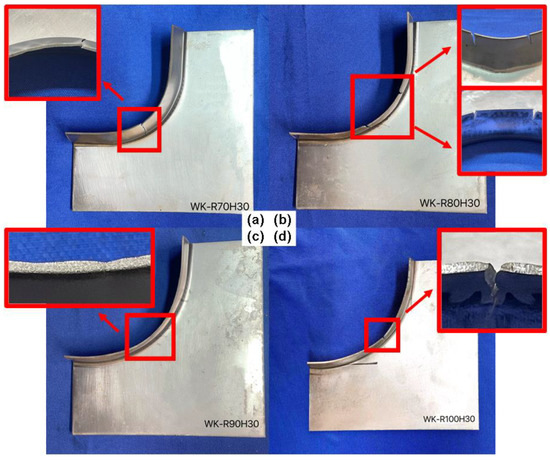
Figure 8.
Cut edges after flanging under H30 and different R values of the WJC process. (a) R70H30; (b) R80H30; (c) R90H30; (d) R100H30.
3.1.4. Flanging Formability under the CNC-Milling Process
The flanging results under the CNC-milling process are shown in Table 6. The changing trend of formability dependent on R and H values is the same as that under the WEDM process in Section 3.1.1. R80H30 is the critical condition for material cracking. With an increase in R value and a decrease in H value, the formability of flanged specimen becomes better; conversely, with a decrease in R value and an increase in H value, the formability becomes worse. Under the condition of H30, specimens of R70, R80, R90, and R100 are shown in Figure 9. With an increase in flanging radius R from R70 to R100, the material exhibits a trend from cracking, necking, to successful flanging, as shown in Figure 9a,d.
Table 6.
Flanging results of the CNC-milling process.
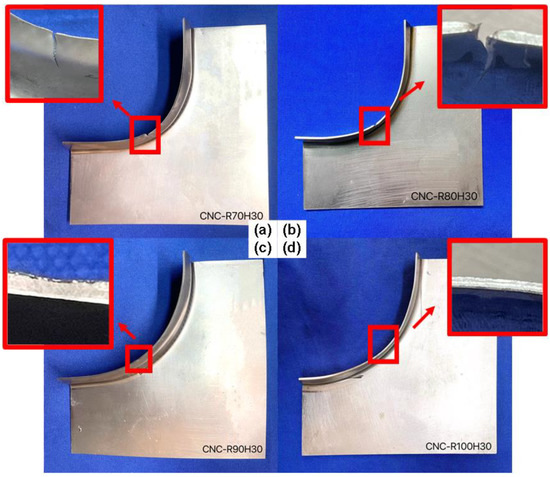
Figure 9.
Cut edges after flanging under H30 and different R values of the CNC-milling process. (a) R70H30; (b) R80H30; (c) R90H30; (d) R100H30.
3.2. Tensile Properties of Cut Specimens under Different Cutting Processes
Uniaxial tensile test was carried out on the samples treated by six kinds of cutting processes, respectively, and the engineering stress–engineering strain curves under different cutting processes were obtained. In order to specifically measure the formability gap between specimens, the yield strength and tensile strength of materials were calculated for comparison, as shown in Figure 10. As can be seen from Figure 10, different cut-edge damage conditions have an impact on the yield strength and tensile strength of the materials. The yield strength of the materials after the LC-L and LC-H processes reaches 730 MPa and 725 MPa, respectively, which is significantly improved compared with the other four processes. The yield strengths of the other four processes are about 710 MPa, and that of WJC is the lowest. The tensile strength of LC-L reaches 1011 MPa, and that of WJC is only 990 MPa, which means that WJC will seriously affect the basic mechanical properties of the cut edge. There is little difference in yield strength and tensile strength between WEDM and CNC milling. The specific influential mechanism of the cutting process on tensile properties is studied in the following section with microstructural observation.
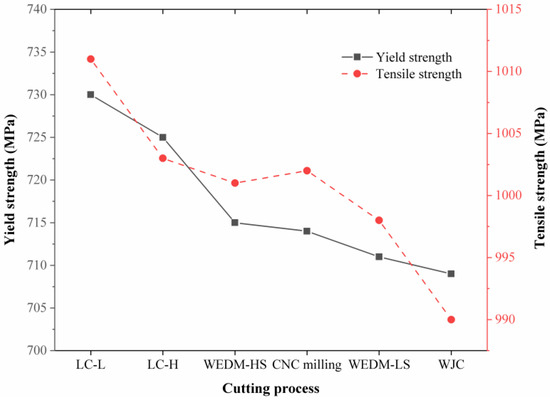
Figure 10.
Yield strength and tensile strength of cut edges under different cutting processes.
3.3. Microstructure under Different Cutting Processes
3.3.1. Microstructure of the Cut Edge after the WEDM Process
An SEM image of a cut edge after the WEDM-HS process is shown in Figure 11a. The surface of the cut edge is relatively straight and smooth, and the thickness of the plate is also retained. Two areas, denoted as Area 1 on the surface and Area 2 in the matrix, were selected along the central line for further observation. Area 1 was used to observe the effect of the cut edge, and Area 2 was selected to observe the matrix microstructure. SEM images at Area 1 and Area 2 are shown in Figure 11b,c. Certain obvious regions of local micro-damage can be seen in Figure 11b to form microvoids on the surface of the edge as a result of the influence of the electrical discharge of the wire. Comparing the microstructure near the sub-surface in Figure 11b and the matrix in Figure 11c, the depth of the affected zone of WEDM-HS can be determined as about 3 μm, which means the affected zone of cutting is small.
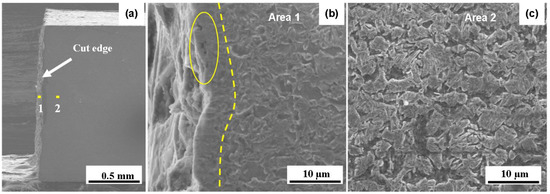
Figure 11.
SEM images of cut edges under the WEDM-HS process. (a) Overall morphology of cut edge; (b) Area 1; (c) Area 2.
An SEM image of a cut edge after the WEDM-LS process is shown in Figure 12a. The surface of the cut edge of WEDM-LS is smoother than that of WEDM-HS under the same magnification, which is attributed to the even damage originated from low speed. The middle area of the cut edge is enlarged as shown in Figure 12b. It can be seen that there are microvoids distributed at the edge. Two areas, namely Area 1 on the surface and Area 2 in the matrix, were selected along the central line for further observation. Area 1 was selected near the microvoids, and Area 2 was selected to observe the matrix microstructure. SEM images of Area 1 and Area 2 are shown in Figure 12c,d. Comparing the microstructure near the sub-surface in Figure 12c and the matrix in Figure 12d, the depth of the affected zone of WEDM-LS is about 3 μm, which is similar to the case under WEDM-HS. However, it can be seen in Figure 12c that the number and size of microvoids on the surface of the edge are greater than those under WEDM-HS as shown in Figure 11b. The likely reason for this is that for the electrical discharge of the wire under WEDM-LS, a lower speed causes a greater retention time at a certain position, which results in a longer discharge time and more damage.
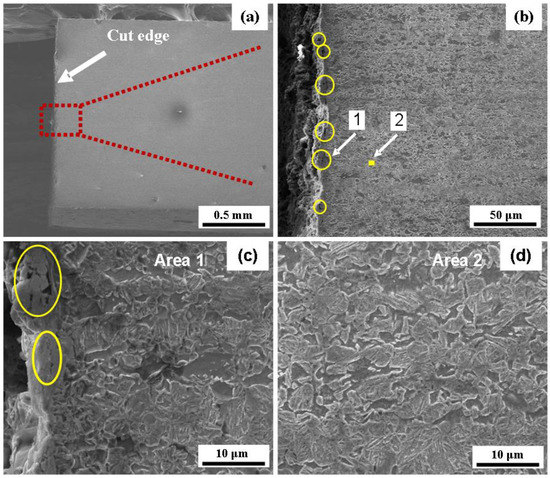
Figure 12.
SEM images of cut edges under the WEDM-LS process. (a) Overall morphology of cut edge; (b) middle area of cut edge; (c) Area 1; (d) Area 2.
3.3.2. Microstructure of Cut Edges after the Laser-Cutting Process
SEM images under the LC-L and LC-H processes are shown in Figure 13 and Figure 14. For the LC-L process, it can be seen in Figure 13a that the edges of the material are flat and smooth after laser cutting with a low speed and low power. Three areas, namely Areas 1, 2, and 3 from the surface to the matrix along the central line, were selected for further observation, as shown in Figure 13b,d. No micro-damage and no microvoids were seen on the surface of the edge (Figure 13b). Acicular martensite could be found near the sub-surface, which was generated by laser heating and subsequent cooling. In Figure 13c, a clear boundary line appears, which can be used to distinguish the heat-affected zone. As a result, the depth of the HAZ of LC-L is about 150 μm. By comparison, for the LC-H process, a similar microstructure to that of LC-L is displayed from the surface to the matrix, as shown in Figure 14a,d. The acicular martensite also appears near the sub-surface and the depth of the affected zone of LC-H is also about 150 μm. The results indicate that the microstructure of the cut edge is similar for the LC-L and LC-H processes.
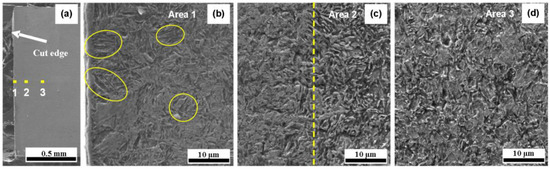
Figure 13.
SEM images of cut edges under the LC-L process. (a) Overall morphology of cut edge; (b) Area 1; (c) Area 2; (d) Area 3.
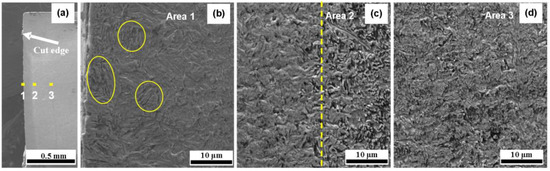
Figure 14.
SEM images of cut edges under the LC-H process. (a) Overall morphology of cut edge; (b) Area 1; (c) Area 2; (d) Area 3.
3.3.3. Microstructure of Cut Edges after the WJC Process
SEM images under the WJC process are shown in Figure 15. It can be clearly seen from Figure 15a that the cut edge after the WJC process is not straight and has a sloped edge. There is a transition area with rounded corners from the top to the bottom of the cut edge, and the horizonal distance between the top and bottom of the cut edge is about 0.5 mm. It is obvious that there is a burr near the bottom of the cut edge. Five typical areas were selected for further observation, as shown in Figure 15b–f. Figure 15f shows the microstructure of the matrix in Area 5 away from the cut edge. The cutting process successively passes through Areas 1, 2, 3, and 4. At Area 1 (Figure 15b), the surface of the edge is curved and no obvious defects are found. Plastic deformation occurs at the sub-surface along the cutting direction. Inside the sub-surface, the microstructure is the same as that in the matrix. At Area 2 (Figure 15c) near the central line, as the steel plate begins to be cut off, a large number of microcracks are generated. At Area 3 (Figure 15d), large cracks can be found and plastic deformation occurs in different directions around the crack. The fracture mainly happens at this stage. At Area 4 (Figure 15e), an obvious burr is formed, and many microcracks are distributed on the burr. Compared with the WEDM and LC processes, the cut edge of the WJC process is not a flat and smooth surface because the WJC is a pure mechanical process without heat. The cutting procedure is accompanied by plastic deformation, and therefore the surface of the edge is curved.
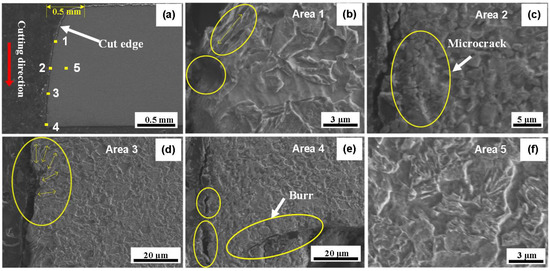
Figure 15.
SEM images of cut edges under the WJC process. (a) Overall morphology of cut edge; (b) Area 1; (c) Area 2; (d) Area 3; (e) Area 4; (f) Area 5.
3.3.4. Microstructure of Cut Edges after the CNC-Milling Process
SEM images under the CNC-milling process are shown in Figure 16. It can be seen that the cut edge after CNC milling is flat and smooth, as shown in Figure 16a, and the thickness of the plate is well retained. Three areas were selected for further observation. In Figure 16b–d of the surface of the edge, the plastic deformation only occurs on the surface layer with a small depth. The sub-surface layer keeps the same microstructure as the matrix (Figure 16d). In general, the influence of the cutting on the material is small.
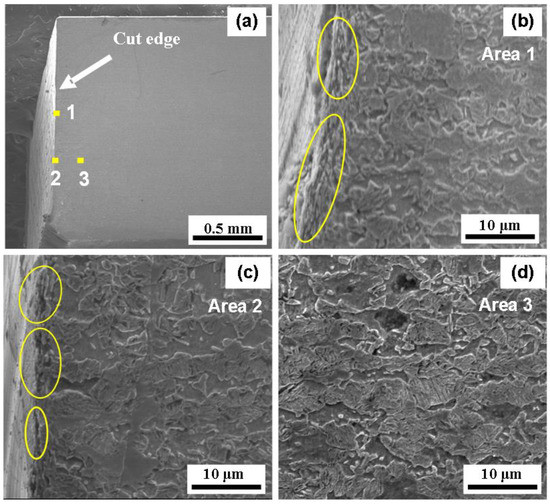
Figure 16.
SEM images of cut edges under the CNC-milling process. (a) Overall morphology of cut edge; (b) Area 1; (c) Area 2; (d) Area 3.
3.4. Microhardness Distribution of Cut Edges after Different Cutting Processes
Microhardness was measured for the specimens after different cutting processes. By analyzing SEM images of the cut edges, it was found that the other five cut edges except for the WJC edge were flat without an obvious slope; therefore, two microhardness measurement methods were designed, as shown in Figure 17. In the depth direction of the specimen, the distance from the sampling point to the cut-edge surface is set as 50 μm, 110 μm, 170 μm, 230 μm, and 300 μm, respectively. In the thickness direction of the specimen, four sampling points are set with a sampling interval of 200 μm, 400 μm, 400 μm, and 400 μm from the top to the bottom of the cut edge of the specimen in order to obtain the hardness distribution at the same depth.
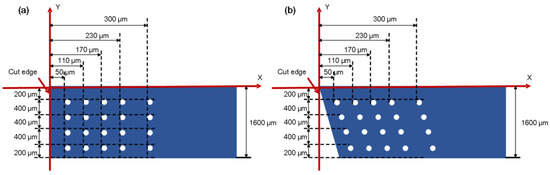
Figure 17.
Design of microhardness measurement points for the cases of the straight and oblique cut edges. (a) Straight cut edge; (b) oblique cut edge.
Microhardness values of measurement points under different cutting processes, namely WEDM-LS, WEDM-HS, LC-L, LC-H, WJC, and CNC milling, are shown in Figure 18. It can be seen that the microhardness values are basically consistent at the same depth under the same process, and therefore the average microhardness value of four sampling points at the same depth can be calculated as the microhardness value corresponding to the depth. Thus, the obtained microhardness distributions at different distances from the cut edge are shown in Figure 19. The microhardness values after laser cutting (LC-H and LC-L) are significantly enhanced, and the hardened depth is about 150 μm. The edge microhardness is 446 HV for LC-L and 427 HV for LC-H, respectively. From the cut edge, the microhardness values gradually decrease to the matrix microhardness value of about 300 HV. For the WJC, CNC milling, and WEDM processes, the microhardness value remains at about 300 HV from the edge to the matrix, which means their hardened layers are thin (<50 μm). The microhardness distribution results match the microstructure results in Section 3.3 well.
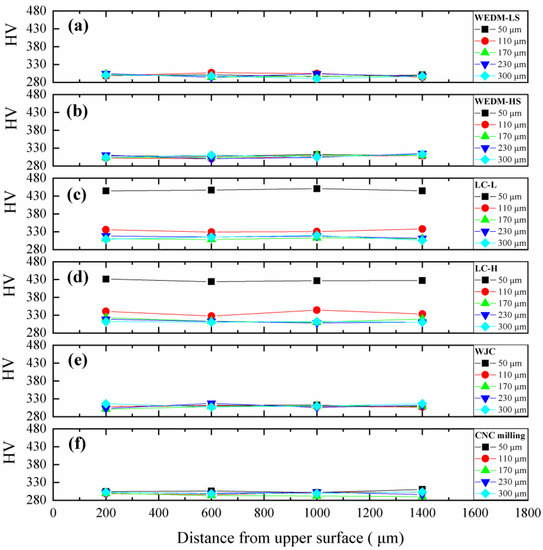
Figure 18.
Distribution of microhardness values of measurement points under different cutting processes. (a) WEDM-LS; (b) WEDM-HS; (c) LC-L; (d) LC-H; (e) WJC; (f) CNC milling.
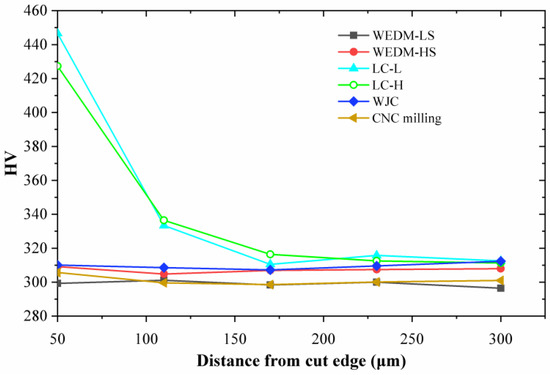
Figure 19.
Average microhardness results at each depth under different cutting processes.
4. Discussion
4.1. Influence of the Cutting Process on the Critical Condition of Flanging Cracking
Different cutting processes have a significant influence on the flanging test. The critical conditions of flanging edge cracking under different cutting processes are compared in Figure 20. Under each process, the critical flanging heights are the same at 30 mm. However, the critical flanging radii are obviously different. A rising trend is displayed from the LC-L, LC-H, WEDM-HS, WEDM-LS, CNC milling, and WJC. The critical flanging radius value is changed from 70 mm to 100 mm.
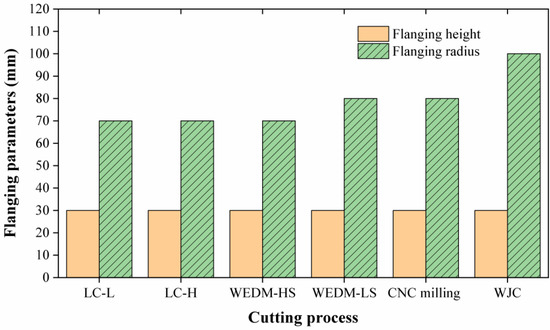
Figure 20.
Flanging parameters of critical conditions of cracking under different cutting processes.
Laser cutting is carried out by high-energy laser beams, with a high instantaneous cutting temperature, which is equivalent to the heat treatment of the material. Therefore, the critical radius is smaller and a better flanging formability is obtained. The higher the cutting power, the more rapid the cutting speed. However, a cutting speed that is too fast leads to a decrease in cutting quality. Comparing the experimental results in Table 3 and Table 4, the critical conditions of cracking under laser cutting occurred at R70H30. It could be confirmed that at a larger flanging radius than the critical radius, necking occurred under LC-H with a high speed and high power, while it did not occur under LC-L with a low speed and low power, as shown in Figure 6 and Figure 7. Therefore, the cutting power should not be set too high and the LC-L process is more suitable for the investigated material. The formability of the LC-L edge is better than that of the LC-H edge. As to the two different WEDM processes, WEDM-HS and WEDM-LS had different electrode wires and working conditions. It is interesting to note that the cutting quality of the WEDM-HS process was better. The speed of the WEDM-LS was lower, and the retention time at a certain position of the cut edge was longer, which resulted in a longer discharge time and greater damage. Therefore, the flanging formability of the WEDM-HS edge was better, as shown in Table 1 and Table 2. After the critical condition of cracking, the necking phenomenon appeared under the R80H30 condition of the LC-H process (Figure 7b); however, compared with the WEDM-HS edge under the same critical condition of cracking (Figure 4c), the necking phenomenon of the LC-H edge was reduced, so the formability of the LC-H edge was better. By contrast, the other two methods, namely CNC milling and WJC, were cold processing methods. Due to the lack of thermal factors, the deformation from the flanging process could only be achieved under pure mechanical action, which caused more mechanical damage on the cut edge, and consequently the flanging formability was worse. CNC milling had smaller critical condition parameters for cracking and thereby held a better formability. Under the R90H30 condition, the WEDM-LS edge did not show the necking phenomenon and its edge integrity was good, while the CNC-milled edge showed the necking phenomenon; thus, the formability of the WEDM-LS edge was better.
In general, the rank of the formability for the six selected processing methods is concluded as follows: LC-L > LC-H > WEDM-HS > WEDM-LS > CNC milling > WJC.
4.2. Influence of the Cutting Process on the Microstructure, Microhardness, and Tensile Properties of Cut Edges
The original structure of DP980 comprised ferrite as the matrix, and the island-shape martensite microstructure was distributed on the ferrite matrix. During the LC process, when the laser beam irradiated the surface of the DP980 steel plate, a high-temperature area was locally generated and then cooled rapidly after the laser beam passed. The local heat treatment promoted the formation of acicular martensite, as shown in Figure 13b and Figure 14b. The acicular martensite had a high hardness and excellent strength and toughness, which increased the material hardness. The acicular martensite content in Figure 13b is higher than that in Figure 14b; therefore, the edge hardness of LC-L is greater. With the increase in depth from the edge surface to the inside, the material gradually returned to the original matrix structure. The HAZ of the LC processes was about 150 μm, which matched the results in microhardness well. The microhardness of the cut-edge surface was 446 HV and 427 HV, respectively, and then decreased to the hardness of the matrix at the depth of about 150 μm. In addition, the tensile properties of the samples were compared in Figure 10. Compared with the other four processes, the yield strength and tensile strength after laser cutting were significantly improved. The yield strength was 730 MPa and 725 MPa, respectively, and the tensile strength of LC-L also increased to 1011 Mpa. The influence of the WEDM process on the cut edge was smaller than that of the LC process. During the WEDM process, the cut-affected depth of the two WEDM methods was approximately 3 μm. Comparing the microstructures of the two WEDM methods shown in Figure 11 and Figure 12, there were obvious regions of damage and microvoids at the cut edge of the WEDM-LS process, and there was a wider distribution range and larger size of microvoids. The nucleation, growth, and merging of microvoids were the main causes of material cracking. When flanging, a cut edge with many microvoids is more easily cracked. Therefore, the WEDM-LS held a larger critical flanging radius. For the CNC milling and WJC processes without a heat factor, the cutting deformation was achieved under a pure mechanical state. Therefore, the edge of CNC milling (Figure 16) exhibited microvoids and specific tensile deformation of the microstructure, resulting in significant plastic deformation within a range of approximately 2 μm, as well as a decrease in the edge hardness. The edge of WJC exhibited more tensile deformation of microstructure, microvoids, microcracks, and especially burrs, meaning that the edge formability of WJC was the worst. The analysis and comparison of the microstructure is consistent with the conclusions regarding the critical condition of flanging cracking.
In addition, according to the results of the microhardness test, the hardened layer of the edge for the LC processes was about 150 μm. For the other four processes, namely WEDM-HS, WEDM-LS, WJC, and CNC milling, the hardened layer was less than 50 μm. As shown in SEM images, the cut-affected zone was about 3 μm for WEDM and 2 μm for CNC milling. The analysis of the microstructure is consistent with the conclusions regarding microhardness.
4.3. Analysis of Reasons for the Limited Use of WJC
WJC is a high-efficiency, high-precision, and environmentally protective cutting process, and abrasives can be added to greatly enhance the cutting force. Tiny abrasives are sprayed out under extremely high pressure to destroy the tested material. However, when the abrasives are sprayed out, their moving direction is affected by the water flow and previously sprayed abrasives. Thus, the contact state and actual contact force between abrasives and the tested material are uncertain, and consequently a certain randomness exists in the damage effect. Therefore, the critical condition could not be determined to some extent. Goshert et al. [16] indicated that the data of yield strength and tensile strength of WJC showed uncertainty, believing that the lack of a hardened layer was the main reason. Hance et al. [29] confirmed that the effect of WJC was significantly worse than that of laser cutting due to its instability. As shown in Table 5, the material was necked but not cracked when the flanging height was H30 and the flanging radius was R90. However, when the flanging radius was increased to R100, cracking occurred again. It is impossible to obtain the exact necking/cracking condition from the test results because of the randomness of WJC results. Comparing WJC with CNC milling, which also did not involve thermal effects, no thick hardened layers were observed on the WJC or CNC milling edges (Figure 15 and Figure 16), but more microcracks and microvoids were found on the WJC edge which may form a potential cracking source. As a result, the flanging formability of the WJC edge was decreased.
Moreover, the cutting procedure of the WJC process can be analyzed according to stages. At the initial stage of the WJC process, the material experienced plastic deformation under a large pressure to form a curved cut edge until the fracture started. At the final stage of the WJC process, the plate was about to be cut off. The retained plate with a very thin thickness was bent downward under the water-jet pressure to generate the burr. The burr is a quite serious source of cracking, which will greatly affect the subsequent flanging process. As shown in Section 3.3, in contrast with other processes, WJC had a curved cut edge with a horizonal distance of about 0.5 mm from the top to the bottom of the cut edge. The burr was generated on the bottom surface of the plate. Therefore, compared with other processes with a relatively smooth cut edge, the formation of irregular edge damage and the burr for the WJC process resulted in the possibility of stress concentration in the subsequent flanging process, decreased the edge quality (Figure 15), and caused the occurrence of cracking. At the same time, in Section 3.2, it was also seen that the tensile strength of WJC was significantly reduced compared with other processes, only 990 MPa, which also proves the decline in the tensile capacity of the material.
Therefore, the formability after WJC cannot be accurately predicted by controlling flanging process parameters. For fine cutting and forming applications with a high-quality requirement, the WJC process is not an optimal selection for cutting. Other cutting processes are recommended.
5. Conclusions
In this paper, different cutting processes, namely high-speed WEDM, low-speed WEDM, laser cutting with a high speed and high power, laser cutting with a low speed and low power, water-jet cutting, and CNC milling, were used to cut a DP980 steel plate. A self-designed flanging device was adopted to evaluate the flanging formability of the cut edge under different cutting processes. Microstructural observation, microhardness, and tensile tests were conducted to investigate the influence of cutting processes on the flanging formability. The conclusions are presented as follows:
(i) The critical flanging conditions determined by the flanging height and flanging radius exhibited different trends under six cutting processes. Firstly, for these six cutting processes, the critical flanging height was 30 mm, while the critical flanging radius was 70 mm for LC-L, LC-H, and WEDM-HS; 80 mm for WEDM-LS and CNC milling; and 100 mm for WJC. The critical forming conditions were used to determine the level of formability. Therefore, the flanging formability of the six cut edges could be ranked as: LC-L > LC-H > WEDM-HS > WEDM-LS > CNC milling > WJC. However, the critical flanging condition of WJC was not stable; that is, the flanging formability was unstable.
(ii) The changes in microstructure after cutting had a significant impact on the flanging formability. The LC process was equivalent to a local heat treatment of the material, meaning that there was a 150-μm heat-affected zone on the edge of the material, and an acicular martensite structure was formed that could improve the hardness. The change in process parameters also affected the content of acicular martensite, and more martensite was found on the LC-L edge. Compared to WEDM-LS, WEDM-HS had a smaller range and size of microvoids on the edge, thereby demonstrating a better formability. The plastic deformation of the edges caused a decrease in the formability of CNC milling. For WJC, a curved cut edge was formed with a horizonal distance of about 0.5 mm from top to bottom. No obvious hardening layer was observed on the WJC edge; however, compared to other cutting processes, the formation of irregular edge damage and the generation of burrs were the main reasons for the unstable cutting performance of the WJC edge.
(iii) The microhardness of the cut edge was influenced by different cutting processes. Especially for the LC processes, acicular martensite was generated on the edge after laser cutting, and therefore the edge microhardness increased: 446 HV for LC-L and 427 HV for LC-H. The hardened layer of the cut edge for the other four cutting processes was thin (<50 μm) because the cut-affected zone of these four cutting processes was relatively thin.
Author Contributions
Conceptualization, Y.C.; data curation, J.Z.; formal analysis, X.L. and S.Y.; funding acquisition, Y.C.; investigation, J.Z.; methodology, Y.C., S.H., and X.L.; resources, Y.C. and S.H.; supervision, Y.C.; writing—original draft, J.Z.; writing—review and editing, X.L. and S.Y. All authors have read and agreed to the published version of the manuscript.
Funding
This work was supported by the National Natural Science Foundation of China, grant number 51971050.
Data Availability Statement
All data have been included in this article.
Conflicts of Interest
The authors declare no conflict of interest.
Abbreviation
| Abbreviations | Meaning |
| UHSS | Ultra-high strength steel |
| LC | Laser cutting |
| WEDM | Wire electrical discharge machining |
| LC-L | Laser cutting with low speed and low power |
| LC-H | Laser cutting with high speed and high power |
| WEDM-HS | High-speed wire electrical discharge machining |
| WEDM-LS | Low-speed wire electrical discharge machining |
| CNC milling | Computer numerical control milling |
| WJC | Water-jet cutting |
| HER | Hole-expanding ratio |
| SAZ | Shear-affected zone |
| SEM | Scanning electron microscope |
| HAZ | Heat-affected zone |
References
- Soussi, H.; Krichen, A. Calibration method of ductile damage model based on hybrid experimental-numerical analysis of uniaxial tensile and hole-expansion tests. Eng. Fract. Mech. 2018, 200, 218–233. [Google Scholar] [CrossRef]
- Wang, K.; Greve, L.; Wierzbicki, T. Fe simulation of edge fracture considering pre-damage from blanking process. Int. J. Solids Struct. 2015, 71, 206–218. [Google Scholar] [CrossRef]
- Khalilabad, M.M.; Perdahcioglu, E.S.; Atzema, E.H.; van den Boogaard, A.H. Measurement of edge fracture strain of dual-phase steels by in-plane bending test. In Proceedings of the 41st Annual Conference of the International-Deep-Drawing-Research-Group (IDDRG), Lorient, France, 6–10 June 2022; IOP Publishing Ltd.: Lorient, France, 2022. [Google Scholar] [CrossRef]
- Khalilabad, M.M.; Perdahcioglu, E.S.; Atzema, E.H.; van den Boogaard, A.H. An in-plane bending test to characterize edge ductility in high-strength steels. J. Mater. Eng. Perform. 2023, 32, 1892–1904. [Google Scholar] [CrossRef]
- Sandin, O.; Hammarberg, S.; Parareda, S.; Frometa, D.; Casellas, D.; Jonsen, P. Prediction of sheared edge characteristics of advanced high strength steel. In Proceedings of the 41st Annual Conference of the International-Deep-Drawing-Research-Group (IDDRG), Lorient, France, 6–10 June 2022; IOP Publishing Ltd.: Lorient, France, 2022. [Google Scholar] [CrossRef]
- Basak, S.; Kim, C.; Jung, Y.I.; Jin, H.K.; Lee, M.G. Analyses of shearing mechanism during shear-cutting of 980 mpa dual-phase steel sheets using ductile fracture modeling and simulation. Int. J. Mater. Form. 2022, 15, 21. [Google Scholar] [CrossRef]
- Ben Said, L.; Wali, M. Accuracy of variational formulation to model the thermomechanical problem and to predict failure in metallic materials. Mathematics 2022, 10, 3555. [Google Scholar] [CrossRef]
- Ben Said, L.; Chabchoub, A.K.; Wali, M. Mathematical Model Describing the Hardening and Failure Behaviour of Aluminium Alloys: Application in Metal Shear Cutting Process. Mathematics 2023, 11, 1980. [Google Scholar] [CrossRef]
- Feistle, M.; Kindsmuller, A.; Patzold, I.; Golle, R.; Volk, W. Influence of sheet metal pre-forming on edge crack sensitivity using an ahss steel grade. Int. J. Mater. Form. 2022, 15, 11. [Google Scholar] [CrossRef]
- Habibi, N.; Munstermann, S. Adjustment of fracture locus to improve edge crack resistance. In Proceedings of the 41st Annual Conference of the International-Deep-Drawing-Research-Group (IDDRG), Lorient, France, 6–10 June 2022; IOP Publishing Ltd.: Lorient, France, 2022. [Google Scholar] [CrossRef]
- Qian, L.Y.; Ji, W.T.; Sun, C.Y.; Fang, G.; Lian, J.H. Prediction of edge fracture during hole-flanging of advanced high-strength steel considering blanking pre-damage. Eng. Fract. Mech. 2021, 248, 15. [Google Scholar] [CrossRef]
- Tahir, A.F.M.; Rashid, A.R.; Sariff, N.E.; Rahim, E.A. CO2 laser cutting performance on ultra high strength steel (uhss). Lasers Manuf. Mater. Process. 2020, 7, 15–37. [Google Scholar] [CrossRef]
- Thomas, D.J. Understanding the effects of mechanical and laser cut-edges to prevent formability ruptures during automotive manufacturing. J. Fail. Anal. Prev. 2013, 13, 451–462. [Google Scholar] [CrossRef]
- Thomas, D.J. Life assessment and crack growth properties of laser cut dual-phase steel. J. Fail. Anal. Prev. 2016, 16, 811–820. [Google Scholar] [CrossRef]
- Zhou, M.; Li, Y.H.; Hu, Q.; Li, X.F.; Chen, J. Investigations on edge quality and its effect on tensile property and fracture patterns of qp980. J. Manuf. Process. 2019, 37, 509–518. [Google Scholar] [CrossRef]
- Goshert, B.; Terrazas, O.R.; Matlock, D.K.; Van Tyne, C.J. Sample edge effects on tensile properties and sheet formability. In Proceedings of the 37th Annual Conference of the International-Deep-Drawing-Research-Group (IDDRG)—Forming of High Performance Sheet Materials and Components, Waterloo, ON, Canada, 3–7 June 2018; IOP Publishing Ltd.: Waterloo, ON, Canada, 2018. [Google Scholar] [CrossRef]
- Supriya, S.B.; Srinivas, S. Machinability studies on stainless steel by abrasive water jet—Review. In Proceedings of the International Conference on Advanced Materials and Applications (ICAMA), Bengaluru, India, 15–17 June 2016; Elsevier: Bengaluru, India, 2018; pp. 2871–2876. [Google Scholar] [CrossRef]
- Miraoui, I.; Boujelbene, M.; Zaied, M. High-power laser cutting of steel plates: Heat affected zone analysis. Adv. Mater. Sci. Eng. 2016, 2016, 8. [Google Scholar] [CrossRef]
- Izmailov, V.V.; Barchukov, D.A.; Novoselova, M.V.; Afanasieva, L.E. Surface microgeometry and microstructure of the gas laser cut of a two-layer steel material. J. Frict. Wear 2021, 42, 290–295. [Google Scholar] [CrossRef]
- Li, Y.; Fu, Y.; Dou, Y.; Zhang, C.; Zhang, K.J.A.A. Magnetic properties measurement and analysis of electrical steel sheet under cutting influence. AIP Adv. 2021, 11, 025115. [Google Scholar] [CrossRef]
- Krajewski, S.J.; Grochala, D.; Tomkow, J.; Grzejda, R. Analysis of the surface stereometry of alloyed austenitic steel after fibre laser cutting using confocal microscopy. Coatings 2023, 13, 15. [Google Scholar] [CrossRef]
- Chang, Y.; Han, S.; Li, X.D.; Wang, C.Y.; Zheng, G.J.; Dong, H. Effects of different cutting processes on characteristics of cut damage for the third-generation automobile medium-mn steel. Steel Res. Int. 2018, 89, 10. [Google Scholar] [CrossRef]
- Udhayakumar, T.; Paliwal, L.; Misal, S.; Ponkshe, S. Hole expansion characteristics of advanced high strength steel (AHSS) grades and their effects on manufacturability in automotive industry. SAE Tech. Pap. 2022, 2022-28-0350. [Google Scholar] [CrossRef]
- Syafiq, Y.M.; Hamedon, Z.; Aziz, W.A.; Yusoff, A.R. Prevention of crack in stretch flanging process using hot stamping technique. In Proceedings of the 4th International Conference on Mechanical Engineering Research (ICMER), Kuantan, Malaysia, 1–2 August 2017; IOP Publishing Ltd.: Kuantan, Malaysia, 2017. [Google Scholar] [CrossRef]
- Wang, M.H.; Wang, S.J.; Li, Z. Multi-step forming punch (mfp) for improving stretch-flangeability of advanced high-strength steel. Int. J. Adv. Manuf. Technol. 2018, 99, 1627–1638. [Google Scholar] [CrossRef]
- Li, H.; Dai, J.; Chen, Y.; Chen, J.; Li, L. Effect of annealing process on flanging formability of 590mpa grade galvannealing dual phase steel. J. Phys. Conf. Ser. 2020, 1653, 012022. [Google Scholar] [CrossRef]
- Habibi, N.; Beier, T.; Richter, H.; Konemann, M.; Munstermann, S. The effects of shear affected zone on edge crack sensitivity in dual-phase steels. In Proceedings of the 38th Annual Conference of the International-Deep-Drawing-Research-Group (IDDRG), Enschede, The Netherlands, 3–7 June 2019; IOP Publishing Ltd.: Enschede, The Netherlands, 2019. [Google Scholar] [CrossRef]
- Balisetty, V.; Chakkingal, U.; Venugopal, S. Evaluation of stretch flangeability of dual-phase steels by hole expansion test. Int. J. Adv. Manuf. Technol. 2021, 114, 205–217. [Google Scholar] [CrossRef]
- Hance, B.M.; Comstock, R.J.; Scherrer, D.K.J.S.T.P. The influence of edge preparation method on the hole expansion performance of automotive sheet steels. SAE Tech. Pap. 2013, 2013-01-1167. [Google Scholar] [CrossRef]
Disclaimer/Publisher’s Note: The statements, opinions and data contained in all publications are solely those of the individual author(s) and contributor(s) and not of MDPI and/or the editor(s). MDPI and/or the editor(s) disclaim responsibility for any injury to people or property resulting from any ideas, methods, instructions or products referred to in the content. |
© 2023 by the authors. Licensee MDPI, Basel, Switzerland. This article is an open access article distributed under the terms and conditions of the Creative Commons Attribution (CC BY) license (https://creativecommons.org/licenses/by/4.0/).