Article

Study on Growth Mechanism and Characteristics of Zirconium Alloy Micro-Arc Oxidation Film

1
School of Materials Science and Engineering, Inner Mongolia University of Technology, Hohhot 010051, China
2
Engineering Research Center of Development and Processing Protection of Advanced Light Metals, Ministry of Education, Hohhot 010051, China
3
The Inner Mongolia Advanced Materials Engineering Technology Research Center, Hohhot 010051, China
*
Author to whom correspondence should be addressed.
Metals 2023, 13(5), 935; https://doi.org/10.3390/met13050935
Submission received: 21 April 2023 / Revised: 8 May 2023 / Accepted: 9 May 2023 / Published: 11 May 2023
(This article belongs to the Special Issue Research on Advanced Forming Technology and Process of Light Alloys)

Abstract

:
Ceramic coatings on R60705 zirconium alloy were prepared on the surface by the micro-arc oxidation (MAO) technique in electrolytes containing Na2SiO3, NaOH, and Na2EDTA. The growth behavior of the MAO ceramic coatings at different stages, including growth rate, microstructure, and phase composition, was investigated using the method of direct observation of the boundary area. The results showed that the growth of the MAO coatings on R60705 zirconium alloy occurred in both inward and outward directions. At an oxidation time of 5 min, the thickness of the oxidation layer increased fastest, reaching 103.43 μm, with a growth rate of 0.345 μm/s. After 5 min, the growth rate decreased and tended to level off around 15 min, with a thickness and growth rate of 162.7 μm and 0.181 μm/s, respectively. The total thickness of the coatings continuously increased throughout the process, with the outward growth thickness always higher than the inward growth thickness. The composition of the zirconium alloy micro-arc oxidation coatings mainly consisted of monoclinic zirconia (m-ZrO2), tetragonal zirconia (t-ZrO2), and a small amount of SiO2. The main elements in the coatings were Zr, O, and Si. The corrosion resistance of the zirconium alloy micro-arc oxidation coatings increased first and then decreased with increasing oxidation time, with a corrosion current density of 8.876 × 10⁻⁹ A·cm−2 at 15 min, indicating the best corrosion resistance.

1. Introduction

Zirconium alloys with low thermal neutron absorption cross-sections are often used in the nuclear industry [1,2,3,4]. Zirconium alloys are also used in the chemical and biomedical fields due to their excellent wear resistance, corrosion resistance, and biocompatibility [5,6]. With the development of society and technological progress, further requirements have been put forward for the wear and corrosion resistance of zirconium alloys [7]. Compared with anodic oxidation, sol–gel, and other surface treatment technologies, the oxide film made by micro-arc oxidation technology has better wear and corrosion resistance, a strong bonding force with the matrix, and can effectively extend the service life of zirconium alloy [8,9,10,11].
Micro-arc oxidation has attracted extensive attention since its birth. Many scholars at home and abroad have made outstanding achievements in the research on the performance, structure, and composition of micro-arc oxidation ceramic coatings [12,13,14,15,16]. However, there is not yet a complete theoretical system for film growth. Wenbin et al. [17] proposed that the micro-arc oxidation film on ZM5 magnesium alloy mainly grows outward in the early stage, and after reaching a certain thickness, it completely turns to grow inside the matrix. Ping et al. [18] proposed that the film growth of Mg GD Y magnesium alloy follows a linear pattern. Their research mainly focuses on measurement and calculation and cannot directly observe and judge the growth of the film layer.
This experiment adopts the boundary zone direct observation method proposed by Hairong et al. [19] and uses a scanning electron microscope to directly observe the inward and outward growth of the filmed and non-filmed areas under the same field of view. In addition, this experiment prepares zirconium alloy micro-arc oxidation film layers under different growth conditions by controlling the time. The growth of the film layers at different stages can be directly observed, and the growth mechanism of the zirconium alloy micro-arc oxidation film layer can be studied by analyzing the surface morphology, roughness, thickness, and wear resistance of the micro-arc oxidation film at different oxidation times. This provides a theoretical basis for optimizing the performance of the film layer and controlling the thickness and morphology of the film layer. By understanding the growth mechanism of micro-arc oxidation film layers, the properties and performance of the film layers can be better predicted and controlled, and the application value of micro-arc oxidation technology can be improved.

2. Experimental

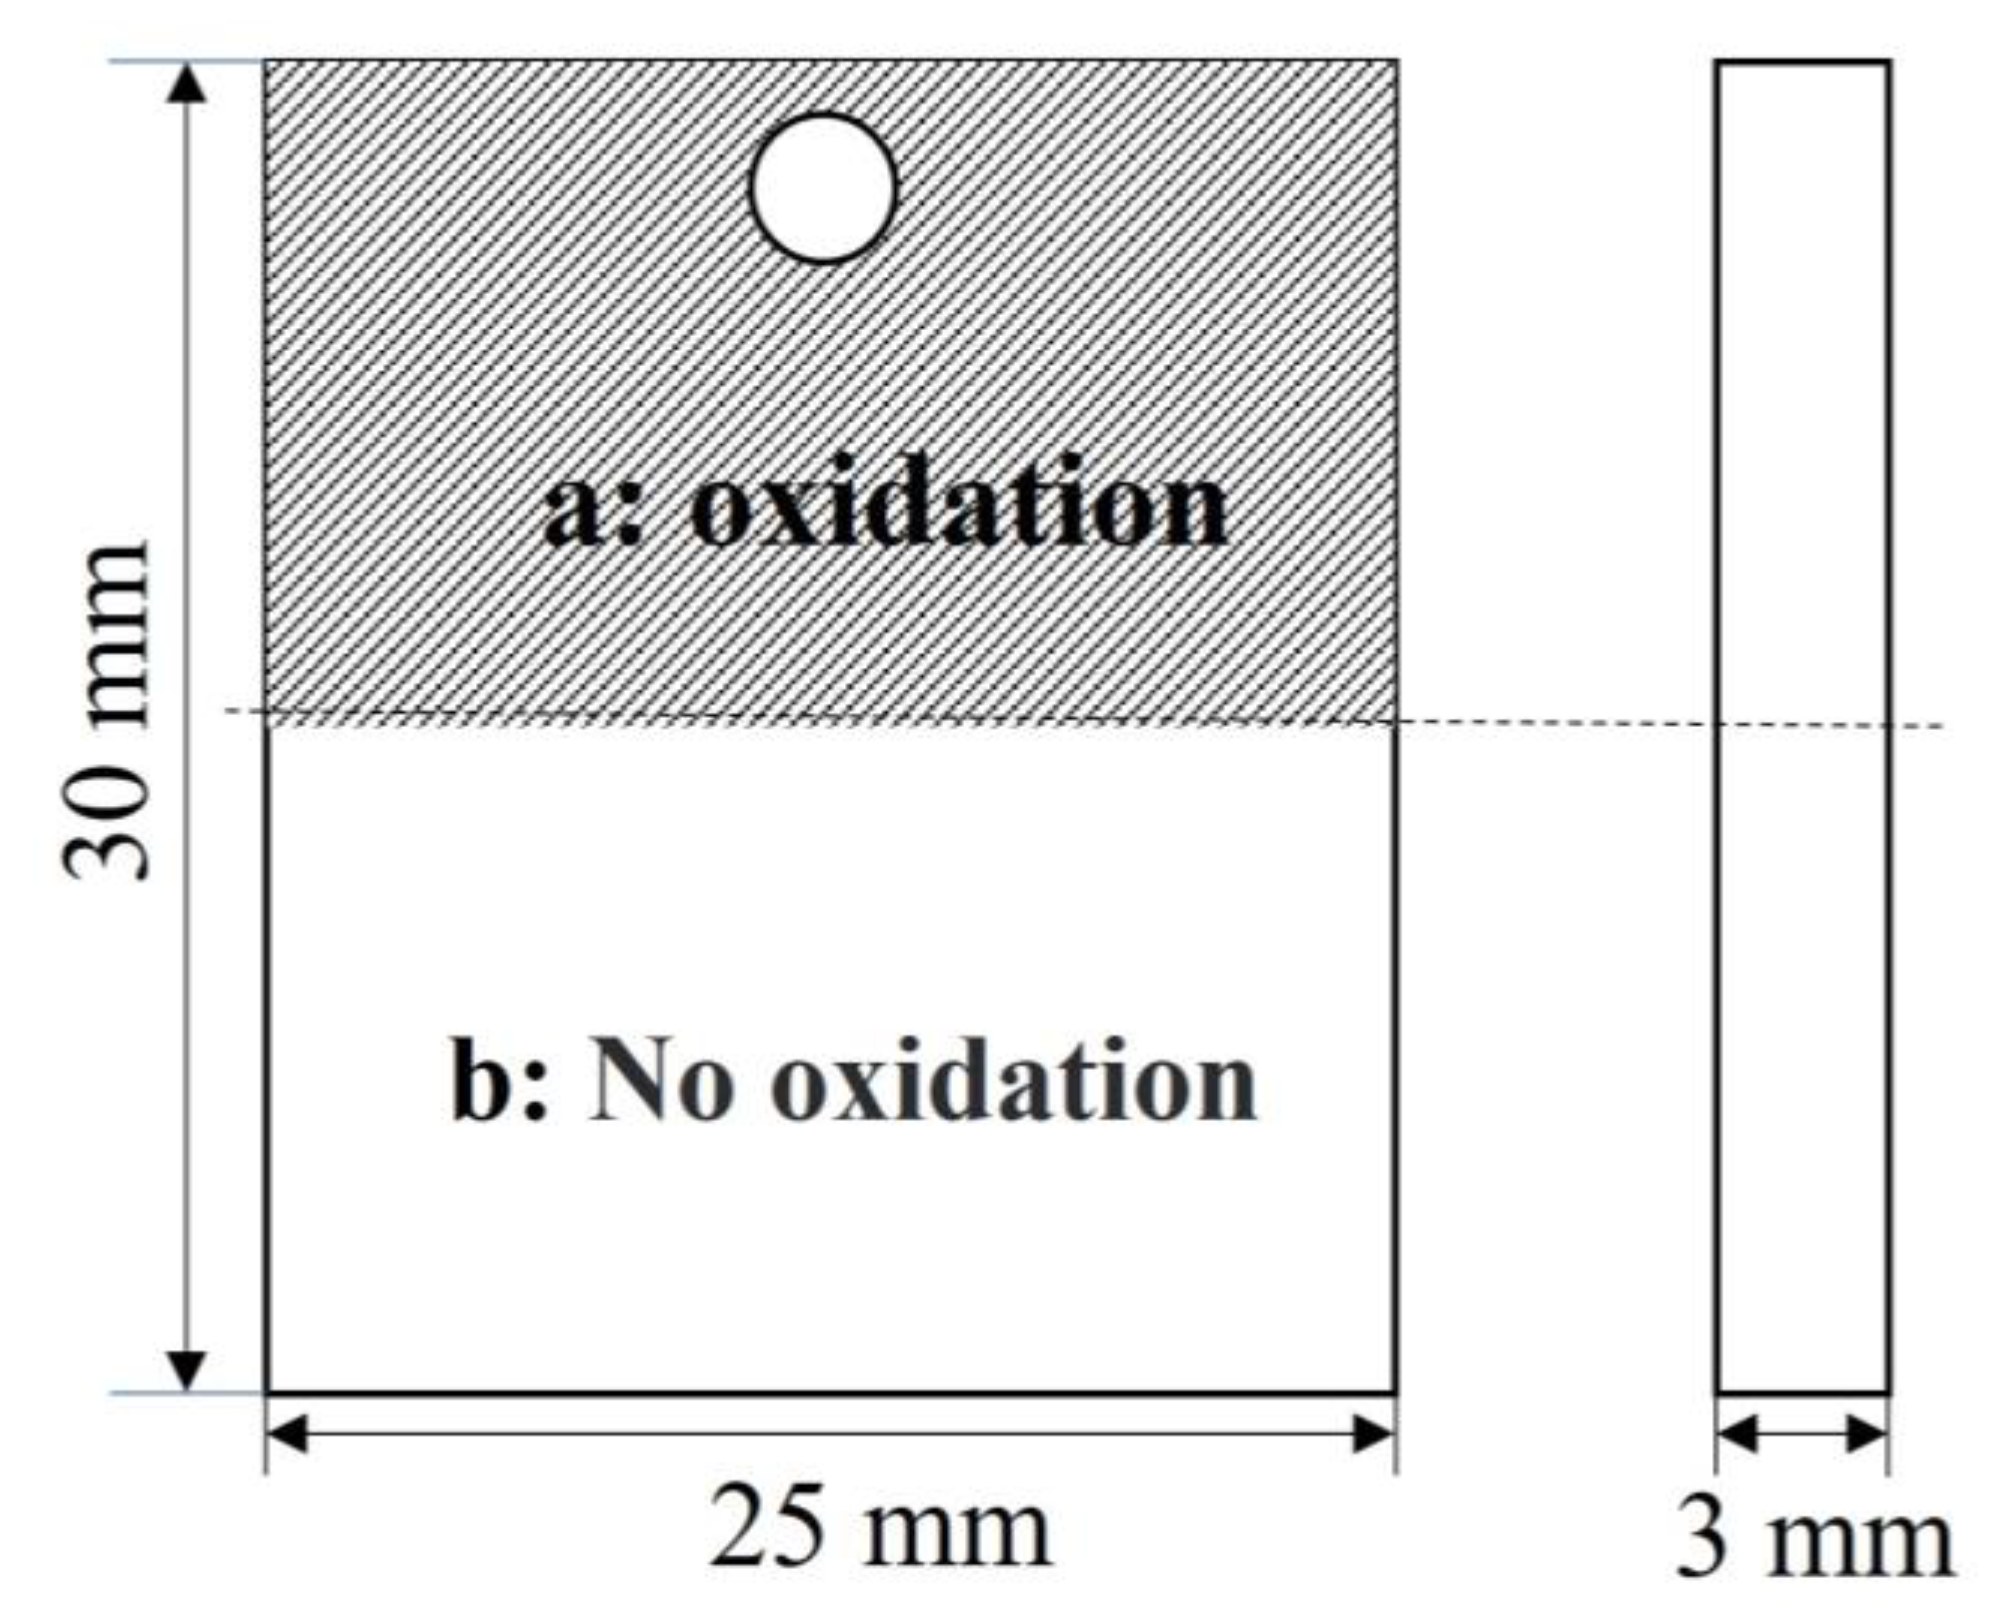
2.1. Materials and Methods

The experimental substrate for micro-arc oxidation was R60705 zirconium alloy, which was cut into a flake-like shape of 30 mm × 25 mm × 3 mm, and then polished with sandpaper step-by-step and washed with acetone. An electrolyte solution comprised 16.0 g·L−1 of Na2SiO3, 2.0 g·L−1 of Na2EDTA, and 2.0 g·L−1 of NaOH. The electrolyte by a circulating water-cooling system was controlled between 20 °C and 30 °C. The constant-voltage mode was adopted, and the MAO parameters were selected as shown in Table 1.

2.2. Characterization

To characterize the growth of MAO coatings, the method of direct observation of the boundary area was used. The lower half of the sample was insulated and sealed to achieve non-oxidation of this area, as shown in Figure 1. The growth of the coating in and out was observed and calculated based on the non-oxidation half.
The thickness of the MAO coating was measured by an eddy current thickness meter (HCC-25 Hitachi Analytical Science Ltd., Shanghai, China). The average value was measured by 10 points at different positions on the front and back of the sample. Laser confocal microscopy (LSM700, Zeiss, Oberkochen, Germany) was used to measure the roughness (Ra). The HitachiS-3400NII (Horiba, Kyoto, Japan) scanning electron microscope and EMAX energy spectrometer were used to analyze the micromorphology and elemental composition of the MAO coating. The DZ-322TABER (Dazhong Instrument Co., Ltd., Dongguan, China) wear-resisting tester was used to test the wear resistance of the MAO coating (250 g load, 50 r/min speed). X-ray diffraction (XRD) analysis was performed on an X-ray diffractometer (PW1700, Cu Kα radiation, Rigaku, Tokyo, Japan) to identify the different phases present in the coatings. The scanning angle ranged from 20° to 80° and the scanning rate was 2°/min.
In order to determine the valence states of different elements in the oxide film according to the binding energy of the peaks, and verify with the XRD results, XPS analysis was conducted with the ESCALAB-250Xi X-ray photoelectron spectroscopy instrument (Thermo Fisher Scientific, Waltham, MA, USA). The test parameter was monochrome Al Kα (hv = 1486.6 eV).
A Zennium (Zahner, Germany) electrochemical workstation was used to characterize the corrosion properties of the film layer in a 3.5% NaCl solution. The reference electrode was a saturated calomel electrode and the auxiliary electrode was a platinum electrode. The sample was wrapped with epoxy resin and protected as a working electrode, with a bare area of 1 cm2. Before the experiment, in order to stabilize the open-circuit potential, the sample was immersed in a NaCl solution for about 1 h, with a polarization curve scanning range of ±0.6 V and a scanning rate of 1 mv/s. In order to characterize the corrosion properties of the film layer, EIS tests were performed on the film layer. The frequency scanning range was from 100 kHz to 1 kHz, and the amplitude of the AC excitation signal was 10 mV. After the experiment, equivalent circuit fitting was performed using Zview software to obtain the resistance and capacitance information of the oxide film.

3. Results and Discussion

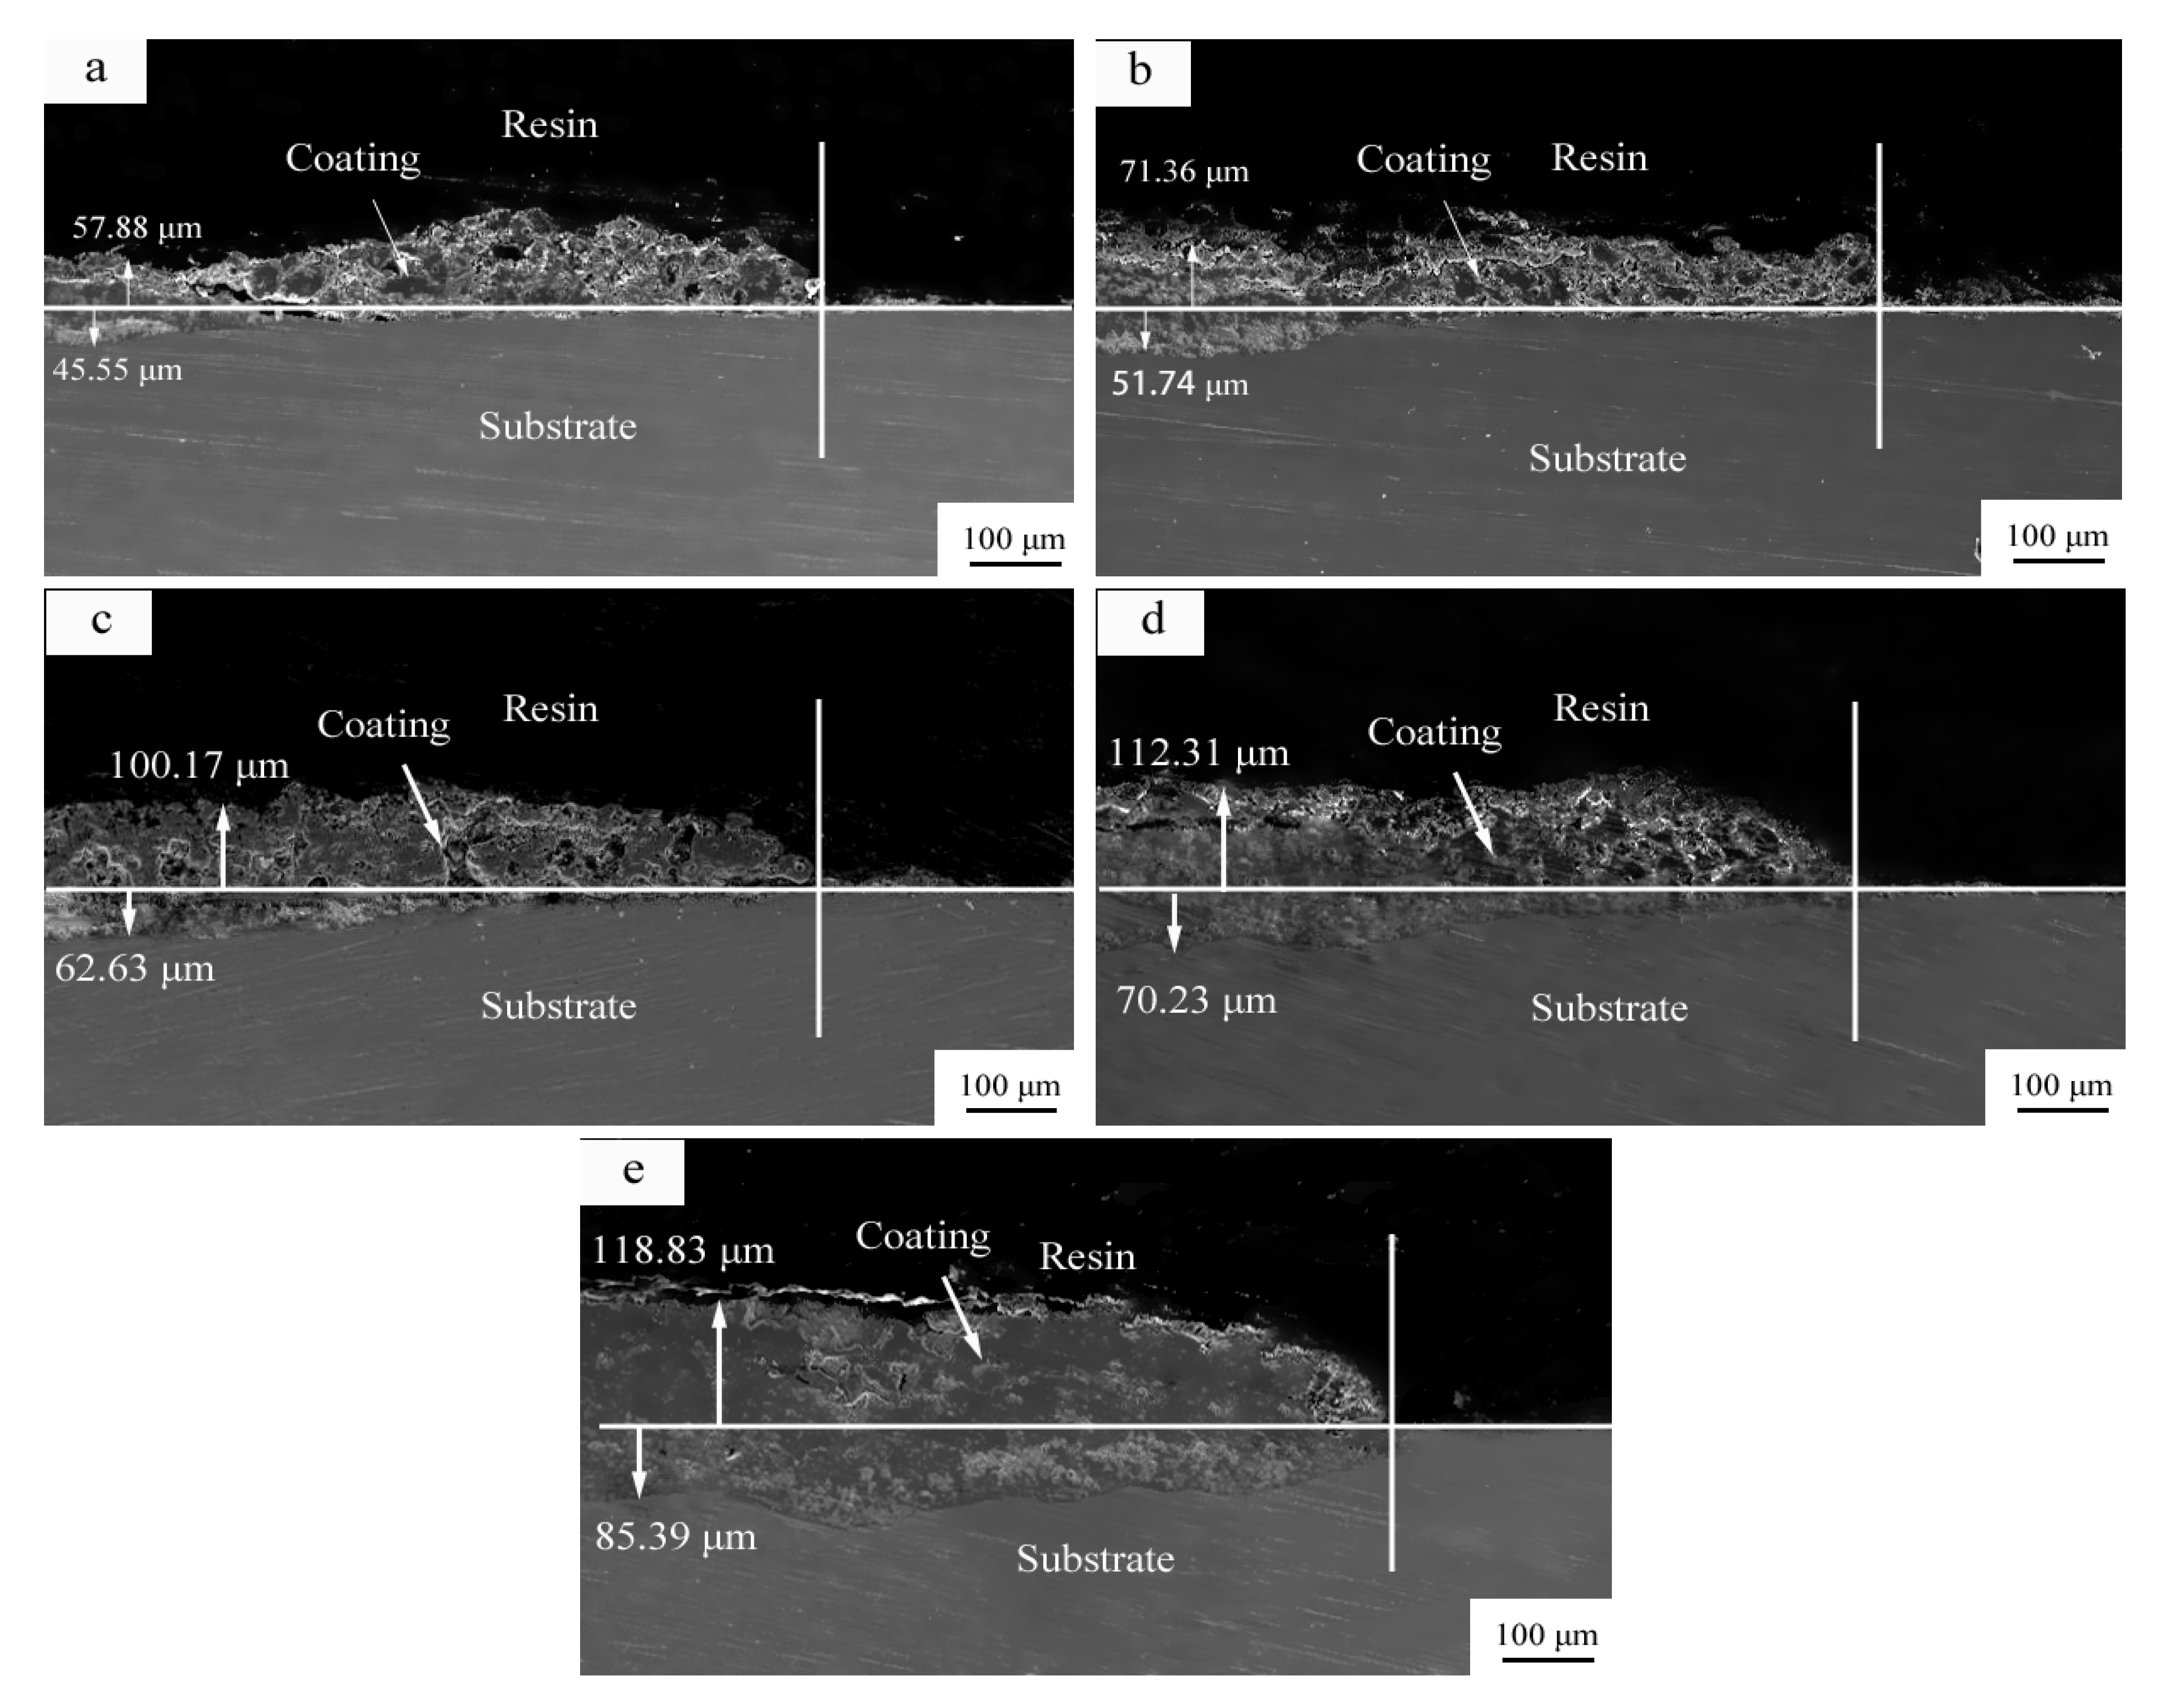
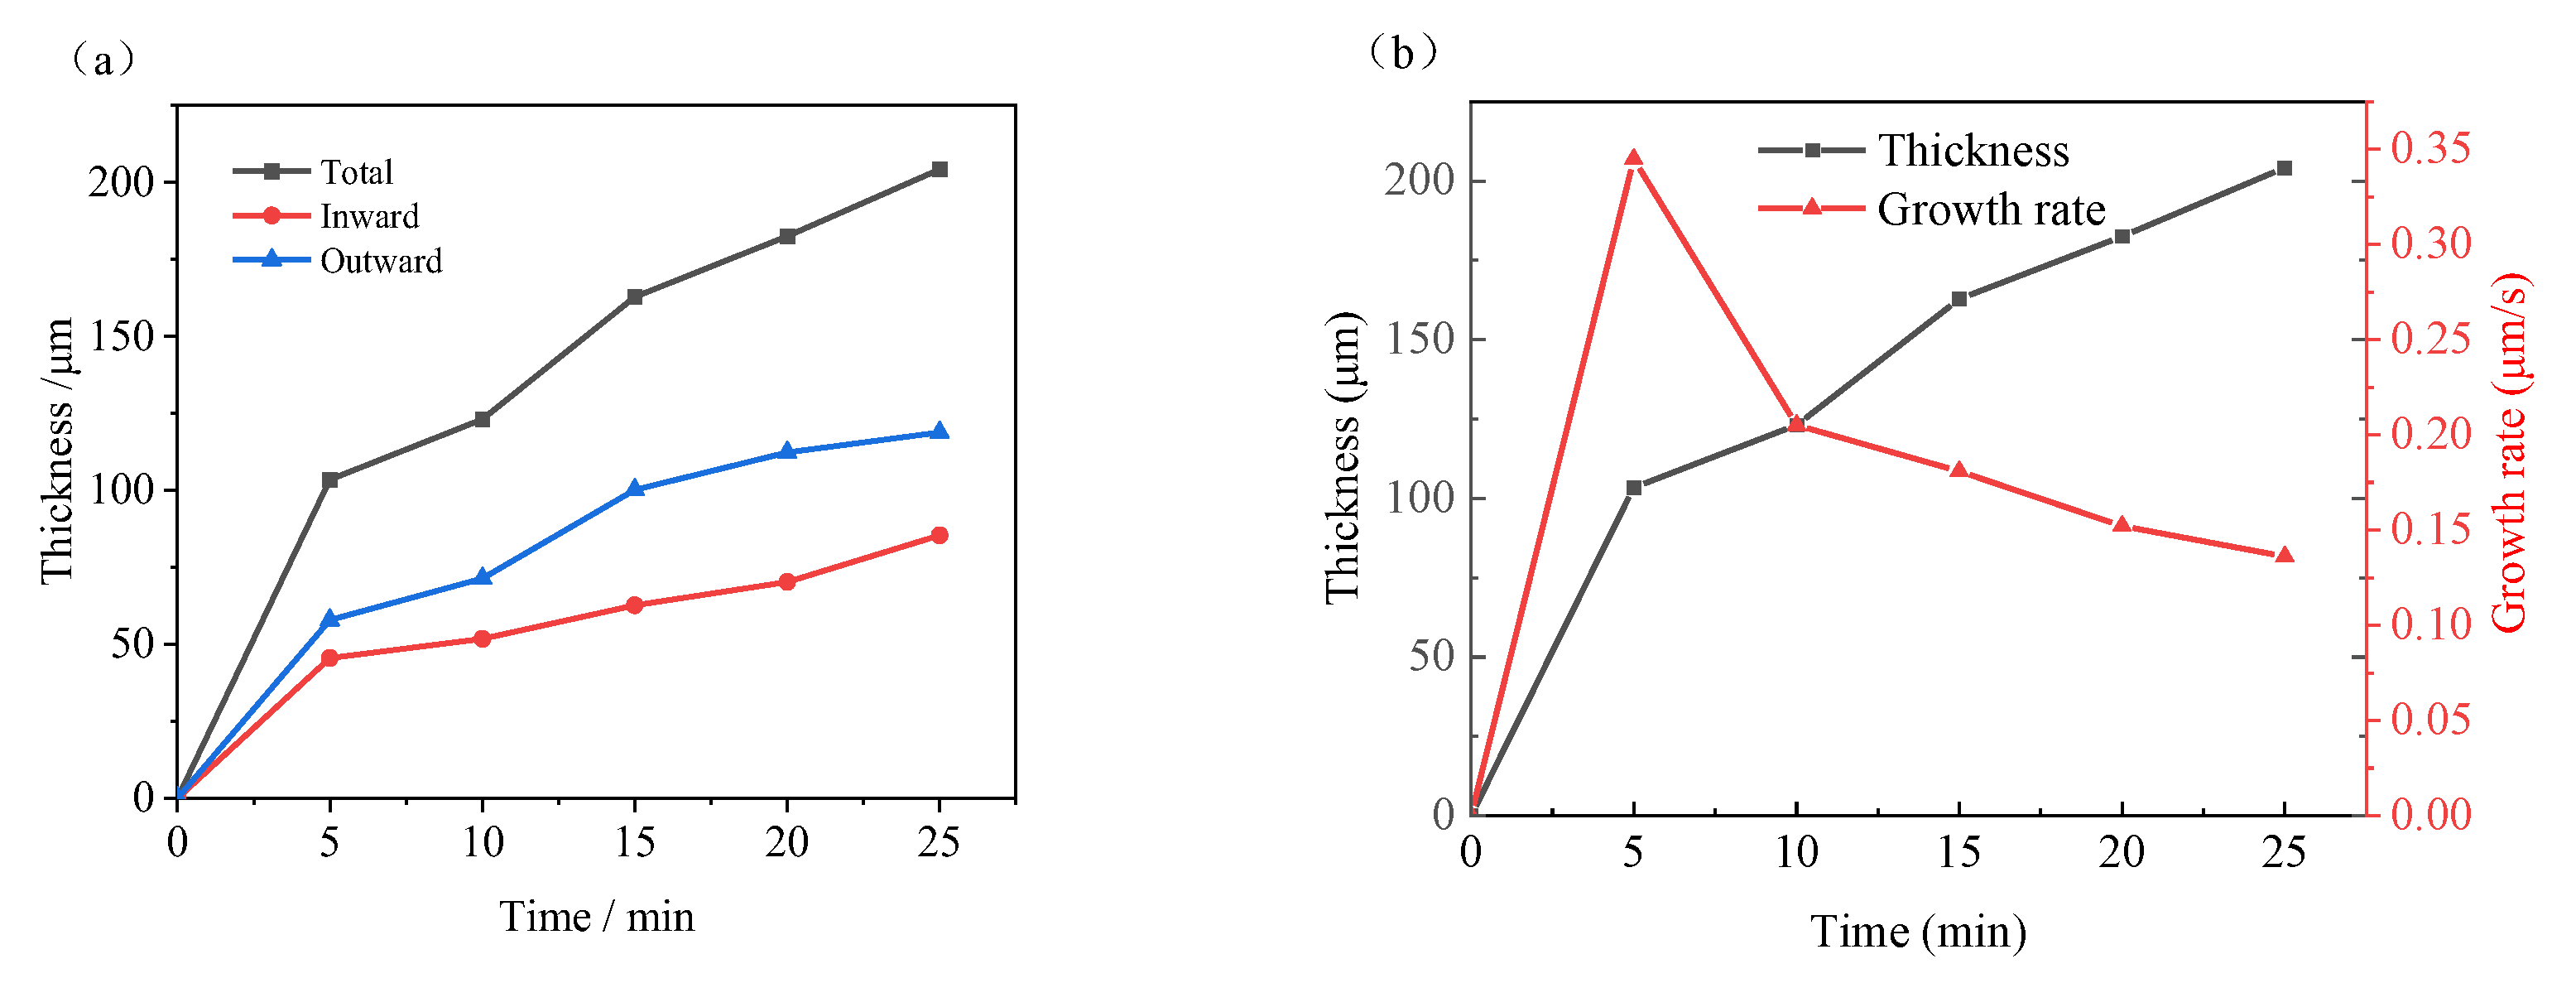
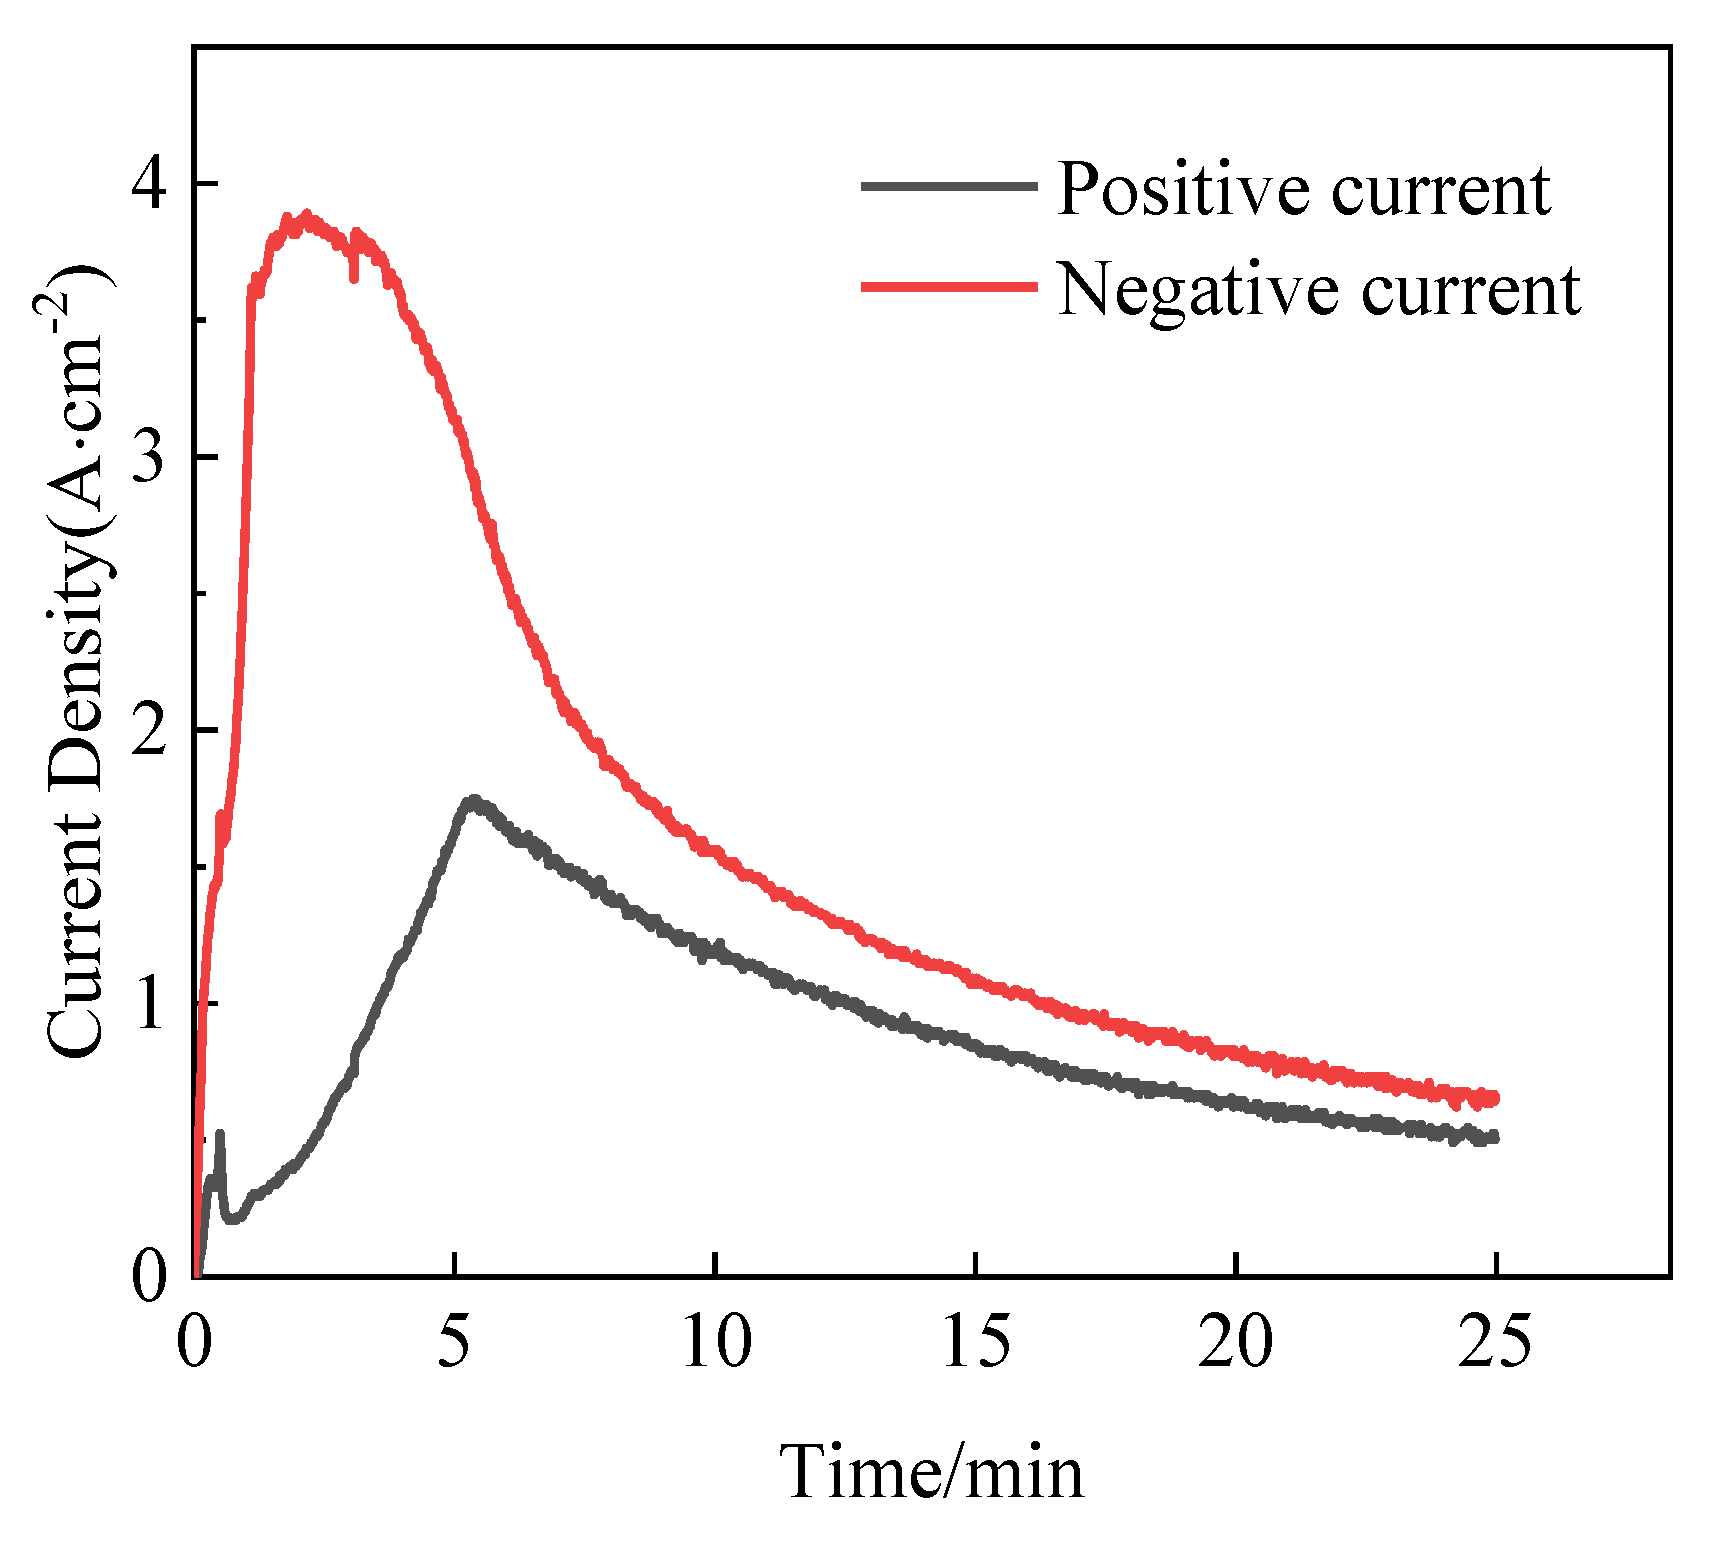
3.1. Growth of MAO Coating

With different oxidation times, the micromorphologies of areas near the dividing line between the coating of the oxidation part and the non-oxidation part are shown in Figure 2. The oxidation coating can be observed on the right side, and the left side is the non-oxidation area. It can be observed from Figure 2 that there is a bidirectional growth of the MAO coating inward and outward. As the oxidation time increases, the thickness and density of the coating increase obviously. Generally, the inward growth rate of the coating is slower than the outward growth rate.
Figure 3a shows the inward and outward growth of the film layer and the change in the total thickness over time. As a whole, the thickness of the film layer increases with the extension of oxidation time, and the thickening of the film layer reaches 103 μm after 5 min of oxidation. After 5 min of oxidation, the thickening of the film layer becomes slow. During the whole growth process, the thickness growing outward always exceeds the thickness growing inward. The inward growth mainly occurs in the early stage of micro-arc oxidation, when the surface of the metal matrix is melted at high pressure and high temperature, and the oxide film is formed when the electrolytic liquid is cooled, which belongs to the in situ growth. The inward growth can improve the bonding and adhesion between the film layer and the metal matrix, and form a relatively dense film structure. This helps to improve the corrosion resistance and protection of the film. Outward growth refers to the process of membrane growth extending outward from the surface. In the process of micro-arc oxidation, the discharge breaks down the film layer and forms holes on the surface of the film layer, making the molten metal matrix contact the electrolyte through the discharge channel and oxidize. Outward growth leads to an increase in the thickness and surface roughness of the film, which increases the porosity and surface defects of the film. This may reduce the sealing and protective properties of the film layer, making it easier for the corrosive medium to penetrate below the metal matrix, resulting in corrosion. With the extension of the micro-arc oxidation time, the growth of the film depends on the breakdown of the existing oxide film by discharge, so that the molten metal matrix contacts the electrolyte through the discharge channel and then oxidizes into a film [20]. In other words, the growth of the film takes place at the interface between the sample and the electrolyte, so the outward growth is more than the inward growth.
The total thickness of the micro-arc oxidation film and its growth rate with time are shown in Figure 3b. The growth rate is fastest in the first 5 min of micro-arc oxidation, and the growth rate is 103.43 μm. At 10 min, the growth rate slows down significantly, and the total growth rate is 123.1 μm and the growth rate is 0.205 μm/s. After 15 min, the growth rate decreases to 0.181 μm/s. At this time, the growth curve becomes smooth and the growth rate of the film gradually slows down. After 10 min, the growth rate begins to decrease and the growth rate curve also flattens out, indicating that continued extension of the oxidation time would not cause drastic changes to the growth of the film.
In constant-voltage mode, the growth of the MAO coating is closely related to the current [21]. The coating growth is analyzed in combination with the current change during the MAO process for 25 min, as shown in Figure 4. In the first 5 min, with the voltage rapidly raised to the set constant-voltage value, the current increases, and then the current begins to decrease significantly. The passivation coating on the surface of the substrate is relatively thin in the early stage of MAO, which is easy to break down. At the same time, a high-temperature region is formed instantly to dissolve the oxide and the substrate, and the molten melt is then cooled in contact with the electrolyte and forms the MAO coating. The process of breaking–melting–cooling–coating is repeated, resulting in rapid growth of the MAO coating. After the oxidation, the time exceeds 5 min because the coating has reached a certain thickness, which means that with the increase in resistance, the electric breakdown under constant-voltage mode becomes more and more difficult, and the thickening of the coating slows down.

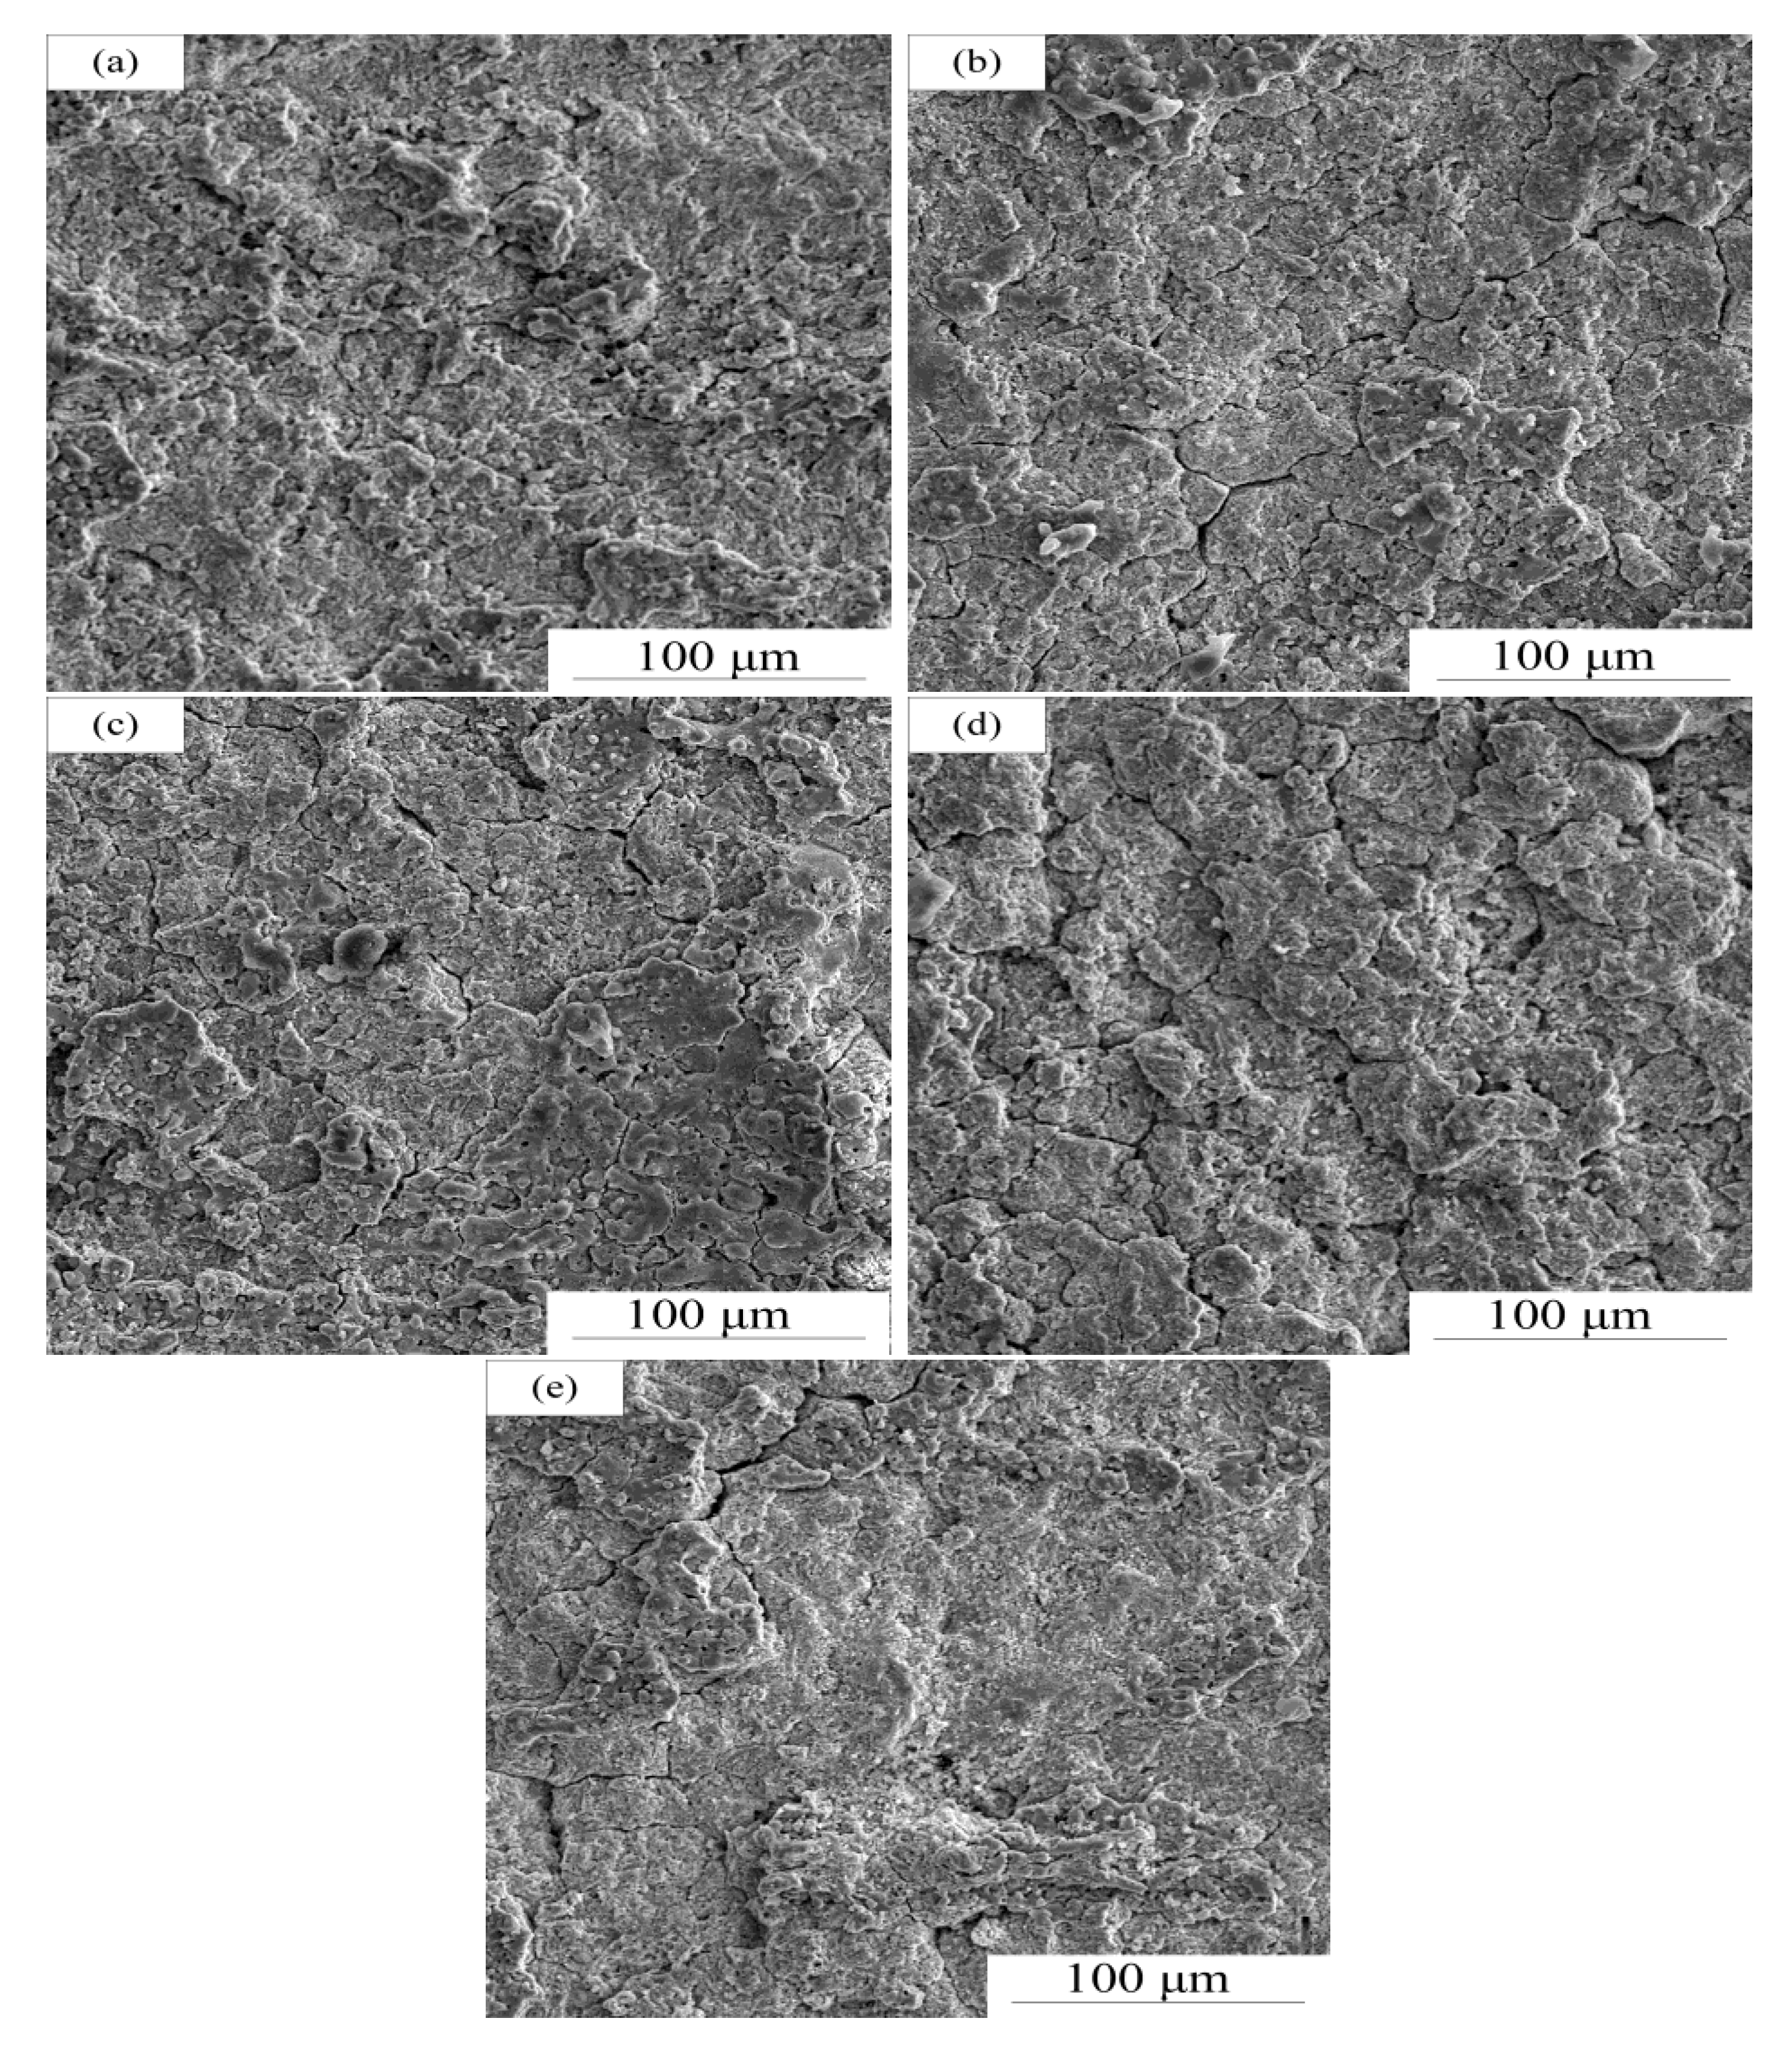
3.2. Surface Morphology of MAO Coating

The surface microstructure of the MAO coatings is shown in Figure 5. As can be seen from Figure 5a, with the 5 min, the surface of the coating is uneven, and there are micro-cracks and pores on the surface. In the early stage of MAO, micro-arc discharge would occur on the surface of the sample, leading to the breakdown of the coating and the formation of molten oxides and bubbles, resulting in the formation of holes. With the electrolyte contact, the molten oxide rapidly cools, due to the existence of stress, resulting in the emergence of cracks. Moreover, the accumulation of molten oxide causes the coating surface to be uneven.
When the oxidation time is 15 min, the concave parts of the surface are filled, resulting in a smoother and denser surface morphology. Prolonged discharging leads to the interconnection of pores, and the molten material is sprayed out of the pores, filling the original micropores. However, there are still residual molten oxides and large particle deposits on the surface of the film. After 20 min of oxidation, numerous cracks appear on the surface of the film, and the accumulation of molten oxides on the film surface becomes severe. At 25 min of oxidation, the number of cracks on the film surface decreases significantly, indicating that the molten oxide accumulation inside the film reaches a relatively stable equilibrium state, thereby reducing the accumulation of internal stress and decreasing crack formation.

3.3. Composition of MAO Coating

Figure 6 shows the line scan results of the oxide film section. They show that the main elements present in the membrane layer are Zr, O, Si, C, and Pt. In the EDS analysis of the cross-section of the micro-arc oxidation film, a higher content of C element is observed. This may be caused by the presence of carbon source contamination or other factors during the preparation. The Pt element comes from a spray treatment prior to SEM observation, which is intended to enhance the conductivity of the sample. According to the distribution of the elements, the closer to the metal matrix, the higher the content of Zr. On the contrary, the content of Si decreases gradually from the inner side of the film to the outer side. O is uniformly distributed in the interior of the film layer. The Zr element in the film layer mainly comes from the metal matrix, and the Si element mainly comes from the electrolyte. This indicates that in the process of micro-arc oxidation, Si and O in the electrolyte react with the matrix, and the components in the matrix and the electrolyte migrate with each other, making the film grow in two directions: inward and outward.
Table 2 lists the content of elements (in terms of the mass fraction) on the surface of the micro-arc oxide film. It can be observed that the micro-arc oxide film is mainly composed of Zr, Si, and O elements. The content of Zr is highest, accounting for 48.73% of the film mass. This is because zirconium alloy is the basic material, and the film formed by anodizing in the process of micro-arc oxidation is mainly composed of zirconium elements in the base material. At the same time, the composition of silicate electrolytes will also affect the composition of the film, leading to the introduction of trace Si elements into the film. In addition, the content of oxygen element (O) is about 17.14%, which is due to the reaction of oxygen with the metal substrate under high temperature and pressure during the micro-arc oxidation process to form an oxide film.
Figure 7 shows the X-ray diffraction pattern of the micro-arc oxidation coating on the zirconium alloy. From the figure, it can be observed that, in addition to impurity peaks, the ceramic coating on the zirconium alloy mainly consists of a monoclinic phase (m-ZrO2), tetragonal phase (t-ZrO2), and a small amount of SiO2. The number and intensity of diffraction peaks for m-ZrO2 are higher than those for t-ZrO2, indicating a higher content of m-ZrO2 in the coating. Moreover, with increasing oxidation time, the height of the t-ZrO2 diffraction peaks decreases and the peaks become narrower, indicating that the thicker the coating, the lower the content of t-ZrO2. Zirconium dioxide exists in the monoclinic phase at room temperature, and it begins to transform into the tetragonal phase at 1100~1200 °C. It only transforms into the cubic phase at temperatures exceeding 2300 °C. During the micro-arc oxidation process, the arc discharge forms a super high-temperature zone, and the rapidly cooled oxide forms the stable m-ZrO2 phase. Only a small amount of molten oxide forms in the high-temperature zone, and the slow-cooling inner side of the coating transforms into the t-ZrO2 phase. The SiO2 peaks show little change and are minimally affected by the oxidation time.
Figure 8 shows the XPS (X-ray photoelectron spectroscopy) survey spectrum and Zr 3d peak spectrum of the ceramic coating at an oxidation time of 15 min. The composition of the zirconium alloy micro-arc oxidation ceramic coating in the electrolyte system of silicate includes Na, O, Si, C, and Zr elements. The chemical state of elements can be determined by their binding energies. In Figure 8b, the binding energies of Zr 3d peaks are 185.67 eV (3d3/2) and 181.36 eV (3d5/2), corresponding to the binding energies of ZrO2. No metallic Zr elemental or other chemical bonds are found in the spectra. In Figure 8c, the binding energy of Si 2p is 101.9 eV, corresponding to SiO2, indicating the presence of Si element in the reaction of micro-arc oxidation. Si comes from Na2SiO3 in the electrolyte, while Zr comes from the zirconium alloy substrate. As with the Zr element, no other bonds of Si element are present in the spectrum.
During the micro-arc oxidation process, Zr in the zirconium alloy substrate is oxidized to form ZrO2, which forms the ceramic coating. Na2SiO3 in the electrolyte provides the Si element and participates in the micro-arc oxidation reaction, forming SiO2. Therefore, Si and Zr elements in the zirconium alloy micro-arc oxidation ceramic coating come from the electrolyte and the zirconium alloy substrate and exist in the form of silicon and zirconium oxides in the ceramic coating, respectively.
The XRD results in Figure 7 show the phase composition of Zr and Si elements in the outer few micrometers of the film layer, which exist mainly as ZrO2 and SiO2, respectively. However, XPS shows the chemical bonds of Zr, Si, and other elements in the surface layer with a thickness of several nanometers outside the film layer. Both confirm each other, which proves that element movement and product formation occur in the process of micro-arc oxidation of zirconium alloy under the silicate electrolyte liquid system. The silicate in the electrolyte provides Si and O elements, while the zirconium alloy matrix provides Zr, and the main components of the film layer are zirconium dioxide and titanium dioxide.

3.4. Properties of MAO Coating

The variation in roughness with oxidation time is shown in Figure 9a. The roughness is highest at 5 min of micro-arc oxidation, with a Ra value of 13.458 μm. As the oxidation time increases, the roughness rapidly decreases and then slows down. The minimum roughness is achieved at 15 min, with a Ra value of 5.917 μm, indicating the smoothest surface of the oxide layer. Subsequently, the roughness starts to increase, but the increase is minimal. In the early stage of micro-arc oxidation, due to the rapid growth of the oxide layer, accumulation of molten oxides, as well as the rapid generation of pores and cracks, the surface of the oxide layer becomes rough and uneven. With the prolonged oxidation time, the roughness rapidly decreases and then slowly increases. During this stage, the micro-arc oxidation continues, and the molten materials are tightly bonded and stacked between each other, filling some of the pores and cracks, and resulting in a gradually smoother surface of the oxide layer. As the thickness of the oxide layer increases, it becomes less susceptible to voltage breakdown, and the growth of the oxide layer slows down relatively. Discharge occurs in local areas, resulting in the uneven organization of the oxide layer and an increase in roughness.
From Figure 9b, it can be observed that the wear loss of the oxide layer follows a similar trend. In the initial stage of wear, the mass loss of the oxide layer is significant, and then the curve tends to flatten. The wear resistance is similar at oxidation times of 5, 10, and 15 min. The wear loss rapidly increases at 20 min of oxidation time, with the largest mass loss of the oxide layer and the poorest wear resistance. Subsequently, as the oxidation time reaches 25 min, the mass loss of the oxide layer begins to decrease. The mass loss of the oxide layer initially increases and then decreases with oxidation time, indicating that the wear resistance of the ceramic oxide layer decreases first and then increases. It is inferred that the molten material formed in the early stage of micro-arc oxidation undergoes rapid temperature changes and has a harder texture, resulting in a dense oxide layer with good wear resistance. With the increase in oxidation time, the hardness of the molten material decreases, and the wear resistance decreases as well. At 20 min of oxidation time, there are more cracks on the surface of the oxide layer, which affects the wear resistance. However, at 25 min of oxidation time, the wear resistance of the oxide layer is enhanced, which corresponds well with the changes in the microstructure of the oxide layer shown in Figure 3 and Figure 5e.
Figure 10 and Table 3 show the polarization curves and the fitting results of MAO coatings immersed in 3.5 wt% NaCl solution at different oxidation times. Ecoor is the self-corrosion potential, representing the degree of difficulty of corrosion, and Jcorr is the corrosion current density, representing the speed of corrosion. The corrosion resistance of the coating is directly explained through corrosion current density.
In Table 3, corrosion potential (ECorr), corrosion current density (Jcorr), anode slope (βa), and cathode slope (βc) are measured by the Tafel extrapolation method, and polarization resistance (Rp) is obtained by the Stern–Geary formula.
R p = ( β a × β c ) 2.3 × J c o r r ( β a + β c )
In Table 3, the corrosion potential of the metal matrix is smallest, while the corrosion current density is largest, indicating that the metal matrix is prone to corrosion when the film is not formed. After micro-arc oxidation, the corrosion potential shifts from −0.169 V to −0.072 V with reference to the saturated calomel electrode. The corrosion current density also changes, decreasing from 2.237 × 10⁻⁷ to 9.659 × 10⁻⁸ A·cm−2, which is one order of magnitude lower than that of the metal substrate. This indicates that the presence of the micro-arc oxidation film provides good protection to the metal substrate, effectively preventing the penetration of the corrosive medium through the film and improving the corrosion resistance of the material. With the increase in oxidation time, the corrosion potential shifts toward more positive values, and the self-corrosion current density continuously decreases. At an oxidation time of 15 min, the surface of the film is relatively smooth with fewer cracks, and the corrosion current density is lowest, at 8.876 × 10⁻⁹ A·cm−2, indicating the best corrosion resistance of the film. However, with a further extension of oxidation time (20–25 min), the self-corrosion current density starts to increase, indicating a decrease in corrosion resistance. The polarization resistance Rp increases first and then decreases with the increase in oxidation time. The maximum value is 11,010 (kΩcm2) when the oxidation time is 15 min.
As shown in the Nyquist plot (Figure 11a), samples with ceramic film layers have two capacitive arcs, indicating similar corrosion processes and mechanisms. The first capacitive arc in the high-frequency range is formed by the impedance reaction of the loose outer layer outside the ceramic film layer, while in the low-frequency range, the impedance behavior of the dense inner layer and substrate of the film layer forms the second capacitive arc.
In the Bode plot (Figure 11c), the data of samples with ceramic film layers have two peaks and two time constants, corresponding to the analysis in the Nyquist plot. Generally, the size of the capacitive arc in the low-frequency range represents the corrosion resistance performance of the micro-arc oxidation film layer. The larger the radius of the capacitive arc, the less likely the corrosion medium can penetrate the film layer and reach the substrate, indicating higher corrosion resistance. From Figure 11b, it can be observed that the zirconium alloy has the best corrosion resistance performance at 15 min.
In addition, the impedance modulus, |Z|, in the Bode plot can also represent the corrosion resistance performance. In Figure 11b, the impedance modulus in the low-frequency range can be used to evaluate the corrosion resistance of the zirconium alloy to some extent. The corrosion resistance decreases in the order of 15 min, 20 min, 25 min, 10 min, and 5 min, and then the R60705 substrate. The results are consistent with the trends observed in the polarization curve and Nyquist plot.
The equivalent circuit diagram of the micro-arc oxidation film is shown in Figure 12. Rs represents the solution resistance, and Rc represents the transfer resistance of the loose film layer. Due to the presence of two time constants in the micro-arc oxidation film layer, there are also two constant-phase elements (CPEc and CPEdl) in the equivalent circuit. The capacitance C is represented by CPEc, considering the influence of factors such as surface roughness and anisotropy of the film layer. The charge transfer resistance and double-layer capacitance of the film layer are represented by Rct and CPEdl, respectively. As shown in Table 4, the Rct value of the film layer is much higher than the resistance value of Rc, indicating that the film layer interface plays the main role in corrosion resistance. With increasing oxidation time, the Rct value of the film layer increases significantly, indicating that the corrosion resistance of the film layer also gradually improves.

4. Conclusions

The following conclusions were drawn after testing and analysis of the micro-arc oxidation (MAO) film on zirconium alloy surfaces in a silicate electrolyte system:
(1)
The MAO film exhibits bidirectional growth, both inward and outward. The fastest growth occurs in the first 5 min, with a thickness increase of 103.43 μm. From 10 to 15 min, the growth rate of the film slows down, with a thickness increase of only 39.76 μm. Overall, the film grows outward by 118.83 μm and inward by 85.39 μm during 0–25 min, with an average growth rate of 0.079 μm/s outward and 0.057 μm/s inward. The outward growth rate is always higher than the inward growth rate.
(2)
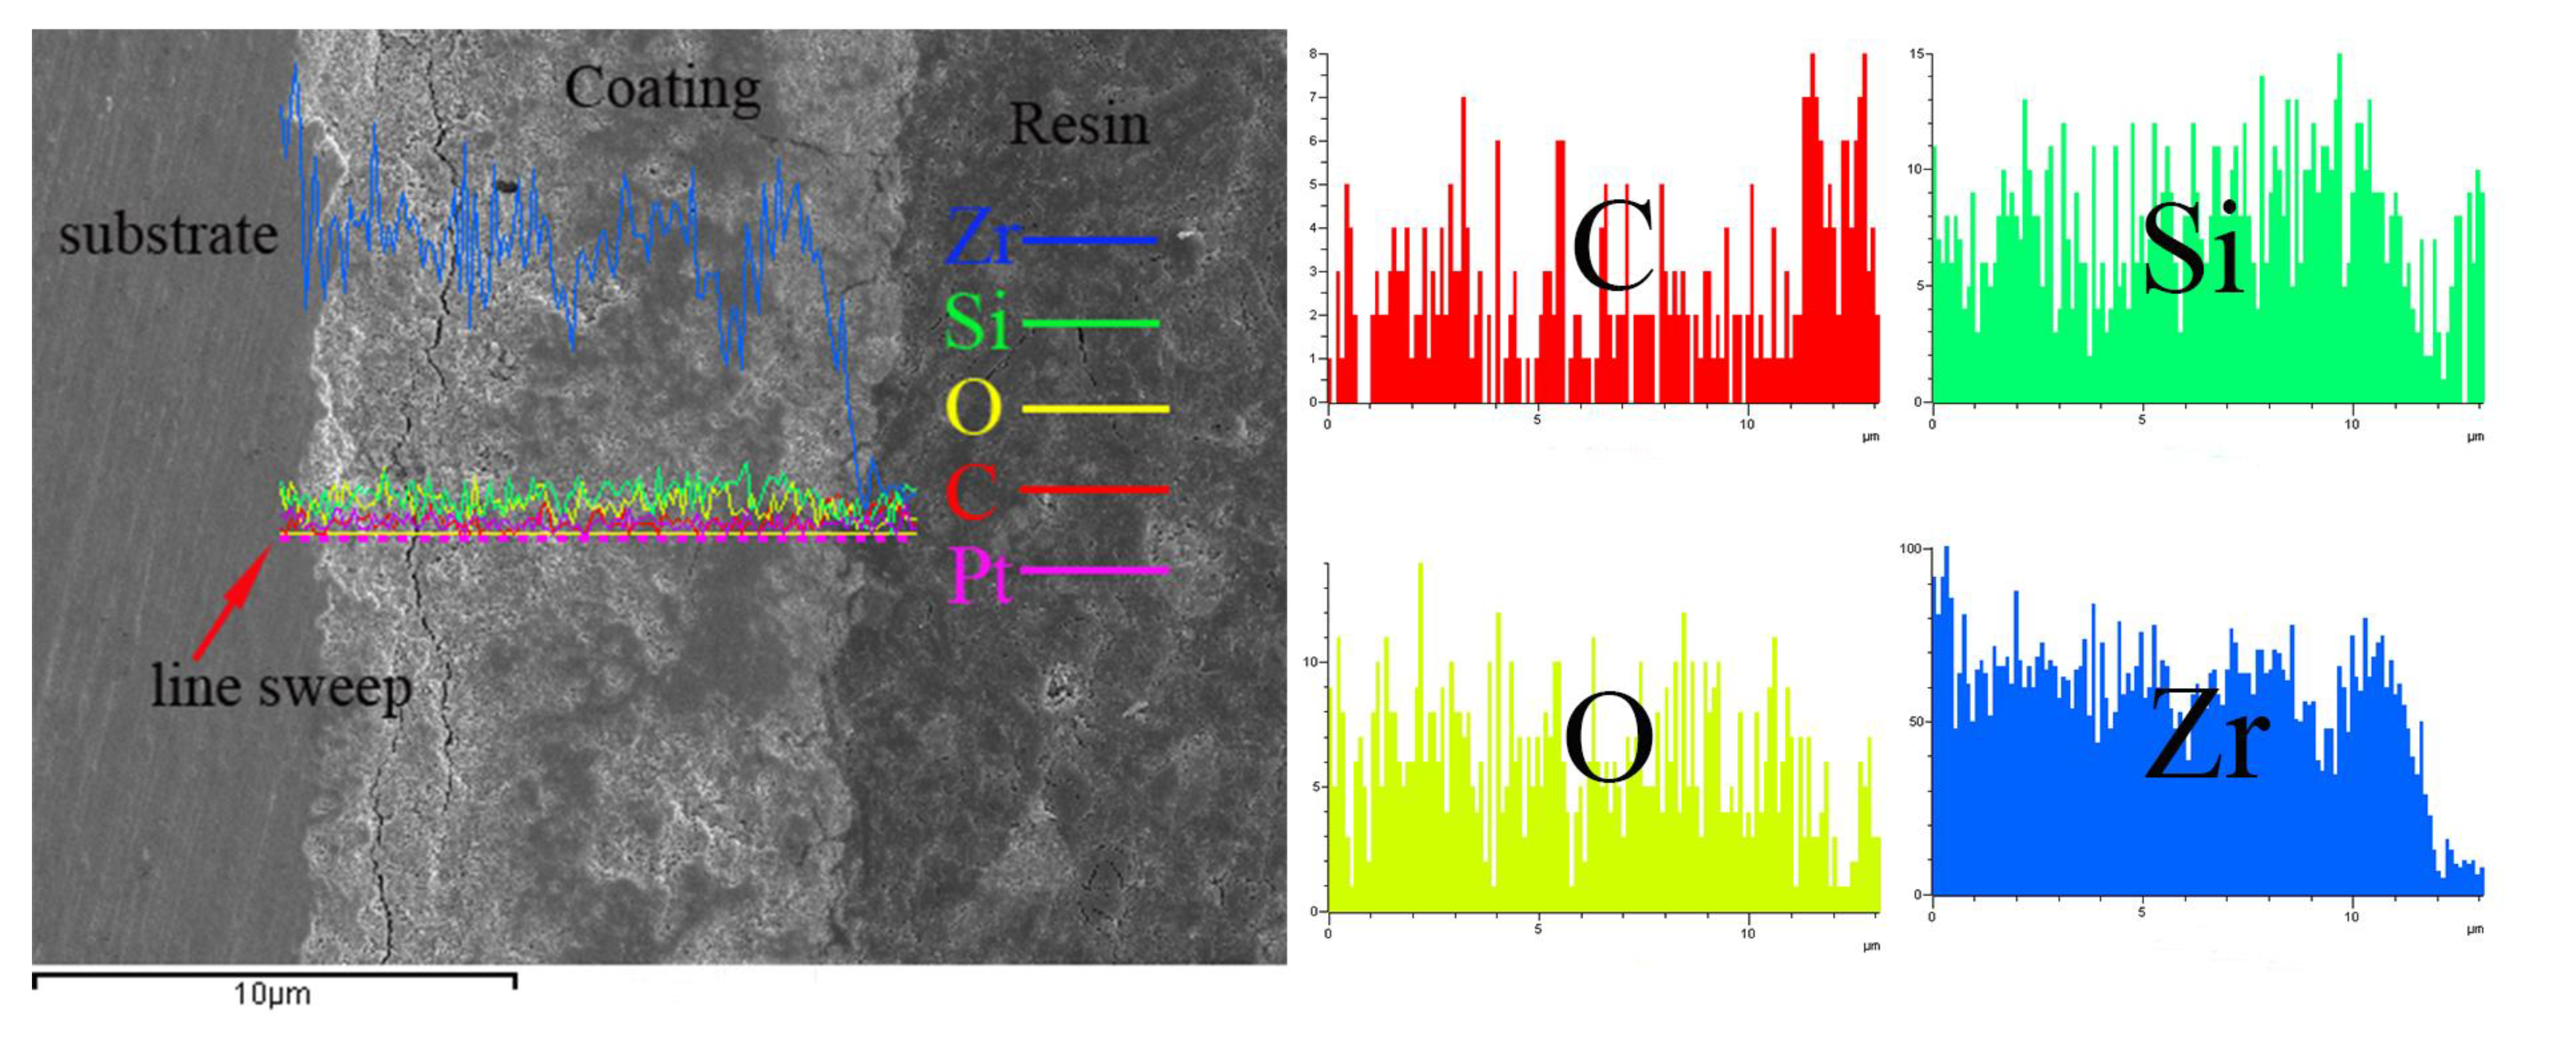
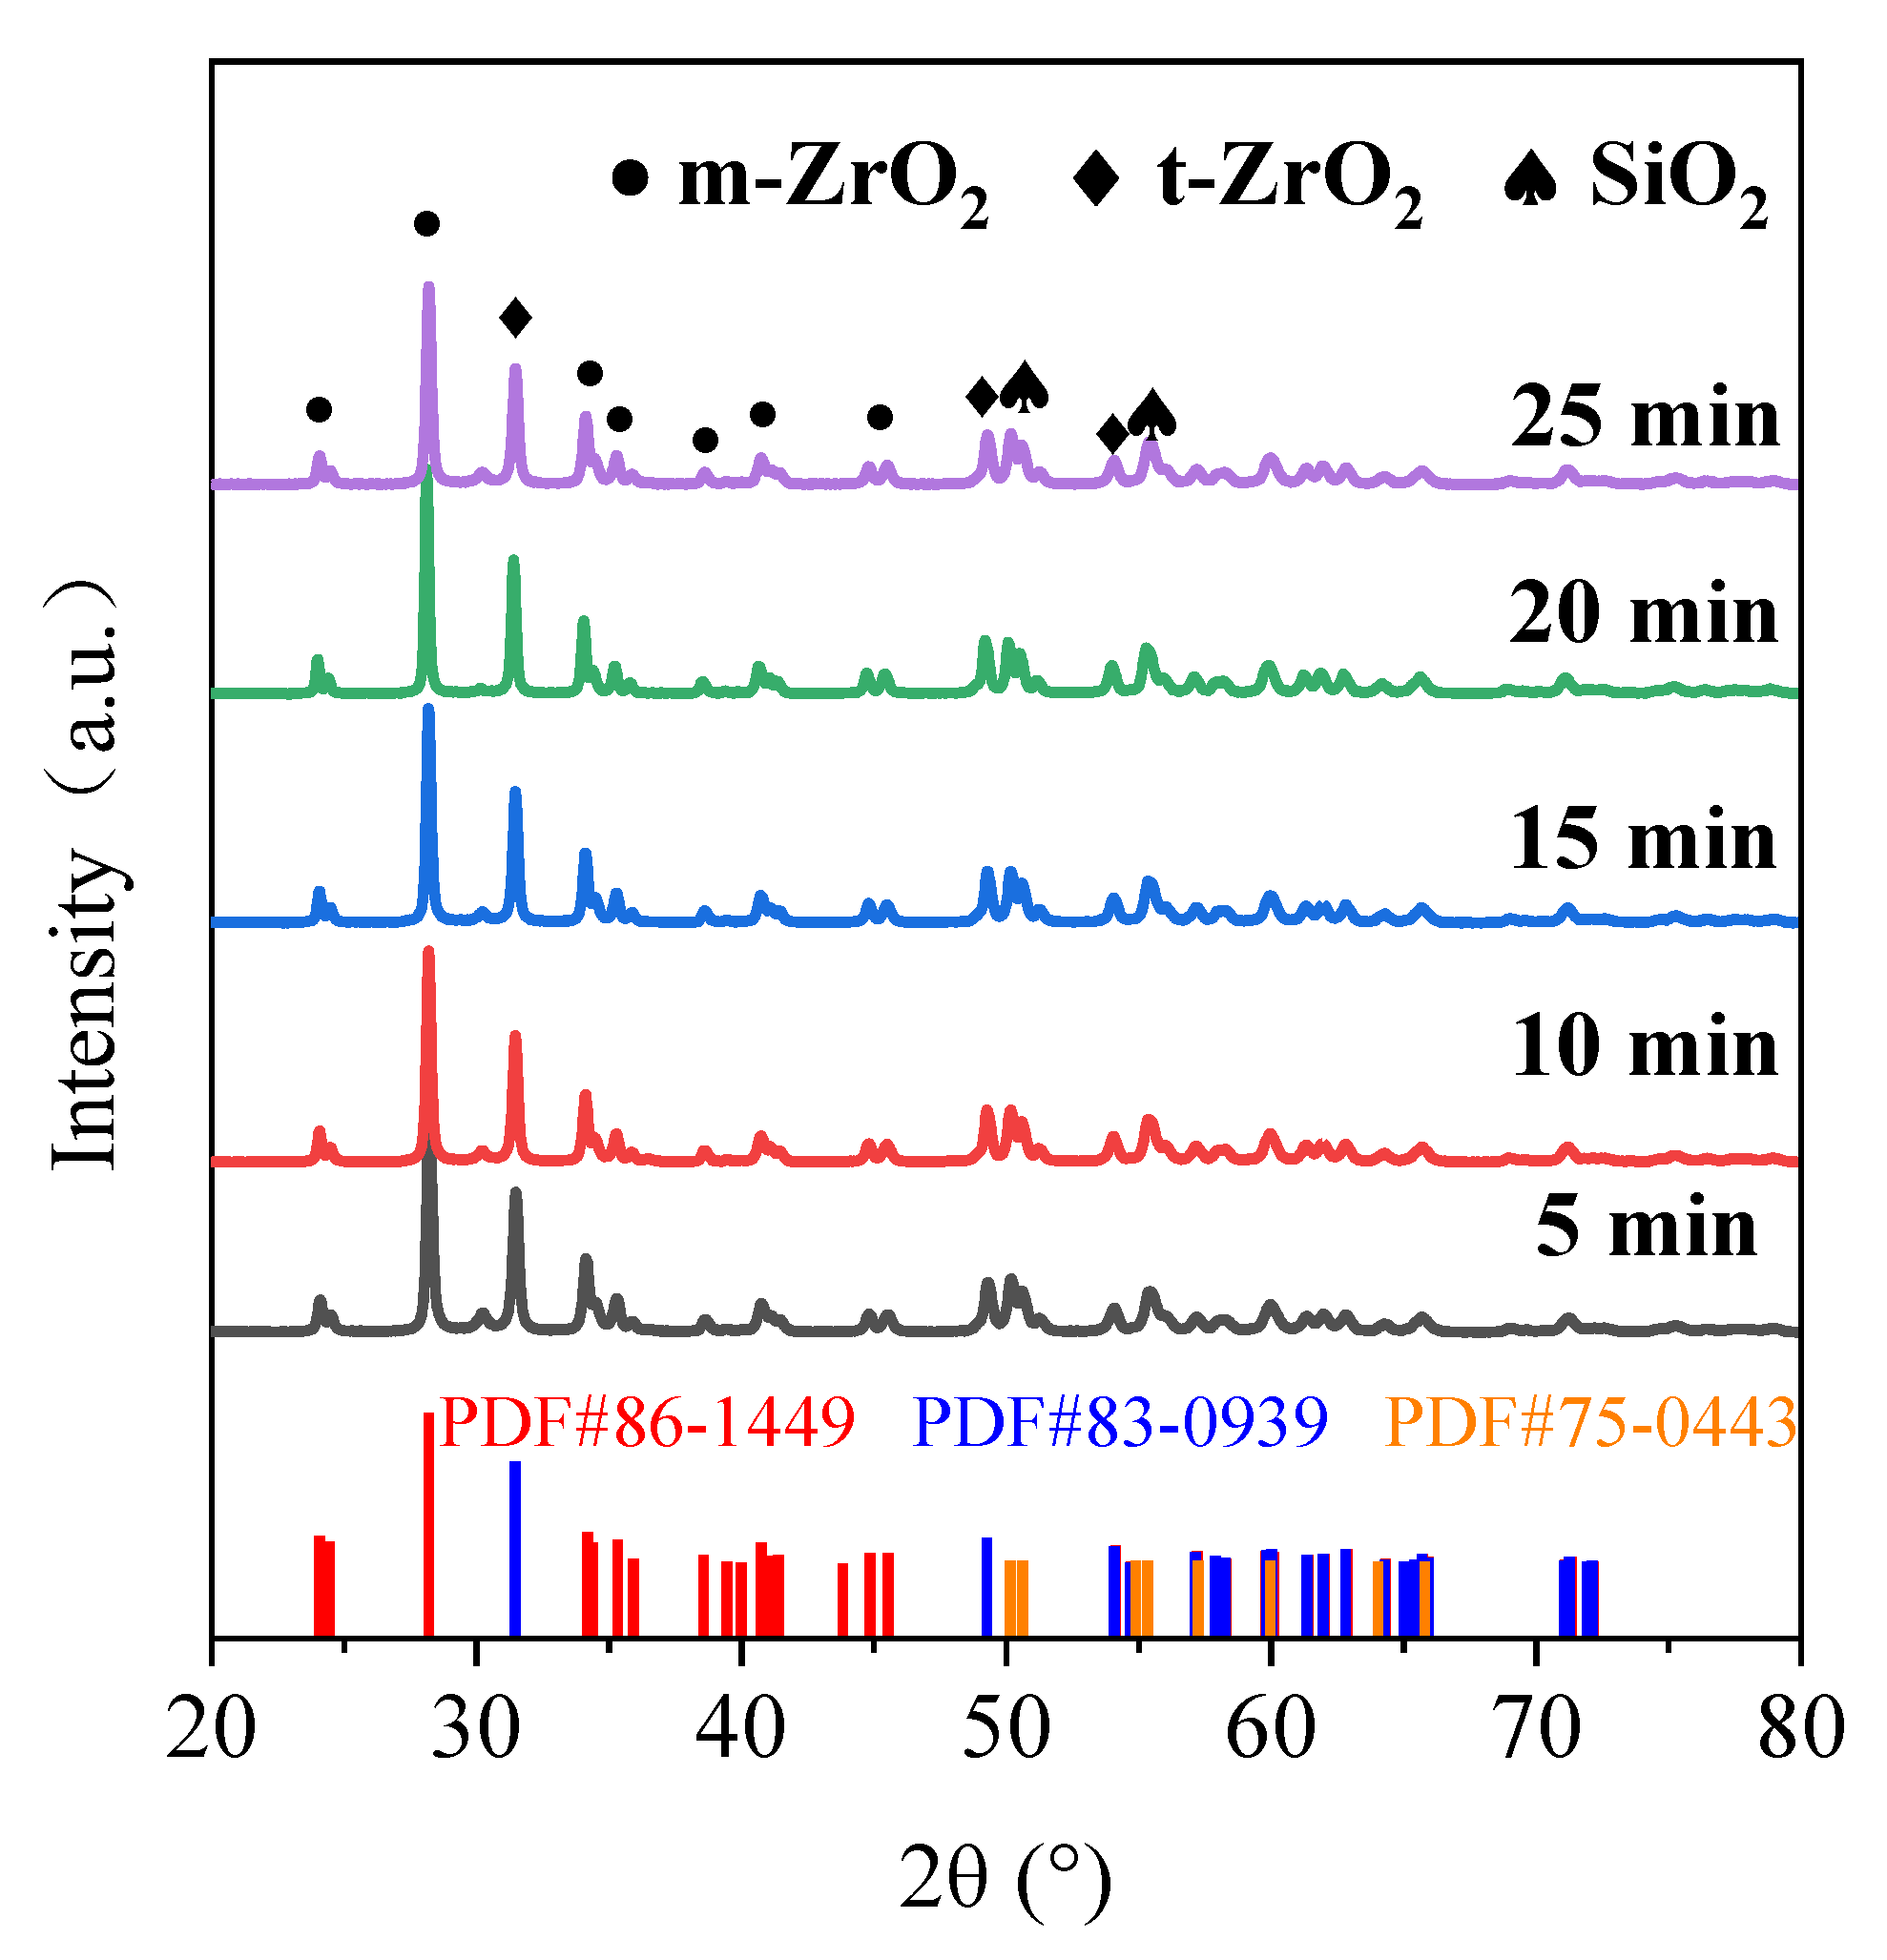
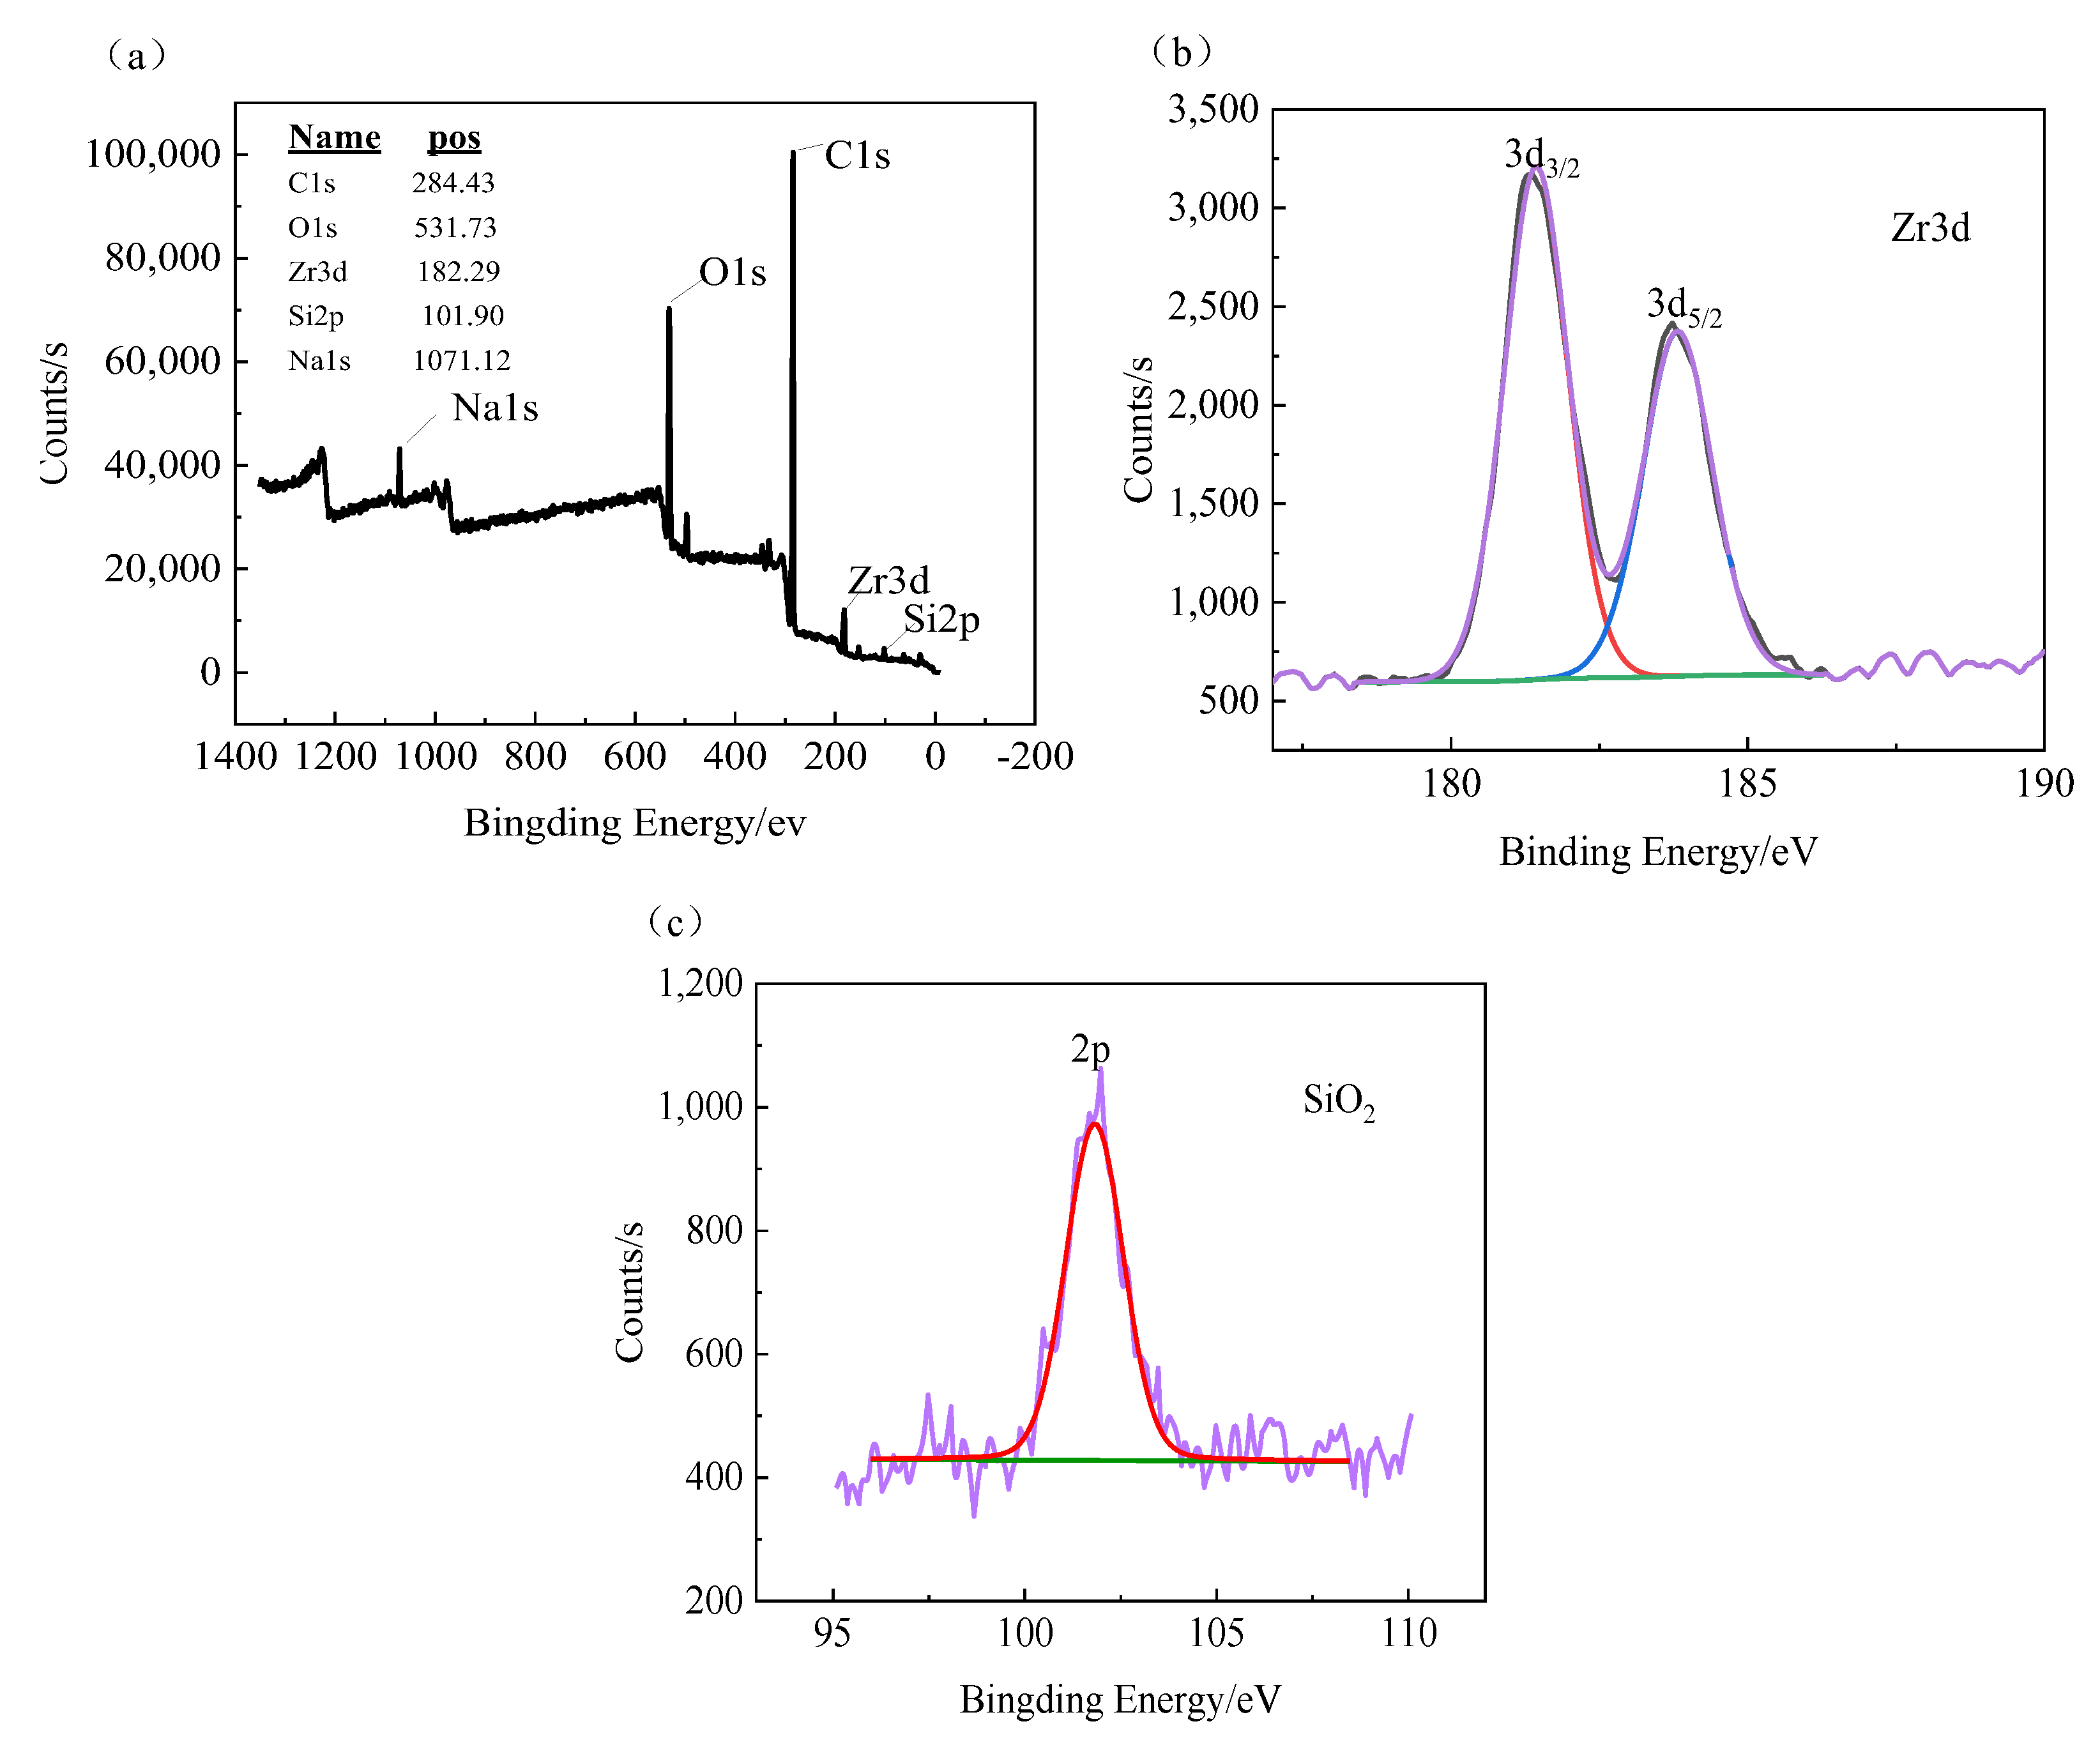
The MAO film on the zirconium alloy mainly consists of a monoclinic phase (m-ZrO2), a tetragonal phase (t-ZrO2), and a small amount of SiO2, with a higher content of monoclinic phase. The binding energies of Zr are 185.67 eV (3d3/2) and 181.36 eV (3d5/2). The film is mainly composed of Zr, O, and Si, with Zr evenly distributed in the film and a lower Si content closer to the substrate.
(3)
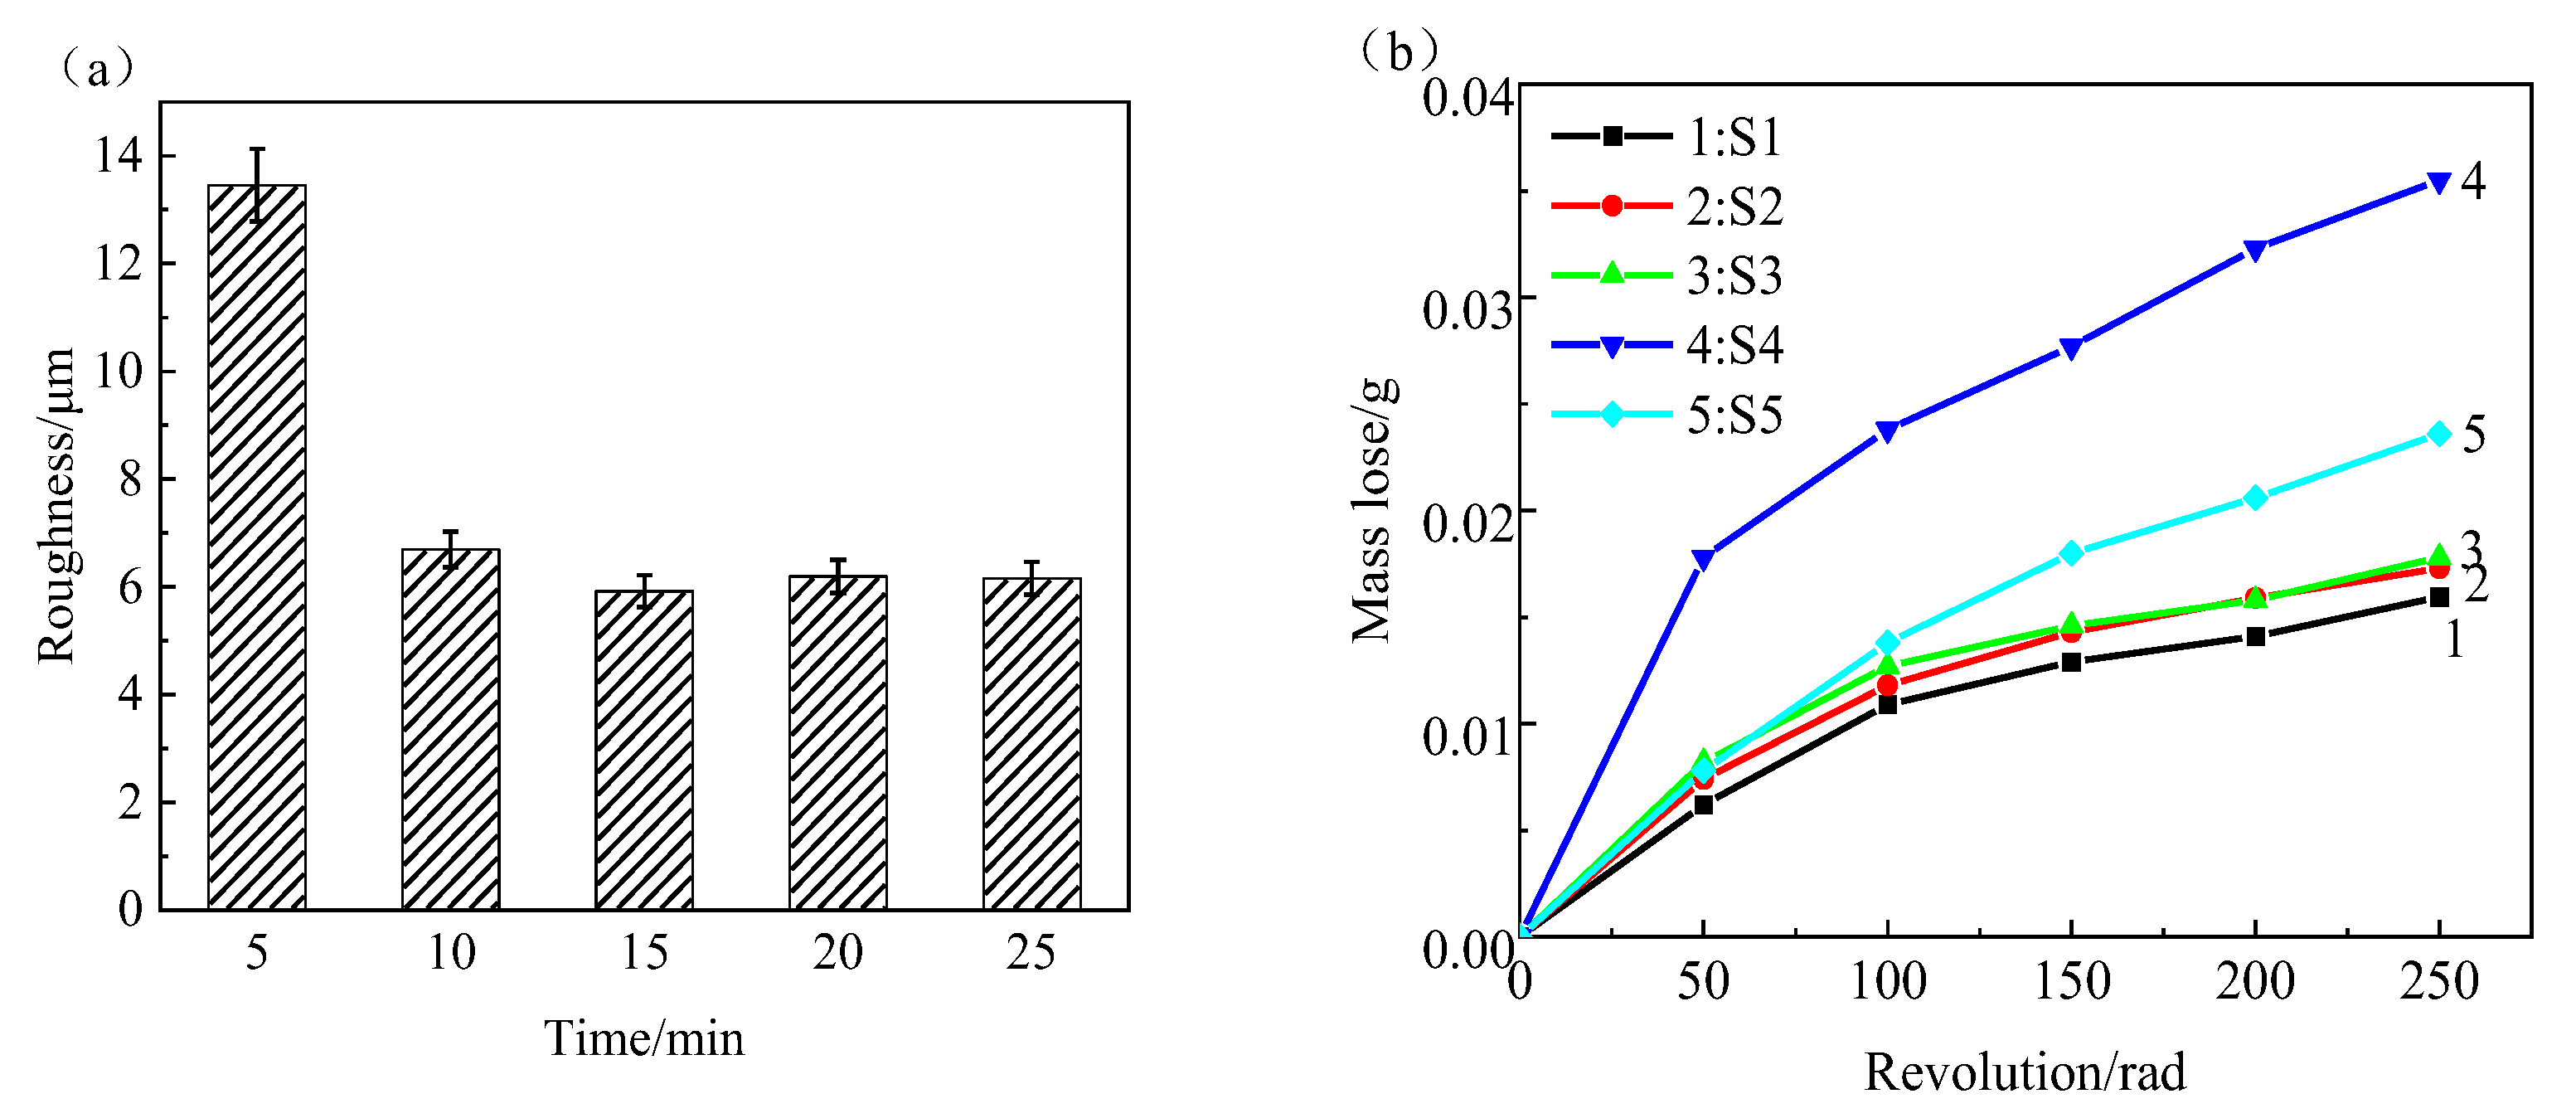
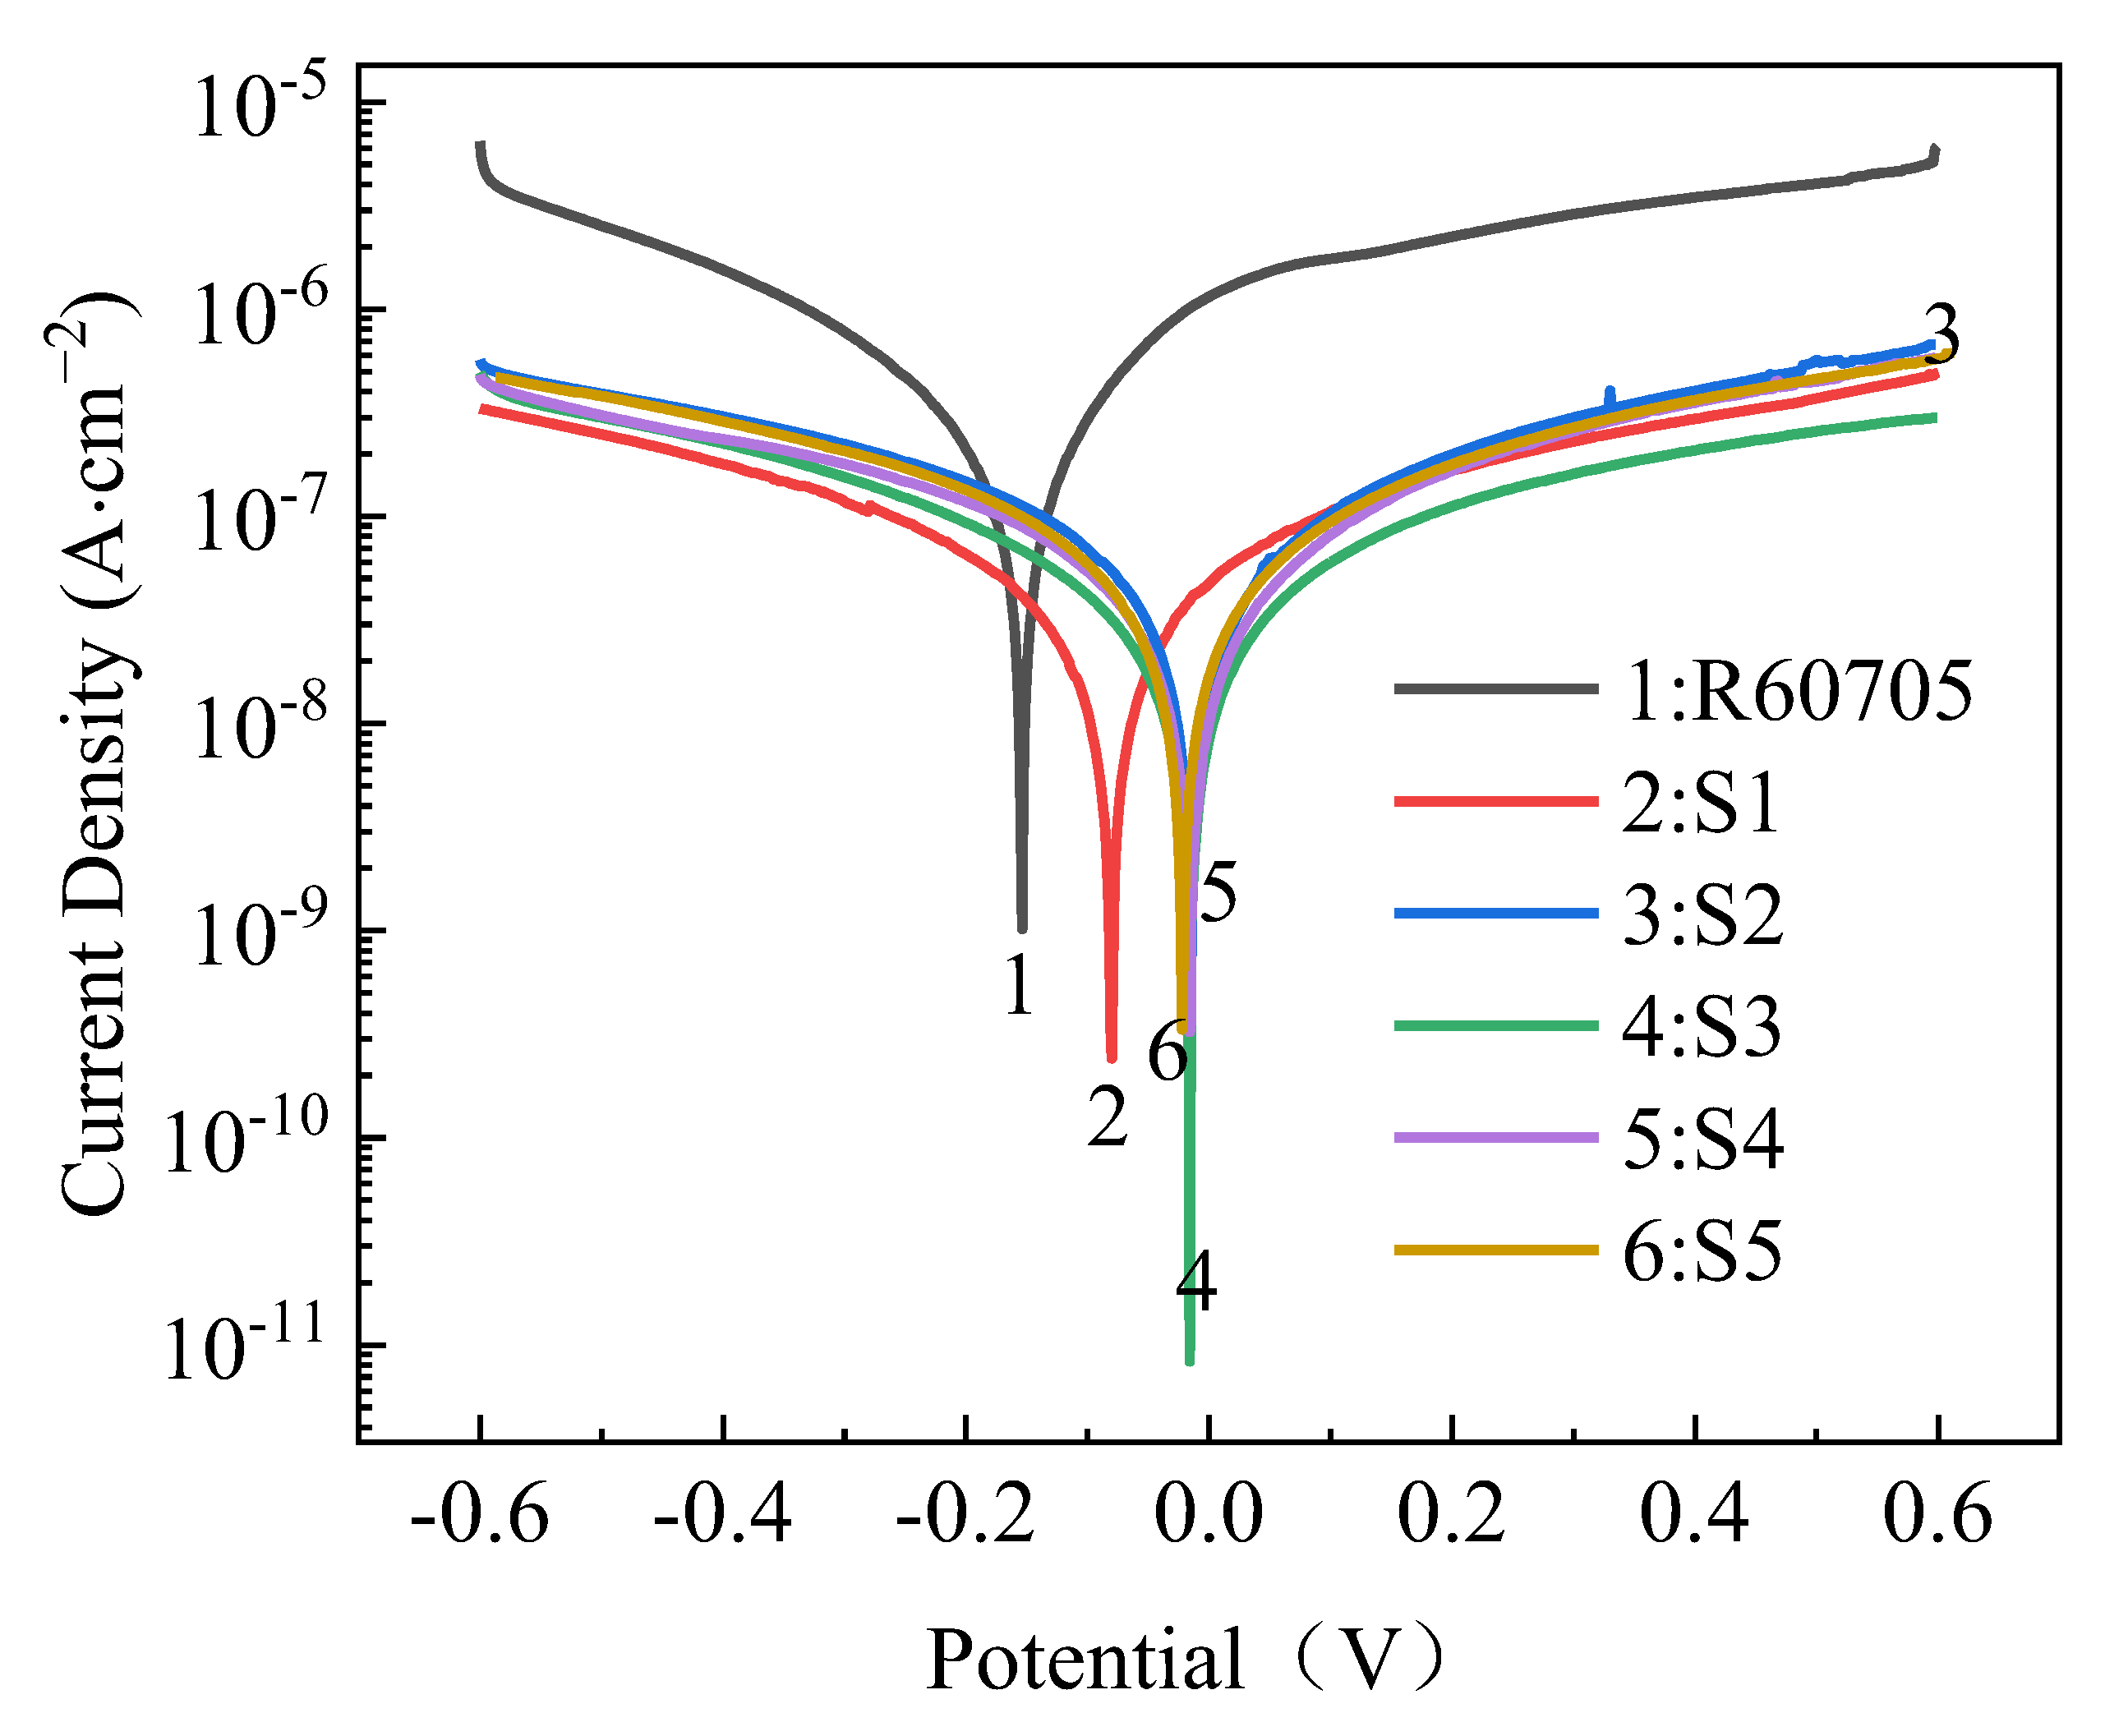
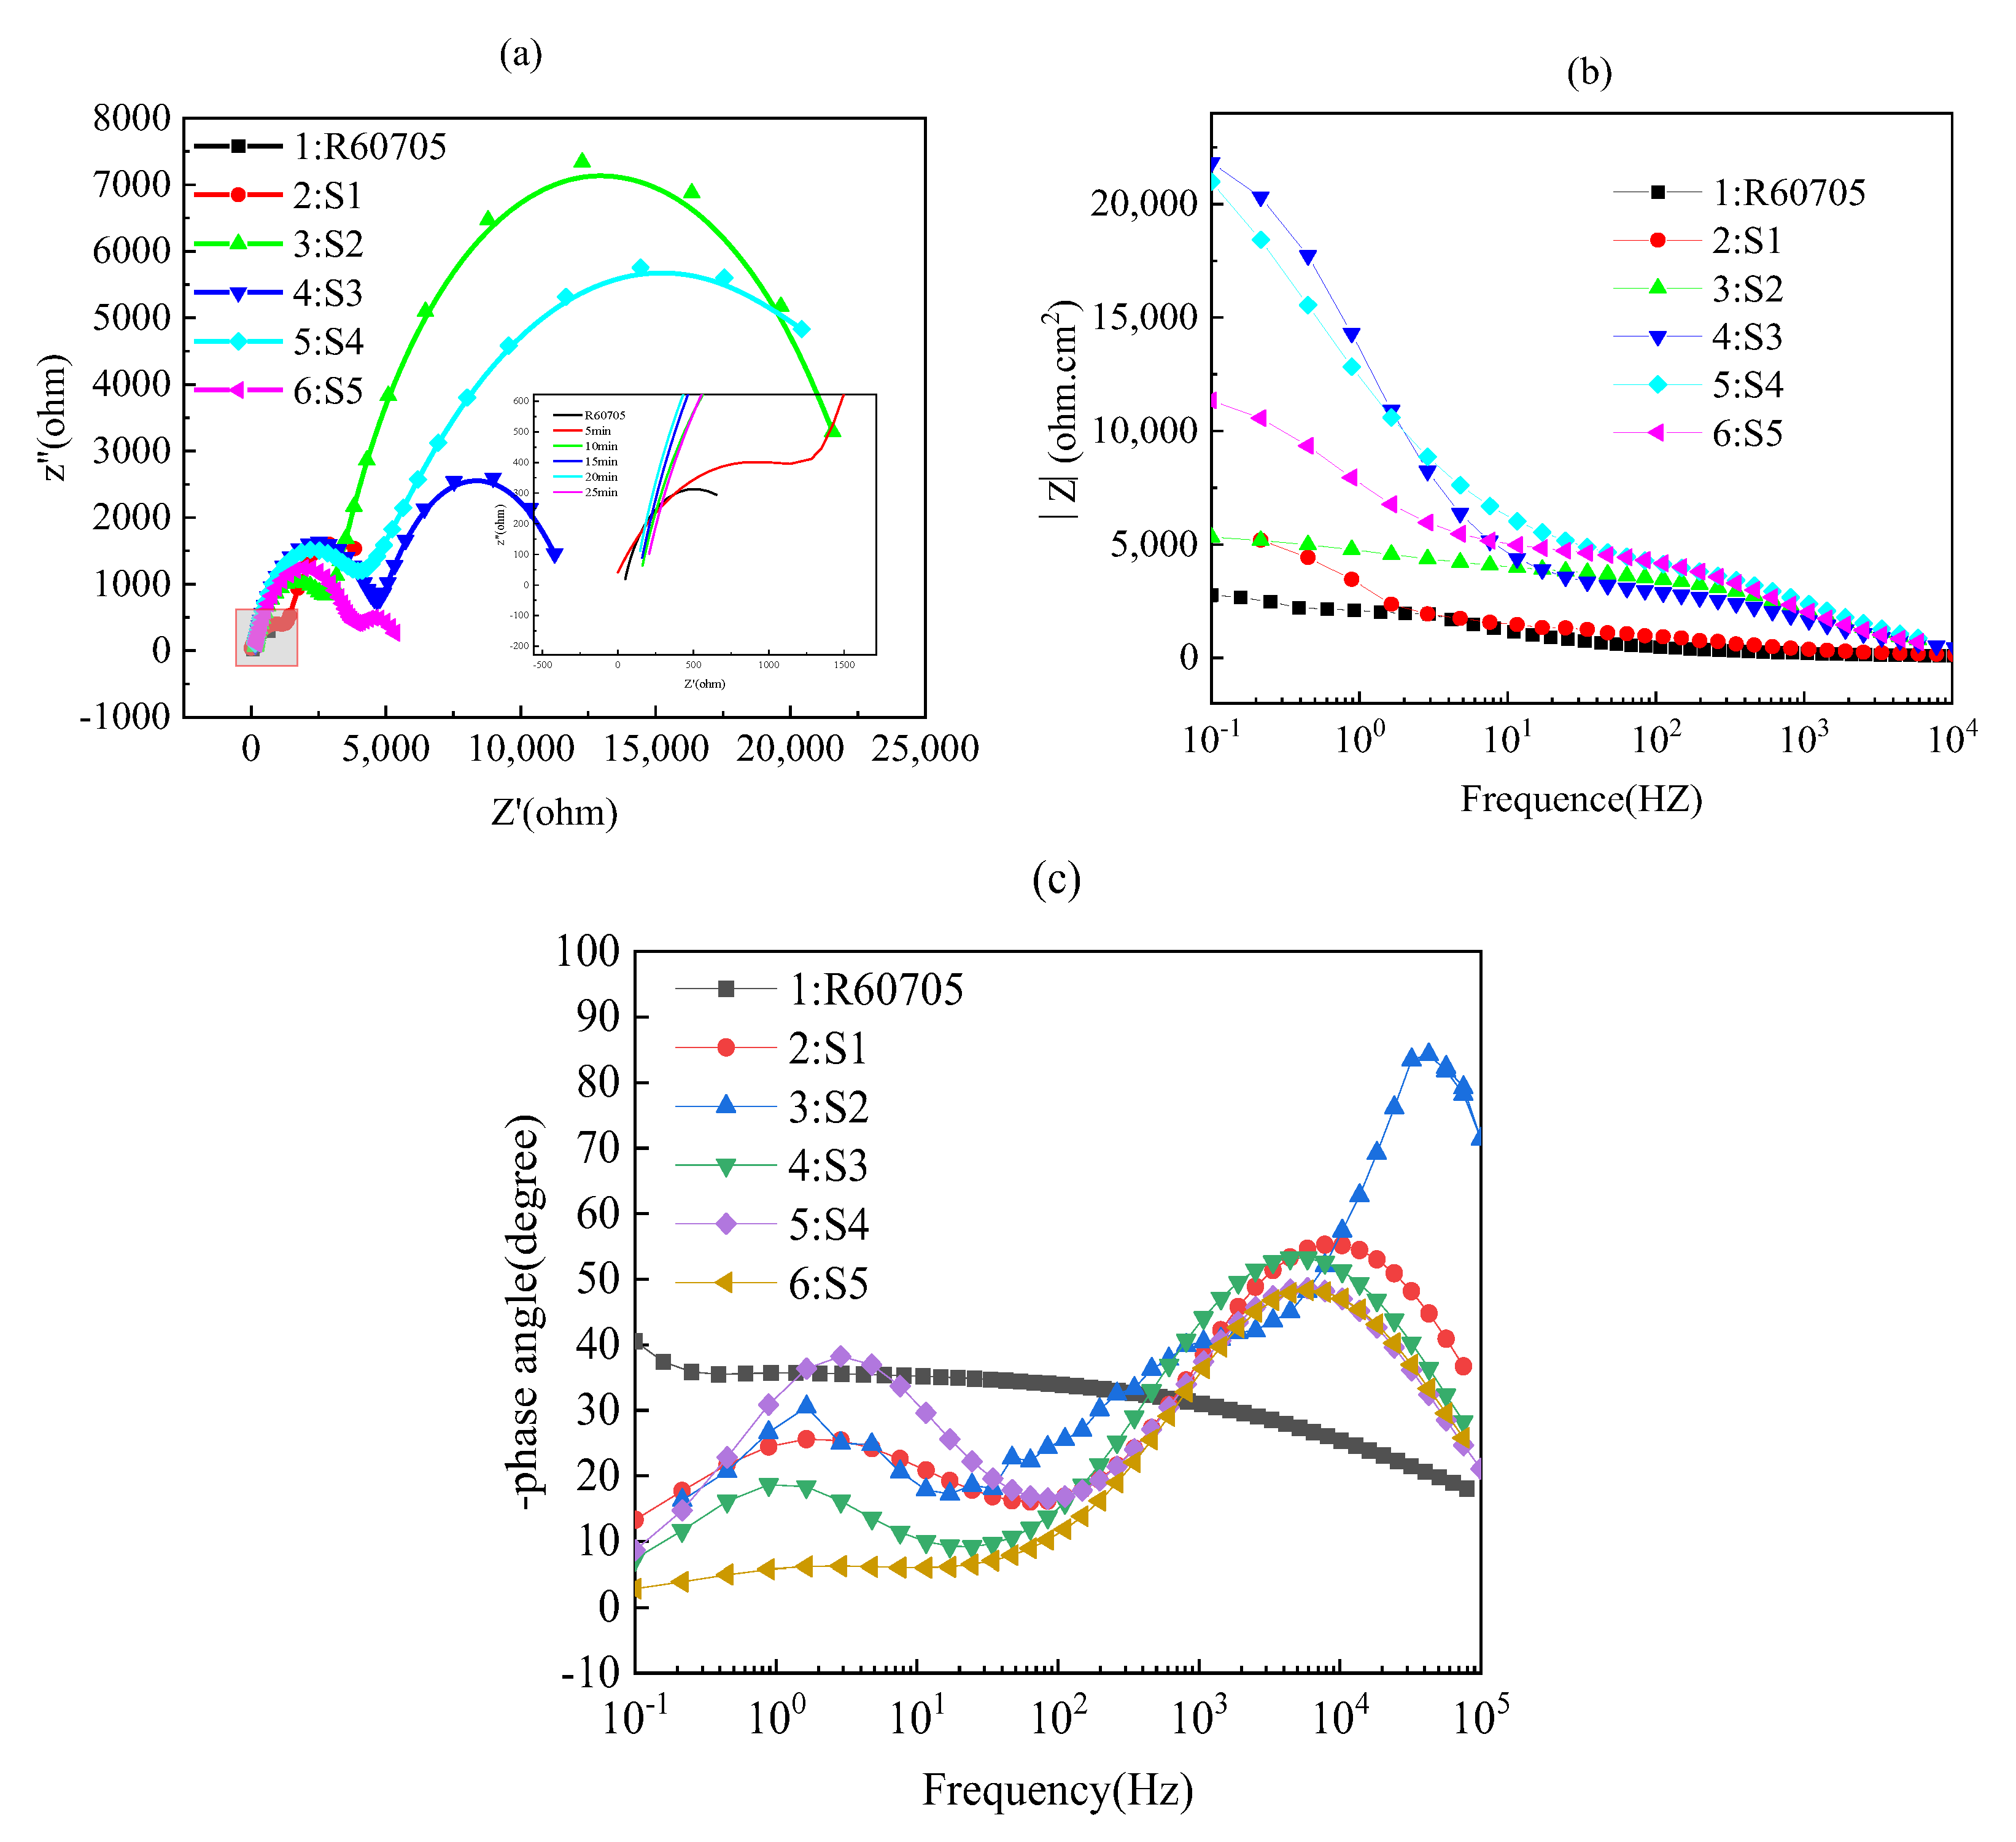
The roughness of the film initially decreases and then increases with increasing oxidation time. The lowest roughness is observed at 15 min, with a Ra value of 5.917 μm. The increase in roughness after 15 min is not significant, and the effect of oxidation time on roughness diminishes. The loss of film thickness due to wear is similar at 5, 10, and 15 min of oxidation time, indicating similar wear resistance. At 20 min, the film shows the highest loss of thickness and the poorest wear resistance, while at 25 min, the loss of film thickness decreases and wear resistance improves. The corrosion resistance of the MAO film shows a trend of initially increasing and then decreasing with oxidation time, with the minimum corrosion current density observed at 15 min, which is the optimal time for obtaining the best corrosion resistance. Based on comprehensive analysis, the optimal oxidation time for preparing the zirconium alloy micro-arc oxidation film is 15 min.

Author Contributions

Conceptualization, K.L.; Methodology, Z.D., W.C., P.J., W.W. and Z.P.; Validation, M.W.; Investigation, M.W. and Z.D.; Writing—Original Draft, M.W.; Writing—Review and Editing, K.L.; Project Administration, M.W. and K.L. All authors have read and agreed to the published version of the manuscript.

Funding

This work was financially supported by the University Science Foundation for Young Science and Technology Talents in Inner Mongolia Autonomous Region of China (Grant No. NJYT22078), Research Funds for Universities of Autonomous Region (JY20220059), National Natural Science Foundation of China (Grant No. 51964035), and Inner Mongolia Natural Science Foundation (Grant No. 2018LH05034).

Data Availability Statement

Data sharing is not applicable.

Conflicts of Interest

The authors declare no conflict of interest.

References

  1. Li, C.; Mu, L.; Zhuang, M.; Li, M.; Ma, Z. Effect of Pulse Frequency on Phase Composition and Properties of Amorphous Zirconium Alloy Micro-arc Oxidation Coating. J. Phys. Conf. Ser. 2022, 2174, 012043. [Google Scholar] [CrossRef]
  2. Durdu, S.; Aktug, S.L.; Aktas, S.; Yalcin, E.; Cavusoglu, K.; Altinkok, A.; Usta, M. Characterization and in vitro properties of anti-bacterial Ag-based bioceramic coatings formed on zirconium by micro-arc oxidation and thermal evaporation. Surf. Coat. Technol. 2017, 331, 107–115. [Google Scholar] [CrossRef]
  3. Sun, L.; Ma, Y.; An, L.; Wang, X.; Gao, W. Comparative Study on Anti-corrosion Electrochemical Response of Micro-arc Oxidation Coatings with Different Thicknesses under High and Low Voltage. Surf. Technol. 2021, 50, 366–374. [Google Scholar]
  4. Shi, L.; Qiu, C.; Liu, H. Review on Hydrogen Absorption Cracking Behavior of Zirconium Alloy Surface of Nuclear Fuel Cladding. Mech. Eng. 2022, 3, 47–48+51. [Google Scholar]
  5. Wei, K.; Xue, W.; Qu, Y. Advance in Microarc Oxidation Surface Treatment on Zr. Surf. Technol. 2019, 48, 11–23. [Google Scholar]
  6. Nahum, E.Z.; Lugovskoy, S.; Lugovskoy, A.; Kazanski, B.; Sobolev, A. The study of hydroxyapatite growth kinetics on CP-Ti and Ti65Zr treated by Plasma electrolytic oxidation process. J. Mater. Res. Technol. 2023, 24, 2169–2186. [Google Scholar] [CrossRef]
  7. Meiyi, Y.B.L.M.Y.; Jianian, Z.B.S. In Situ Impedance Characteristics of Zirconium Alloy Corrosion In High Temperature And Pressure Water Environment. Acta Metall. Sin. 2010, 46, 946–950. [Google Scholar]
  8. Zhang, Z.; He, F.; Huang, C.; Song, Z.; Yang, J.; Wang, X. Effect of Fe3+ and F on black micro-arc oxidation ceramic coating of magnesium alloy. Int. J. Appl. Ceram. Technol. 2022, 19, 2203–2212. [Google Scholar] [CrossRef]
  9. Yao, W.; Wu, L.; Wang, J.; Jiang, B.; Zhang, D.; Serdechnova, M.; Pan, F. Micro-arc oxidation of magnesium alloys: A review. J. Mater. Sci. Technol. 2022, 118, 158–180. [Google Scholar] [CrossRef]
  10. Zhou, H.; Li, Z.; Du, J.; Zhang, J.; Ji, S. Oxide Coatings on Zirconium Alloy Deposited by AC Microarc Oxidation. Rare Met. Mater. Eng. 2005, 34, 1330–1333. [Google Scholar]
  11. Jia, Y.; Lin, X.; Zou, X. Research & Development History, Status and Prospect of Zirconium Alloys. Mater. China 2022, 41, 354–370. [Google Scholar]
  12. Hu, D.; Tao, L.; Gao, G. Effect of voltage on properties of micro-arc oxidation coating formed on Zr-4 alloy from a Na2SiO3–(NaPO3)6–K2ZrF6 electrolyte. Electroplat. Finish. 2021, 40, 1352–1358. [Google Scholar]
  13. Lin, Q.; Luan, L.; Cheng, S. Surface oxidation modification of R60705 Zr alloy. Heat Treat. Met. 2013, 38, 104–107. [Google Scholar]
  14. Wang, W.; Cui, W.; Xiao, Z.; Qin, G. The improved corrosion and wear properties of Ti-Zr based alloys with oxide coating in simulated seawater environment. Surf. Coat. Technol. 2022, 439, 128415. [Google Scholar] [CrossRef]
  15. Wang, S.; Guo, F.; Liu, L. Effect of Process Parameters on Thickness and Morphology of Micro-Arc Oxidation Ceramic Coating of Zirconium Alloy. Rare Met. Mater. Eng. 2008, 1466–1470. [Google Scholar]
  16. Yan, Y.; Han, Y.; Li, D.; Huang, J.; Lian, Q. Effect of NaAlO2 concentrations on microstructure and corrosion resistance of Al2O3/ZrO2 coatings formed on zirconium by micro-arc oxidation. Appl. Surf. Sci. 2010, 256, 6359–6366. [Google Scholar] [CrossRef]
  17. Xue, W.; Deng, Z.; Lai, Y.; Zhang, T. Growth Regularity of Ceramic Film in Microarc Oxidation on Cast Magnesium Alloy. Trans. Met. Heat Treat Ment. 1998, 3, 43–46. [Google Scholar]
  18. Wang, P.; Li, J.; Guo, Y.; Yang, Z. Growth process and corrosion resistance of ceramic coatings of micro-arc oxidation on Mg-Gd-Y magnesium alloys. J. Rare Earths 2010, 28, 798–802. [Google Scholar] [CrossRef]
  19. Dong, H.; Ma, Y.; Guo, H.; Zhang, Y.; Hao, Y. Multi-dimensional investigation on coating growth of micro arc oxidation on AZ91D magnesium alloys. Chin. J. Nonferrous Met. 2015, 25, 690–696. [Google Scholar]
  20. Yang, W.; Jiang, B.L.; Shi, H.Y. Formation and growth mechanism of microarc oxidation coating on LY12 aluminium alloy. Chin. J. Nonferrous Met. 2010, 20, 1949–1954. [Google Scholar]
  21. Wang, Z.X.; Zhang, Z.Y.; Lv, W.G.; Gan, J.J.; Lu, S. Micro-arc oxidation mechanism of ZK60 magnesium alloy prepared under two-step voltage-increasing mode. J. Jiangsu Univ. Sci. Technol. 2019, 33, 14–20. [Google Scholar]
Figure 1. Schematic diagram of subregional experimental samples.
Metals 13 00935 g001
Figure 2. The section microscopic morphology of the coating including the oxidation and non-oxidation region. (a) S1; (b) S2; (c) S3; (d) S4; (e) S5.
Metals 13 00935 g002
Figure 3. Growth and growth rate of MAO coatings. (a) Degree of film growth; (b) Thickness and growth rate.
Metals 13 00935 g003
Figure 4. The curve of current changes with MAO process time.
Metals 13 00935 g004
Figure 5. Surface morphology of micro-arc oxide film on zirconium alloy. (a) S1; (b) S2; (c) S3; (d) S4; (e) S5.
Metals 13 00935 g005
Figure 6. Cross-sectional morphology and element distribution of micro-arc oxide film.
Metals 13 00935 g006
Figure 7. The phase composition of micro-arc oxide films of zirconium alloys.
Metals 13 00935 g007
Figure 8. XPS Analysis of MAO Coatings. (a) The survey spectrum; (b) Zr 3d spectrum at pass energy of 20 eV; (c) Si 2p spectrum at pass energy of 20 eV.
Metals 13 00935 g008
Figure 9. Roughness and wear resistance of the coatings. (a) Roughness; (b) Mass loss.
Metals 13 00935 g009
Figure 10. Polarization curves of micro-arc oxidation film at different oxidation times.
Metals 13 00935 g010
Figure 11. Nyquist and Bode maps of micro-arc oxide films at different oxidation times. (a) Nyquist plots; (b) Bode plots of |Z| vs. frequency; (c) bode plots of phase angle vs. frequency.
Metals 13 00935 g011
Figure 12. Equivalent circuits of the EIS plots for MAO coatings.
Metals 13 00935 g012
Table 1. Specimen codes and MAO parameters.
Specimen CodesOxidation Time (min)Forward/Negative Voltage (V)Frequency (Hz)Duty Cycle (%)
S15350/14020050
S210
S315
S420
S525
Table 2. Surface element content (wt%) of micro-arc oxidation films.
ElementZrOSiCPt
wt%48.7317.1414.3210.169.65
at%21.7141.289.1119.578.33
Table 3. Fitting parameters of the polarization curve.
Specimen
Codes
Ecoor (V)Jcorr (A·cm−2)βa (mV/dec)βc (mV/dec)Rp (kΩ·cm2)
R60705−0.1692.237 × 10−7485432444
S1−0.0729.659 × 10−85274941147
S2−0.0273.6 × 10−87264623409
S3−0.0168.876 × 10−948142211,010
S4−0.0131.649 × 10−84885386746
S5−0.0244.536 × 10−85095132448
Table 4. EIS data for R60705 and MAO coatings.
Specimens
Code
Rs (Ω·cm2)Rc (Ω·cm2)Rct (Ω·cm2)R (Ω·cm2)Error (%)
R60705103.229763.08 × 1030.66809
5109.6394112295.28 × 1032.4234
10132.3153936485.32 × 1033.4268
15150.22464517,0182.18 × 1041.1838
20153.1290017,8392.09 × 1044.1792
25165357871571.09 × 1041.8697
Disclaimer/Publisher’s Note: The statements, opinions and data contained in all publications are solely those of the individual author(s) and contributor(s) and not of MDPI and/or the editor(s). MDPI and/or the editor(s) disclaim responsibility for any injury to people or property resulting from any ideas, methods, instructions or products referred to in the content.

