Abstract
This work aimed to compare the coating protection efficiency of C-steel using two kinds of clay: a local Khulays clay (RCKh) from Saudi Arabia and a commercial clay (CCIn) from India. Clay-based polymer nanocomposites have a unique layered structure, rich intercalation chemistry, and availability at low cost. They are promising reinforcements for polymers. The raw clay for both clay types was washed before being treated with NaCl to produce sodium clay (NaC). The cationic surfactant cetylpyridinium chloride (CPC) was then used to convert the NaC into the organoclay (OC) form. Polystyrene/organoclay nanocomposites (PCNs) were prepared by combining different concentrations of organoclay (1%, 3%, and 5% OC) in toluene solvent and polystyrene (PS) as the matrix. To ensure the success of the PCN modification process, the organoclay and PCN films were characterized using a variety of techniques, including Fourier transform infrared spectroscopy (FT-IR), X-ray diffraction (XRD), and transmission electron microscopy (TEM). The shifts in the FT-IR spectra after the CPC treatment of NaC confirmed the presence of CPC in the organoclay samples and the presence of OC in the PCNs. The exfoliated structure was obtained from the XRD spectrum for low clay loading (1–3% PCN), while the intercalated structure was the dominant form for the 5% PCN. The XRD results were confirmed by TEM images. To calculate the coating efficiency of the PCNs, various electrochemical methods were used. The electrochemical measurements included electrochemical impedance spectroscopy (EIS), the electrochemical frequency modulation (EFM) method, and Tafel plots. The PCN with a concentration of 1 wt.% OC has a fully exfoliated structure and higher coating efficiency than the PCNs with partially exfoliated structures (3 wt.% and 5 wt.%). It was found from the Tafel plots that commercial Indian clay has better corrosion protection (81.4%) than local Khulays clay (60.2%). A comparison with other studies using current density values shows that our results are superior to those of many studies.
1. Introduction
Many metals are widely used in construction and other industrial fields. Corrosion problems, which limit the long-term use of metals such as iron, zinc, and their alloys, are one of the greatest challenges in the metals industry. Carbon steel (C-steel) is a common steel alloy that is used extensively in a variety of applications, such as installation, transportation, mining, and construction [1,2,3,4,5,6,7]. C-steel has a carbon content ranging from 0.12% to 2.0% (w/w), which increases the strength and hardness of steel objects, as well as their corrosion resistance [1,2,3,4,5,6,7]. Metal corrosion protection is the most difficult problem that many engineers and chemists face [1,2,3,4]. Many studies have been conducted to protect steel bodies and other metal alloys from damage caused by aggressive corrosion [1,2,3,4,5,6,7]. Organic coatings are one of many coating applications used to protect various steel bodies and other metallic substrates from corrosion due to their good barrier properties. Recently, scientists have attempted to prepare nanocomposite materials by interacting polymer coating materials with nanosized particles (e.g., metallic, organic, and inorganic nanofillers, and many nanoscale additives) that are added to improve the barrier, mechanical, and thermal properties of these polymer coatings [7,8,9,10,11,12]. Some filler nanoparticles are SiO2, TiO2, ZrO2, Fe2O3, Al2O3 [10,11], and clay derivatives (e.g., organic and inorganic clay) [11,12,13,14,15,16,17,18,19].
A nanocomposite is described as a mixture of two or more different materials, at least one of which has nanostructural dimensions between 1 and 100 nm. Clay and polymer or monomer molecules can be combined to create nanocomposite materials, or they can be made via a variety of other methods [20,21,22,23]. According to the degree of silicate-layer separation and the strength of the interfacial tension between the polymer matrix and clay layers, polymer organoclay nanocomposites are divided into three categories: intercalated nanocomposites, exfoliated nanocomposites, and conventional composites [21]. Due to their superior properties as compared with pure polymers, polymer organoclay nanocomposites (PCNs) have been used in several applications in numerous fields. These characteristics include flame resistance, thermal stability, barrier properties, mechanical properties, chemical resistance, and optical qualities [13,14]. Additionally, many studies have examined the coating characteristics of polymers and assessed the impact of adding clay to various polymers and epoxy coating [13,16,17,18,19,23,24].
Montmorillonite clay (MMT), which belongs to the Smectite group, is used for intercalation or exfoliation with the polymer matrix in PCN application [12,21]. MMT is a very soft layered silicate with the following chemical formula:
Na0.67K0.13Ca0.02Ba0.04(Si7.47Al0.53)(Al2.59Fe0.78Ti0.14Mg0.44Cr0.04)O20(OH)4
MMT possesses a high cationic-exchange capacity (CEC), which ranges between 80 and 150 meq./100 g, as well as high reactivity and a large surface area. MMT clay’s crystal structure consists of nanometer-thick layers or plates (approximately 1 nm) of aluminum octahedron sheets sandwiched between two silicon tetrahedron sheets. When the layers are arranged and stacked, a gap between them is created that is known as d-spacing or gallery spacing [12,20,21]. MMT and other layered silicate clays are hydrophilic by nature. This makes them unsuitable for interacting and mixing with most hydrophobic polymer matrices. The surface of the inorganic clay should be treated with an organic surfactant to make it compatible with the organic polymer. The conventional ion-exchange method is a simple way to modify the clay surface. The most common organic surfactants used for clay modification are phosphonium or ammonium ions in the primary, secondary, tertiary, and quaternary states. Organic cations can be exchanged for inorganic cations (K+, Na+, and Ca++) that are not strongly bound to the clay surface [12,13,14,15,16,17,18,19,21,22,23,24]. This organic modification causes the d-spacing to increase in proportion to the length of the alkyl group in the surfactant. A wide range of matrix polymers are compatible with modified organic clay (OC) [12,13,14,15,16,17,18,19,21,22,23,24]. The organic polymer can diffuse into the clay galleries after reducing the electrostatic interaction between the clay layers, which helps to separate the clay platelets so they can be more easily intercalated and exfoliated. Polymer nanocomposites represent an exciting and promising alternative to conventional composites due to the dispersion of nanometer clay platelets and their improved performance in mechanical, thermal, barrier, optical, electrical, and other physical and chemical properties [8,17,18,19,21,22,23,24,25,26]. In the present study, proceeding from our previous findings, we aimed to enhance the coating protection of C-steel using low clay loading and two types of clay.
Because of the amount of sea salt deposited on metallic and nonmetallic bodies, the marine system is one of the most important aggressive-corrosion environments. To simulate the seawater system, the corrosion behavior of steel bodies is frequently studied in a solution containing 3.5% w/v % sodium chloride. The difference in the coating efficiency of C- steel differs according to the clay type or nanoadditive intercalated with the polymer. In the first stage, the goal of this research was to modify and prepare polystyrene/organoclay nanocomposites (PS/OC PCNs). In the second stage, we aimed to characterize these PCN formulations using FT-IR, XRD, and TEM. The final stage was to investigate the corrosion behavior of C-steel rods coated with PCN using commercial Indian clay (CCIn) and local Khulays clay (RCKh) at various concentrations (1, 3, 5% PCN). The coating efficiency of the RCKh and CCIn after preparing the anticorrosive PCN coatings was then calculated using various electrochemical methods, such as electrochemical impedance spectroscopy (EIS), the electrochemical frequency modulation (EFM) method, and Tafel plots.
2. Materials and Methods
2.1. Materials
To compare the coating efficiency, two types of raw clay were studied: a commercial clay from India (CCIn) provided from the Clay Craft India, Jaipur [25] and a local clay (RCKh) from Saudi Arabia’s Khulays region, Jeddah. The RCKh was prepared by grinding raw rocks with a mortar and pestle to achieve a fine grain size in the micrometer range. X-ray Florescence (XRF, from Hitachi Company, Tokyo, Japan) was used to characterize both types of clay. The dominant CCIn components were montmorillonite (64.9%), kaolinite (10.6%), goethite (9.5%), hematite (9.4%), and boehmite (5.6%), as found earlier [25]. The XRD patterns of the RCKh show that the dominant components were montmorillonite (35.22%), mica (22.8%), kaolinite (13.33%), quartz (8.57%), feldspar (6.66%), and ilmenite (5.71%). Dolomite and gypsum (3.81%) and calcite (3.81%) were the remaining components [26].
Polystyrene (PS), with a molecular weight of 259,000 g/mol, was used to prepare the polymer clay nanocomposite in this study, and it was provided by the Sabic Company, Riyadh, Saudi Arabia.
Cetylpyridinium chloride (CPC) was purchased from the BDH Co., Istanbul, Turkey. It was used as a cationic surfactant in the production of organoclay (OC). The general formula is C21H38ClN, and its molecular weight is 358.01 g/mol. The Avonchem Company, Cheshire, UK, provided toluene (C6H5CH3), with a high purity percentage of 99.5%, which was used as a solvent for the polymer matrix PS. The Win lab Company, Queensland, Australia, provided analytical-grade sodium chloride AR.
The carbon steel (C-steel) rods were provided by the ODS Co., Schleswig-Holstein, Germany. C-steel has a chemical composition of 98.468% Fe and 0.46% C [17].
2.2. Methods
2.2.1. Modification Methods of Clay
The scheme of synthesis of PCN starting from raw clay using present study technique is shown in Figure 1. The local Khulays clay was prepared in our laboratory from raw rocks by grinding to a fine grain size in the micrometer range [26], and the CCIn was supplied as a fine powder. An amount of 30 g of raw clay (RC) was dispersed in 500 mL of distilled water and shaken overnight to remove undesirable salts and contaminants from both clay types. After setting the solution aside for a while, the supernatant solution was removed. Three days were spent repeating this action. A 250 mL solution of 0.25 M NaCl was added to the raw clay suspension of both types of clay (RCKh and CCIn), which was then agitated overnight. This process was repeated for three days. This is referred to as the inorganic cationic-exchange modification that creates a homo ionic clay surface. Following this process, the solution suspension was separated by centrifuging at 3800 rpm for roughly 10 min. When the AgNO3 test for chloride ions was negative, the produced homo ionic clay (NaC) was washed and separated by centrifuging. After this alteration, the NaC was ground to fine powder and stored in a desiccator after being dried in an oven. The organic modification of the NaCl of both clay types was then achieved through a cationic-exchange reaction with cetylpyridinium chloride (CPC), in which organic cations replaced sodium ions to prepare the organoclay (OC).
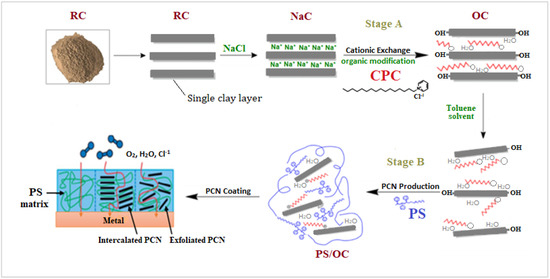
Figure 1.
Scheme of synthesis of PCN starting from raw clay using present study technique.
This procedure was carried out by dispersing 5 g of NaC from both clay types in 500 mL of distilled water, stirring the solution, and leaving it overnight. CPC solution was made by dissolving 3.58 g of cetylpyridinium chloride (two times the CEC of clay) in 100 mL distilled water. The CPC surfactant solution was added dropwise to the NaC suspension while vigorously stirring, and the mixture was stirred for 24 h at room temperature to ensure CPC insertion within the clay layers. The OC was collected and separated by centrifugation at 3800 rpm for about 10 min, followed by several washes with distilled water until no chloride ions were found in the solutions. The organoclay was oven-dried overnight before being ground with a mortar and pestle to a fine grain size in the micrometer range and stored in a desiccator [17].
2.2.2. PCN Preparation Methods
Polystyrene/organoclay (PS/OC) composites, or PCNs, were prepared utilizing solution techniques, with the OC contents ranging from 1% to 5%. A specific amount of organoclay (0.02, 0.06, or 0.1 g) was added to 10 mL of toluene solvent in 50 mL glass bottles, and the mixture was magnetically agitated for 24 h at room temperature. The next day, two grams of PS was added to the organoclay suspension, which was magnetically stirred for six hours at room temperature. The PS/OC (PCN) mixture was then subjected to 10 min of sonication. For the characterization methods, the PCN solutions were cast into Petri dishes and allowed to dry at room temperature for 24 h before being delicately removed from the glass surface [26]. Figure 1 shows the process of preparing a PS/OC nanocomposite from raw clay to the final goal of preparing the coating protecting the C-steel using PCN.
2.2.3. Characterization Methods
For the characterization, the methods FT-IR and XRD were performed at King Saud University’s College of Science, the Department of Chemistry. In the absorbance range from 400 to 4000 cm−1, Perkin Elmer FT-IR (Waltham, MA, USA) was used to characterize the raw clay, Na clay, organoclay, and all prepared polystyrene nanocomposites. Wide-angle X-ray diffraction (XRD) patterns were used to examine all the PCN samples and modified clays using an XRD (Bruker model D8 ADVANCE from Hamburg, Germany). The operating conditions were as follows: a Cu anode radiation source with a wavelength of λ = 0.154 nm, and a current and voltage generator of 40 mA and 40 kV, respectively. The experiments were conducted at a scanning rate of 0.30/sec in the 2θ = 3–50° range. Transmission electron microscope (TEM) (JOEL-1400 from Japan) measurements were taken in the central laboratory for the Center of Science and Medical Studies for Female Students at KSU. All prepared films were immersed in epoxy resin and cured at room temperature overnight. They were then divided into segments with a thickness of roughly 70–100 nm using a microtome. The nanocomposite samples were placed on carbon-coated 200-mesh Cu grade, and the ultrathin segments were cut with a diamond knife to create clear images. TEM was used to examine the morphology of the pure PS, OC, and polystyrene/organoclay nanocomposite (1–5% wt.) films.
2.2.4. Electrochemical Methods
All electrochemical measurements were performed using a three-electrode electrochemical cell, with the C-steel as the working electrode, having a surface area of 9.95 cm2, which was calculated using a Mitutoyo gauging tool (Kanagawa, Japan). The standard Calomel electrode (SCE) served as the reference electrode, and rigid platinum foil served as the auxiliary/counter electrode, having a surface area of 100 mm2. The working electrode was polished to a mirror image by the polishing machine (Metaserve 2000, Buehler, London, UK) using emery papers of various grades (80, 220, 600, 1000). The electrodes were then washed several times with distilled water and cleaned with an ultrasonic cleaner in acetone for 2 min. The PCN solutions were cast dropwise onto the polished C-steel rods to completely cover their surfaces. The coated C-steel samples were then dried at room temperature for 1 h before being dried at 50 °C overnight. Another layer was added to achieve a final thickness of 100 ± 10 µm, as measured by a coating-thickness gauge (Elcometer 465, Manchester, UK) [8]. All of the electrodes were immersed in a 3.5 wt.% NaCl aqueous solution at room temperature (30 ± 0.5 °C).
The electrochemical measurements were performed using a Gamry Potentiostat/Galvanostat ZRA (model 3000, Warminster, PA, USA). Three electrochemical methods were used in the following order to assess the protection efficiencies of the prepared PCN coatings. The first step was to attain equilibrium. The open-circuit potential (OCP) was activated for 90 min to stabilize the system and achieve steady-state potential (ESS). The first method was electrochemical impedance spectroscopy (EIS) using Nyquist plots, with a sweep frequency from 105 to 10−1 Hz and at an AC amplitude of 10 mV. The perturbation amplitude for the second approach, electrochemical frequency modulation (EFM), was 10 mV with a base frequency of 0.1 Hz. The potential 250 mV from the ESS was scanned using the fourth method, potentiodynamic polarization (Tafel plot), at a rate of 1 mV/sec. Each experiment was conducted three times, and the reported results are the averages of three similar results.
3. Results and Discussion
3.1. Characterization Methods
The following parts will exhibit the FT-IR spectra, XRD, and TEM analyses of the different types of clay: commercial Indian clay (CCIn), local Khulays clay (RCKh), and their derivatives (NaC, OC), in addition to all recorded from 1–5 wt.% PCN.
3.1.1. FT-IR Analysis
Clay surface changes are identified using FT-IR analysis [27,28]. The FT-IR spectra of the unmodified, Na-modified, and organically modified clay from the CCIn and RCKh are shown in Figure 2 and Figure 3, respectively. From Figure 2, the infrared spectrum of commercial clay, the band in the OH-stretching region at 3628 cm−1 is attributed to the hydroxyl groups coordinated to Al+3 octahedral cations (Al-OH) [28]. At 3439 cm−1 and 1646 cm−1, respectively, the OH-stretching and -bending vibrations of the adsorbed water molecules were seen [29]. Additionally, a band at 522 cm−1 is for Al–O–Si deformation, and a band width at 1033 cm−1 is for the clay’s Si–O stretching vibrations. Additionally, a wide weak band at 462 cm−1 has been linked to Si–O–Si deformation [28,30,31]. Absorption bands for water molecules were seen at 3440 and 1650 cm−1. The bands for the deformations of Al–O–Al and Si–O–Si are situated at 523 and 464 cm−1, respectively.
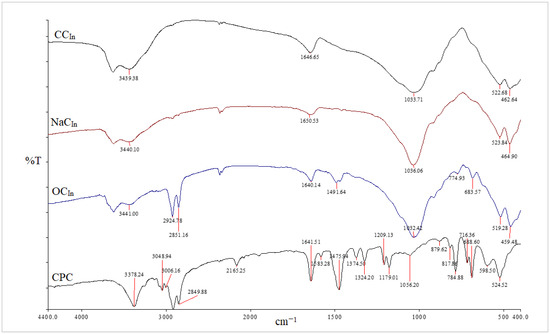
Figure 2.
FT-IR spectra of CCIn, NaCIn, OCIn, and CPC from CCIn modification.
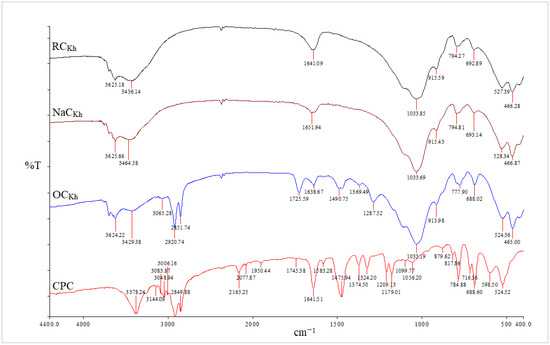
Figure 3.
FT-IR spectra of RCKh, NaCKh, OCKh, and CPC from RCKh modification.
The asymmetric and symmetric stretching vibrations of the (C–H) in the alkyl group of CPC have significant sharp peaks at 2924 and 2851 cm−1, respectively [32]. These two distinct, strong bands are unmistakably an indication of the intermolecular interactions that take place between neighboring alkyl chains of the organic surfactant (CPC) in clay galleries that have been treated with sodium. Additionally, a new peak for the aromatic (C = C) stretching vibrations of CPC molecules has been identified at 1491 cm−1 [33]. In addition to the Si–O vibrations’ strong broadband properties, which were seen at 1032 cm−1, the OH groups of water’s asymmetric stretching and bending vibrations were visible at 3441 cm−1 and 1640 cm−1. The success of the CPC cation intercalation between silicate layers and the organic alteration of NaC by CPC were both validated by all of these shifts and modifications in the OC spectrum [34]. Figure 4 and Figure 5 for the CCIn and RCKh, respectively, display the FT-IR spectra for all synthesized PS/OC nanocomposites (PCNs) and their derivatives. These spectra show the presence of OC in the polymer matrix. The absorption bands emerged in these spectrums at the same places of the polystyrene matrix with little shifting, while some novel band alterations were attributed to the OC structure [34,35]. Two absorption bands related to the aromatic stretching vibration of sp2 can be seen in the PS spectrum at 3059 and 3027 cm−1 (C–H). Additionally, at a wavelength from 2923 to 2852 cm−1, there are two powerful absorption bands that are connected to the asymmetric/symmetric vibrations of the aliphatic (C–H) stretching of (–CH2).
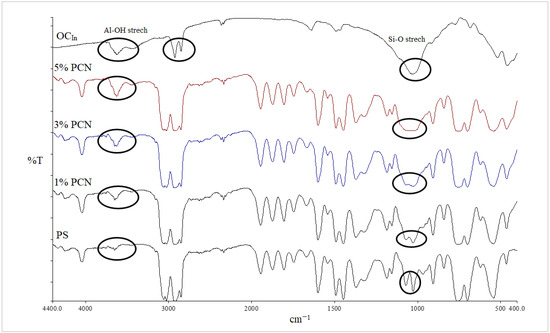
Figure 4.
FT-IR spectra of PS, 1–5% wt.% PCN, and OCIn using CCIn.
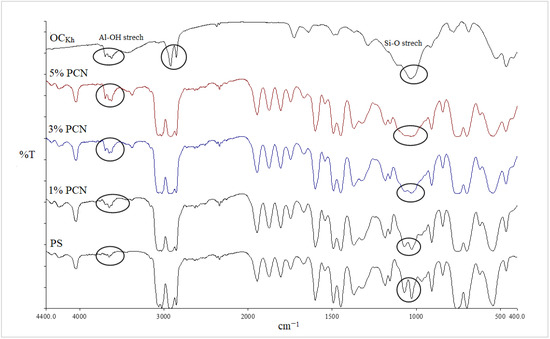
Figure 5.
FT-IR spectra of PS, 1–5% wt.% PCN, and OCKh using RCKh.
Additionally, it was discovered that in all the PCN spectra, the aromatic ring stretching vibrations of (C = C–C) had absorptions between 1492 and 1600 cm−1, and their overtone bands were seen between 1945 and 1746 cm−1. For the Indian and Khulays clay types, as well as for all manufactured nanocomposites (1–5% wt.% PCNs), the evident change in the weak band of pure PS at 3652 cm−1 was noted, especially in the case of the 5% PCN. Additionally, for all the nanocomposites, the overlap with the aliphatic and aromatic C–H stretching of PS is to blame for the removal of the CH2 stretch peak for OC. Additionally, it was noted that the form of the CH2 bending peak for PS at 1027 cm−1 changed, and it was particularly obvious in the case of the 5 wt.% PCN. These alterations all pointed to the successful intercalation between the OC and PS matrices. Additionally, the overlap with the aliphatic and aromatic C–H stretching of PS is to blame for all the nanocomposites’ elimination of the CH2 stretch peak for OC.
3.1.2. X-ray Diffraction
The distances between the clay layers for the raw clay, NaC, OC, and PCN films were obtained from the peak position of the XRD pattern using Bragg’s equation:
where d is the basal spacing between the clay layers; θ is the angle from the diffraction beam to the atomic plane; n (equal to one here) relates to the order of the reflection; λ is the wavelength of the X-ray radiation employed in the experiment (λ = 1.54060 Å).
2d sinθ = n λ
X-ray Diffraction of RC, NaC, and OC
In Figure 6 the spectra of the raw Indian clay (CCIn) showed a characteristic peak at a 2θ value of 7.15°, corresponding to a basal spacing of 12.35 Å. The small peak in NaC appeared at a 2θ value of 9.17°, with a d-spacing of 9.64 Å. However, the NaCIn peak after modification with a CPC organic surfactant to obtain in the OCIn shifted to a lower 2θ value at 4.21°, with a d-spacing equal to 21 Å due to the loss of water molecules. The XRD patterns for the local Khulays clay (RCKh) in Figure 7 show the characteristic peak of d-spacing at a 2θ equal to 7.00° (d = 12.62 Å). This peak in the NaCKh and OCKh was observed at a 2θ equal to 7.39° (d = 11.95 Å) and 2θ equal to 4.30° (d = 20.55 Å), respectively. The changes and shifting of the OC peaks (for the Indian and Khulays clay) to a lower 2θ and the increase in the d-spacing refer to the increase in the gap between the clay platelets. Thus, the large increase between the NaC platelets provides a good interlayer exchange of sodium cations by CPC cations [34], which means that the CPC surfactant was successfully intercalated in these types of clay [34,36].
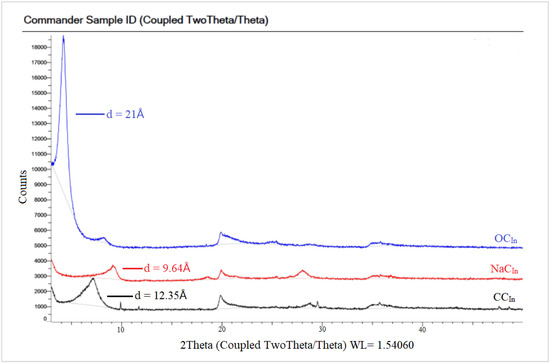
Figure 6.
XRD patterns for RC, NaC, and OC of commercial Indian clay.
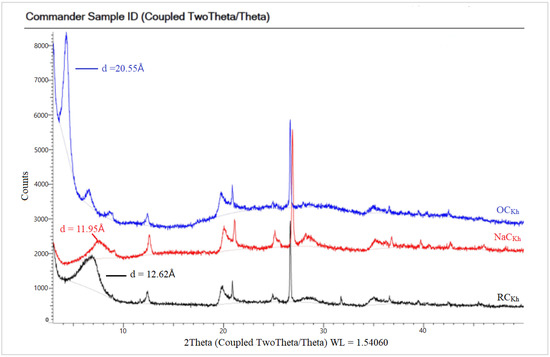
Figure 7.
XRD patterns for RC, NaC, and OC of Khulays clay.
X-ray Diffraction of PS, OC, and PCN
The XRD of the PCN samples from both clay types are shown in Figure 8 and Figure 9. Both figures show the amorphous PS humps. Low crystallinity is the factor behind the broad diffraction peaks in PS. In the 1–5% PCN patterns, the diffraction peak of polystyrene appeared in the same position in these PCNs (1–5% PCNs). Importantly, the diffraction peak of the OC disappeared in the prepared PCNs, which indicated the amorphous PCN structure. The elimination of the OC peak denotes a significant opening of the clay layers, which is consistent with a good intercalation between the OC and PS matrix. The produced PCNs thus acquired an exfoliated structure. Our findings are consistent with numerous earlier investigations that found polymer clay nanocomposites to have an exfoliated structure [34,36]. The intercalated organic cations can be distinguished based on their different configurations using the d001 spacing value that Chen et al. [37] previously published. The change in the basal spacing for both types of OC is attributed to the increase in the interlayer space distance, indicating a successful intercalation of surfactant molecules between clay layers for both CCIn and RCKh [38,39].
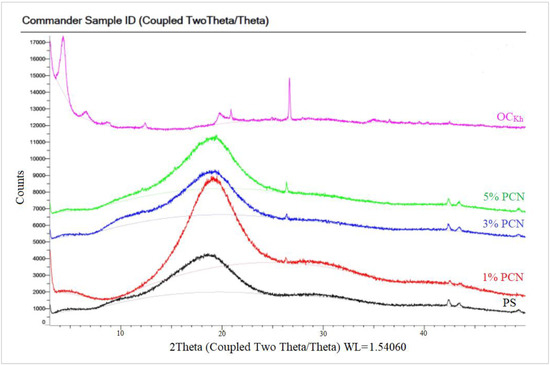
Figure 8.
XRD patterns of pure OC, pure PS, and 1–5% wt. PCN using Indian organoclay.
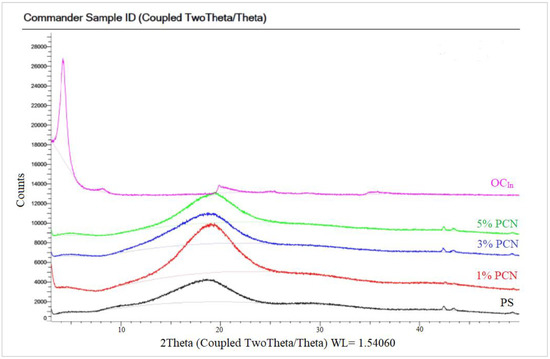
Figure 9.
XRD patterns of pure OC, pure PS, and 1–5% PCN using Khulays organoclay.
3.1.3. TEM Analysis
In this investigation, TEM was employed to confirm and explore the dispersion states of polystyrene chains into the organoclay (OC) clay galleries [36]. Figure 10 and Figure 11 show the TEM micrographs of pure organoclay (OC) from the Indian and Khulays clay, as well as all prepared nanocomposites (1–5 wt.% PCNs). The bright areas in these photos repre-sent the PS matrix, and the dark lines represent the OC sheets [17]. Images of the 1% PCN from both types of clay revealed that the OC sheets are entirely exfoliated, whereas at 3% and 5% PCN, the OC sheets are still well ordered in certain tiny regions. This finding demonstrates categorically that the structure of the PS/OC nanocomposite at 1 wt.% is totally exfoliated, while the structure at 3 and 5 wt.% PS/OC nanocomposites are only partially exfoliated. In the case of the 1% PCN, the results are consistent based on the available XRD data and TEM micrographs.
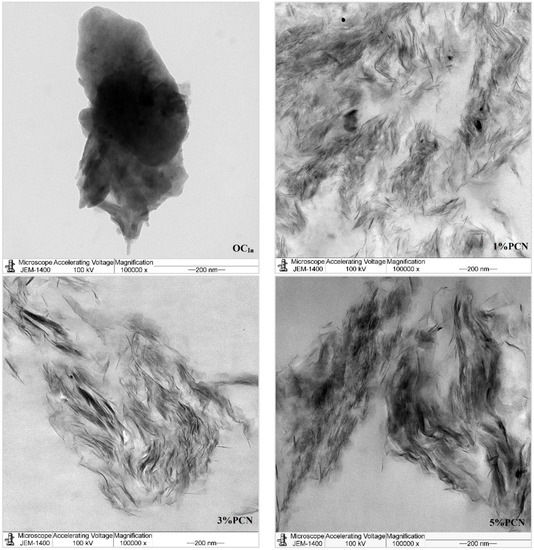
Figure 10.
TEM micrographs of pure OC and 1–5 wt.% PCN for CCIn at high magnifications.
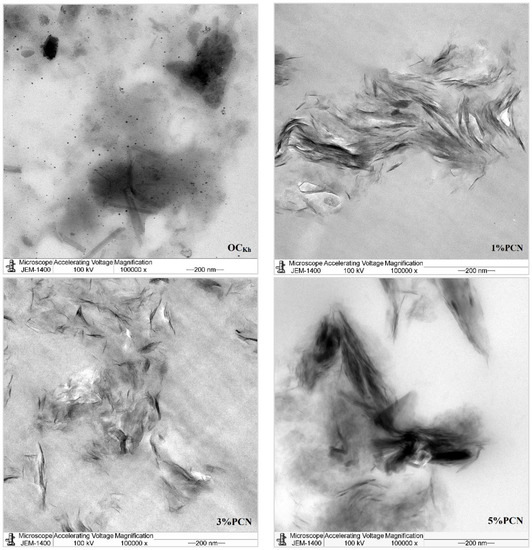
Figure 11.
TEM micrographs of pure OC and 1–5 wt.% PCN for RCKh at high magnifications.
However, the XRD results for the 3 and 5% PCNs revealed the formation of an exfoliated structure, while the TEM data revealed the presence of an intercalated structure in localized locations. The same outcomes were attained for all the PS/OC nanocomposites made from the local Khulays and Indian clay. As a result, the TEM technique is regarded as an important tool for evaluating the dispersion degree of nanoparticles in polymer matrices [11,12,21]. When the TEM pictures are compared, it is clear that the CCIn exhibited greater exfoliation than the RCKh at all the formulations tested.
3.2. Electrochemical Methods
3.2.1. Electrochemical Impedance Spectroscopy (EIS)
The coating efficiencies of pure PS and all PS nanocomposite coatings on C-steel rods were investigated using electrochemical impedance spectroscopy (EIS), which is a vital tool in electrochemistry research. It is a strong nondestructive tool for examining and evaluating various electrical characteristics of materials [2,3,4]. Figure 12 and Figure 13 show Nyquist plots of pure PS and all samples of commercial and local clay PCNs, as well as similar circuits. Table 1 shows the EIS parameters as corrosion resistance (RCorr or Rct), electrical double-layer capacitance (Cdl or CCorr), coating resistance (Rpo) (pore resistance), and coating capacitance (CC). As illustrated in Figure 12 and Figure 13, these parameters were derived by fitting the Nyquist plots of all the coated C-steel samples that had undergone testing to an analogous circuit using Gamry software.
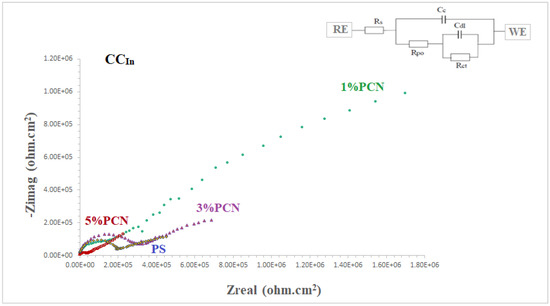
Figure 12.
EIS plots of coated C-steel by pure PS and all prepared 1–5% PCNs from Indian clay (CCIn) in 3.5% NaCl solution at 30 °C.
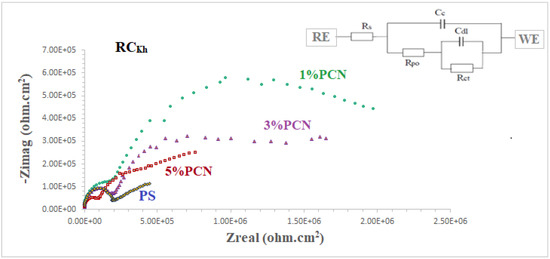
Figure 13.
EIS plots of coated C-steel by pure PS and all prepared (1–5% PCNs for RCKh in 3.5% NaCl solution at 30 °C.

Table 1.
EIS data of bare C-steel, pure PS, and 1–5 wt.% PCN coating from commercial Indian and local Khulays clay in 3.5% NaCl solution at 30 °C.
The fitted EIS data of bare C-steel and PS and the 1–5% PCN data for both types of clay are presented in Table 1. It is noticed that the coating of C-steel with PS greatly increased the RCorr values and decreased the CCorr values relative to bare C-steel. As reported in the literature for the coated substrates, the first semicircle in the high-frequency region was related to the resistance and capacitance of the protective coating and its properties [13,14,15,22]. The second semicircle in the low-frequency region was attributed to the electrochemical reactions on the C-steel surface. The findings demonstrated that, in comparison with pure PS coating, the introduction of a tiny amount of OC to the PS polymer enhanced the corrosion resistance (RCorr) and pore resistance (Rpo) of the prepared PCNs. It was realized that, as the diameter of the second semicircle increased, so did the values of the RCorr and Rpo. By adding the small percentage of OC, the values of the corrosion and coating capacitance (CCorr, CC) decreased. These observations for the RCorr, Rpo, CCorr, and CC values indicate that the PCN coatings have higher corrosion protection than pure PS coating. Generally, this indicates that the protective properties of pure PS coating were improved by adding OC content. This behavior was observed for all the prepared PCNs from commercial Indian clay and Khulays clay. In the present study, our impedance results are in agreement with many previous studies [2,3,19,23,24]. Moreover, adding the organic form of the commercial Indian clay at 1% PCN increased the corrosion resistance value (RCorr) of the coating by about three times the value of the local Khulays clay at 1% PCN. The value of the RCorr in the case of the commercial Indian clay was 6.26 MΩ·cm2, while in the case of the local Khulays clay, the value was 2.46 MΩ·cm2 This was probably due to the high montmorillonite content in the CCIn, which could be easily exfoliated and allows for maximum protection.
3.2.2. EFM Method
The electrochemical frequency modulation (EFM) method is considered a new nondestructive way of electrochemical corrosion monitoring. Consequently, it is a good choice for many metals and metal alloys in different aqueous corrosion systems. The corrosion parameters of the EFM test are good for comparison with the results from the Tafel method and linear polarization resistance [40,41]. The results from the EFM are included in Table 2, with the potentiodynamic polarization results prepared from 1–5 wt.% PCNs for commercial Indian (CCIn) and local Khulays (RCKh) clay in 3.5% NaCl solution at 30 °C. The percentage of coating, or the protection efficiency, was calculated from the following equation:
Table 2.
EFM data of bare C-steel, pure PS, and 1–5% PCN coating from commercial Indian and local Khulays clay in 3.5% NaCl solution at 30 °C, and relative protection efficiencies (%PE) calculated using ICorr.
The EFM parameters (the corrosion current (ICorr), corrosion potential (ECorr), corrosion rate (CR), and calculated relative coating efficiency from the ICorr values) are summarized in Table 2 and Table 3. It can be noticed that the coating of C-steel with PS greatly decreased the CR and ICorr values relative to the bare C-steel. Moreover, the PCN coating further decreased the corrosion rate and increased the coating efficiency for both clay types. For the EFM in Table 2, the parameters are the current density in µA/cm2 and the corrosion rate in MPY (milli-inch per year). The goodness of fit for the EFM method is presented in causality factors 2 and 3. Almost all of our results fit this criterion. It is shown in Table 2 that for the 1% PCN of CCIn, the CR is 5.920 × 10⁻⁴ mpy, which is the lowest CR of all the formulations.
3.2.3. Potentiodynamic Polarization (Tafel Plots)
Tafel plots are represented in Figure 14 and Figure 15 for the coated C-steel samples prepared from PCNs prepared from CCIn and RCKh, respectively, in 3.5 wt.% NaCl solution at 30 °C. The cathodic and anodic curves were analyzed directly from a Gamry potentiostat/galvanostat to determine the Tafel corrosion parameters.

Figure 14.
Tafel plots of coated C-steel by pure PS and from 1–5 wt.% PCN prepared from commercial Indian clay (CCIn) in 3.5% NaCl solution at 30 °C.
Figure 14.
Tafel plots of coated C-steel by pure PS and from 1–5 wt.% PCN prepared from commercial Indian clay (CCIn) in 3.5% NaCl solution at 30 °C.


Figure 15.
Tafel plots of coated C-steel by pure PS and 1–5 wt.% PCN prepared from local Khulays clay (RCKh) in 3.5% NaCl solution at 30 °C.
Figure 15.
Tafel plots of coated C-steel by pure PS and 1–5 wt.% PCN prepared from local Khulays clay (RCKh) in 3.5% NaCl solution at 30 °C.

Table 3.
Tafel data of bare C-steel, pure PS, and 1–5% PCN coating from CCIn and RCKh in 3.5% NaCl solution at 30 °C, and the relative protection efficiencies (PE%) calculated using ICorr.
Table 3.
Tafel data of bare C-steel, pure PS, and 1–5% PCN coating from CCIn and RCKh in 3.5% NaCl solution at 30 °C, and the relative protection efficiencies (PE%) calculated using ICorr.
| Sample Code | ECorr (mV) | ICorr (µA/cm2) | CR (mpy) | Chi.sq. | %PE | |
|---|---|---|---|---|---|---|
| Bare C-steel | −631 | 1.46 × 10² | 6.87 | 2.55 × 10⁻² | - | |
| PS | −515 | 3.89 × 10⁻¹ | 1.79 ×10⁻² | 1.20 | - | |
| CCIn | 1% PCN | −431 | 7.23 × 10⁻² | 3.32 ×10⁻³ | 2.38 | 81.41 |
| 3% PCN | −568 | 1.34 × 10⁻¹ | 6.12 ×10⁻³ | 4.48 | 65.55 | |
| 5% PCN | −561 | 9.20 × 10⁻² | 4.23 × 10⁻³ | 2.29 | 76.35 | |
| RCKh | 1% PCN | −425 | 1.52 × 10⁻¹ | 6.99 × 10⁻³ | 3.93 × 10⁻² | 60.93 |
| 3% PCN | −496 | 1.71 × 10⁻¹ | 1.06 × 10⁻² | 3.83 | 56.04 | |
| 5% PCN | −496 | 2.90 × 10⁻¹ | 1.33 × 10⁻² | 16.18 | 25.44 | |
In Table 3 for the Tafel plots, the parameters are the current density in µA/cm2 and the corrosion rate in mpy. For Tafel, the values of the chi-square values are included, which reflect the goodness of fit of the present data, which lies in the accepted range. As in the EFM, the best coating efficiency is shown for the 1% PCN of CCIn.
The Tafel plot results showed that the PCN-coated C-steel samples had smaller ICorr and CR values than the PS-coated sample. This indicates that an incorporation of OC in the PS matrix enhances the protective properties of this polymer as a coating for C-steel. This behavior is consistent with previous studies that evaluated the effect of adding small amounts of clay to different types of polymers, such as polyurethane [13], polyaniline [16,23], polypyrrole [22], polystyrene [17,18], and epoxy coating [9,24]. Moreover, the trend in the Tafel results was in agreement with the EFM investigation. According to the EIS, EFM, and Tafel results, the PCN-coated C-steel samples exhibited better corrosion resistance and coating efficiency than the pure PS coating. The best electrochemical protection efficacy was observed at 1% PCN for both types of clay. This is most likely due to the good dispersion of the 1 wt.% organoclay layers in the PS chains, as demonstrated by the XRD and TEM results. Other research groups [13,17] have obtained greater protection efficiencies at 3 wt.% organoclay with polymers. In the case of 1% PCN, however, the fully exfoliated structure was obtained by comparing the electrochemical results with the characterization method results (XRD, TEM). However, the corrosion protection performances of the 3% and 5% PCNs were worse than that of the 1% PCN. This suggests that the results of the characterization methods are consistent with the electrochemical investigations (EIS, EFM, and Tafel). The order of the coating efficiency for both clay types from Table 2 and Table 3 is as follows:
1% PCN > 3% PCN > 5% PCN
3.2.4. Comparison Studies
Finally, Figure 16 compares the results of the three methods used in the present study to assess the corrosion protection efficiency. It was found that the CCIn had a superior corrosion resistance to the local clay in all of these procedures. The corrosion resistance value of the 1% PCN of the commercial Indian clay is about three times higher than the value of the 1% PCN of the local Khulays clay, as illustrated in Figure 16. Furthermore, the corrosion resistance of these polymer clay nanocomposites decreased gradually from 1–5% PCN. When comparing the corrosion resistance (Rct) obtained from the EIS results (Figure 16), it was found that they coincide with the corrosion current density (ICorr) values derived from the EFM and Tafel methods (Figure 17a,b). This main conclusion may be attributed to the chemical composition of the commercial Indian clay and the high percentage of montmorillonite content compared with the local Khulays clay. The high percentage of montmorillonite content (64.9%) [25] increased the ability of this clay to swell more than the local Khulays clay, which contains 35.22% montmorillonite. This resulted in the improved CPC intercalation and greater dispersion of the commercial Indian clay layers inside the polystyrene chains, which increased the tortuous course of the corrosive ions and resulted in a higher coating efficiency. Fully exfoliated organoclay layers within the PS matrix improve the protective qualities of the PS coating more than partially exfoliated nanocomposite and pure PS coatings. Thus, the permeating molecules are forced to take a wiggling path and diffuse via the convoluted channels around them, especially at low OC content, which increases the tortuosity of the oxygen, water, and chloride ion diffusion pathways and increases the coating efficiency compared with using a pure PS coating [4,9,17].
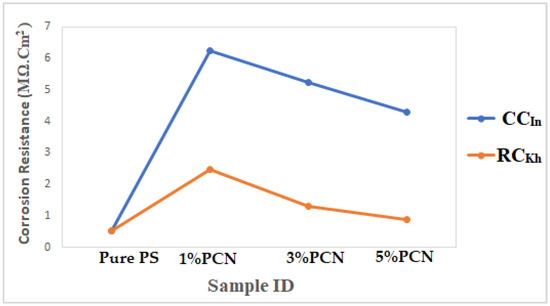
Figure 16.
Comparison of electrochemical results from EIS method of PCN coating of present study for both clay types.
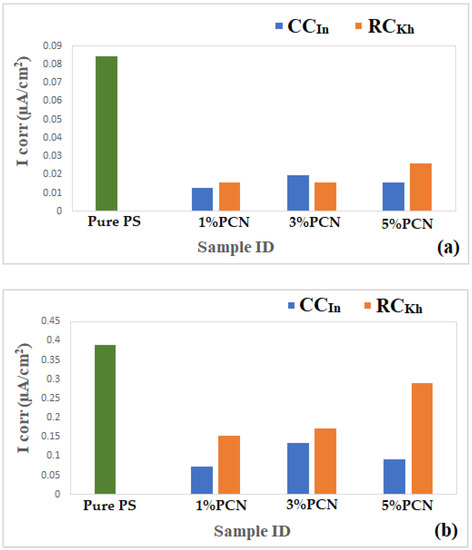
Figure 17.
(a,b) Comparison of electrochemical results from (a) EFM and (b) Tafel for PCN coating of present study for both clay types.
A comparison with other studies is shown in Table 4 using current density values. It is noticed that the current density values of our study are much better than those of the best study, which is Chen-Yang et al. [42] using polyurethan. The current density value of PCN (CCIn) 7.23 × 10⁻⁸ A/cm2 is better than any other formulation, as shown in Table 4. However, it is hard to make such a comparison with other studies, as there are many parameters that need to be taken into consideration, such as the adhesion of the polymer and PCN on the metal, the coating thickness, the metal, the temperature of the study, and the exfoliation of the organoclay layers within the polymer matrix.
Table 4.
A comparison of our results with previous ones.
4. Conclusions
Polymer clay nanocomposite (PCN) samples were generated in this study by combining different concentrations of organic clay (1%, 3%, and 5% OC) in toluene solvent and polystyrene as the matrix (OC/PS). Many techniques, including FT-IR, XRD, and TEM, were used to characterize the organoclay and PCN films to ensure the success of the modification procedure. After treating sodium clay (NaC) with CPC, the shifts in the FT-IR spectra confirmed the presence of CPC in the organic clay samples. An exfoliated structure was obtained from the XRD spectrum for low clay loading (1–3% PCN), whereas an intercalated structure was the dominant form for the 5% PCN. The XRD results were confirmed by TEM images. Exfoliated structure preparation is crucial, as it might be employed in polymer clay nanocomposite coating. Furthermore, the electrochemical measurements (EIS, EFM, and Tafel plots) coincide with the morphological data from the XRD and TEM. According to the results of the electrochemical experiments (EIS, EFM, and Tafel plots), commercial Indian clay provides greater corrosion protection than native Khulays clay. This is clearly demonstrated by comparing the corrosion resistance values obtained from the EIS technique, as well as the relative coating efficiencies obtained from the EFM test and Tafel plots of both types of PCNs. The nanocomposite with a concentration of 1% has a fully exfoliated structure and showed stronger protective characteristics than the nanocomposites with partially exfoliated structures (3 wt.% PCN and 5% PCN). This is due to the increased tortuosity of the diffusion paths of oxygen, water molecules, and chloride ions when compared with pure PS coating. Even with a modest amount of clay added, polymer clay nanocomposites exhibit improved coating characteristics. This is due to the clay particles’ nanoscale size, which results in a wide contact area between the polymer matrix and filler. The structure of clay, with layers of a high aspect ratio, provides superior barrier characteristics as well as enhanced anticorrosive capabilities. This principal result can be attributed to the chemical composition of commercial Indian clay and the high percentage of the montmorillonite concentration when compared with the local Khulays clay. The high montmorillonite content (64.9%) boosted the ability of this clay to swell more than Khulays clay, which has 35.22% montmorillonite, which increases the tortuous track of corrosive ions. It was discovered that commercial Indian clay has better corrosion protection (81.4%) than local Khulays clay (60.2%). A comparison with other studies using current density values proved that the current density values of our study are much better than those of the best study of Chen-Yang et al. using polyurethan. The current density value of PCN (RCIn) 7.23 × 10⁻⁸ A/cm2 is better than any other formulation.
Author Contributions
Methodology and supervision, L.A.A.J. and W.K.M.; writing—original draft, N.A.H.; reviewing, L.A.A.J. and W.K.M.; revision, H.H.A. All authors have read and agreed to the published version of the manuscript.
Funding
The authors extend their appreciation to the Deputyship for Research & Innovation, the Ministry of Education, in Saudi Arabia for funding this research work through project no. IFKSURG-2-480.
Data Availability Statement
Not applicable.
Acknowledgments
This work is based on the master’s thesis of Nashwa A. Howyan, who worked under the supervision of Layla A. Al Juhaiman (corrosion) as the major supervisor, and Waffa K. Mekhamer (polymers) as the assistant supervisor.
Conflicts of Interest
The authors declare no conflict of interest.
Abbreviations
| Symbol | Meaning | Symbol | Meaning |
| RCKh | Raw Khulays clay | CEC | Cation-exchange Capacity |
| CCIn | Commercial Indian clay | OCP | Open-circuit potential |
| NaC | Sodium clay | ESS | Steady-state potential |
| CPC | Cetylpyridinium clay | RCorr | Corrosion resistance |
| OC | Organoclay | Cdl | Electrical double-layer capacitance |
| PS/OC | Polystyrene organoclay nanocomposite | CCorr | Corrosion capacitance |
| MMT | Montmorillonite | Rpo | Pore resistance |
| PS | Polystyrene | CC | Coating capacitance |
| EIS | Electrochemical impedance spectroscopy | %PE | % Protection efficiency |
| EFM | Electrochemical frequency modulation | ICorr | Corrosion current density |
| ECorr | Corrosion potential | CR | Corrosion rate |
References
- Zarras, P.; Stenger-Smith, J. Intelligent Coatings for Corrosion Control, 1st ed.; Butterworth Heinemann: Oxford, UK, 2015; pp. 59–91. [Google Scholar]
- Zaarei, D.; Sarabi, A.A.; Sharif, F.; Kassiriha, S.M. Structure, properties and corrosion resistivity of polymeric nanocomposite coatings based on layered silicates. J. Coat. Technol. Res. 2008, 5, 241–249. [Google Scholar] [CrossRef]
- Hang, T.; Truc, T.X.; Olivier, T.A.; Vandermiers, M.G.; Guérit, C.; Pébre, N. Corrosion protection mechanisms of carbon steel by an epoxy resin containing indole-3 butyric acid modified clay. Prog. Org. Coats. 2010, 69, 410–416. [Google Scholar] [CrossRef]
- Piromruen, P.; Kongparakul, S.; Prasassarakich, P. Synthesis of polyaniline/montmorillonite nanocomposites with an enhanced anticorrosive performance. Prog. Org. Coat. 2014, 77, 691–700. [Google Scholar] [CrossRef]
- Speight, J.G. Oil and Gas Corrosion Prevention; Gulfe Professional: Waltham, NY, USA, 2014; pp. 5–147. [Google Scholar]
- Emich, F. Engineering Chemistry, 1st ed.; Scientific International PVT. Ltd.: New Delhi, India, 2014; pp. 20–66. [Google Scholar]
- El-Sherik, A.M. Trends in Oil and Gas Corrosion Research and Technologies, 1st ed.; Woodhead Publishing Series in Energy; Elsevier Inc.: Amsterdam, The Netherlands, 2017; pp. 1–65. [Google Scholar]
- Niu, L.; Guo, R.; Tang, C.; Guo, H.; Chen, J. Surface characterization and corrosion resistance of fluoferrite conversion coating on carbon steel. Surf. Coat. Technol. 2016, 300, 110–117. [Google Scholar] [CrossRef]
- Sari, M.G.; Ramezanzadeh, B.; Shahbazi, M.; Pakdel, A.S. Influence of nanoclay particles modification by polyester-amide hyperbranched polymer on the corrosion protective performance of the epoxy nanocomposite. Corros. Sci. 2016, 92, 162–172. [Google Scholar] [CrossRef]
- Zhou, C.; Lu, X.; Xin, Z.; Liu, J.; Zhang, Y. Polybenzoxazine/SiO2 nanocomposite coatings for corrosion protection of mild steel. Corros. Sci. 2014, 80, 269–275. [Google Scholar] [CrossRef]
- Kotal, M.; Bhowmick, K.A. Polymer nanocomposites from modified clays: Recent advances and challenges. Prog. Polym. Sci. 2015, 51, 127–187. [Google Scholar] [CrossRef]
- Sattler, K.D. Handbook of Nanophysics: Functional Nanomaterials, 1st ed.; CRC Press: Boca Raton, FL, USA, 2010; pp. 3–31. [Google Scholar]
- Heidarian, M.; Shishesaz, M.R.; Kassiriha, S.M.; Nematollahi, M. Characterization of structure and corrosion resistivity of polyurethane/organoclay nanocomposite coatings prepared through an ultrasonication assisted process. Prog. Org. Coats. 2010, 68, 180–188. [Google Scholar] [CrossRef]
- Shreir, L.L.; Jarman, R.A.; Burstein, G.T. Corrosion2: Corrosion Control, 3rd ed.; Newnws-Butterworths: London, UK, 1994; pp. 9:41–9:57. [Google Scholar]
- Roberge, P. Corrosion Engineering: Principles and Practice, 1st ed.; McGraw-Hill: New York, NY, USA, 2008; pp. 370–383. [Google Scholar]
- Navarchian, A.H.; Joulazadeh, M.; Karimi, F. Investigation of corrosion protection performance of epoxy coatings modified by polyaniline/clay nanocomposites on steel surfaces. Prog. Org. Coat. 2014, 77, 347–353. [Google Scholar] [CrossRef]
- Al Juhaiman, L.A.; Al-Enezi, D.A.; Mekhamer, W.K. Polystyrene/Organoclay Nanocomposites as Anticorrosive Coatings of C-Steel. Int. J. Electrochem. Sci. 2016, 11, 5618–5630. [Google Scholar] [CrossRef]
- Raju, A.; Lakshmi, V.; Prataap, R.K.V.; Resmi, V.G. Adduct modified nano-clay mineral dispersed polystyrene nanocomposites as advanced corrosion resistance coatings for aluminum alloys. Appl. Clay Sci. 2016, 126, 81–88. [Google Scholar] [CrossRef]
- Madhup, M.K.; Shah, N.K.; Parekh, N.R. Investigation and improvement of abrasion resistance, water vapor barrier and anticorrosion properties of mixed clay epoxy nanocomposite coating. Prog. Org. Coat. 2017, 102, 186–193. [Google Scholar] [CrossRef]
- Fontana, M. Corrosion Engineering, 3rd ed.; McGraw-Hill: New York, NY, USA, 1987; pp. 1–30. [Google Scholar]
- Bergaya, F.; Theng, B.; Lagaly, G. Handbook of Clay Science Part A: Fundamental, 2nd ed.; Developments in Clay Science; Elsevier Ltd.: Amsterdam, The Netherlands, 2006; pp. 100–427. [Google Scholar]
- Yeh, J.-M.; Chin, C.-P.; Chang, S. Enhanced corrosion protection coatings prepared from soluble electronically conductive polypyrrole-clay nanocomposite materials. J. Appl. Polym. Sci. 2003, 88, 3264–3272. [Google Scholar] [CrossRef]
- Motlatle, A.M.; Sinha, S.; Scriba, M. Polyaniline-clay composite-containing epoxy coating with enhanced corrosion protection and mechanical properties. Synth. Met. 2018, 245, 102–110. [Google Scholar] [CrossRef]
- Truc, T.A.; Thuy, T.T.; Oanh, V.K.; Xuan Hang, T.T.; Nguyen, A.S.; Caussé, N.; Pébère, N. 8-hydroxyquinoline-modified clay incorporated in an epoxy coating for the corrosion protection of carbon steel. Surf. Interfaces 2019, 14, 26–33. [Google Scholar] [CrossRef]
- Alandis, N.M.; Aldayel, O.A.; Mekhemer, W.K.; Hefne, J.A.; Jokhab, H.A. Thermodynamic and Kinetic Studies for the Adsorption of Fe (III) and Ni (II) Ions From Aqueous Solution Using Natural Bentonite. J. Dispers. Sci. Technol. 2001, 31, 1–9. [Google Scholar] [CrossRef]
- Al Juhaiman, L.A.; Al-Enezi, D.A.; Mekhamer, W.K. Preparation and Characterization of Polystyrene/Organoclay Nanocomposites from Raw Clay. Dig. J. Nanomater. Biostructures 2016, 11, 105–114. [Google Scholar]
- Djomgoue, P.; Njopwouo, D. FT-IR Spectroscopy Applied for Surface Clays Characterization. J. Surf. Eng. Mater. Adv. Technol. 2013, 3, 275–282. [Google Scholar] [CrossRef]
- Madejova, J.; Gates, W.P.; Petit, S. IR Spectra of Clay Minerals. In Developments in Clay Science: Infrared and Raman Spectroscopies of Clay Minerals; Gates, W.P., Kloprogge, J.T., Madejova, J.T., Bergaya, F., Eds.; Elsevier: Amsterdam, The Netherlands; Holland, MI, USA, 2017; Volume 8, pp. 107–149. [Google Scholar]
- Yuehong, M.; Jianxi, Z.; Hongping, H.; Peng, Y.; Wei, S.; Dong, L. Infrared investigation of organo-montmorillonites prepared from different surfactants. Spectrochim. Acta Part A Mol. Biomol. Spectrosc. 2010, 76, 122–129. [Google Scholar] [CrossRef]
- Madejova, J.; Bujdak, J.; Janek, M.; Komadel, P. Comparative FT-IR study of structural modifications during acid treatment of dioctahedral smectites and hectorite. Spectrochim. Acta Part A 1998, 54, 1397–1406. [Google Scholar] [CrossRef]
- Tabak, A.; Afsin, B.; Aygun, S.F.; Koksal, E. Structural Characteristics of Organo-Modified Bentoonites of Different Origin. J. Thermal Anal. Calorim. 2007, 87, 375–381. [Google Scholar] [CrossRef]
- Cervantes-Uc, J.M.; Cauich-Rodríguez, J.V.; Vázquez-Torres, H.; Garfias-Mesías, L.F.; Paul, D.R. Thermal degradation of commercially available organoclays studied by TGA–FTIR. Thermochim. Acta 2007, 457, 92–102. [Google Scholar] [CrossRef]
- Krishna, S.V.; Pugazhenthi, G. Properties and thermal degradation kinetics of polystyrene/organoclaynanocomposites synthesized by solvent blending method: Effect of processing conditions and organoclay loading. J. Appl. Polym. Sci. 2011, 120, 1322–1336. [Google Scholar] [CrossRef]
- Alshabanat, M.; Al-arrash, A.; Mekhamer, W. Polystyrene/Montmorillonite Nanocomposites: Study of the Morphology and Effects of Sonication Time on Thermal Stability. J. Nanomater. 2013, 12, 2–12. [Google Scholar] [CrossRef]
- Tyagi, B.; Chudasama, C.D.; Jasra, R.V. Determination of structural modification in acid activated montmorillonite clay by FT-IR spectroscopy. Spectrochim. Acta Part A 2006, 64, 273–278. [Google Scholar] [CrossRef]
- Li, X.; Kang, T.; Cho, W.; Lee, J.; Ha, C. Preparation and Characterization of Poly (butyleneterephthalate)/Organoclay Nanocomposites. Macromol. Mater. Eng. 2001, 22, 1306–1312. [Google Scholar] [CrossRef]
- Chen, B.; Zhu, L.; Zhu, J.; Xing, B. Configurations of the bentonite-sorbed myristylpyridinium cation and their influences on the uptake of organic compounds. Environ. Sci. Technol. 2005, 39, 6093–6100. [Google Scholar] [CrossRef]
- Xi, Y.; Ding, Z.; Frost, R.L. Structure of organo-clays an X-ray diffraction and thermogravimetric analysis study. J. Colloid Interf. Sci. 2004, 277, 116–120. [Google Scholar] [CrossRef]
- Giannakas, A.; Spanos, C.G.; Kourkoumelis, N.; Vaimakis, T.; Ladavos, A. Preparation, characterization and water barrier properties of PS/organo-montmorillonite nanocomposites. Eur. Polym. J. 2008, 44, 3915–3921. [Google Scholar] [CrossRef]
- Obot, I.B.; Onyeachu, I.B. Electrochemical frequency modulation (EFM) technique: Theory and recent practical applications in corrosion research. J. Mol. Liq. 2018, 249, 83–96. [Google Scholar] [CrossRef]
- Abdel-rehim, S.S.; Khaled, K.F.; Abd-elshafi, N.S. Electrochemical frequency modulation as a new technique for monitoring corrosion inhibition of iron in acid media by new thiourea derivative. Electrochim. Acta 2006, 51, 3269–3277. [Google Scholar] [CrossRef]
- Chen-Yang, Y.W.; Yang, H.C.; Li, G.J.; Li, Y.K. Thermal and anticorrosive properties of polyurethane/clay nanocomposites. J. Polym. Res. 2005, 11, 275–283. [Google Scholar] [CrossRef]
- Olad, A.; Rashidzadeh, A. Preparation and anticorrosive properties of PANI/Na-MMT and PANI/O-MMT nanocomposites. Prog. Org. Coat. 2008, 62, 293–298. [Google Scholar] [CrossRef]
- Olad, A.; Rashidzadeh, A.; Amini, M. Preparation of polypyrrole nanocomposites with organophilic and hydrophilic montmorillonite and investigation of their corrosion protection on iron. Adv. Polym. Technol. 2013, 32, 21337. [Google Scholar] [CrossRef]
- Yeh, J.; Liou, S.; Lin, C.; Chang, Y.; Yu, Y.; Cheng, C. Effective Enhancement of Anticorrosive Properties of Polystyrene by Polystyrene–Clay Nanocomposite Materials. J. Appl. Polym. Sci. 2003, 92, 1970–1976. [Google Scholar] [CrossRef]
- Nematollahi, M.; Heidarian, M.; Peikari, M.; Kassiriha, S.M.; Arianpouya, N.; Esmaeilpour, M. Comparison between the effect of nanoglass flake and montmorillonite organoclay on corrosion performance of epoxy coating. Corros. Sci. 2010, 52, 1809–1817. [Google Scholar] [CrossRef]
- Huang, H.Y.; Huang, T.C.; Yeh, T.C.; Tsai, C.Y.; Lai, C.L.; Tsai, M.H.; Chou, Y.C. Advanced anticorrosive materials prepared from amine-capped aniline trimer-based electroactive polyimide-clay nanocomposite materials with synergistic effects of redox catalytic capability and gas barrier properties. Polymer 2011, 52, 2391–2400. [Google Scholar] [CrossRef]
- Chang, K.C.; Chen, S.T.; Lin, H.F.; Lin, C.Y.; Huang, H.H.; Yeh, J.M.; Yu, Y.H. Effect of clay on the corrosion protection efficiency of PMMA/Na+-MMT clay nanocomposite coatings evaluated by electrochemical measurements. Eur. Polym. J. 2008, 44, 13–23. [Google Scholar] [CrossRef]


Disclaimer/Publisher’s Note: The statements, opinions and data contained in all publications are solely those of the individual author(s) and contributor(s) and not of MDPI and/or the editor(s). MDPI and/or the editor(s) disclaim responsibility for any injury to people or property resulting from any ideas, methods, instructions or products referred to in the content. |
© 2023 by the authors. Licensee MDPI, Basel, Switzerland. This article is an open access article distributed under the terms and conditions of the Creative Commons Attribution (CC BY) license (https://creativecommons.org/licenses/by/4.0/).