1. Introduction
The coatings or films of copper obtained by various production methods occupy an attention of both scientific and technological communities. The cause of this attention lies in specific features of Cu, which include high thermal and electrical conductivity, malleability, corrosion resistance, and good adhesion with a substrate [
1]. Thanking to these characteristics, copper coatings are used in various industries such as aerospace, automotive, electronics and telecommunications. All ways of copper coating production on conductive and non-conductive substrates can be divided in two groups: non-electrochemical and electrochemical methods. The main non-electrochemical methods are electroless plating, chemical vapour deposition (CVD), physical vapour deposition (PVD), thermal spray and sputtering techniques [
2,
3]. Plasma spray is a special kind of thermal spray technique that is used for a formation of various metallic and non-metallic materials, such as nitrides, carbides, and metal oxides [
4]. This technique is not suitable for temperature-sensitive materials such as polymers and polymer matrix composites. The cold spray [
5,
6] and electroless plating [
2,
3] techniques are suitable for a metallization of temperature-sensitive materials.
Electrochemical deposition processes, or shortly, electrodeposition processes found wide application in obtaining of metal coatings of various morphological, structural and mechanical characteristics on conductive substrates. They belong to environmentally friendly, low cost, time saving and facile methods for a production of metal coatings of desired quality at both micro and nano scale [
7]. The desired characteristics of coatings are achieved by selection of regimes and parameters of the electrodeposition. For an application in industry, current regimes, including the constant galvanostatic (DC), the pulsating current (PC) and the reversing current (RC) regimes are used. Although the potentiostatic regimes, involving the constant potentiostatic and the pulsating overpotential (PO) regime as the type of periodically changing regime, are important in academic investigations in examination of mechanism of metal electrodeposition, they give important information necessary for a transfer of knowledge towards application at the industrial scale. The quality of coatings depends on the following parameters of the electrodeposition: the kind of electrolyte, the kind of cathode, temperature of electrolyte, way of electrolyte stirring, electrodeposition time (coating thickness), current density of the electrodeposition, etc. [
8].
The main convenience of electrodeposition processes is a good adhesion of coatings with the electrode surface and an easy control of coating thickness by a choice of parameters and regimes of the electrodeposition; however, an impossibility of deposition on non-conductive substrates is the main shortfall of this technique [
8]. On the other hand, non-electrochemical methods are suitable for a formation of coatings on non-conductive substrates, but these methods generally give coatings of worse adhesion than the electrochemical methods and show certain limitations related with the coating thickness [
5].
The obtaining of compact and uniform Cu coatings of good mechanical characteristics is a huge challenge. The mechanical features of the materials are those associated with an ability of the material to resist mechanical forces and loads. The thirteen main mechanical properties of metals are as follows: strength (yield, fracture, ultimate), elasticity, plasticity, ductility (elongation, area reduction), malleability, brittleness, stiffness, hardness (macro, micro and nano), creep, fatigue, resilience, toughness, and weldability [
9]. Among all these mechanical characteristics, the coating hardness is one of the most important for an application of Cu coatings in above mentioned industries.
In this review paper, comprehensive analysis of influence of various parameters of the electrodeposition on hardness of electrodeposited copper coatings has been presented. The constant galvanostatic (DC) and the pulsating current (PC) regimes are used to produce Cu coatings. The influence of the following electrodeposition parameters will be presented: the kind of electrolyte, the kind of cathode, the thickness of coating, and electrolyte stirring. The following parameters of the PC regime were examined: the average current density (frequency) and the current density amplitude. All electrodepositions were performed on hard Si(111) and brass substrates. Hardness of the Cu coatings was determined applying the Chicot–Lesage (C–L) composite hardness model. This analysis will be presented through the following Sections:
- ○
Influence of parameters of the electrodeposition on morphology and structure of Cu coatings produced by the DC regime—
Section 2,
- ○
Influence of parameters of the electrodeposition on hardness of Cu coatings produced by the DC regime—
Section 3,
- ○
Influence of parameters of the PC regime on morphology and structure of electrolytically produced Cu coatings—
Section 4,
- ○
Influence of parameters of the PC regime on hardness of electrolytically produced Cu coatings—
Section 5, and
- ○
Correlation among morphology, structure and hardness of electrolytically produced copper coatings—
Section 6.
In addition, the short literature survey of Cu coatings obtained with the reinforcements (Copper matrix composites) is presented in
Section 7.
3. Influence of Parameters of the Electrodeposition on Hardness of Cu Coatings Produced by the DC Regime
Hardness is the most important mechanical characteristic of metal coatings, and microindentation technique represents one of often used ways to determine it [
13]. The measured hardness usually consists of a contribution both substrate (cathode) and coating, and for that reason, it is called composite hardness [
12,
13,
23,
24]. The largest challenge in a determination of an absolute (a true, an intrinsic) coating hardness is to eliminate a contribution of substrate to measured composite hardness. It can be achieved on two ways: (a) by use of low indentation loads, and (b) applying the composite hardness models. The main lack of the first way is a huge error of measurement of diagonal size for thin coatings caused by use of low indentation loads, and for that reason, this way is only suitable for thick coatings [
12]. On the other hand, composite hardness models are mathematic models including large number of approximations, and their application requires a knowledge of many phenomena, such as applied load, duration of the applied load at an indentation (dwell time) and indentation depth [
25], elastic properties of the coatings [
26], indentation size effect (ISE) [
27,
28,
29,
30], interfacial adhesion [
31,
32], etc.
A lot of mathematical models are developed which can be used for a determination of the absolute hardness of metal coatings. Some of them are Chicot–Lesage (C–L) [
23,
24,
33,
34], Korsunsky (K) [
35,
36,
37], Chen–Gao (C–G) [
38,
39,
40,
41], Burnett-Rickerby (B–R) [
31,
32], Jonson–Hogmark (J–H) [
42], Puchi–Cabrera (P–C) [
43,
44] models, etc. There is no an universal model applicable for all substrate/coating systems, and some of them are adapted to “soft film (coating) on hard substrate” system, such as C–L and C–G models, while the other models, such as K, J–H and P–C models, are adapted to “hard film (coating) on soft substrate” system.
In this Section, Vickers microindentation technique was used to determine an absolute hardness of the Cu coatings electrodeposited on Si(111) and brass substrates under various electrodeposition conditions. The indentation loads between 0.049 and 2.942 N, and the dwell time of 25 s were used [
12,
13,
45]. The Cu coatings electrodeposited on Si(111) and brass substrates belong to “soft film (coating) on hard substrate” system, and the Chicot–Lesage (C–L) composite hardness model was applied for a determination of absolute hardness of the coatings. This model was selected because the real values of coating hardness can be determined by a simple measurement of diagonal size of Vickers imprint in a surface area of the coating. This model does not require use complex software packages and is based on solution of a quadratic equation for every applied load, i.e., point by point, whereby the positive value of a quadratic equation solution is taken as a value for the coating hardness. The basis of the C–L model is given in Ref. [
13].
The composite hardness,
Hc usually includes a contribution of both substrate (cathode) and coating, and it is presented by Equation (1) [
12,
13,
45]:
In Equation (1), P is applied load, in N, and d, in m is size of diagonal made in a coating during an indentation process.
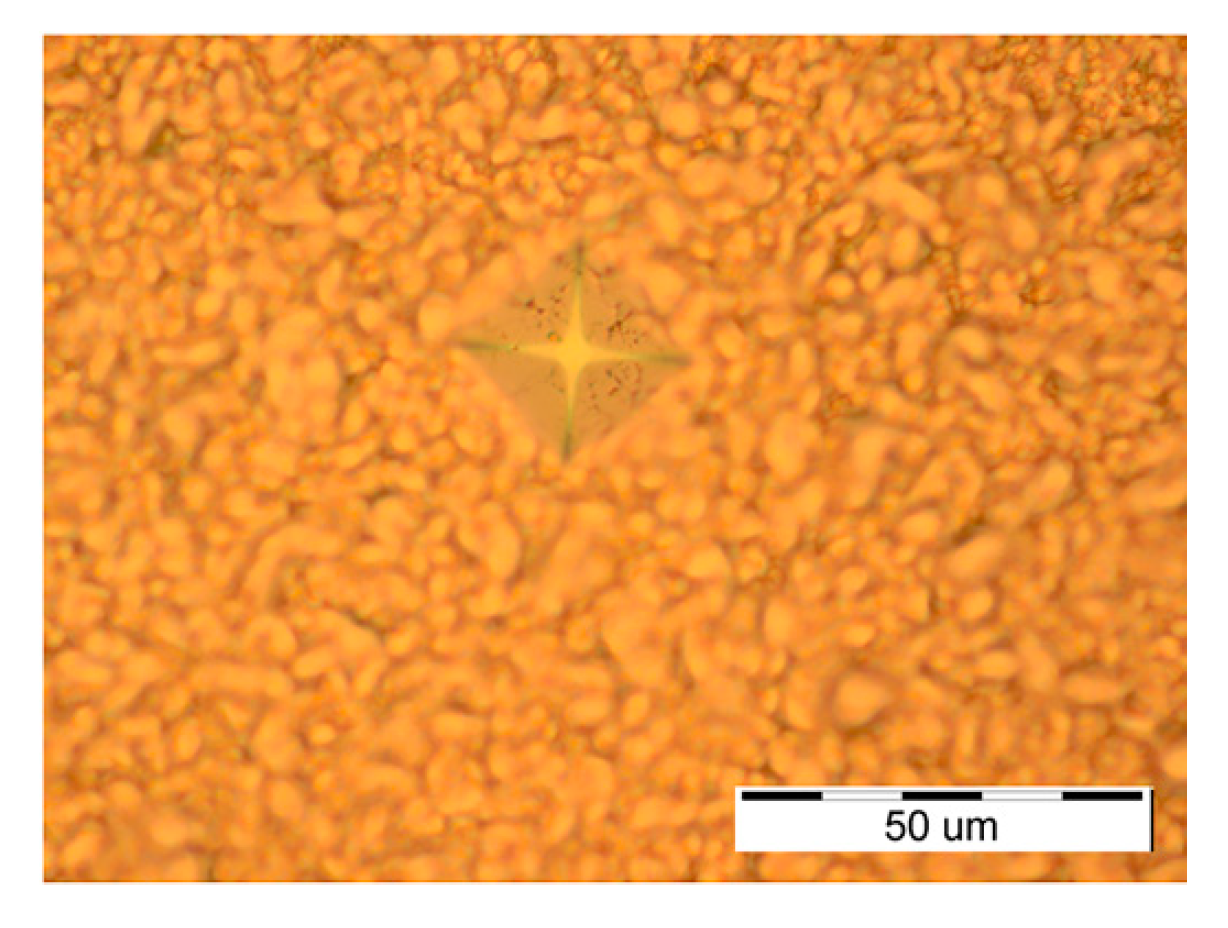
The typical imprint in the Cu coating obtained by Vickers microindentation is shown in
Figure 10.
Vickers microindentation belongs to the static method for a determination of hardness of coatings (films). Aside from this static method, there are also the dynamic methods which involve both micro- and nanoindentation [
47,
48]. Unlike the static method where a determination of coating hardness is based on a measurement of diagonal size of imprint in a coating made by applied load, the dynamic methods are based on continuous processes where the applied load and the displacement of indenter are simultaneously recorded. The nanoindentation method is especially suitable to determine a hardness of thin coatings owing to an avoidance of an influence of substrate with the small applied loads [
49].
In order to determine an absolute hardness of any coating, knowledge of hardness of cathode is of crucial importance. The PSR (Proportional Specimen Resistance) model [
50] is often used for that purpose, and the values of substrate hardness,
Hs were 7.42 GPa for Si(111) [
13] and 1.41 GPa for the brass [
45].
The following Sub-sections give a survey of the effects of types of both electrolyte and cathode, the thickness of the coating and the electrolyte stirring on hardness of the Cu coatings.
4. Influence of Parameters of the PC Regime on Morphology and Structure of Electrolytically Produced Cu Coatings
Electrodeposition by pulse reverse current (PRC) regimes offers many benefits in obtaining metal deposits of desired characteristics. The deposits obtained by these regimes usually possess both lower porosity and more compact structure than the deposits produced by the constant regimes of electrodeposition. The development of electronic industry lowers a price of pulse rectifiers, that is still incomparable higher than the DC units [
52], and this lowering of price enables larger application of pulse reverse regimes in commercial purposes. The only pulsating (PC) and reversing current (RC) regimes have potential commercial application from all PRC regimes of the electrodeposition.
The PC regime is defined by the average current density (
jav), the current density amplitude (
jA), a deposition pulse (
tc) and a period of pause (
tp) on way given by Equation (3) [
8]:
Since the pause-to-pulse ratio,
p is defined by Equation (4) [
8]:
The average current density (
jav) is also defined by Equation (5):
The frequency, ν is defined by Equation (6):
The pulsating current regime gives optimal results in the millisecond range, in the (10–100) Hz frequency range [
8]. In this range of frequency, the surface concentration of depositing ions is constant and corresponds to a concentration in the constant DC regime at the current density equal to the average current density in regime of the pulsating current [
8,
53]. It means that electrochemical deposition in the PC regime in this frequency range takes place at the average current density.
The regime of reversing current (RC) includes anodic component of the current density, and instead of pause duration, the anodic time is included [
8].
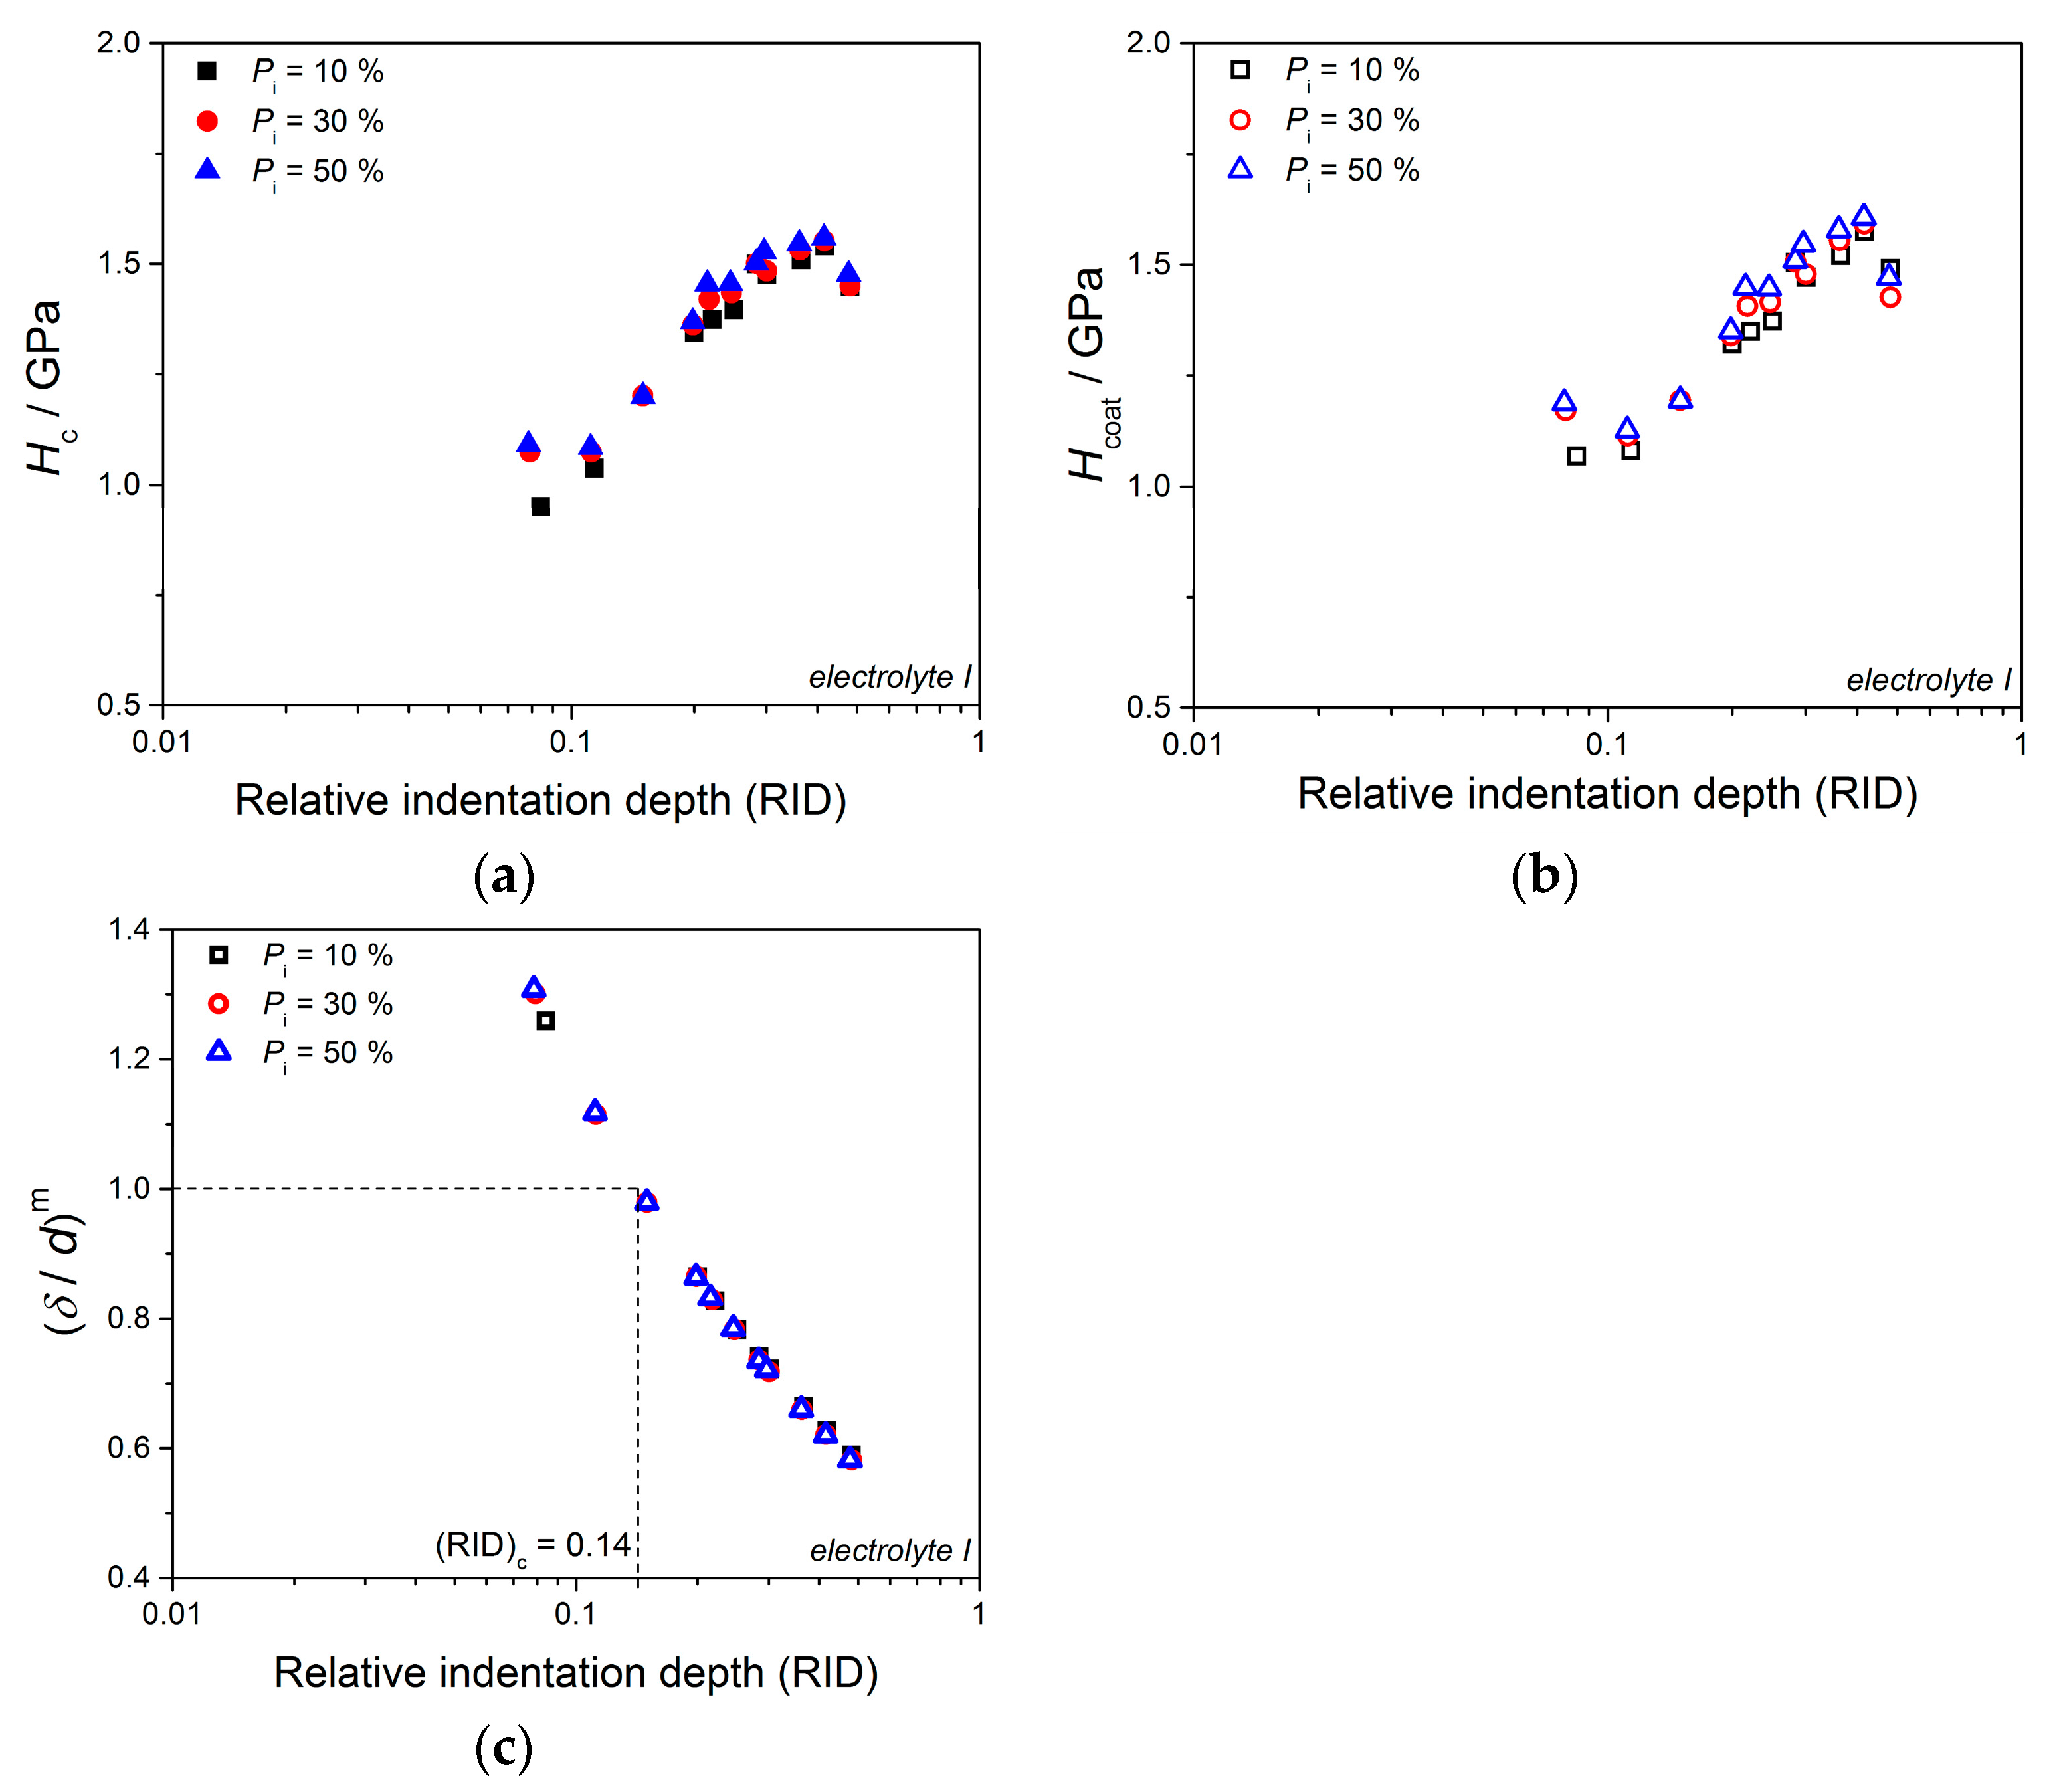
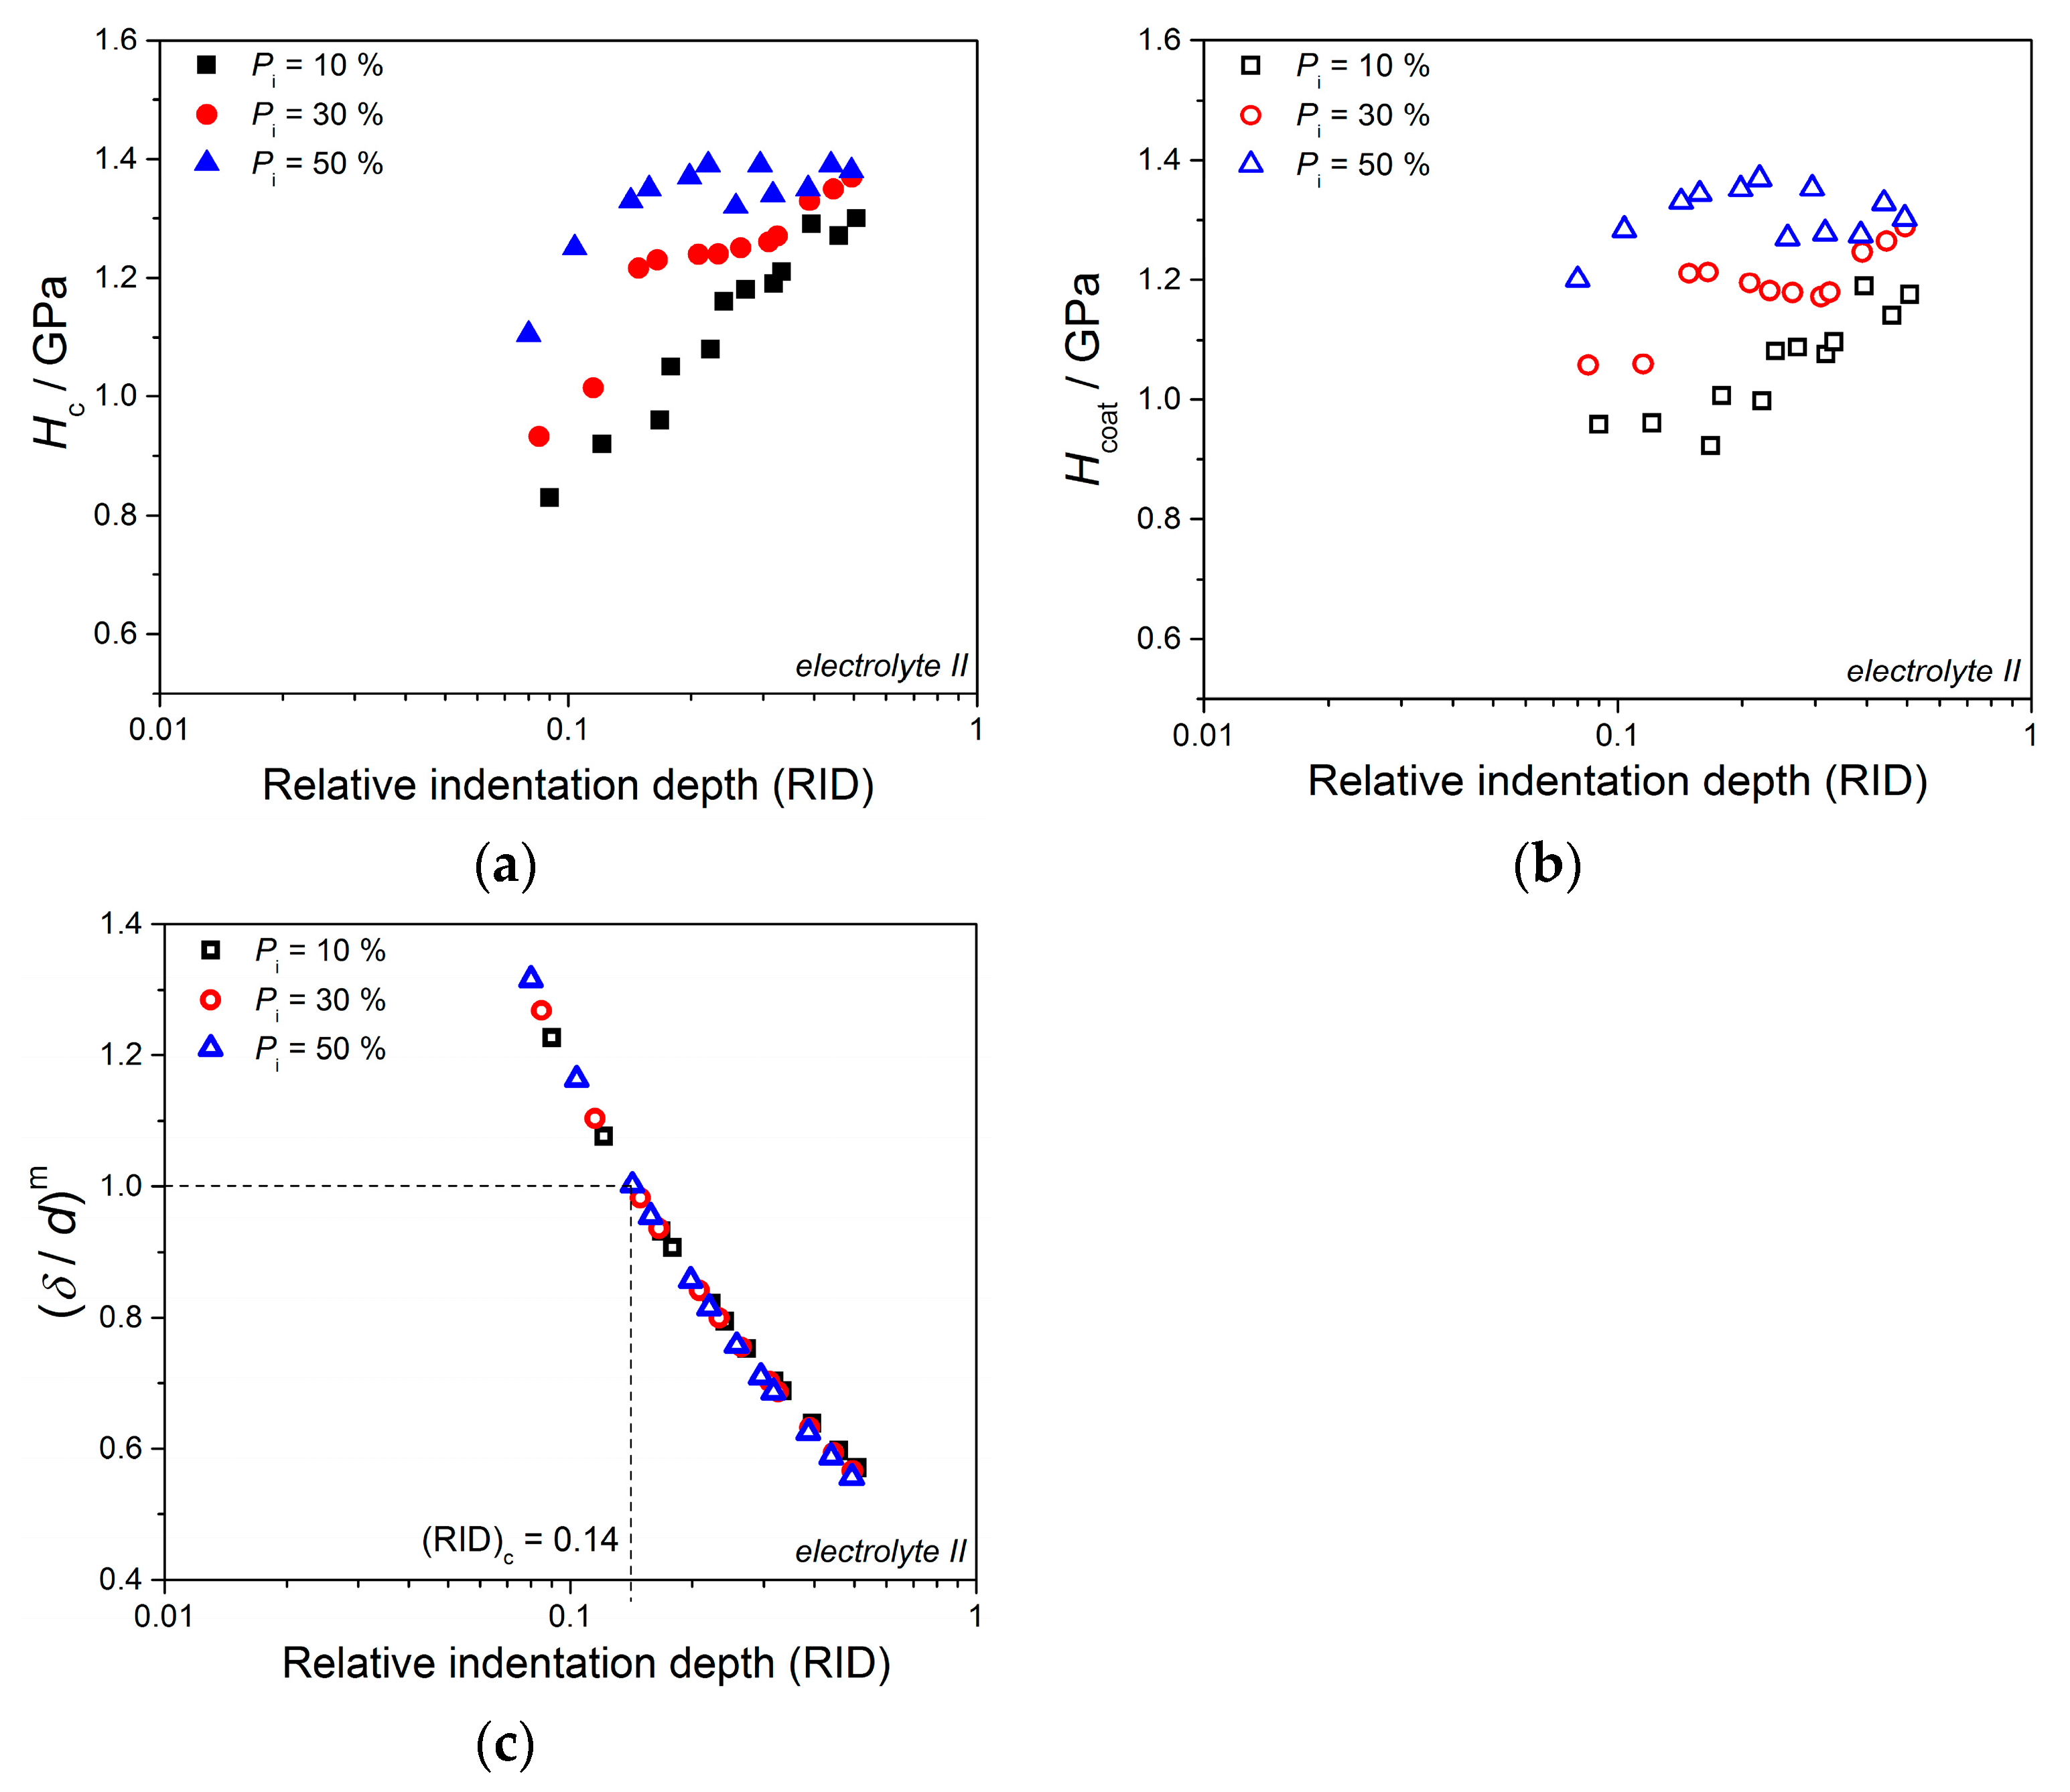
In this review paper, influence of the following parameters of electrodeposition and the pulsating current regime on morphology, structure and hardness of the Cu coatings is analyzed [
13,
45,
46]:
(1) the average current density, jav or frequency, ν—these parameters are analyzed keeping constant the current density amplitude and the deposition pulse, while pause duration is varied,
(2) the current density amplitude, jA—these parameters are analyzed keeping constant both deposition pulse and pause duration,
(3) coating thickness, δ—coating thickness is varied keeping the parameters of pulsating current regime constant (the current density amplitude, the deposition pulse, and the pause duration), and
(4) type of cathode.
The parameters of the pulsating current regime analyzed in this review paper are summarized in
Table 3.
6. Correlation among Morphology, Structure and Hardness of Electrolytically Produced Copper Coatings
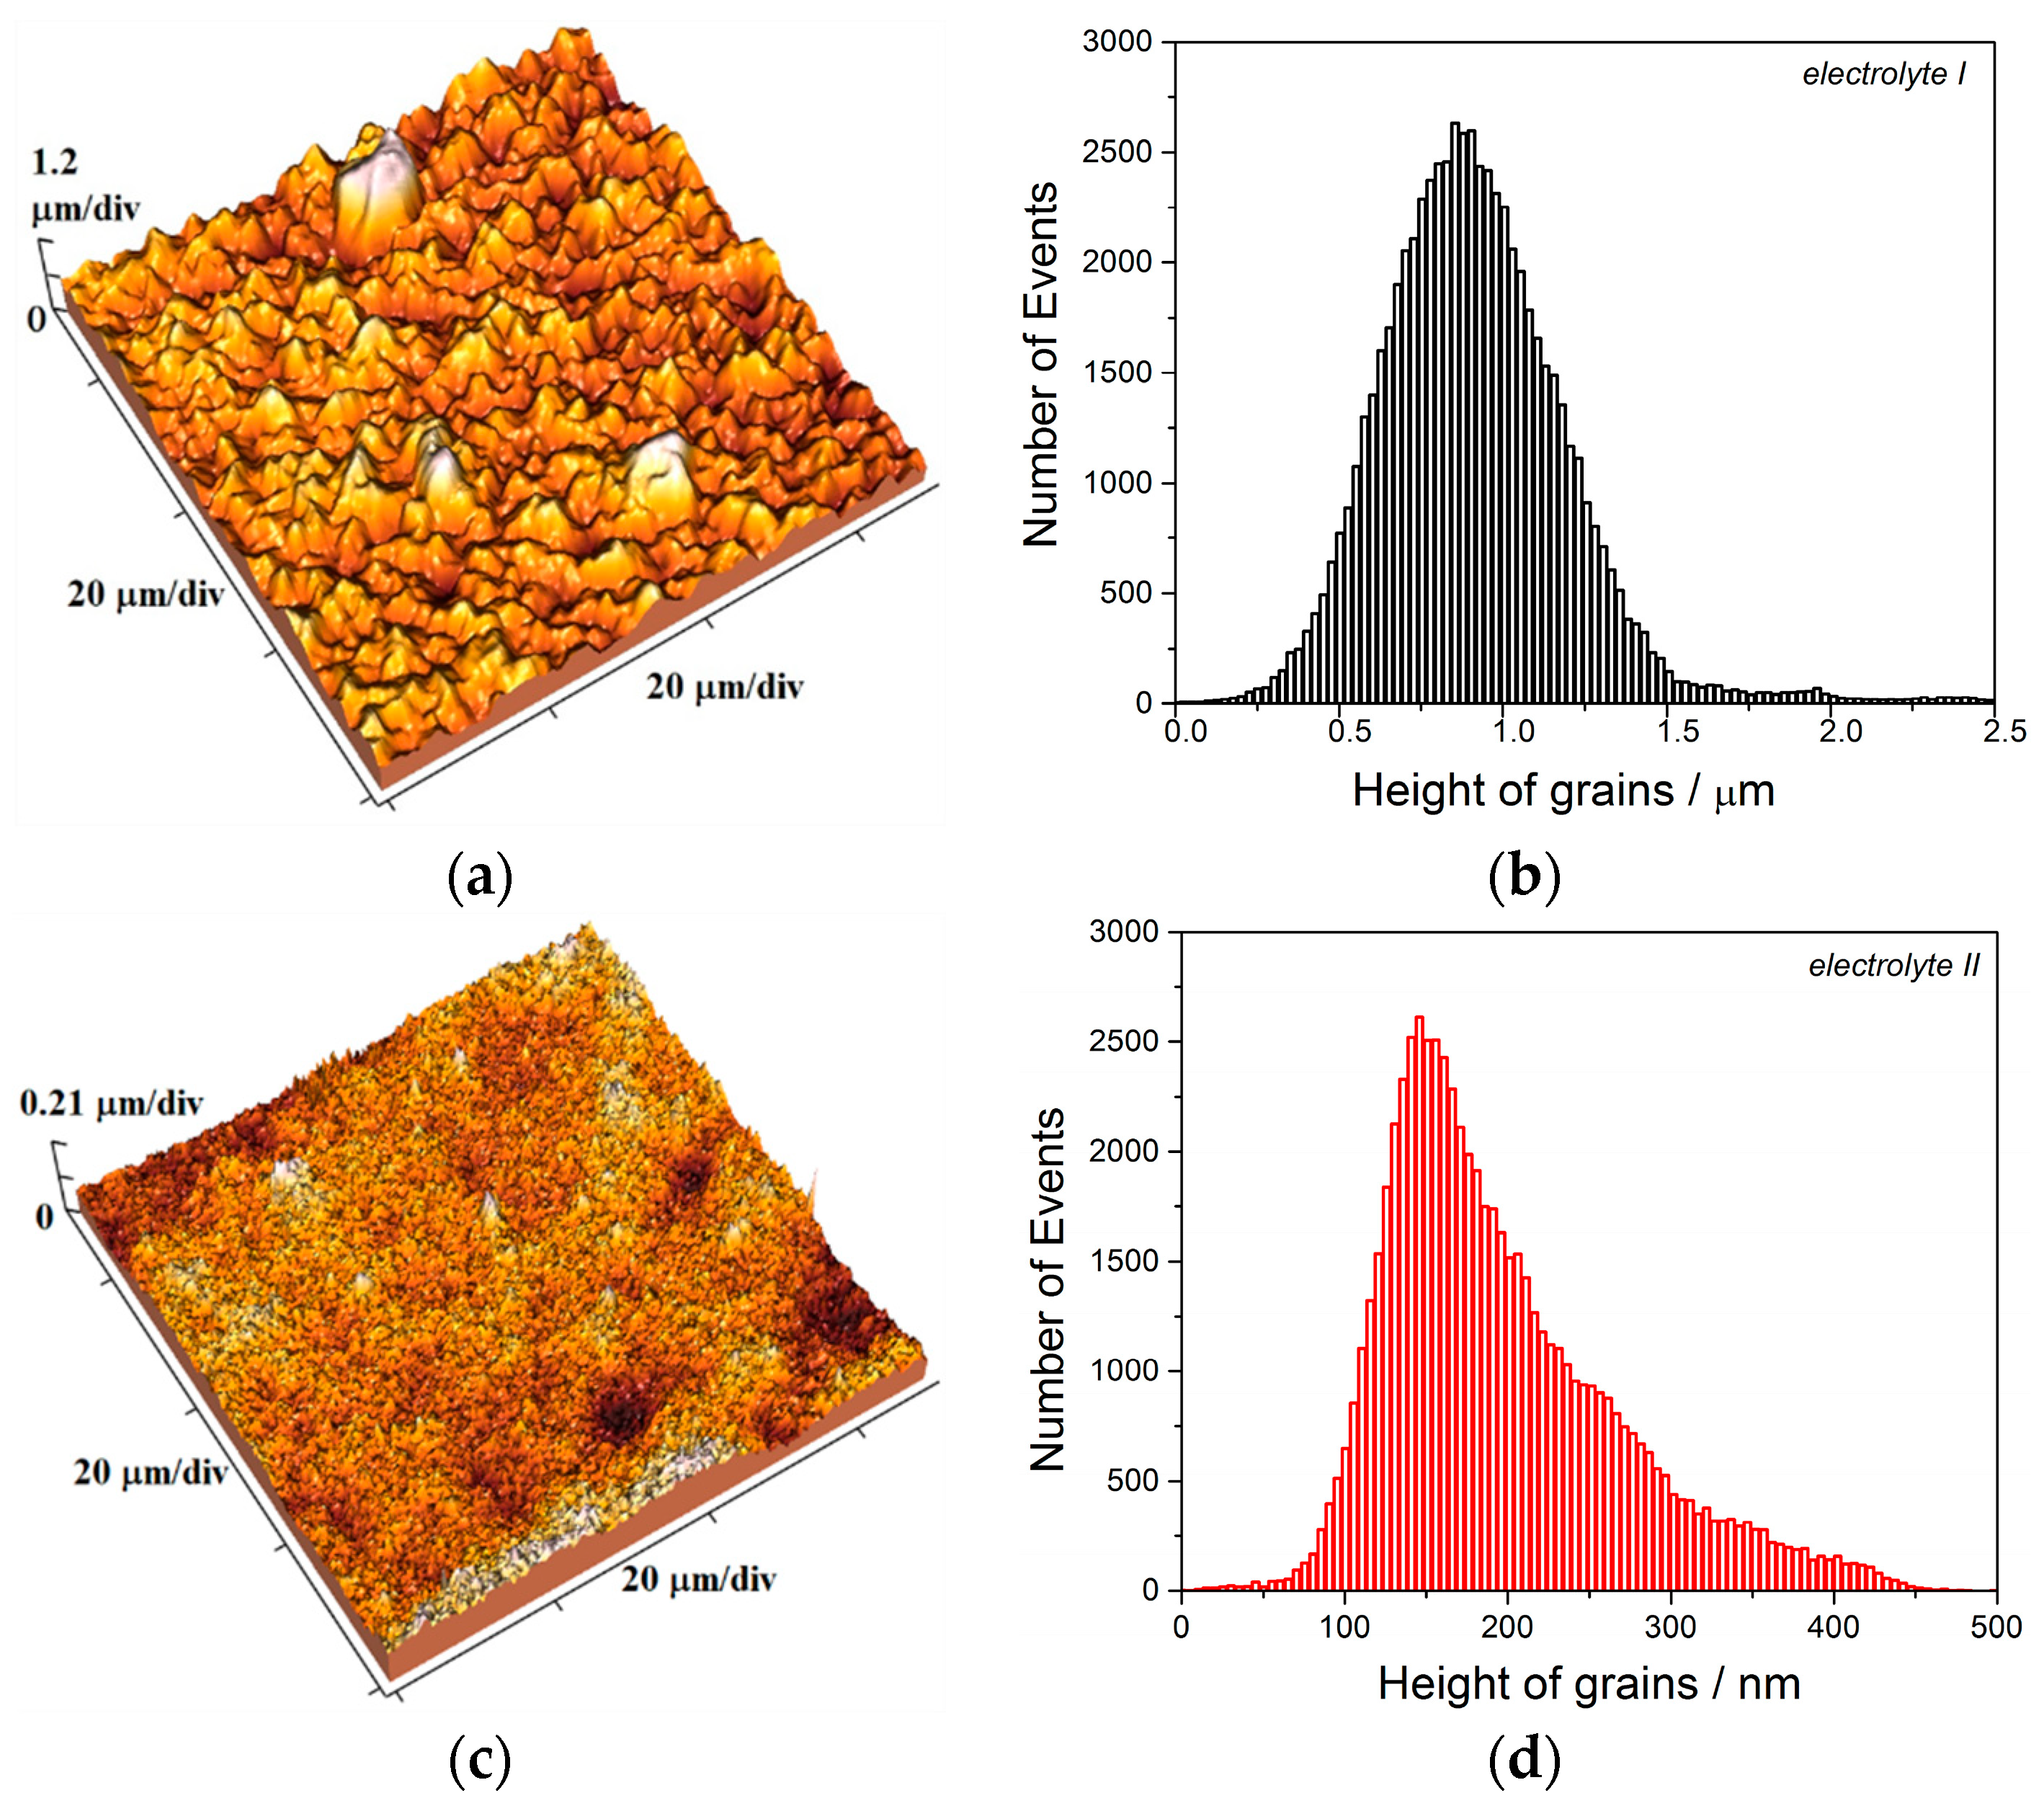
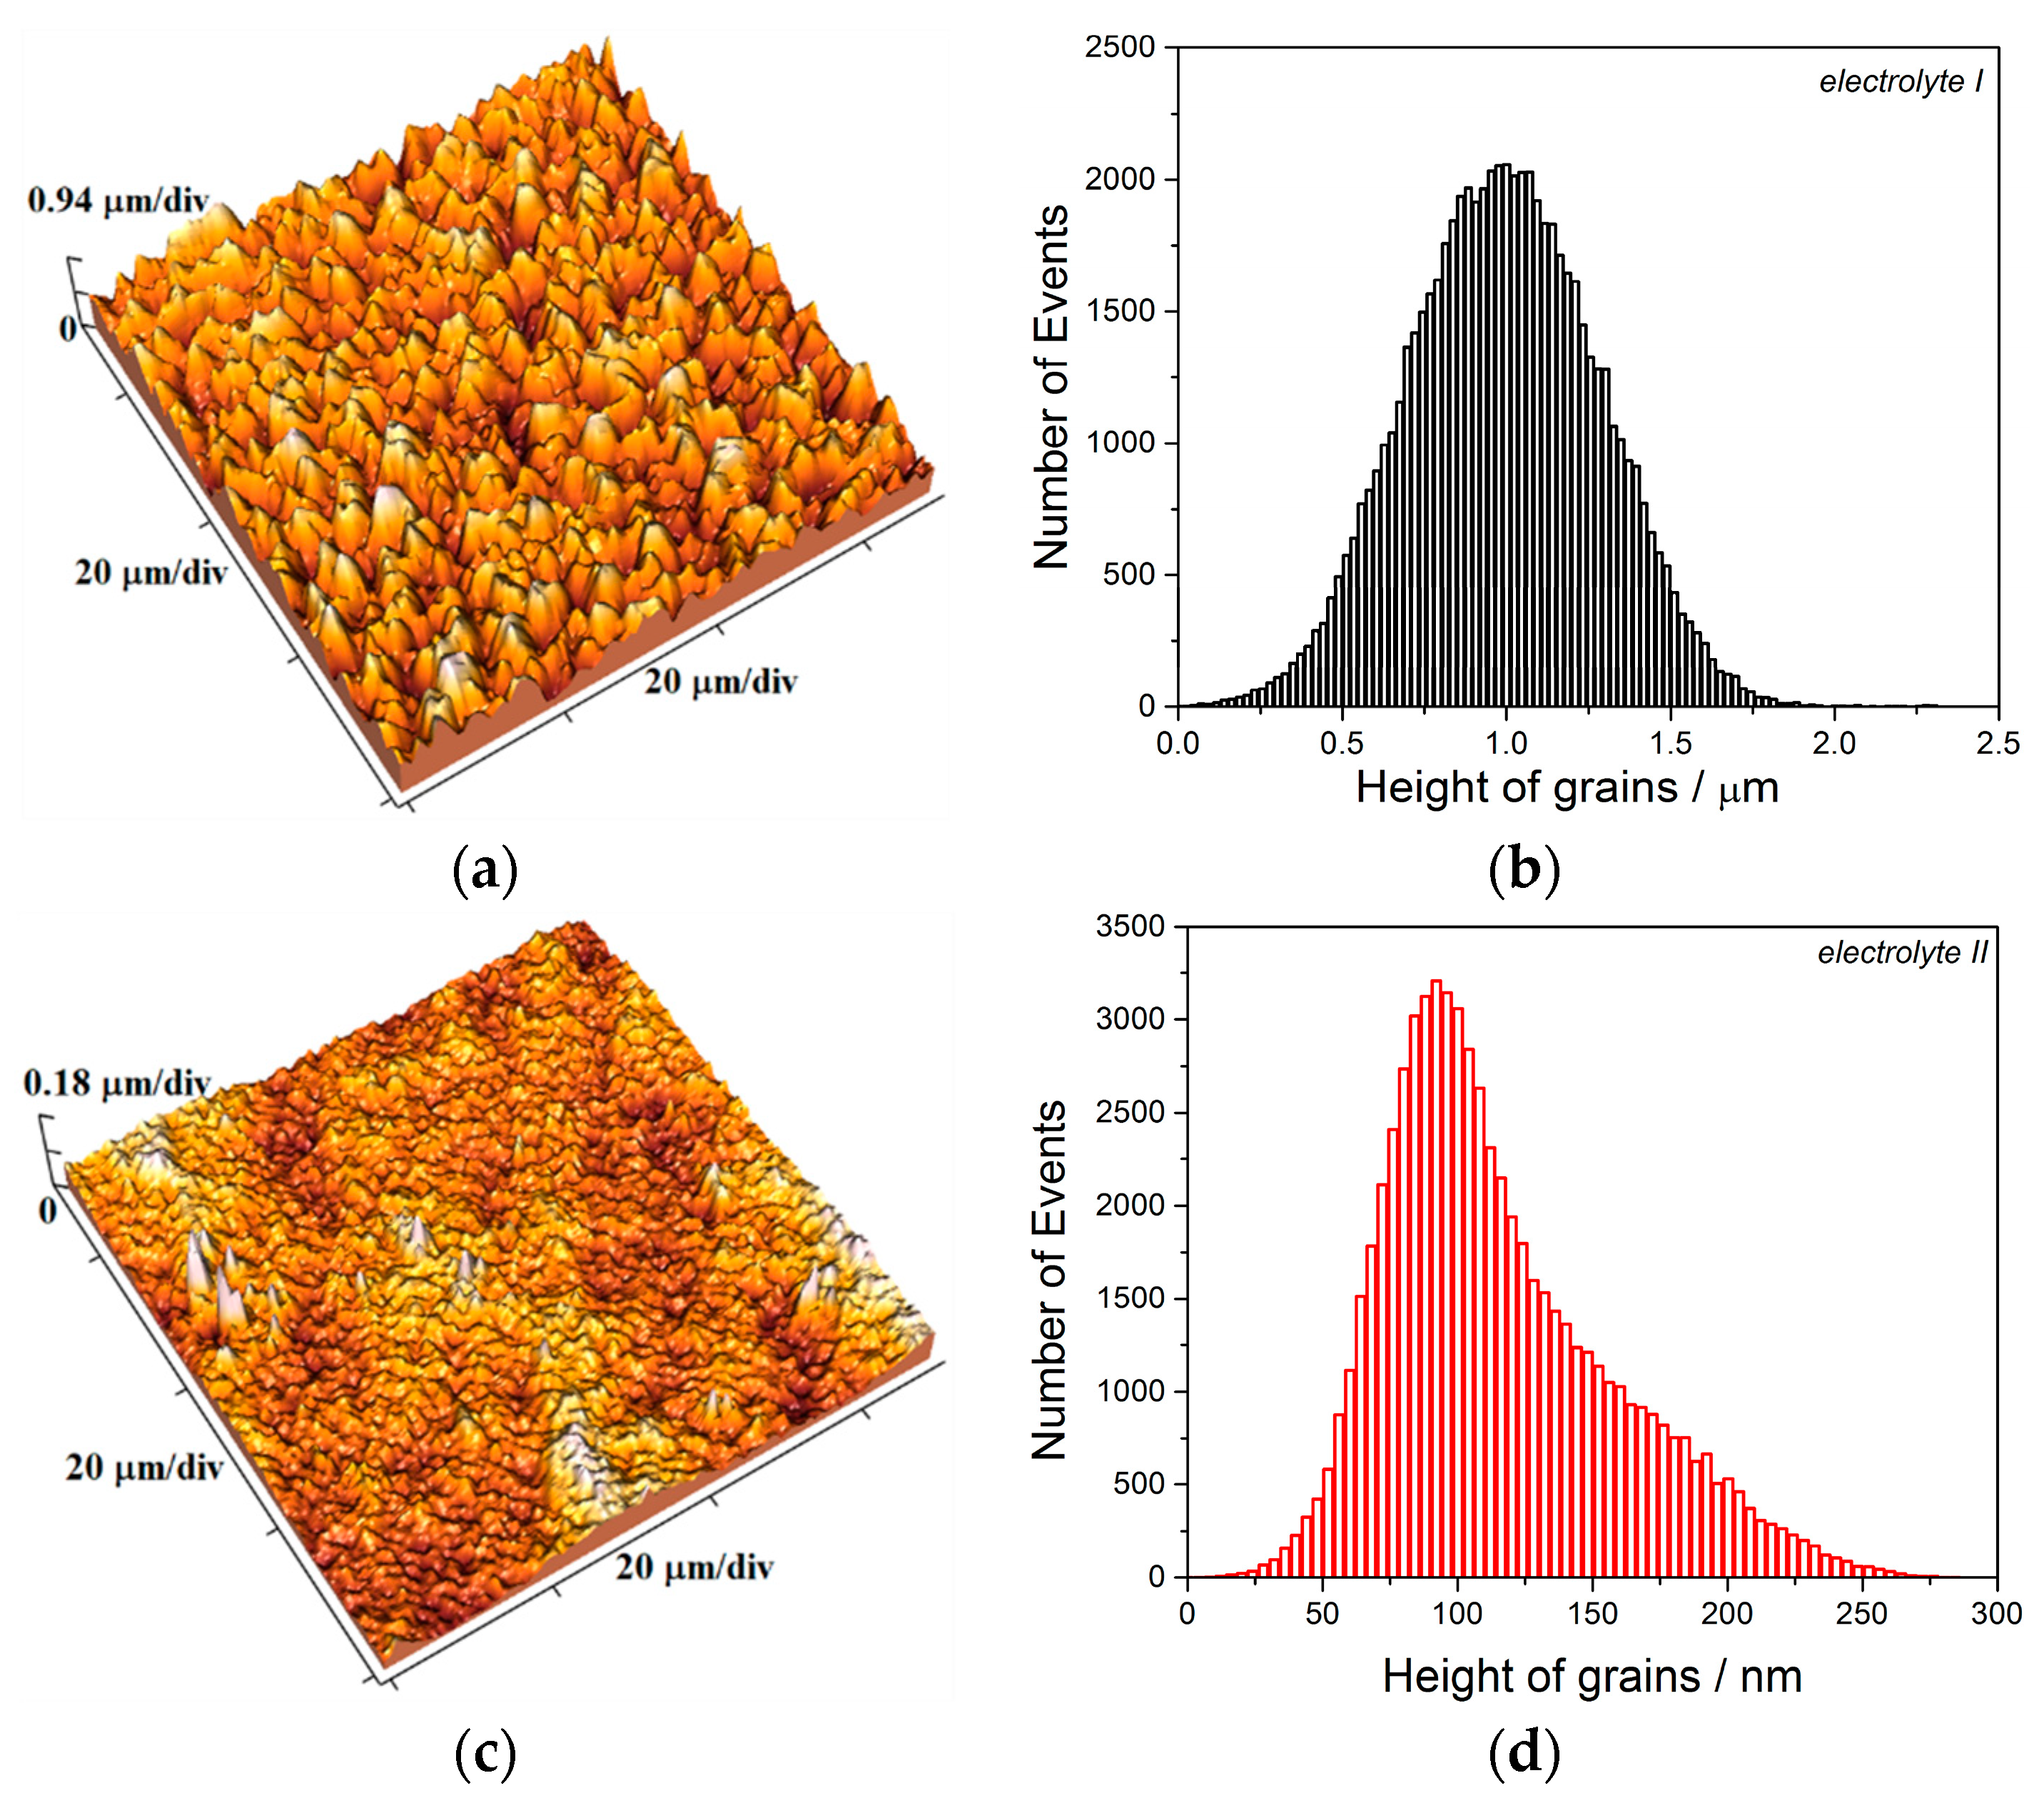
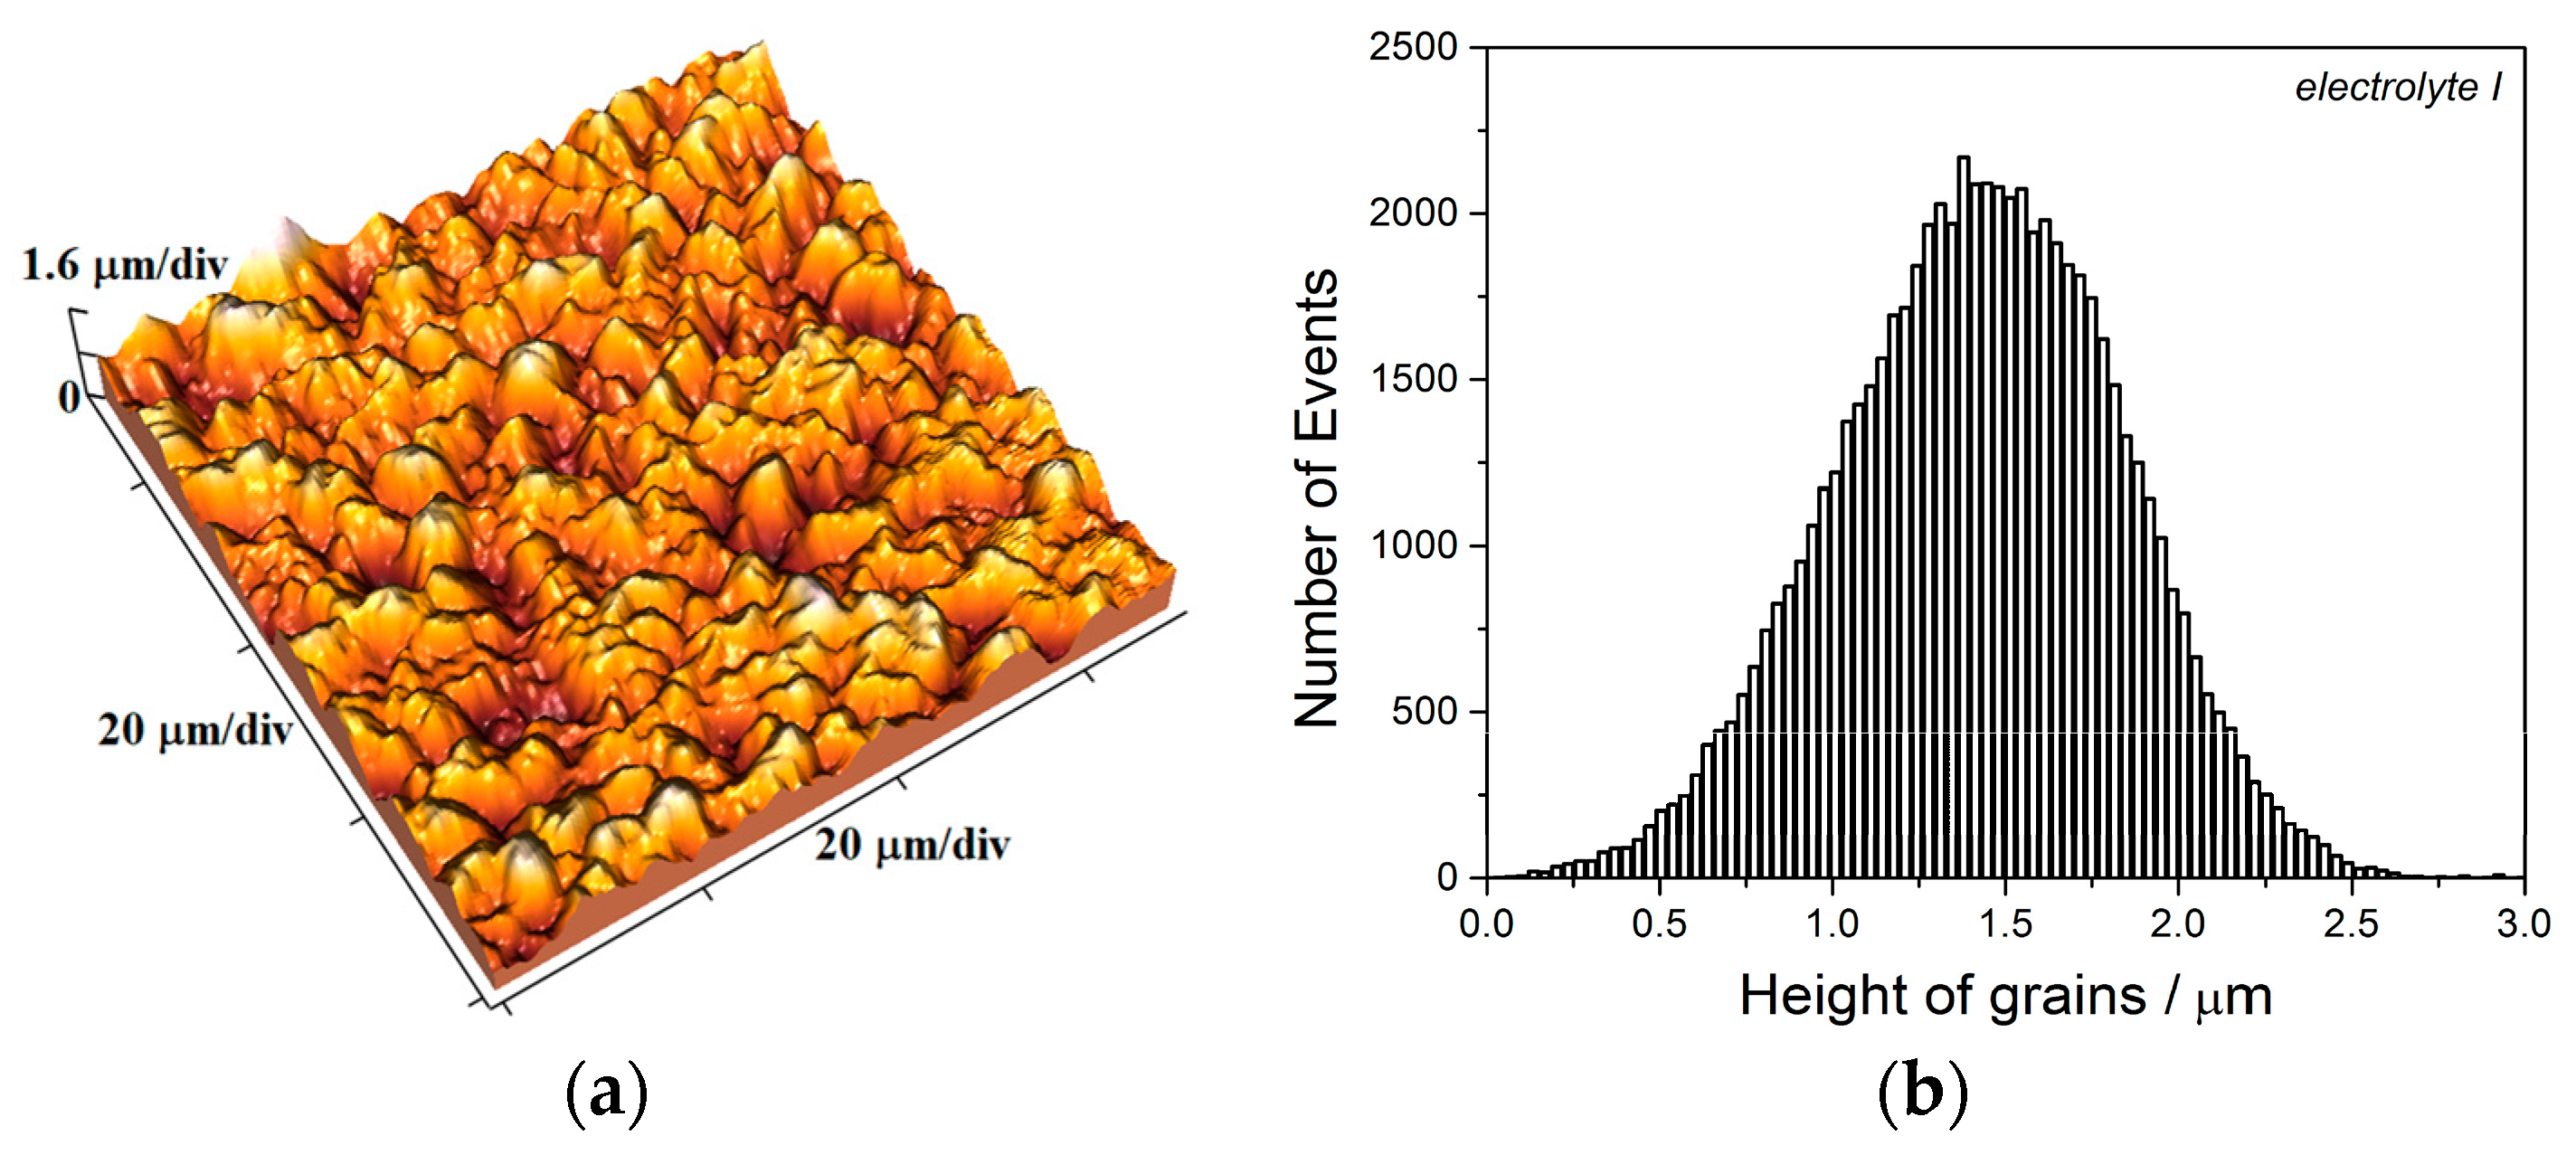
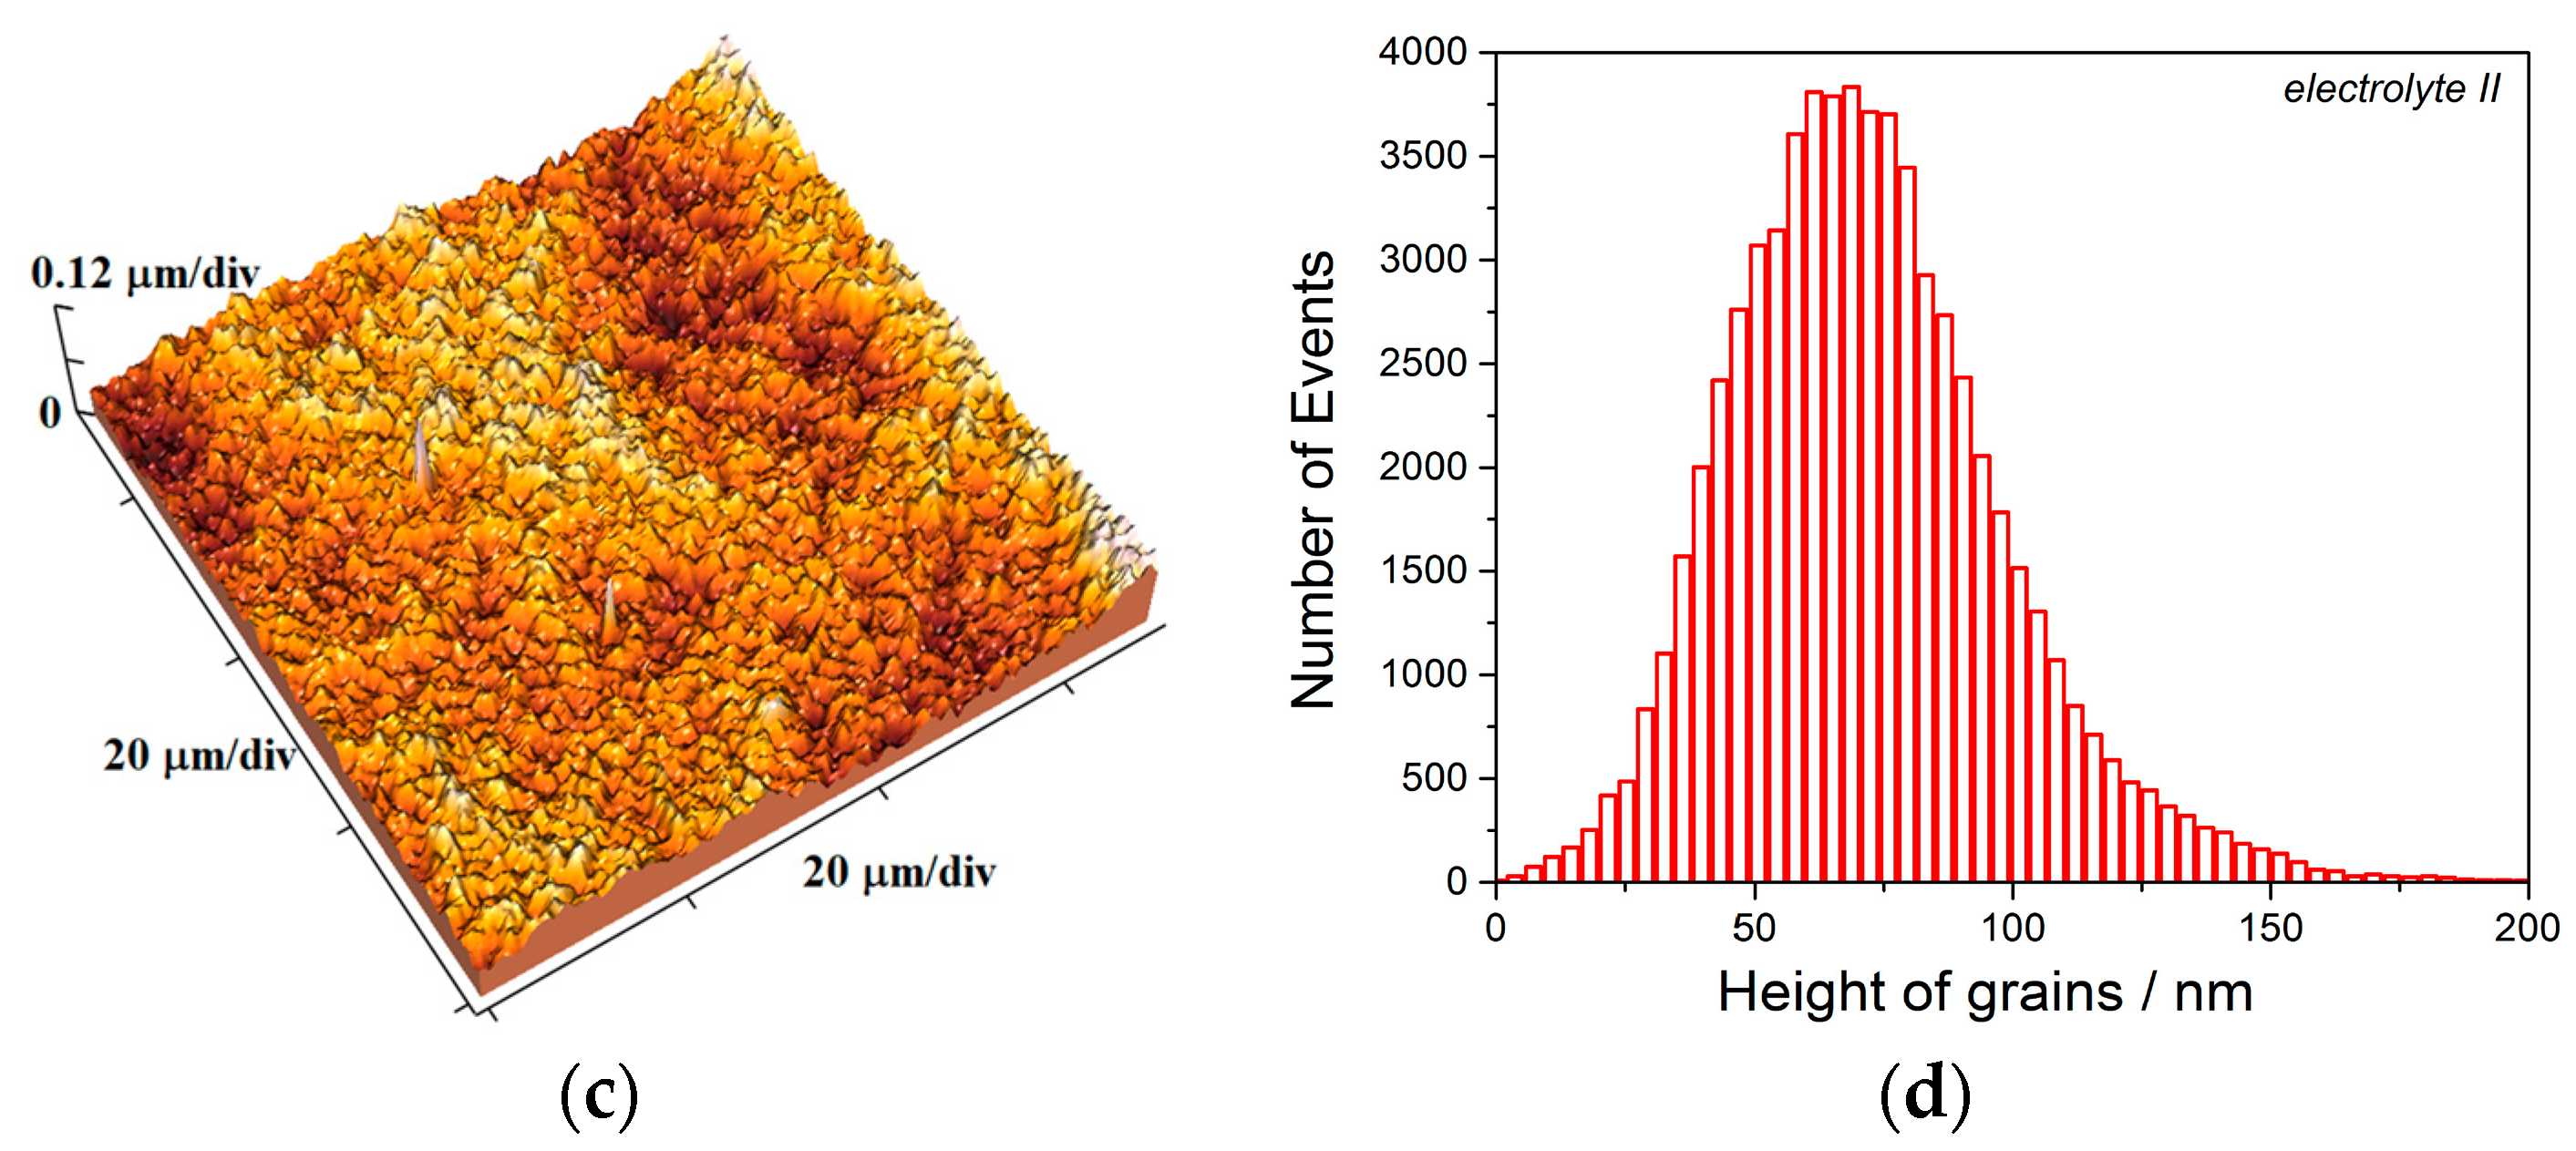
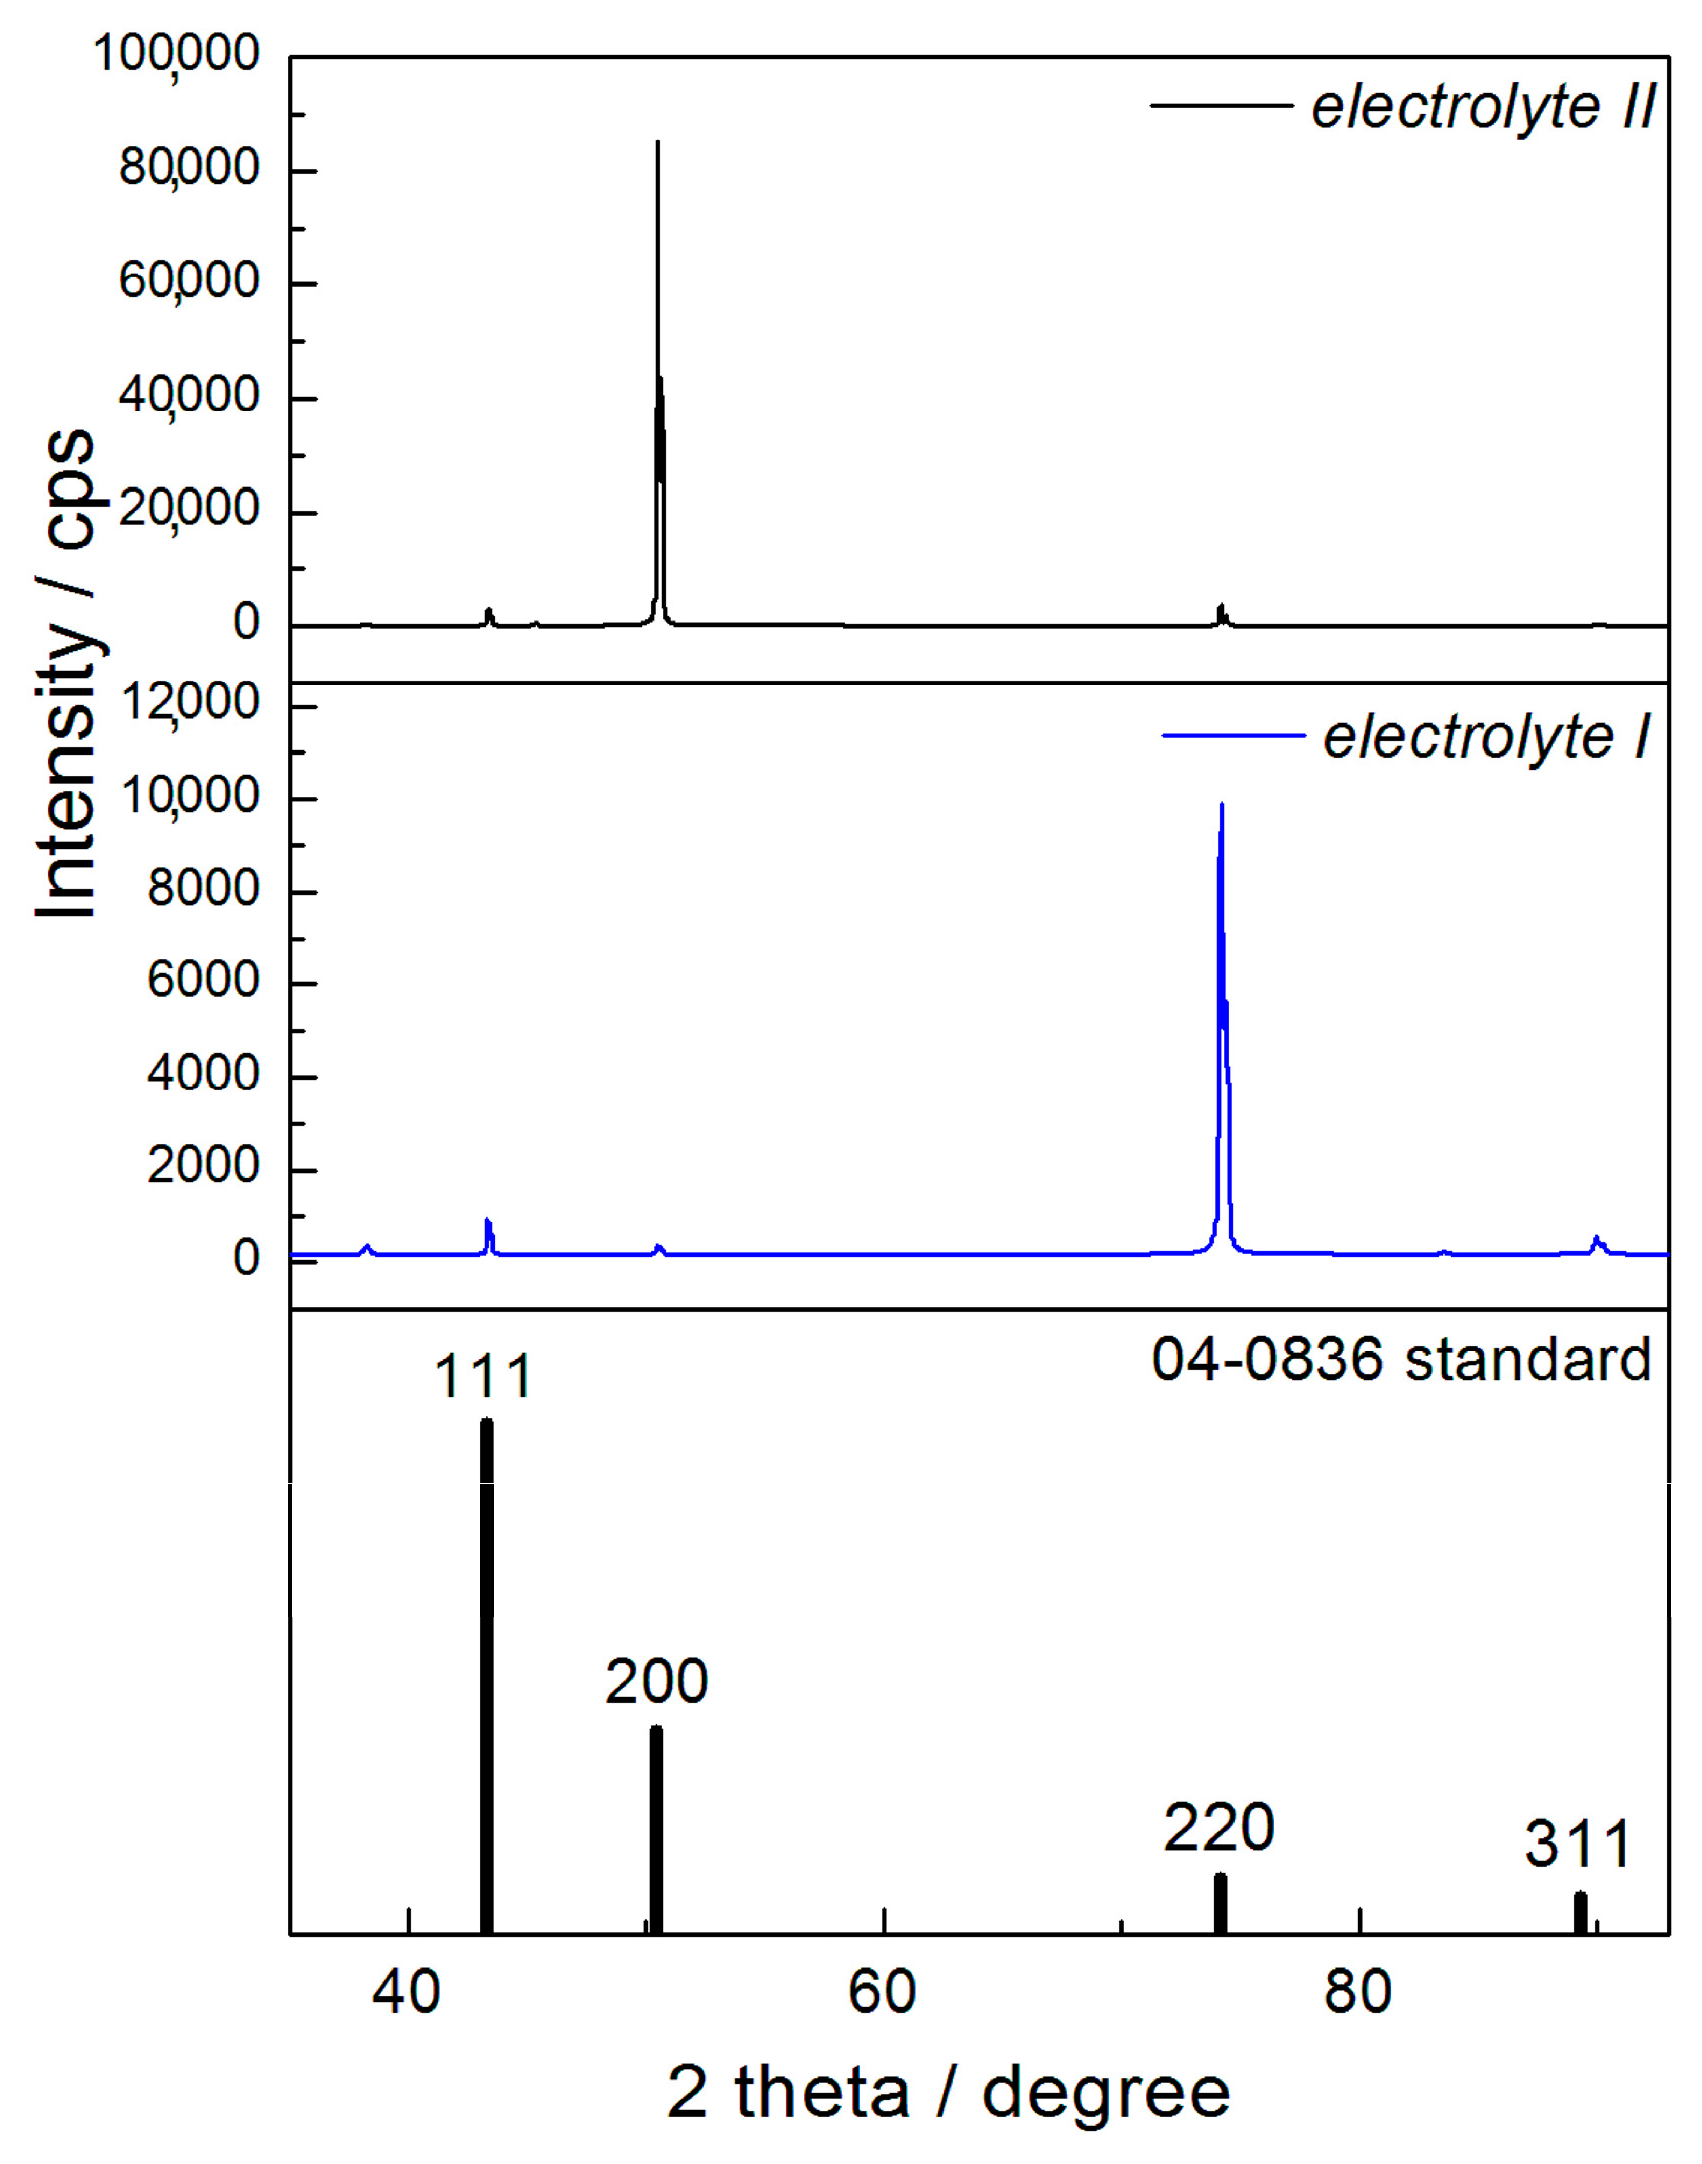
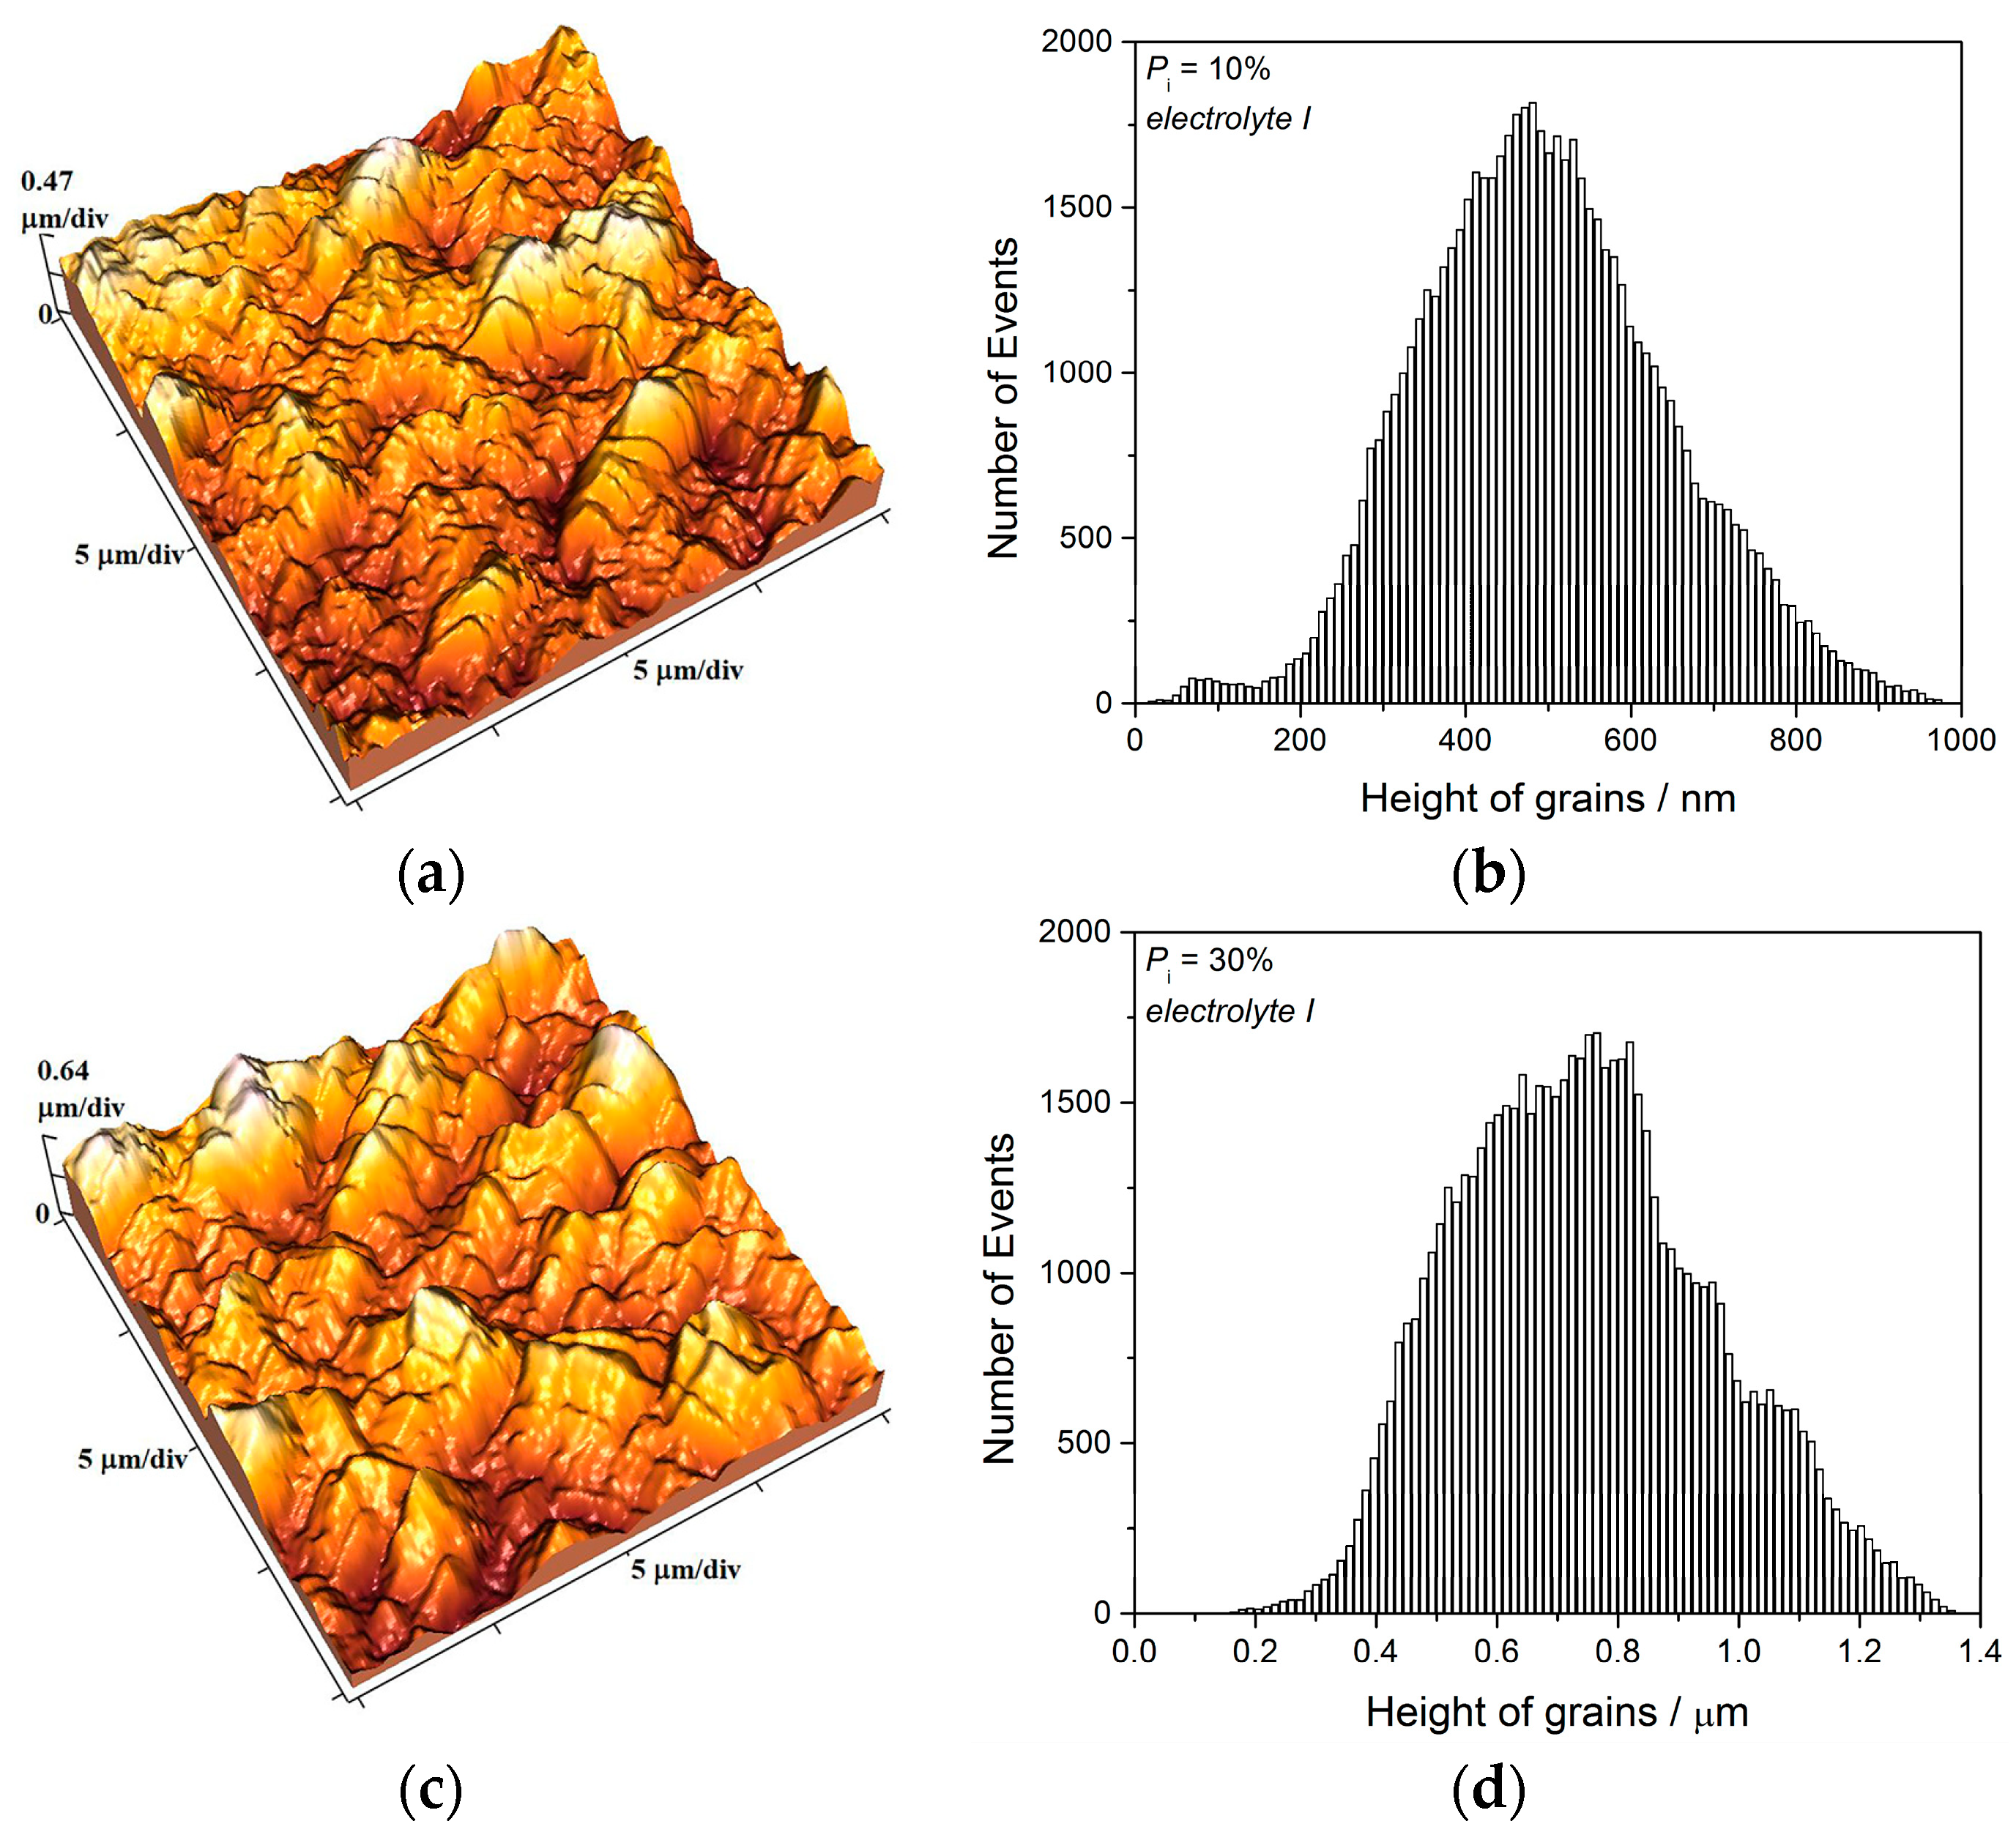
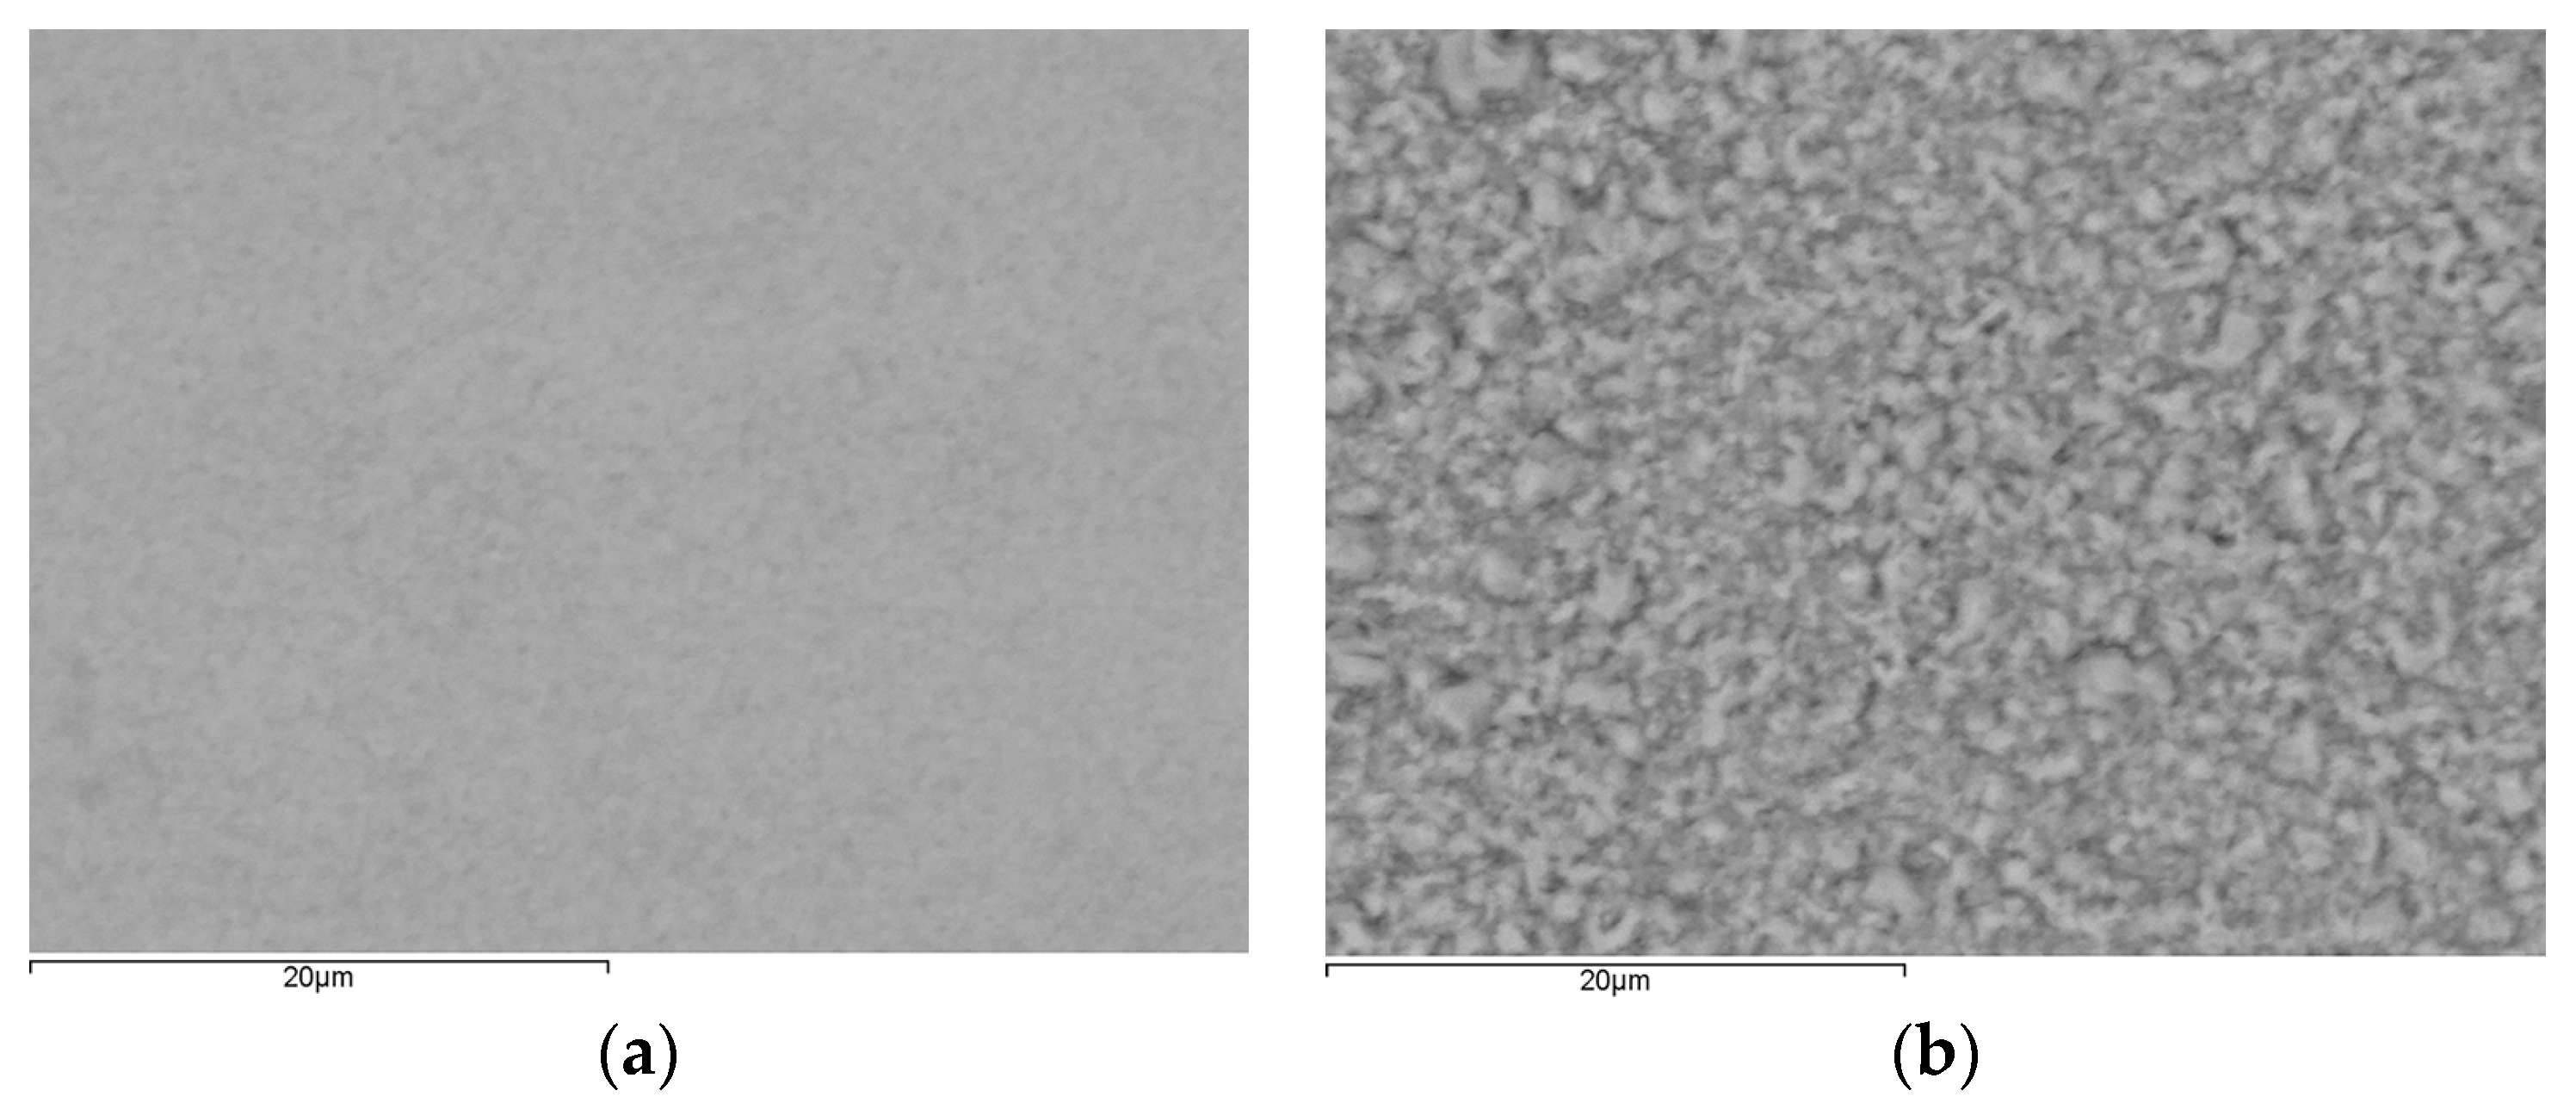
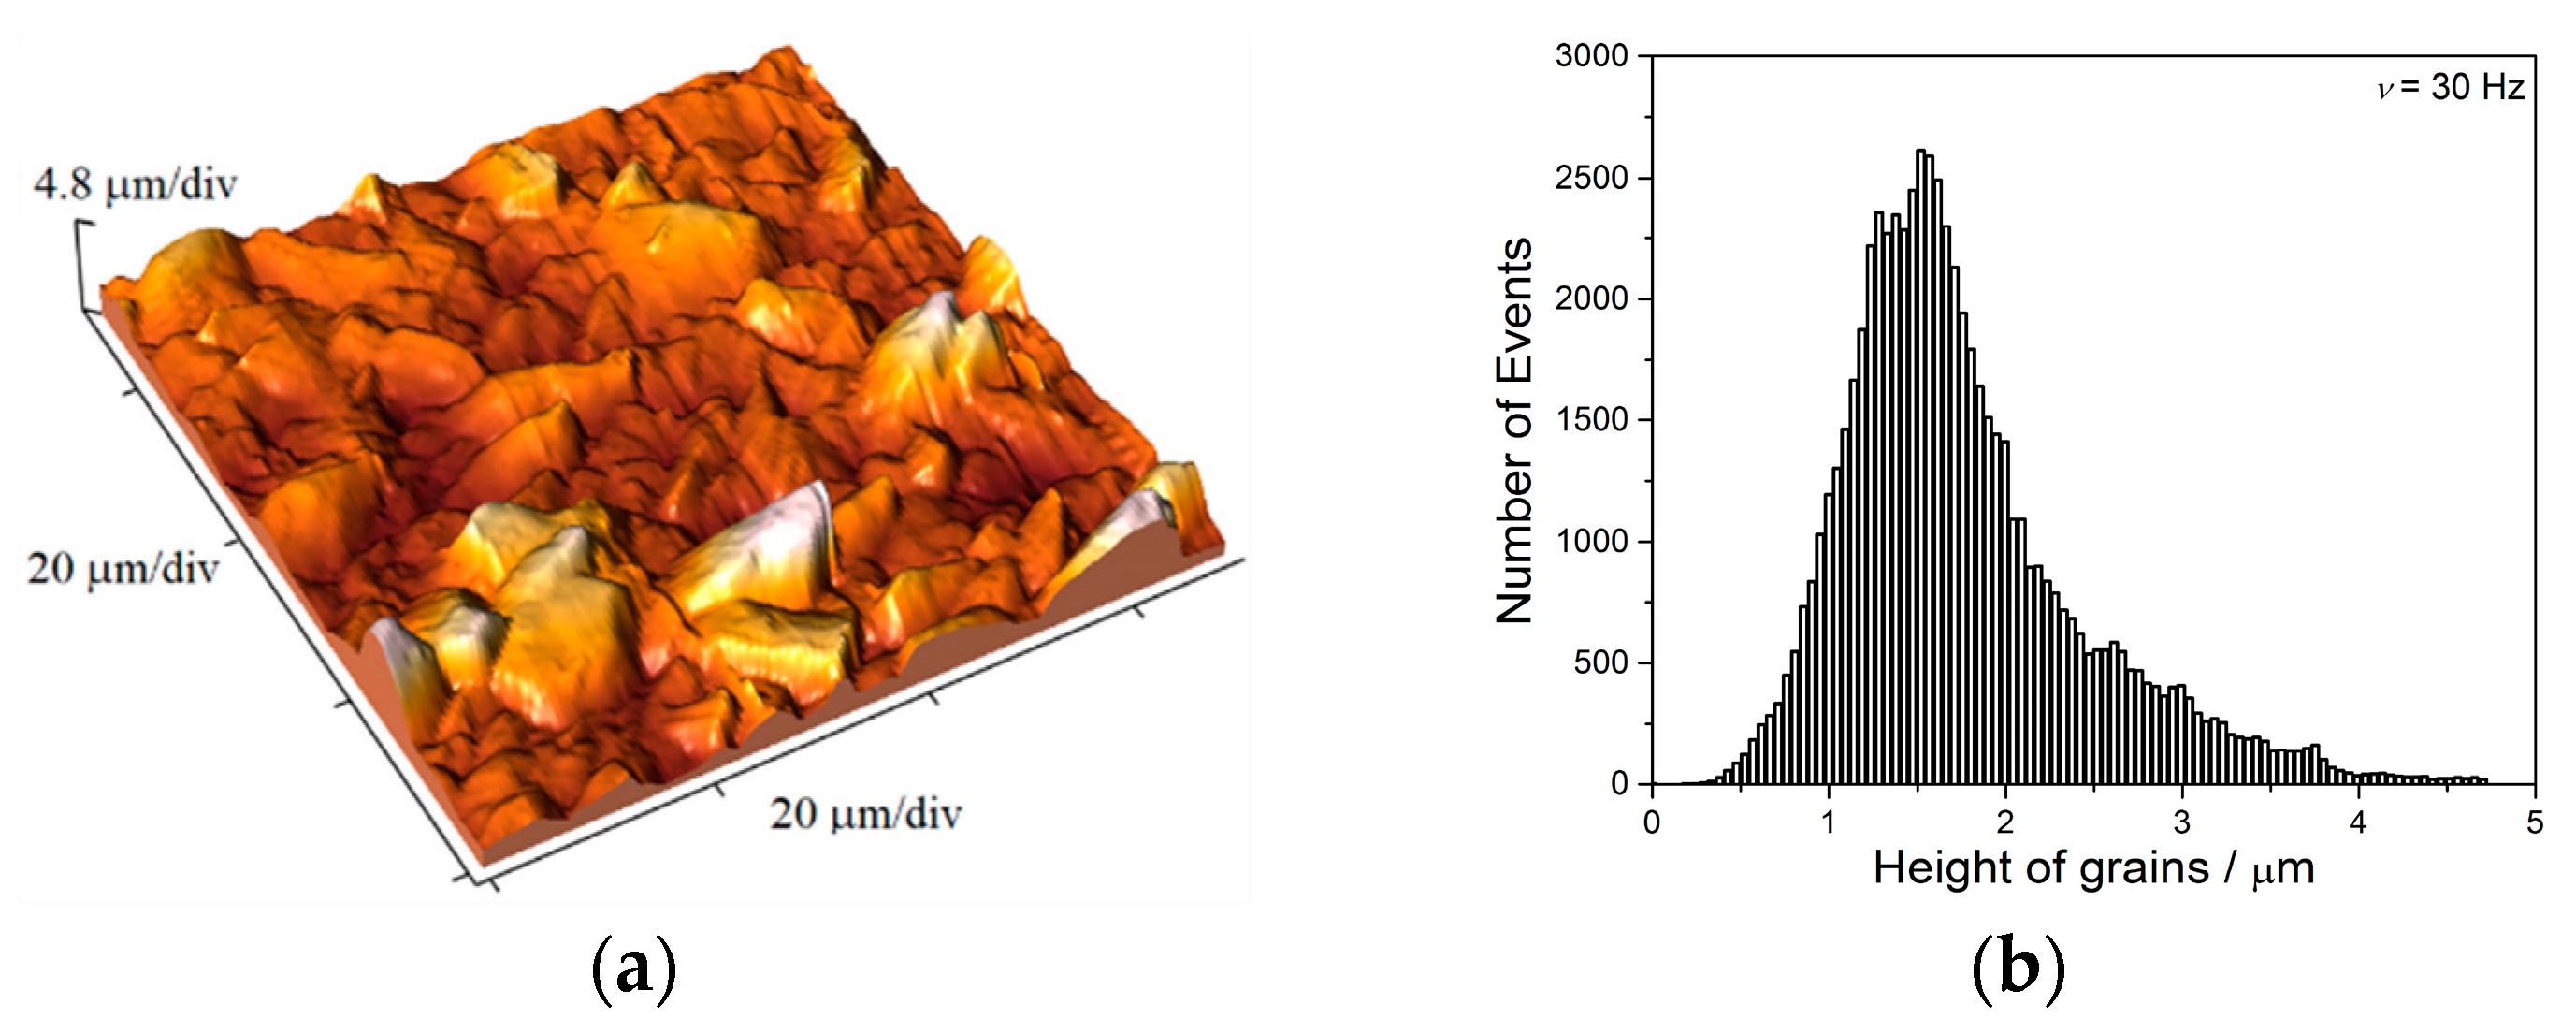
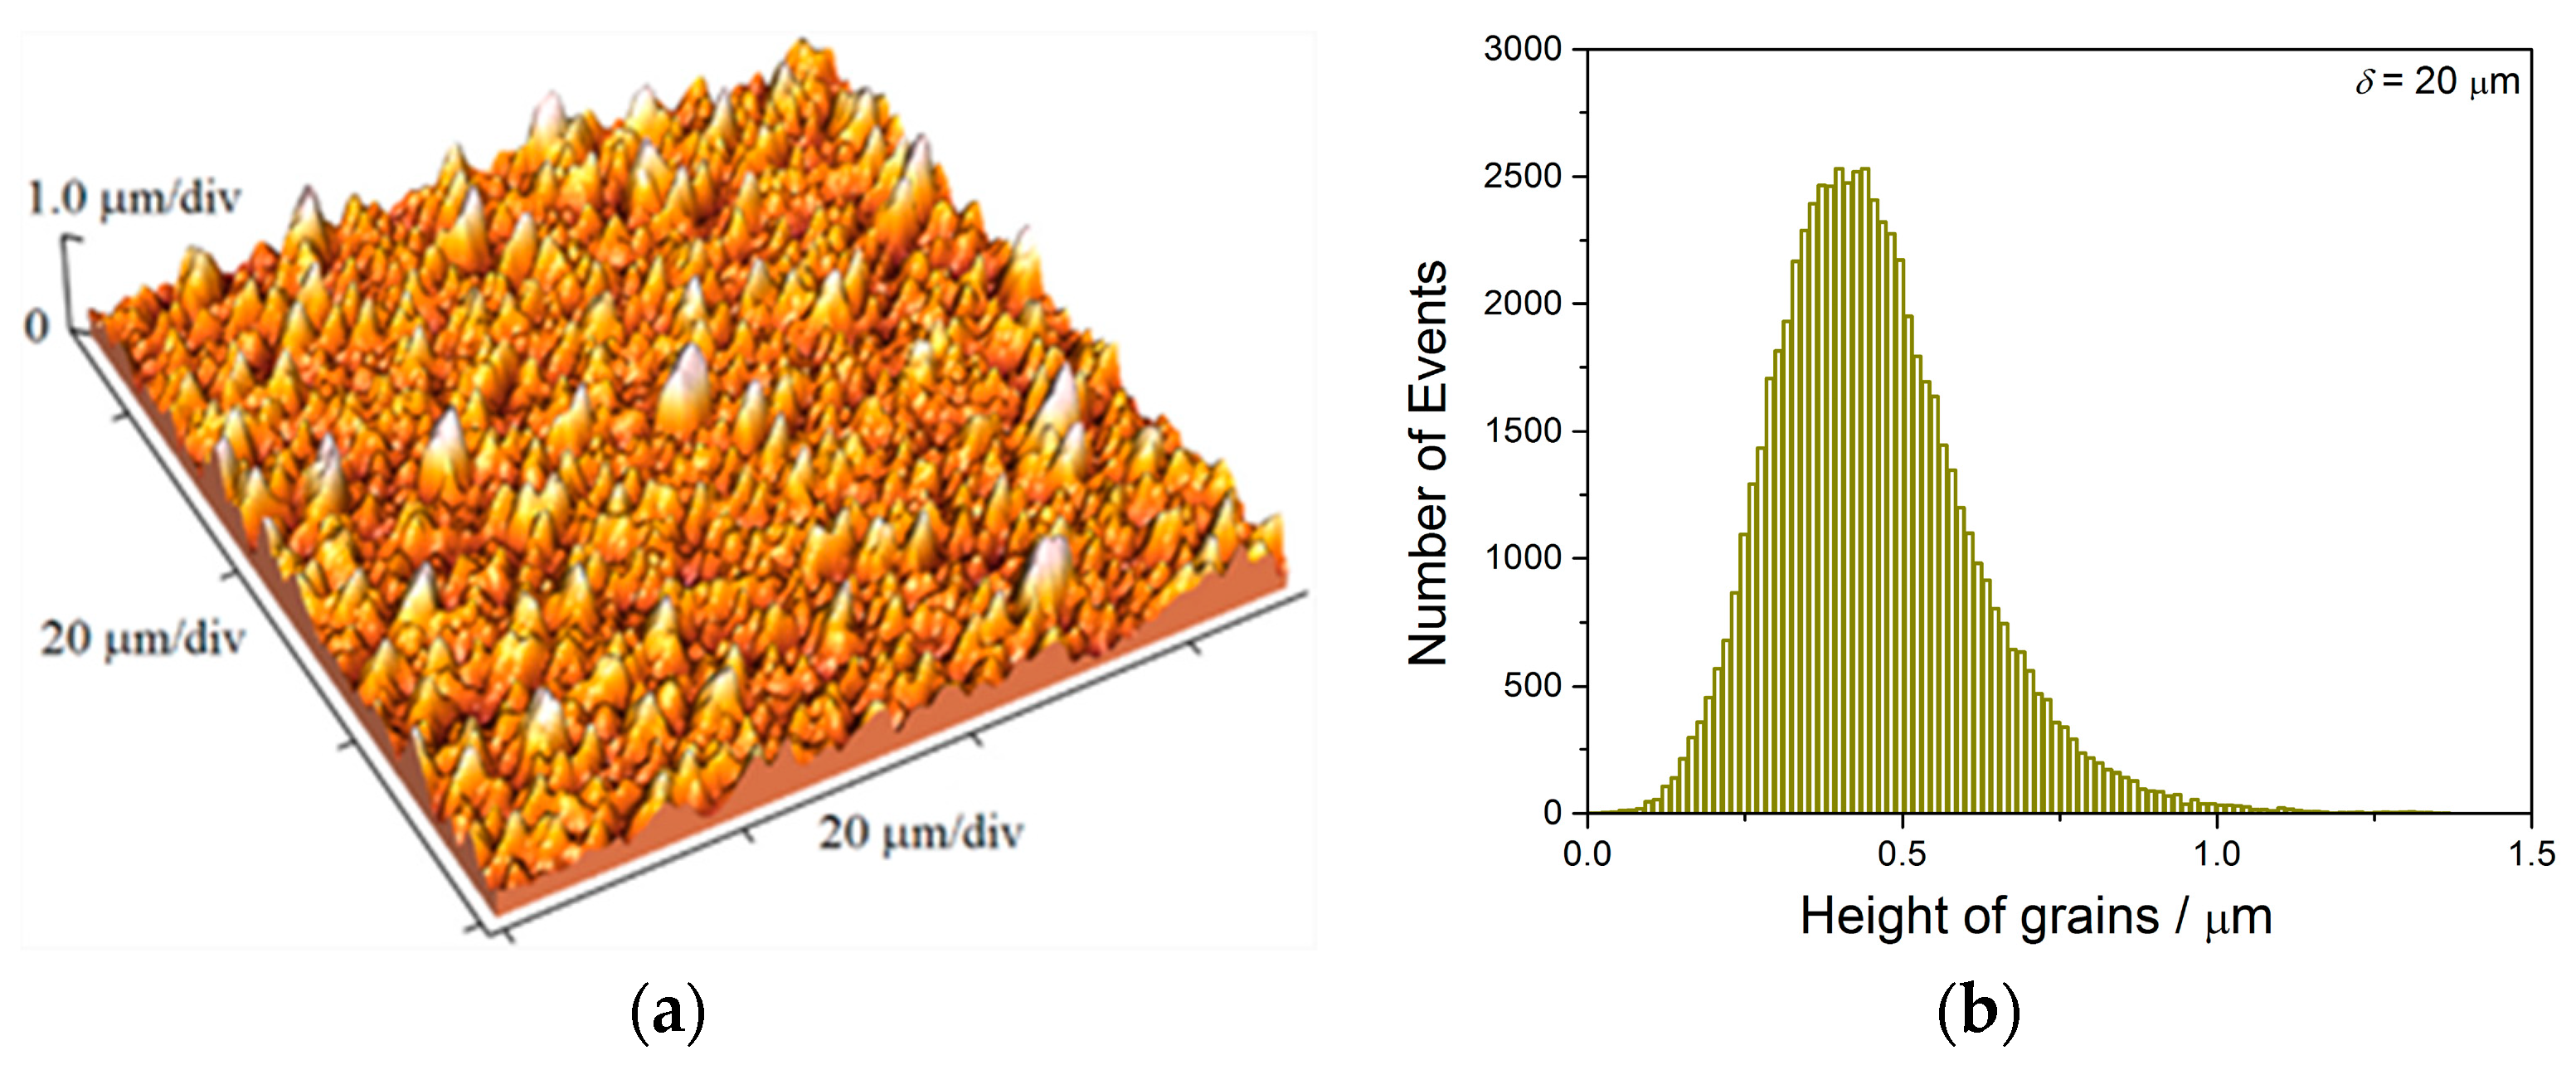
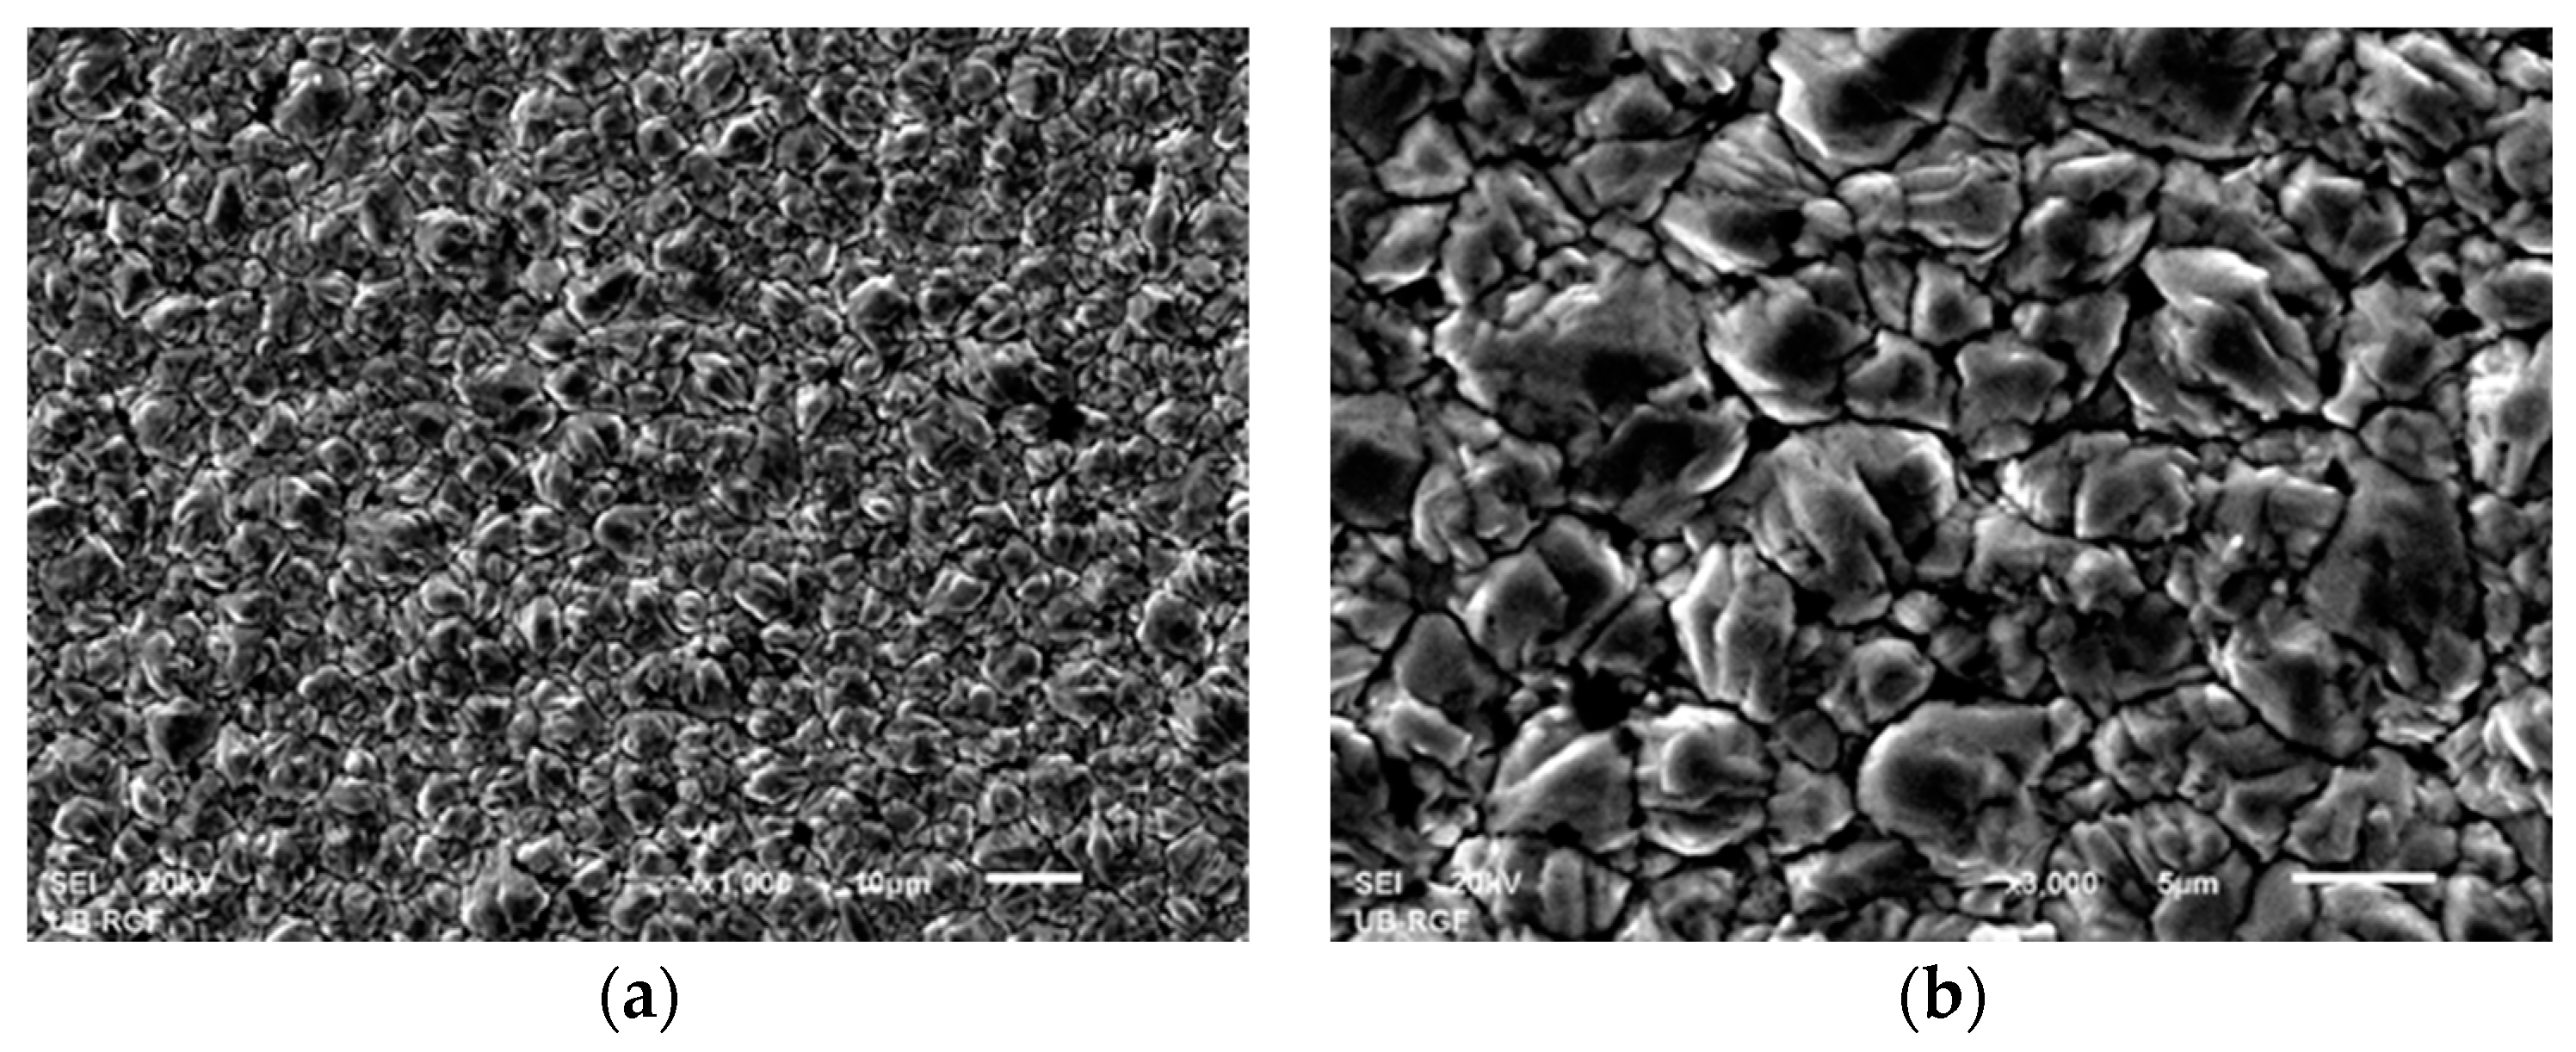
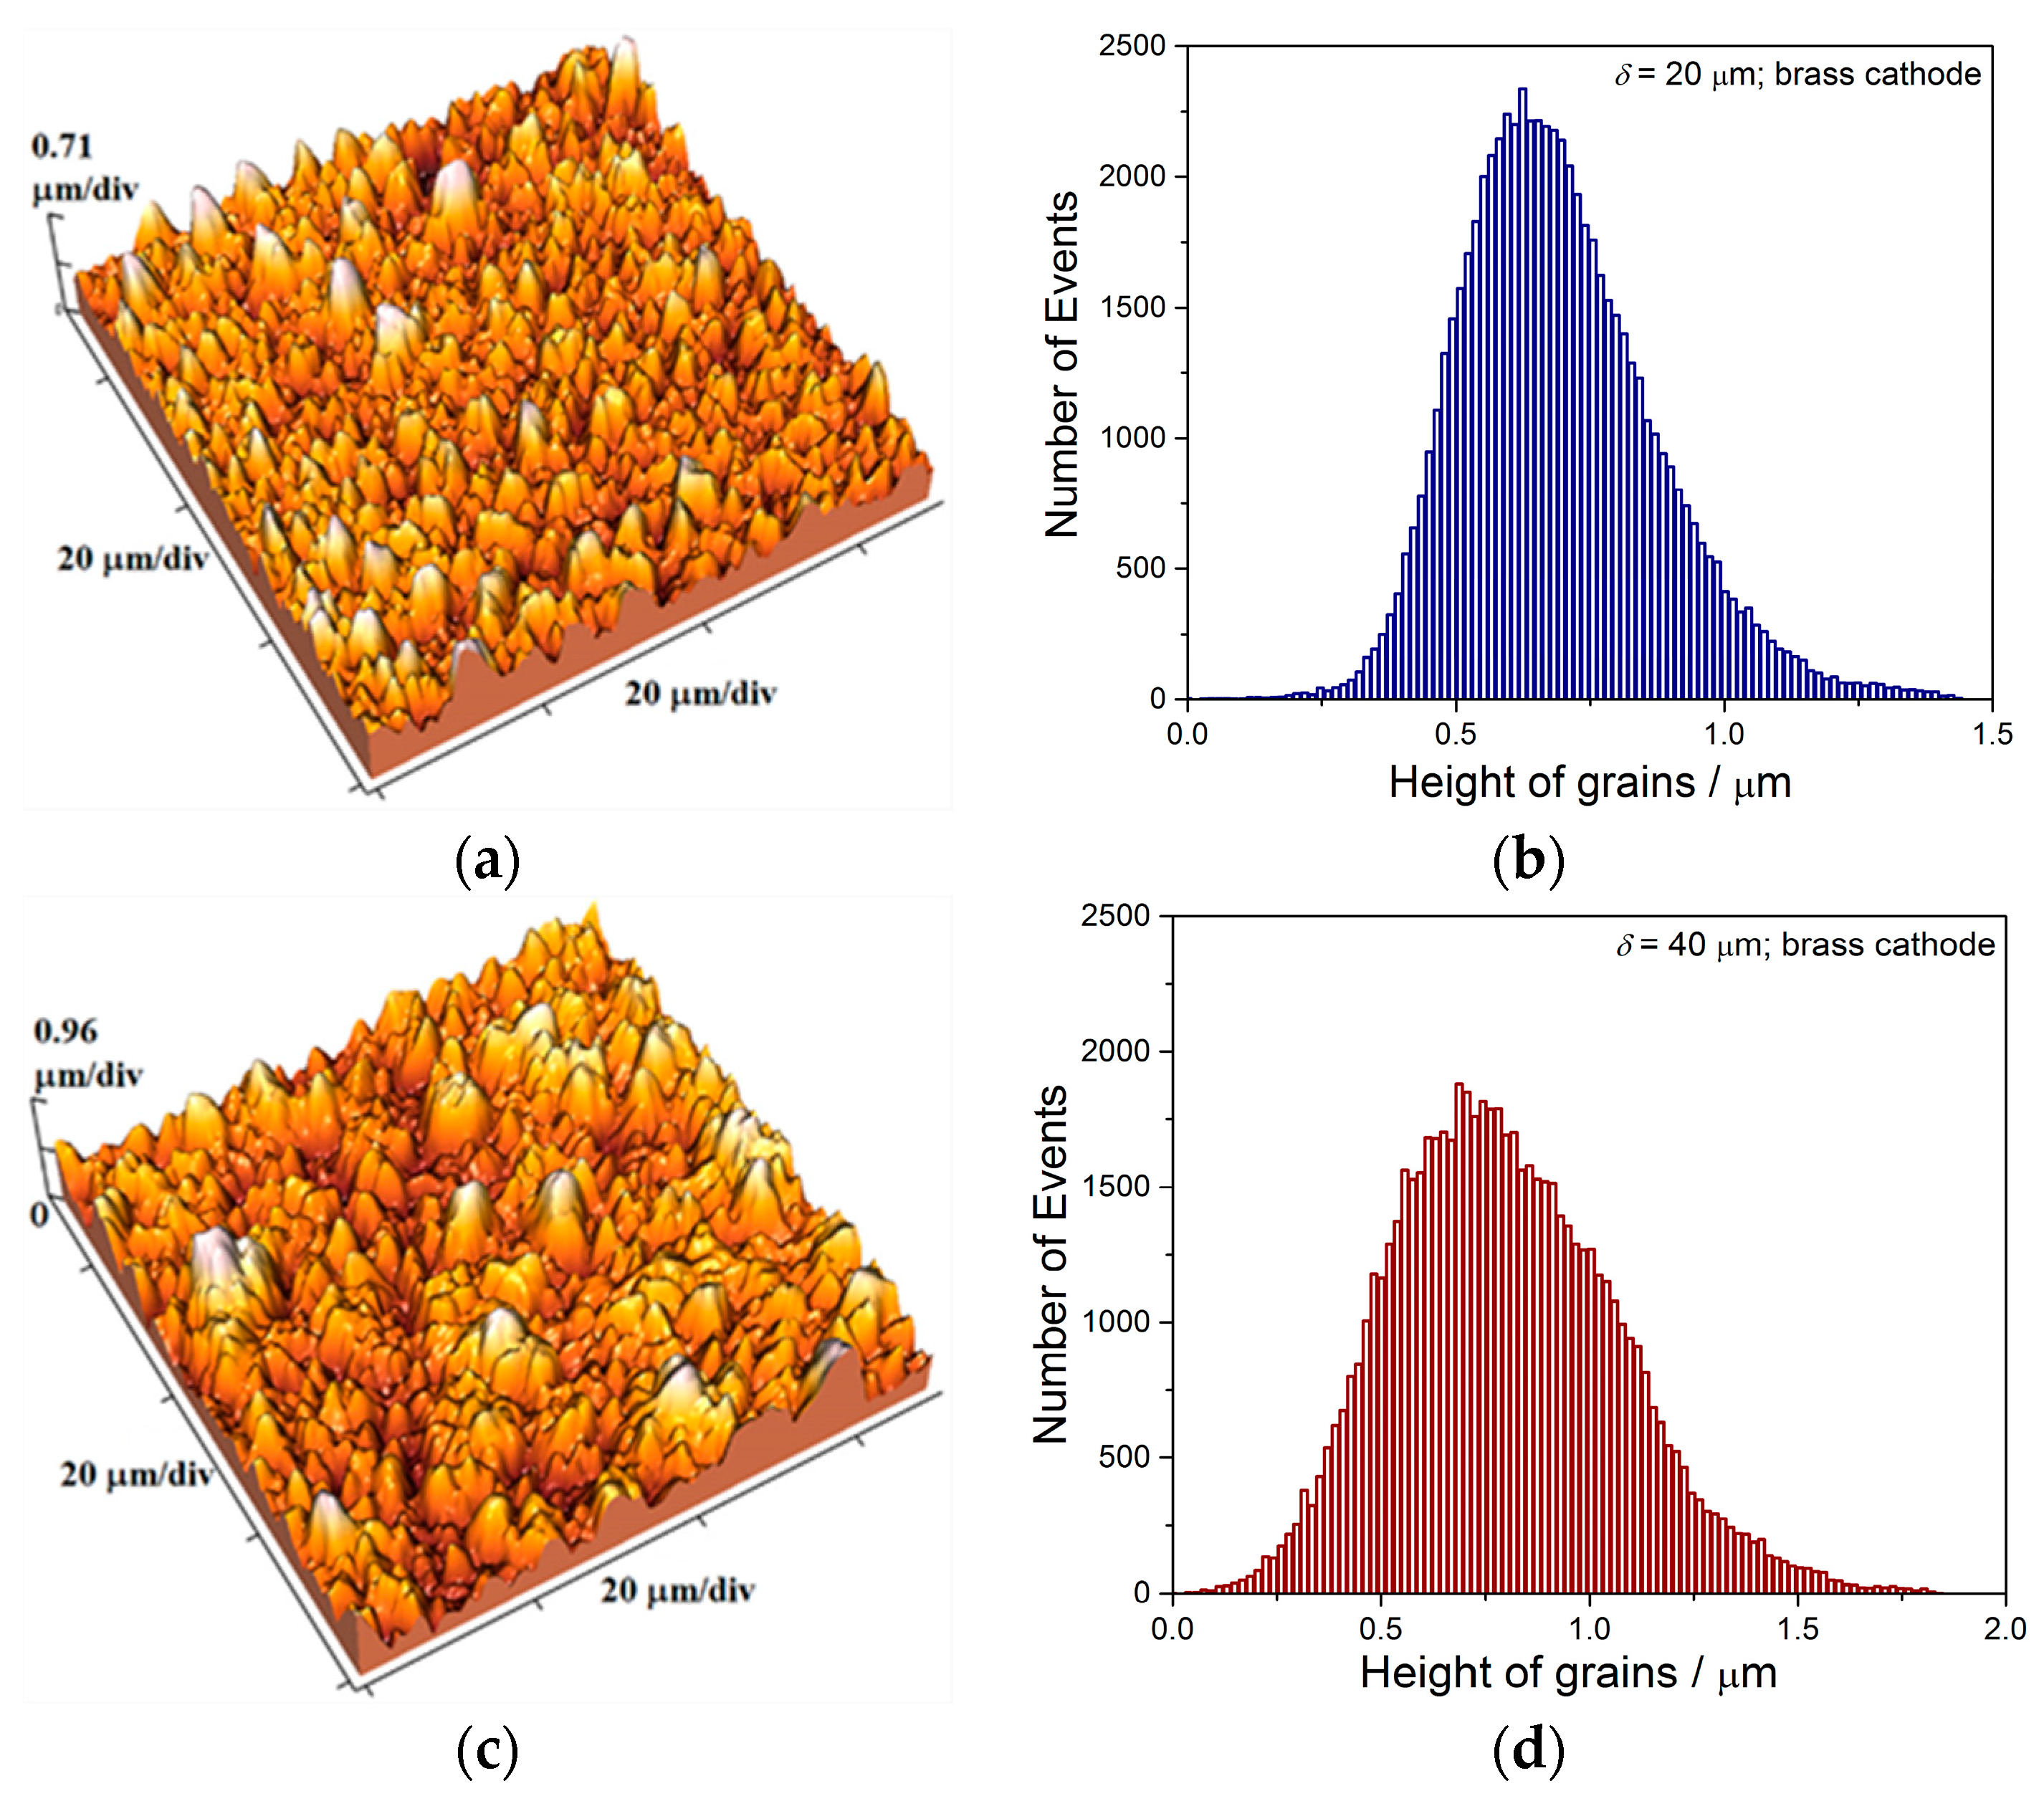
The two kinds of compact and uniform Cu coatings were obtained by electrodeposition in the DC regime. The fine-grained mat coatings are produced from the basic sulfate electrolyte (electrolyte I), and the very smooth mirror bright coatings from the electrolyte in the presence of additives for leveling and brightness (electrolyte II). The analysis of histograms confirmed the strong difference between them. In the mat Cu coatings, the grain heights are at the micro level, while in mirror bright Cu coatings the grain heights were at the nano level. The addition of the additives affected not only morphology of the coatings, but to crystal structure of the produced coatings. The mirror bright Cu coatings exhibited the strong (200) preferred orientation, while those produced from the basic sulfate solution exhibited the strong (220) preferred orientation.
The change in morphology and structure of the Cu coatings can be attributed to a synergistic effect of the used leveling/brightening addition agents on electrodeposition of copper. The adsorbed chloride layer is formed on electrode surface by an addition of small concentrations of chloride ions (1−10 mM). This adsorbed layer mediates copper reduction and introduces an additional reaction pathway, resulting in an overall depolarization of the reduction process. Both depolarization and the increase in peak current observed in the cyclic voltammograms (CVs) revealed a catalytic effect of chloride on Cu reduction [
55]. PEG is copolymer and nonionic surfactant, acting as a suppressor of the electrodeposition process only in the presence of chloride ions [
56]. There is no unique mechanism explaining adsorption/suppression effect of PEG in the presence of chloride ions on Cu electrodeposition process. The various mechanisms are proposed and they are summarized in Ref. [
56]. The MPSA is top brightening addition agent added in parts per million (ppm) concentrations to acid sulfate Cu electrolytes [
56,
57]. The addition of this additive to the basic sulfate electrolyte with already added chloride/PEG additives activates electrodeposition process enabling a formation of mirror bright coatings [
10,
11,
57]. The typical model explaining synergistic effect of this combination of additives causing a formation of mirror bright coatings is known as the model of “local perforation” [
58,
59].
The electrolyte stirring is another important parameter of the electrodeposition affecting a quality of metal coatings, whereby a quality of the coating is strongly influenced by intensity of stirring of the electrolyte. The various intensity of electrolyte stirring can be imposed by application of ultrasound of various powers, and it can be considered as follows: the compact and uniform Cu coatings are produced at the current density, j of 50 mA cm−2 which belongs to the mixed activation-diffusion control of the electrodeposition process.
For this type of electrodeposition control, the overpotential of electrodeposition can be presented by Equation (7) [
8,
60]:
where:
bc is the cathodic Tafel slope,
j0 is the exchange current density and
jL is the limiting diffusion current density.
The first term,
ηact
is an activation part of overpotential required for the charge transfer, and the second term,
ηdiff
is a diffusion part of overpotential and it is due to mass transfer limitations (diffusion limitation primarily).
Ultrasound imposed to the electrodeposition process only effects on the diffusion part of overpotential. The imposed ultrasound causes a mixing of the solution in the near-electrode layer, causing the decrease of the diffusion layer thickness, and the increase of the limiting diffusion current density. The degree of the diffusion control in the mixed activation-diffusion control decreases (i.e., it decreases the diffusion part in Equation (7)) by electrolyte stirring, and this decrease enhances with an intensification of electrolyte stirring.
The effect of imposed ultrasound is equivalent to the other ways of electrolyte stirring, such as imposed magnetic field and magnetic stirring [
60,
61], but also to vigorous hydrogen evolution occurring parallel to metal electrochemical deposition [
62]. The concept of „effective overpotential“ originally proposed to explain a change of the hydrodynamic conditions in the near-electrode layer caused by vigorous hydrogen evolution [
62] is applicable for all other ways of electrolyte stirring. The production of different morphologies of the Cu coatings under different intensities of applied ultrasound (
Figure 6,
Figure 7,
Figure 8 and
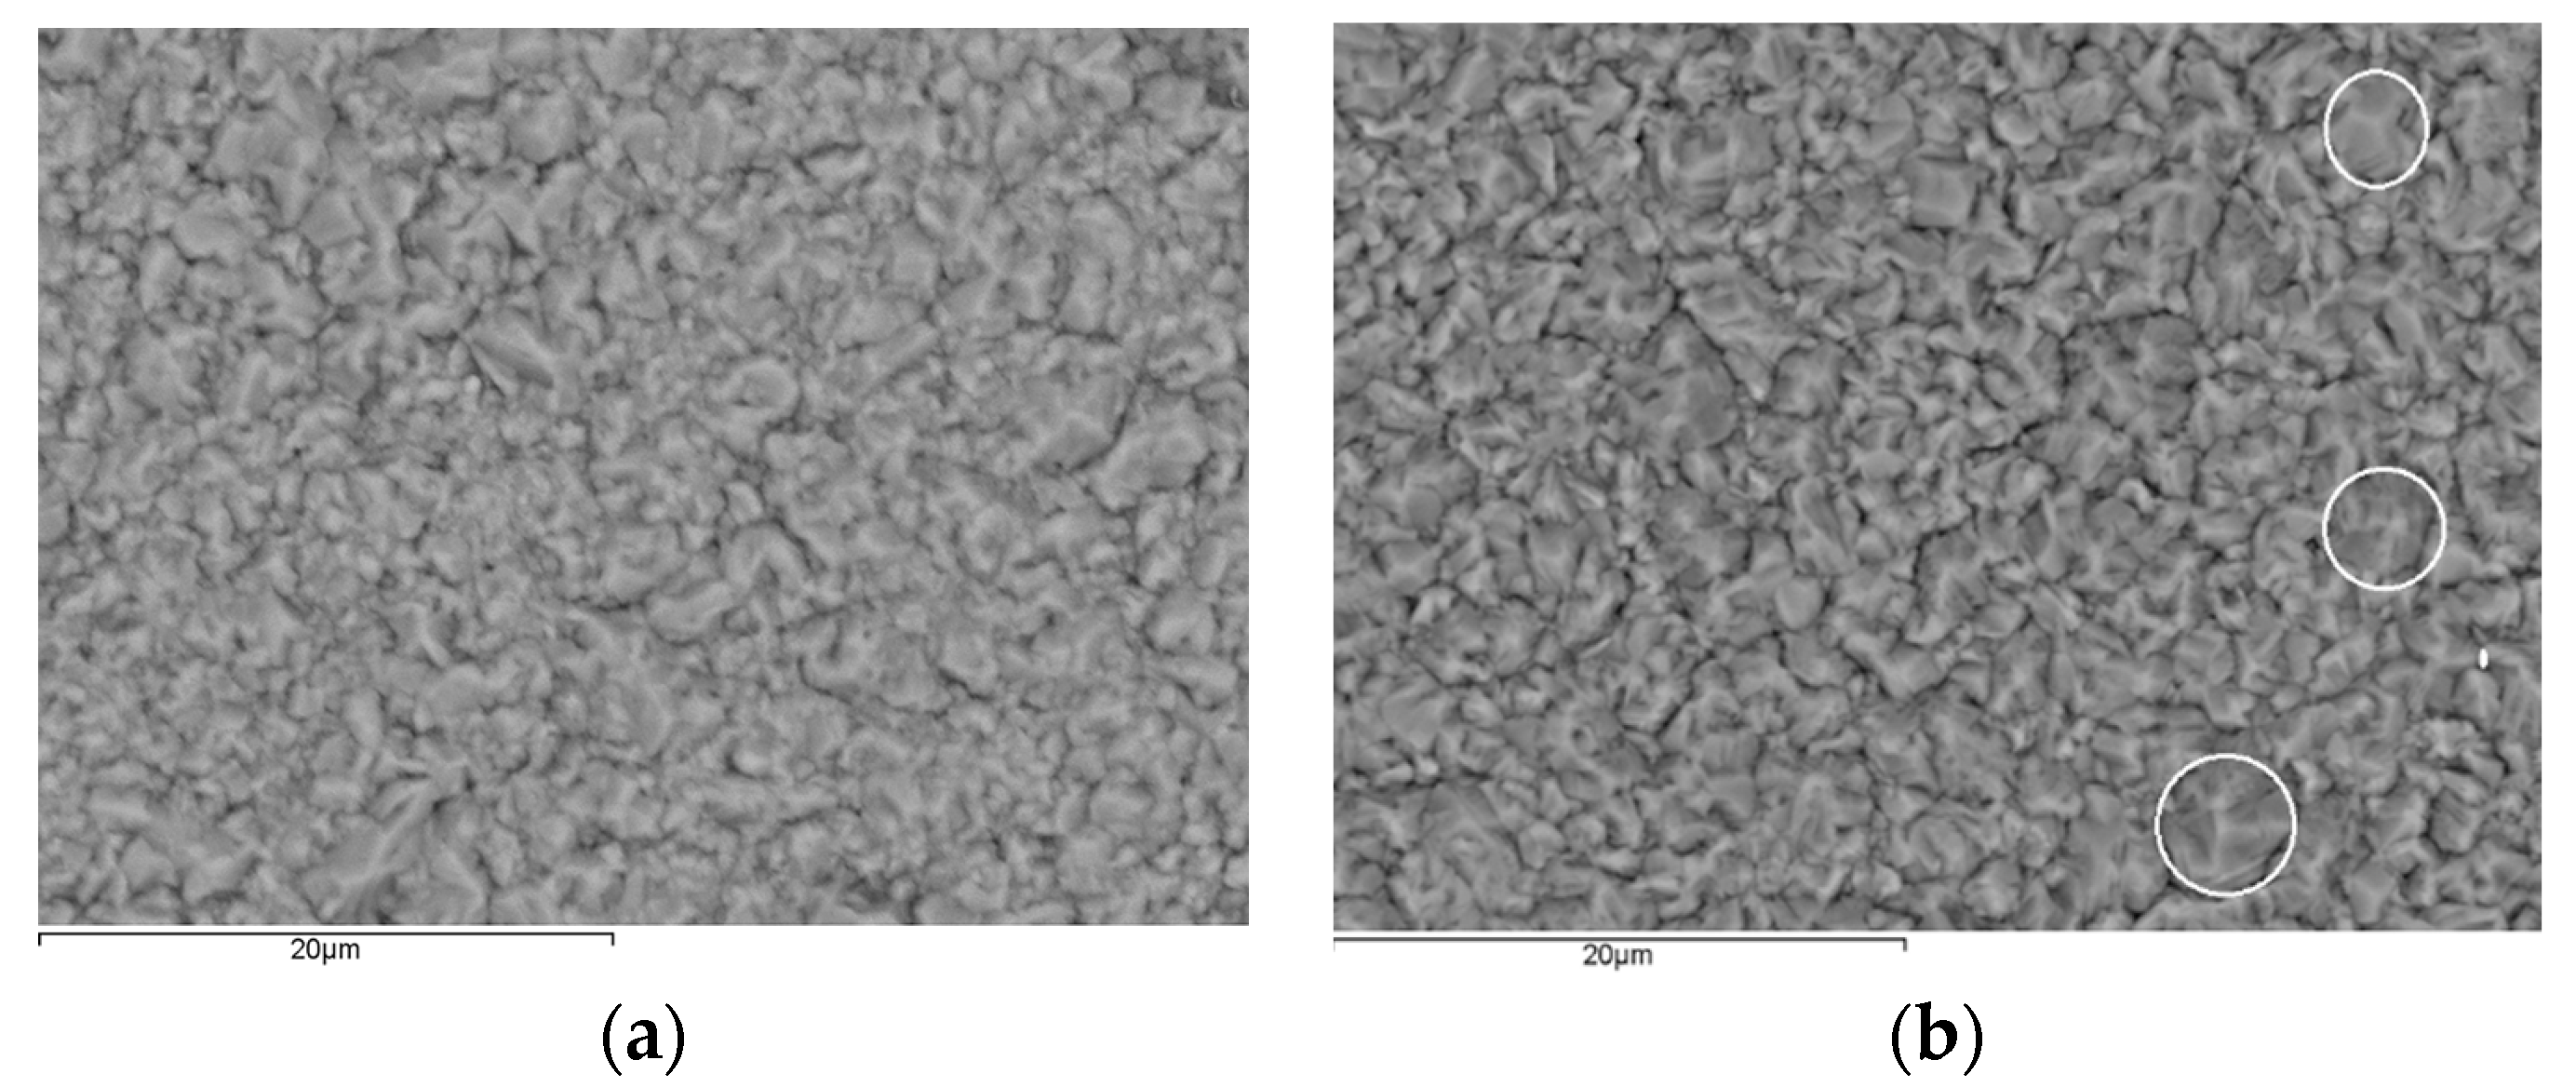
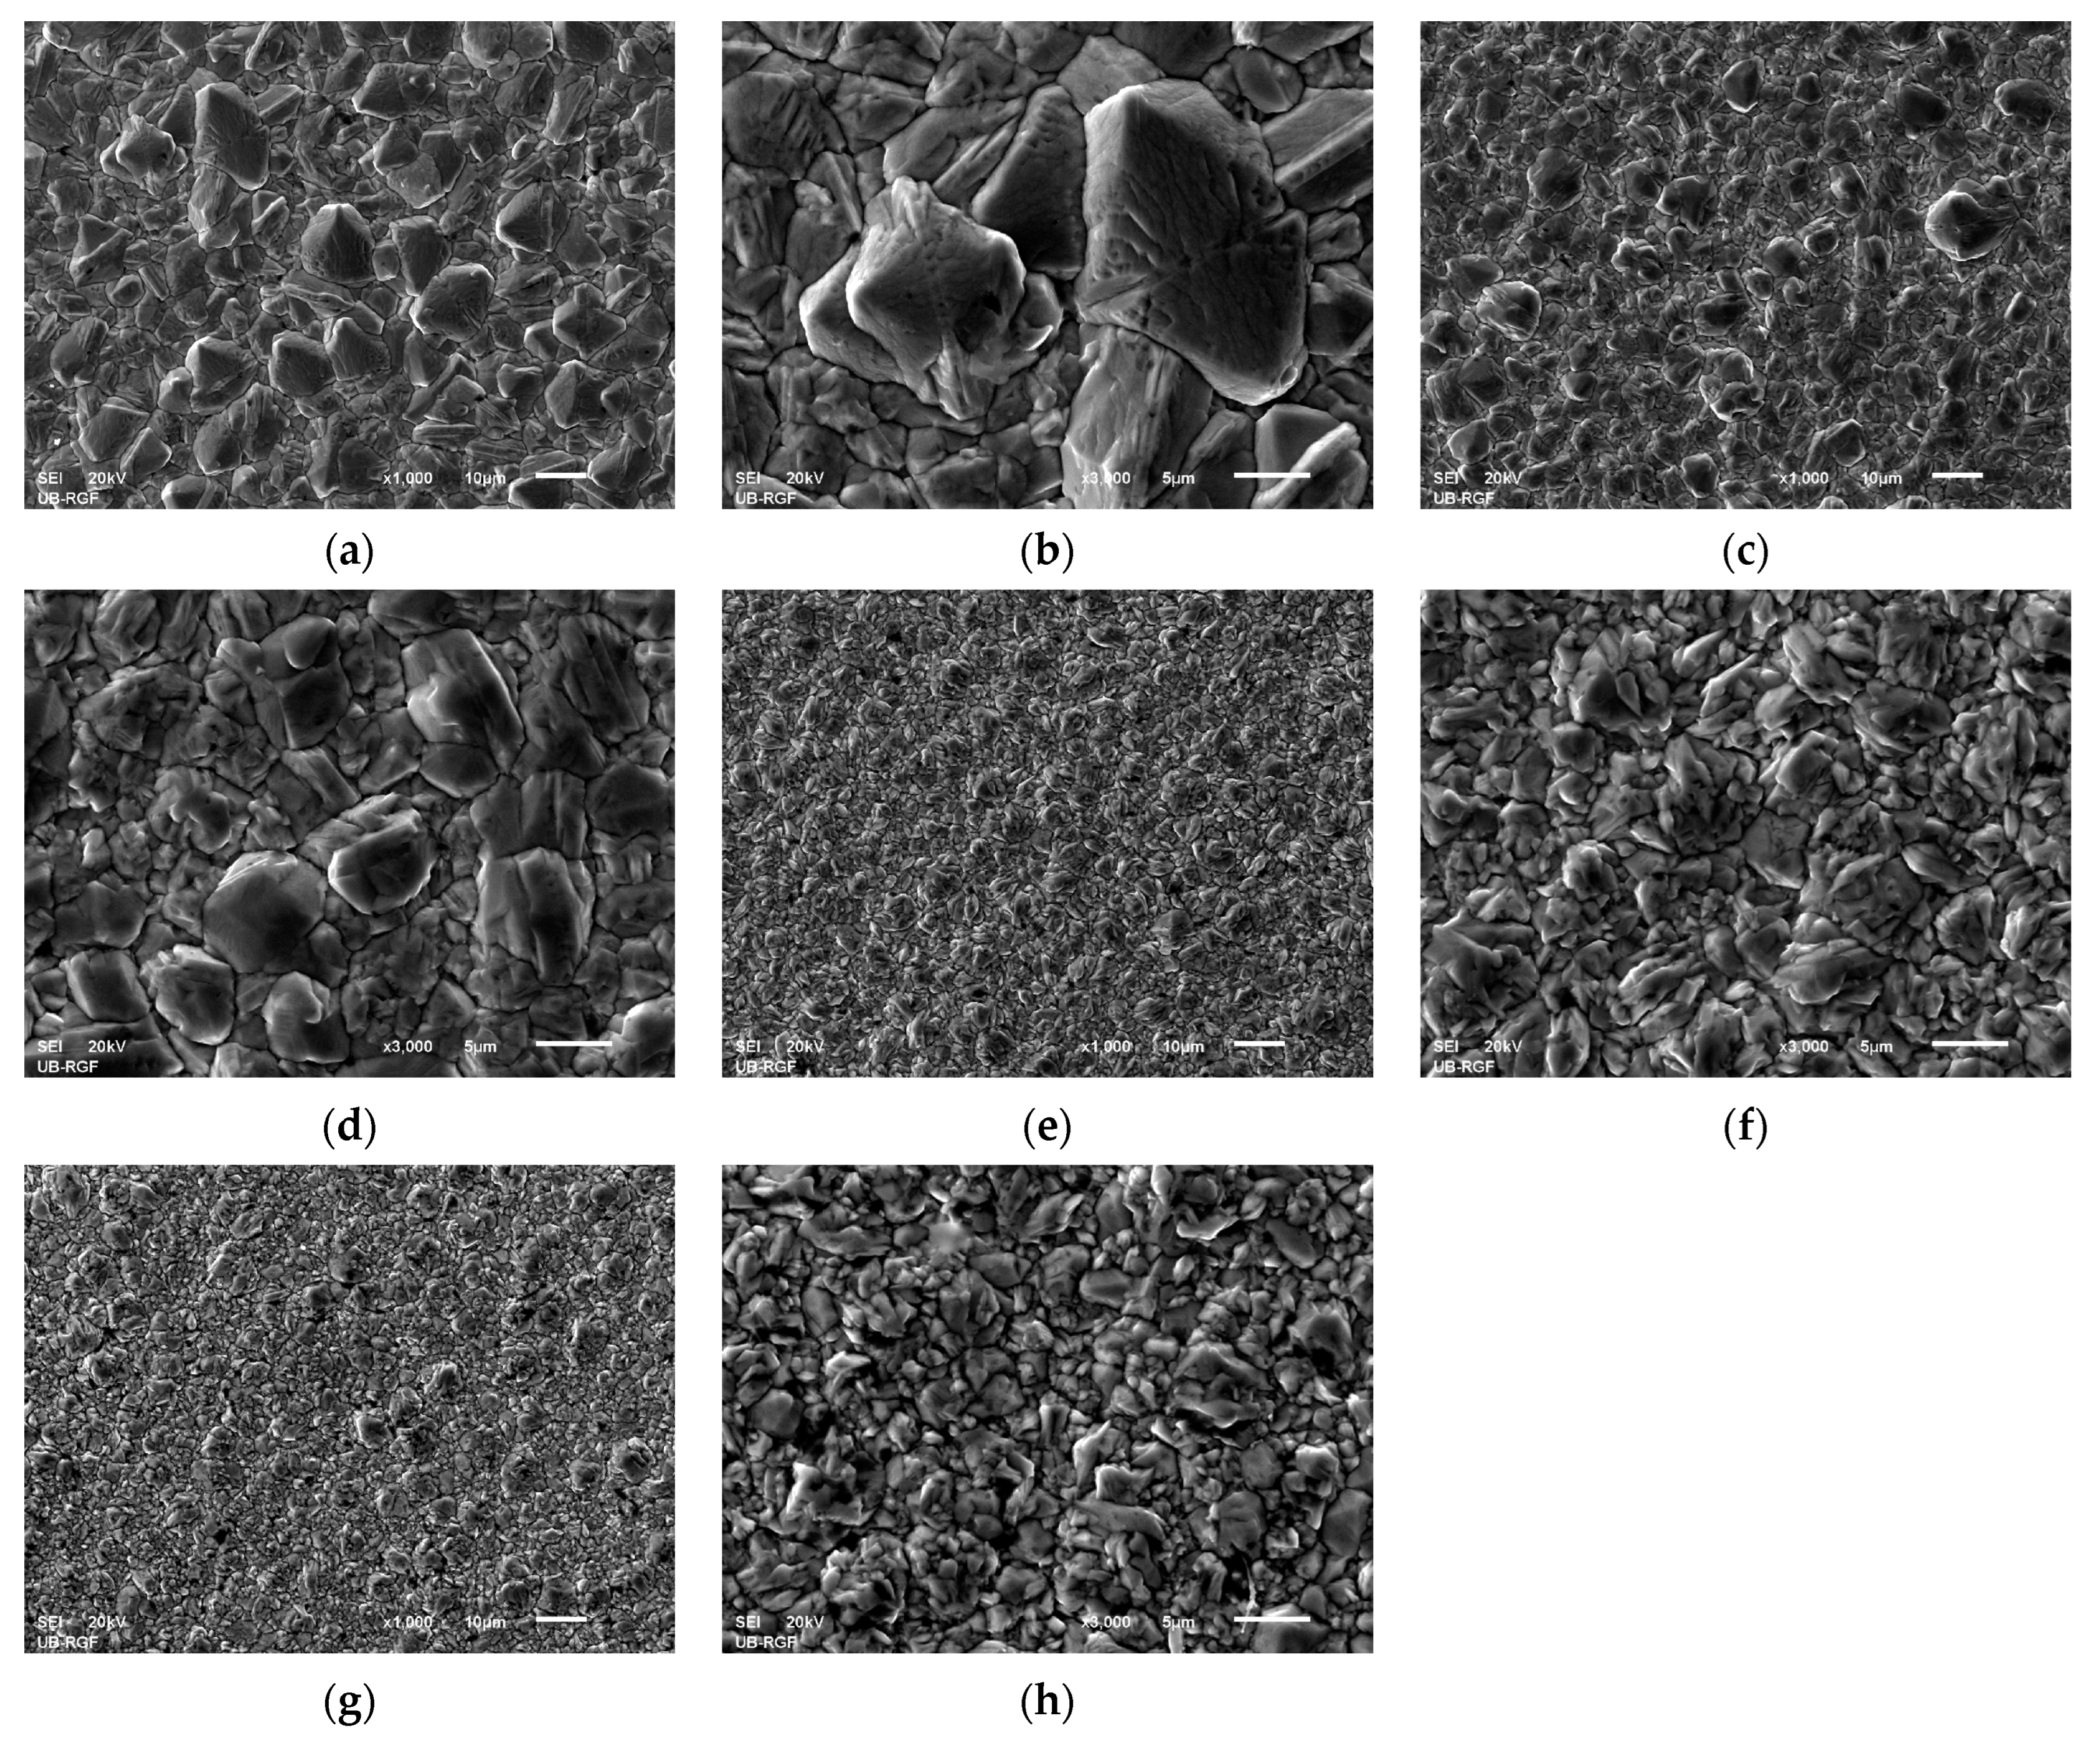
Figure 9) can be considered as follows: the solution stirring in the near-electrode layer intensifies with an increase of the intensity of imposed ultrasound. As a result of this intensification, the degree of the diffusion control in the mixed activation-diffusion control decreases. Since the activation part is independent of the electrolyte stirring, it means that the contribution of the activation control in the mixed activation-diffusion control increases with an increase of the intensity of ultrasound. This causes a formation of large and regular crystal grains in the coatings produced under strong imposed ultrasound (see parts in circles in
Figure 6b). Namely, formation of regular and well defined grains is result of dominant activation control in the overall control of the electrochemical deposition process [
8].
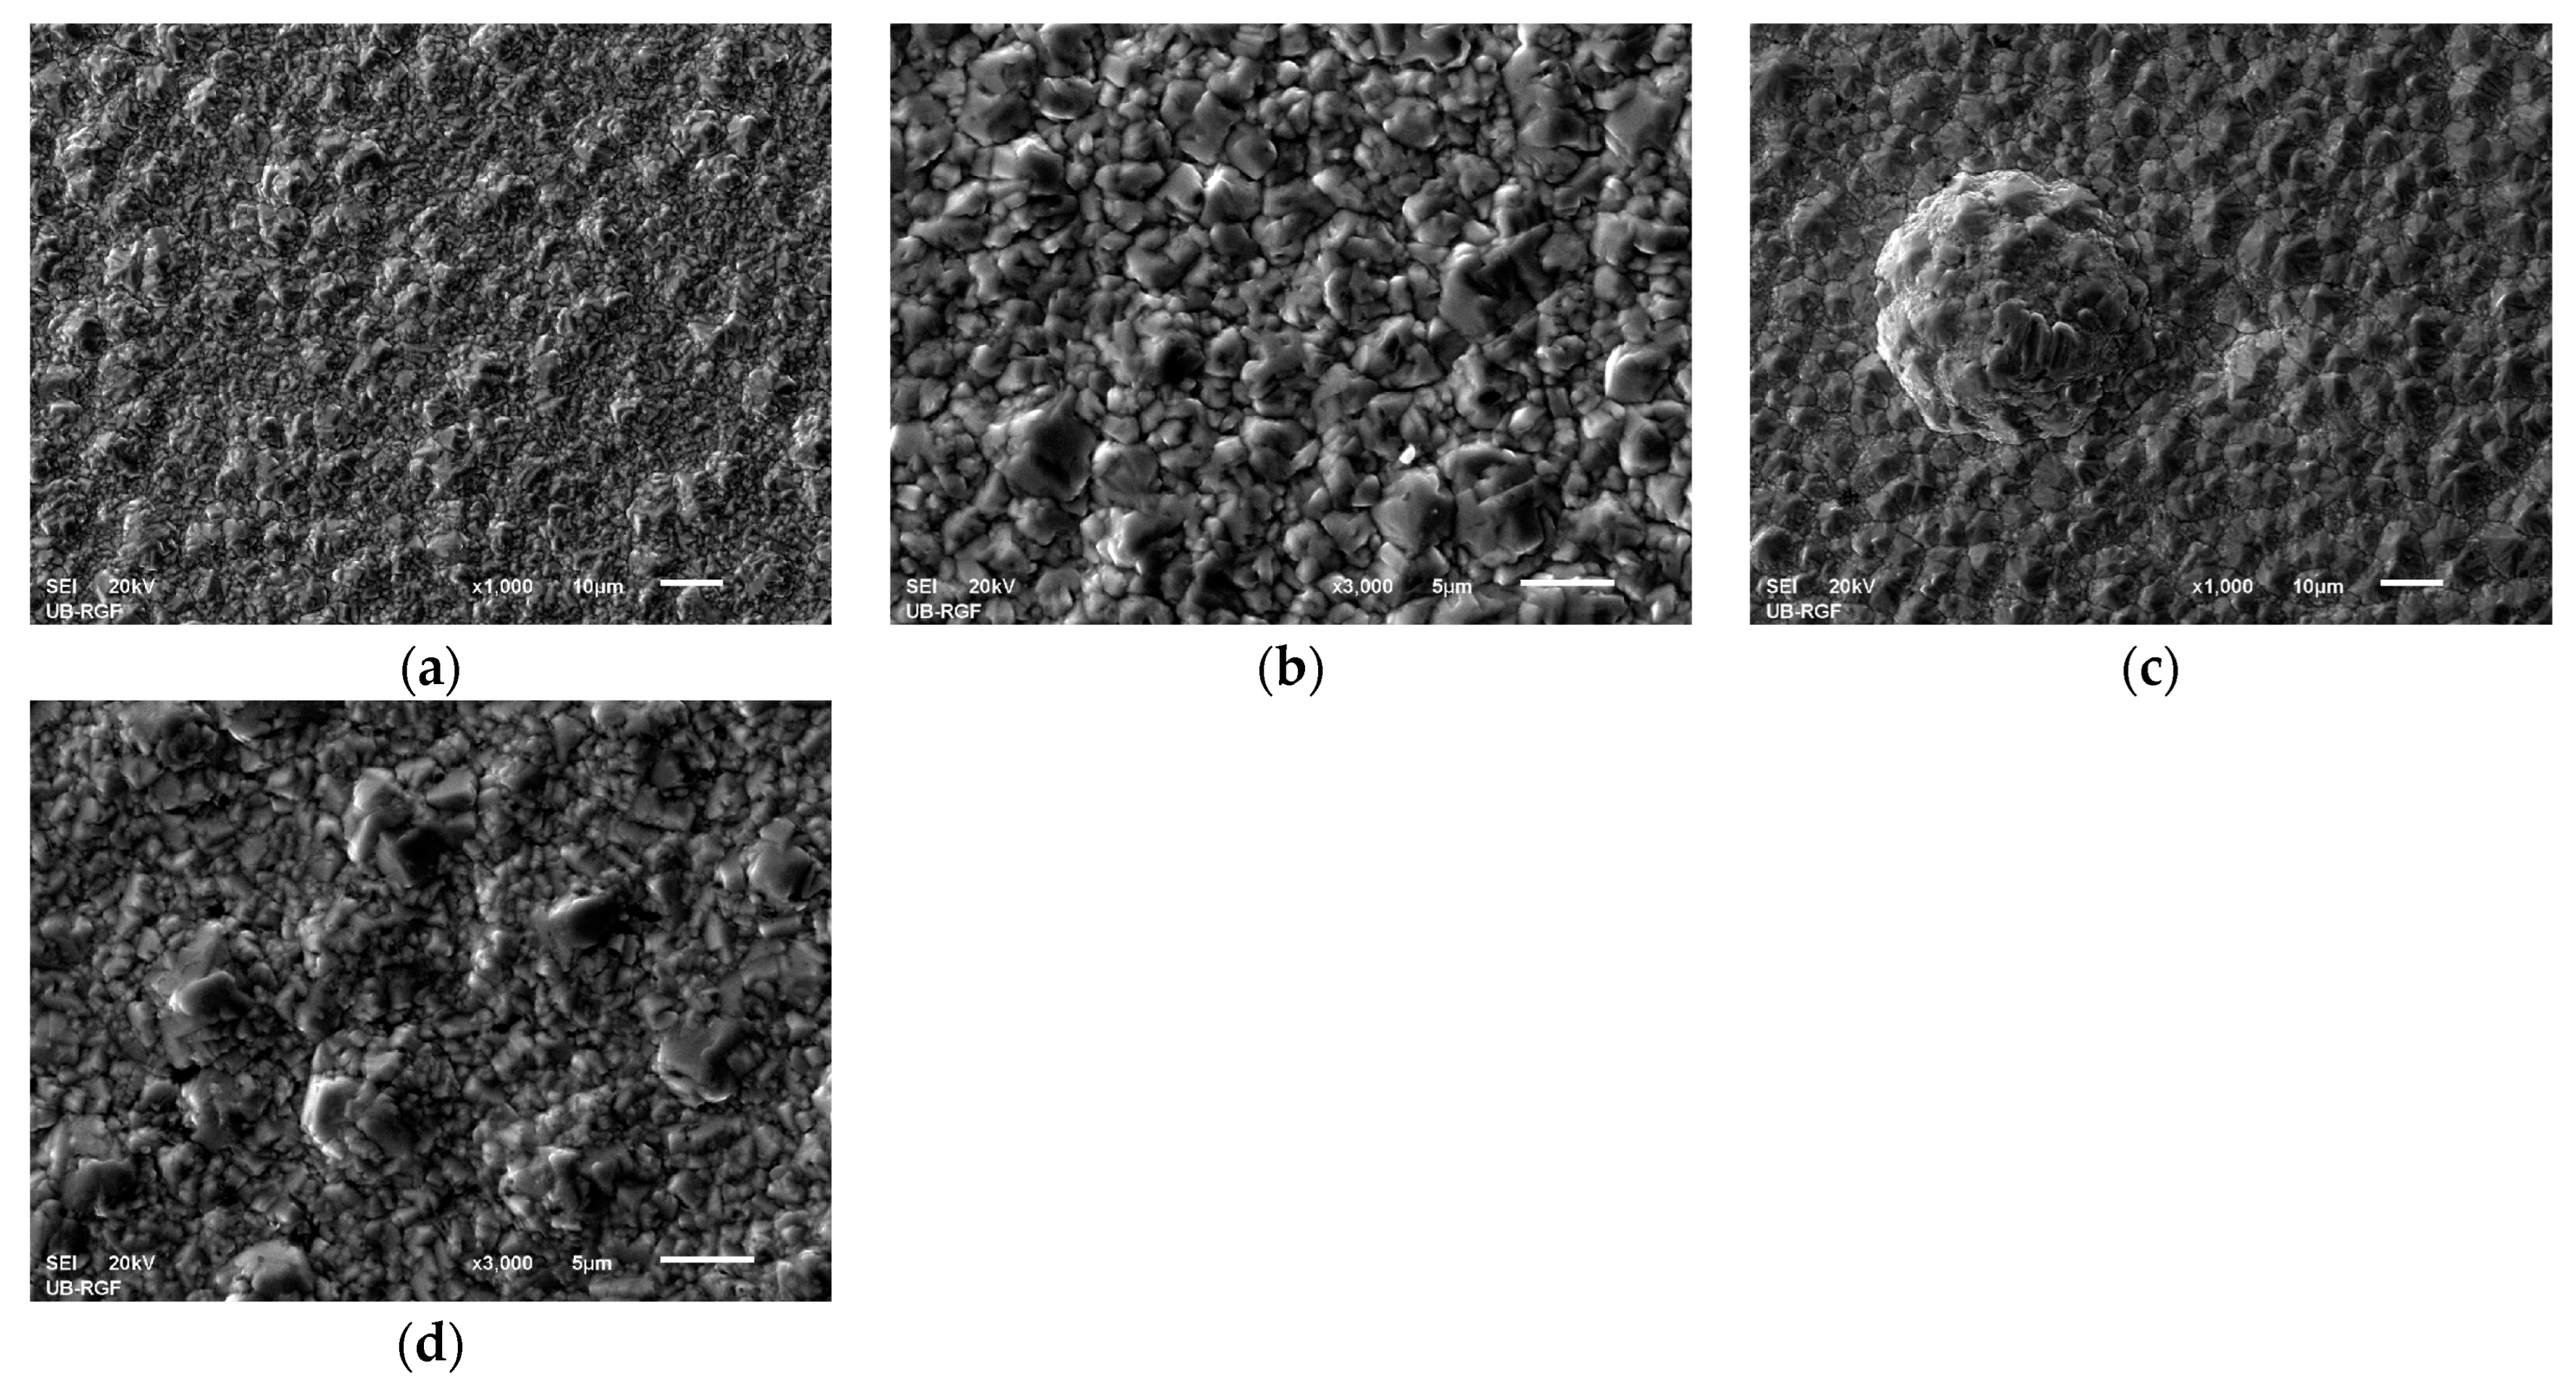
The equivalent effect on morphology and structure of electrodeposited Cu coatings is achieved by the pulsating current regime. The range of the average current densities between 15 and 70 mA cm
−2 belongs to the mixed activation-diffusion control of the electrochemical deposition process [
13]. With the increase of the average current density, the share of the activation control decreased, while the share of diffusion control increased in the mixed activation-diffusion control of the electrochemical deposition. The regular and well defined grains formed with
jav of 15 mA cm
−2 (
Figure 16a,b) are characteristic of predominant activation control, while globules are formed with
jav of 70 mA cm
−2 (
Figure 19c) when diffusion becomes predominant process in the mixed activation-diffusion control of electrochemical deposition.
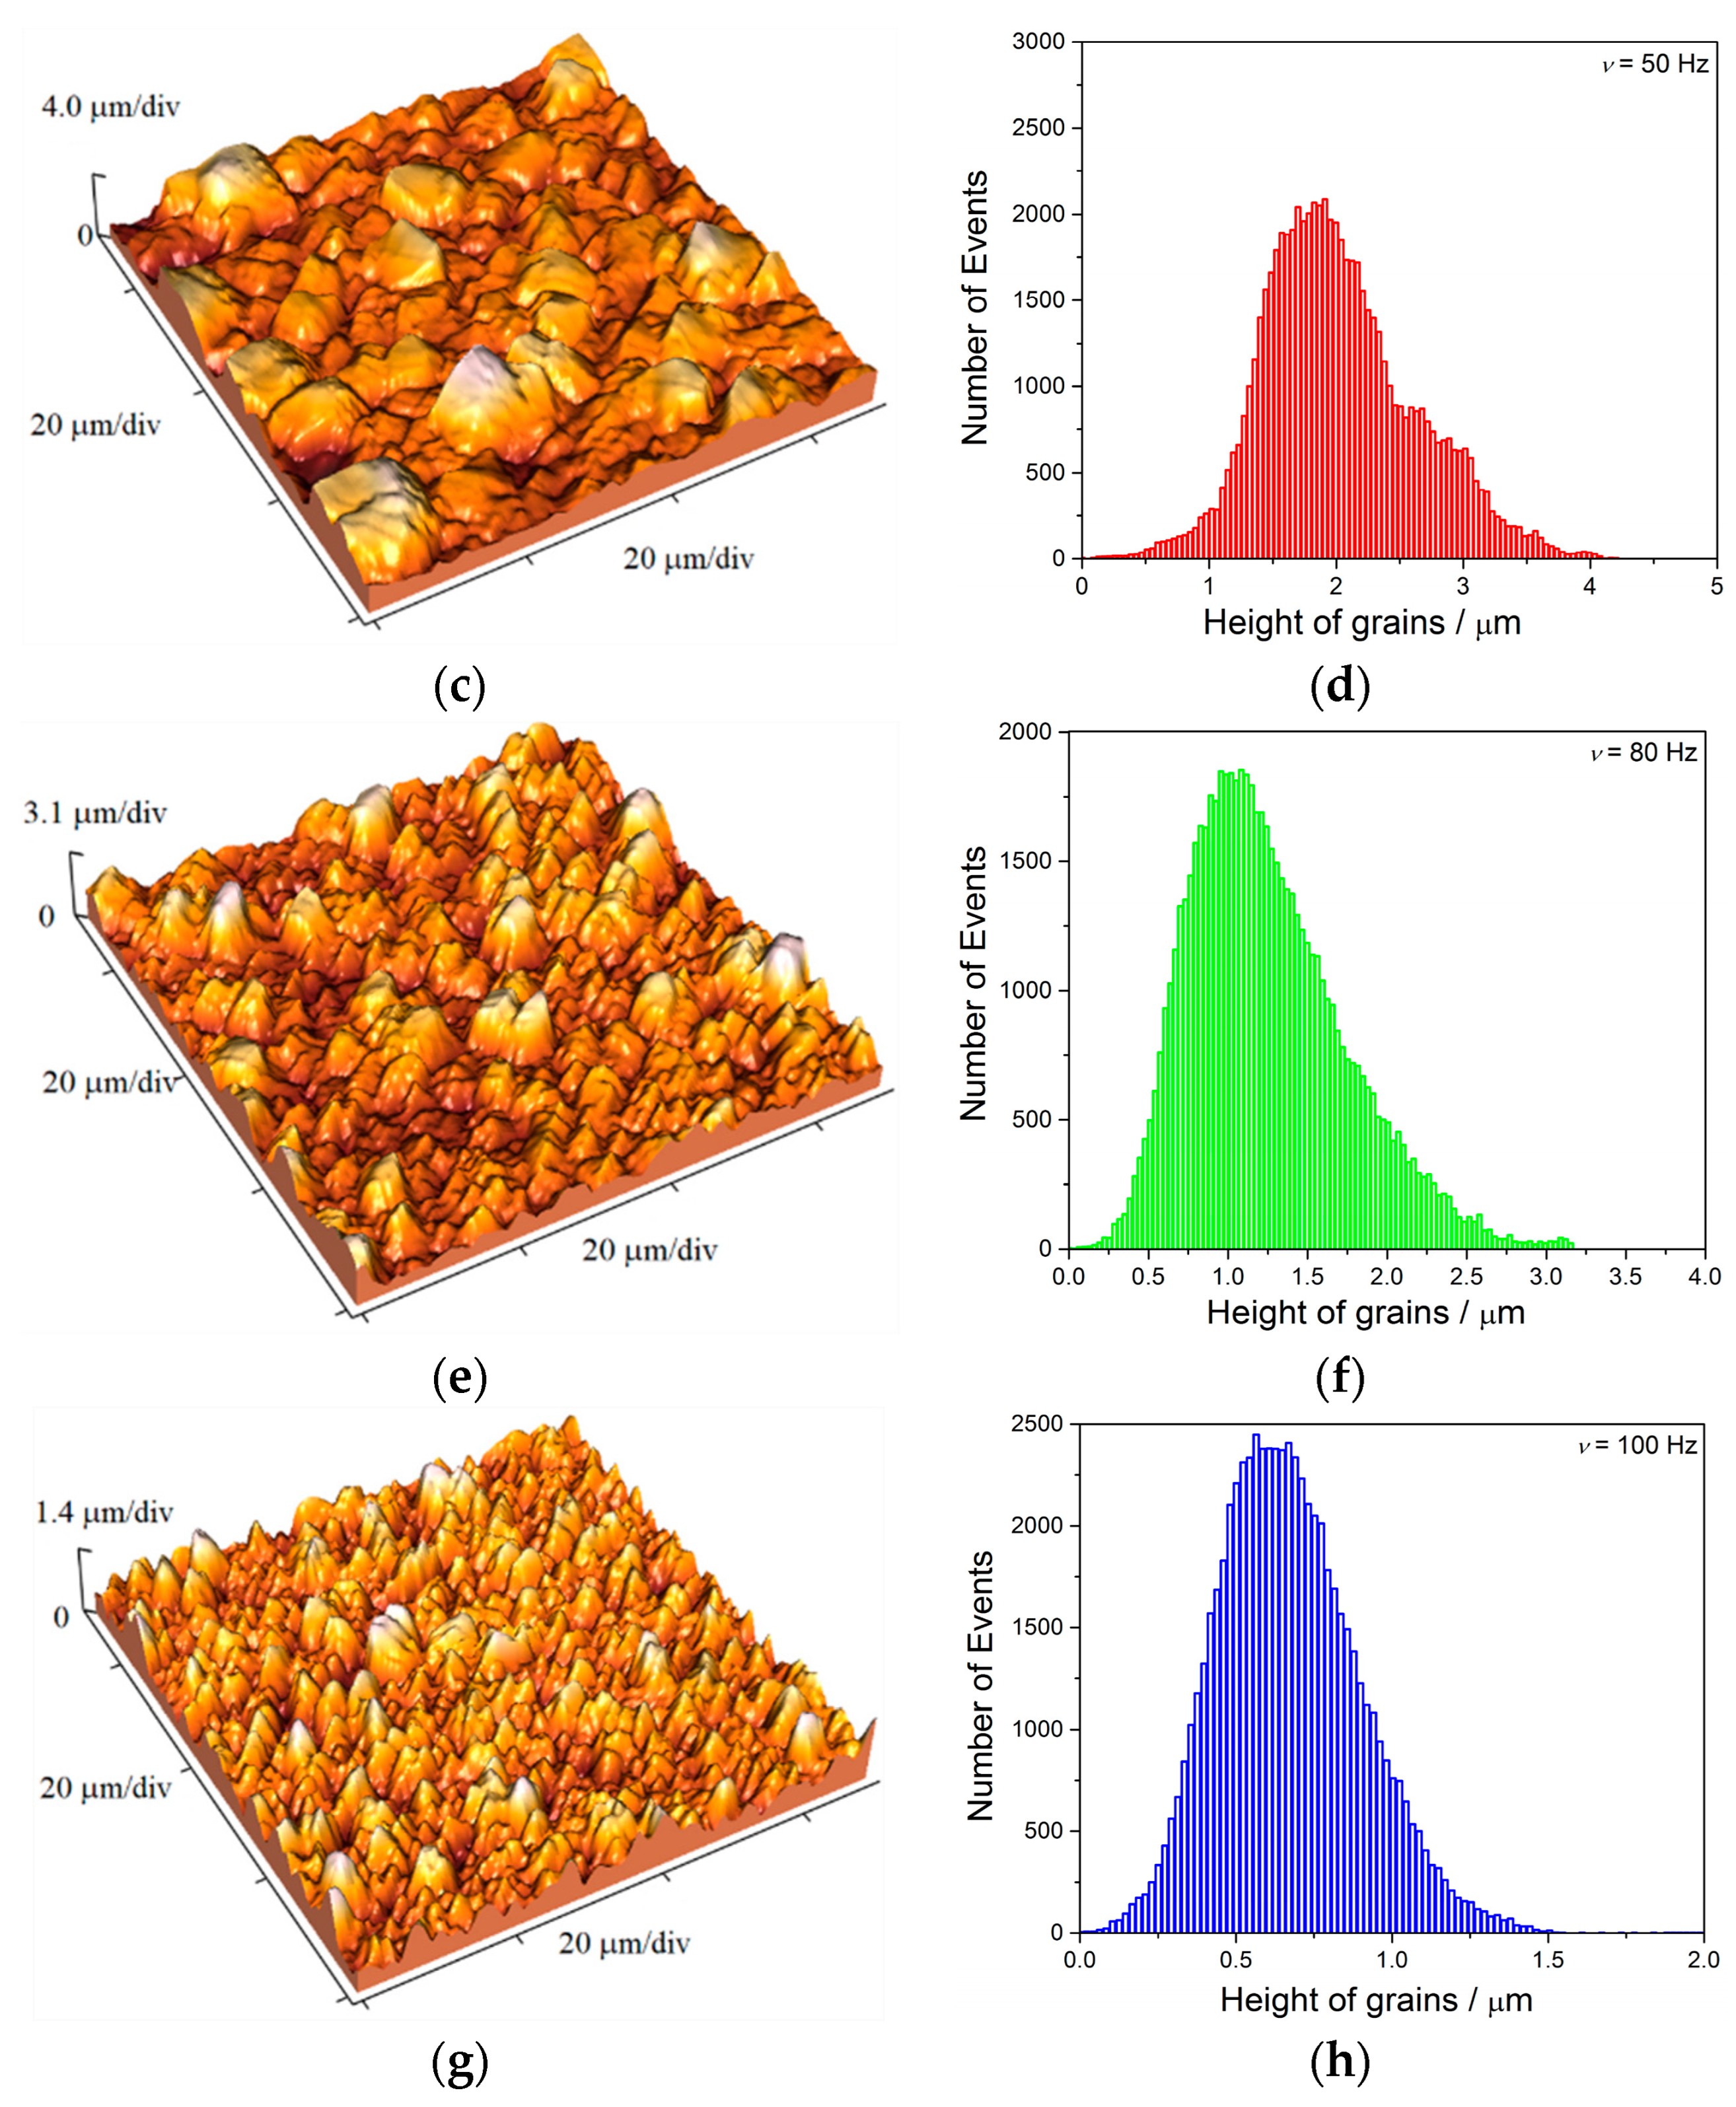
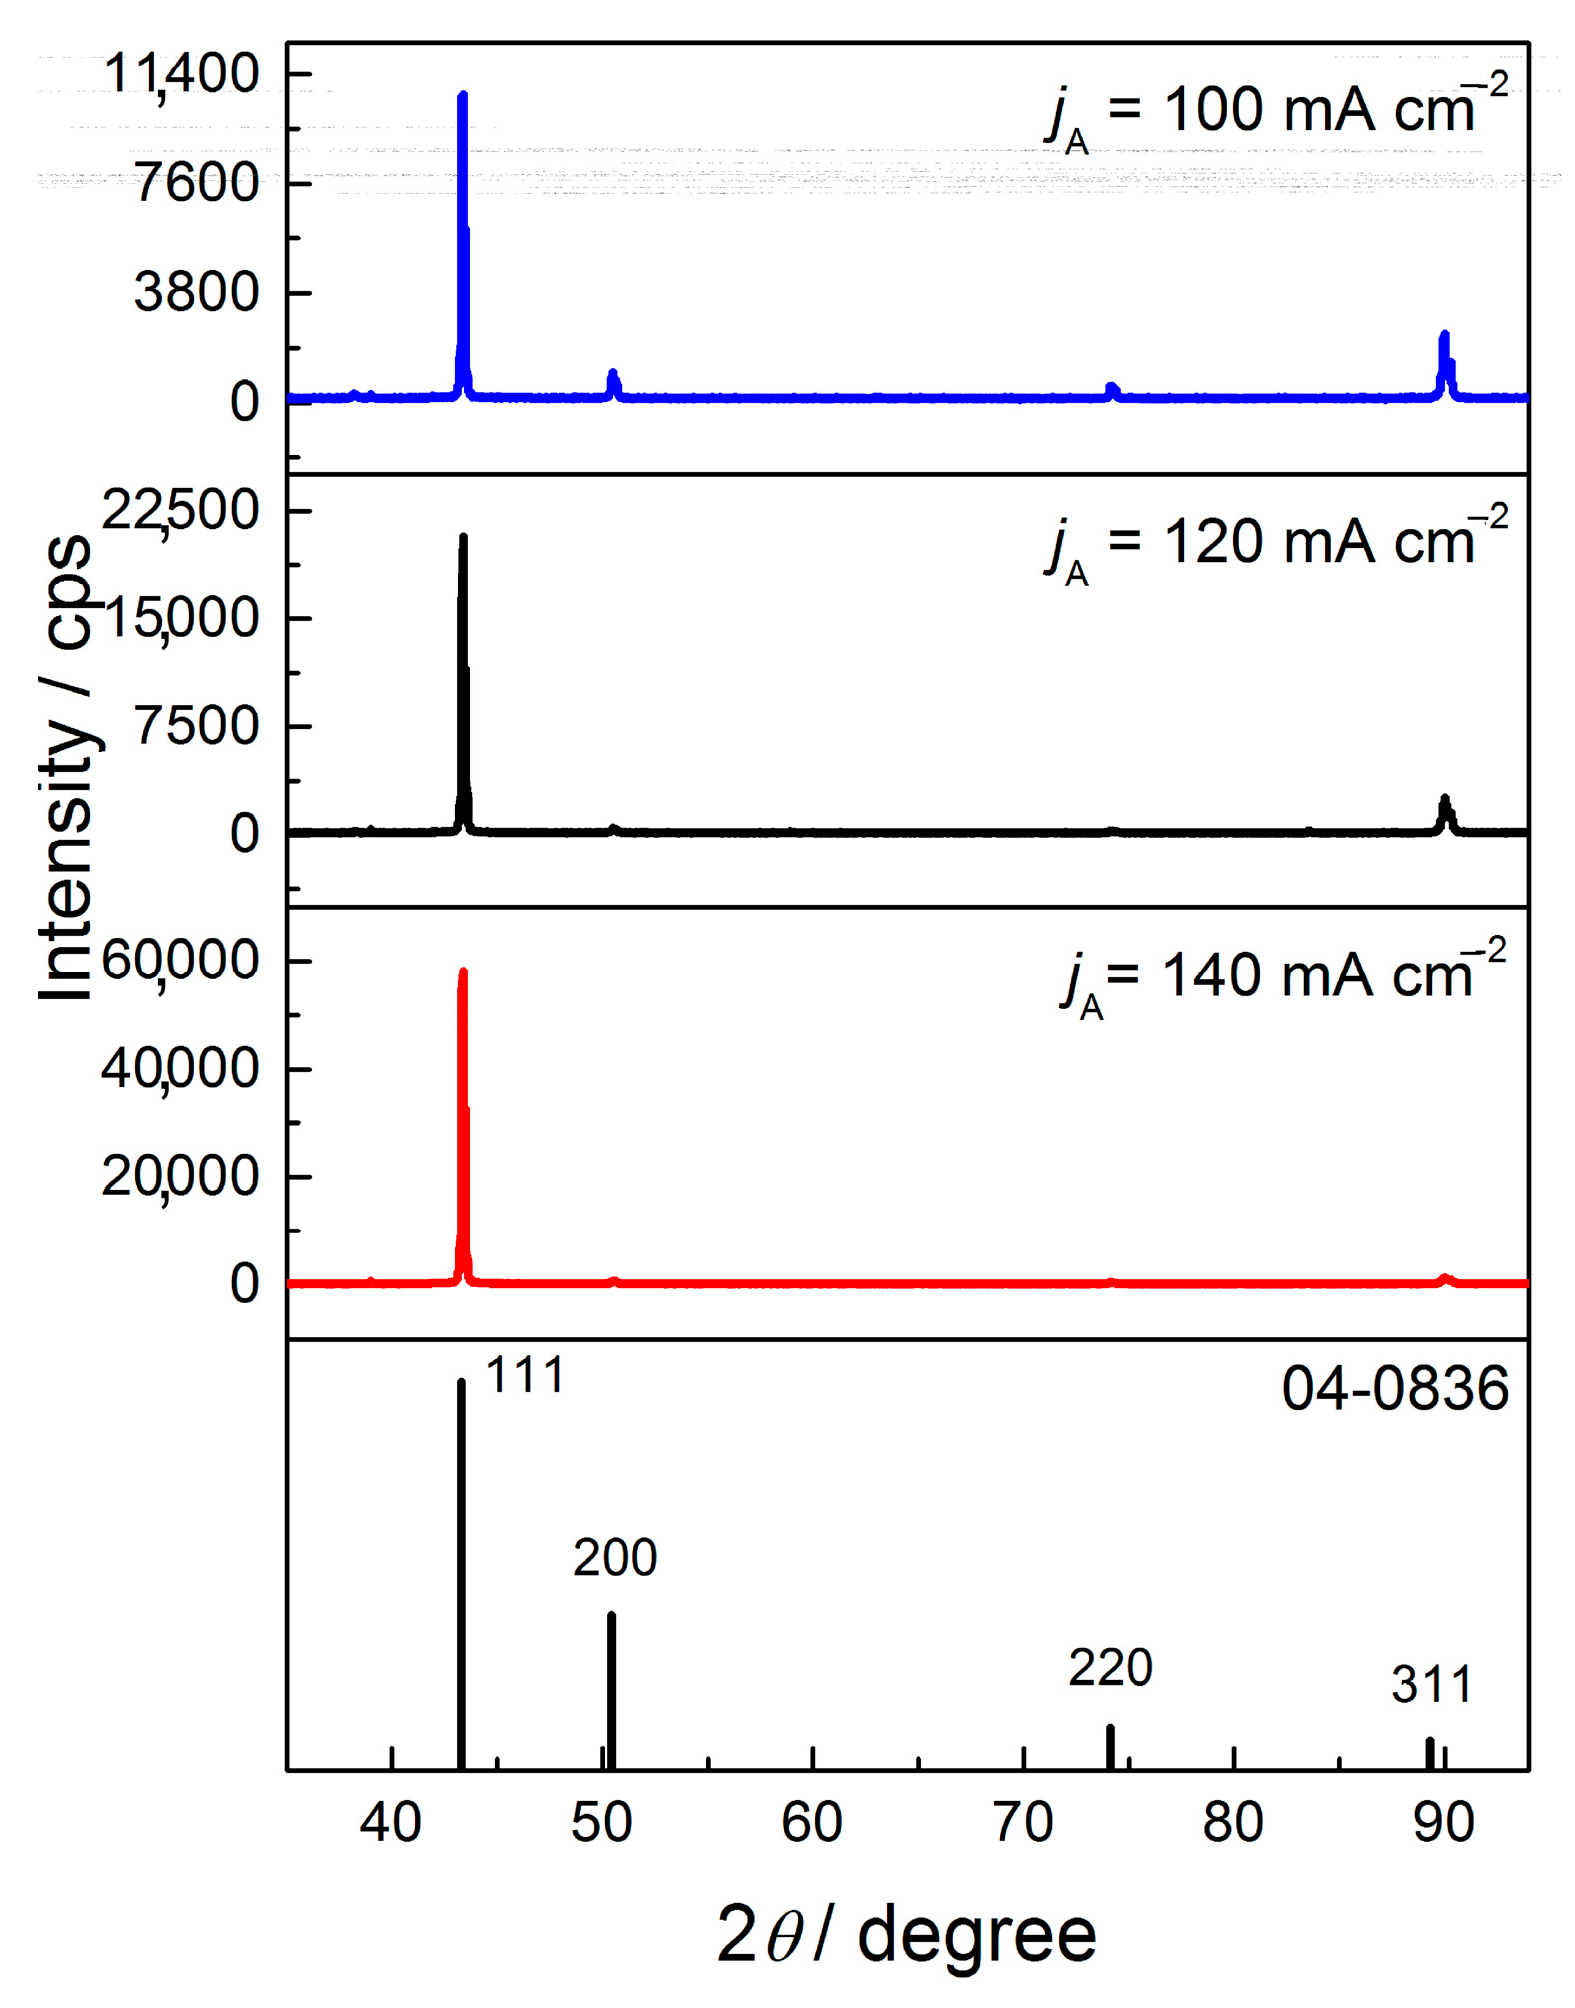
The change in coating morphology is accompanied by change of the preferred orientation from the strong (220) to the strong (111) preferred orientation with the increase of
jav value. This change of the preferred orientation can be explained by different growth rate on different crystal planes [
63]. The rates of growth are associated with the surface energy values of crystal planes
γ and for the FCC type of crystal lattice following the trend
γ111 <
γ100 <
γ311 <
γ110 [
64,
65]. Following the values of surface energy, the electrodeposition rate is the smallest on the (111) crystal plane, and for that reason, the (111) plane represents “slow-growing crystal plane” surviving the electrochemical deposition process [
66]. All other crystal planes, i.e., (100), (311) and (110) planes, are the “fast-growing crystal planes” and they disappear firstly during electrochemical deposition process. In this case, with an intensification of the electrodeposition process, i.e., with increasing the average current density from 15 to 70 mA cm
−2, it increases a share of Cu crystallites oriented in the (111) crystal plane, while it decreases a share of crystallites in all other crystal planes, especially in (220) crystal plane (
Figure 18 and
Figure 21, and
Table 5,
Table 6 and
Table 7).
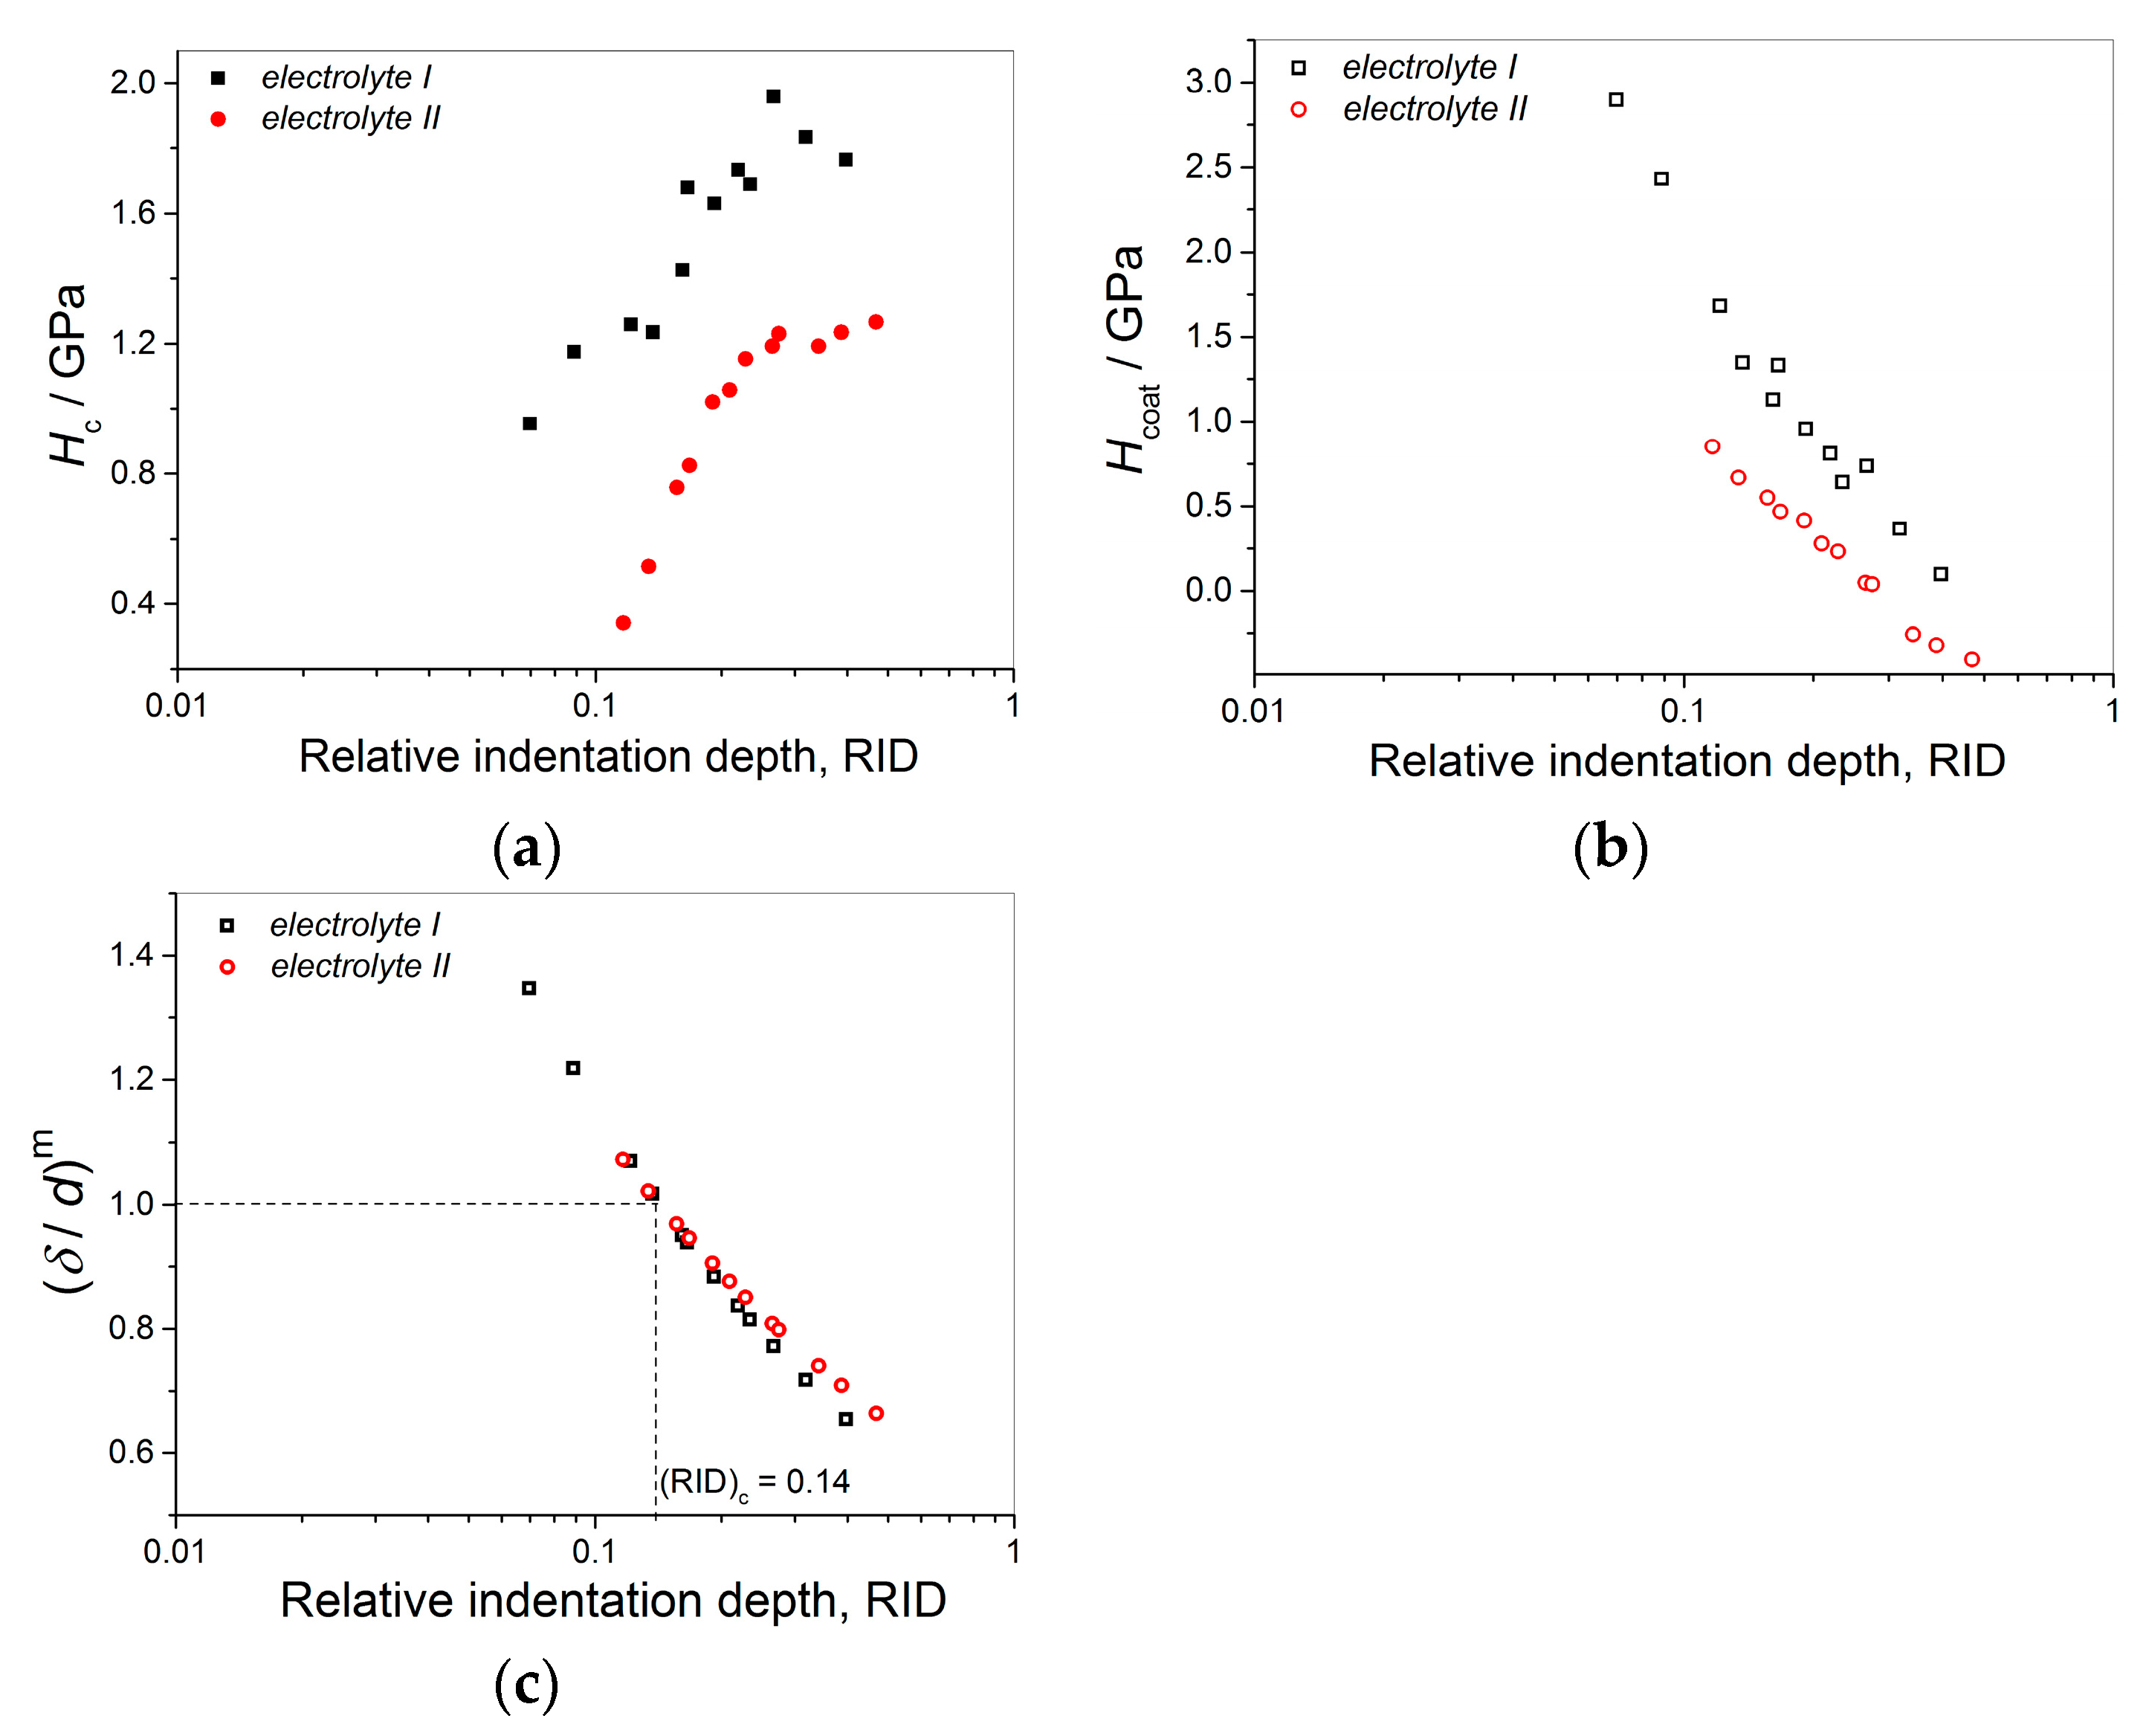
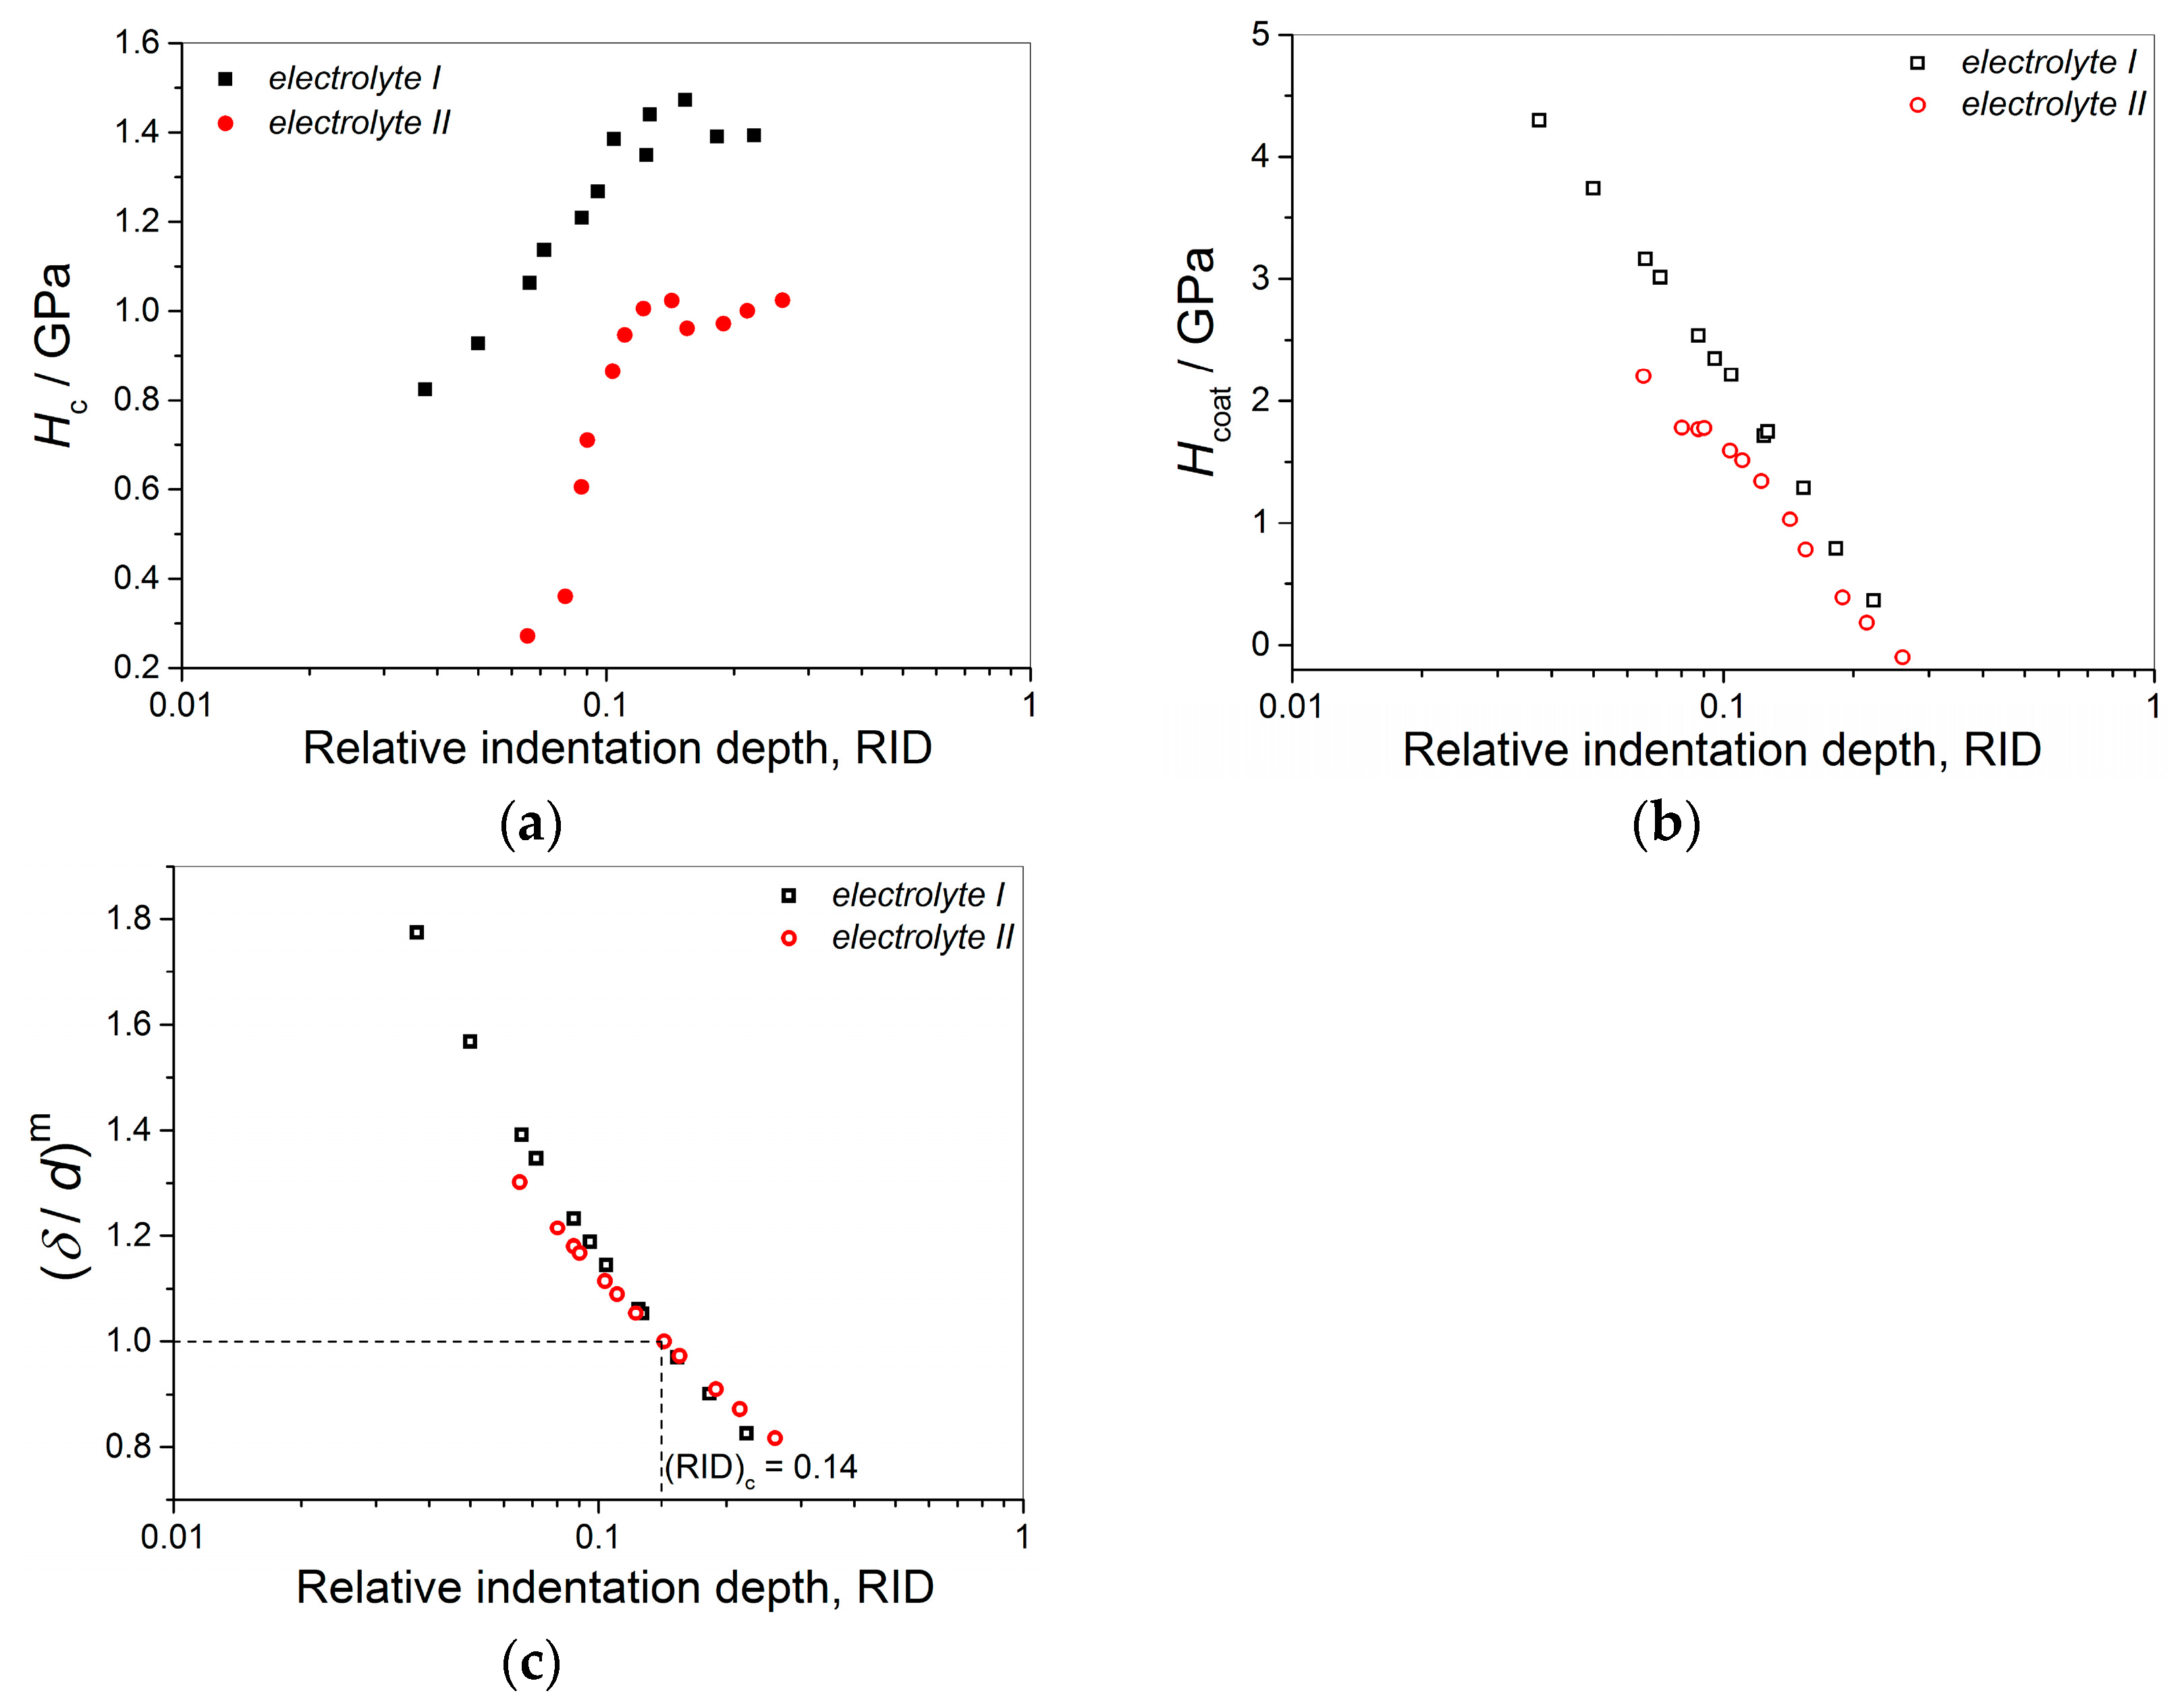
The mat Cu coatings produced from the basic sulfate electrolyte (
electrolyte I) showed larger coating hardness than mirror bright Cu coatings produced in the presence of leveling/brightening additives (
electrolyte II). The processes occurring on boundary among grains are responsible for this difference [
12]. Namely, mat coatings have fine-grained structure with numerous boundaries among grains. The boundaries among grains are a disruption sites for a dislocation motion, and they prevent a movement of the dislocations [
46,
67]. It can be said that the boundaries among grains behave as mini resistors which resist during indentation in the metal coating. On the other hand, mirror bright Cu coatings were very smooth, without clear boundary among grains, and dislocation motion is a dominant mechanism affecting the coating hardness.
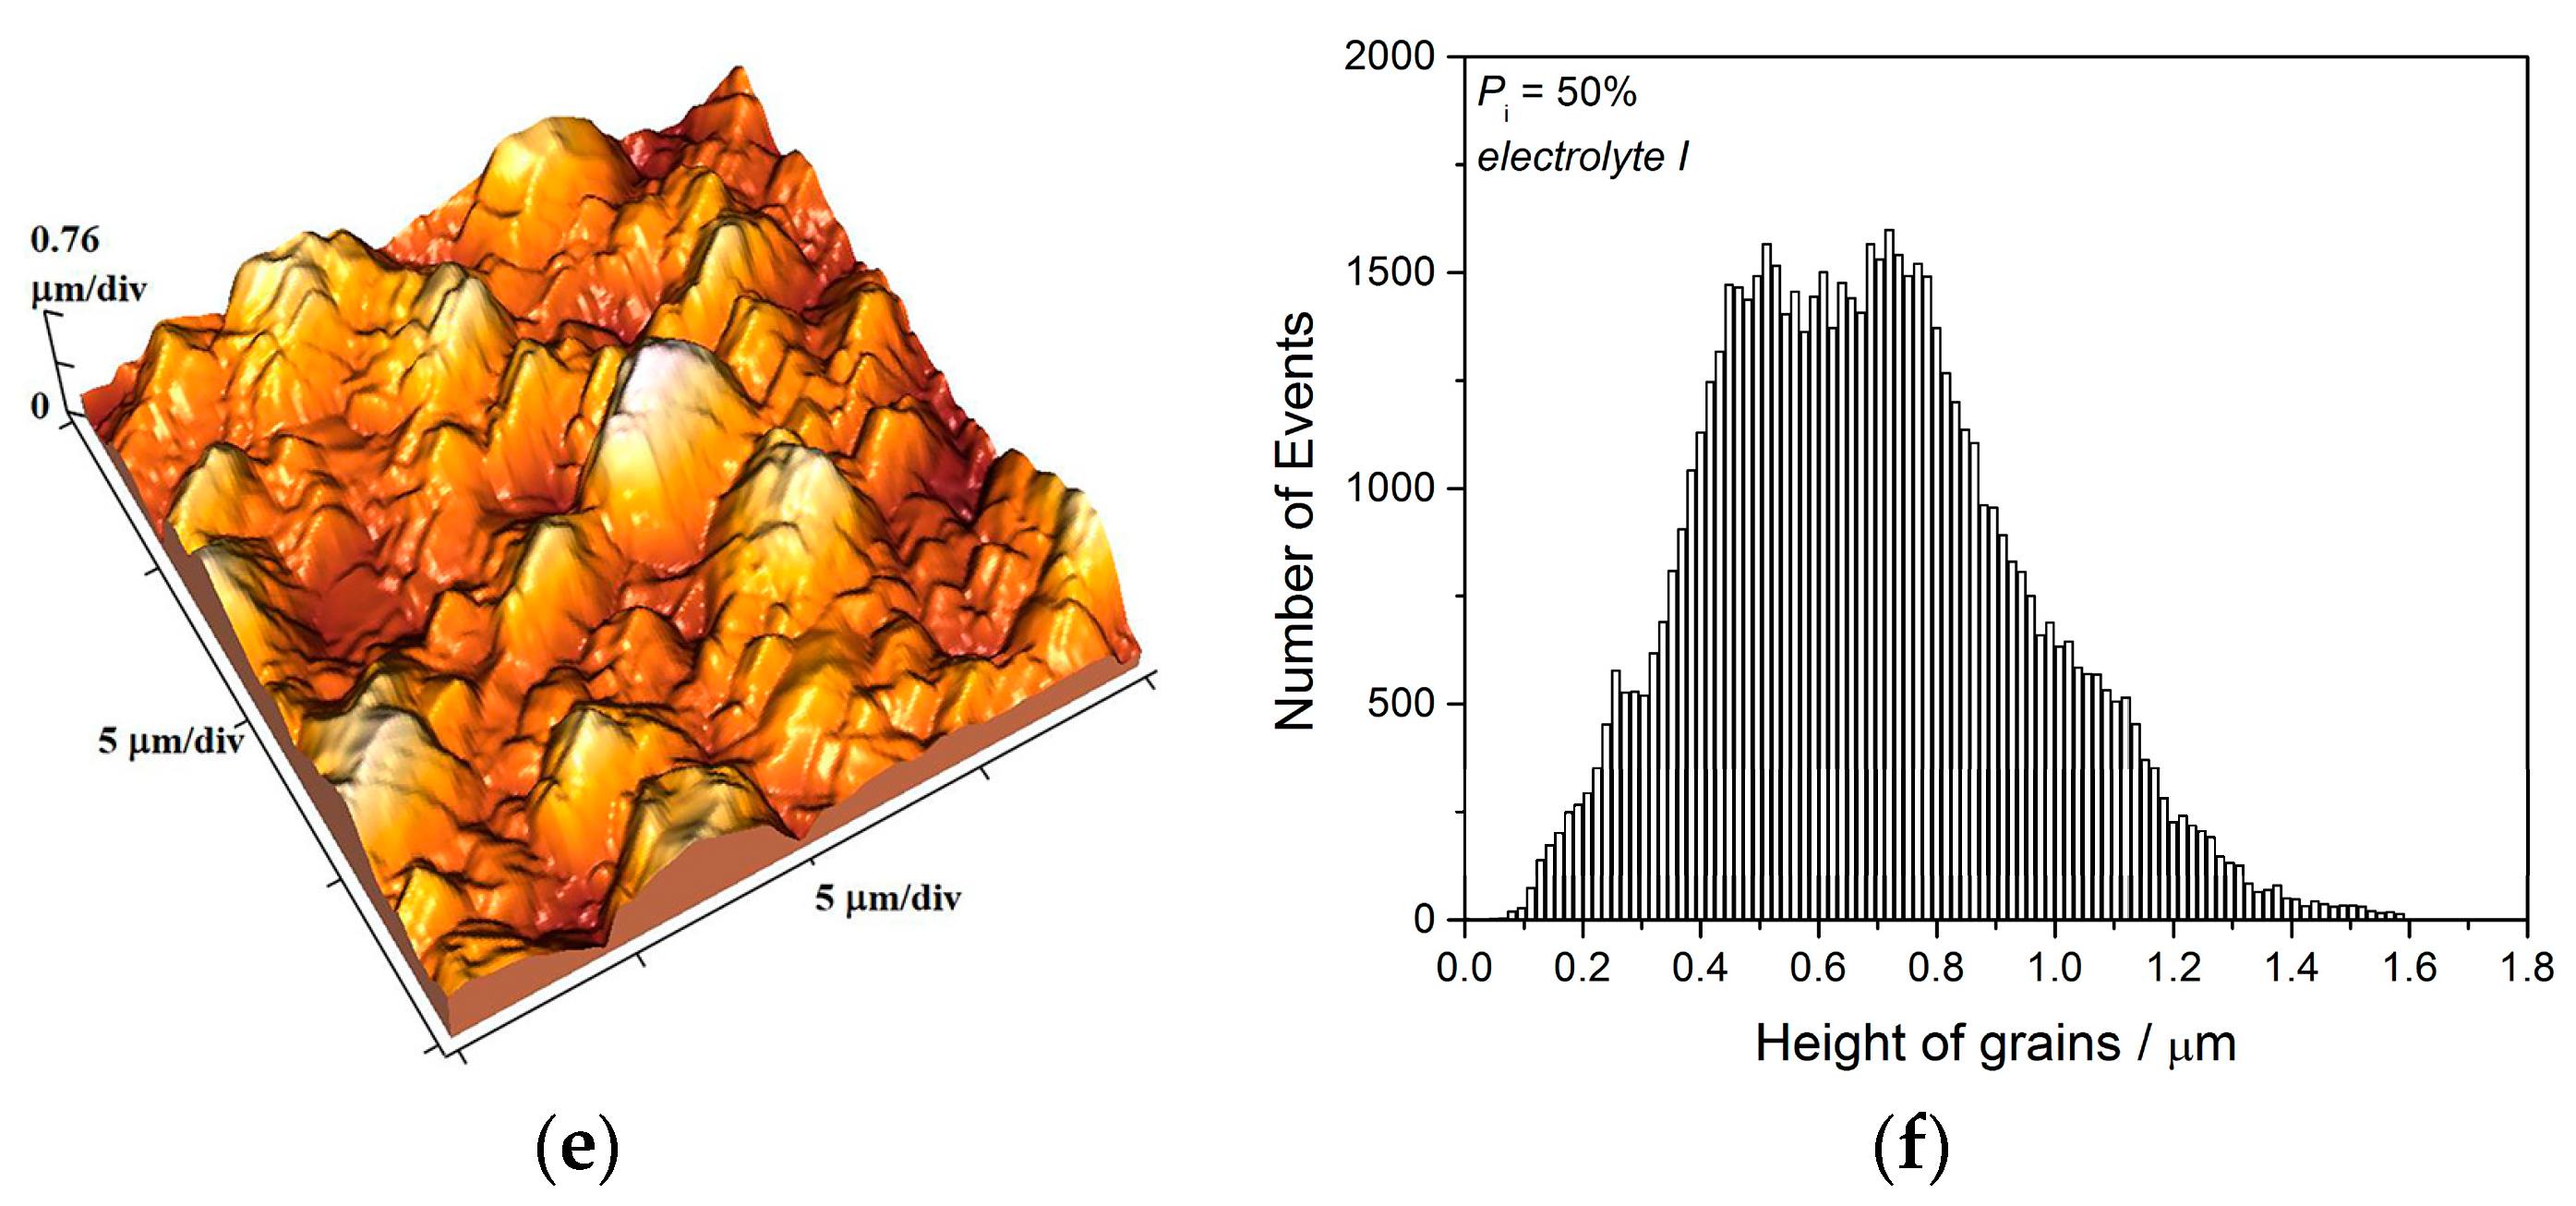
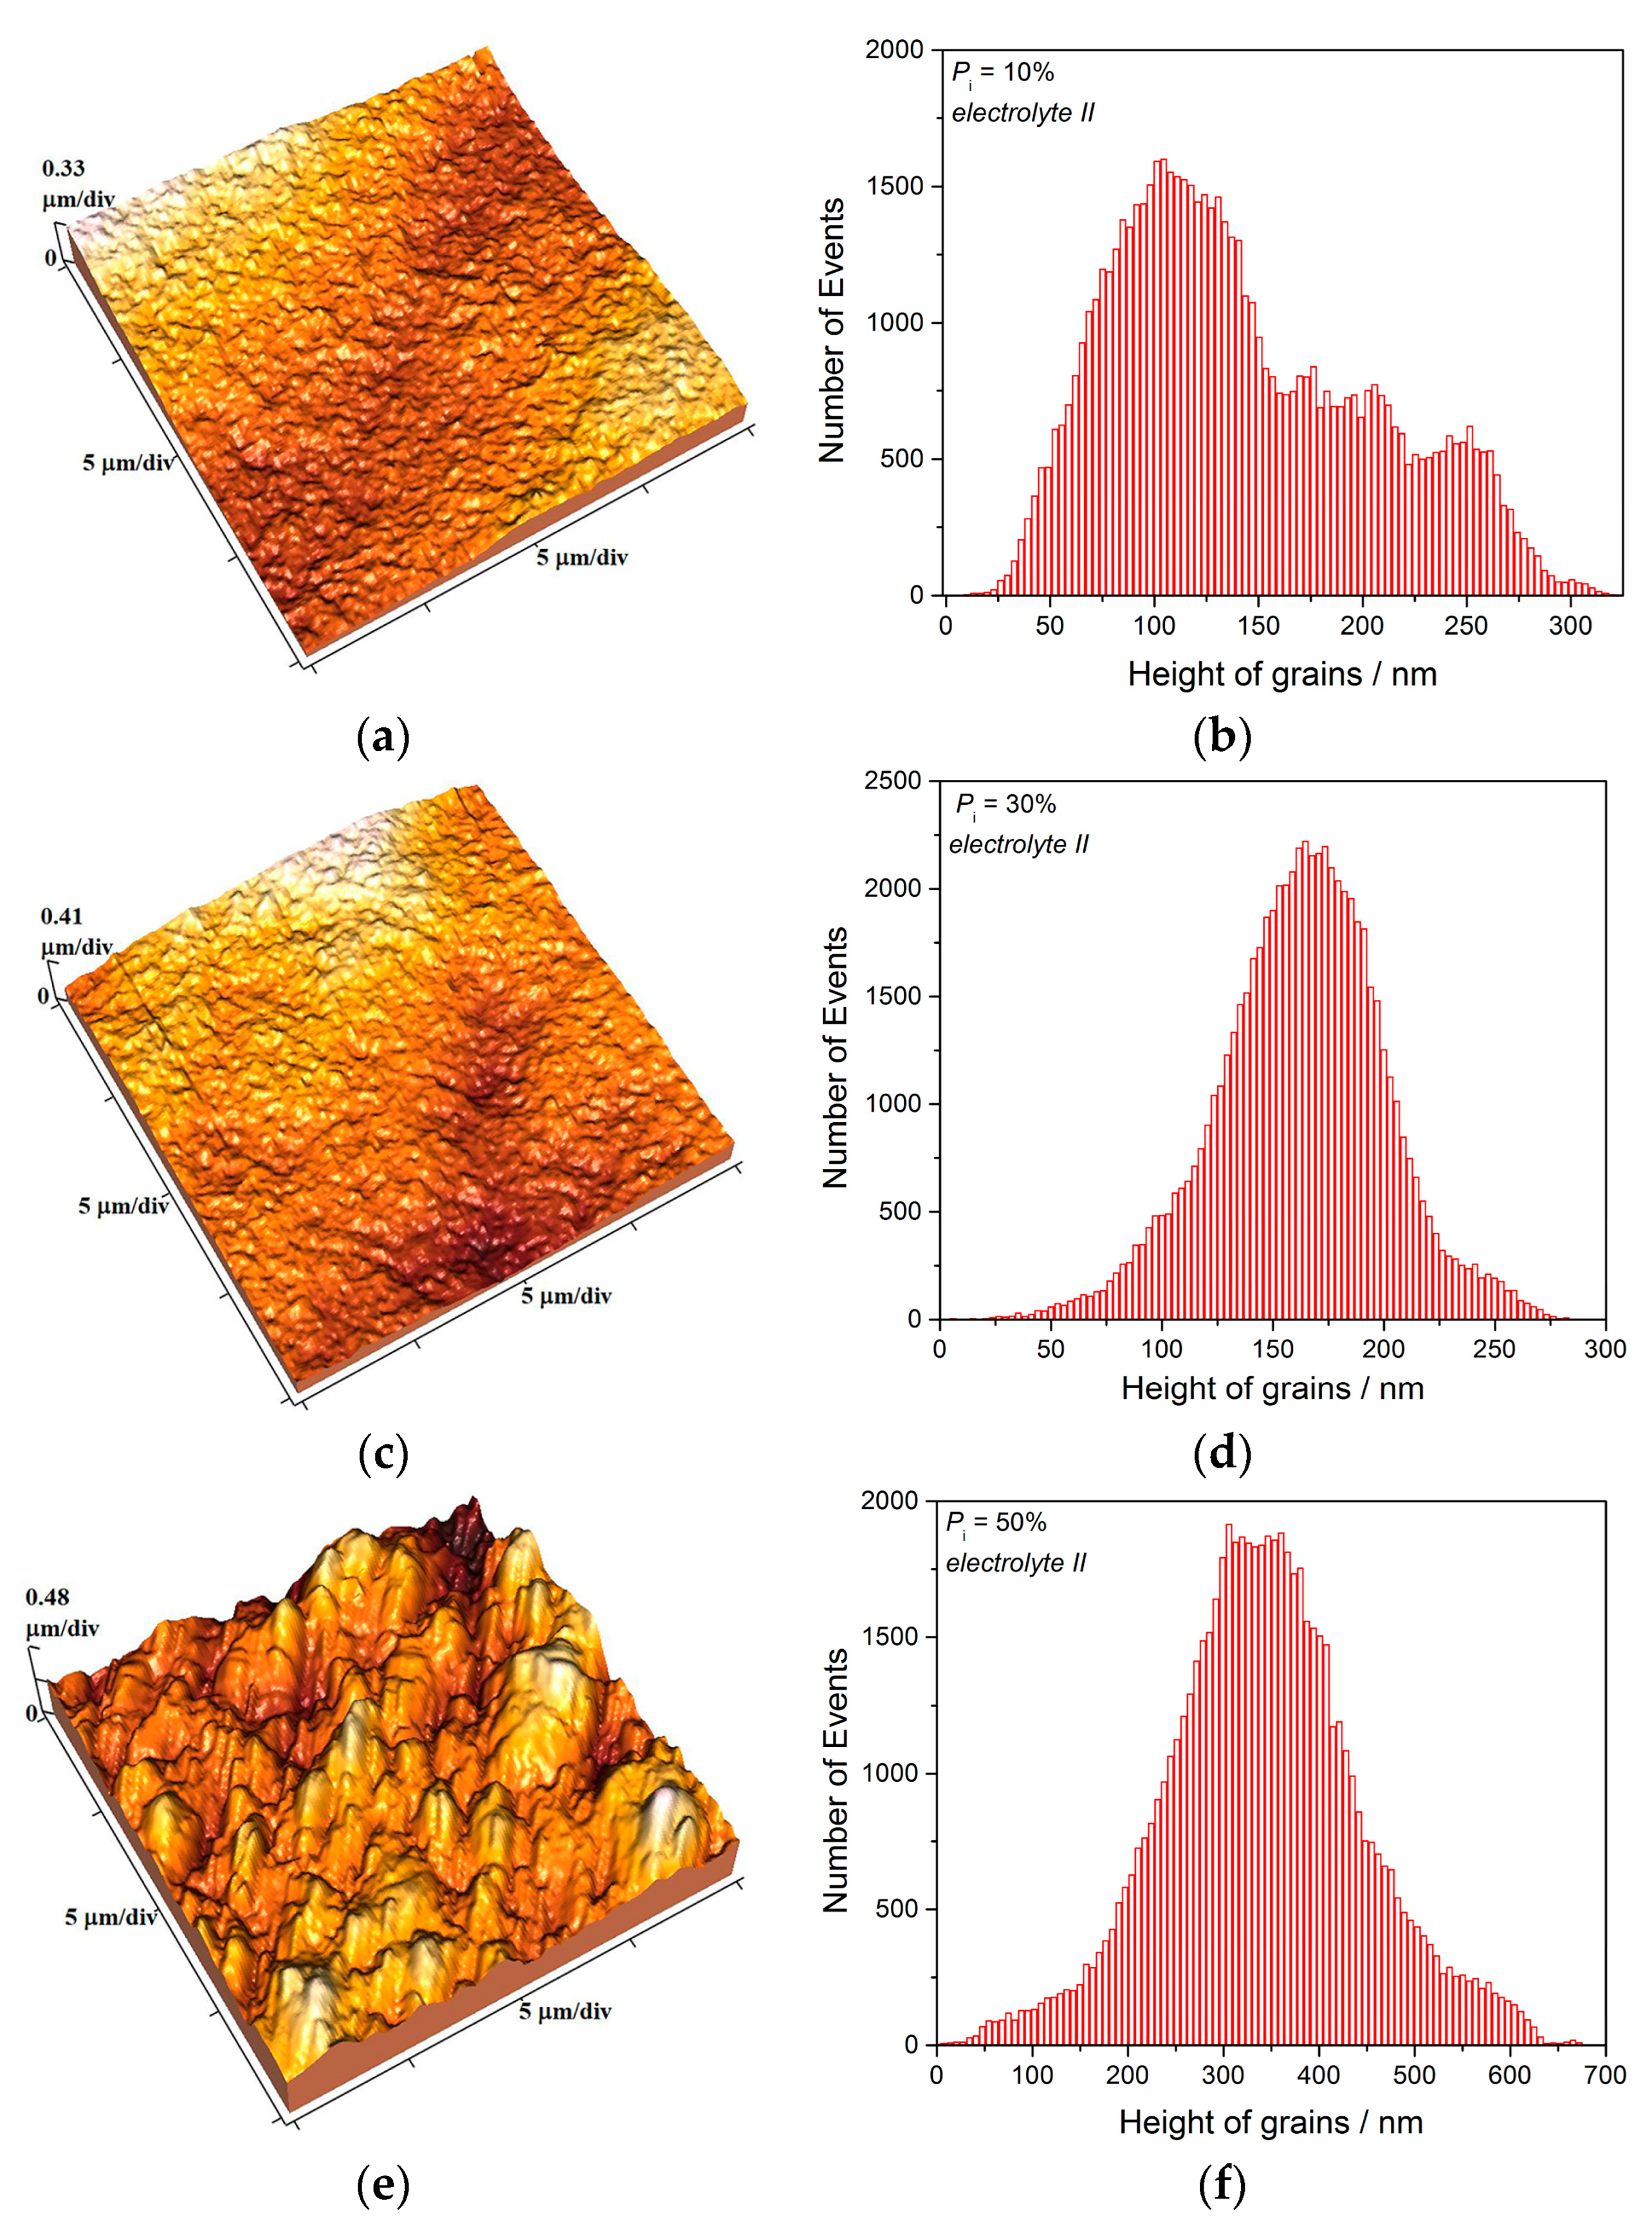
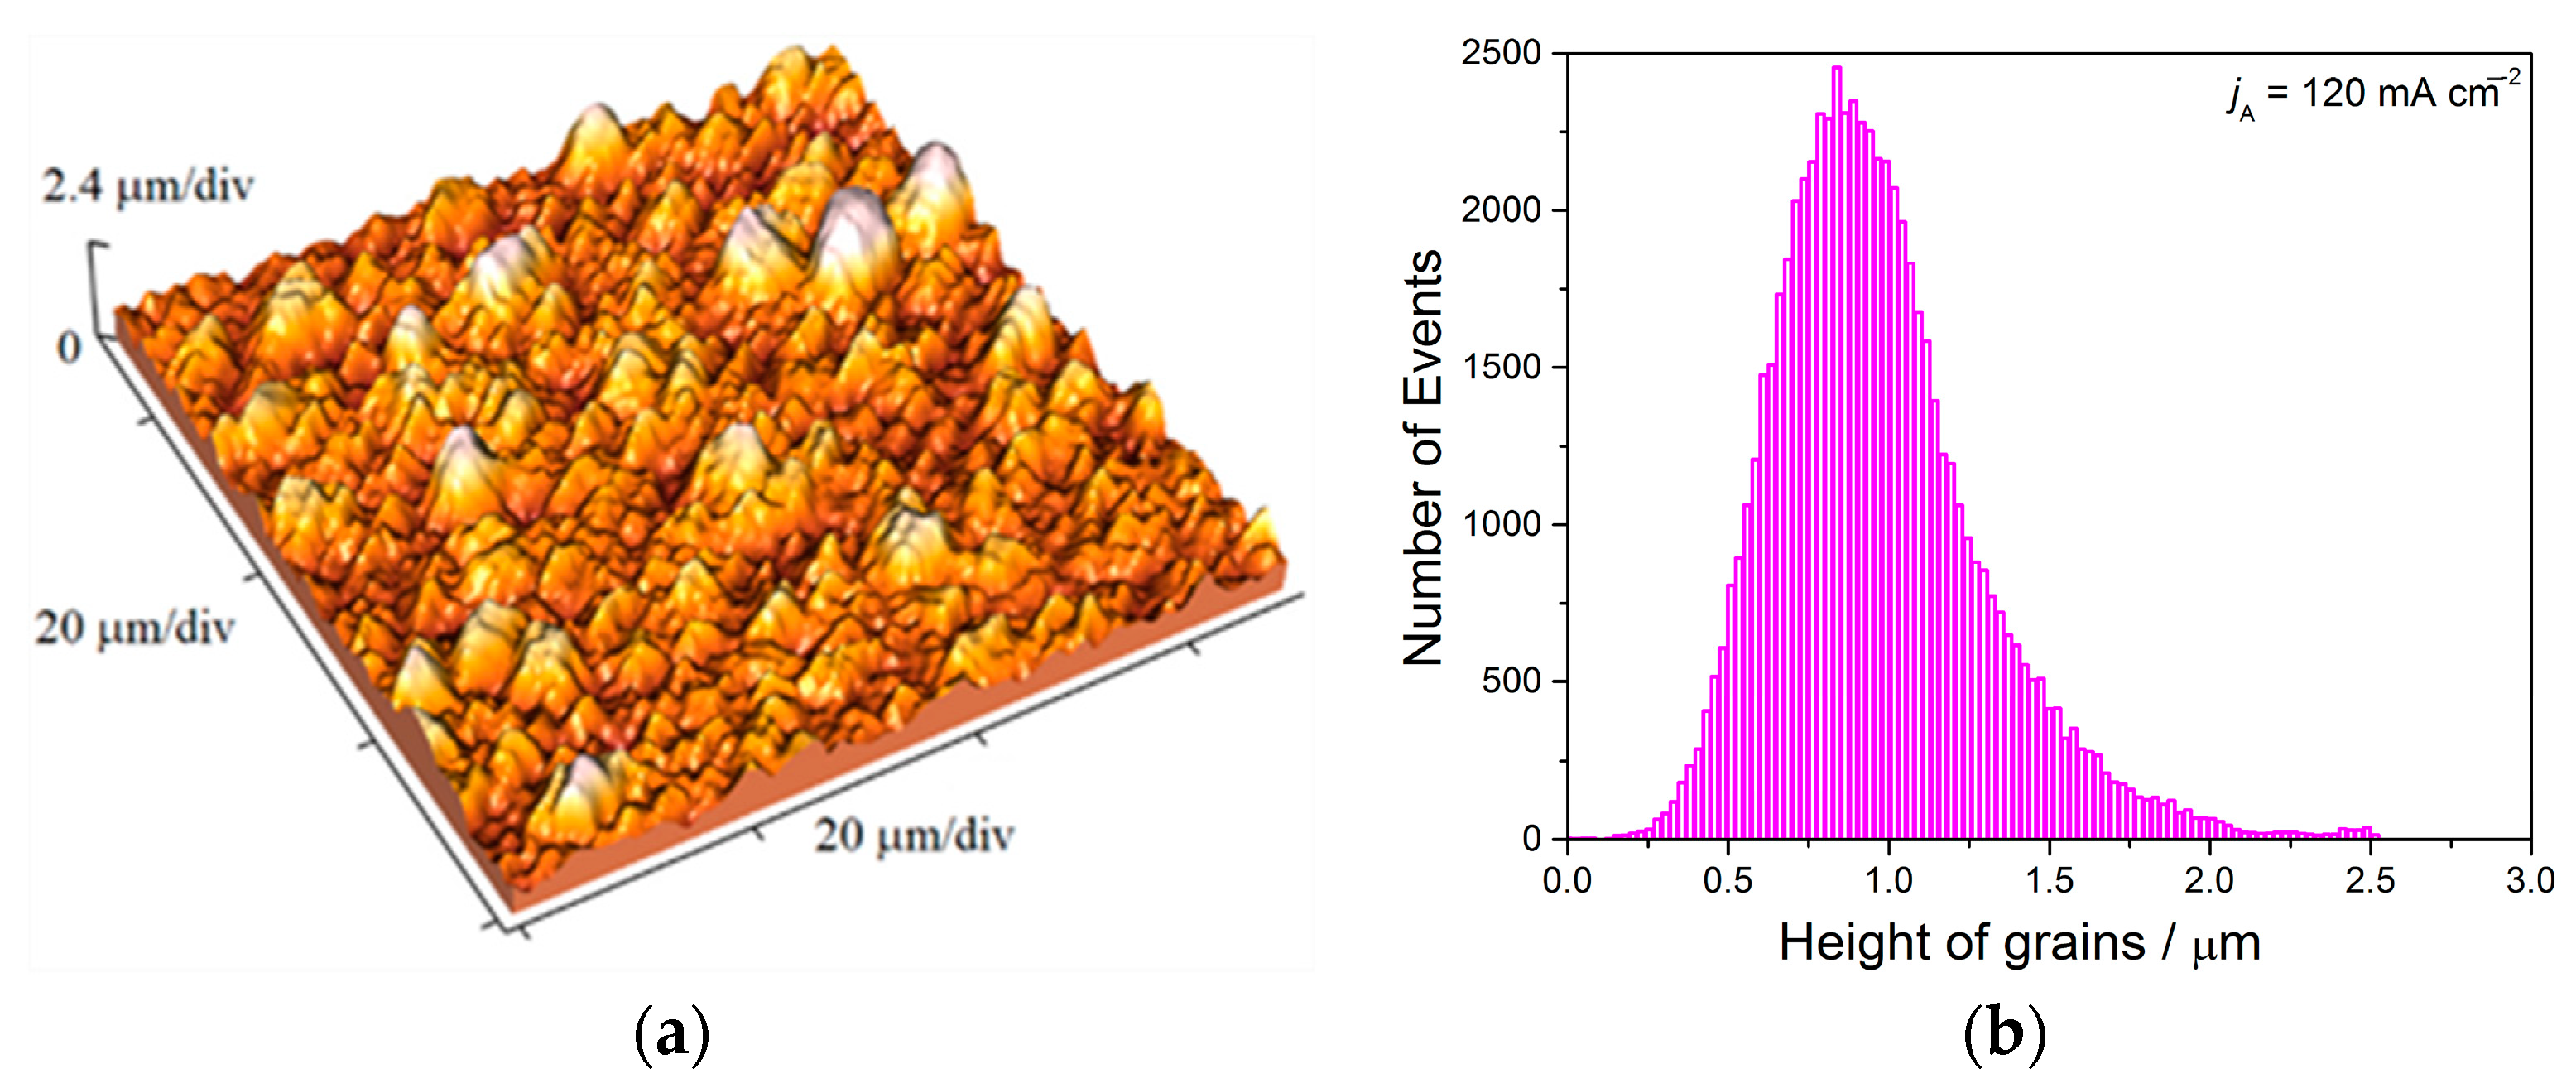
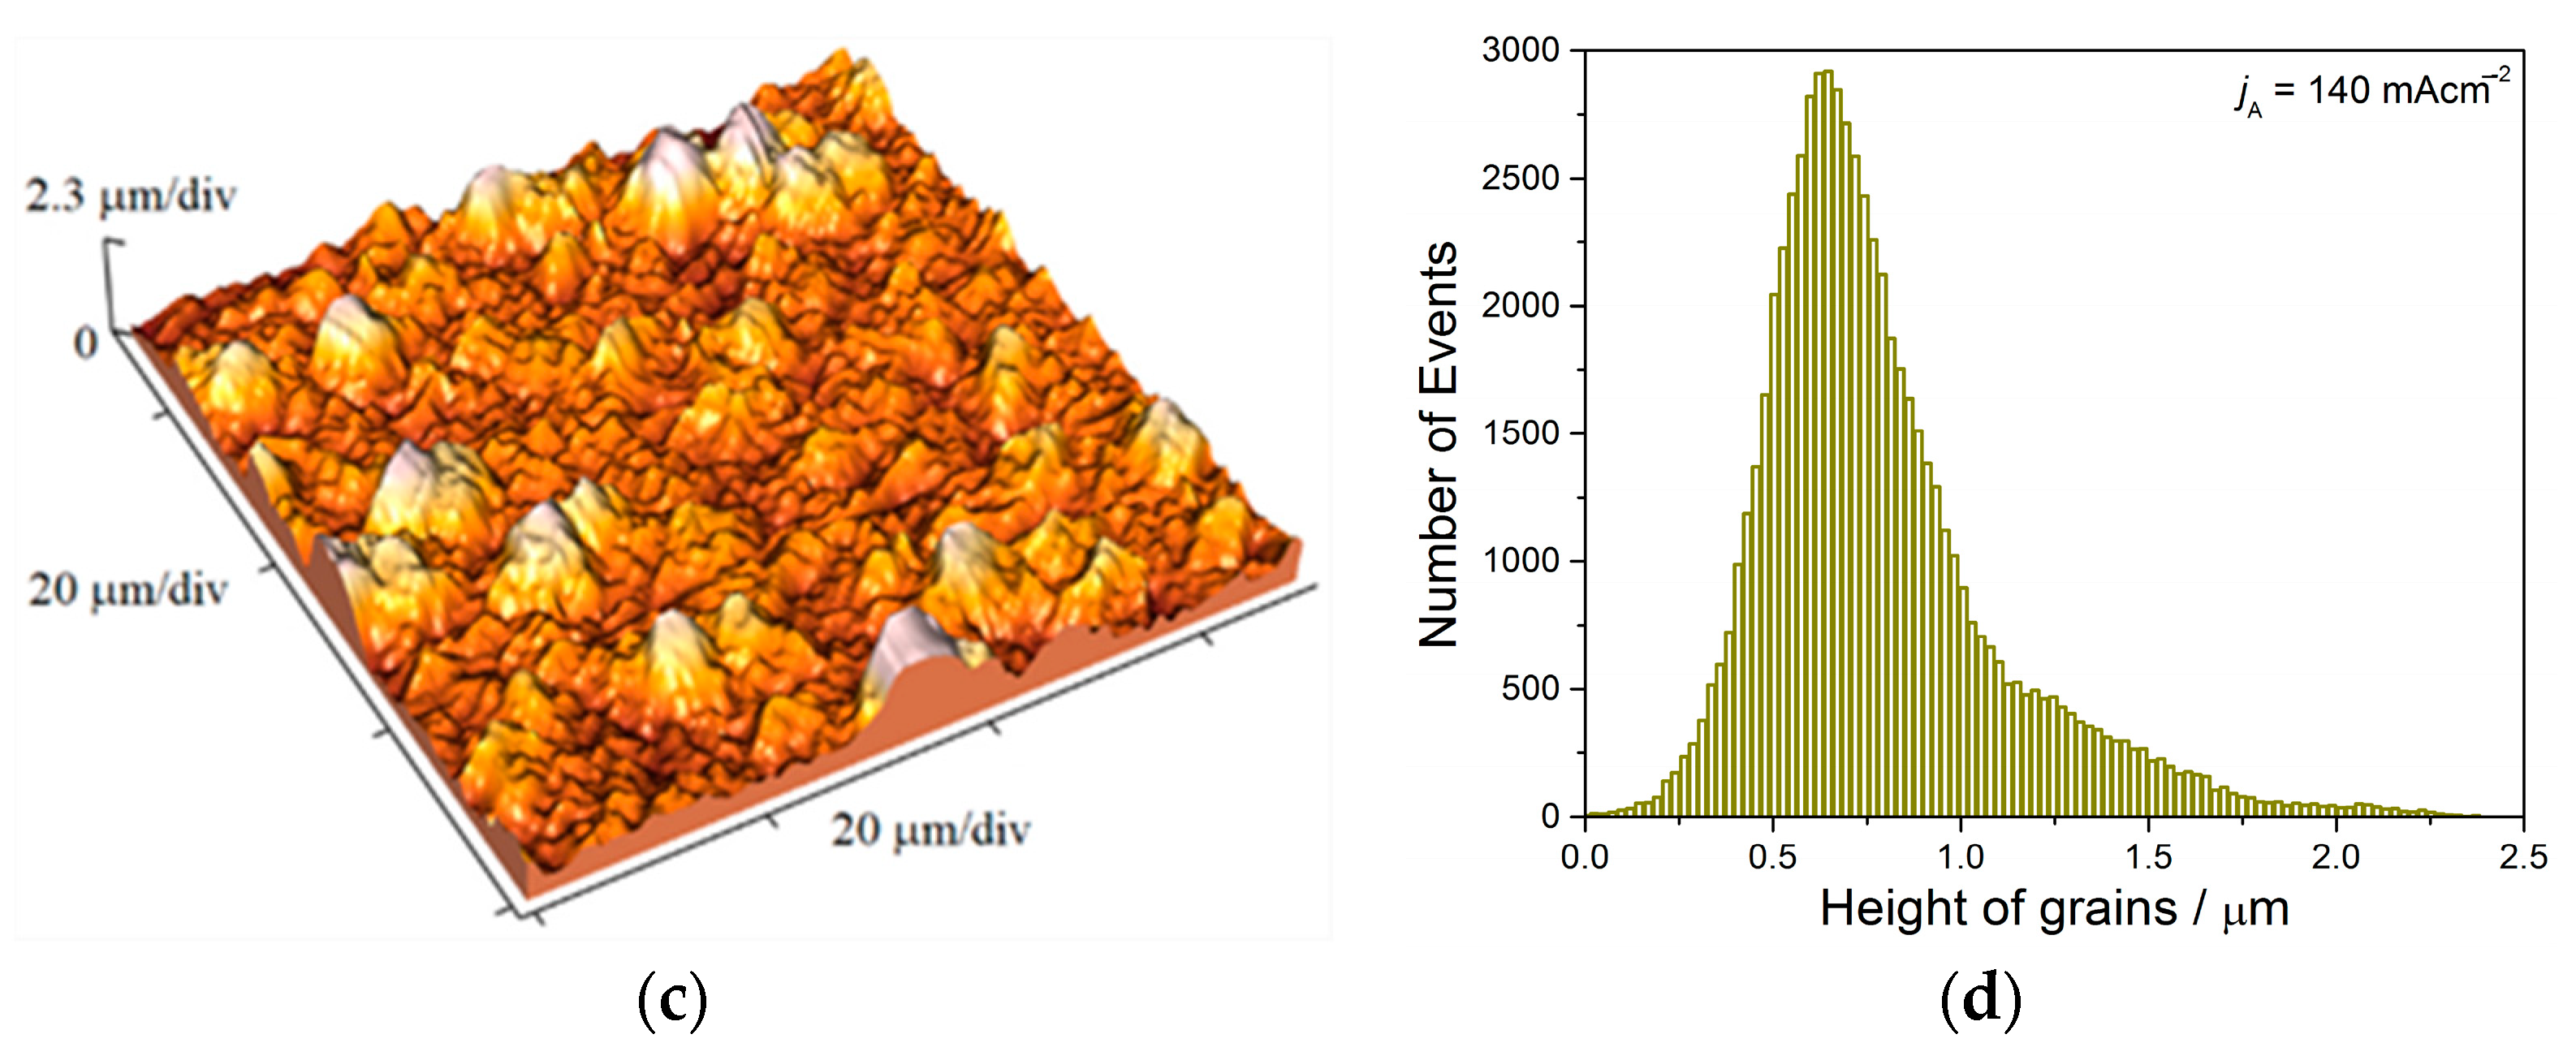
Analysis of histograms for the coatings electrodeposited from
electrolyte I by both DC and PC regimes clearly revealed their microcrystalline (mc) character, and for them, Hall-Patch equation [
68] predicting an increase of coating hardness with a decrease of grain size is valid. On the other hand, the histogram analysis of smooth mirror bright coatings revealed their nanocrystalline (nc) character with size of grains below critical value for a validity of Hall-Patch equation, and for these coatings, the inverse Hall-Petch equation begins to hold [
69].
The values of both composite and calculated coating hardness on Si(111) were larger than the values obtained on the brass cathode, what clearly indicate that a determination of coating hardness is complex phenomena depending on many factors, such as the indenter geometry, plastic pile-up effect, film/substrate adhesion, elastic properties of the film and substrate and the friction between the indenter and film [
70,
71,
72,
73,
74,
75,
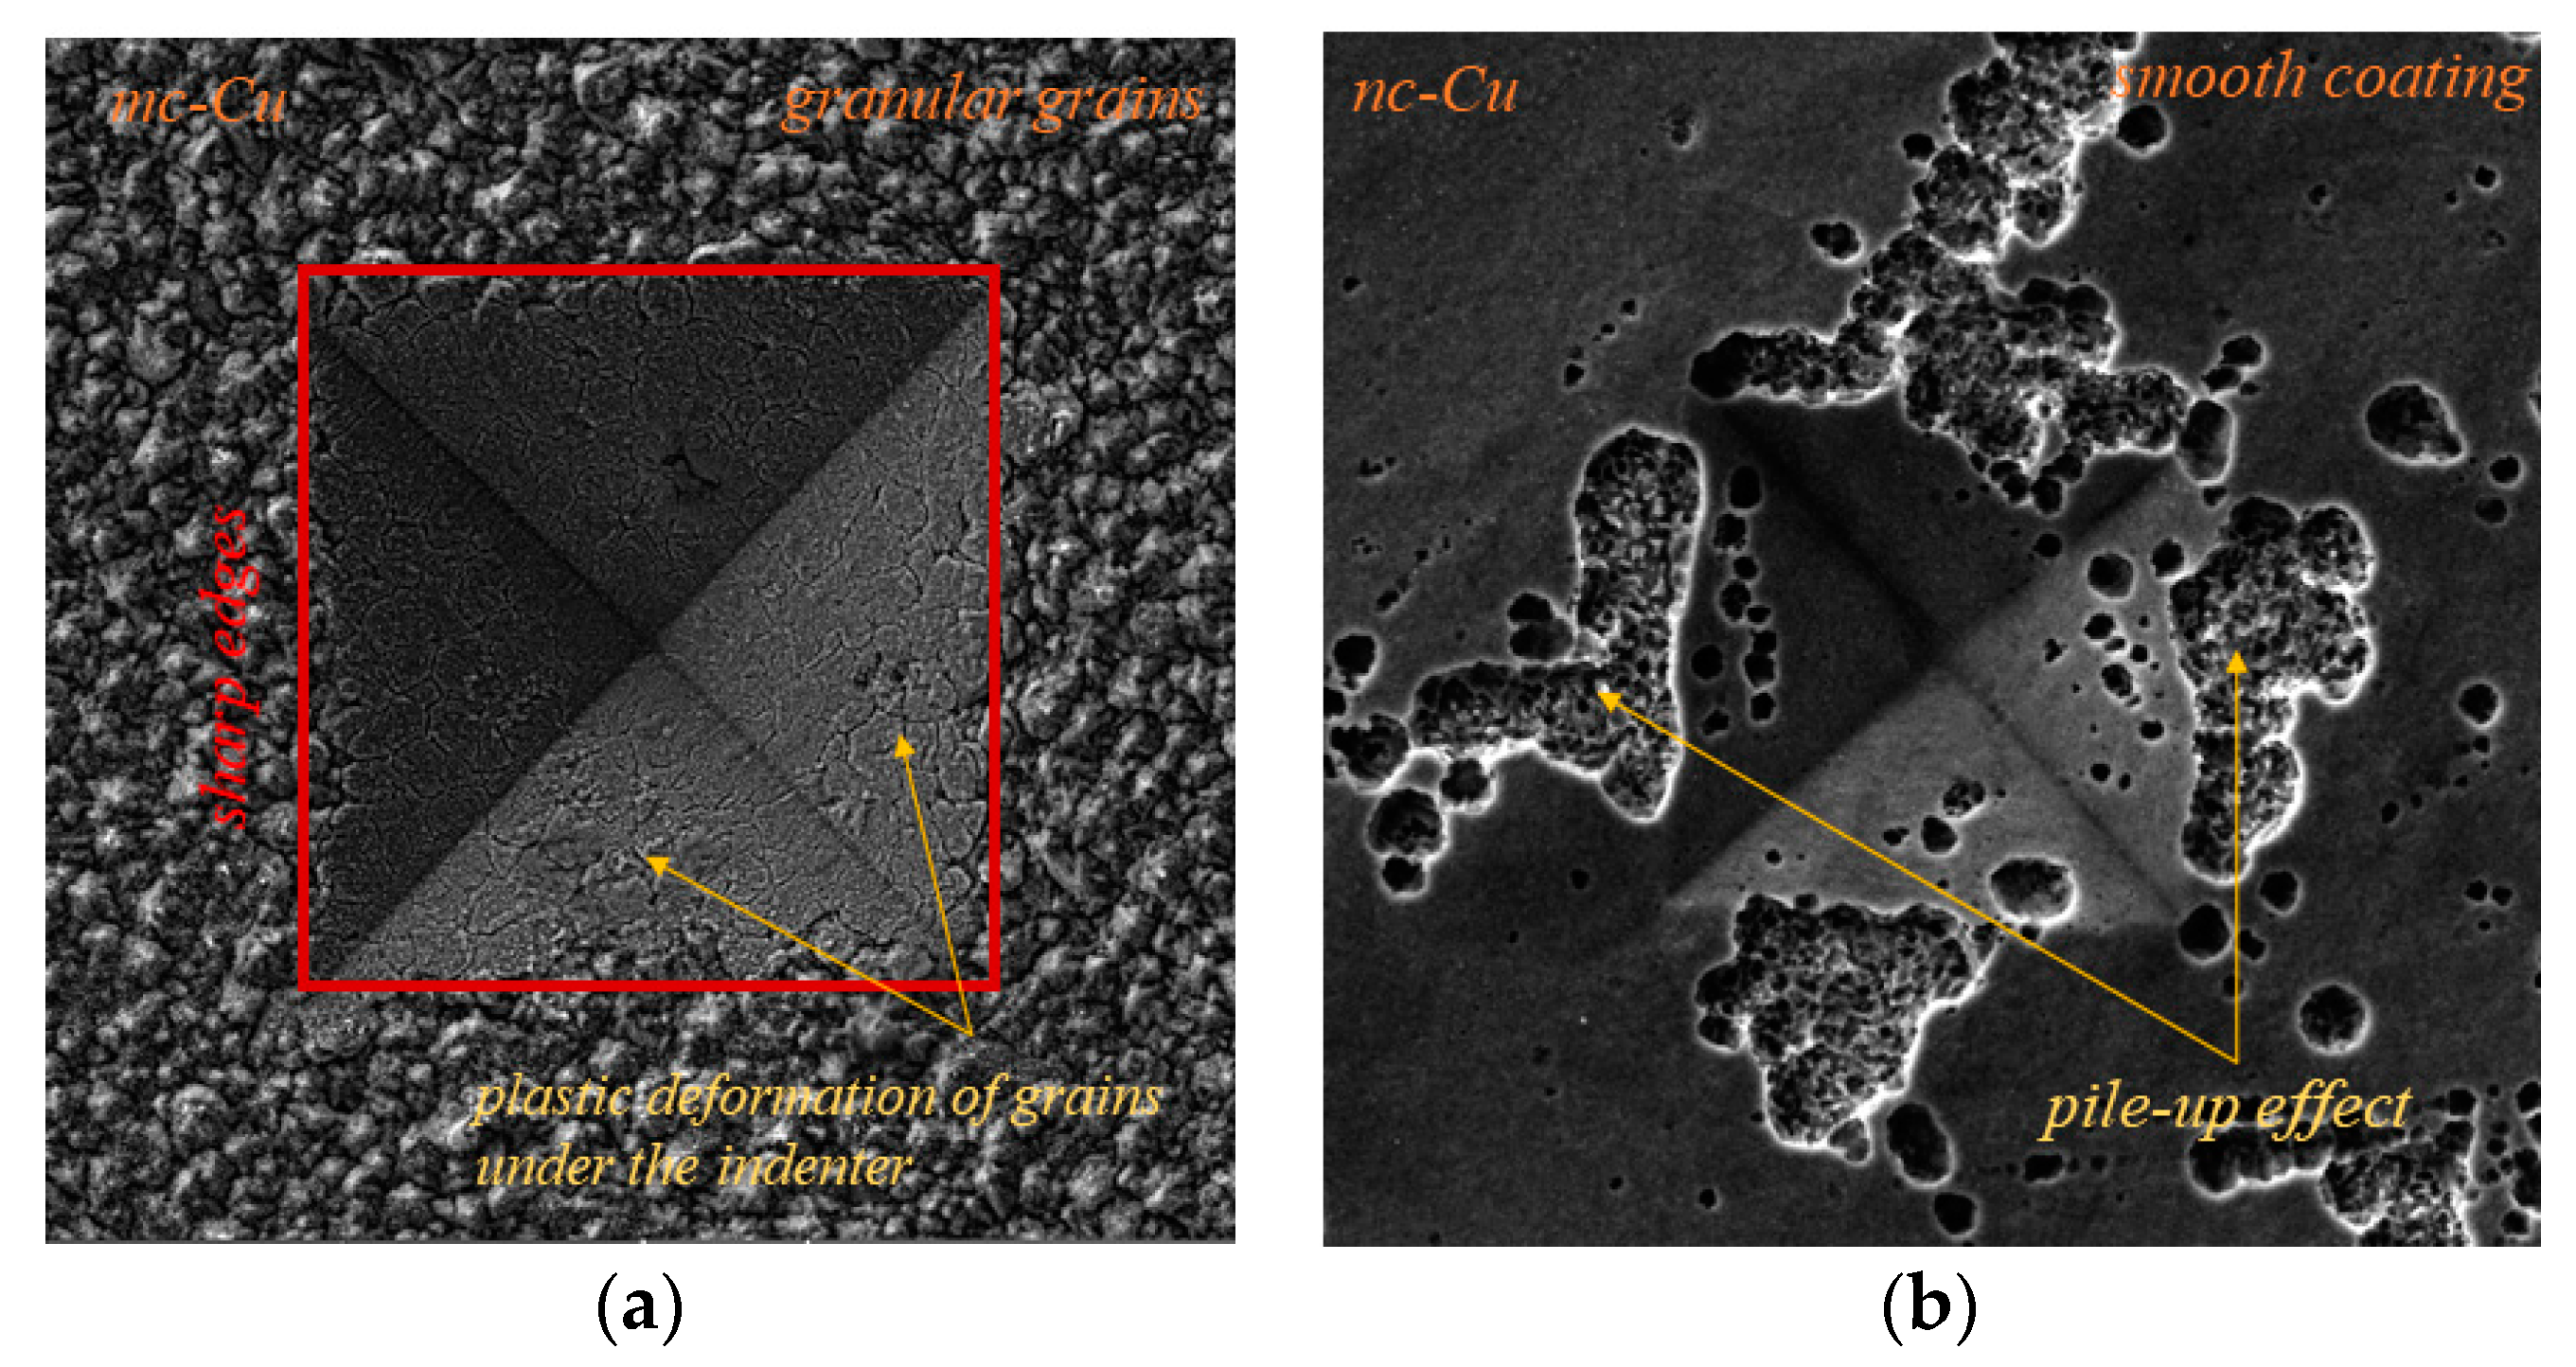
76]. The pile-up effect affecting the coating hardness value can be the easiest looked at through analysis of the Cu coatings electrodeposited from
electrolyte I and
electrolyte II, as seen from
Figure 28 showing Vickers indents.
In the Cu coating electrodeposited from
electrolyte I, the main mechanism is a plastic deformation of the coating under the indenter (
Figure 28a) [
18]. The plastic deformation of fine-grained coatings produced from
electrolyte I occurs throughout the grain with the slip of dislocations mostly in the grain interior (intragranular slip) [
77]. In the nanocrystalline coatings electrodeposited from
electrolyte II, a pile-up effect occurs at edge of the indent (
Figure 28b), and this effect is not observed in the Cu coating electrodeposited from
electrolyte I.
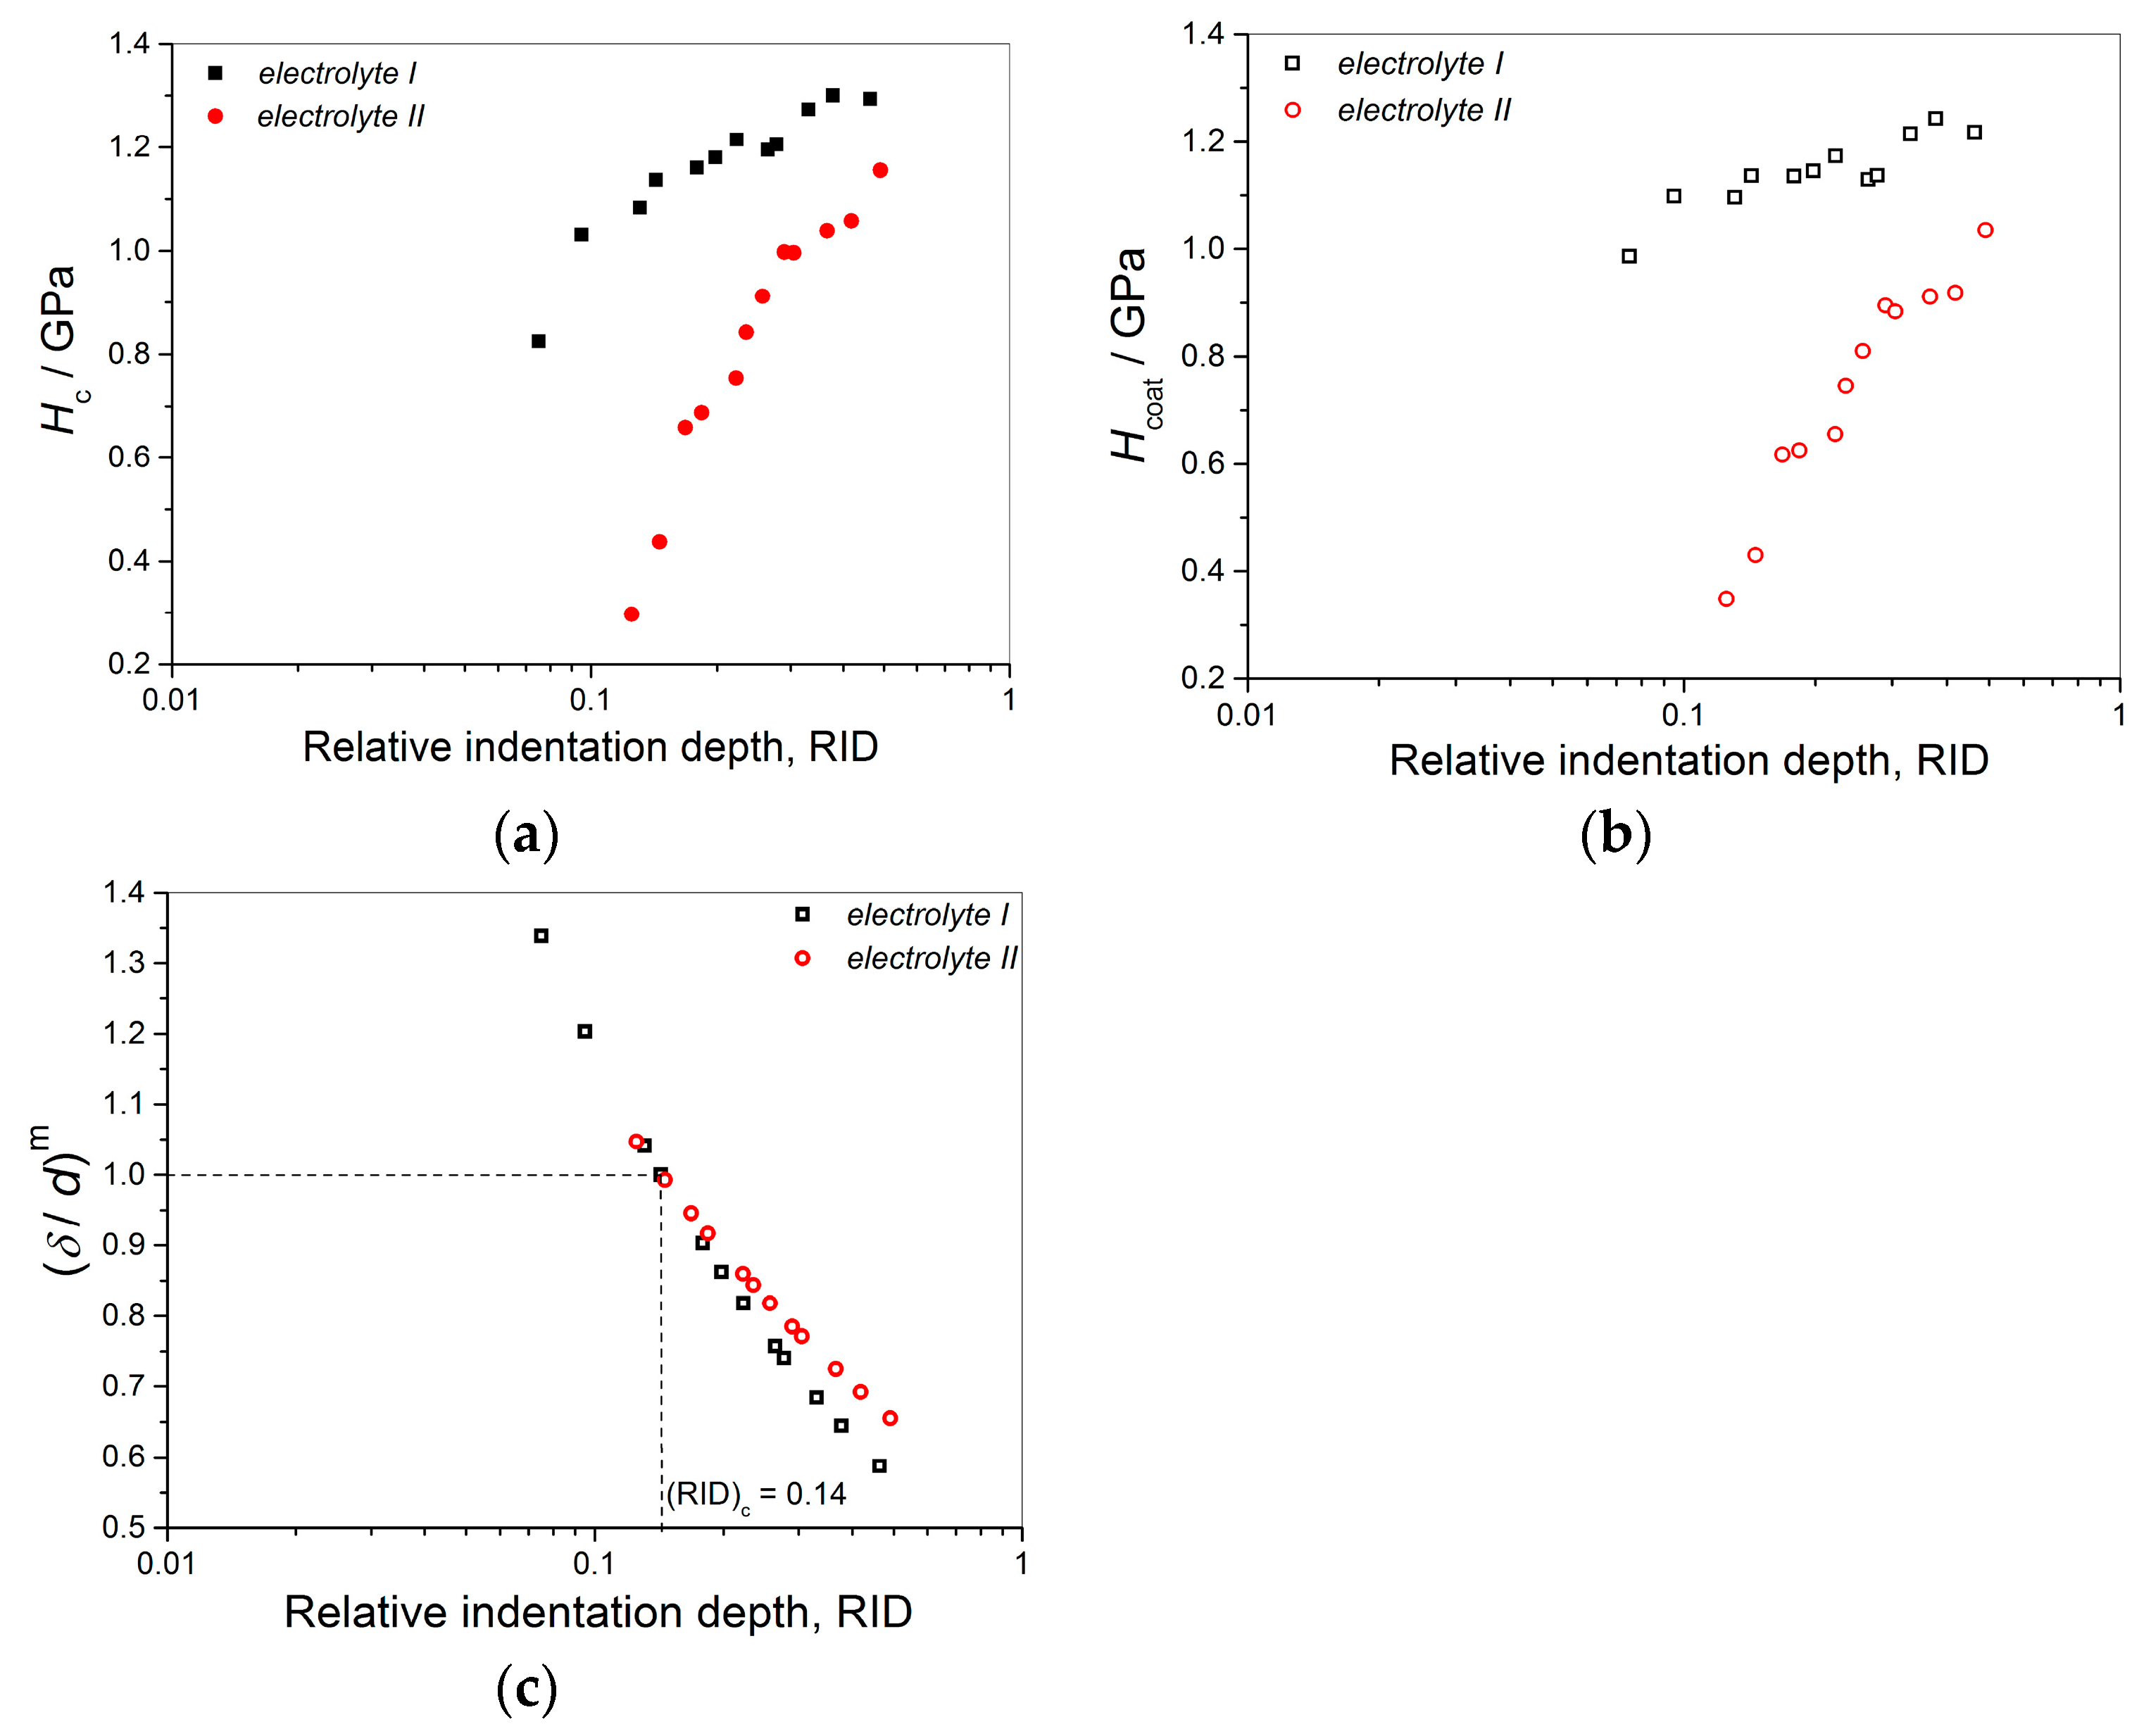
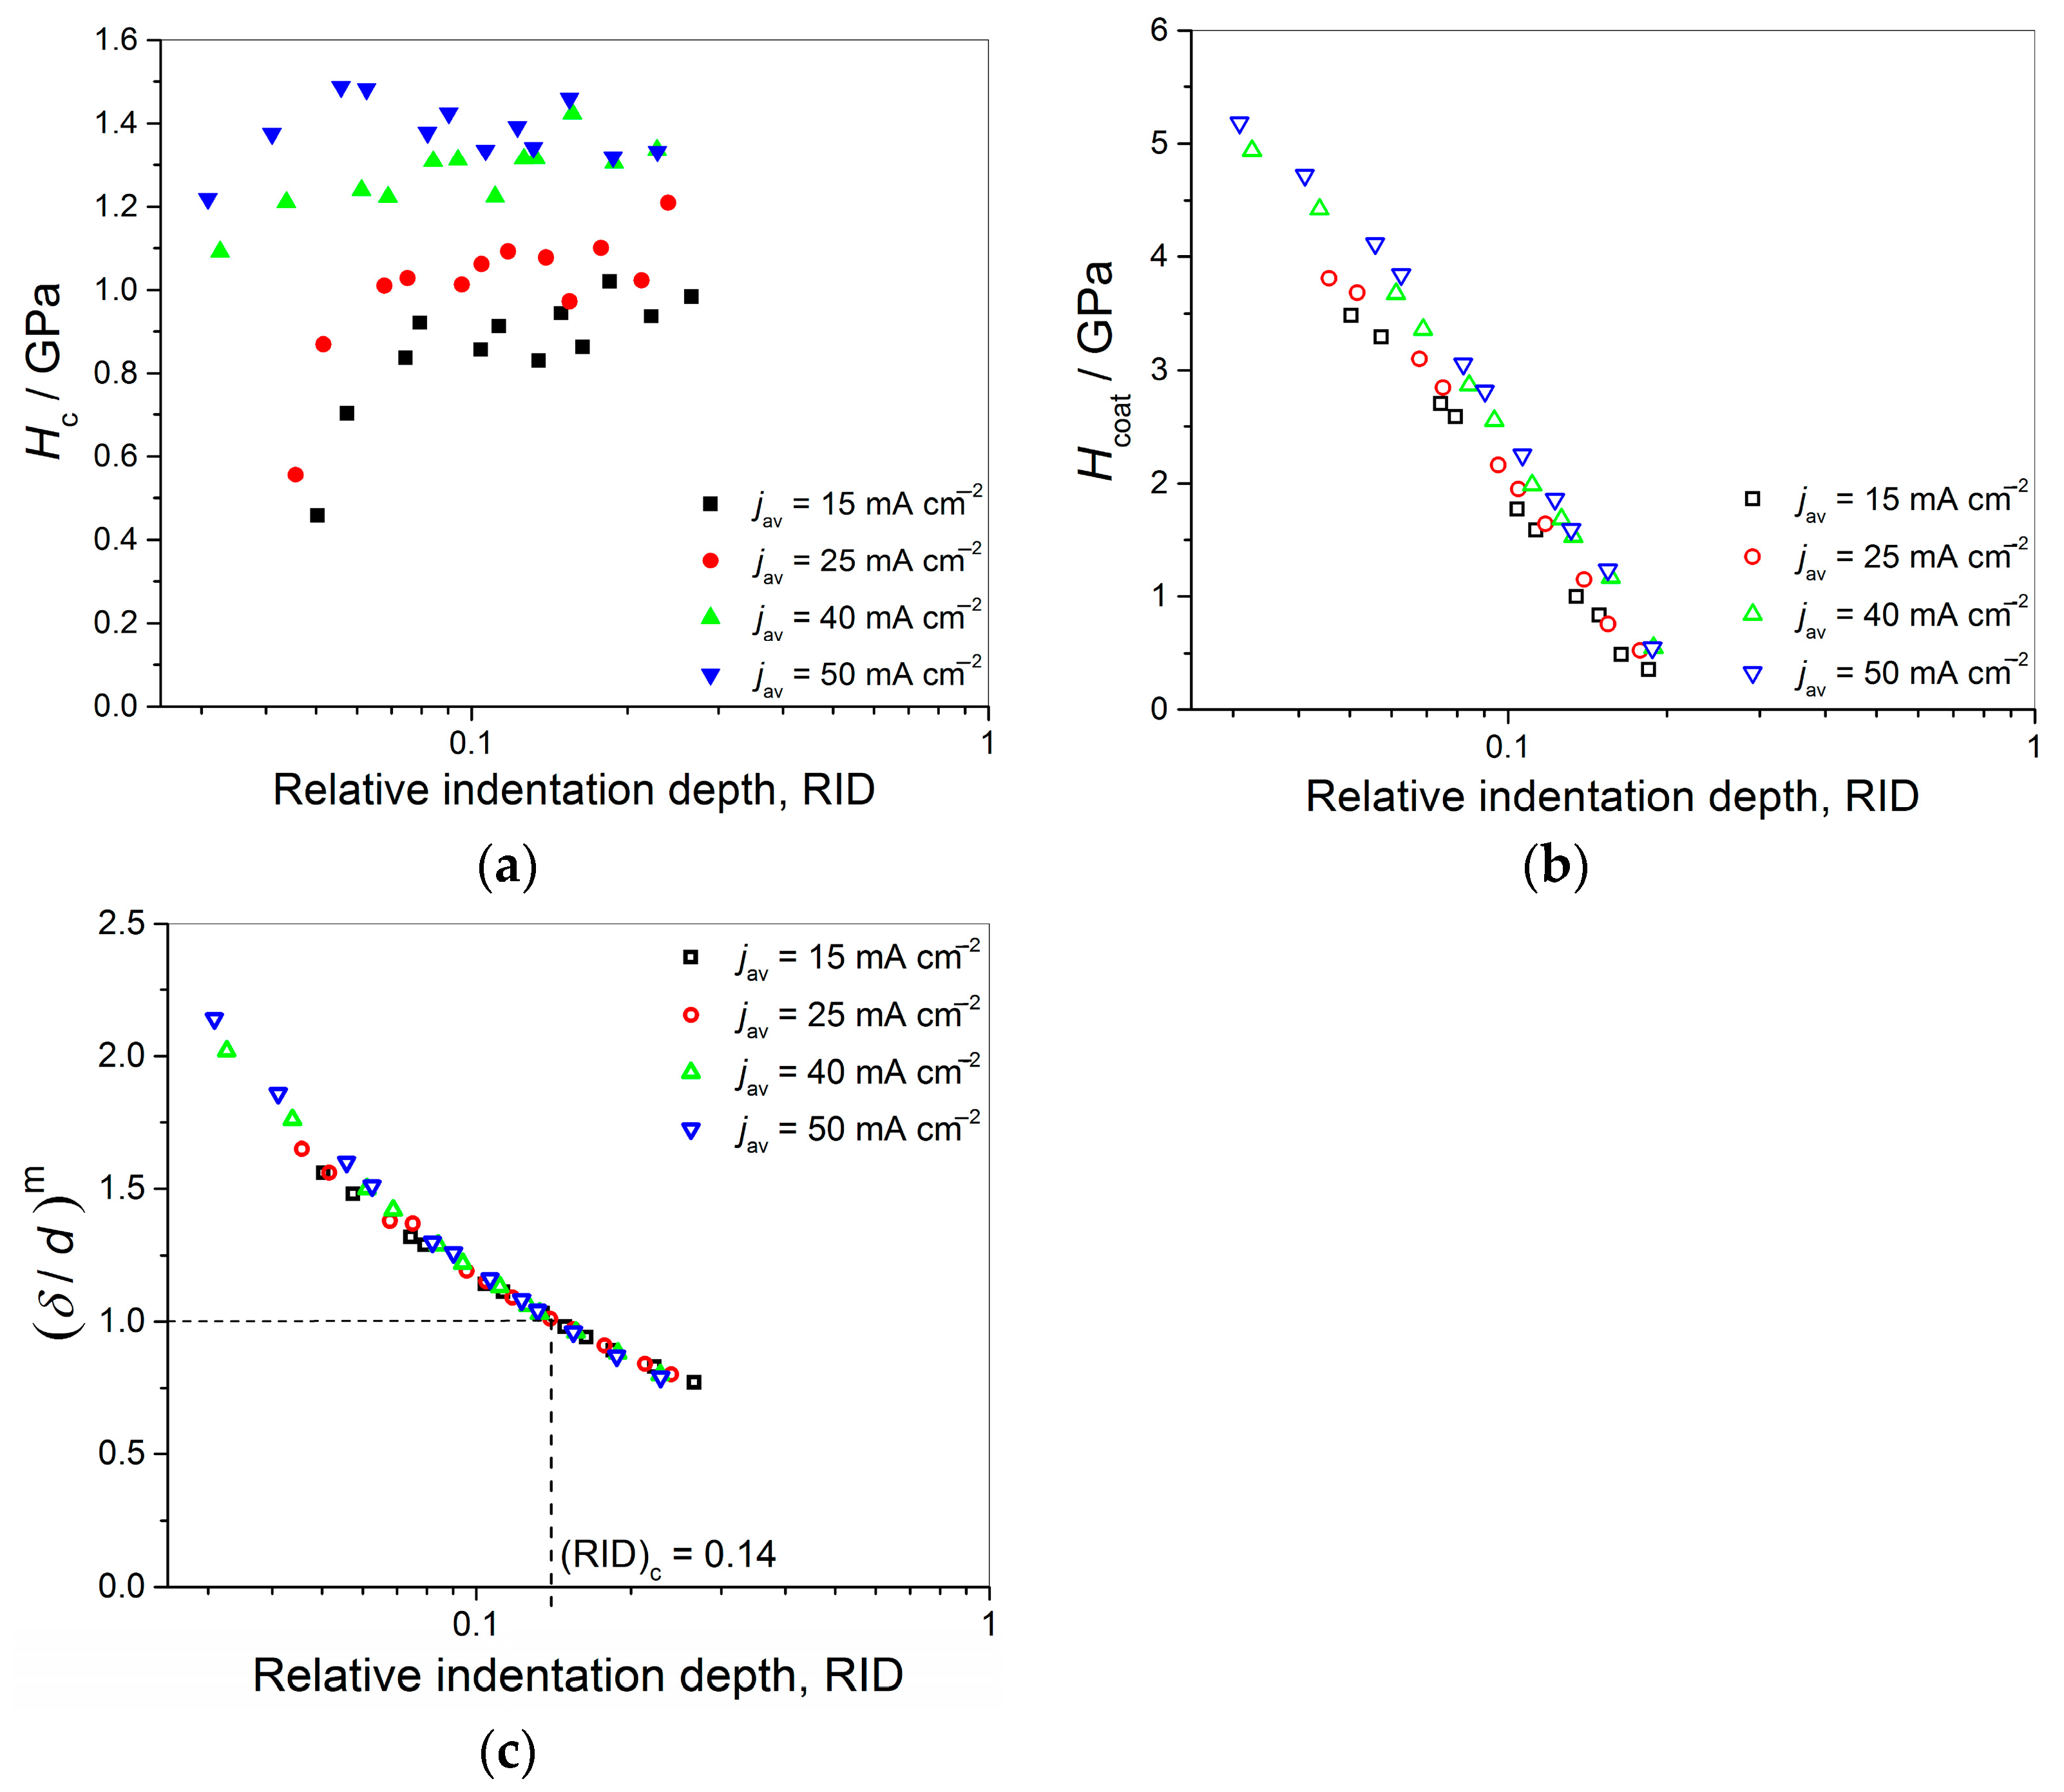
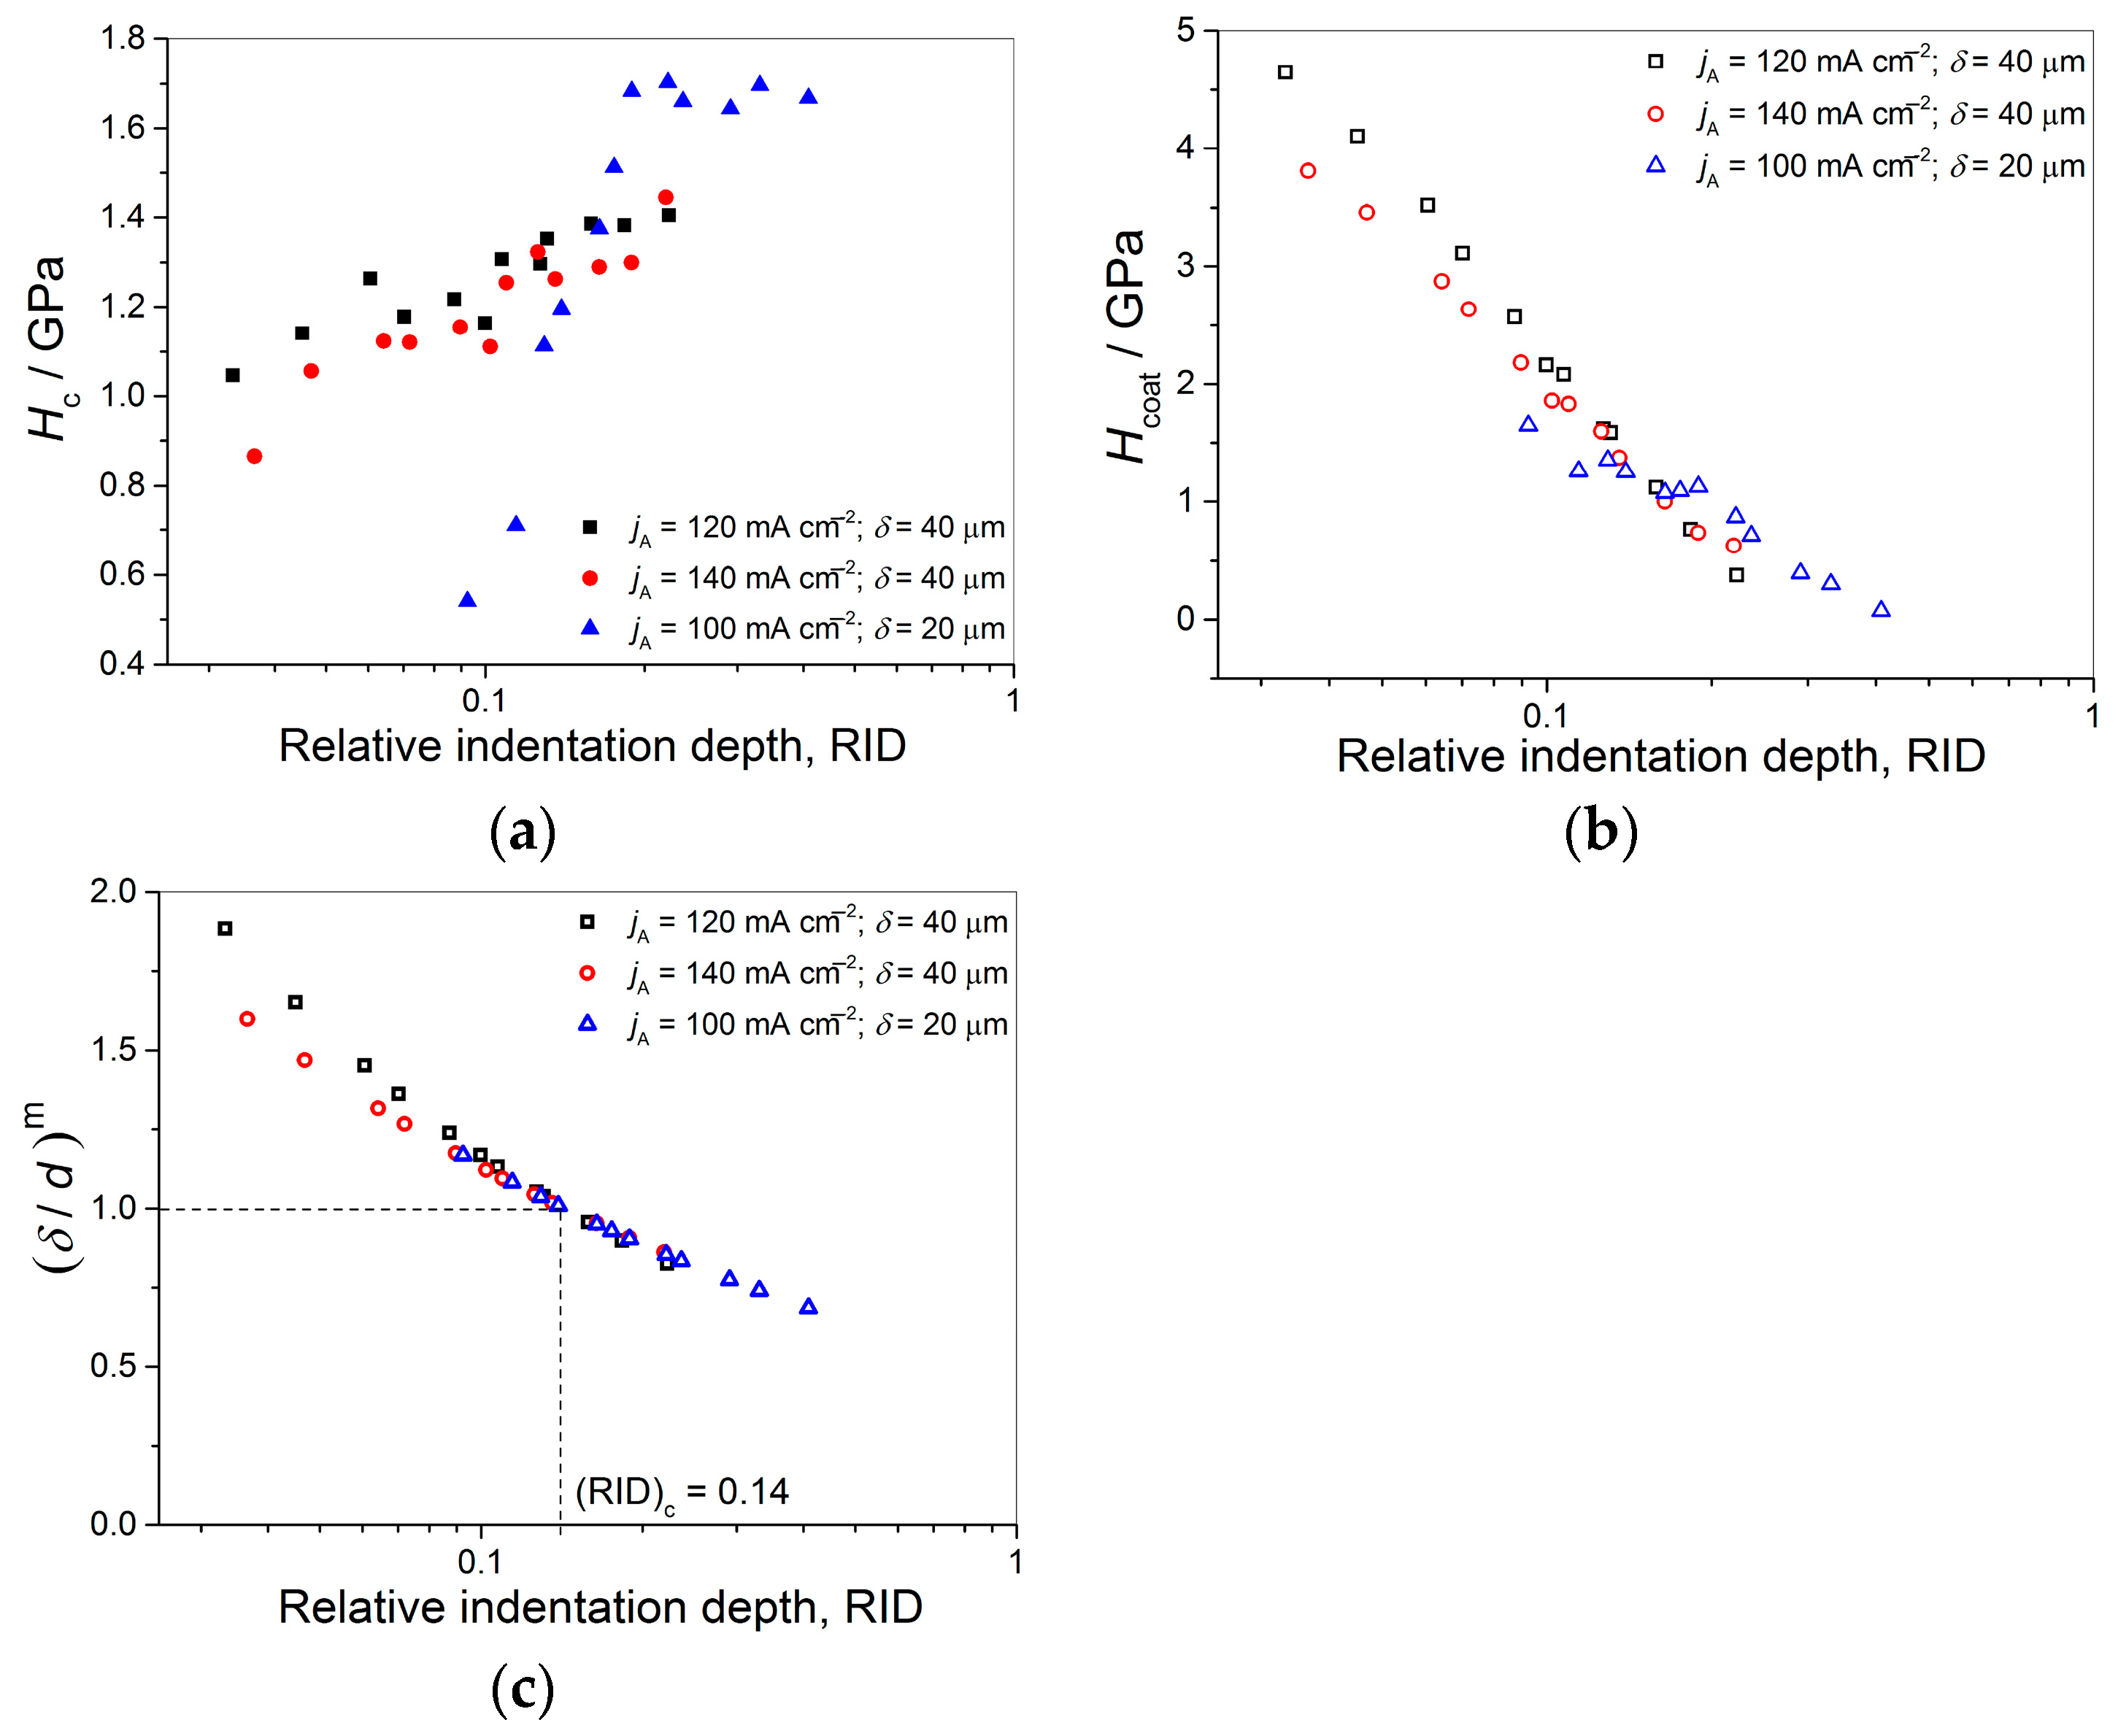
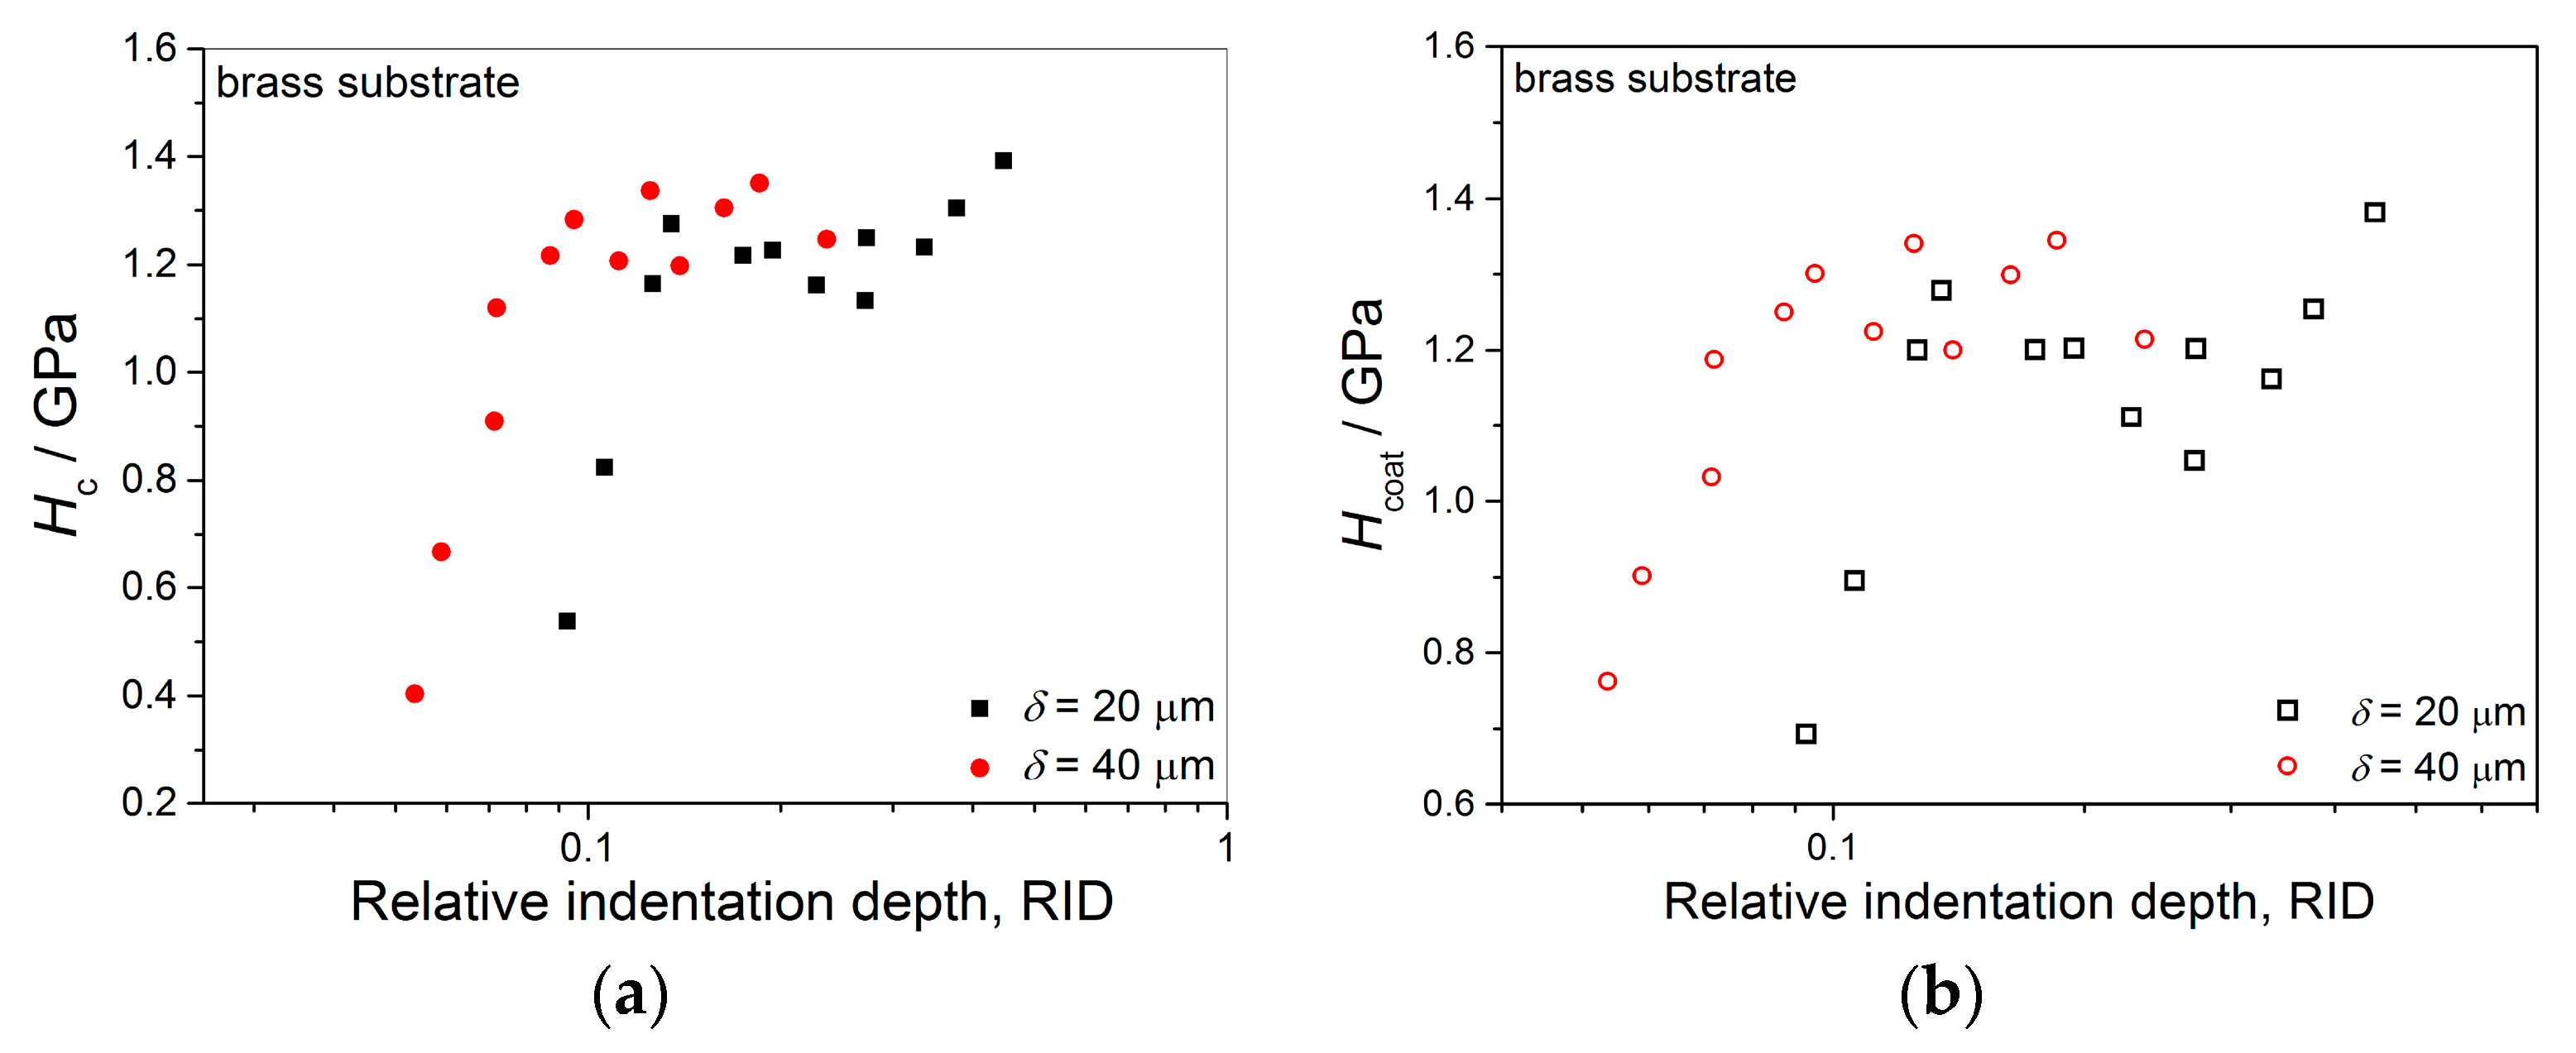
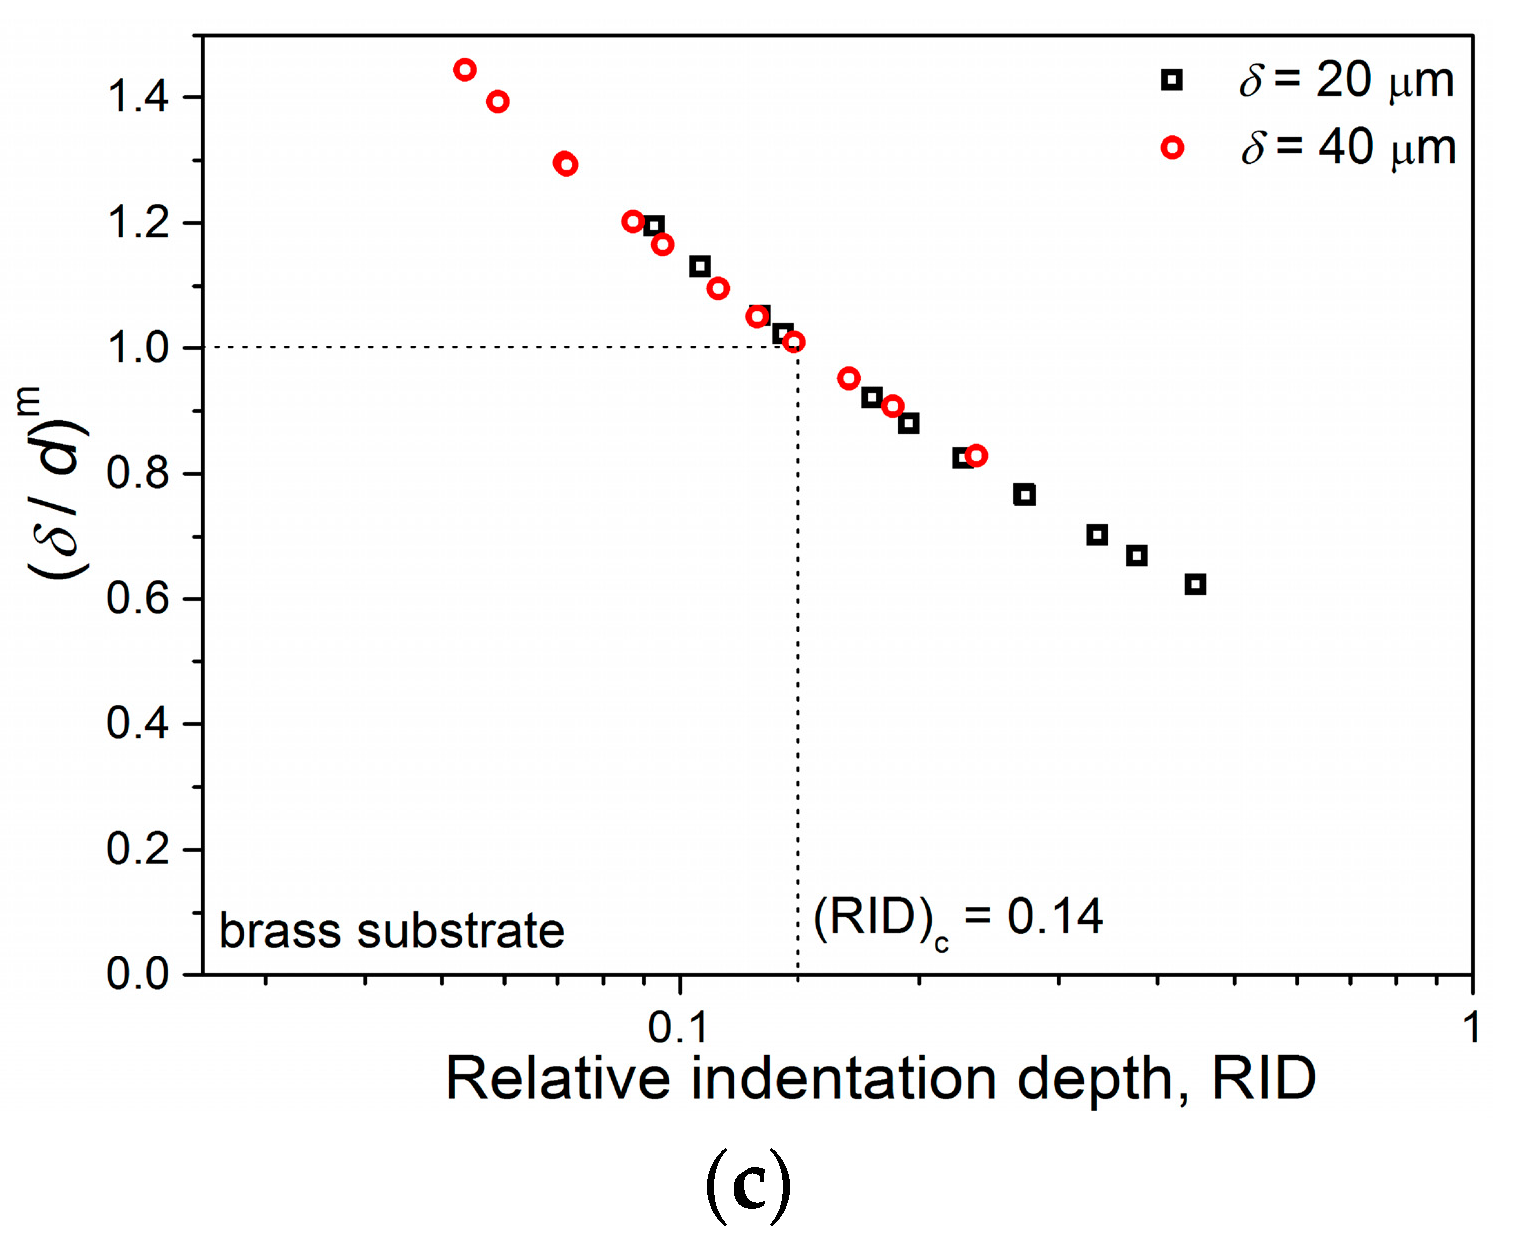
Anyway, the limiting (or critical) RID value of 0.14 [(RID)
c = 0.14] showed an universal character for electrolytically produced Cu coatings. This value was observed for both the Cu coatings electrodeposited in the DC regime under various electrodeposition conditions (the types of electrolyte and cathode, coating thickness and electrolyte stirring) and for various PC regimes. This value is related with the coating thickness as (
hc/
δ) = 0.14, i.e., as
hc = 0.14
δ. For values of an indentation depth smaller than this critical value,
hc, (i.e., for
hc < 0.14
δ) a substrate (cathode) had not any significant influence on the coating hardness and the measured hardness can be equaled with the coating hardness. For
hc ≥ 0.14
δ, the cathode hardness strongly contributes to the measured composite hardness, and it is necessary to apply the C–L model to obtain an absolute hardness of the Cu coatings. This criteria (
hc = 0.14
δ) is situated between the value
hc < 0.20
δ [
70] established for polycrystalline soft coatings on hard substrates. Such as, the Cu coatings produced on Si(111) and brass cathodes, for which a substrate had no influence on the coating hardness, and Buckle’s one-tenth rule predicting that a film thickness of 10 times the indentation depth is sufficient to neglect the influence of the substrate, i.e., a substrate commences to effect on the coating hardness after
hc > 0.10
δ [
51].
The coating hardness values calculated applying the C–L model were in a line with those obtained in other investigations for the Cu coatings obtained by different electrochemical deposition processes. Depending on parameters of the electrodeposition, the values of hardness of Cu coatings electrodeposited by the DC regimes were between 0.70 and 1.65 GPa [
61,
78,
79]. For example, the Cu coating hardness value determined by Korsunsky model was 0.80 GPa [
41]. The values of coating hardness for the Cu coatings produced by different periodically changing regimes of the electrochemical deposition were in the 1.10–2.0 GPa range, and they were slightly higher than the values obtained by the DC mode [
80].


