Abstract
Due to the rapid sintering and densification, spark plasma sintering (SPS) technology can significantly inhibit grain coarsening, and obtain alloy with high density and uniform microstructure. Tantalum-tungsten (Ta-W) alloy had been fabricated by powder metallurgy and consolidated by SPS at temperature of 1600 °C for 5 min at the pressure of 35 MPa. Specimens of pure Ta and four tantalum-based alloys with different concentrations of tungsten ranging from 2.5 to 10 were used to investigate the behavior of developed alloys. X-ray diffraction analyses were applied for all compositions of Ta-W alloys. The morphology of fracture sections was analyzed by scanning electron microscopy (SEM). Morphologies of initial Ta and W powders, microstructures of sintering Ta-W alloy and tensile fractographs of the specimens with different components were observed. When the concentrations of tungsten were distributed with 2.5 wt%, 5 wt%, 7.5 wt% and 10 wt%, the measured densities were 16.151 g/cm3, 15.756 g/cm3, 15.711 g/cm3, 15.665 g/cm3 and 15.670 g/cm3 respectively. As the content of tungsten increased, the density of the alloy decreased and the grain was refined, meanwhile the micro-hardness of the samples increased gradually. Furthermore, the addition of tungsten could greatly enhance the strength of the alloys, but decrease the plasticity of the alloys. Ta-2.5 wt%W shows the maximum bending strength with a value of 832.29 MPa, while the percentage of transgranular fracture increased with the increase of tungsten content.
1. Introduction
Tantalum is in the fifth subgroup of the chemical periodic table and belongs to the transition metals with atomic number of 73. The special electronic structure of tantalum is 1s22s22p63s23p63d104s24p64d104f145s25p65d36s2, meanwhile its normal crystal structure is body-centered cubic (space group-Im (-3) m). Usually the main slip plane of tantalum crystal is (110), while the slip direction is <111>. Tantalum possesses five different valence states which include (-1), (+1), (+2), (+3), (+4) and (+5), and the valence state (+5) is the most common. Tantalum exists in two crystalline phases, among which β-Ta usually appears in thin film structure and when the temperature rises to 750–775 °C, metastable tantalum is transformed into stable tantalum (α-Ta). Refractory metal tungsten is in the sixth subgroup of the chemical periodic table with atomic number of 74, and the special electronic structure is 1s22s22p63s23p63d104s24p64d104f145s25p65d46s2, The steady-state tungsten crystal structure is body-centered cubic structure (space group -Im (-3) m). The main slip plane of tungsten alloy is generally (110) or (122), and the slip direction is <111>. The main valence states of tungsten include (-2), (-1), (0), (+1), (+2), (+3), (+4), (+5) and (+6). The valence states (+6) and (+4) are the most common. Tantalum and tantalum alloys have the advantages of high melting point, high density, good wear resistance, excellent high temperature strength, good processing plasticity and weldability, and low plastic-brittle transition temperature. Due to these unique properties, tantalum and tantalum alloys have been widely used in aerospace, electronics, military and chemical industries [1,2,3].
Common strengthening methods include solid solution strengthening [4], dispersion strengthening [5], fine grain strengthening [6], precipitation strengthening [7] and deformation strengthening [8]. Among them, solid solution strengthening is the main method. Common replacement solid solution strengthening elements [9,10,11,12] include niobium (Nb), tungsten (W), molybdenum (Mo), rhenium (Re), hafnium (Hf) and zirconium (Zr), common interstitial solid solution strengthening element include oxygen (O), carbon (C) and hydrogen (H), nitrogen (N) and so on. Tungsten is one of the best reinforcing elements [13], and it can form a substitutive continuous solid solution with tantalum, which has a significant impact on the mechanical properties of the alloy. Although the traditional electron beam smelting is of high purity, the grain size of tantalum-tungsten alloy is larger and the anisotropy of the alloy is obvious. Although the conventional electron beam melting preparation of tantalum-tungsten alloy has higher purity, the grain size is larger and the anisotropy of the alloy is obvious, and further processing of refined grains is needed to improve its performance.
With the above in mind, the fine-grained, non-textured tantalum-tungsten alloy was prepared using SPS technology [14,15]. In this paper, the densification degree, microstructure and mechanical properties of alloys with different tungsten contents were characterized, and the SPS sintering process of alloy system with tungsten as solid solution strengthening element was determined. The influence of tungsten content on the microstructure and properties of the alloy system was investigated.
2. Experimental Details
2.1. Material Preparation
Commercial powders of tantalum (23 μm in average size, 99.95% in purity), and tungsten (6.1 μm in average size, 99.95% in purity) Supplied by Dimu (Peking) New Materials Tech Co., Ltd. were used. Table 1 shows the characteristic parameters and chemical composition of raw materials.

Table 1.
Characterization and chemical composition of raw materials.
Moreover, morphological characteristics of tantalum and tungsten powder could be obtained in Figure 1.
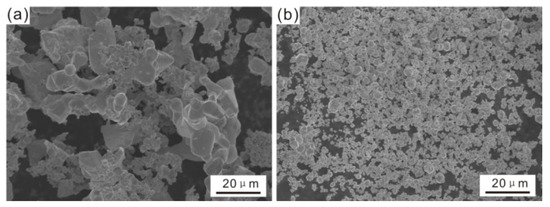
Figure 1.
Micrographs of Ta (a) and W (b) raw powders.
2.2. Powder Mixing
The raw powders of tantalum and tungsten were mixed by QM-1SP04 horizontal (Instrument Factory of Nanjing University, Nanjing, China) ball grinding mill. Before ball-milling, the mixtures of tantalum and tungsten powders according to the quality percentage of 97.5:2.5, 95:5, 92.5:7.5, 90:10 were screened respectively. Then they were put into the stainless steel tanks under circumstance of vacuum and argon gas protection, specific parameters of ball mill mixing are as follows: the total time of milling and milling speed were adjusted at 4 h and 100 rpm/min, without adding any ball mill medium.
2.3. Spark Plasma Sintering
The temperature measuring equipment in the experiment sintering process was infrared thermometer, and the initial measurement temperature was 570 °C, at this moment the sintering pressure was regulated to 35 MPa. During the SPS, the heating rate was kept 100 °C/min. While the volume shrinkage process of Ta-W mixed powder during sintering was reflected by the change of electrode displacement. When the temperature increased from 0 °C to 600 °C, the electrode displacement did not change obviously. Then the electrode displacement increased rapidly when the temperature increased to 700 °C. In order to densify the sintered sample better, it was kept at 700 °C for 5 min. The displacement increased rapidly in the subsequent rapid heating stage, and increased slowly at 1600 °C. Hence, the sintering was held for 5 min at 1600 °C.
2.4. Density Measurements
The relative density of sintering Ta-W blocks directly affects the properties of materials. Physical and chemical properties of materials are closely related to the densification of materials, and the densification has a direct influence on the subsequent processing of alloy blocks.
In Equation (1),
refers to the density of distilled water at test temperature, g/cm3; m1 is the weight of the sample in air, g; m2 and m3 are the wet weight and floating weight of the sample in distilled water. The samples were polished and polished prior to testing and washed and dried in alcohol with ultrasound. In Equation (2),
is the theoretical density of the sample;
,
are the theoretical densities of Ta and W, respectively; Ta (wt%), W (wt%) are the mass percentages of Ta and W in the alloy, respectively. In Formulas (2) and (3):
is the relative density of the sample.
2.5. Microscopic Analysis
In order to characterize the microstructure of Ta-W alloy and explore the effects of plasma sintering, tungsten content and mechanical alloying on the microstructure of Ta-W alloys, all the experiments had used the MM-2C optical microscope (Hengshengfeng Technology of Shenzhen, Shenzhen, China) to observe the microstructure of Ta-W alloy. The metallographic samples were processed into a size of 5 × 5 × 4 mm by wire-cutting machine and then were inserted in thermosetting resin. The D/MAX-RBRU X-ray diffractometer (XRD) (PANalytical B.V., Almelo, Netherlands) was used to analyze the phase of Ta-W alloy samples. The Kα radiation of Cu target (λ = 1.54059 Å) was used in the diffractometer test and the scanning angle range was 30–90 degrees, while the tube voltage was 40 KV, and the tube current was 250 mA.
2.6. Micro-Hardness Test
In this paper, the polished samples were tested with Vickers micro-hardness [16] test using HVS-1000 digital micro hardness tester (Fengzhi Test Instrument of Jinan Co., Ltd., Jinan, China). The test process followed the standard of GB/T4340.1–2009, with the head load of 9.8 N and the pressure maintaining time of 10 s. The hardness of each sample was averaged at 7 points.
2.7. Mechanical Property Investigation
By blending (speed of 180 rpm/min, blending time 4 h, Ar atmosphere environment) preparation group is divided into Ta–2.5 wt% W, Ta–5 wt% W, Ta–7.5 wt% W, Ta–10 wt% W mixing powder, and the discharge plasma sintering under 1600 ℃, insulation 5 min, and insulation at 1200 °C for 5 min. The effect of W content on the structure and properties of tantalum tungsten alloy was studied. All the mechanical experiments were carried out at room temperature (20 °C). Ta has a theoretical density of 16.65 g/cm3 and W has a theoretical density of 19.35 g/cm3 [17,18].
3. Results and Discussion
3.1. Relative Density of Ta-W alloy
The theoretical density, real density and relative density of fabricated Ta-W alloy specimens with various concentrations of tungsten have been calculated according to Formulas (1)–(3), and the result of relative density can be seen in Figure 2. As in Figure 2, the relative density of sintered Ta-W alloys gradually decrease with the increase of tungsten concentration by the reason of excellent oxytropism performance of tantalum, so the raw hybrid powder is easy to absorb oxygen and other gas impurities from the air before sintering. In addition, during the raw powder mixing process, the content of absorbed gas increases gradually, and the oxygen adsorption on the surface of powder particles results in a significant reduction of density after sintering. Contrast to tantalum, tungsten performs ultrahigh melting point (approximately 3410 °C), excellent electrical conductivity and thermal conductivity. Therefore, the higher concentration of tungsten involves in Ta-W powder mixture, the more difficult migration and diffusion that mixture particles will exhibit during sintering process and then the lower relative density of sintered Ta-W alloy shows.
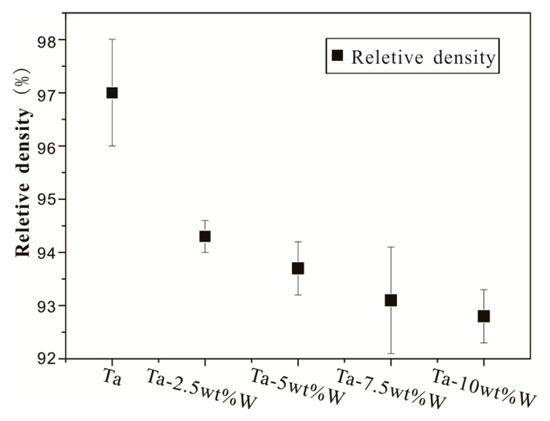
Figure 2.
The relative density varies with the content of tungsten (wt%).
3.2. Microstructural and Phase Characterization of Ta-W Alloys
The metallographic microstructure of the sintering Ta-W alloys with various concentrations of tungsten are presented in
Figure 3. It can be seen that the grain size of Ta-W alloys decreases with the increase of W content. By comparing the grain sizes of pure tantalum in Figure 3a, it is shown that the addition of tungsten can significantly reduce the grain sizes of tantalum based alloy. When the concentrations of tungsten are distributed with 2.5 wt%, 5 wt%, 7.5 wt% and 10 wt%, the average grain sizes of the Ta-W alloys are displayed as 15 μm, 13 μm, 10 μm and 8 μm, respectively. It can be also seen that the quantity of black cavities in the surface of the alloy is increasing, which is consistent with the corresponding relation of the change of the density. The results show that tungsten can refine the grain size of the sintered samples, but reduce the density.
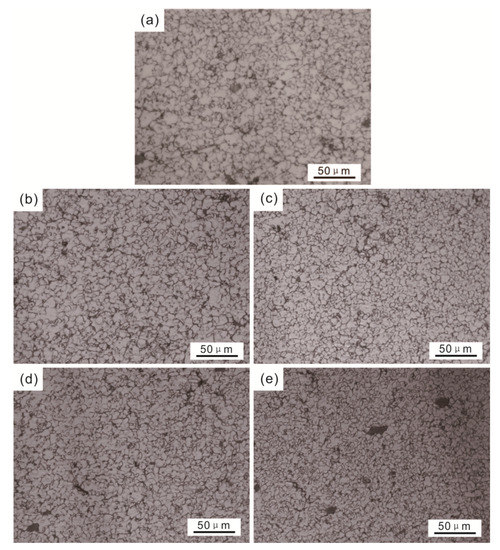
Figure 3.
Metallographic diagram of Ta-W alloys under different mass fractions(a) Pure Ta, (b) Ta-2.5 wt%W, (c) Ta-5 wt%W, (d) Ta-7.5 wt%W, (e) Ta-10 wt%W.
Typical XRD patterns of powder mixtures (Figure 4a) and sintering samples (Figure 4b) indicate that as desired, it can be seen that three major peaks including (110), (200) and (211) corresponding to Ta are all located in the powder mixtures and sintering samples, and the diffraction peaks of W can be clearly seen in the powder mixtures. In the diffraction spectra of the sintering samples, the intensity of the diffraction peak of W decreased sharply and shifted slightly in the direction of low Angle, which overlapped with the main peak of Ta.
Figure 4b suggests the disappearance of XRD peaks corresponding to W because of its dissolution into the Ta matrix.
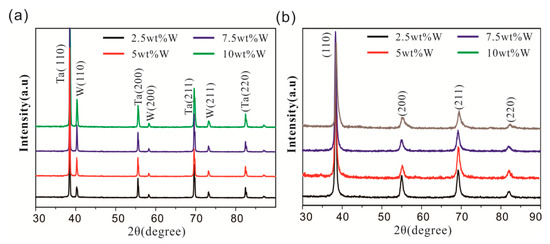
Figure 4.
XRD patterns of powder mixtures (a), and sintering samples (b).
Combined with the migration of diffraction peaks, it is shown that the crystal structure of sintering Ta-W alloy is a body-centered cubic structure. Ta and W are alloying under the sintering process to form Ta-W solid solution.
In Figure 4, it can be also seen that the diffraction peaks are widened to a certain extent. Meanwhile, the crystalline interplanar spacing tends to decrease and the lattice constant to be smaller with addition of W. According to the Bragg equation [19], , as the amount of W increase, the crystalline interplanar spacing of the Ta-W alloy decrease, then the diffraction Angle shifts to higher, which is consistent with the diffraction spectrum. According to Vegard’s law [20], the lattice constant of multivariate alloy with solid solution is approximately linear with the content of solute atoms in the alloy. For the Ta-W alloy, the theoretical lattice constant can be expressed as below:
where
,
and
represent the lattice constants of Ta-W alloy, Ta and W, while
and
represent the molar concentrations of Ta and W, respectively.
The lattice constants of Ta and W were obtained as
and
respectively. The theoretical lattice constant of Ta-W alloy can be calculated according to Formula (4).
Table 2
shows the theoretical values of the lattice constant of Ta-W alloy and the measured values according to the X-ray diffraction.
Table 2.
Theoretical and measured values of lattice constants of tantalum tungsten alloy.
3.3. Micro-Hardness
The micro-hardness of different regions in Ta-W alloy sintered by SPS are quite different. In Figure 5, the internal micro-hardness and external micro-hardness of the Ta-W alloys with different content of W are concluded. The interior hardness of Ta-W alloy increases with the increased tungsten content in Ta-W alloy. While the tungsten content is 2.5 wt%, contrast to the pure tantalum, the surface hardness of Ta-W alloy fabricated by SPS has decreased slightly. But when the addition amount of tungsten is more than 2.5%, the surface hardness of Ta-W alloys increases with the increased tungsten content significantly. Besides, the hardness of the surface is much higher than of the core.
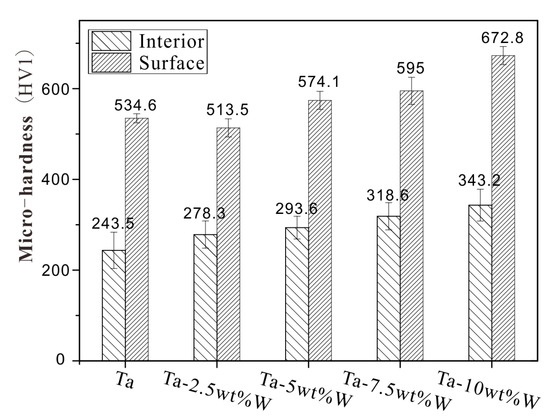
Figure 5.
The superficial and internal micro-hardness of Ta-W alloy.
When fabricated by SPS, the Ta-W solid solution forms in Ta-W alloy, which plays an important role of solid solution strengthening on the alloy. In addition, the initial powder mixing process results in the increase of gas content (especially oxygen) of the mixture. As the oxygen content increases, it combines with tantalum to form an interstitial solid solution, and the solubility increases with the temperature. The surface hardness of the sintered sample is not only affected by the solid solution strengthening and interstitial solid solution, but also influenced by the hard carbide such as tantalum carbide (TaC) and tungsten carbide (WC) that generated on the surface of the alloy. The surface hardness of the Ta-W alloy is far higher than that of the core region under the combined strengthening mechanism of Ta-W solid solution strengthening and interstitial solid solution strengthening.
3.4. Mechanical Properties and Morphologies
In order to obtain mechanical properties of sintered Ta-W alloys, tensile experiment are performed and Figure 6 shows the tensile stress-strain curve of the specimens with different tungsten content. In the figure, it can be seen that the tensile strength of the tantalum based specimens is greatly improved by means of adding tungsten. As the amount of tungsten increases, the tensile strength of Ta-W alloy generally increases. Also, the plasticity of the Ta-W alloys decreases sharply on account of tungsten addition, and the fracture mode changes from ductile fracture to brittle fracture. When tangsten content is 0 wt%, 2.5 wt%, 5 wt%, 7.5 wt%, and 10 wt%, the ultimate tensile strength of the alloy is 325.3 Mpa, 643.64 Mpa, 613.56 Mpa, 645.2 Mpa, 693.41 Mpa, and the elongation rate is 3.8, 1.8, 1.6, 1.4, 0.9 percent, respectively. Although the relative density of Ta-W alloys decreases with the addition of tungsten, it can form solid solution and enhance the strength of the alloys. It can be also seen that the strength of Ta-2.5 wt% is higher than Ta-5.0 wt%, which is due to the combined effects of densification and alloying degree.
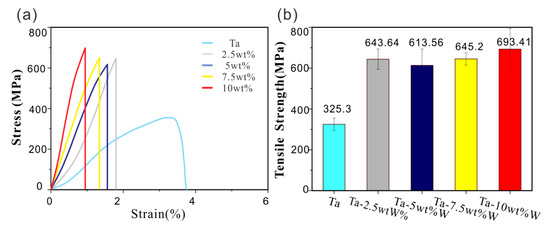
Figure 6.
Tensile test (a) stress-strain curves of Ta-W alloy, (b) tensile strength of Ta-W alloy.
The various complex morphologies of tensile fracture sections of the specimens with different tungsten concentrations are developed in Figure 7. The variations of tungsten concentration have not only shown an obvious impact on the tensile fracture mode, but also affected the percentage of transcrystalline fracture. While the tungsten concentration increases, the tensile fracture mode changes from intercrystalline fracture to transcrystalline fracture, and the percentage of transcrytalline fracture increases gradually.
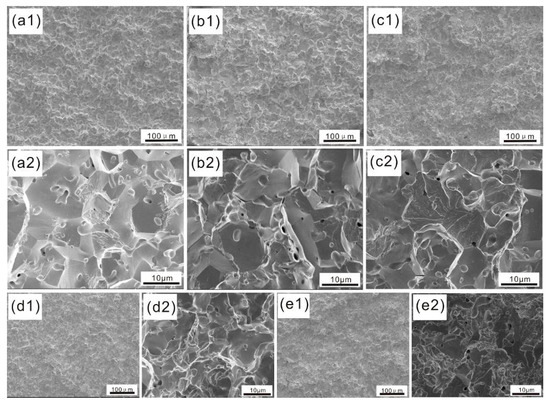
Figure 7.
Tensile fracture section morphology of Ta-W alloy with different W contents (a1,a2) Pure Ta, (b1,b2) Ta-2.5 wt%W, (c1,c2) Ta-5 wt%W, (d1,d2) Ta-7.5 wt%W, (e1,e2) Ta-10 wt%W.
In the tensile fracture morphology of pure tantalum, a large number of intercrystalline fractures exist, partial tearing edges and some tiny dimples can be seen. Figure 7b shows the tensile fracture morphology of Ta-2.5 wt%W. Figure 7c shows the tensile fracture morphology of Ta-5 wt%W. The percentage of intergranular fracture in the figure is about 50%, and the percentage of intergranular fracture increases with the increase of W content, and the fracture cleavage surface increases. This is because W acts as solid solution strengthening for rigid phase, increasing the strength of Ta alloy and reducing its plasticity at room temperature.
To further study the mechanical properties of Ta-W alloy, the sintered samples with different tungsten concentrations were tested for three-point bending resistance at room temperature. The stress-strain curve and ultimate bending strength of the tests to three-point bending resistance are given in Figure 8. It can be seen from the figure that with the increase of tungsten concentration, the elongation of Ta-W alloy decreases gradually, and the specimen of pure tantalum exhibits good plasticity, its bending elongation is about two times that of Ta-2.5 wt%W and more than four times that of Ta-10 wt%W. Besides, the pure tantalum specimen has a long yield stage, its ultimate bending strength reaches to 338.3 MPa. Contrast to pure tantalum, the fracture form of the tantalum tungsten alloy is brittle fracture, which is due to the decreased density of the alloy and the decreased bonding strength after the addition of tungsten. Moreover, in the powder metallurgy process, tungsten did not dissolve well into tantalum, and some tungsten formed hard phases. While during the experiment loading process, the cracks started to expand from cavities and hard phases. Thus, the addition of tungsten lead to a sharp decline in the plasticity of Ta-W alloys, this is mainly influenced by the porosity and alloying degree. And the increased tungsten concentration not only reduces the density of the alloys but also decreases the alloying degree.
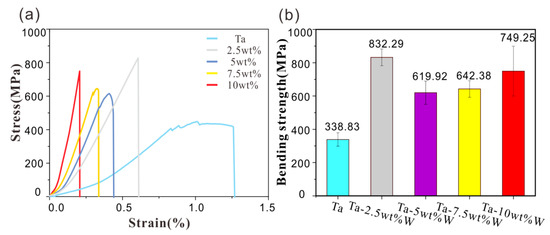
Figure 8.
The flexural stress-strain curve (a) and ultimate flexural strength (b) of tantalum tungsten alloy with different tungsten contents.
Brittle fracture, ductile fracture and ductile-brittle fracture are three typical forms of fracture failure. Different fracture failure modes have different fracture morphology. To study the effect of tungsten concentration on flexural fracture forms of Ta-W alloys, the morphology of the flexural fracture areas of the specimens was analysed. Figure 9 shows the flexural fracture morphology of sintered Ta-W alloys with different tungsten contents. It can be seen from Figure 9a that the main fracture form of pure tantalum is intergranular fracture with a large number of tearing edges. When the content of W increased to 2.5 wt%, the flexural fracture percentage of the sintered sample decreased along the grain fracture percentage and the cross grain fracture percentage increased, as shown in Figure 9b. When W content increases further to 5.0 wt%, 7.5 wt% and 10 wt%, the percentage of intergranular fracture gradually decreases, the percentage of intercrystalline fracture gradually increases, and the cleavage surface gradually increases. It can be seen from the morphology of intergranular section of tensile fracture that the grain of alloy decreases gradually with the increase of W content.
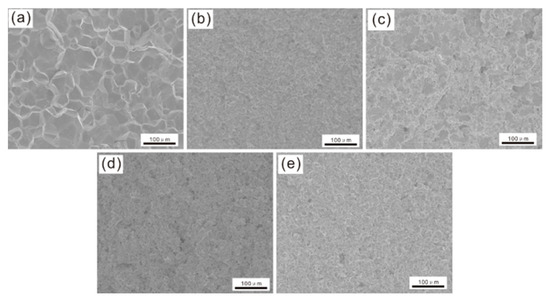
Figure 9.
Flexural fracture morphology of tantalum tungsten composite with different tungsten contents(a) Pure Ta, (b) Ta-2.5 wt%W, (c) Ta-5 wt%W, (d) Ta-7.5 wt%W, (e) Ta-10 wt%W.
4. Conclusions
The alloy powders of Ta-2.5 wt%W, Ta-5 wt%W, Ta-7.5 wt%W, and Ta-10 wt%W can be alloyed at a sintering temperature of 1600 °C, forming the solid solution of tantalum tungsten with the density up to 94.3%. As the content of tungsten increases, the density of the alloy decreases, the grain is refined, and the micro-hardness of the core of the sample gradually increases. The average grain size of Ta-2.5 wt%W sample was 15 , the core microhardness was 278.3.5 HV1, and the surface micro-hardness was 513.5 HV1, while the average size of Ta-10 wt%W alloy grains was 8 , the core hardness was 343.2 HV1, and the surface micro-hardness was 672.8 HV1. Furthermore, the addition of tungsten can greatly enhance the alloy strength, but the alloy plasticity decreases. Ta-2.5 wt%W shows the maximum bending strength with a value of 832.29 MPa, while the percentage of transgranular fracture increased with the increase of tungsten content.
Author Contributions
Writing & original draft, D.Y.; data curation, X.B.; software, L.X.; supervision, Q.Z. All authors have read and agreed to the published version of the manuscript.
Funding
This research was funded by [the National Natural Science Foundation of China] grant number [No. 51210008]; and funded by [the Open Fund of State Key Laboratory of Advanced Welding and Joining at Harbin Institute of Technology] grant number [AWI-21Z05].
Data Availability Statement
Not applicable.
Conflicts of Interest
The authors declare no conflict of interest.
References
- Kuznietz, M.; Livne, Z.; Cotler, C.; Erez, G. Diffusion of liquid uranium into foils of tantalum metal and tantalum-10 wt% tungsten alloy up to 1350 °C. J. Nucl. Mater. 1988, 152, 235–245. [Google Scholar] [CrossRef]
- Yasunaga, K.; Watanabe, H.; Yoshida, N.; Muroga, T.; Noda, N. Correlation between defect structures and hardness in tantalum irradiated by heavy ions. J. Nucl. Mater. 2000, 283-287, 179–182. [Google Scholar] [CrossRef]
- Liu, S.; Fan, H.; Deng, C.; Hao, X.; Guo, Y.; Liu, Q. Through-thickness texture in clock-rolled tantalum plate. Int. J. Refract. Met. Hard Mater. 2014, 48, 194–200. [Google Scholar] [CrossRef]
- Browning, P.N.; Alagic, S.; Kulkarni, A.; Matson, L.; Singh, J. Room and ultrahigh temperature structure-mechanical property relationships of tungsten alloys formed by field assisted sintering technique (FAST). Mater. Sci. Eng. A 2016, 674, 701–712. [Google Scholar] [CrossRef]
- Xie, Z.; Miao, S.; Liu, R.; Zeng, L.; Zhang, T.; Fang, Q.; Liu, C.; Wang, X.; Lian, Y.; Liu, X.; et al. Recrystallization and thermal shock fatigue resistance of nanoscale ZrC dispersion strengthened W alloys as plasma-facing components in fusion devices. J. Nucl. Mater. 2017, 496, 41–53. [Google Scholar] [CrossRef]
- Chen, Y.; Zhu, S.; Wang, X.; Yang, B.; Han, G.; Qiu, L. Microstructure evolution and strengthening mechanism of Al 0.4 CoCu 0.6 NiSi x (x=0–0.2) high entropy alloys prepared by vacuum arc melting and copper injection fast solidification. Vacuum 2018, 150, 84–95. [Google Scholar] [CrossRef]
- Gwalani, B.; Soni, V.; Lee, M.; Mantri, S.; Ren, Y.; Banerjee, R. Optimizing the coupled effects of Hall-Petch and precipitation strengthening in a Al 0.3 CoCrFeNi high entropy alloy. Mater. Des. 2017, 121, 254–260. [Google Scholar] [CrossRef]
- Malopheyev, S.; Kulitskiy, V.; Kaibyshev, R. Deformation structures and strengthening mechanisms in an Al Mg Sc Zr alloy. J. Alloy. Compd. 2017, 698, 957–966. [Google Scholar] [CrossRef]
- Ritter, N.C.; Roman, S.; Schauer, J.C.; Gruber, D.; Goehler, T.; Rettig, R.; Povoden-Karadeniz, E.; Koerner, C.; Singer, R.F. Effects of Solid Solution Strengthening Elements Mo, Re, Ru, and W on Transition Temperatures in Nickel-Based Superalloys with High γ′-Volume Fraction: Comparison of Experiment and CALPHAD Calculations. Met. Mater. Trans. A 2018, 49, 3206–3216. [Google Scholar] [CrossRef]
- Walbrühl, M.; Linder, D.; Ågren, J.; Borgenstam, A. Modelling of solid solution strengthening in multicomponent alloys. Mater. Sci. Eng. A 2017, 700, 301–311. [Google Scholar] [CrossRef]
- Liu, W.; Huang, Y.; Wang, Y.; Zhang, Y.; Duan, X.; Liu, W.; Ma, Y. Microstructure and mechanical properties of W-10 wt-%Ta alloys prepared by spark plasma sintering. Mater. Sci. Technol. 2022, 38, 159–168. [Google Scholar] [CrossRef]
- Moeen, A.; Gholam Hossein, B.; Saeed Reza, B.; Hassan, S. Development of high densified tantalum-tungsten alloy by powder metallurgy route. Mater. Res. Express. 2019, 6, 0865h5. [Google Scholar] [CrossRef]
- Li, B.; Sun, Z.; Hou, G.; Ding, F.; Hu, P.; Yuan, F. The effects of alumina reinforcement and nickel activated sintering on nanosized tungsten matrix. J. Alloy. Compd. 2017, 692, 420–426. [Google Scholar] [CrossRef]
- Guo, Z.; Wang, L.; Wang, X.-Z. Additive manufacturing of W-12Ta(wt%) alloy: Processing and resulting mechanical properties. J. Alloy. Compd. 2021, 868, 159193. [Google Scholar] [CrossRef]
- Dong, C.; Bi, X.; Yu, J.; Liu, R.; Zhang, Q. Microstructural evolution and sintering kinetics during spark plasma sintering of pure tantalum powder. J. Alloy. Compd. 2018, 781, 84–92. [Google Scholar] [CrossRef]
- He, T.; He, Y.; Li, H.; Su, Z.; Fan, Y.; He, Z. Fabrication of Ni-W-B4C composite coatings and evaluation of its micro-hardness and corrosion resistance properties. Ceram. Int. 2018, 44, 9188–9193. [Google Scholar] [CrossRef]
- Tahiri, M.; Masaif, N.; Jennane, A. Theoretical Study of Spontaneous Polarization Behavior and Density Behavior of Ni-Doped LiMO3(M˭Nb or Ta). Ferroelectrics 2015, 481, 189–195. [Google Scholar] [CrossRef]
- Liu, K.; Ning, C.; Luo, Z.; Shi, L.; Deng, J. An experimental and theoretical study of the HOMO of W(CO)6: Vibrational effects on the electron momentum density distribution. Chem. Phys. Lett. 2010, 497, 229–233. [Google Scholar] [CrossRef]
- Nogami, S.; Ozawa, I.; Asami, D.; Matsuta, N.; Nakabayashi, S.; Baumgärtner, S.; Lied, P.; Yabuuchi, K.; Miyazawa, T.; Kikuchi, Y.; et al. Tungsten–tantalum alloys for fusion reactor applications. J. Nucl. Mater. 2022, 566, 153740. [Google Scholar] [CrossRef]
- Foronda, H.M.; Mazumder, B.; Young, E.C.; Laurent, M.A.; Li, Y.; DenBaars, S.P.; Speck, J.S. Analysis of Vegard’s law for lattice matching InxAl1−xN to GaN by metalorganic chemical vapor deposition. J. Cryst. Growth 2017, 475, 127–135. [Google Scholar] [CrossRef]


Disclaimer/Publisher’s Note: The statements, opinions and data contained in all publications are solely those of the individual author(s) and contributor(s) and not of MDPI and/or the editor(s). MDPI and/or the editor(s) disclaim responsibility for any injury to people or property resulting from any ideas, methods, instructions or products referred to in the content. |
© 2023 by the authors. Licensee MDPI, Basel, Switzerland. This article is an open access article distributed under the terms and conditions of the Creative Commons Attribution (CC BY) license (https://creativecommons.org/licenses/by/4.0/).