Article

Uncertainty Analysis of Ultimate Strength for Spherical Shells Subjected to External Pressure

School of Mechanical Engineering, Jiangsu University of Science and Technology, Zhenjiang 212003, China
*
Authors to whom correspondence should be addressed.
Metals 2023, 13(3), 529; https://doi.org/10.3390/met13030529
Submission received: 1 February 2023 / Revised: 26 February 2023 / Accepted: 4 March 2023 / Published: 6 March 2023

Abstract

:
To evaluate the stochastic characteristics of ultimate strength for spherical shells subjected to external pressure, uncertainty analysis is conducted in this study. Experimental measurements and result analysis of dimensions, as well as ultimate strength, are performed. The basic theories of the surrogate model and probability-box method for ultimate strength are introduced briefly. Uncertainty analysis of ultimate strength is completed utilizing double-nested random sampling based on the established Gaussian process model with high precision, and the results are compared with the experimental findings. The results show that the experimental empirical cumulative distribution function is contained in the probability-box obtained while considering the influence of welding, and the absolute errors of the mean value, as well as those of the standard deviation, are much smaller. The study verified that the influence of welding cannot be ignored, and the prediction of ultimate strength, considering uncertainties, can eliminate the occasionalities of simulations and experimental tests.

1. Introduction

With the acceleration of human exploration of marine resources, the studies on high-stability pressure shell structures have become more and more urgent. As a typical type of pressure shell, spherical shells are widely used because of their great performance in regards to spacing, manufacturing, and service [1,2,3]. The ultimate strength of spherical shells subjected to external pressure is a main area of concerned for designers and engineers in the design and service phase.
Many numerical and experimental methodologies have been studied to investigate the ultimate strength of spherical shells. Zolly [4] derived the formula for the critical pressure of spherical shells subjected to external pressure based on the small deformation assumption. Wagner et al. [5] proposed a reliable design method for spherical shells based on a robust knockdown factor. Krenzke and Kiernan [6] conducted experimental tests on a large number of spherical shells, and concluded a method to calculate the ultimate strength. However, spherical shell is a positive Gaussian rotation structure, and its ultimate strength is sensitive to structural dimensions, defects, and material properties [7]. Yu et al. [8] and Zhang et al. [9] introduced imperfections to the model and analyzed the ultimate strength of spherical shells. Wagner et al. [10] presented and compared modeling details of commonly used new approaches for shell design, and evaluated the lower-bound buckling pressure. Pan et al. [11,12] summarized and verified the empirical formula for ultimate strength calculation of spherical shells made of titanium alloy, and indicated that the influence of welding on ultimate strength cannot be ignored. Zhang et al. [13] investigated the ultimate strength of externally pressurized steel spheres considering through-thickness defects. Zhu et al. [14] proposed a prediction formula for local buckling calculation of spherical shells, considering local corrosion. Zhao and Bai [15] conducted a comparative study on various analytical approaches and codified rules, and established the model evaluation criteria by implementing statistical model uncertainty factors. In addition, spherical shells are assembled with cylinders or cones, and the mechanical characteristics become more complex [16,17].
Uncertainty is inevitable in all aspects of manufacturing, including modeling and testing. Cerik et al. [18] defined the modeling uncertainties by probabilistic characteristics based on experimental data, and evaluated the influences of random geometrical and material properties on the failure assessment. MacKay et al. [19] investigated the accuracy of model prediction for collapse pressure of a pressure hull by taking uncertainty factors into account, and the uncertainty level in the numerical evaluation of limit states of submarine pressure hulls has been quantified. Qiu et al. [20] performed uncertainty analysis for an axial flow waterjet pump based on the computational fluid dynamics method. Reed and Earls [21] presented a detailed study on identifying and characterizing imperfections of a representative ship hull, along with concomitant uncertainties. However, when different kinds of uncertainties are considered in the modeling and experimental phases, the uncertainty propagation and quantification process become more complex [22].
Currently, the verification and validation (V&V) theory is used in evaluating the credibility of model predictions in many areas [23,24,25], especially for cases considering combined uncertainties. Long et al. [26] introduced the delayed detached eddy verification and validation method, and evaluated the reproduction and prediction performance of simulation under the uncertainty condition. Matsuda and Katsui [27] employed the V&V method to study uncertainties in the turbulence model for viscous resistance estimation. However, few of them concentrate on the hybrid uncertainty condition, which is more common in the real world. The probability box (p-box) is an efficient method to deal with hybrid uncertainties, and it has great potential for engineering applications. Faes et al. [28] presented the state-of-art review for the modeling and propagation of uncertainties using p-box, especially for the conditions of structural reliability analysis. Vinuesa and Cuervo [29] demonstrated uncertainty analysis based on the p-box method by using nested random sampling. Wu et al. [30] investigated the sensitivity analysis for numerical and engineering case studies based on the p-box method, and the influences of input parameters on the output responses were quantified. Zhang et al. [31] proposed a novel reliability assessment method for turbine discs by combining fuzzy and p-box variables; the proposed method performed well in transforming non-normal variables and decreasing computational costs.
As shown above, the ultimate strength is an important characteristic for evaluating the performance of spherical shells. Until now, most studies on spherical shells were conducted on the deterministic premise. However, uncertainties are everywhere in the simulation and experimental tests. The studies ignoring uncertainties will lead to some misjudgment of the engineering decisions. While some potential methods are being applied in critical fields to improve design safety and service reliability, deep studies considering uncertain factors for spherical shells should be conducted to improve the credibility of prediction.
The present paper aims to investigate uncertainties of ultimate strength for spherical shells subjected to external pressure. Compared with the works published in the literature, aleatory and epistemic uncertainties are considered simultaneously in this study, which can be regarded as the highlight of the research. The works presented in this paper extend the analysis of ultimate strength of spherical shells to a stochastic premise which makes the comparison between simulation and experimental results more reasonable.
The rest of this paper is organized as follows: Section 2 introduces some basic methodologies of the p-box and surrogate models for ultimate strength. 
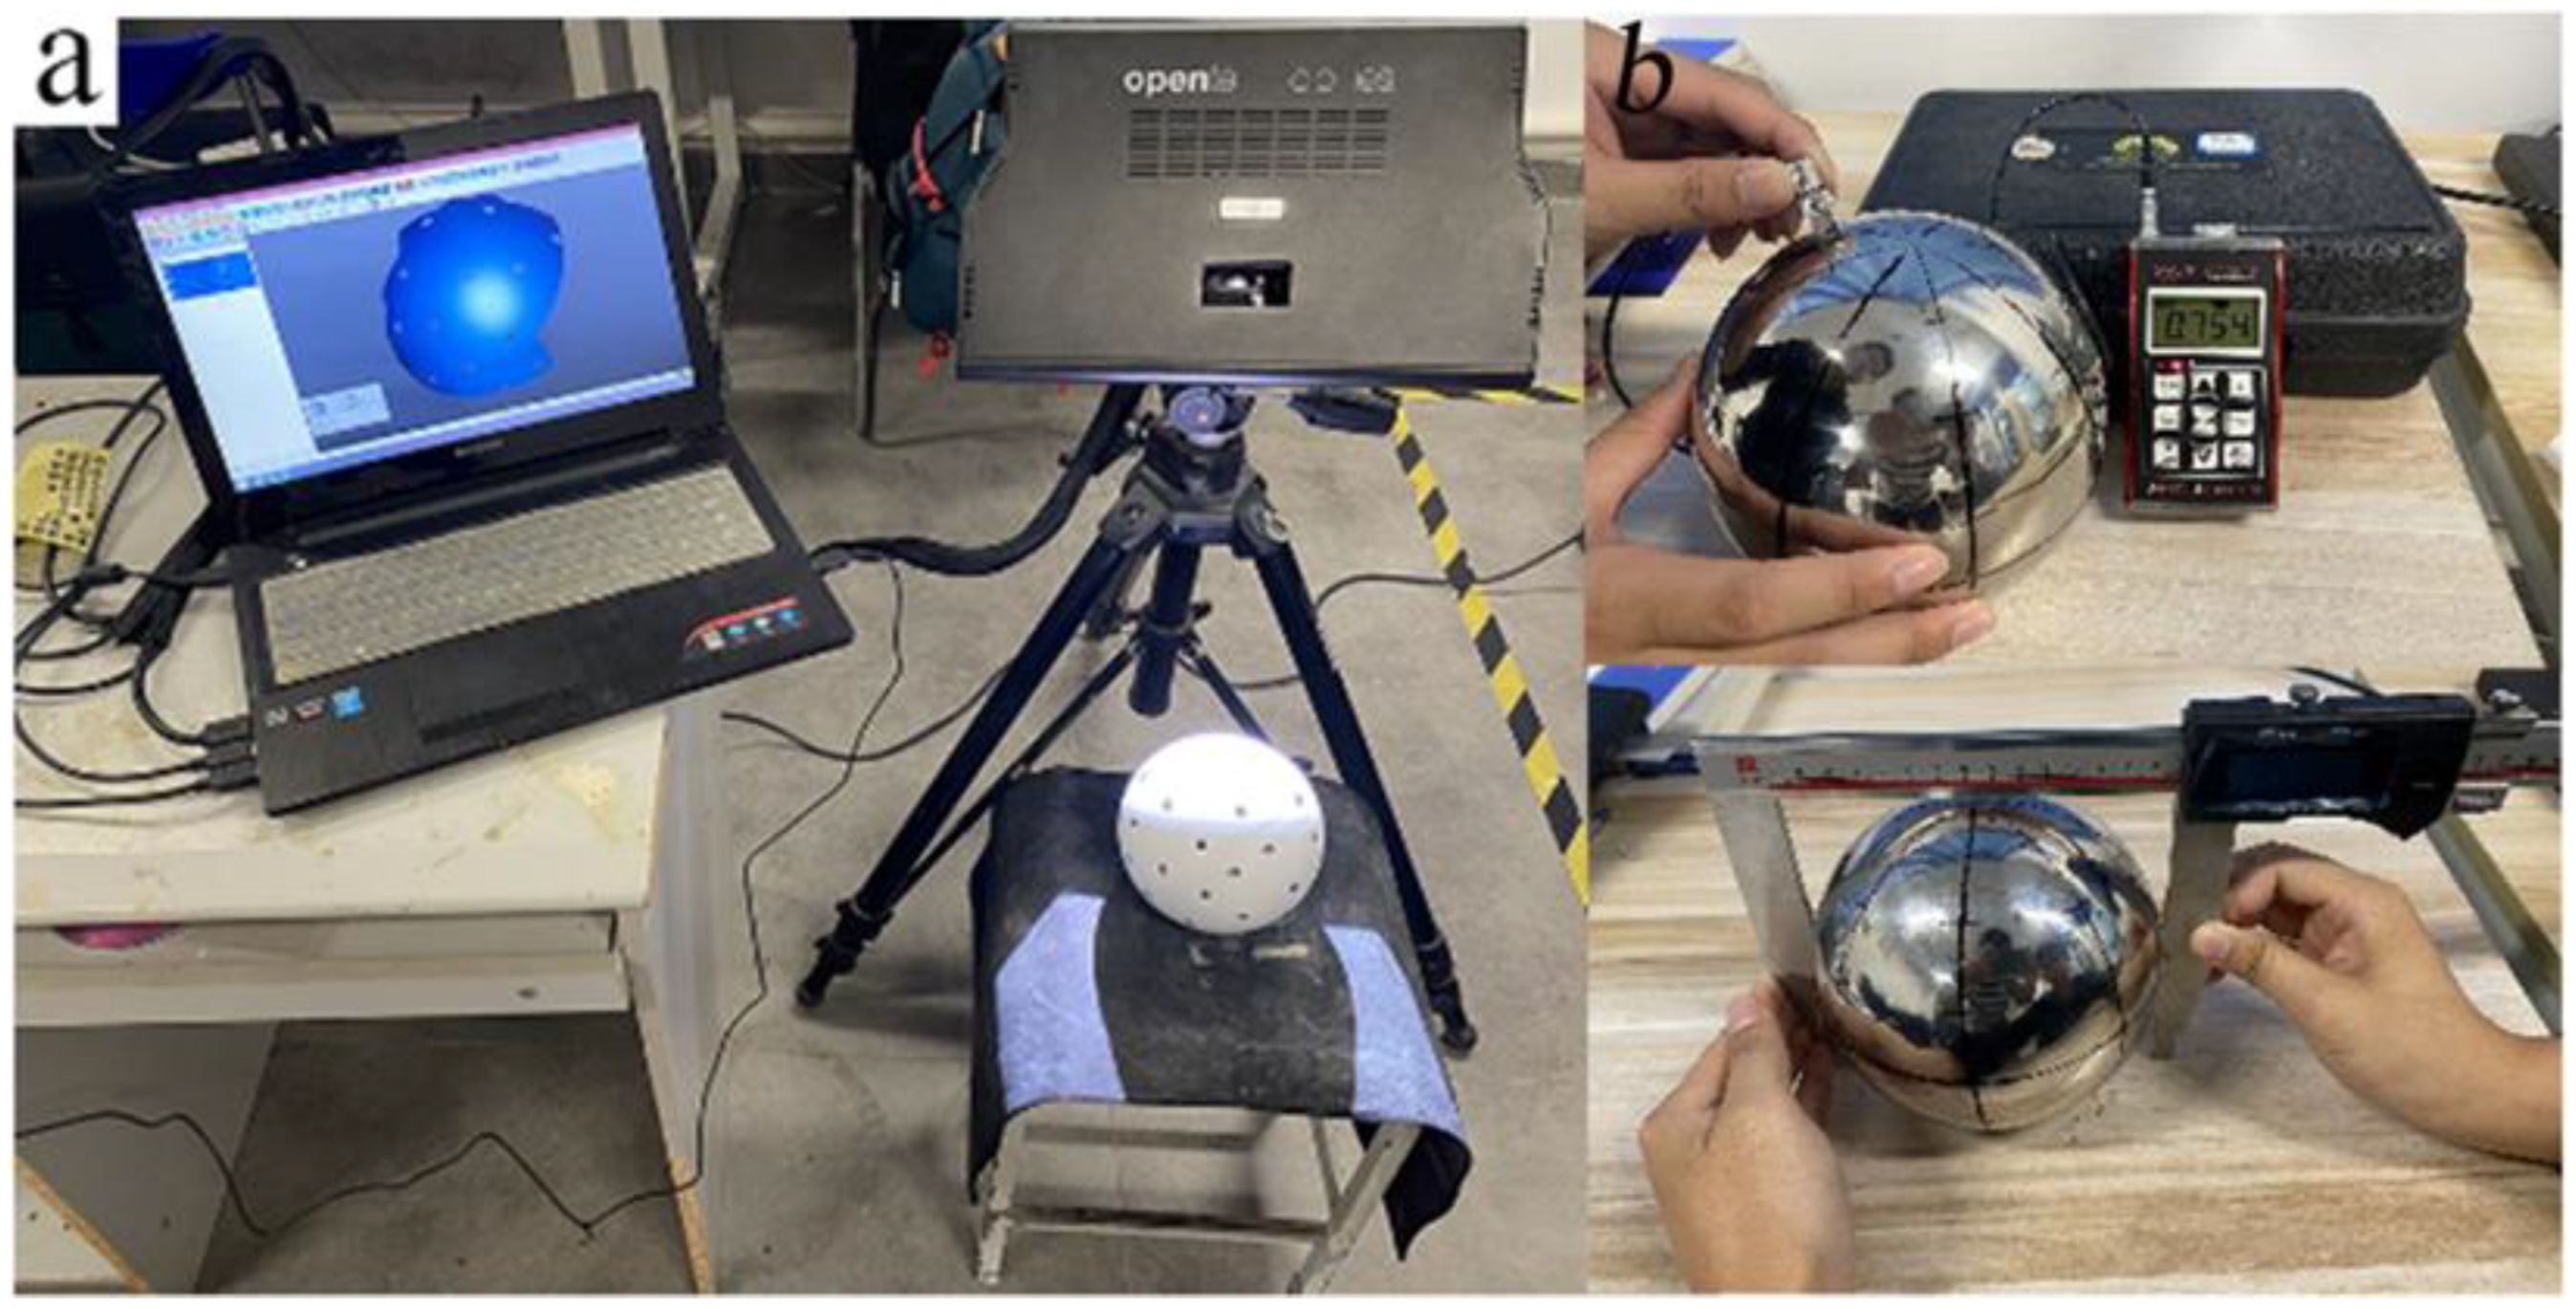
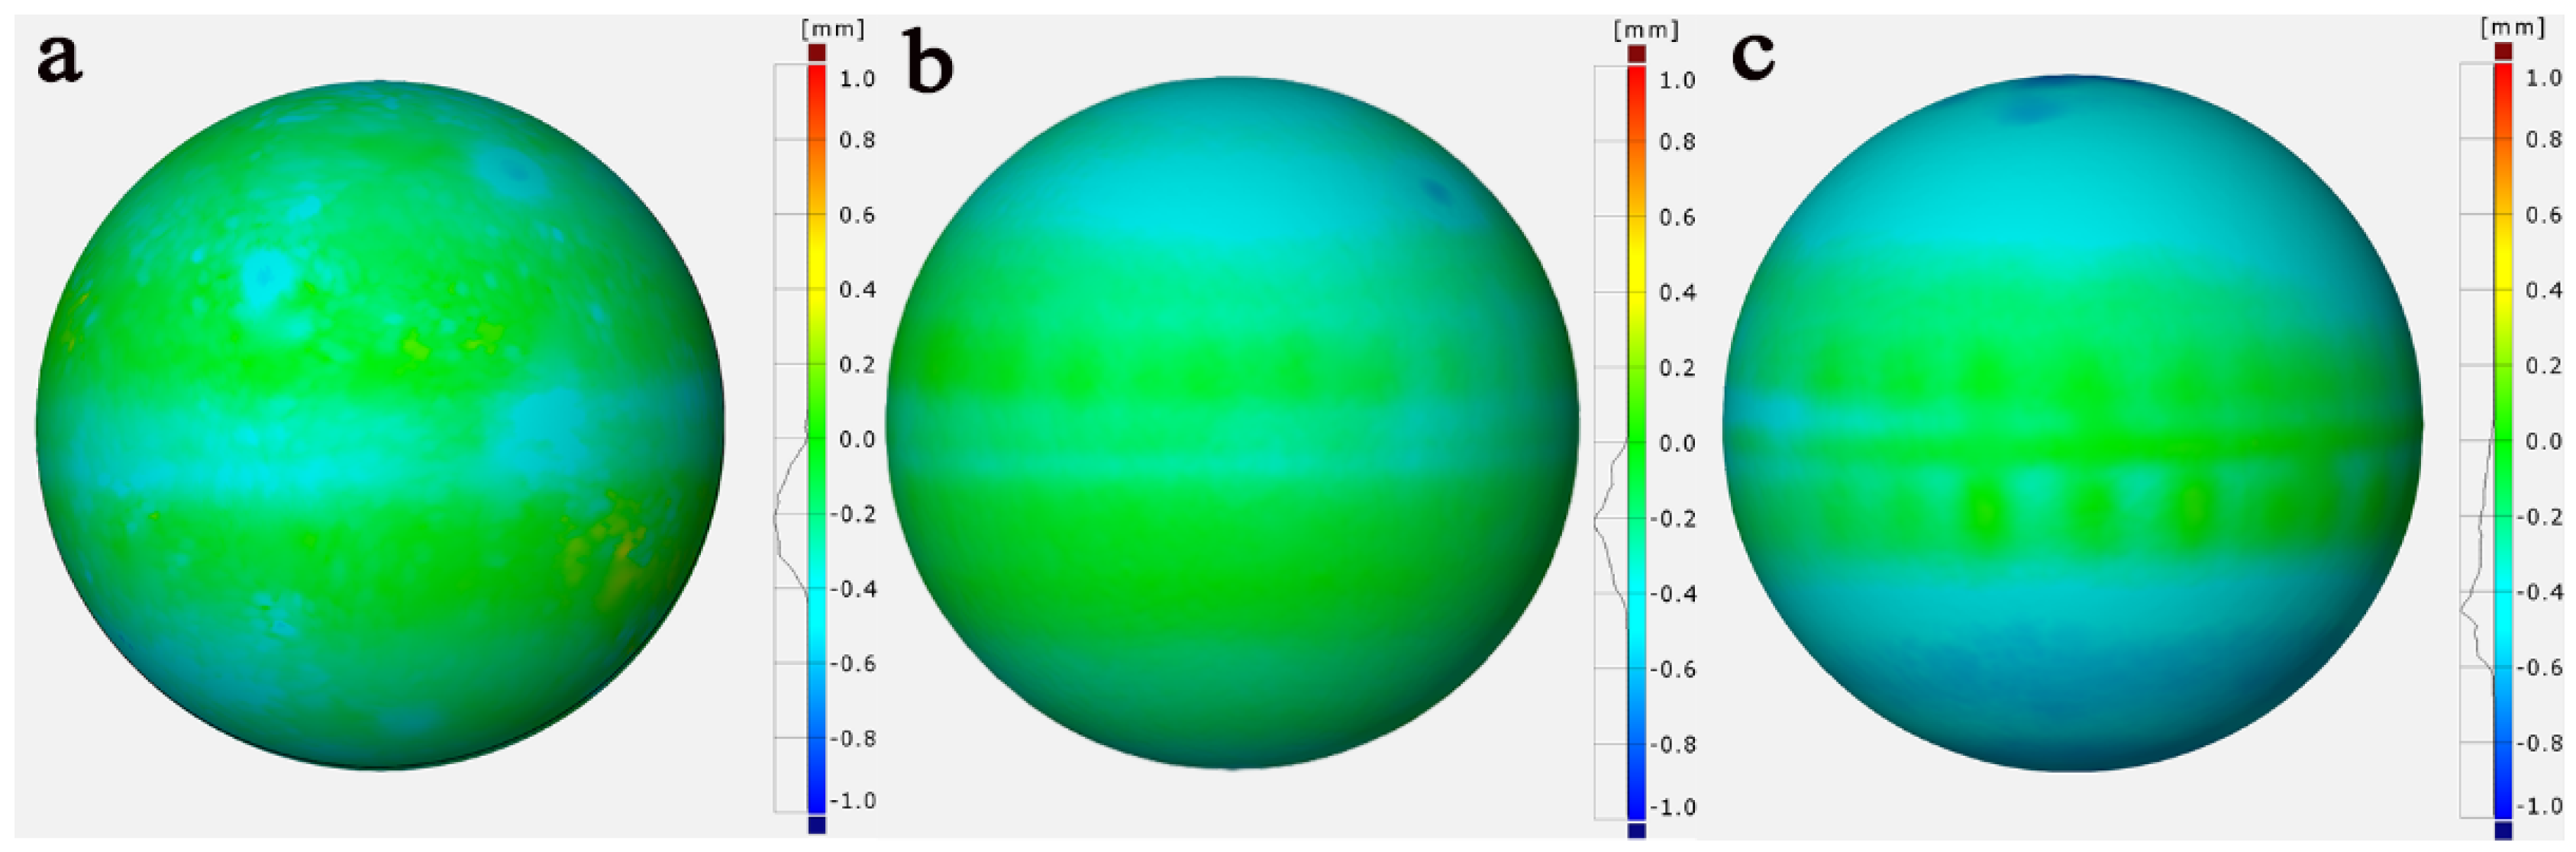
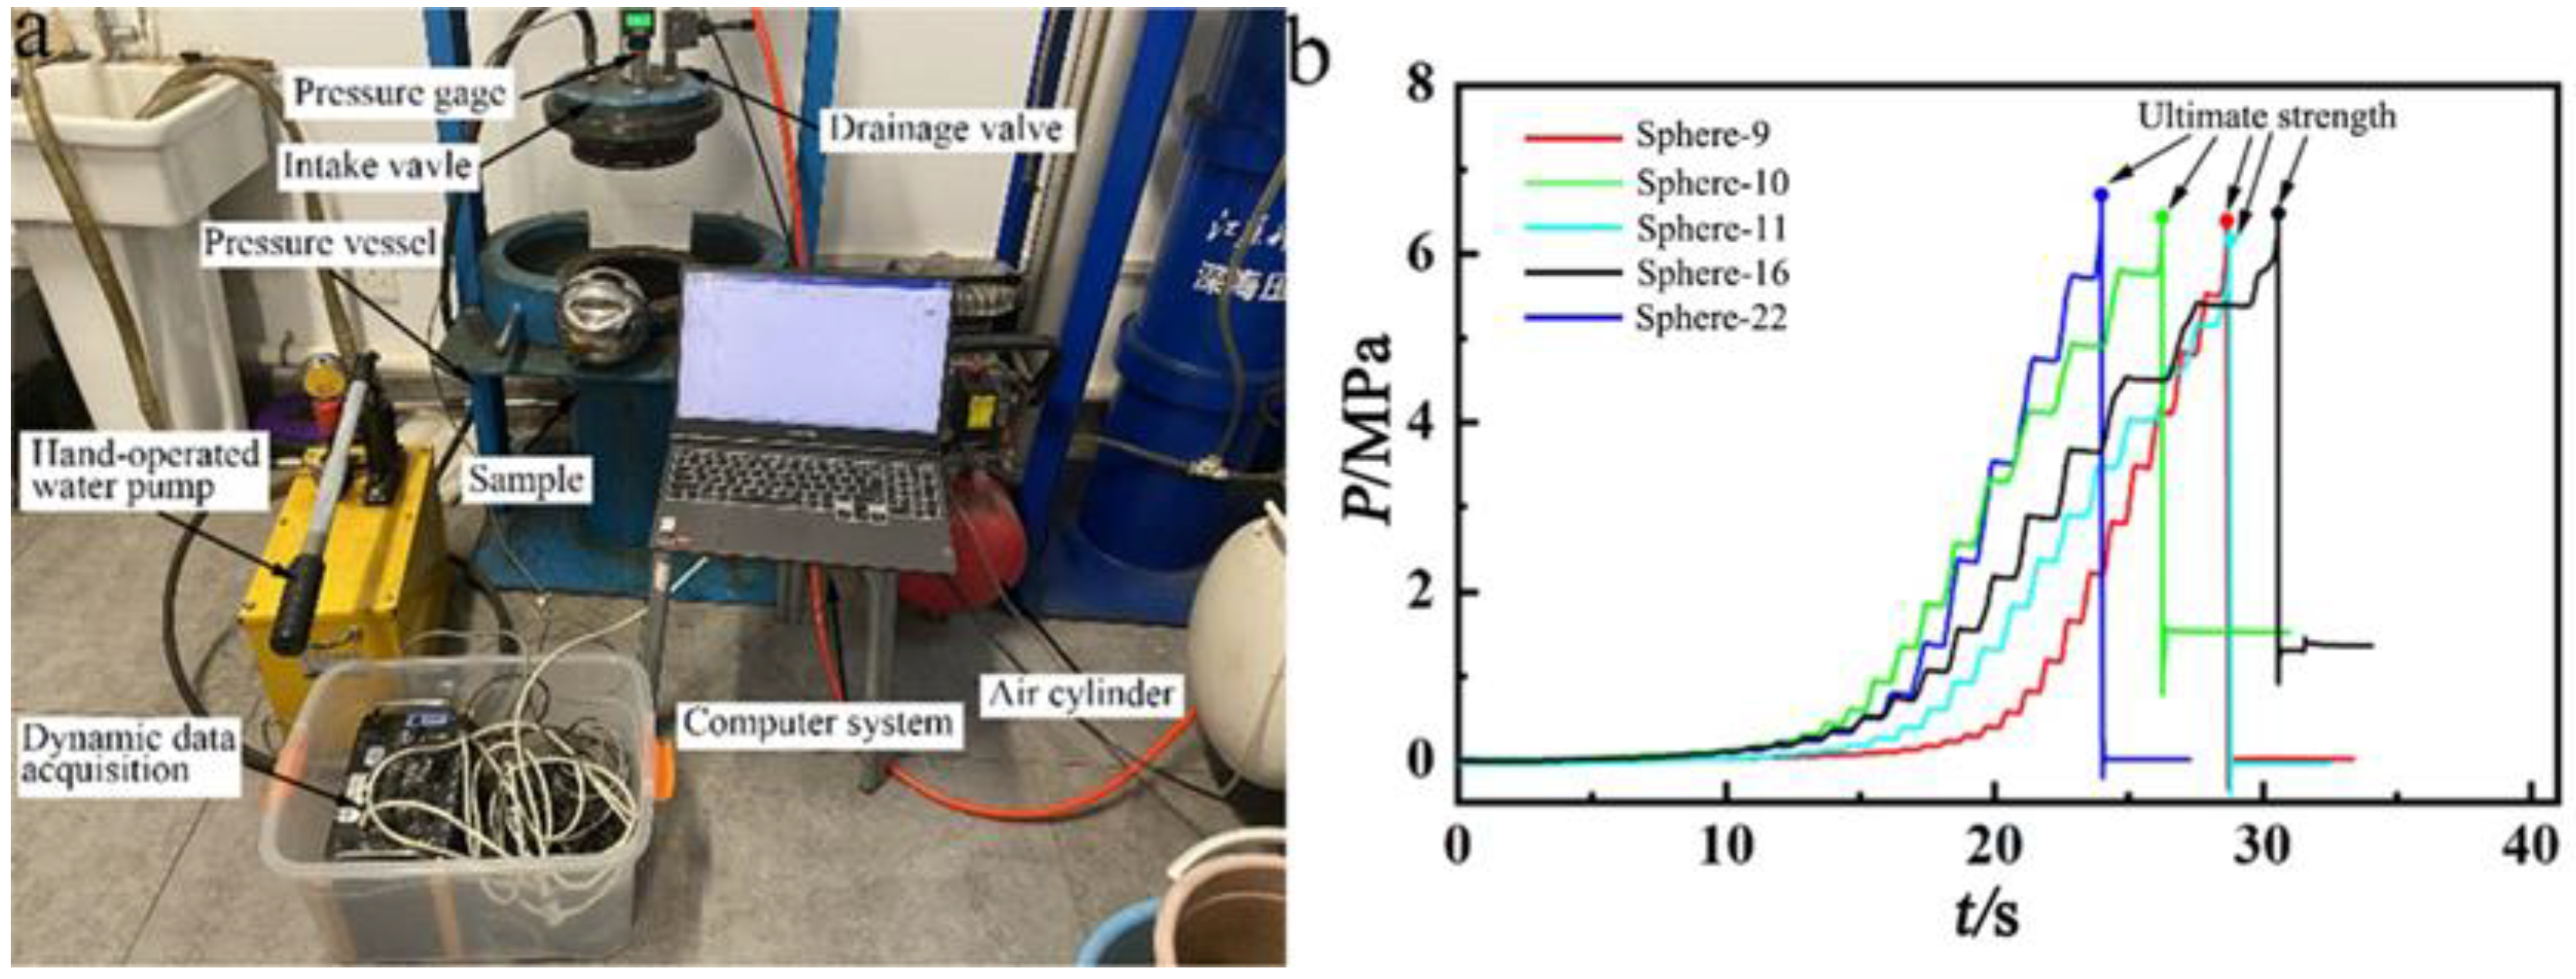
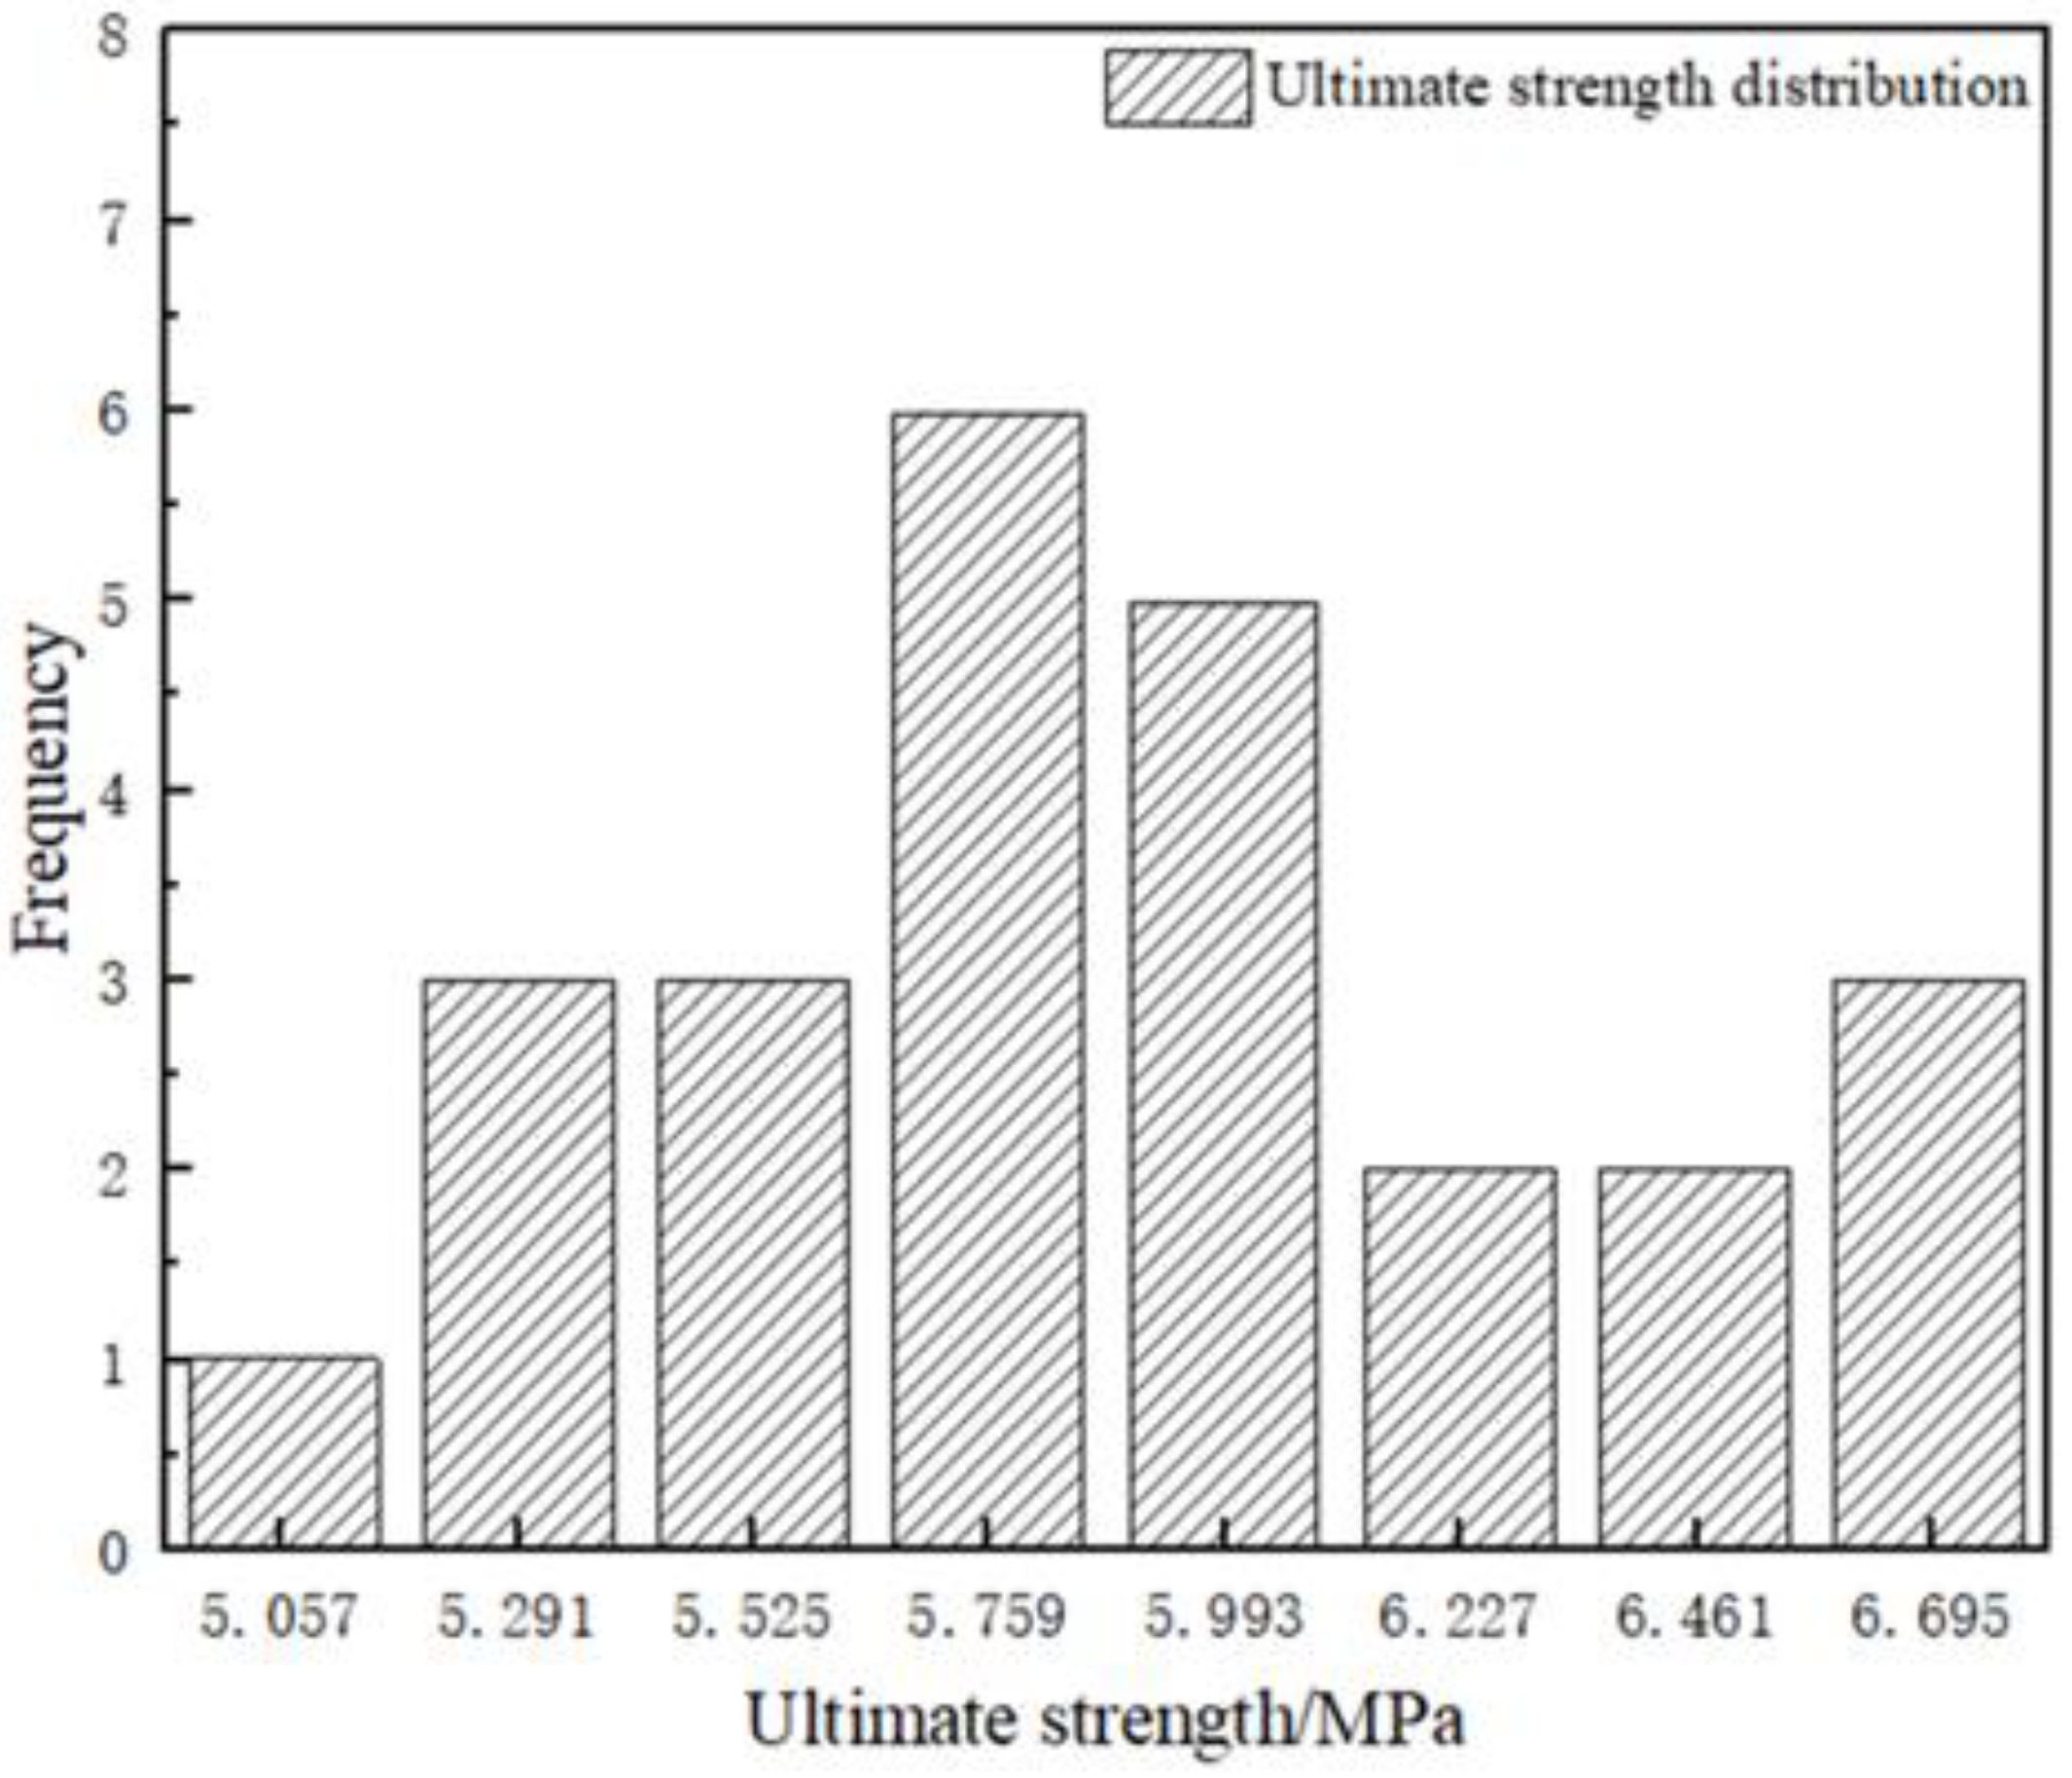
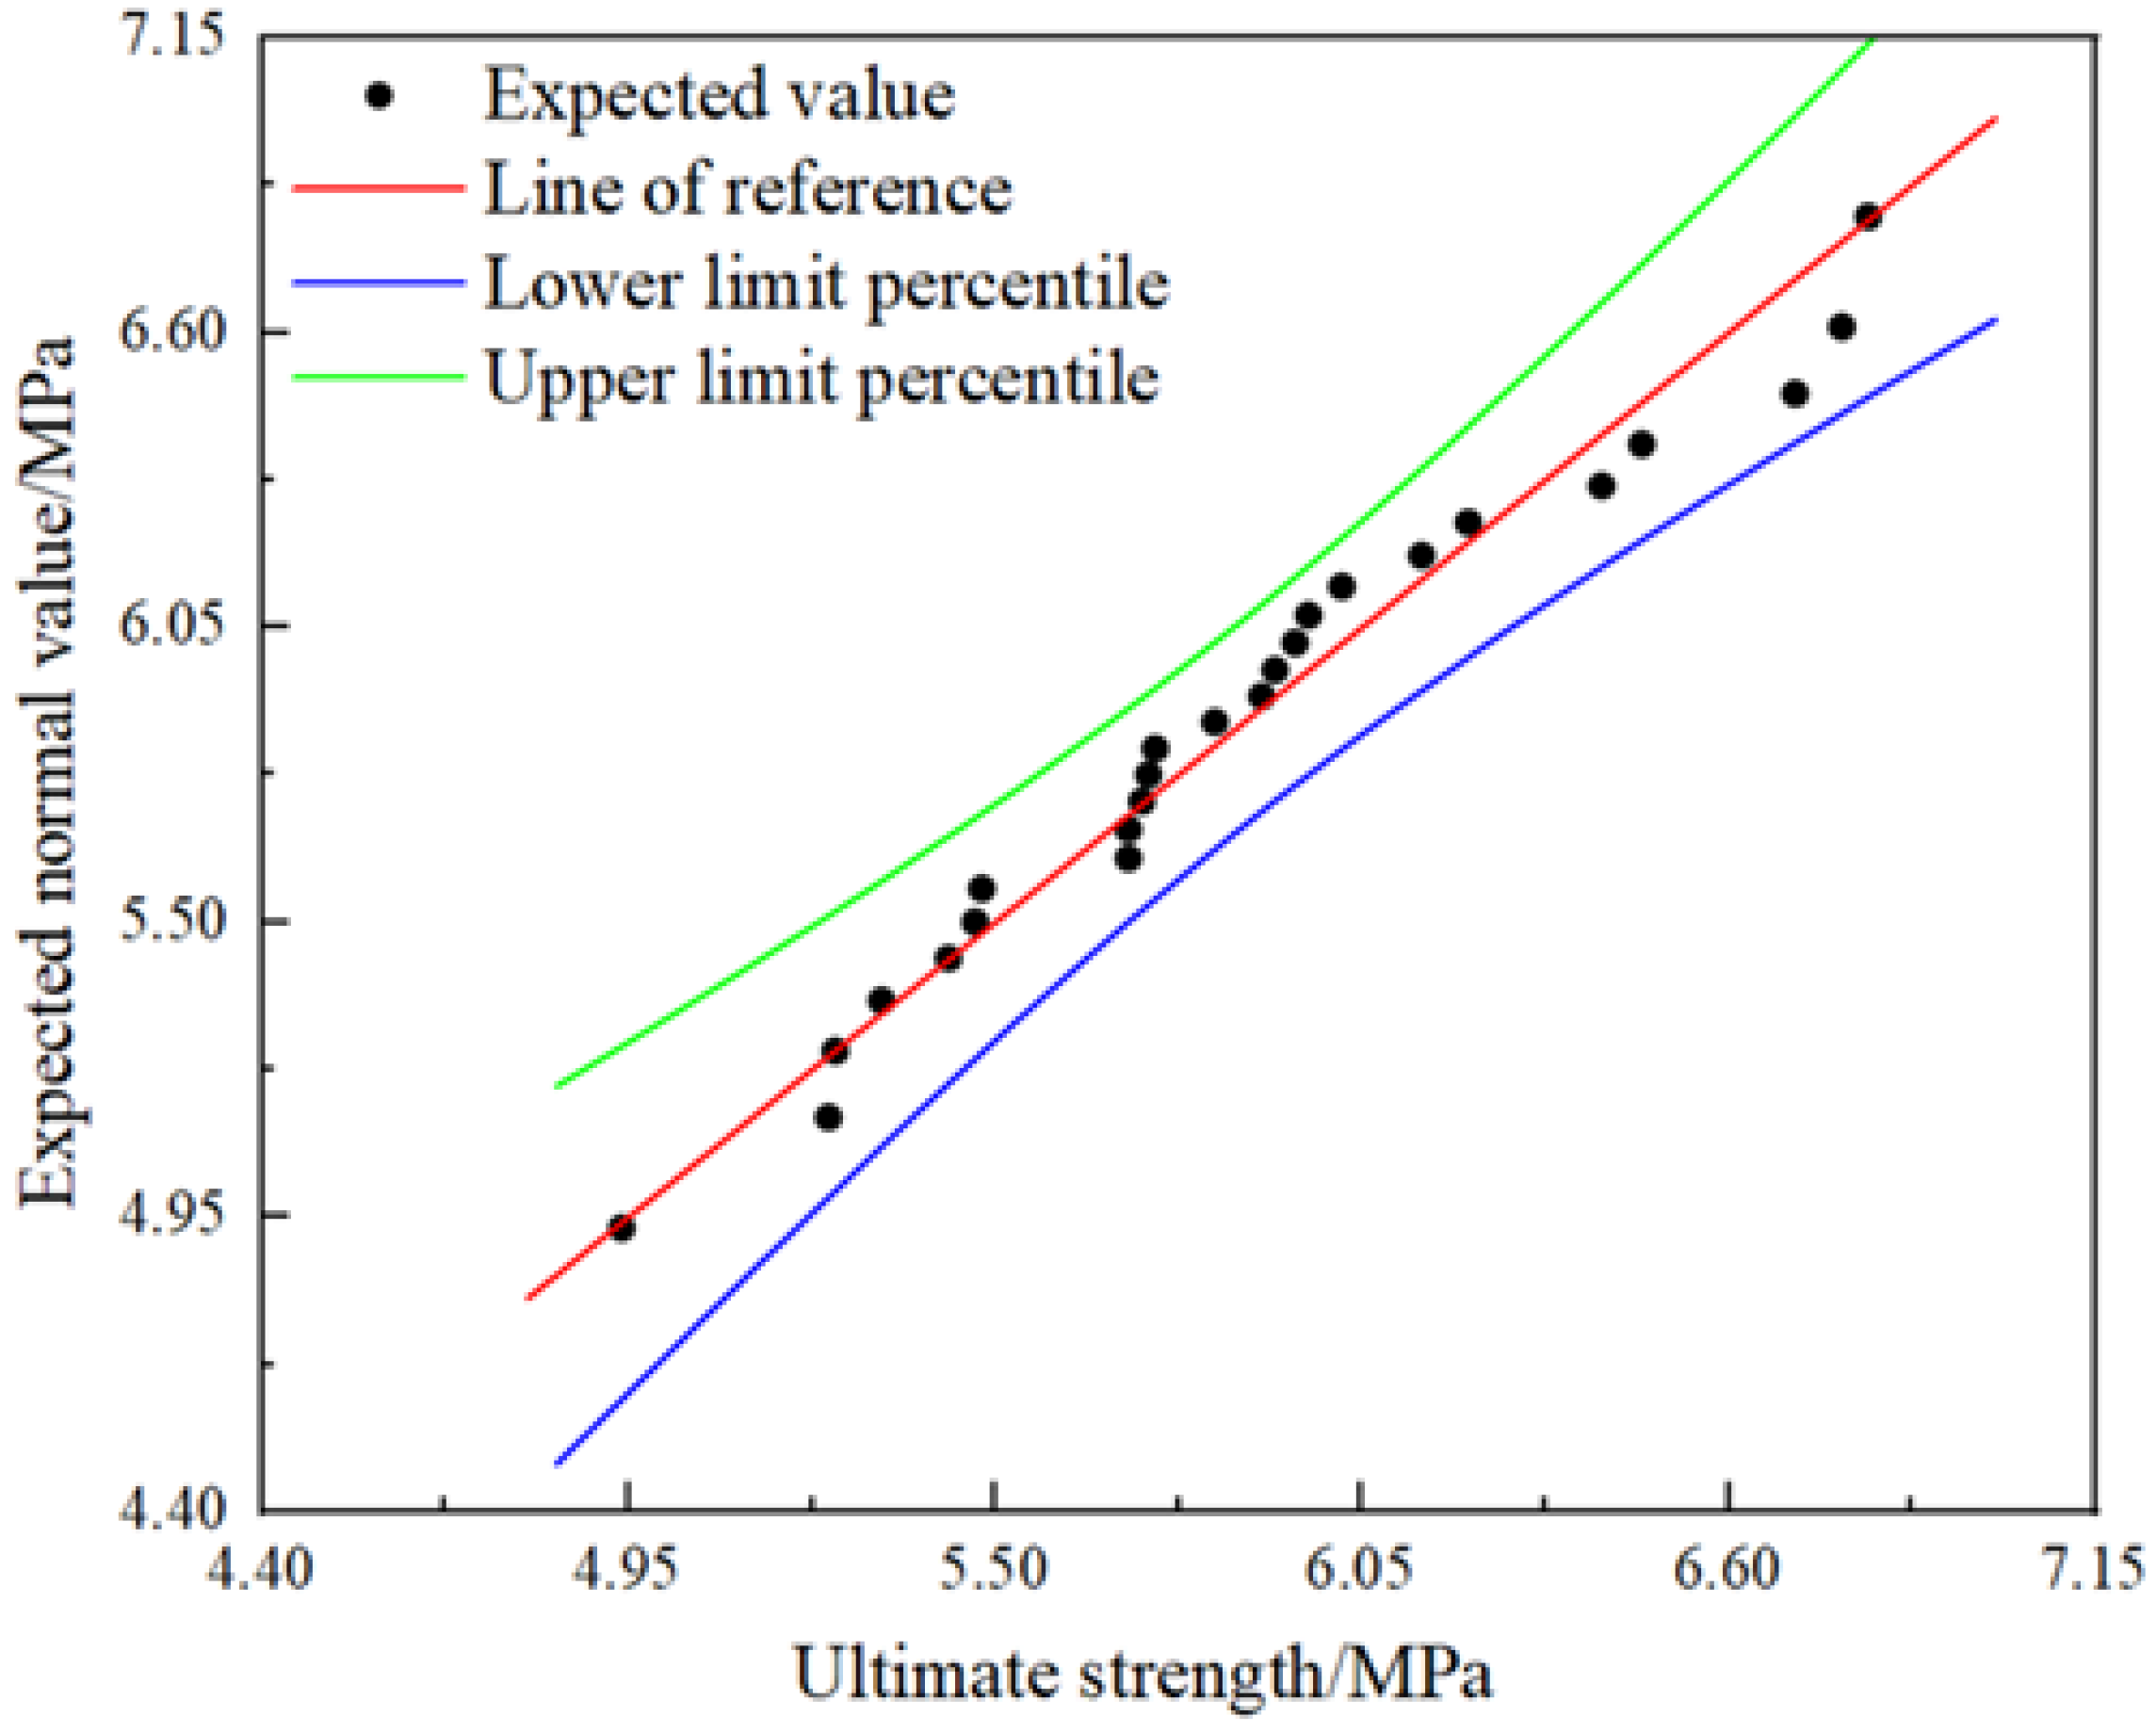
Section 3 presents the experimental studies, including the test details regarding the dimensions and ultimate strength, as well as the analysis of the test results. Section 4 establishes the Gaussian process (GP) model of ultimate strength, and the p-box of ultimate strength is obtained based on the highly precise surrogate model. In the same section, uncertainty analysis of ultimate strength is conducted by comparing experimental and simulating results in the stochastic frame. The conclusions of this paper are summarized in Section 5.

2. Materials and Methods

Uncertainty is inevitable in the simulations and experimental tests of spherical shells. The probability-box method for ultimate strength analysis, considering aleatory and epistemic uncertainties simultaneously, is introduced. Meanwhile, in order to save computational costs, a representative surrogate model, called the GP model, of ultimate strength is also demonstrated in this section.

2.1. Probability-Box of Ultimate Strength

The probability-box method is a mixed probabilistic model commonly used for uncertainty analysis in cases that contain aleatory and epistemic uncertainties simultaneously. Given that the quantity of interest in the ultimate strength of spherical shells subjected to external pressure, while the estimated value of ultimate strength, denoted as Y, is not deterministic, the corresponding cumulative probability distribution function (CDF) cannot be expressed by a single non-decreasing curve. Suppose F Y I is a space of CDF of ultimate strength defined in the real number field , according to Ferson [32] and Chen [33], the p-box of ultimate strength can be expressed as follows:
F Y I = F Y : Y , F ¯ Y y F Y y F ¯ Y y
in which F ¯ Y y = P ¯ Y y and   F ¯ Y y = 1 P ¯ Y > y are non-decreasing functions defined in [0, 1]. Meanwhile, F ¯ Y y and   F ¯ Y y represent the lower and upper bounds of the p-box, respectively. F Y y is a non-decreasing function that denotes all probable CDFs between the bounds.
As is shown in Figure 1a, the left bound F ¯ Y y is an upper bound of probabilities and a lower bound of y-values. Any point on the left bound F ¯ Y y represents the maximum probability at a deterministic ultimate strength y, or the minimum ultimate strength y at a deterministic probability. Likewise, the right bound F ¯ Y y is a lower bound of probabilities and an upper bound of y-values. In addition, the p-box represents an interval containing all probable values of ultimate strength y at a deterministic probability, and an interval of all probabilities at a deterministic ultimate strength y. Special cases of the p-box are shown in Figure 1b–d. Figure 1b,c shows cases that contain only aleatory and epistemic uncertainties, respectively. Figure 1d is the deterministic case in which all uncertain factors are ignored.
For academic and engineering problems that can scarcely be described as explicit mathematic models, the p-box is usually established, utilizing double-nested random sampling. The outer layer sampling represents the epistemic uncertainties, and the inner layer represents aleatory uncertainties. In addition, the sampling size of the outer layer is much smaller than that of inner layer.

2.2. Surrogate Model of Ultimate Strength

The surrogate model presented in a mathematical form is commonly used to replace time-consuming finite element analysis, especially for analyses such as nonlinear buckling and explicit dynamics. The Gaussian process model is a representative surrogate model that is used in stochastic modeling to represent the relationship between model inputs with model outputs [34].
Suppose D = X , Y is a dataset of ultimate strength and its influence parameters, while X = x 1 , x 2 , , x N R N × d is an N by d matrix that represents the parameters such as material properties and shell thickness of the spherical shells, and the component x i = x i 1 , x i 2 , , x i d , i = 1 , 2 , , N represents a single group of model inputs. Meanwhile, Y = f x 1 , f x 2 , , f x N R N × 1 is a vector of ultimate strength. In this case, the GP model of ultimate strength can be formulated as follows:
f x G P μ x , v x , x
in which, μ x = E f x is the mean function, and v x , x = cov f x , f x is the covariance function. In addition, f x represents any assumption that satisfies the joint Gaussian distribution.
The regression model, considering the effects of random noise, can be written as:
y i = f x i + ε i
in which, y i is a prior value of ultimate strength corresponding to the model input x i , f x i is the ultimate strength calculated by the GP model at x i , and ε i N 0 , σ n 2 represents independent identically distributed random white noise.
According to the Bayesian theory, the joint Gaussian distribution of dataset D and its prediction points can be expressed as:
Y Y p N 0 , V + σ n 2 E V p T V p V p p
in which, Y p is the predicted ultimate strength, V is the assembled covariance matrix of the input sample, V p is the covariance matrix between the input sample and prediction points, and V p p is the variance of the prediction points. In addition, E is a unit matrix with dimensions N by N.
While the surrogate model is established, precision inspections should be conducted to verify its reproduction and prediction capability. The determination coefficient ( R 2 ) and the root mean square error ( R M S E ), which are defined as Equations (5) and (6) [35], are two commonly used indexes in precision inspection.
R 2 = 1 S S E S S Y = 1 i = 1 N m y m i y r i 2 i = 1 N m y m i y ¯ 2
R M S E = S S E N m = i = 1 N m y m i y r i 2 N m
while the value of R 2 is closer to 1 and that of R M S E is closer to 0, indicating a better accuracy of the surrogate model. Moreover, only modeling sampling is used to establish the surrogate model during the modeling phase. In order to ensure the repeatable and predictable capability of the established surrogate model, modeling and inspection sampling groups should be generated separately, and both groups should meet the requirements of precision inspection.

3. Experimental Studies

Experimental tests on spherical shells, including dimensional measurements and hydrostatic pressure tests considering uncertainties, are presented in this section. In order to investigate the uncertainty characteristics of dimensions and ultimate strength, a total of 25 nominally identical spherical shells, with diameters of 150 mm and thicknesses of 0.8 mm, are manufactured and tested. Each shell is made of two semi-spheres by welding at the equatorial free edges, and both semi-spheres are manufactured by punch forming from square 304 stainless plates.

3.1. Measurement of Dimensions

Dimensional measurements are carried out to evaluate the variance of shell thickness. On one hand, 3D scanning is conducted by an industrial-grade 3D scanner with a scanning accuracy of 0.02 mm from Open Technologies, and 50 measuring points are distributed randomly on the surface of each spherical shell. On the other hand, 8 longitudes and 6 latitudes are uniformly distributed on the surface of the spherical shell, and the thickness at all the cross points is measured by a non-destructive ultrasonic thickness gauge. The 3D scanning and thickness measurement test sites are shown in Figure 2a,b.
The scanning results are compared with the corresponding nominal structural dimensions, and three typical comparisons are shown in Figure 3. The stochastic characteristics of thickness are listed in Table 1, and the statistical distribution of thickness is shown in Figure 4.
As the manufacturing processes of punching and welding for thin plates are relatively mature, an excellent geometrical consistency is obtained between 3D scanning and nominal structure evaluation. The geometrical error in the main part of shell shown in Figure 3 is less than 0.4 mm, which is about 0.5% of the sphere radius. The maximum error in the radial direction is 0.6 mm, and the error is clustered in a very small region. In addition, an obvious separation line is shown in the figure indicating the interface between two individual semi-spheres.
The thickness of the spherical shell varies randomly over the structure, as is shown in Table 1. The minimum coefficient of variation for the shells is 4.206%, and the maximum is 6.214%, indicating a significant variability of thickness in each shell. Moreover, from Figure 4, the distribution of thickness at all test points presents like a normal distribution, with a mean and standard deviation of 0.753 and 0.037, respectively. The relative error between the mean values of the fitted distribution and the experimental measurement is −0.39%, and that between the standard deviation is −4.60%. Meanwhile, the coefficient of variation for the fitted distribution is very close to the mean value between the maximum and the maximum result obtained from experimental measurements. As a result, the shell thickness in the main body can be treated as aleatory uncertainty and described by the fitted normal distribution.
In order to check the inside morphology, all spherical shells are cut up after collapse. To account for the effect of welding on structural performance, the thickness in the welding region is also measured in this section. The stochastic characteristics of thickness, as well as its comparison with that in the main body, are listed in Table 2. Meanwhile, the distribution of thickness in the welding region of a typical shell (22#) is shown in Figure 5.
The thickness in the welding area is thinned and randomly distributed compared to that in the main body because of fusion in the welding process. An obvious welding seam with about a 6 mm width, symmetrically distributed on both sides of the interface, can be seen in the welding area in Figure 6. In addition, a crack-shaped free edge exists on the inner side of the seam due to the fact that this site cannot be welded directly. For experimental results of different spherical shells listed in Table 2, the mean value of the thickness in the welding region is about 0.545 to 0.736 times that in the main body. However, the measured thickness in the welding region shown in Figure 6 varies randomly, and it cannot be fitted by a normal distribution. The influence of thickness thinning caused by welding will be investigated in the following section.

3.2. Measurement of Ultimate Strength

Hydrostatic pressure tests are conducted on all test pieces after the dimensional measurements, and the corresponding ultimate strengths are obtained. The test site is shown in Figure 7a, and five typical loading curves are presented in Figure 7b. In the experimental process, external pressure is applied by a hydraulic pump, and the loading speed is less than 0.3 MPa/s, which can be regarded as a quasi-static load case. The ultimate strengths of all test pieces are listed in the last column of Table 2, and the corresponding distribution is shown in Figure 8. Meanwhile, the quantile-quantile graph shown in Figure 9 is used to validate the normality of the measured ultimate strength.
Due to the variation in material properties and shell thickness, as well as uncertain factors caused by manufacturing, the ultimate strength of the nominally identical spherical shells can be different from each other. The histogram of measured ultimate strength shown in Figure 8 is approximately subordinate to a logarithm normal distribution. Meanwhile, in Figure 9, the ultimate strength values are distributed closely on both sides of the reference line, which indicates a good consistency between the measured and the expected normal values. The mean value and standard deviation of the measured ultimate strength are 6.019 MPa and 0.580 MPa, respectively. The variation coefficient of the tested ultimate strength is 9.64%, indicating an obvious randomness of the nominally identical spherical shells.
The welding results in a relatively smaller stiffness in the welding region than that in the main body. Consequently, the existence of a welding seam can dramatically affect the ultimate strength of the spherical shell, and the spherical shell is first collapsed in the welding region. The collapse mode of the spherical shell is shown in Figure 10. An obvious pit is generated over the welding region, and the pit is distributed symmetrically, with respect to the welding seam.

4. Results and Discussion

This section presents the uncertainty analysis of the ultimate strength of the spherical shells subjected to external pressure. The uncertainty of ultimate strength for the spherical shells in both cases is analyzed and compared with the experimental results. Two case studies are employed to demonstrate the influence of welding on the results, one of them is performed on the perfect spherical shell that ignores the welding seam, and the other is conducted on the case considering the thickness thinning in the welding region.

4.1. GP Model of Ultimate Strength

In order to save the computational costs in the uncertainty analysis, a highly precise GP model for the calculation of ultimate strength is established and inspected in this subsection.

4.1.1. Finite Element Modeling

The ultimate strength of the spherical shell subject to external pressure is calculated utilizing the nonlinear buckling method, which can be performed by elastic-plastic Riks analysis in Abaqus.
A parametric model, shown in Figure 11, is established to map the real spherical shell into the numerical space. In the modeling stage, two-dimensional (2D) elements with a mesh size of 3 mm, determined by the mesh convergence index, are used. A total of 9128 elements and 9126 nodes are contained in the model. The model is mainly meshed by linear quadrilateral elements of type S4R, which occupy about 99.91% of the total amount of the elements, and the rest are linear triangular elements of type S3. However, in order to investigate the influence of the welding seam, the elements in the main body and those in the welding region, shown in the red box in Figure 11, are assigned with different uniform thicknesses.
While a spherical shell is subjected to uniform external pressure, a relatively small thickness-to-radius ratio of the structure will lead to elastic-plastic buckling. As a result, the ideal elastic-plastic material constitutive model, including yielding strength, is used here. The material properties of 304 stainless steel spherical shells, given by the manufacturer, and initial values of thickness in different regions are shown in Table 3.
In order to eliminate rigid motions, the symmetrical boundary condition recommended by CCS 2018 [1] is adopted. The displacements at three nodes, separated from each other by 90 degrees, are constrained, as shown in Figure 11. All the constrained nodes are on the welding seam. A unit pressure is applied uniformly on the outside surface of the spherical shell in the Riks analysis. The equilibrium path curve of the spherical shell is presented in Figure 12, while the thicknesses and material properties are listed in Table 3.
The collapse mode shown in Figure 12 is identical to the experimental result shown in Figure 10. The point of maximum displacement is located on the welding interface. The abscissa is defined as the maximum displacement to thickness ratio of the main body (u/t) to show the amount of displacement more intuitively. With the increase in abscissa, the equilibrium curve rises sharply in a narrow range, and then falls slowly after the pressure reaches ultimate strength. In addition, the maximum stress occurs in the welding region, according to the stress distribution at the critical load point. By combining the stress distribution and collapse mode, a smaller stiffness in the welding region can be inferred relative to that in the main body.

4.1.2. GP Modeling and Inspection

A GP model of ultimate strength for spherical shells is established, considering the uncertain parameters. Given the uncertain factors due to different production batches and manufacturing processes, the material properties and the shell thickness in the main body and the welding region are regarded as uncertain parameters. The ultimate strength of the spherical shell is regarded as the response.
Firstly, Latin hypercube sampling is used to generate two groups of variables, the modeling group and the prediction group, with 2000 and 200 samples, respectively. The bounds of variables are listed in Table 4. In order to eliminate the boundary effect of the surrogate model, the bounds are a little wider than those determined by the dimensional measurements or recommended by the manufacturer. Secondly, both of these two groups of model inputs are substituted into the above finite element model to calculate the corresponding ultimate strength. Then, the GP model is established to describe the relationship between the model inputs and the quantity of interest. At last, the precision factors listed in Table 5 are calculated to verify the precision of the established surrogate model. The surrogate model is shown in Figure 13.
The established GP model of ultimate strength is highly nonlinear, but exhibits excellent precision. As is shown in Figure 13, the ultimate strength varies nonlinearly over the design space of uncertain parameters. Meanwhile, from Table 5, the determination coefficient R2 of the GP model for the modeling and prediction sample groups are 1.0 and 0.998, respectively. In addition, the RMSE of the model for the two sample groups is 2.138 × 10⁻¹⁴ and 0.008, respectively. The R2 is close to 1, and the RMSE is close to 0, indicating an excellent reproduction and prediction capability of the established GP model. As a result, the established GP model is accurate enough to replace the finite element model to predict the ultimate strength in further uncertainty analysis.

4.2. Uncertainty Analysis of Ultimate Strength

Two uncertainty analysis cases for ultimate strength are studied in this subsection. Firstly, the welding region is neglected, i.e., the material properties and thickness of shells in the whole model are both regarded as identical (case I). Then, the influence of welding is included, and the material properties, as well as shell thickness in the main body, are assigned different values from those in the welding region (case II).
Different distributions should be employed to characterize the uncertain parameters in the analysis of ultimate strength of the spherical shells. The material properties are usually regarded as aleatory uncertainties and are described by normal distributions [35]. The thickness of the shell in the main body, shown in Figure 4, is approximate to a normal distribution. Herein, it is regarded as aleatory uncertainty. However, less information can be obtained about the distribution of thickness in the welding region, and it is treated as epistemic uncertainty and described by a uniform distribution. Due to the nonlinear variation of thickness in the welding region, the mean value of thickness on the welding seam and that of the main body are used to determine the bounds of uniform distribution for the equivalent thickness of the welding region. According to the material properties from the manufacturer and the results of dimensional measurements, the stochastic characteristics of the uncertain model inputs are listed in Table 6.
Uncertainty analysis of the ultimate strength of spherical shells is conducted using the double-nested sampling method. In case I, the influence of welding is ignored, i.e., no epistemic uncertainty is considered in the analysis. Consequently, the p-box degenerates to an empirical CDF curve, as shown in Figure 1b. In this case, the thickness of the whole model in the main body and the welding region are regarded as an identical value. A total of 2000 samples of aleatory uncertainties for material properties and shell thicknesses are generated, and the corresponding ultimate strengths are obtained based on the GP model. The degenerated p-box of case I and its comparison with the experimental results are shown in Figure 14. The stochastic characteristics of the predicted and experimental ultimate strengths are listed in Table 7.
The prediction of ultimate strength for a spherical shell, while ignoring the influence of welding, is much different from the real-world results. An obvious gap, shown in Figure 14, exists between the empirical CDF obtained from simulation and the experimental result. The difference between the empirical CDFs indicates that the model is not accurate enough to predict the experimental ultimate strength of spherical shells. Meanwhile, as is shown in Table 7, the error of mean value, as well as the standard deviation of ultimate strength obtained from simulation and experimental results, are 12.44% and −9.48%, respectively. The larger mean value and smaller standard deviation of the predicted ultimate strength verified the difference between the simulation and experimental results.
For case II, the influence of welding is considered, and both aleatory and epistemic uncertainties are included in the process of ultimate strength analysis. The material properties and shell thickness in the main body are treated as aleatory uncertainties and are defined with the same stochastic characteristics as those in case I. However, the thickness in the welding region is treated as a uniform distribution, and the interval bounds and radius are shown in Table 6. A total of 200 samples in the outer layer for epistemic uncertainty and 2000 samples in the inner layer for aleatory uncertainties are generated utilizing the double-layer nested sampling method. The corresponding ultimate strengths are calculated based on the precise GP model. As a result, the p-box of case II and its comparison with experimental results is shown in Figure 15. The left and right bounds of CDFs for ultimate strength are bolded and highlighted. The stochastic characteristics of predicted and experimental ultimate strength are listed in Table 8.
As the aleatory and epistemic uncertainties are considered simultaneously in this case, the p-box of ultimate strength for spherical shells can predict the bounds of experimental empirical CDF. In Figure 15, all probable predicted CDFs of ultimate strength are contained in the p-box. The empirical CDF of experimental ultimate strength is contained in the p-box. Meanwhile, from Table 8, the mean value, as well as the standard deviation of experimental CDF, are contained in the corresponding intervals obtained from the simulation. The error of mean value is −6.612% to 8.805%, and that of standard deviation is −19.138% to 0.517%. Both the results presented in the figure and table indicate that the prediction of case II can cover the experimental results well.
In order to account for the influence of welding on the prediction of ultimate strength, the results of case I and case II are also compared. For case I, an obvious gap between the empirical CDFs of predicted and experimental ultimate strength is shown. The ignoring of welding causes a larger prediction of ultimate strength. However, while the influence of welding is considered, as is presented in case II, the predicted p-box can cover the experimental empirical CDF over the whole range. Meanwhile, the error of mean value in case I is out of the range determined by the bounds in case II, and the absolute error of mean value in case II is much smaller than that in case I. Consequently, the influence of welding should be included to obtain the more reasonable and accurate results for the prediction of ultimate strength for spherical shells subjected to external pressure.
Moreover, in both case I and case II, the comparison of predicted CDFs and experimental empirical CDF is conducted under the concept of uncertainty, and no point-to-point error is calculated directly. Obviously, the comparison of CDFs and their stochastic characteristics covers a wider range. As a result, the occasionalities or erroneous judgment caused by simulation and experimental results can be avoided. Furthermore, from the p-box of ultimate strength, the bounds of probability distributions are determined, and the corresponding results can be used for further research, such as for credibility analysis and engineering decisions.

5. Conclusions

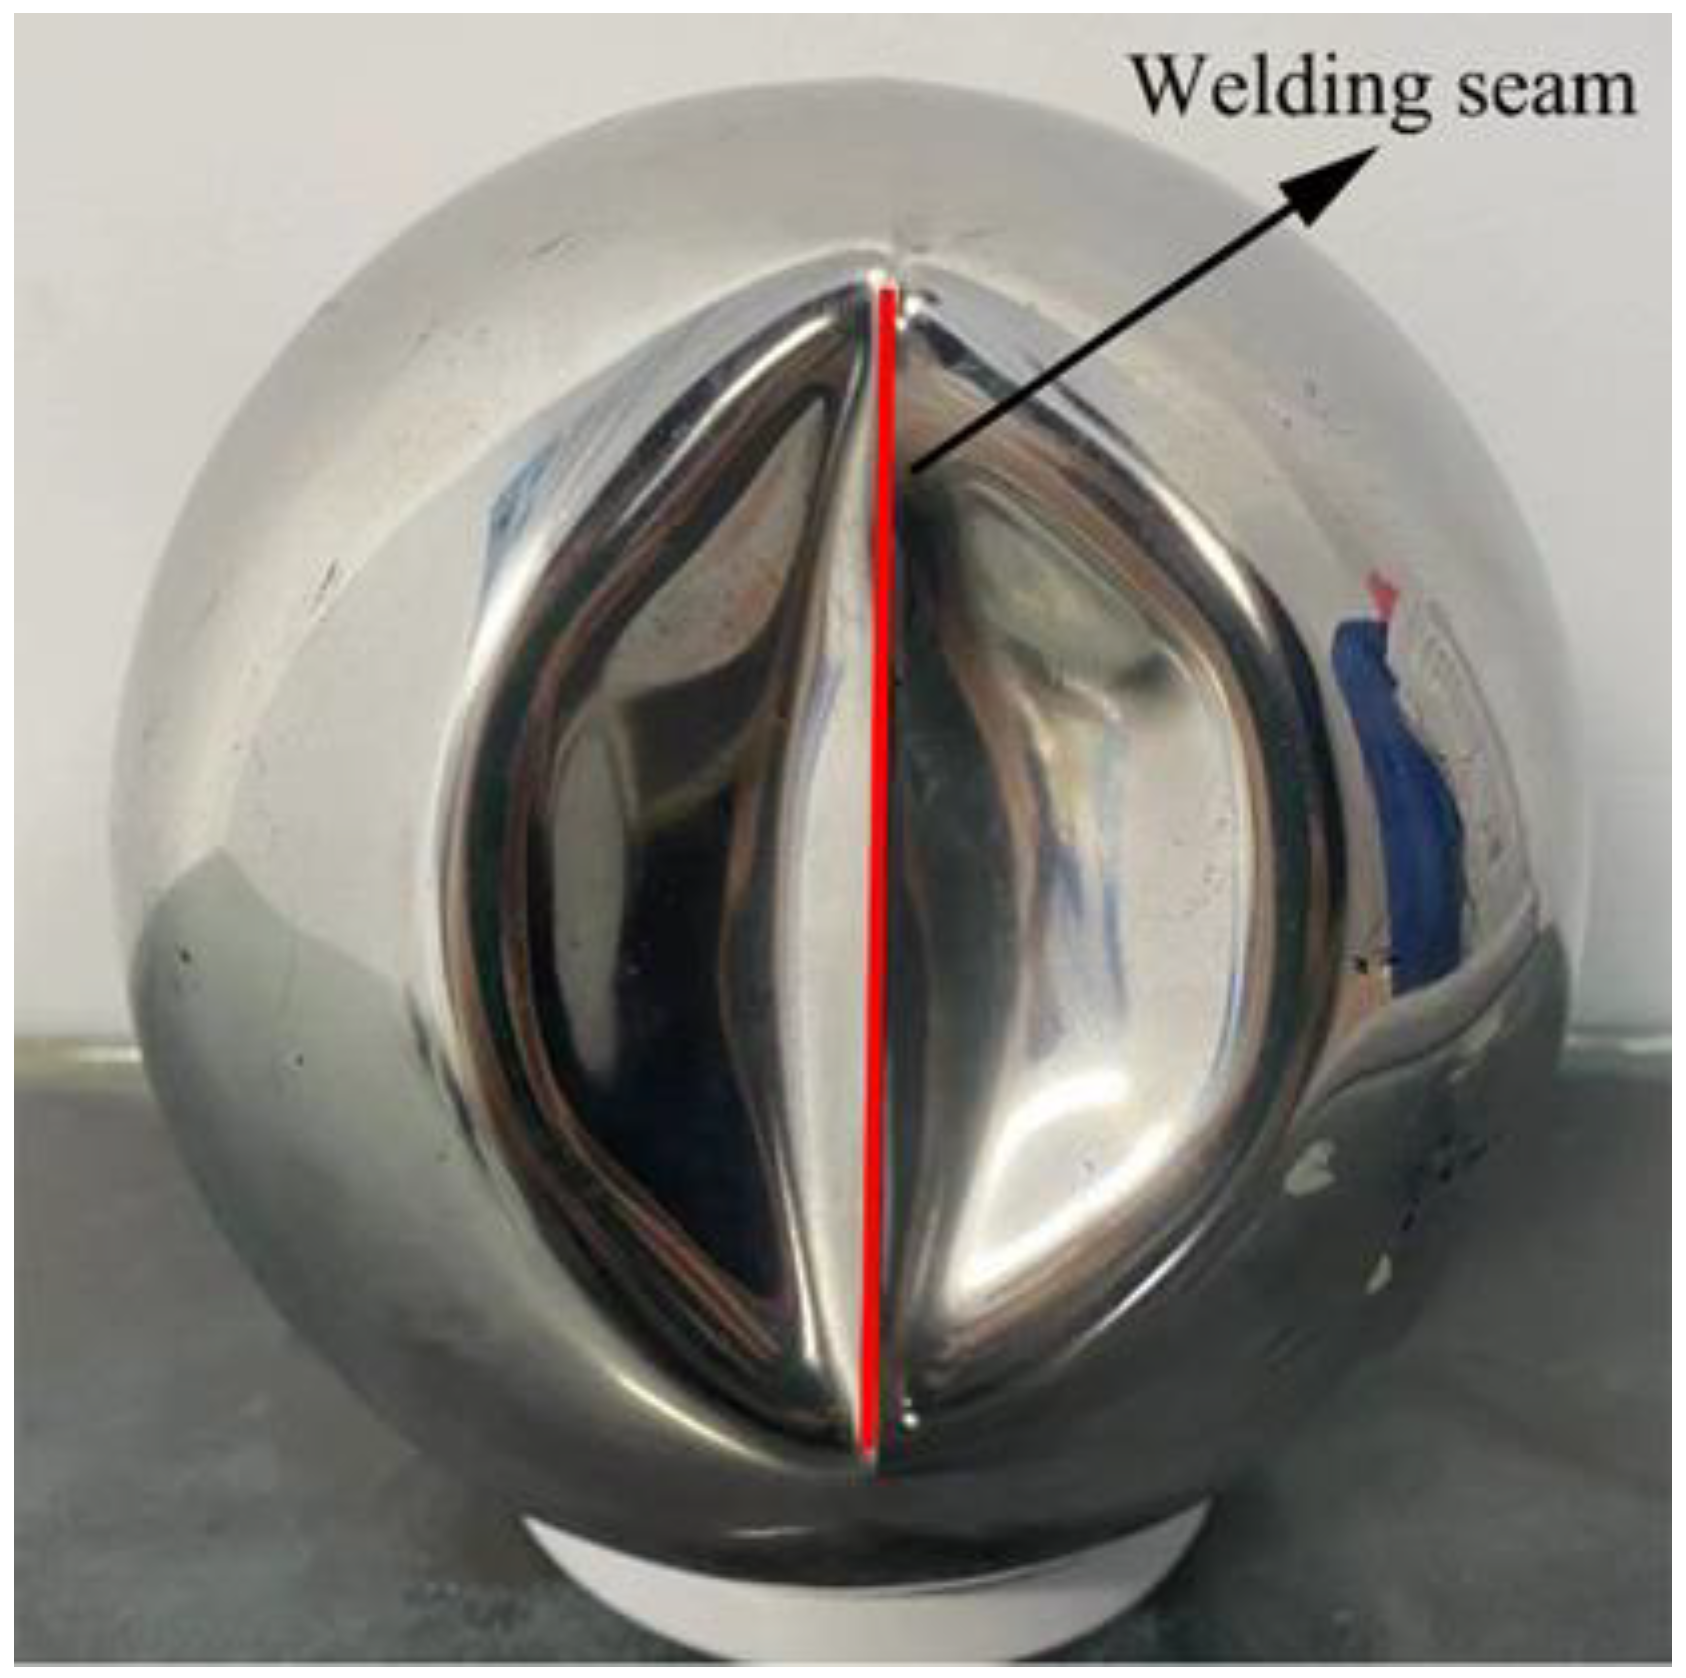
The uncertainty of ultimate strength for spherical shells subjected to external pressure is studied from both experimental and simulation aspects. To evaluate the influence of welding on simulation results, case studies using perfect spherical shells and shells considering welding are carried out, respectively. The conclusions can be summarized as follows:
(1) The uncertainty analysis can extend the study on the ultimate strength of spherical shells from the deterministic to the stochastic perspective. The analysis considering the variability of material properties and shell thickness can predict the ultimate strength over a wider range, and the comparison between CDFs and stochastic characteristics can avoid the occasionalities or erroneous judgment of both experimental and prediction values.
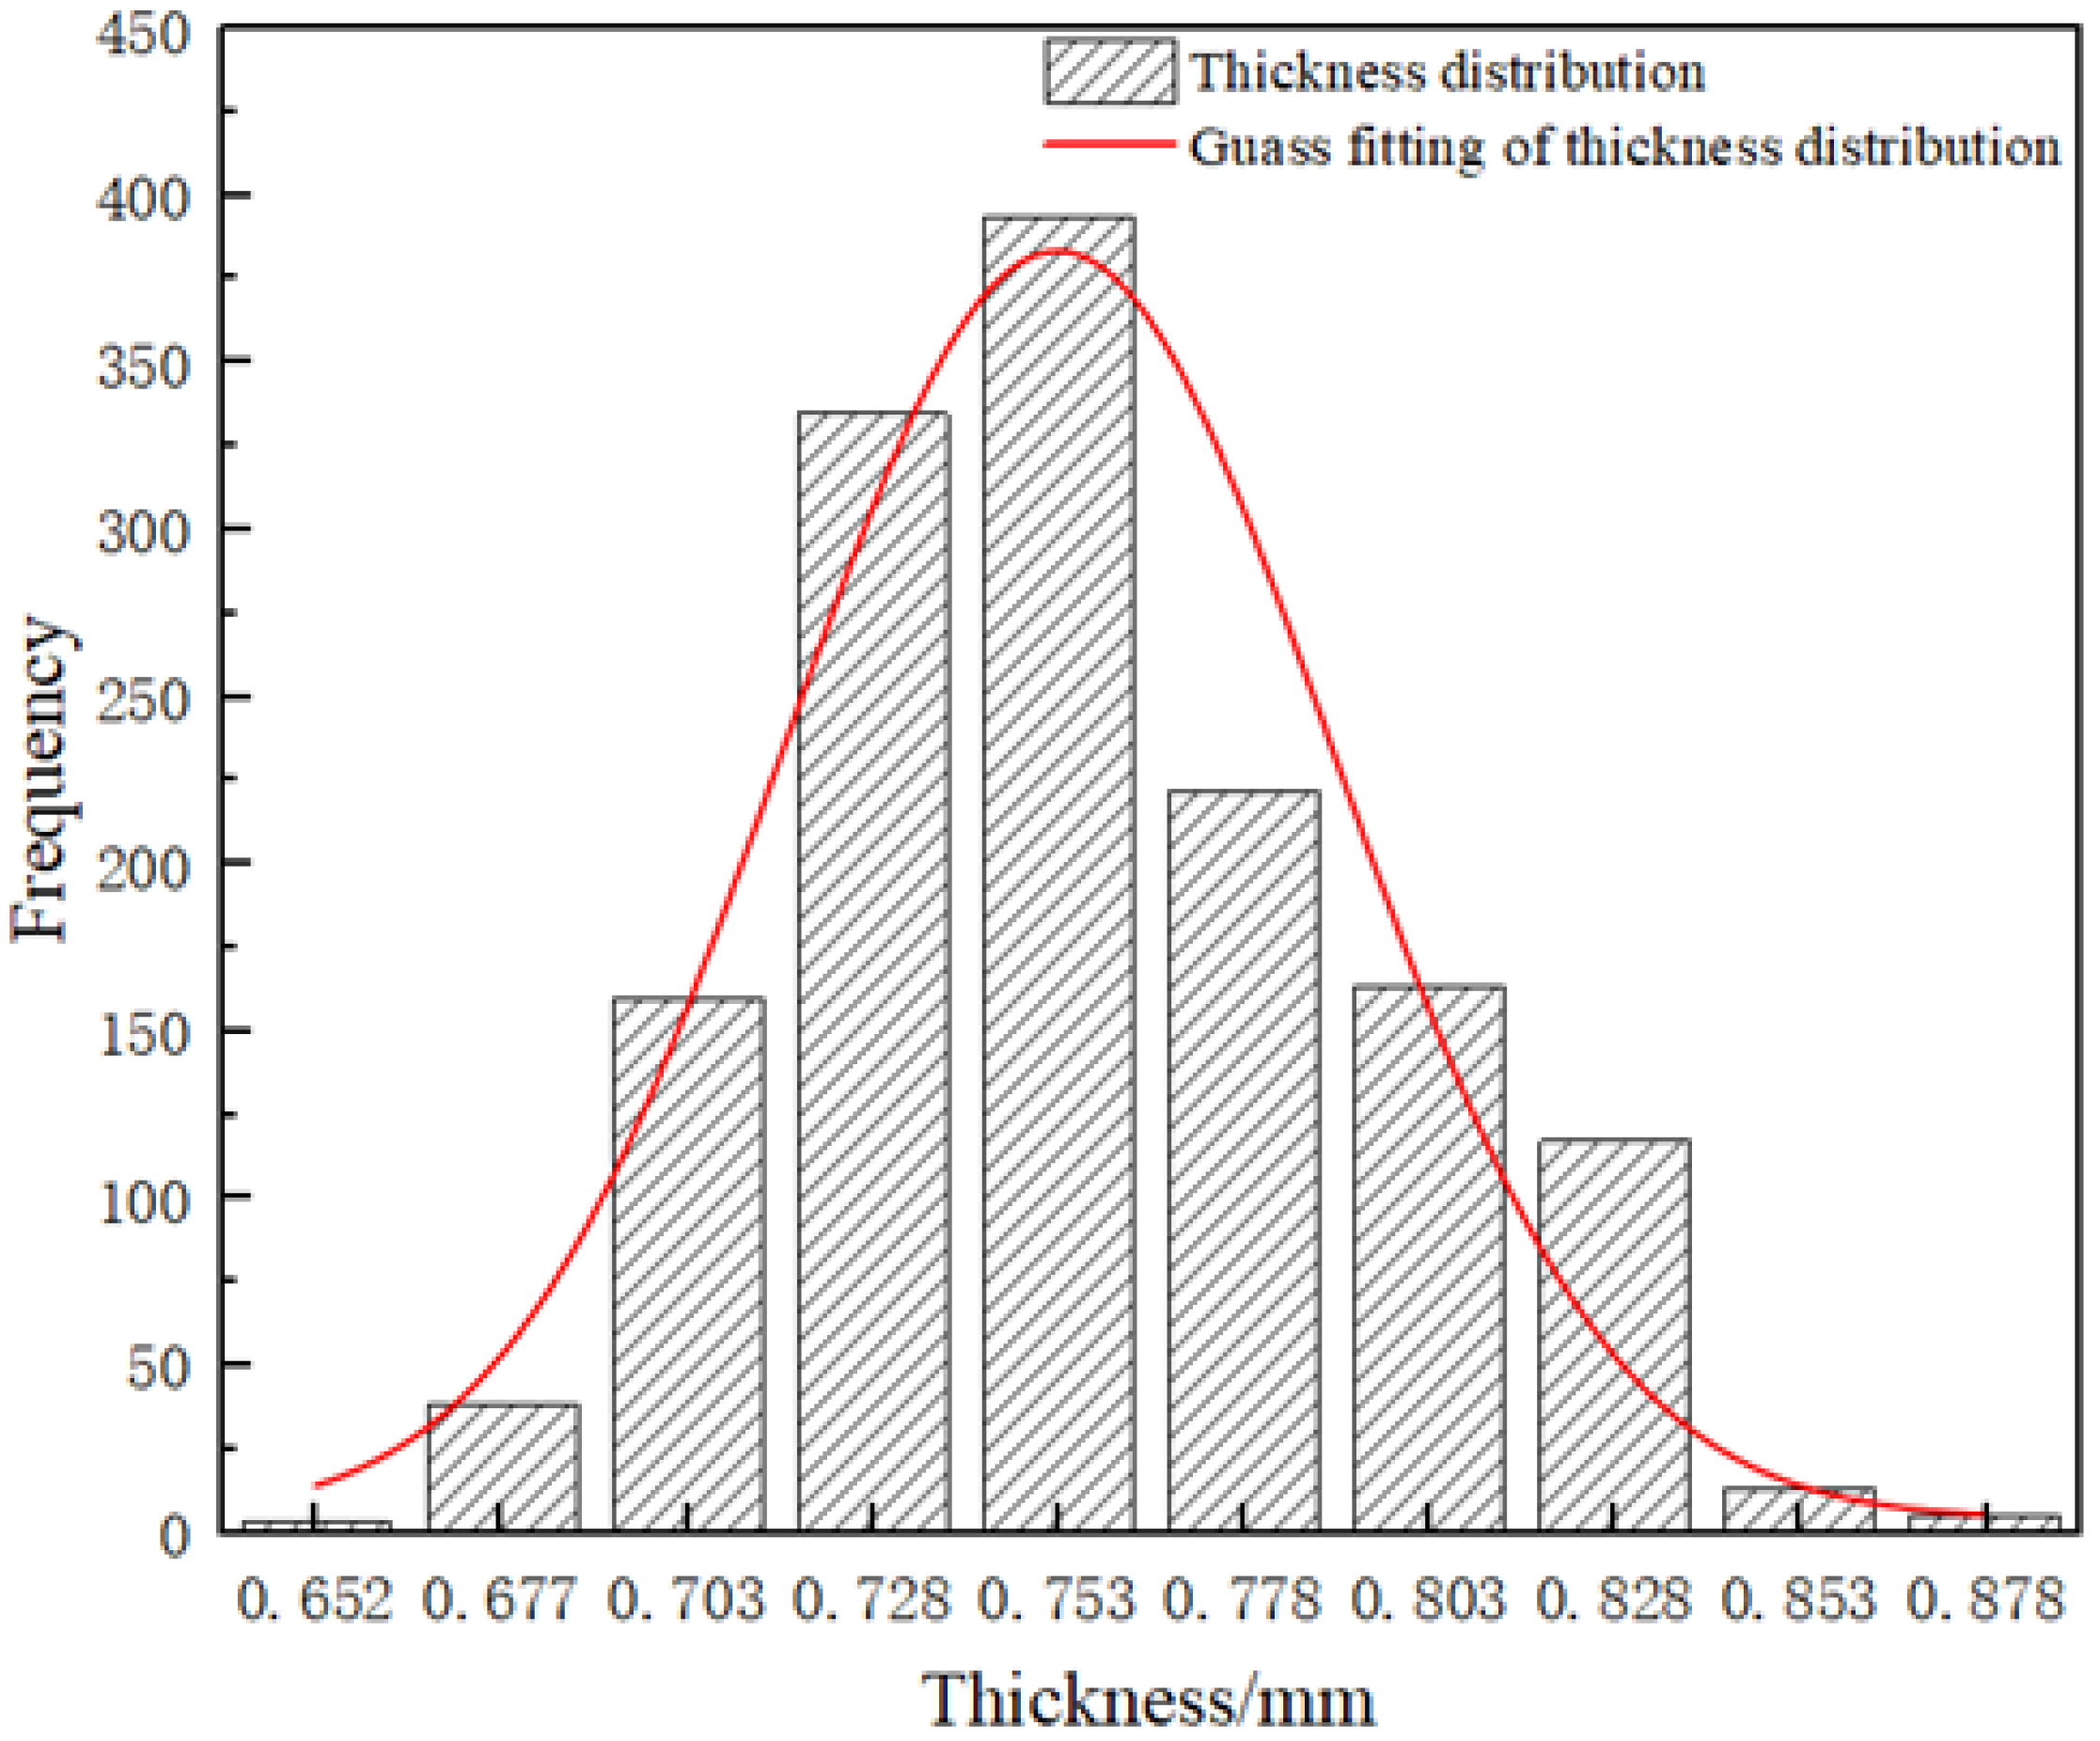
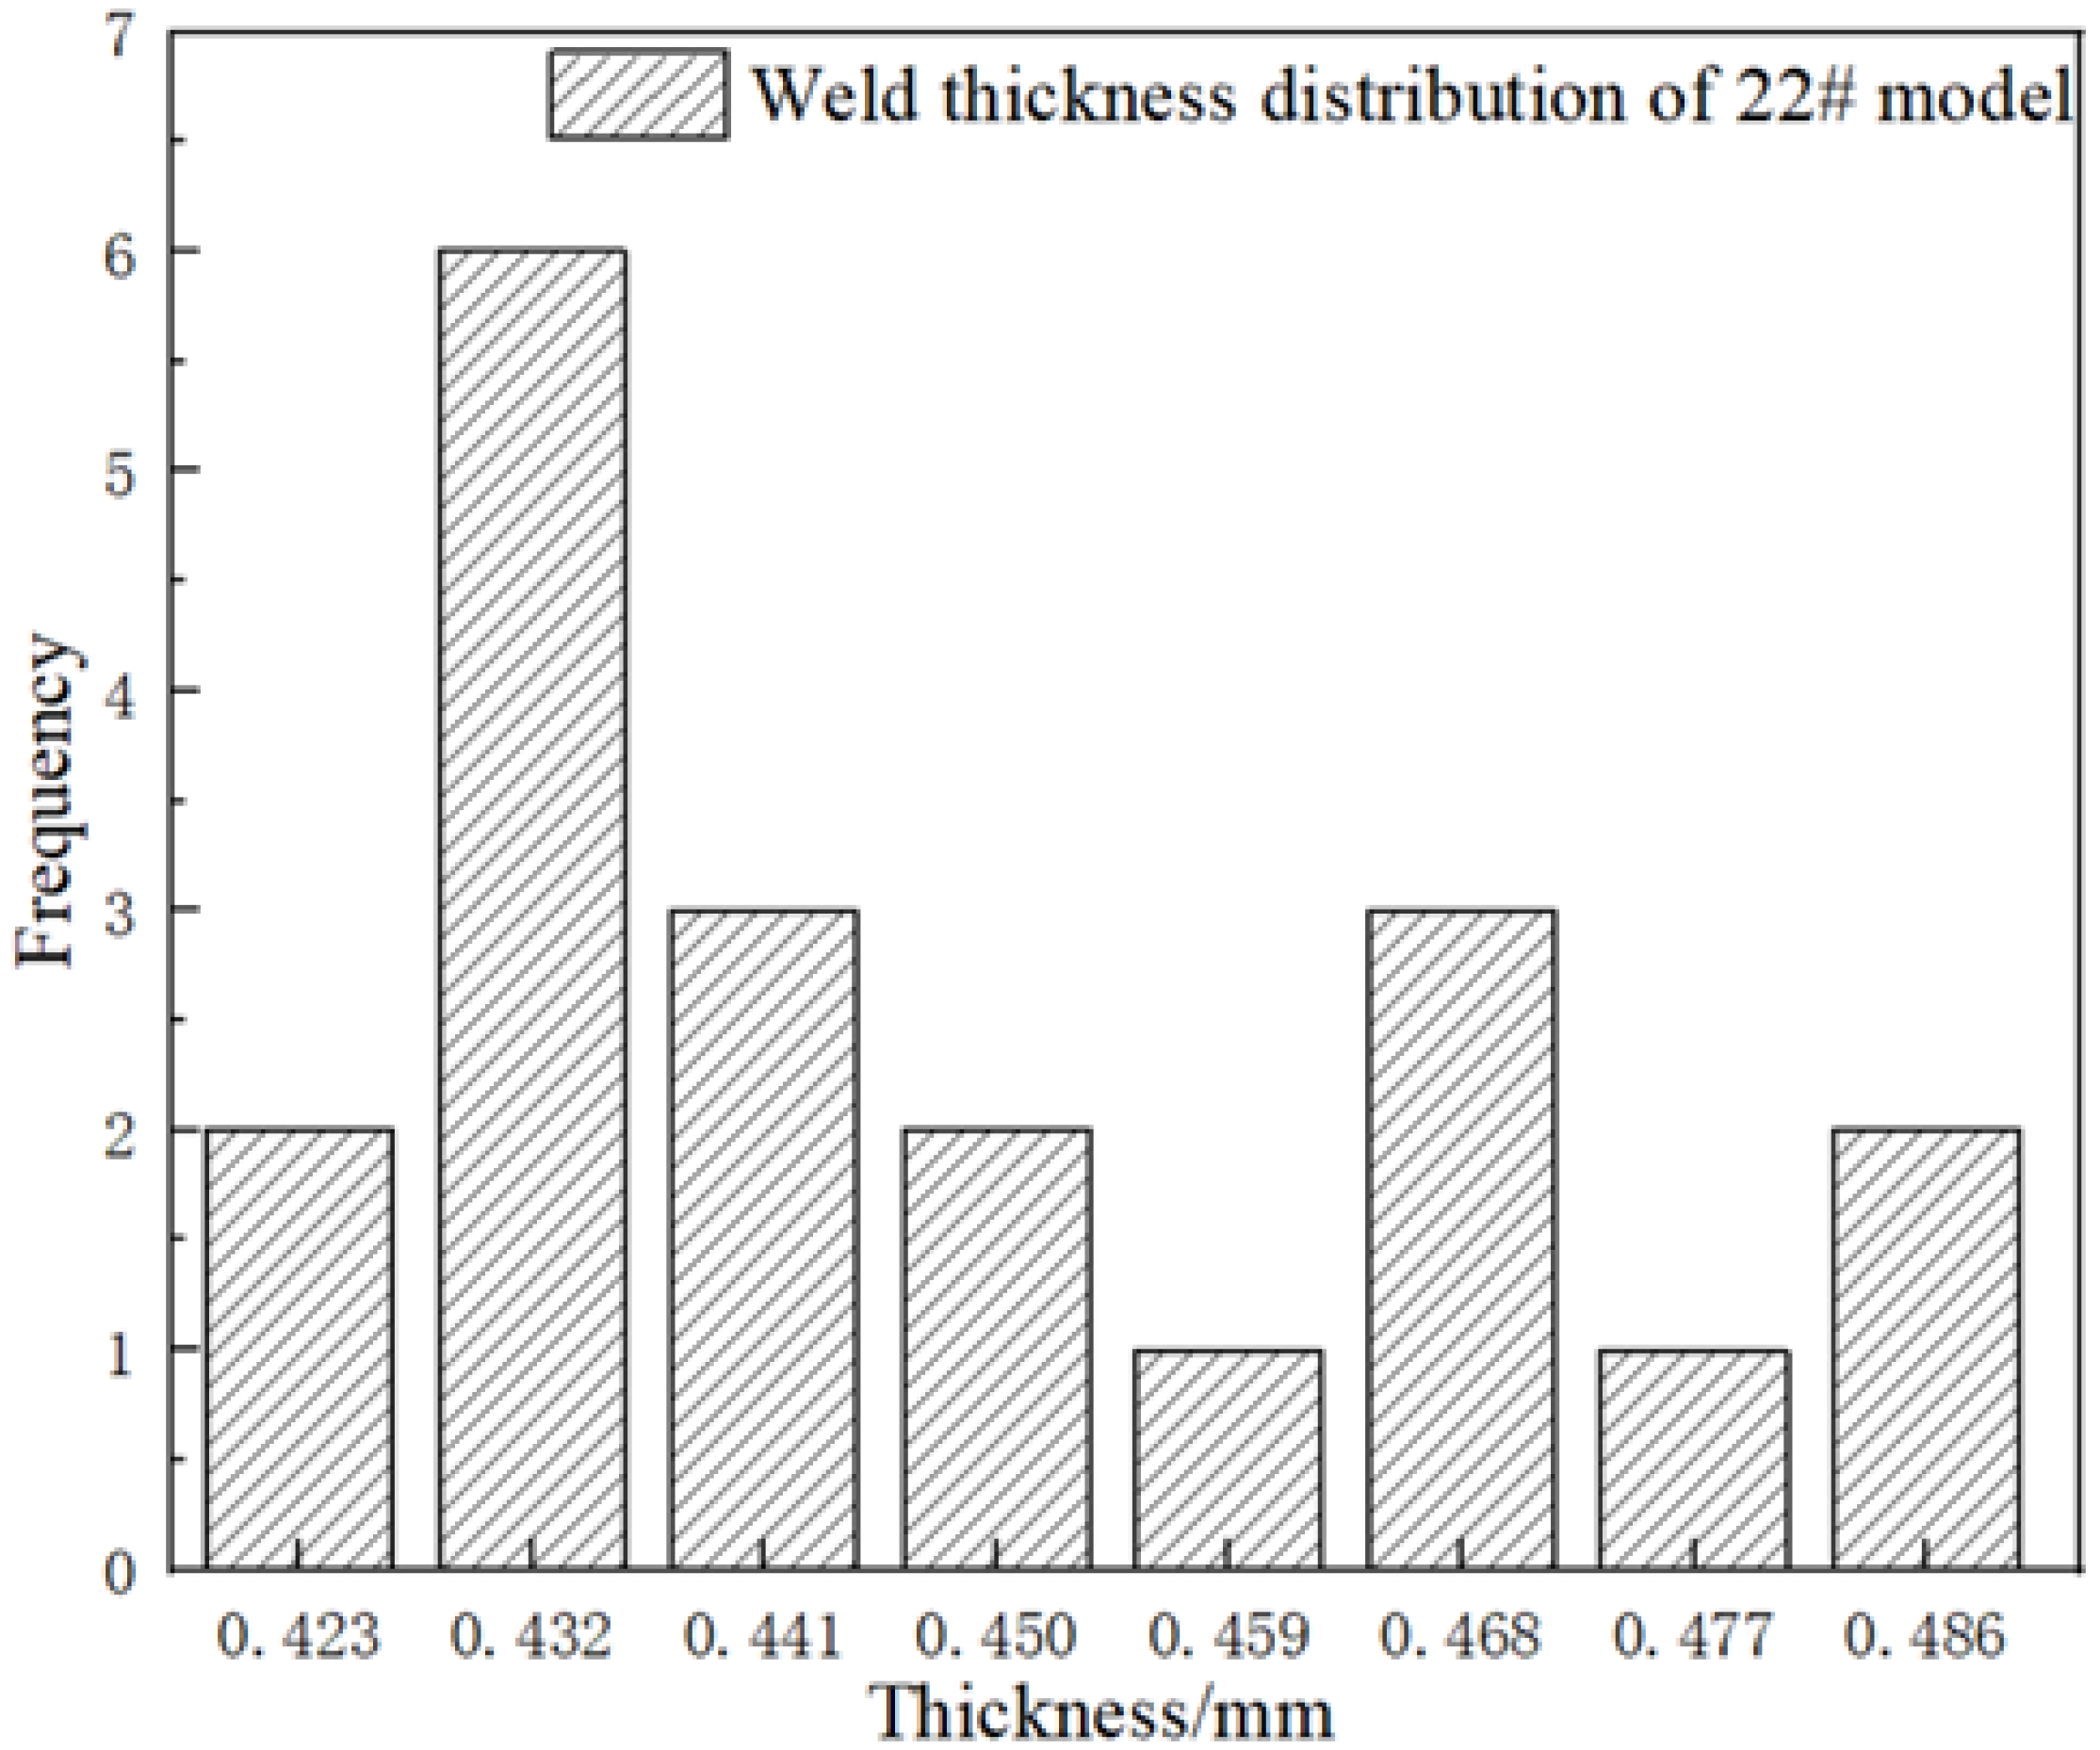
(2) The thickness of the spherical shell varies randomly over the structure. In the main body, the coefficient of variation for shell thickness is 4.206–6.214%, and the distribution of thickness at all test points presents like a normal distribution, in which the mean and standard deviation are 0.753 and 0.037. However, the shell thickness in the welding region cannot be fitted by a normal distribution, and the mean value of thickness in the welding region is about 0.545 to 0.736 times of that in the main body.
(3) The established GP model is accurate enough to replace the time-consuming finite element mode to calculate the ultimate strength of the spherical shells. The determination coefficient R2 of the GP model for the modeling and prediction sample groups is 1.0 and 0.998, respectively. In addition, the RMSE of the model for the two sample groups is 2.138 × 10⁻¹⁴ and 0.008, respectively.
(4) The influence of welding should be included in the ultimate strength analysis for spherical shells subjected to external pressure. The case study ignoring the welding seam results in greater ultimate strength over the whole uncertain parameter space, along with a wide gap between the experimental CDF and the predicted value. The error of the mean value, as well as the standard deviation of ultimate strength between the predicted and experimental results, are 12.44% and −9.48%, respectively. The errors are mainly caused by ignorance of the influence of uncertainties caused by welding.
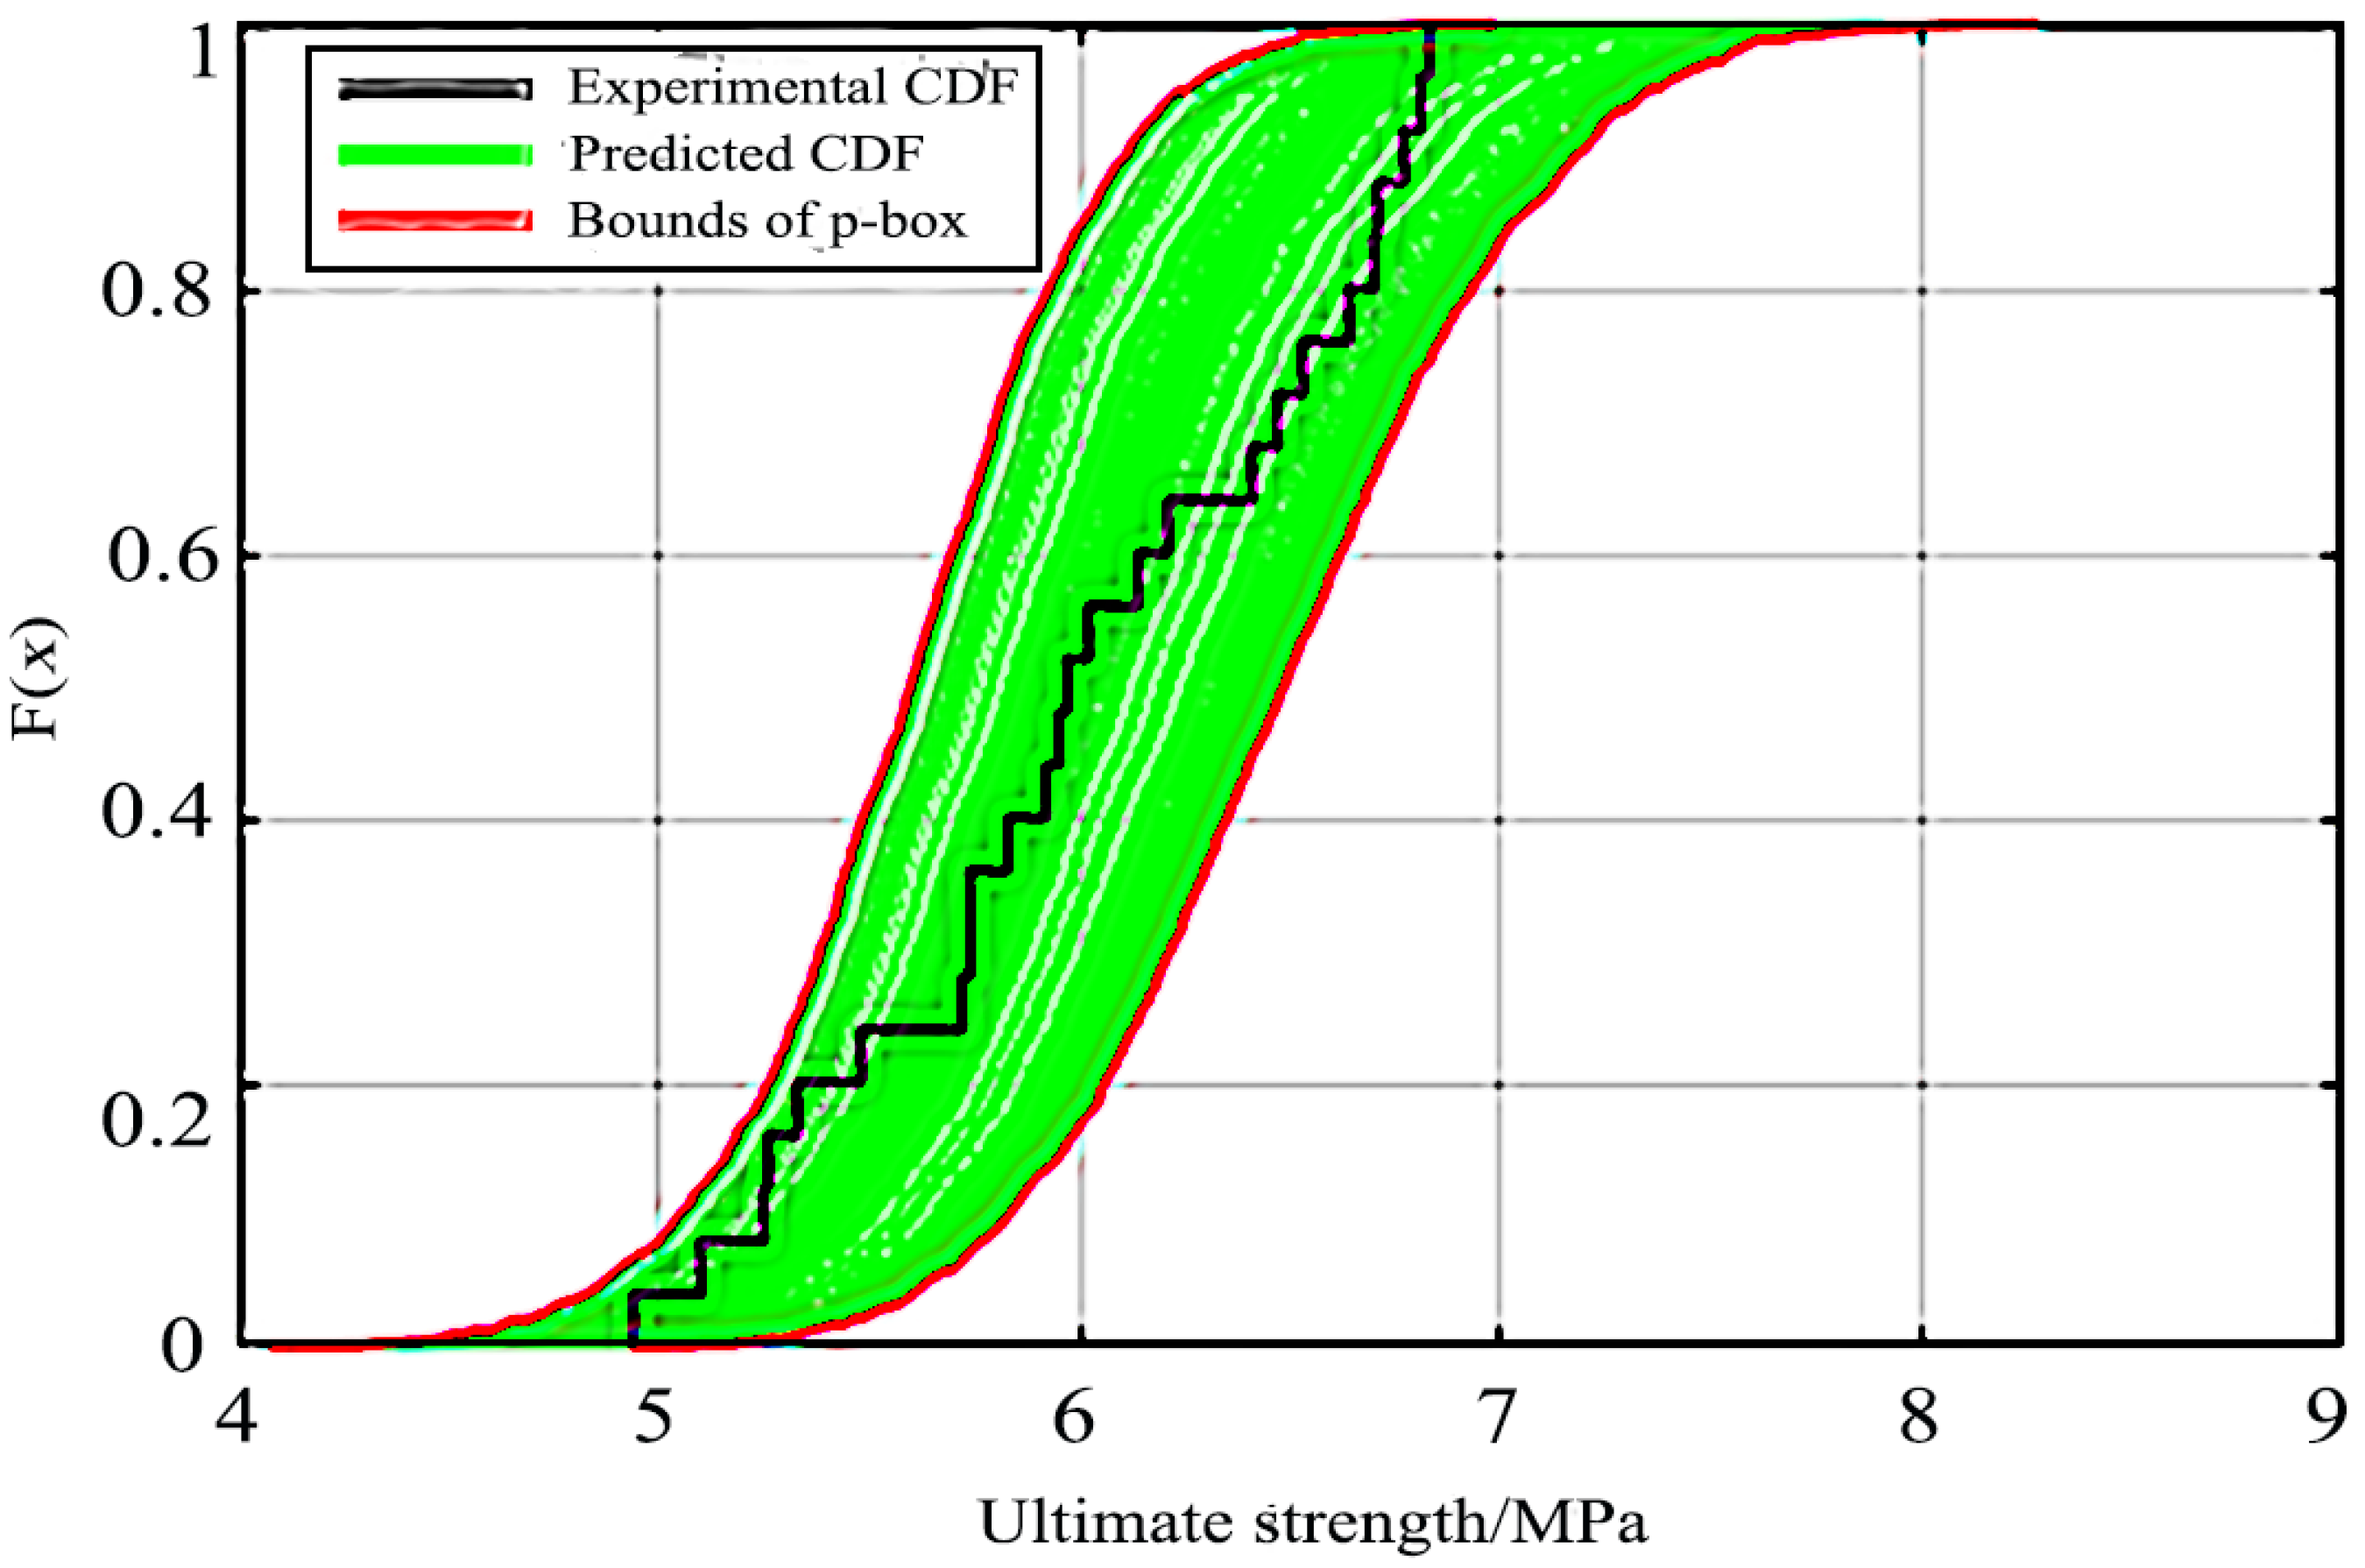
(5) The predictions of ultimate strength for spherical shells, considering aleatory and epistemic uncertainties simultaneously, can better cover the experimental results. The experimental empirical CDF is contained in the predicted p-box over the whole range. For the experimental empirical CDF and the bounds of the p-box, the error of mean value is −6.612% to 8.805%, and that of standard deviation is −19.138% to 0.517%, respectively. The results indicate that while uncertainties of material properties and thickness are considered, the capability of the model in predicting the ultimate strength is improved.
The proposed method can be used for the reliability of the design and the evaluation of the spherical shells working in the real environment. However, the uncertainties are more complex for the real spherical shells. Further studies should verify the material properties given by the manufacturer and conduct hierarchical stochastic model updating, as well as model validation, based on multi-responses to improve the prediction capability of the established model.

Author Contributions

M.Z. and C.D. equally contributed to this work. Conceptualization, J.Z.; methodology, C.D.; software, L.Z.; validation, L.W.; formal analysis, M.Z. and C.D.; investigation, M.Z. and C.D.; data curation, M.Z. and J.Z.; writing—original draft preparation, M.Z.; writing—review and editing, C.D.; All authors have read and agreed to the published version of the manuscript.

Funding

This work was supported by the National Natural Science Foundation of China (Grant number. 52071160).

Data Availability Statement

All data are included in the manuscript.

Conflicts of Interest

The authors declare no conflict of interest.

References

  1. CCS. Rules for the Classification and Construction of Diving Systems and Submersibles; China Classification Society: Beijing, China, 2018. [Google Scholar]
  2. Zhang, J.; Zuo, X.; Wang, W.; Tang, W. Overviews of Investigation on Submersible Pressure Hulls. Adv. Nat. Sci. 2014, 7, 1. [Google Scholar] [CrossRef]
  3. Pranesh, S.B.; Kumar, D.; Subramanian, V.A.; Sathianarayanan, D.; Ramadass, G.A. Non-Linear Buckling Analysis of Imperfect Thin Spherical Pressure Hull for Manned Submersible. J. Ocean Eng. Sci. 2017, 2, 293–300. [Google Scholar] [CrossRef]
  4. Zoelly, R. Ueber Ein Knickungsproblem an Der Kugelschale. Ph.D. Thesis, Zürcher & Furrer, Urbana-Champaign, IL, USA, 1915; pp. 1–40. [Google Scholar]
  5. Wagner, H.N.R.; Hühne, C.; Niemann, S. Robust Knockdown Factors for the Design of Spherical Shells under External Pressure: Development and Validation. Int. J. Mech. Sci. 2018, 141, 58–77. [Google Scholar] [CrossRef]
  6. Krenzke, M.A.; Kiernan, T.J. Tests of Stiffened and Unstiffened Machined Spherical Shells under External Hydrostatic Pressure; David Taylor Model Basin: Washington, DC, USA, 1963. [Google Scholar]
  7. Wagner, H.N.R.; Hühne, C.; Zhang, J.; Tang, W. On the Imperfection Sensitivity and Design of Spherical Domes under External Pressure. Int. J. Press. Vessel. Pip. 2020, 179, 104015. [Google Scholar] [CrossRef]
  8. Yu, C.L.; Chen, Z.T.; Chen, C.; Chen, Y.T. Influence of Initial Imperfections on Ultimate Strength of Spherical Shells. Int. J. Nav. Archit. Ocean Eng. 2017, 9, 473–483. [Google Scholar] [CrossRef]
  9. Zhang, J.; Zhang, M.; Cui, W.; Tang, W.; Wang, F.; Pan, B. Elastic-Plastic Buckling of Deep Sea Spherical Pressure Hulls. Mar. Struct. 2018, 57, 38–51. [Google Scholar] [CrossRef]
  10. Wagner, H.N.R.; Hühne, C.; Zhang, J.; Tang, W.; Khakimova, R. Geometric Imperfection and Lower-Bound Analysis of Spherical Shells under External Pressure. Thin-Walled Struct. 2019, 143, 106195. [Google Scholar] [CrossRef]
  11. Pan, B.B.; Cui, W.C.; Shen, Y.S.; Liu, T. Further Study on the Ultimate Strength Analysis of Spherical Pressure Hulls. Mar. Struct. 2010, 23, 444–461. [Google Scholar] [CrossRef]
  12. Pan, B.B.; Cui, W.C.; Shen, Y.S. Experimental Verification of the New Ultimate Strength Equation of Spherical Pressure Hulls. Mar. Struct. 2012, 29, 169–176. [Google Scholar] [CrossRef]
  13. Zhang, J.; Lin, Z.; Wang, F.; Zhao, T.; Zhu, Y. Ultimate Strength of Externally Pressurised Steel Spheres Containing Through-Thickness Defects. Int. J. Press. Vessel. Pip. 2022, 199, 104750. [Google Scholar] [CrossRef]
  14. Zhu, Y.; Zhang, J.; Yu, J.; Zhou, X.; Zhao, X.; Yin, B.; Tang, W. Buckling of Externally Pressurized Corroded Spherical Shells with Wall-Thickness Reduction in Local Region. Int. J. Press. Vessel. Pip. 2020, 188, 104231. [Google Scholar] [CrossRef]
  15. Zhao, L.; Bai, Y. Ultimate Strength Models for Spherical Shells under External Pressure: A Comparative Study. Ships Offshore Struct. 2022, 1–12. [Google Scholar] [CrossRef]
  16. Sobhani, E.; Masoodi, A.R.; Ahmadi-Pari, A.R. Wave Frequency Responses Estimate of the Nanocomposite Linked Hemispherical-Conical Shell Underwater-like Bodies with the Impacts of Two Types of Graphene-Based Nanofillers. Ocean Eng. 2022, 262, 112329. [Google Scholar] [CrossRef]
  17. Sobhani, E.; Masoodi, A.R.; Ahmadi-Pari, A.R. Circumferential Vibration Analysis of Nano-Porous-Sandwich Assembled Spherical-Cylindrical-Conical Shells under Elastic Boundary Conditions. Eng. Struct. 2022, 273, 115094. [Google Scholar] [CrossRef]
  18. Cerik, B.C.; Shin, H.K.; Cho, S.R. Probabilistic Ultimate Strength Analysis of Submarine Pressure Hulls. Int. J. Nav. Archit. Ocean Eng. 2013, 5, 101–115. [Google Scholar] [CrossRef] [Green Version]
  19. MacKay, J.R.; Van Keulen, F.; Smith, M.J. Quantifying the Accuracy of Numerical Collapse Predictions for the Design of Submarine Pressure Hulls. Thin-Walled Struct. 2011, 49, 145–156. [Google Scholar] [CrossRef]
  20. Qiu, J.T.; Yang, C.J.; Dong, X.Q.; Wang, Z.L.; Li, W.; Noblesse, F. Numerical Simulation and Uncertainty Analysis of an Axial-Flowwaterjet Pump. J. Mar. Sci. Eng. 2018, 6, 71. [Google Scholar] [CrossRef] [Green Version]
  21. Reed, H.M.; Earls, C.J. Stochastic Identification of the Structural Damage Condition of a Ship Bow Section under Model Uncertainty. Ocean Eng. 2015, 103, 123–143. [Google Scholar] [CrossRef] [Green Version]
  22. Chen, X.; Qiu, Z. A Novel Uncertainty Analysis Method for Composite Structures with Mixed Uncertainties Including Random and Interval Variables. Compos. Struct. 2018, 184, 400–410. [Google Scholar] [CrossRef]
  23. Thacker, B.H.; Doebling, S.W.; Hemez, F.M.; Anderson, M.C.; Pepin, J.E.; Rodriguez, E.A. Concepts of Model Verification and Validation; Los Alamos National Laboratory: Santa Fe, NM, USA, 2004; pp. 5–9. [Google Scholar]
  24. Kumar, M. ASME V&V 10-2006: Guide for Verification and Validation in Computational Solid Mechanics; ASME: New York, NY, USA, 2006. [Google Scholar]
  25. Mehta, U.B.; Eklund, D.R.; Romero, V.J.; Pearce, J.A.; Keim, N.S. Simulation Credibility: Advances in Verification, Validation, and Uncertainty Quantification; NASA: Washington, DC, USA, 2016. [Google Scholar]
  26. Long, Y.; Han, H.Q.; Ji, B.; Long, X.P. Numerical Investigation of the Influence of Vortex Generator on Propeller Cavitation and Hull Pressure Fluctuation by DDES. J. Hydrodyn. 2022, 34, 444–450. [Google Scholar] [CrossRef]
  27. Matsuda, S.; Katsui, T. Hydrodynamic Forces and Wake Distribution of Various Ship Shapes Calculated Using a Reynolds Stress Model. J. Mar. Sci. Eng. 2022, 10, 777. [Google Scholar] [CrossRef]
  28. Faes, M.G.R.; Daub, M.; Marelli, S.; Patelli, E.; Beer, M. Engineering Analysis with Probability Boxes: A Review on Computational Methods. Struct. Saf. 2021, 93, 102092. [Google Scholar] [CrossRef]
  29. Duran-Vinuesa, L.; Cuervo, D. Uncertainty Quantification and Propagation with Probability Boxes. Nucl. Eng. Technol. 2021, 53, 2523–2533. [Google Scholar] [CrossRef]
  30. Wu, M.; Xiahou, T.; Chen, J.; Liu, Y. Differentiating Effects of Input Aleatory and Epistemic Uncertainties on System Output: A Separating Sensitivity Analysis Approach. Mech. Syst. Signal Process. 2022, 181, 109421. [Google Scholar] [CrossRef]
  31. Zhang, X.; Gao, H.; Li, Y.F.; Huang, H.Z. A Novel Reliability Analysis Method for Turbine Discs with the Mixture of Fuzzy and Probability-Box Variables. Int. J. Turbo Jet Engines 2022, 39, 291–302. [Google Scholar] [CrossRef]
  32. Ferson, S.; Kreinovich, V.; Ginzburg, L.; Myers, D.S.; Sentz, K. Constructing Probability Boxes and Dempster-Shafer Structures; Sandia National Laboratories: New York, NY, USA, 2002; pp. 13–19. [Google Scholar]
  33. Chen, N.; Yu, D.; Xia, B.; Beer, M. Uncertainty Analysis of a Structural–Acoustic Problem Using Imprecise Probabilities Based on p-Box Representations. Mech. Syst. Signal Process 2016, 80, 45–57. [Google Scholar] [CrossRef] [Green Version]
  34. Shields, M.D.; Zhang, J. The Generalization of Latin Hypercube Sampling. Reliab. Eng. Syst. Saf. 2016, 148, 96–108. [Google Scholar] [CrossRef] [Green Version]
  35. Zhan, M.; Guo, Q.; Yue, L.; Zhang, B. Modeling and Stochastic Model Updating of Bolt-Jointed Structure. Shock Vib. 2018, 2018, 1–12. [Google Scholar] [CrossRef]
Figure 1. Sketch of the p-box and its special cases: (a) p-box considering aleatory and epistemic uncertainties; (b) p-box considering aleatory uncertainties; (c) p-box considering epistemic uncertainties; (d) p-box ignoring uncertainties.
Metals 13 00529 g001
Figure 2. Dimensional test sites: (a) 3D scanning; (b) non-destructive thickness measurement.
Metals 13 00529 g002
Figure 3. Dimensional comparison of 3D scanning: (a) 7# model; (b) 8# model; (c) 10# model.
Metals 13 00529 g003
Figure 4. Distribution of thickness at all test points of all shells.
Metals 13 00529 g004
Figure 5. Thickness distribution of welding area.
Metals 13 00529 g005
Figure 6. Welding thickness measurement.
Metals 13 00529 g006
Figure 7. Hydrostatic pressure test: (a) test site; (b) typical loading curves.
Metals 13 00529 g007
Figure 8. Ultimate strength histogram.
Metals 13 00529 g008
Figure 9. Distribution of ultimate strength.
Metals 13 00529 g009
Figure 10. Collapse mode of spherical shell.
Metals 13 00529 g010
Figure 11. Finite element model of the spherical shell.
Metals 13 00529 g011
Figure 12. Equilibrium path curve of the spherical shell.
Metals 13 00529 g012
Figure 13. GP model between Emain and tmain, with ultimate strength.
Metals 13 00529 g013
Figure 14. P-box of case I and its comparison with experimental results.
Metals 13 00529 g014
Figure 15. P-box of case II and its comparison with experimental results.
Metals 13 00529 g015
Table 1. Results of thickness measurement in the main body.
Samplingtmin/mmtmax/mmtav/mmtstd/mmtcv
10.710.8440.7690.0364.741
20.7040.8660.7740.0405.216
30.7040.8280.7620.0324.206
40.6680.8220.7470.0324.244
50.670.8160.7440.0324.338
60.6820.8240.7490.0364.755
70.6620.8220.7480.0324.337
80.6740.8360.7520.0405.262
90.6840.8220.7460.0344.564
100.6700.8320.7510.0364.841
110.670.8880.7580.0435.716
120.6460.840.7560.0415.360
130.6880.840.7590.0354.621
140.680.830.7400.0385.182
150.6720.8460.7350.0466.214
160.6780.8140.7380.0385.094
170.6620.8680.7540.0374.859
180.7120.8360.7680.0384.951
190.6760.8660.7650.0415.380
200.6820.8240.7600.0324.246
210.6960.8440.7690.0364.659
220.6660.850.7640.0435.657
230.6920.8360.7560.0354.624
240.710.8440.7670.0384.986
250.680.8940.7630.0405.191
Table 2. Results of thickness measurement in the welding region.
Samplingtwmin/mmtwmax/mmtwav/mmtwav/tavPtest/MPa
10.5920.4100.4880.6355.74
20.5520.430.4850.6275.83
30.5620.4660.5080.6675.26
40.5420.4200.4730.6336.14
50.5060.3820.4420.5946.64
60.6240.5160.5510.7364.94
70.5240.3480.4120.5516.83
80.5020.3860.4310.5736.71
90.5920.3580.4590.6156.41
100.4980.3980.4510.6016.47
110.5840.4080.4640.6126.21
120.4860.3260.4150.5496.81
130.5620.3580.4870.6426.02
140.5840.4700.5060.6845.33
150.5920.4280.4940.6725.72
160.4920.4180.4480.6076.53
170.5380.4540.4970.6595.48
180.5820.4100.4840.6305.92
190.5620.3580.4870.6375.74
200.6180.4620.5390.7095.10
210.6260.4220.5200.6765.25
220.4760.3480.4160.5456.77
230.5560.4060.4820.6385.95
240.5480.4120.4820.6285.97
250.4940.3760.4370.5736.70
Table 3. Thickness and material properties of the spherical shell.
Regiont/mmE/GPaσy/MPaμ
main body0.752033350.3
welding region0.602033350.3
Table 4. Bounds of model parameters in spherical shells.
Design SpaceThickness/mmEmain/GPaσy/MPa
tmaintweldEmainσy
lower bound0.700.40185250
upper bound0.850.85215450
Table 5. Precision factors of GP model.
SamplingR2RMSE
modeling1.02.138 × 10−14
prediction0.9980.008
Table 6. Aleatory and epistemic uncertainty model inputs.
AleatoryE/GPaσy/MPatmain/mmEpistemictweld/mm
mean value2033350.753lower bund0.546
standard deviation2.0326.80.037upper bound0.685
coefficient of variation1.0%8.0%4.96%interval radius0.070
Table 7. Stochastic characteristics of ultimate strength in case I.
StatisticTest/MPaPrediction/MPaError/%
mean6.0196.76812.44
std0.5800.525−9.48
Table 8. Stochastic characteristics of ultimate strength in case II.
StatisticTest/MPaPrediction/MPaError/%
Left BoundRight BoundLeft BoundRight Bound
mean6.0195.6216.549−6.6128.805
std0.5800.4690.583−19.1380.517
Disclaimer/Publisher’s Note: The statements, opinions and data contained in all publications are solely those of the individual author(s) and contributor(s) and not of MDPI and/or the editor(s). MDPI and/or the editor(s) disclaim responsibility for any injury to people or property resulting from any ideas, methods, instructions or products referred to in the content.

