Article

Quantification of Mesoscale Deformation-Induced Surface Roughness in α-Titanium

1
Institute of Strength Physics and Material Science, Russian Academy of Sciences, 634055 Tomsk, Russia
2
School of Engineering and Information Technology, University of New South Wales Canberra, Canberra, ACT 2600, Australia
*
Author to whom correspondence should be addressed.
Metals 2023, 13(2), 440; https://doi.org/10.3390/met13020440
Submission received: 28 January 2023 / Revised: 14 February 2023 / Accepted: 17 February 2023 / Published: 20 February 2023
(This article belongs to the Special Issue Fatigue Behavior and Crack Mechanism of Metals and Alloys)

Abstract

:
The phenomenon of mesoscale deformation-induced surface roughening in titanium polycrystals is examined experimentally and numerically. The evolution of the surface morphology under uniaxial tension is analyzed in terms of the standard and ad hoc roughness parameters and the fractal dimension. The statistical estimates are compared to the grain-scale stress-strain fields in order to reveal an interrelation between the in-plane plastic strains and out-of-plane surface displacements. A strong correlation with a determination coefficient of 0.99 is revealed between the dimensionless roughness parameter Rd and the corresponding in-plane plastic strain. The standard roughness parameters Ra and RRMS are shown to correlate linearly with the in-plane strains, but only for moderate tensile deformation, which is due to filtering out low-frequency components in the surface profiles. The fractal dimension DF changes with the subsection strains in a sawtooth fashion, with an abrupt drop in the neck region. The descent portions of the DF dependences are supposedly related to the appearance of low-frequency components in the structure of the surface profiles.

1. Introduction

The development of reliable stress-strain criteria to evaluate and predict dangerous material states is the key problem in the mechanics and physics of solids and materials science. The methods for the non-destructive testing of loaded materials commonly rely on the knowledge of the deformation and fracture mechanisms involved and their correlation with the loading history and certain measurable parameters (e.g., acoustic emission signals [1,2], displacement fields [3,4], quantitative and qualitative changes in microstructure and texture [5,6], etc.). At present, the demands on improving the reliability and operating capacity of structures, while reducing their weight, call for the development of new criteria to evaluate material deformation or for revising the existing ones. Furthermore, the active development of advanced materials and innovative technologies for their processing, as well as breakthrough characterization methods, create an urgent need for investigations along these lines. Composite and functionally graded materials [7,8] and additively manufactured and nanostructured alloys [9,10] are among prominent examples.
The macroscopic failure of loaded structures is commonly preceded by the progressive accumulation of plastic strain and damage at the lower scales, where the material microstructure plays a particular role [11]. Therefore, studies of lower-scale deformation events are of vital importance to elaborate reliable criteria for predicting macroscopic failure.
Extensive experimental and numerical studies suggest that valuable data can be gained from the observations of deformation-induced surface roughening (DISR) (see, e.g., [12]). In contrast to surface roughness caused by a direct external action (e.g., due to a tribological contact [13], heat source irradiation [14], etc.), the free surface roughening results from the internal stress-strain state that develops in the bulk of a deformed material and, thus, would be related to the internal deformation mechanisms.
In Refs. [15,16], a particular role is given to the mesoscale DISR, which is attributed to the collective behavior of grains. The out-of-plane displacements of grain groups are seen as ridging [17,18], roping [18] or a checkered distribution of extruded and intruded regions [16,17,18]. Being well-defined throughout the entire deformation process, the mesoscale roughening was thought to be a good candidate for the early prediction of macroscale localization and failure in titanium alloys [16].
This paper continues the investigations along these lines. Recently [16], we proposed to employ a dimensionless roughness parameter and demonstrated its value for the early prediction of plastic strain localization in loaded metals. A step forward made in this contribution is the in-depth analysis of the mesoscale surface morphology in terms of the standard and ad hoc roughness parameters and the fractal dimension. Note that, although the fractal dimension was introduced to characterize DISR quite a while ago [19], it has been rarely used for this purpose since then. Following the ideas of Shimizu and Abe [19] and Kuznetsov [20], we believe that the fractal dimension provides valuable information on the shape of the roughened surface and decided to compare it against the other roughness parameters.
Therefore, the objective of this contribution is to reveal the relationship between the stress-strain state in polycrystalline materials and the statistical roughness estimates and to determine the applicability limits, and pros and cons, of the latter. For this purpose, the current study experimentally and numerically examines the mesoscale roughening events in commercially pure titanium polycrystals subjected to uniaxial tension. The statistical estimates of mesoscale roughening are compared to the grain-scale stress-strain fields to reveal an interrelation between the in-plane plastic strains accumulated in a loaded material and the out-of-plane surface displacements.
The paper is organized as follows. The experimental procedure and a crystal plasticity model based on the experimental data are detailed in Section 2 and Section 3, respectively. The features of the roughness quantification in terms of the fractal dimension, standard roughness estimates and a dimensionless roughness parameter [15] are described in Section 4. The experimental and numerical results, including the surface profiles, optical microscopy, digital image correlation data, computational stress, strain and displacement fields and the statistical estimates of the mesoscale surface morphology, are analyzed in Section 5. Further discussion of the roughness statistical estimations in view of their application in assessing material plastic deformation is provided in Section 6. The main findings are briefly summarized in the Conclusion.

2. Experimental

2.1. Microstructure

Experimental investigations were performed for rolled commercially pure titanium. To obtain comprehensive information about the grain shape and crystallographic orientations, the microstructure was studied by electron backscatter diffraction (EBSD) using a field emission scanning electron microscope Apreo 2 S (Thermo Fisher Scientific Inc., Waltham, MA, USA), equipped with an energy-dispersive X-ray spectrometer Octane Elect Super and electron backscatter diffraction detector Velocity Super. Hereinafter, the rolling, normal and transverse directions of the titanium sheet are abbreviated as RD, ND, and TD, respectively.

2.2. Stop-and-Study Tensile Tests

The stress-strain curves obtained in the tensile tests along the TD and RD were used for calibrating the numerical model. To this end, the dog-bone-shaped specimens with 50 × 8 × 3 mm3 gage parts were cut from a rolled, commercially pure titanium sheet, parallel and perpendicular to the RD. Further investigations into the deformation-induced surface roughening were performed for the specimens loaded parallel to the TD. The specimen surface intended for contact profilometry was mechanically polished with a diamond paste to a mirror finish; its gage part was divided by a set of control marks into 10 subsections, each 5 mm long (Figure 1a). The opposite surface was prepared for an investigation using digital image correlation (DIC) [3,4,21]. For this purpose, a randomized speckle pattern was applied to the entire area of the gage part, and the control marks of the subsection boundaries were additionally drawn on the lateral side of the specimen (Figure 1b).
A stop-and-study technique, developed in Ref. [16], was applied to examine the mesoscale roughness evolution at different deformation stages. The specimen was subjected to uniaxial tension using a BISS Nano 15 kN universal testing machine at 1 mm/min loading velocity. After a certain degree of tension, the specimen was extracted from the testing machine and the roughness profiles were measured in the subsections along the specimen centerline (line A–A′ in Figure 1a) using an Alpha Step IQ contact profiler (KLA-Tencor Corp., Milpitas, CA, USA). Then, the specimen was put back into the testing machine and its tension was resumed. In this way, a set of surface profiles were obtained for all subsections, from the beginning of loading to necking, with a strain interval of 2–5%. The corresponding engineering strains of the subsections along the tensile axis were calculated at each deformation stage using the formula
ε s u b = L s u b / L s u b 0 1 ,
where L s u b and L s u b 0 are the initial and current subsection lengths, respectively.
In the course of active loading, the displacement fields of the specimen surface marked by a speckle pattern (Figure 1b) were recorded using a Vic3D digital optical system. The DIC and contact profilometry results were compared to reveal the relationship between the in-plane strains of, and the surface roughness in, the specimen subsections. Finally, the surface morphology of some selected regions was examined using a NewView optical profiler (Zygo Corp., Middlefield, CT, USA).

3. Numerical Simulation

3.1. Microstructure Design

Commonly, the microstructure-based simulations of mesoscale deformation phenomena require substantial computational resources. In particular, it has been shown, in Ref. [22], that the grain model is capable of reproducing mesoscale roughening until the regions of the plastic strain localization become comparable to the model size. The larger the model size, the wider the strain range at which the mesoscale processes can be simulated in a proper way. On the other hand, polycrystalline grains should be meshed with a sufficient resolution to describe the microscale stress-strain fields with a reasonable degree of accuracy. Meeting both of these requirements within a single calculation is a challenging task. As a compromise, two polycrystalline models, consisting of 12,000 and 36,000 equiaxed grains, were generated by the step-by-step packing (SSP) method [23] on 600 × 450 × 50 voxel meshes with the steps of 2 and 6 µm, respectively. The smaller model of 1.2 × 0.9 × 0.1 mm3 was meshed with a resolution of approximately 1000 elements per grain to analyze the micro- and meso-scale stress, strain and displacement fields up to 10% tensile strain [22]. The larger model of 3.6 × 2.7 × 0.3 mm3 was approximated with a resolution of 350 elements per grain and enabled us to investigate the general tendencies of mesoscale roughening up to necking, although did not reproduce the local stress-strain characteristics with sufficient detalization.
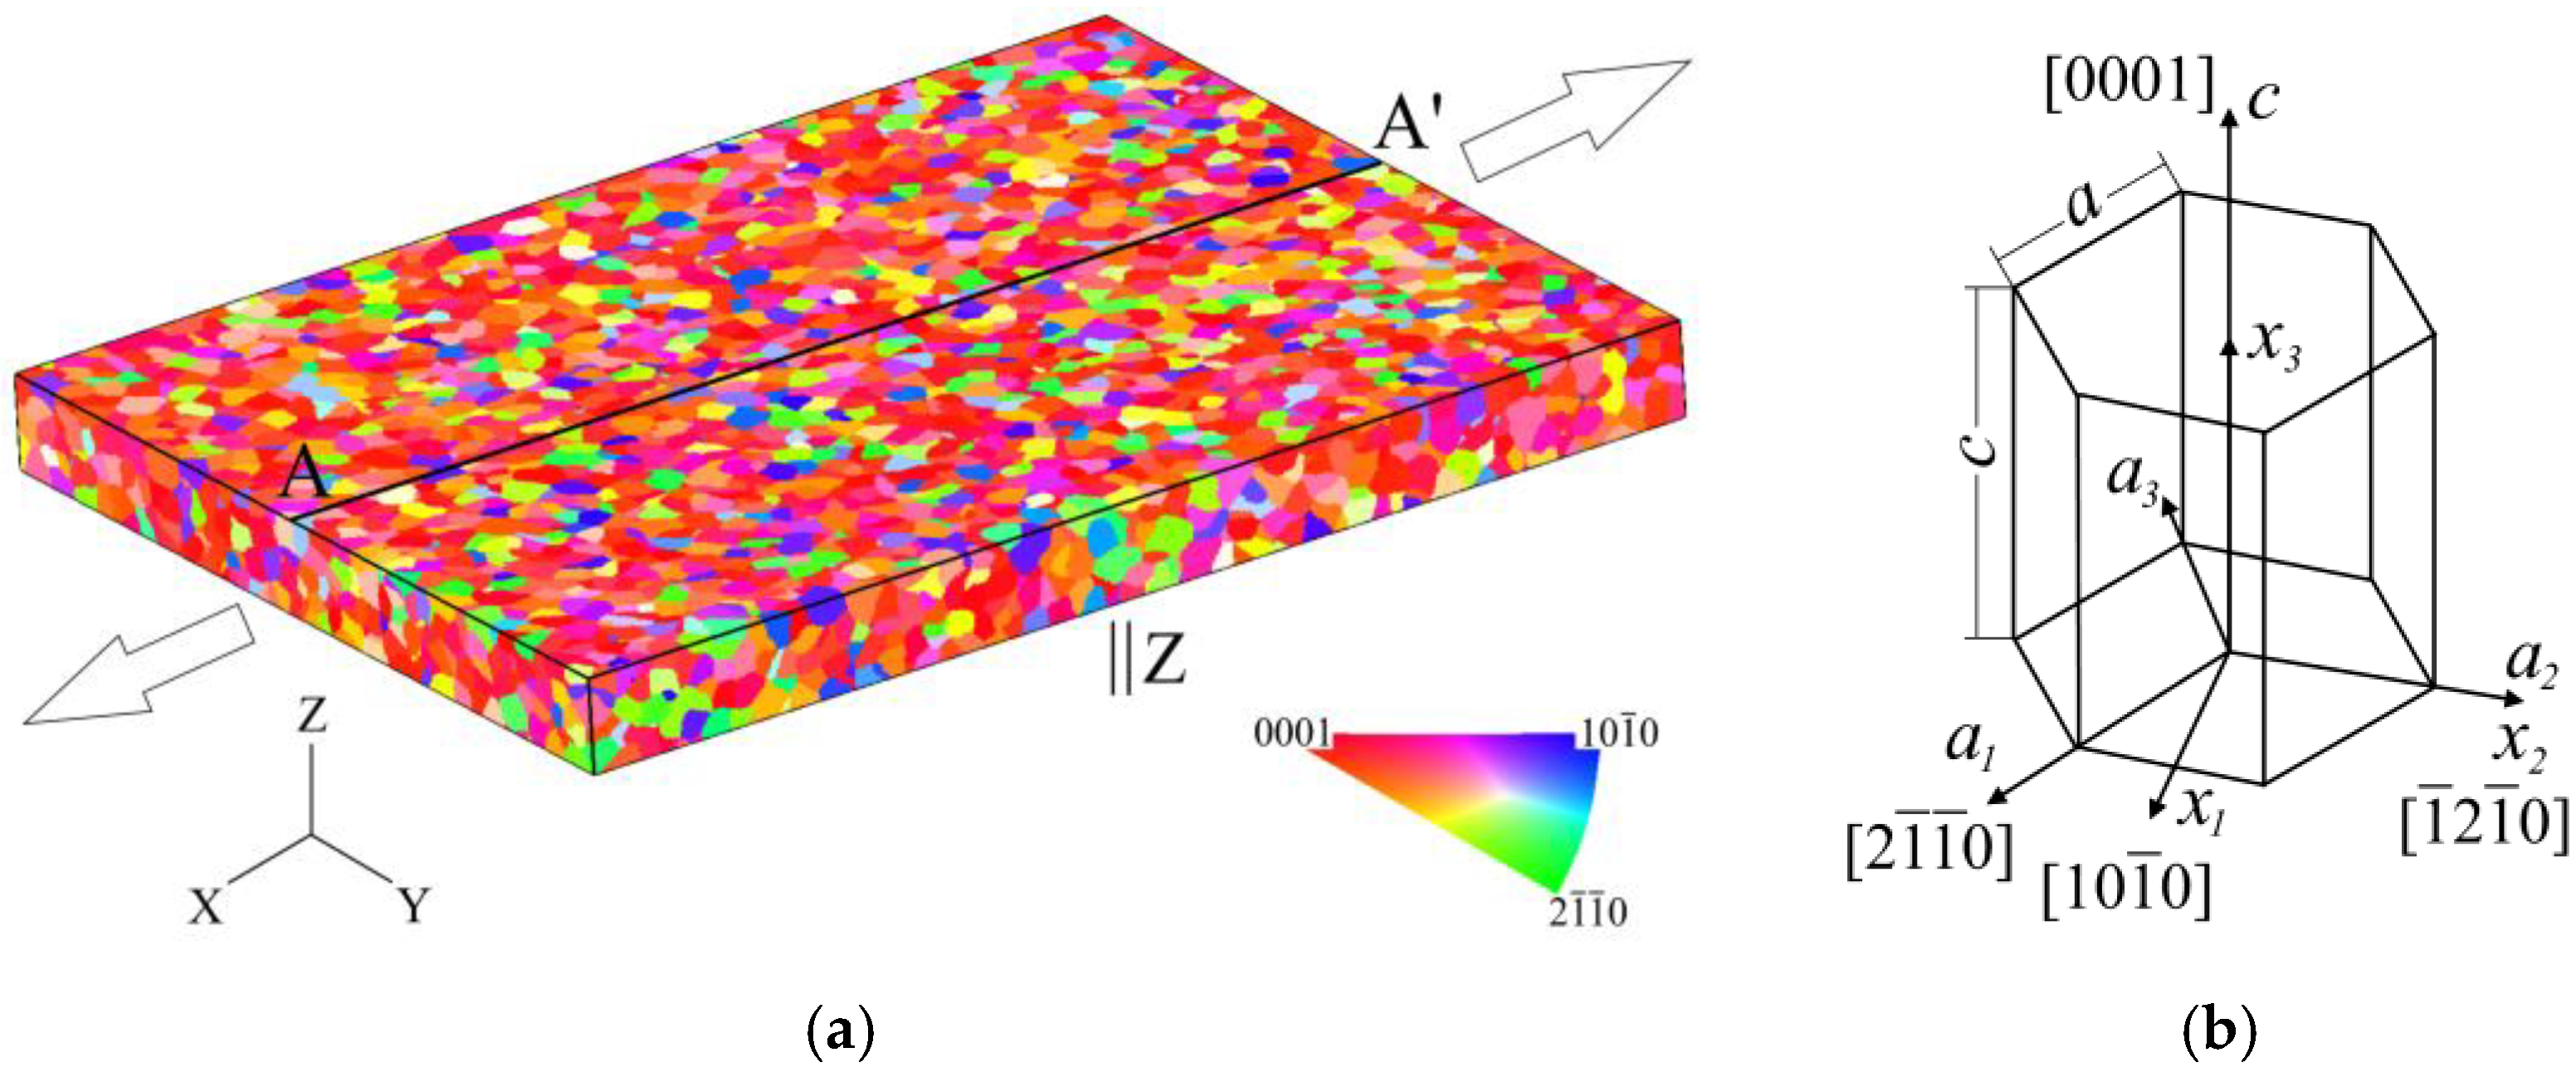
The initial seed distributions in the SSP procedure were set using a random number generator. In the subsequent SSP generation, all of the grains were grown at the same rate by a spherical equation (see [23] for further detail). As an example, the model consisting of 12,000 grains is shown in Figure 2a.

3.2. Constitutive Description and Boundary Conditions

The constitutive equations for describing the deformation behavior of grains were constructed within the framework of the crystal plasticity theory [24,25], taking into account the geometrical features of the dislocation slip and the anisotropy of the elastic properties attributed to the crystal lattice. Commercially pure titanium has a hexagonal close-packed (hcp) lattice. The crystallographic coordinate system of an hcp grain has 4 axes, denoted in Figure 2b as a1, a2, a3, and c. The three ai axes lie in the (0001) basal plane, intersecting at an angle of 120°. The fourth axis c is perpendicular to the basal plane and longer than the three others. The constitutive equations of the grains are convenient to write with respect to the orthonormal coordinate systems xi, with the unit axes co-directing with the 10 1 ̄ 0 , 1 ̄ 2 1 ̄ 0 and 0001 crystal directions (Figure 2b). Formulated in the local coordinate systems xi (Figure 2b), Hooke’s law is written in the same way for all grains, independent of their orientations in the global XYZ frame (Figure 2a)
σ ˙ i j = C i j k l ε ˙ k l ε ˙ k l p .
here, σ i j are the stress tensor components, ε i j and ε i j p are the total strain and plastic strain tensor components and C i j k l is the fourth-order tensor of elastic moduli. All of the tensorial quantities are calculated in the local frames xi specific for each grain, so that C ijkl has five independent values — C 1111 ,   C 1122 ,   C 1133 ,   C 3333 ,   C 2323 —irrespective of the grain orientations.
The components of the plastic strain rate tensor are related to the slip on active slip systems via the geometrical equations
ε ˙ i j p = 1 2 α γ ˙ α s i α n j α + s j α n i α ,
where γ ˙ α is the shear strain rate in the α slip system, s i α and n i α are the components of the slip direction and slip plane normal vectors in the xi coordinate system.
The shear strain rate γ ˙ α is a function of the resolved shear stresses that follows a power law [26]:
γ ˙ α = γ ˙ 0 τ α τ CRSS α ν s i g n τ α ,
where γ ˙ 0 is the initial slip rate and ν is the strain rate sensitivity coefficient. The values of these parameters were chosen to achieve the convergence between the quasi-static and dynamic solutions [27]. The resolved shear stress in an active slip system is calculated as:
τ α = s i α σ i j n j α .
Commercially pure titanium is characterized by three prismatic, three basal, six <a>-pyramidal, twelve first order <c + a>-pyramidal and six s order <c + a>-pyramidal slip systems. In our calculations, we take into account only three prismatic, three basal and twelve first order <c + a>-pyramidal slips [28]. According to Schmid’s law, a slip system becomes active when the resolved shear stress τ α reaches the τ CRSS α value. The value of the critical resolved shear stress in an α slip system is defined as:
τ CRSS α = τ 0 α + f ε e q p .
here, τ 0 α denotes the initial critical resolved shear stress (CRSS) on the α-slip system and f ε e q p stands for the strain-hardening function of the equivalent plastic strain accumulated in a finite element
f ε e q p = k 1 e x p ε e q p / b ,
where k and b are the fitting coefficients. The material constants and model parameters are presented in Table 1.
The boundary-value problem was solved in a dynamic formulation using an ABAQUS/Explicit finite element package (2019, Dassault Systèmes, Velizi, France). The boundary conditions simulated uniaxial tension along the X-axis (Figure 2a). The symmetry conditions, with respect to the surface plane, were specified on the bottom surface; the top and lateral surfaces were free from external forces. To minimize the inertial term in the equation of motion, the velocity of tension was smoothly increased at the initial stage and then maintained at constant. Further features of the FE implementation are given at length in Refs. [16,22,27].

4. Roughness Quantification

4.1. Fractal Dimension

The procedure for calculating the fractal dimension, DF, takes its roots from Hurst’s pioneering work [29]. In order to obtain the fractal dimension, the Hurst exponent was calculated using a so-called R/S analysis, developed by Mandelbrot and Wallis in Ref. [30]. In materials science applications [31], the Hurst exponent is referred to as the roughness exponent and treated as one of the roughness pattern characteristics.
In this work, the fractal dimension is determined in terms of the Hausdorff-Besicovitch dimension. Its calculation procedure for a data set DS of length N is described as follows [32,33]:
  • The data set DS is divided into d subsets of length n, where n is a divider of N;
  • For each subset DSm (m = 1, …, d):
    a.
    The mean Em and the standard deviation Sm are calculated;
    b.
    The data are normalized by subtracting the sample mean
    D S m ,     i n o r m = D S m , i E m ,   for   i = 1 ,   2 ,   ,   n ;
    c.
    The cumulative series are calculated as
    C S m , i = j = 1 i D S m , j n o r m ,   for   = 1 ,   2 ,   ,   n ;
    d.
    The range is found as
    R m = max C S m , 1 ,   ,   C S m , n m i n C S m , 1 ,   ,   C S m , n
    and then rescaled as
    R m / S m ;
  • The mean value of the rescaled range is calculated for all subsets:
    R / S n = 1 d m = 1 d R m S m .
The steps 1–3 are repeated for all dividers of N larger than 100.
Considering the relation R / S n ~ c o e f × n H , the value of the Hurst exponent H is obtained by running a simple linear regression over the equation given below:
log ( R / S ) n = log c o e f + H log n .
The Hurst exponent is related to the Hausdorff-Besicovitch dimension by the equation
D F = 2 H .
Sánchez-Granero et al. [32] analyzed the procedure of the Hurst exponent calculation. They found that the R/S analysis failed to provide the appropriate results when the length of the subsets n was small. A modification of the R/S analysis to improve the procedure for small n numbers was proposed by Anis and Lloyd [34] in 1976 and further developed by Peters [35] in 1994.
The following equation was proposed In Ref. [32]
log   H n = log R / S n log E R / S n + 0.5 log n ,
where E(R/S)n is calculated as
E R / S n = n 1 2 n Γ n 1 2 π   Γ n 2 i = 1 n 1 n i i         f o r   n 340 , n 1 2 n 1 π n 2   i = 1 n 1 n i i       f o r   n 340 ,
where Γ is the gamma function that can be found as
Γ n = n 1 ! .
Then H can be found by the linear regression on
l o g H n = l o g c o e f + H l o g n .
In our calculations, we applied this modification for the cases where H exceeded its limits [0; 1].

4.2. Standard Roughness Estimations

The arithmetic and root mean square average roughness parameters, Ra and RRMS, are most widely used in roughness quantifications [36,37,38]. They are calculated for surface profiles as:
R a = 1 n p i = 1 n p y i x ¯
and   R R M S = 1 n p i = 1 n p y i x ¯ 2 ,
where np is the number of profile points, y i is the height of the i-th point and x ¯ is the profile mean height. The main drawback related to the definition of these values is the requirement of the ISO standard for the preliminary filtering of the high-frequency noise oscillations and the slope presented in the surface profiles [39]. Being reliant on the intuition of the researcher, the choice of the filtering thresholds may affect the Ra and RRMS values in the wrong way and lead to the misinterpretation of the experimental data [40]. Moreover, there are contradictory opinions about the correctness of the Ra measurements in the neck region. Some researchers [36] excluded this region from the roughness quantification to avoid the effects of biaxial strain. Others believed such measurements are acceptable, but for the profiles without a pronounced slope [41,42,43].
In this paper, the Ra and RRMS values were calculated for the preliminary filtered profiles to meet the ISO standard [39]. To this end, the profiles were leveled out horizontally and then subjected to FFT filtering to remove the low-frequency components, referred to as waviness.

4.3. Dimensionless Roughness Parameter

A new approach to DISR quantification was proposed in Ref. [16], with the assumption that the surface patterns are related to the multiscale deformation mechanisms that develop in a loaded material. The high and low frequencies presented in the raw surface profiles were not filtered out to take into account the deformation mechanisms from all scales. The dimensionless roughness parameter Rd was introduced in Ref. [16] to analyze the surface morphology of plastically deformed titanium and aluminum alloys. By the analogy with a strain measure, the Rd value was calculated as:
R d = L r / L e 1 ,
where Lr is the rough profile length and Le is the base length. The change in this parameter is interpreted as follows: the larger the Rd value, the stronger the surface irregularity caused by the out-of-plane displacements. It was found that the Rd value nonlinearly correlated with the degree of plastic strain at the mesoscale.

5. Results

5.1. Microstructure

The EBSD analysis revealed equiaxed grains with diameters of 10–30 microns (Figure 3a,b). The pole figures presented in Figure 3c show a split basal texture with the deviation of prismatic axes within 15°.
Corresponding to the experimental data, the average grain size in the polycrystalline models was 20 µm (Figure 3b) and the experimental sets of Euler angles delivered by EBSD were randomly assigned to the model grains (cf. Figure 2a and Figure 3a).

5.2. Model Validation

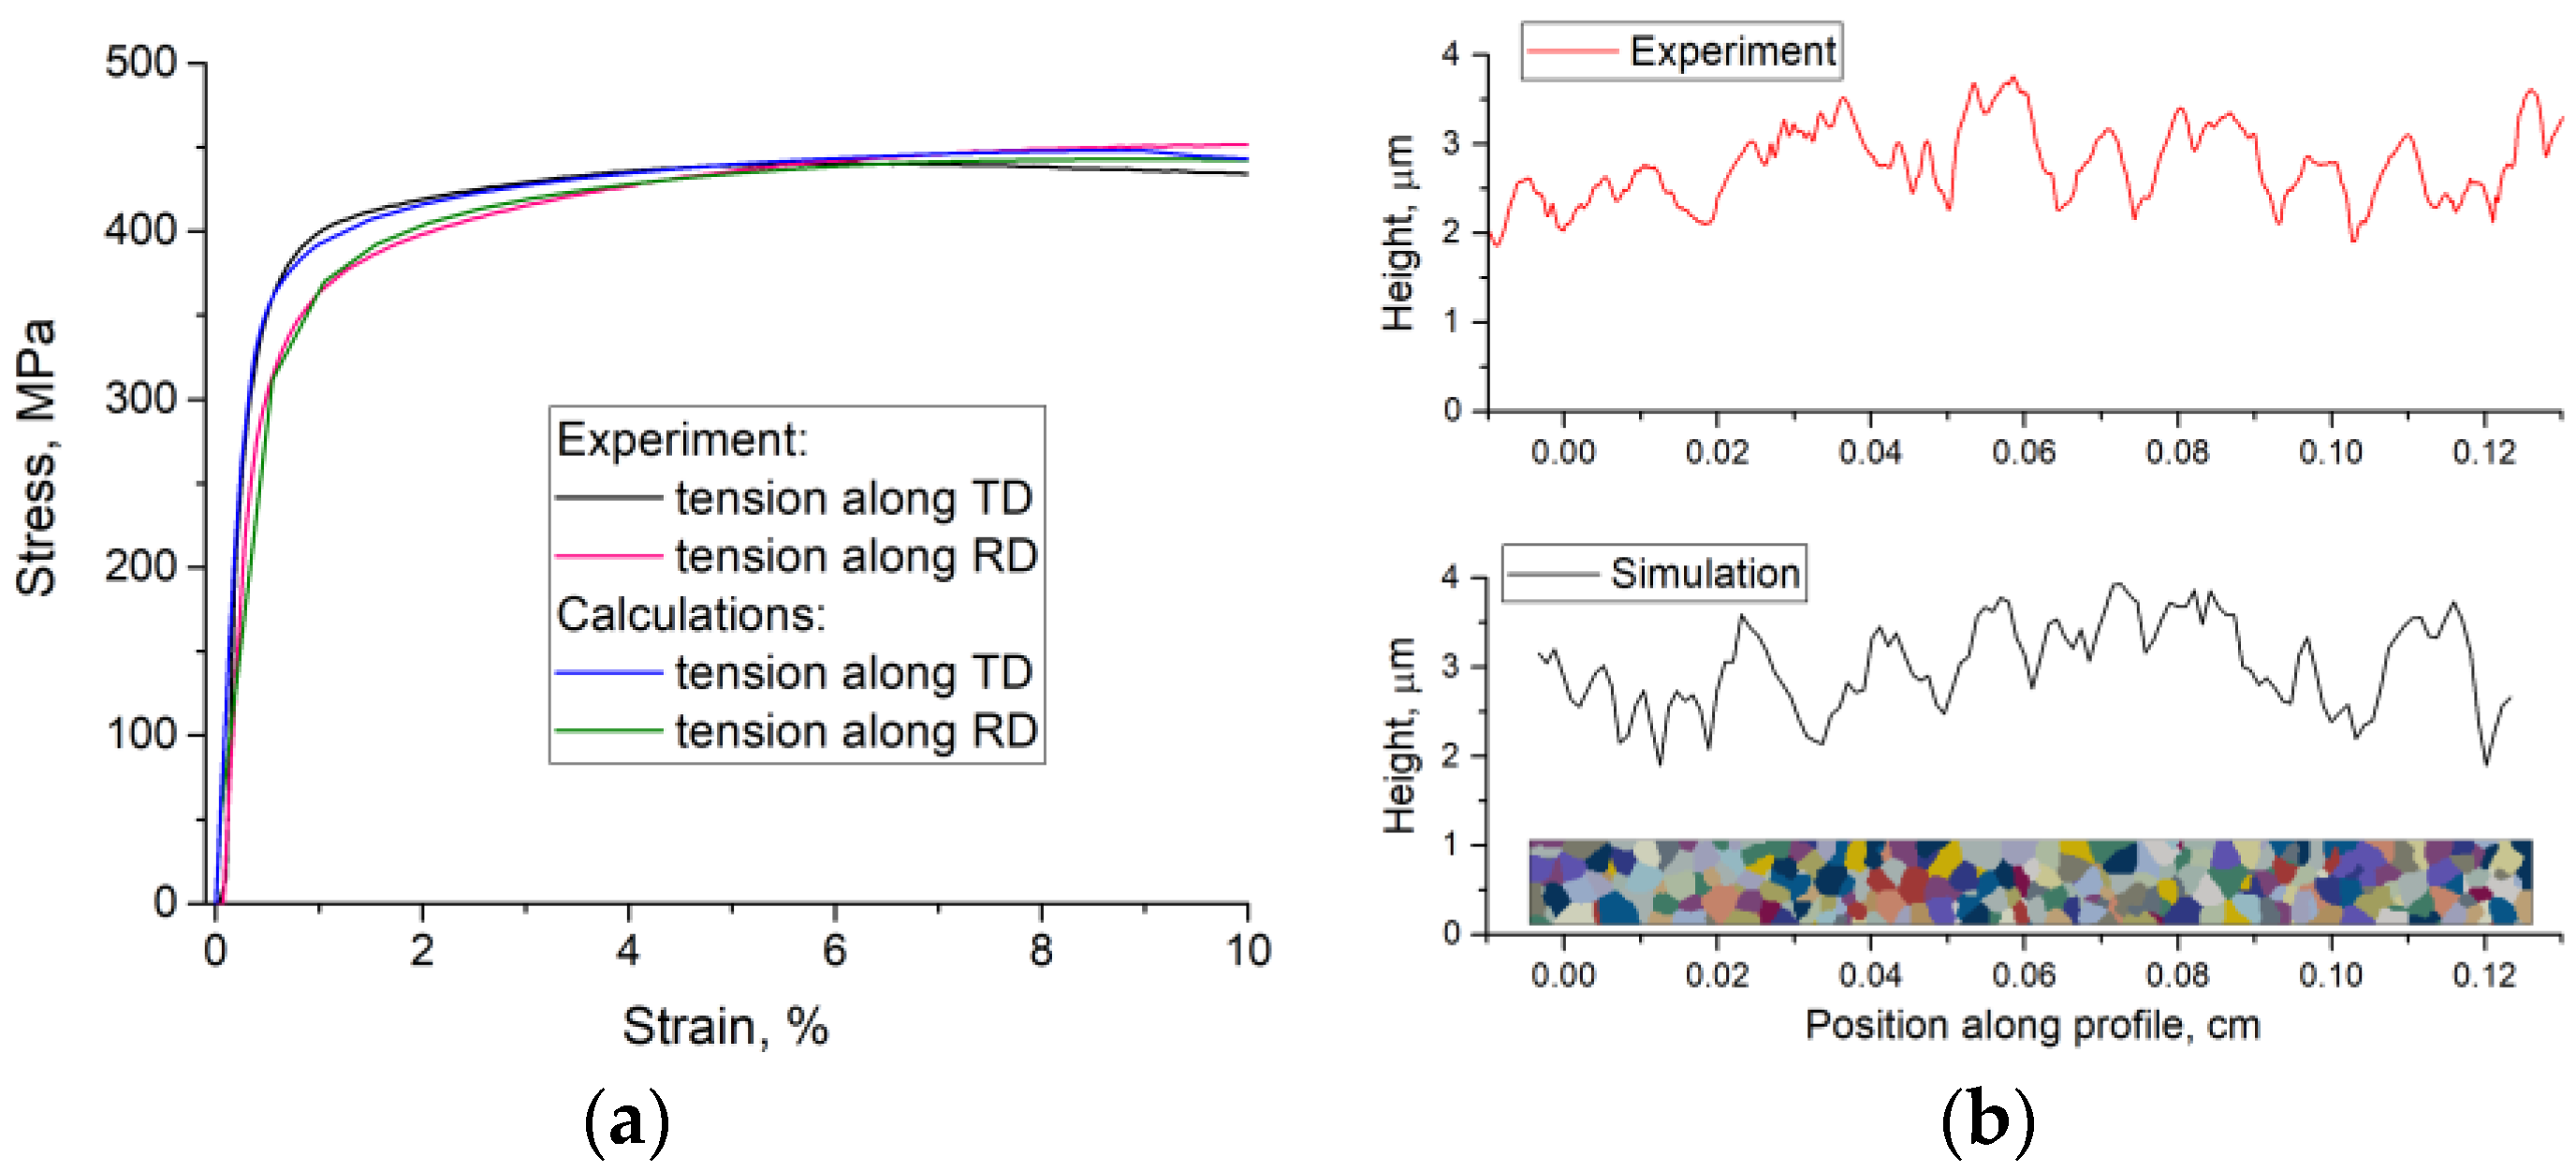
In order to validate the numerical model, the calculations were performed for the polycrystalline models loaded along the RD and TD. The homogenized stress-strain curves obtained in the calculations are plotted in Figure 4a in comparison with the experimental data. Experimental tensile tests were performed according to the GOST standard [44]. The agreement between the experimental and numerical stress-strain curves with a high degree of accuracy validates the model at the macroscale.
Comparing the experimental and numerical surface patterns revealed qualitative and quantitative similarity at the mesoscale. As an example, the surface profiles measured in the experimental and model specimens at the same degree of tensile strain are presented in Figure 4b. The peak-to-valley distance and width of the surface oscillations varied within the same range in the experimental and numerical profiles, which verifies the model correctness at the mesoscale. Further numerical analysis of the roughness evolution was performed for the model polycrystals loaded along the TD.

5.3. Experimental Observations for Mesoscale Roughening

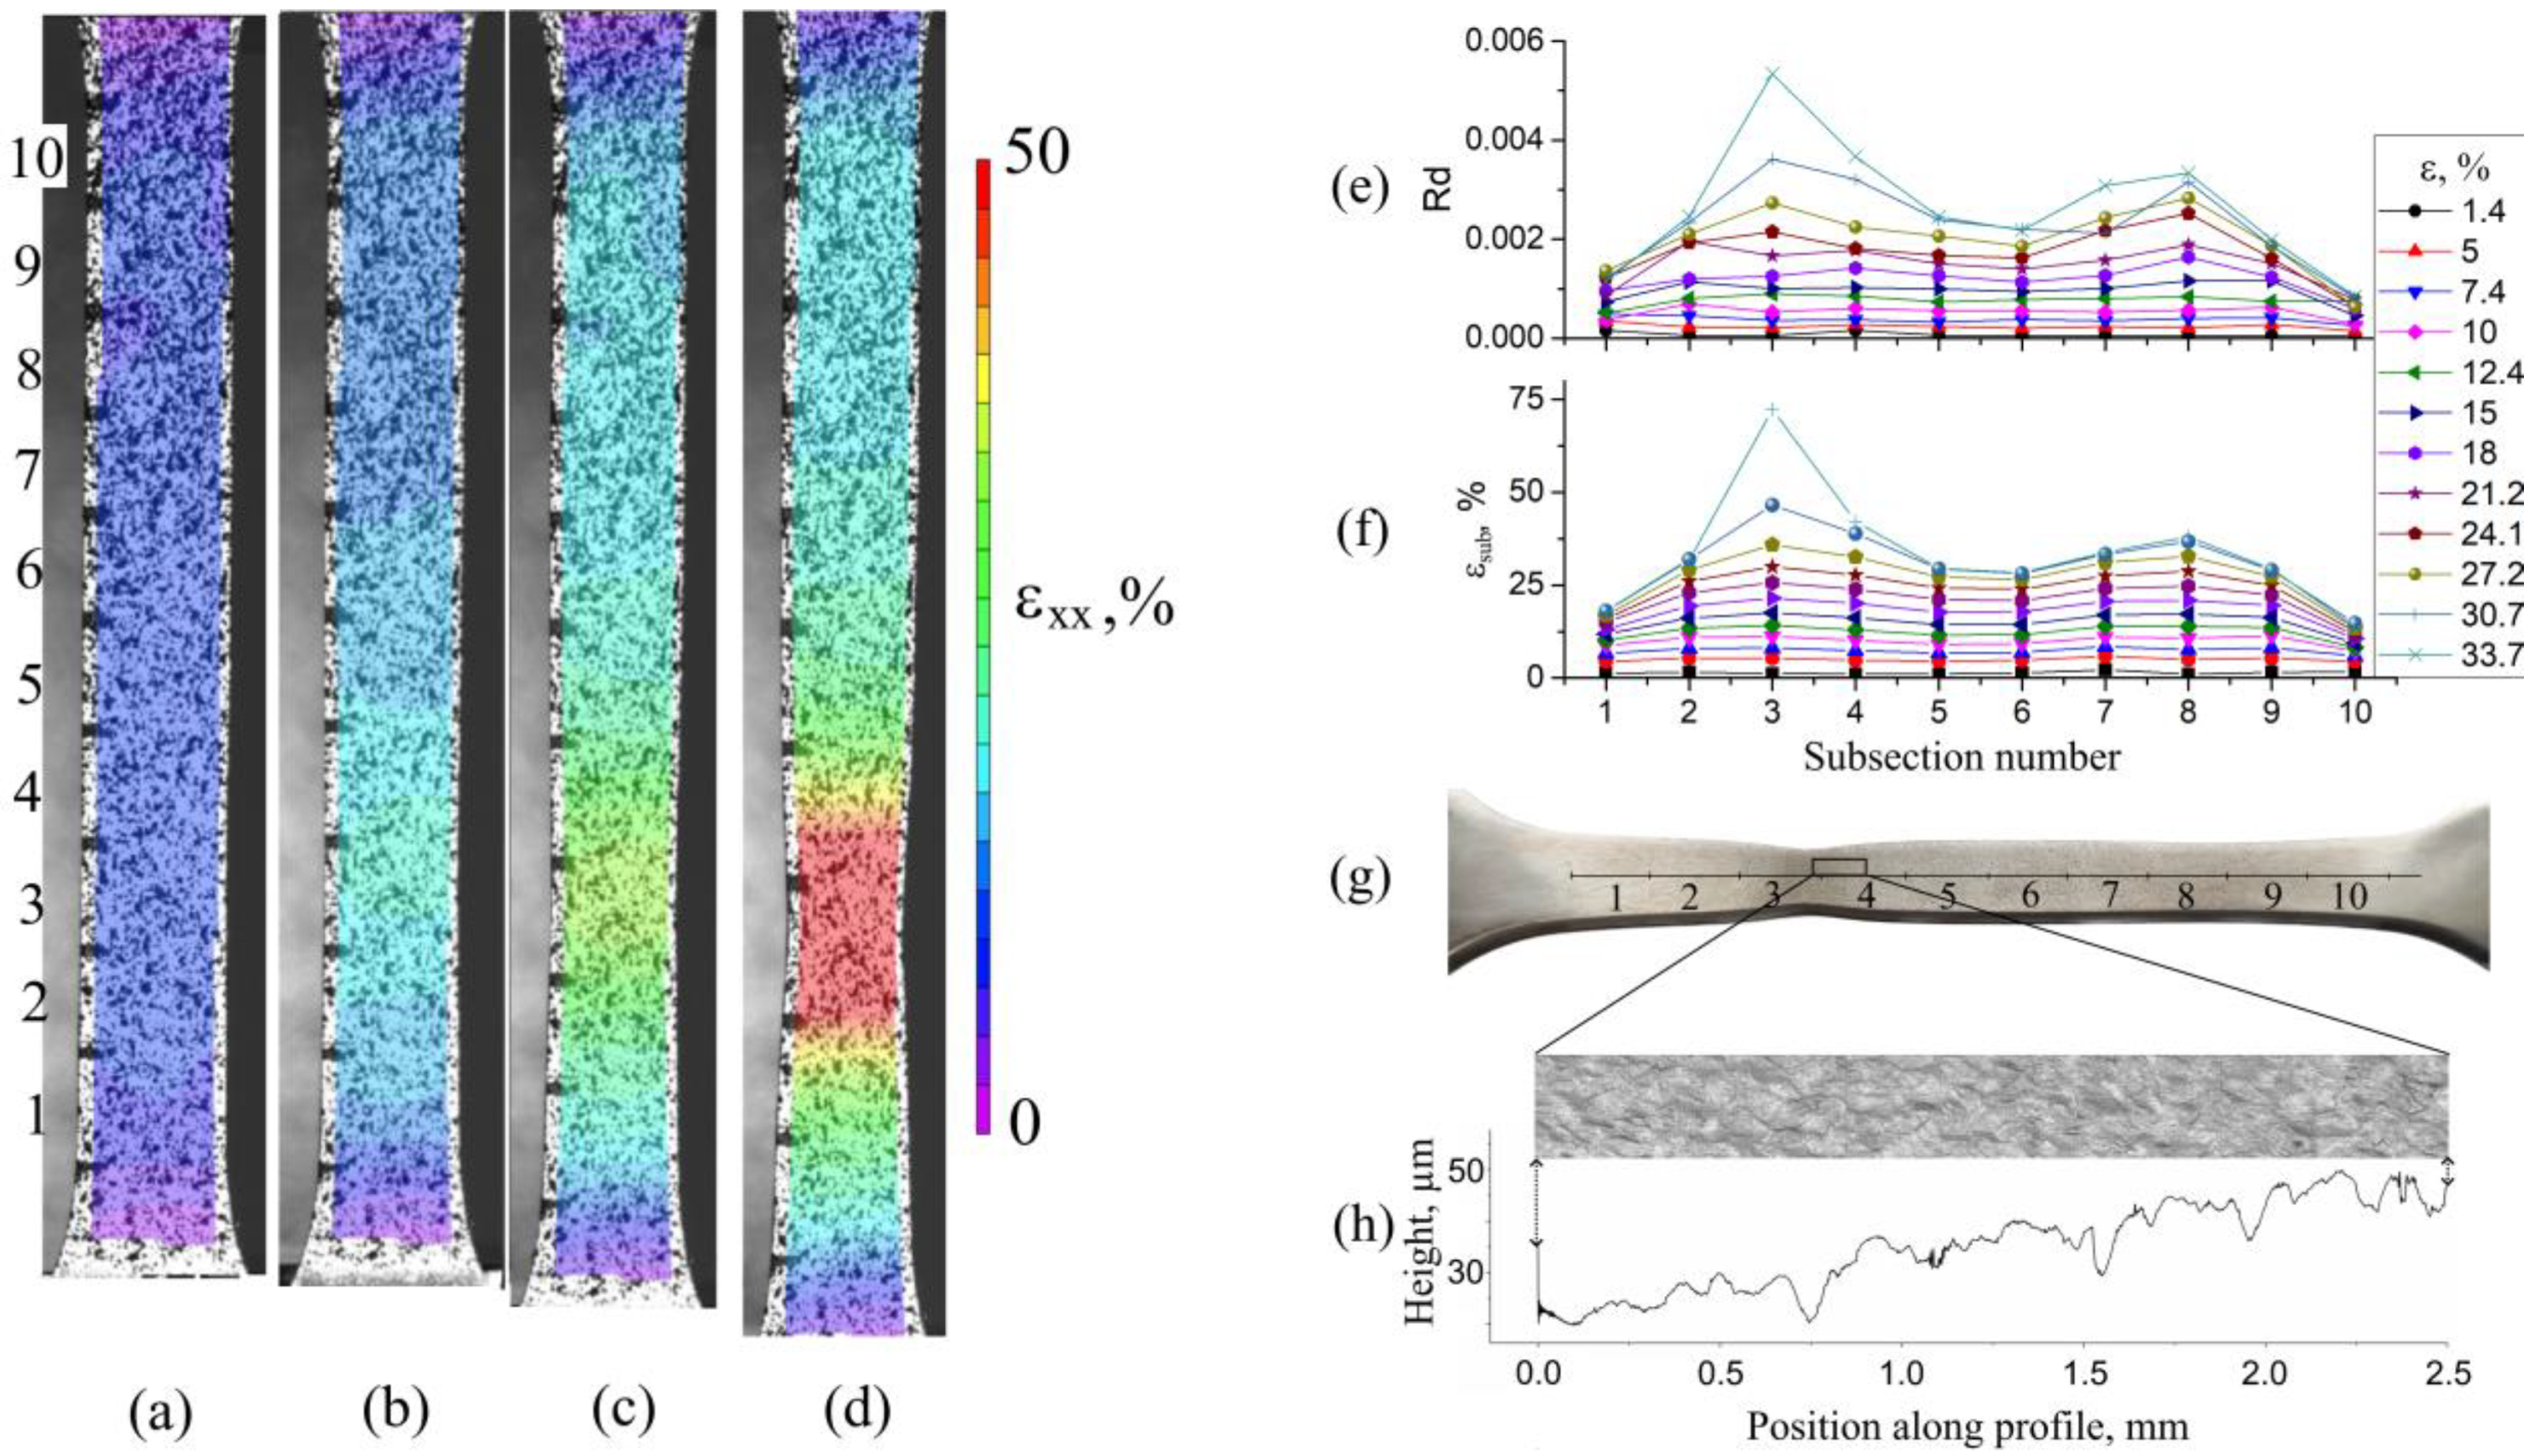
The in-plane deformation fields obtained by DIC are presented in Figure 5a–d for 10, 15, 20 and 25% tensile strains. The optical image and corresponding surface profile for the neck region elongated to 72% are shown in Figure 5h.
For quantifying and comparing the roughness patterns, the Ra, RRMS, and Rd parameters were calculated by Equations (9)–(11), respectively, for the whole set of experimental profiles taken along the specimen centerline. Recall that the profiles were preliminarily filtered for the Ra and RRMS estimations and remained unfiltered for evaluating Rd. The dependences of the subsection strain εsub and the Rd and Ra values on the specimen elongation ε are plotted in Figure 6a–c in the form of individual curves for each subsection (for the sake of shortness, the RRMS dependences behaving much similarly to Ra are not presented here). Additionally, the Rd and εsub distributions along the specimen gage part are given in Figure 5e,f for the different tensile strains.
It is readily seen from the comparison of Figure 6a–c that the Rd roughness values and the subsection strains εsub correlate well to each other. This conclusion is also supported by the Rd and εsub distributions in Figure 5e,f. The DIC measurements (Figure 5a–d) show that the specimen experiences an almost uniform deformation up to 15% tensile strain. Accordingly, the εsub curves nearly coincide, as do the Rd dependences. On further tension, the specimen deformation ceases to be uniform, with the strain rate increasing in subsections 3 and 8 and decreasing in the regions adjacent to the specimen shoulders. The Rd values in the specimen subsections grow proportionally to their elongations with an exponential increase in the region of necking (subsection 3). Noticeably, a monotonous correlation between the Ra and εsub values exists in the range of moderate strains, but is violated after 20% specimen elongation (cf. Figure 6b,c). In particular, these values in the neck region grew even slower than in other subsections. This is a result of the artificial surface smoothing caused by filtering out low-frequency components in the surface profiles.
Along with the roughness parameters, the evolution of the surface morphology was investigated in terms of fractal dimension DF, as detailed in Section 4.3. The DF values in each subsection seem not to correlate with either subsection strain or specimen elongation, but change chaotically within an arc-shaped area with a parabolic mean line MM’ (Figure 6d). The ascending and descending portions of the mean line take place before and after 20% specimen straining. It is interesting to note that the range of DF scattering around the mean remains unchanged throughout the entire deformation process, except in the final stage, where the DF value decreases abruptly in the neck region (magenta and blue triangles in Figure 6d). The analysis of the surface morphology in the neck region suggests the following explanation: the contribution of low-scale surface asperities in the neck region becomes negligible in comparison to the macroscopic waviness. This conclusion is supported by the experimental data reported by Kuznetsov et al. for austenite stainless steel in Ref. [20], where the fractal dimension changed in a stepwise fashion during tensile load and dropped shortly before fracture. The authors suggested that this effect could be attributed to smoothing over the low-scale surface asperities during necking.

5.4. Numerical Stress-Strain Fields and Roughness Patterns

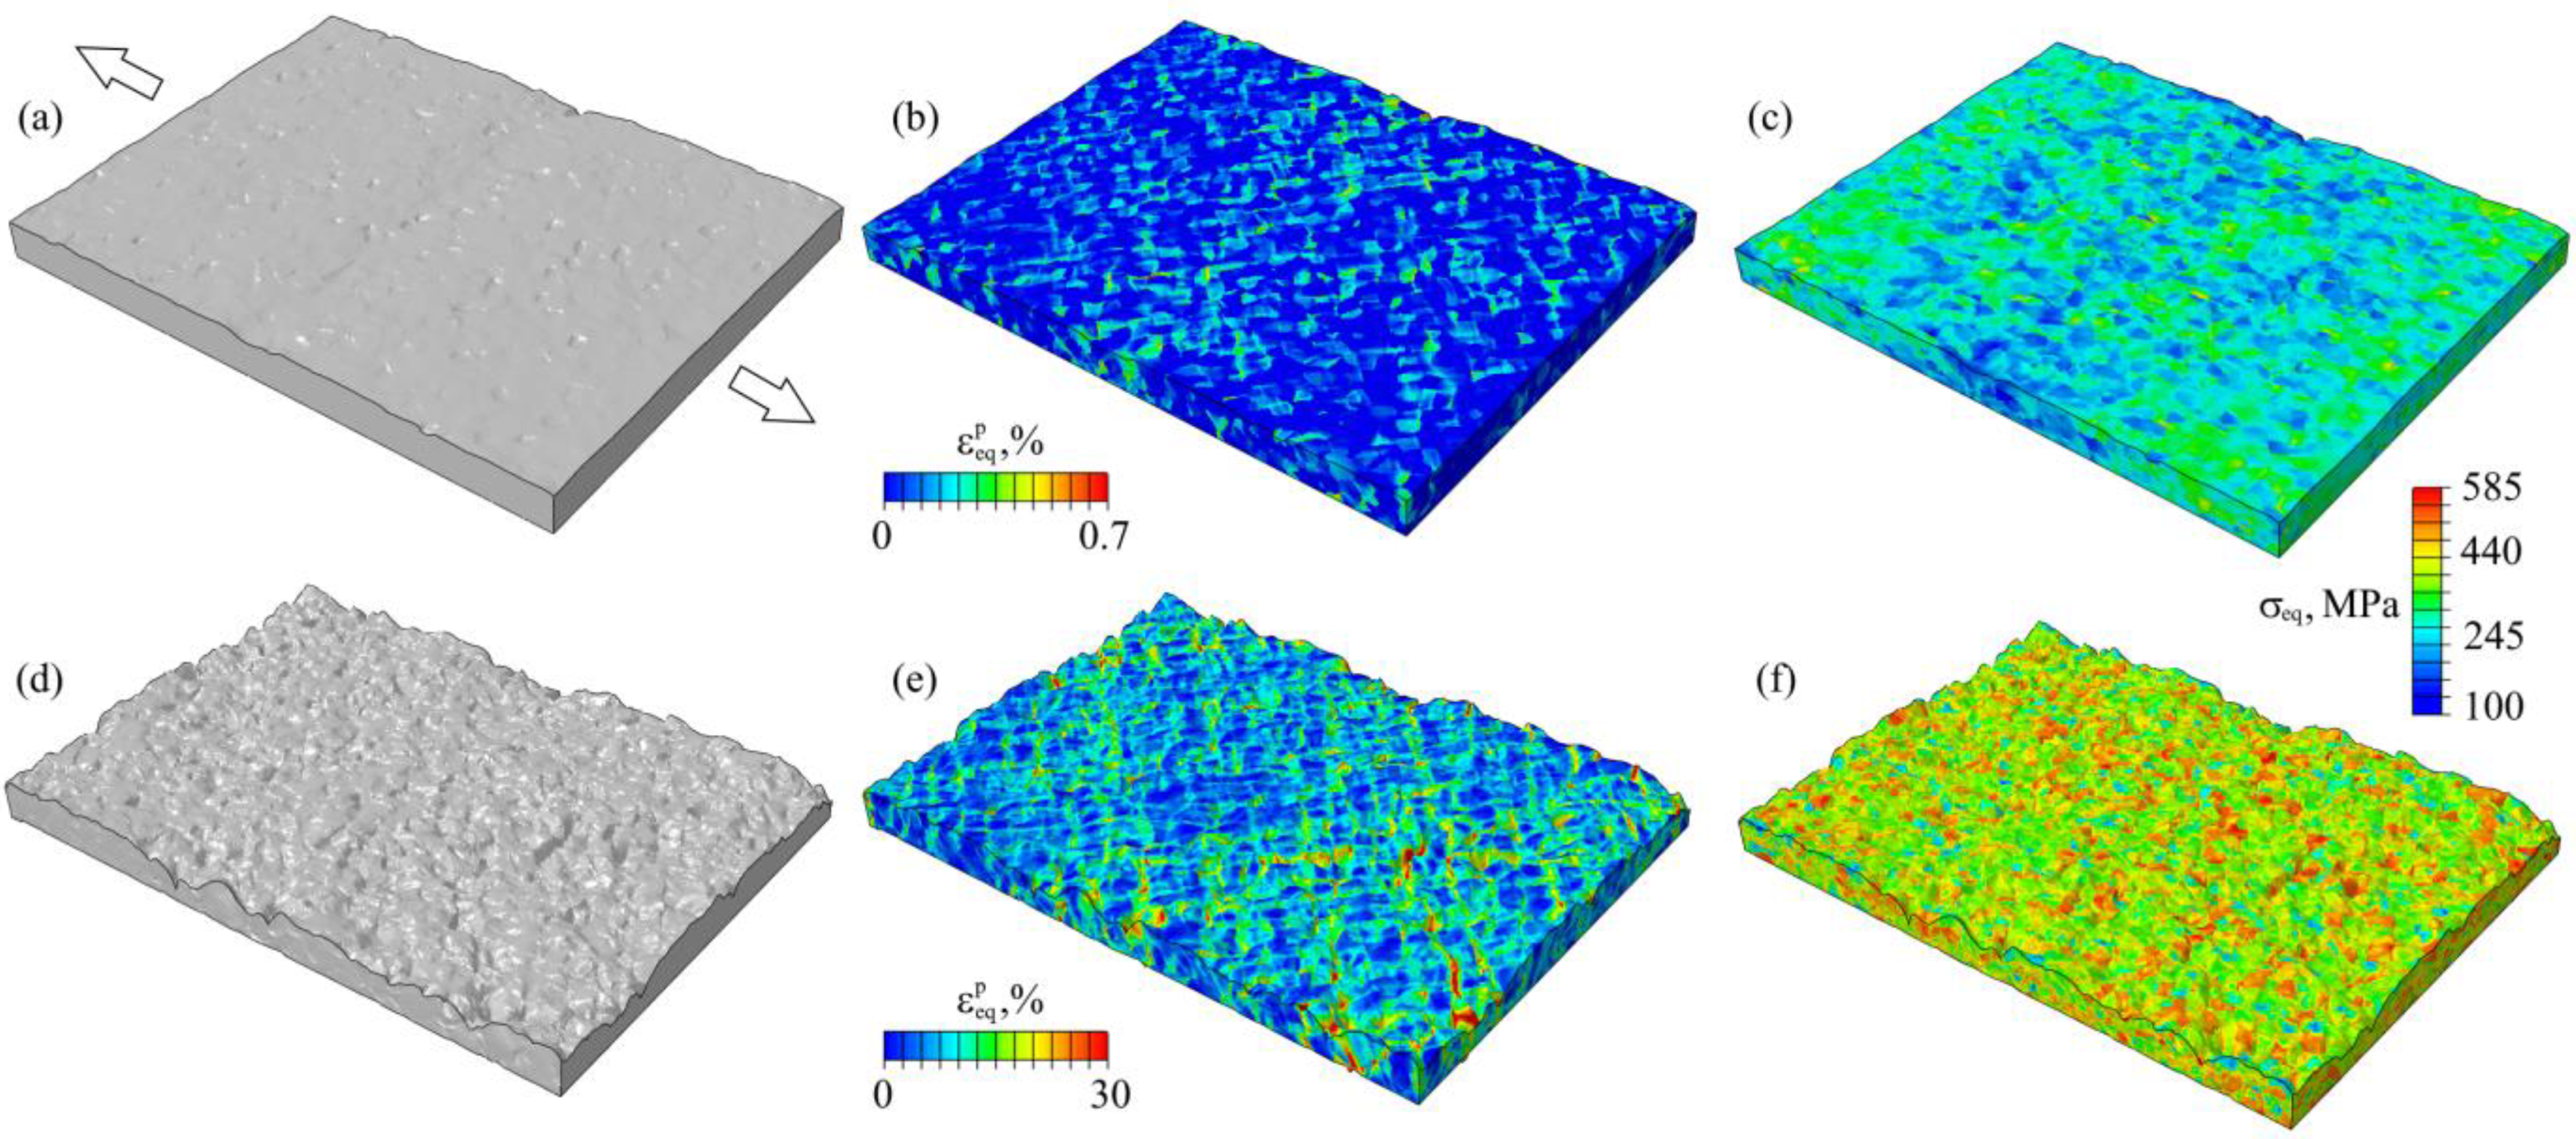
Microstructure-based numerical simulations provide an exceptional opportunity to establish a correlation between the grain-scale stress-strain fields and DISR parameters. To this end, the stress, plastic strain and displacement fields obtained in the calculations were analyzed qualitatively and quantitatively and compared to the free surface morphology represented by the FE mesh distortions. As an example, the equivalent stress and plastic strain fields, as well as their corresponding roughness patterns, are shown in Figure 7 for 0.22 and 5% tensile strains.
The comparison of the roughness patterns with the grain structure has shown that small hills and dimples appearing on the surface are attributed to individual grains or grain parts extruded or plunged relative to the neighboring material (cf. Figure 2a and Figure 7a). These kinds of surface imperfections make a tangible contribution to roughening in the early stage of plastic deformation (note that individual dislocation jogs, which could provide even finer surface asperities, were not resolved either experimentally or numerically). The grains with the largest Schmid factors in the prismatic slip systems had started to deform plastically well before the average stress in the stress-strain curve reached the macroscopic yield point, which is consistent with the results reported by Kawano et al. [11]. Most of these grains exhibited in-plane deformation, while some grains moved perpendicular to the surface plane to form the hills and dimples, referred to as the microscale roughening (see Figure 7a,b). As a result, the grain boundaries became visible on the spotlighted surface of the computational model as early as 0.2% tensile strain.
As plastic deformation develops, the grains are united into clusters to form larger surface undulations. Involved in the cooperative motion, the grain groups are capable of accommodating larger out-of-plane deformation, thus increasing the surface roughening. Although individual grains within the ridges and valleys are still deformed by dislocation mechanisms, the cooperative deformation of the grain clusters is a non-dislocation event and is classified as mesoscale. First, mesoscale undulations appeared nearly simultaneously with the microscale asperities and were formed by groups of two or three grains. As more grains were involved in the plastic deformation, the small grain clusters were united into larger ones to form even higher and longer ridges and valleys (Figure 7d).
Correspondingly, extended band-like regions of plastic strain localization develop on the surface and in the bulk (Figure 7e). These bands of localized deformation go through the grains, irrespective of their orientation, and thus are treated as the mesoscale events. Note, the roughness is related to the surface displacements, while out-of-plane strains are calculated as the displacement gradients. Therefore, more intensive plastic strain develops in the regions of narrow surface peaks and valleys and on the steep hillsides of the surface asperities, where the displacement gradients are higher. A layer-by-layer analysis of the plastic strain fields revealed that the mesoscale bands seen on the surface are a visible portion of the strain localization regions formed in the bulk of the material.

5.5. Amplitude-Frequency Analysis of Roughness Profiles

With the assumption that the surface morphology is related to the deformation mechanisms developing at different length scales, the Fast Fourier Transform (FFT) was applied to the experimental and numerical profiles to distinguish the characteristic frequency components present in the profile structure. The experimental profiles were examined in the specimen subsection, where the roughening resulted in macroscopic necking (Figure 8a). Similar to the experimental procedure, the numerical profiles at different tensile strains were measured along the centerline of the polycrystalline model consisting of 36,000 grains (Figure 8b).
It is seen from the experimental and numerical profiles (Figure 8a,b) that the material surface begins to roughen from the very incipience of plastic deformation. The peaks and valleys that appeared in the profiles in an early deformation stage became higher or deeper with straining, but did not change their positions relative to each other.
The normalized amplitude-frequency spectra for the experimental and numerical profiles are plotted in Figure 8c,d, respectively, for four selected strain values. The high-frequency FFT components located in the right part of the frequency axis are attributed to the microscale out-of-plane displacements and rotations of individual grains or grain parts; being initially small, their amplitudes only slightly increase up to 15% strain and then nearly stop growing. The lower-frequency components associated with the mesoscale surface undulations become dominated shortly after the yield point in the stress-strain curve.
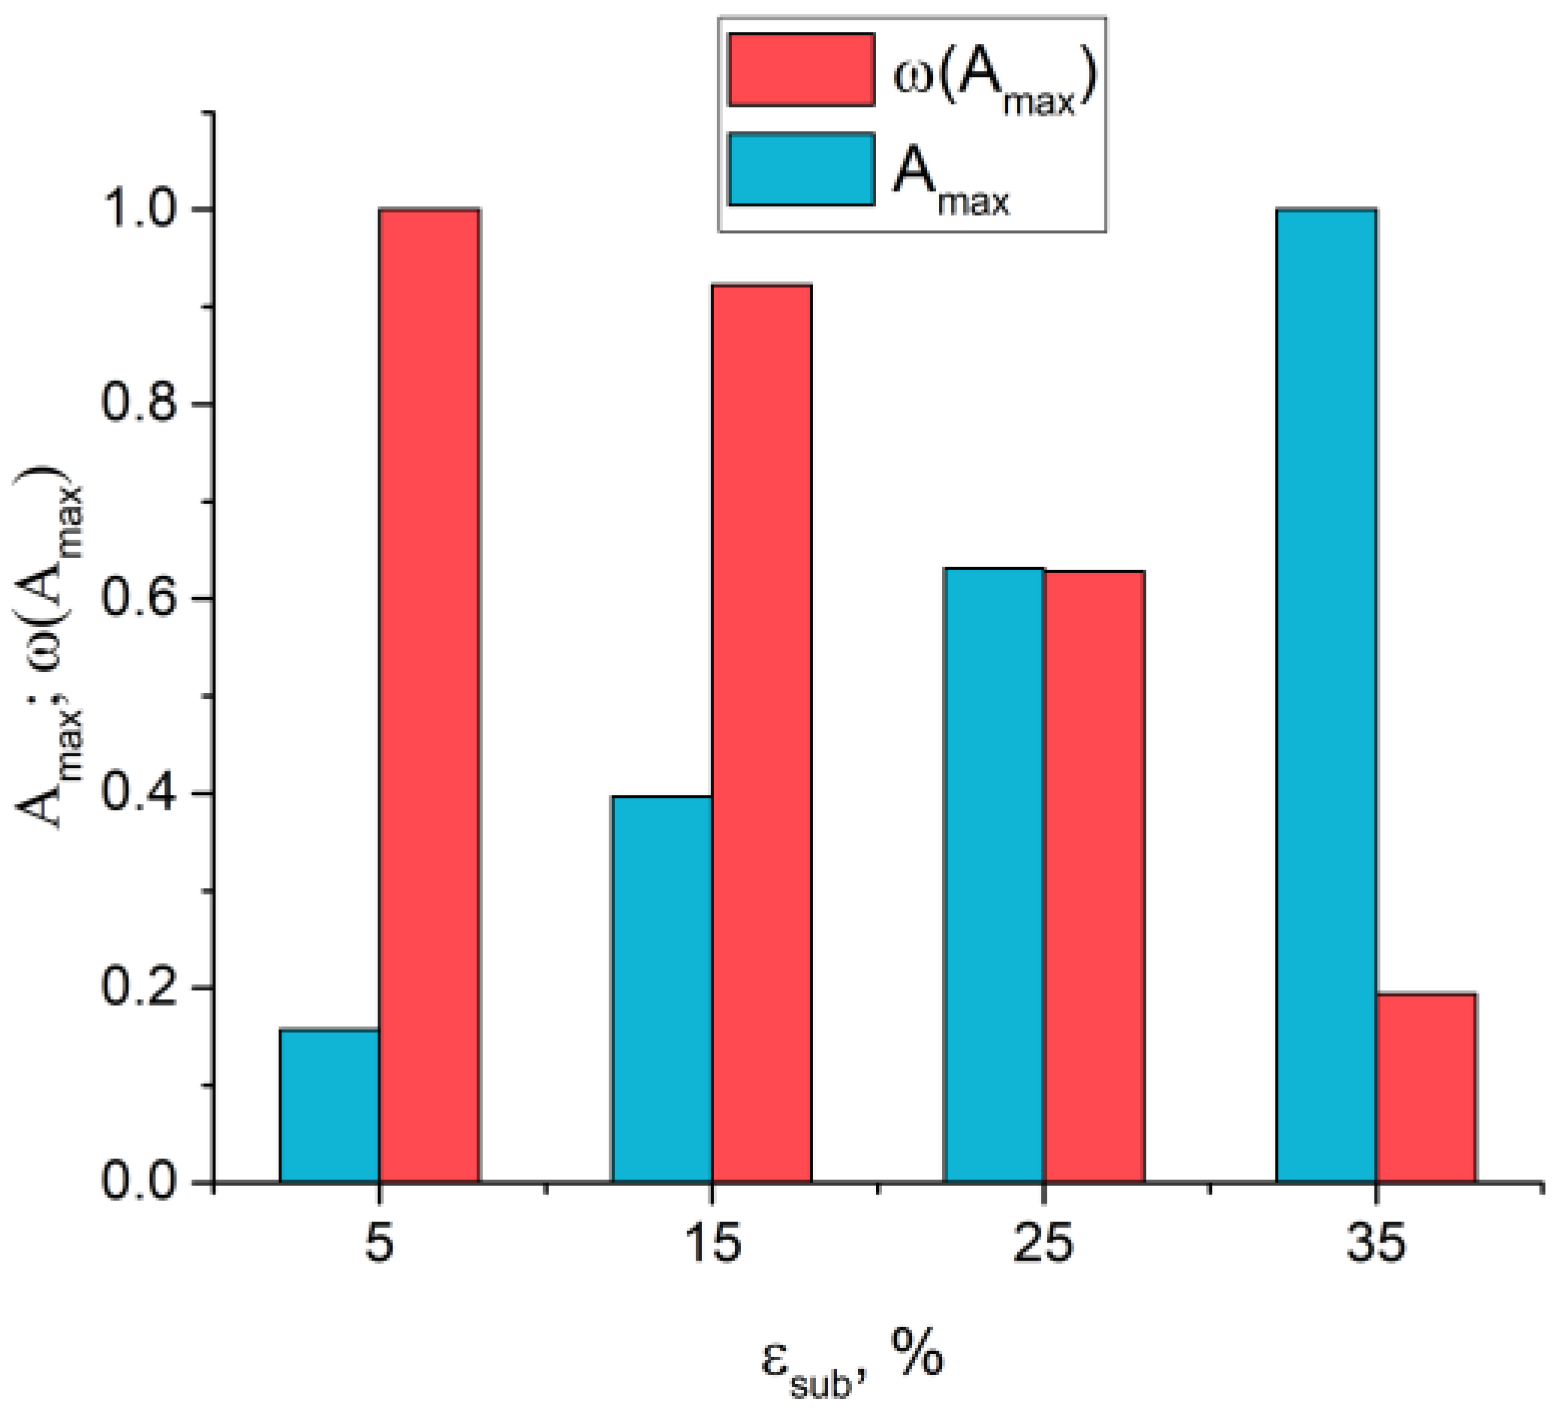
Evidently, the contribution of a certain FFT component to roughening is as large as its amplitude is high. As the plastic deformation develops, the profile components with the highest amplitudes shift towards low frequencies, as illustrated by the bar graph in Figure 9. Here, the red and blue bars are the maximum amplitudes and their corresponding frequencies found in the FFT decompositions of the experimental profiles (Figure 8c). The increase in the maximum amplitude of the lower-frequency components bears witness to the roughness intensification due to the formation of increasingly large mesoscale surface undulations.

6. Discussion

6.1. Stress Analysis

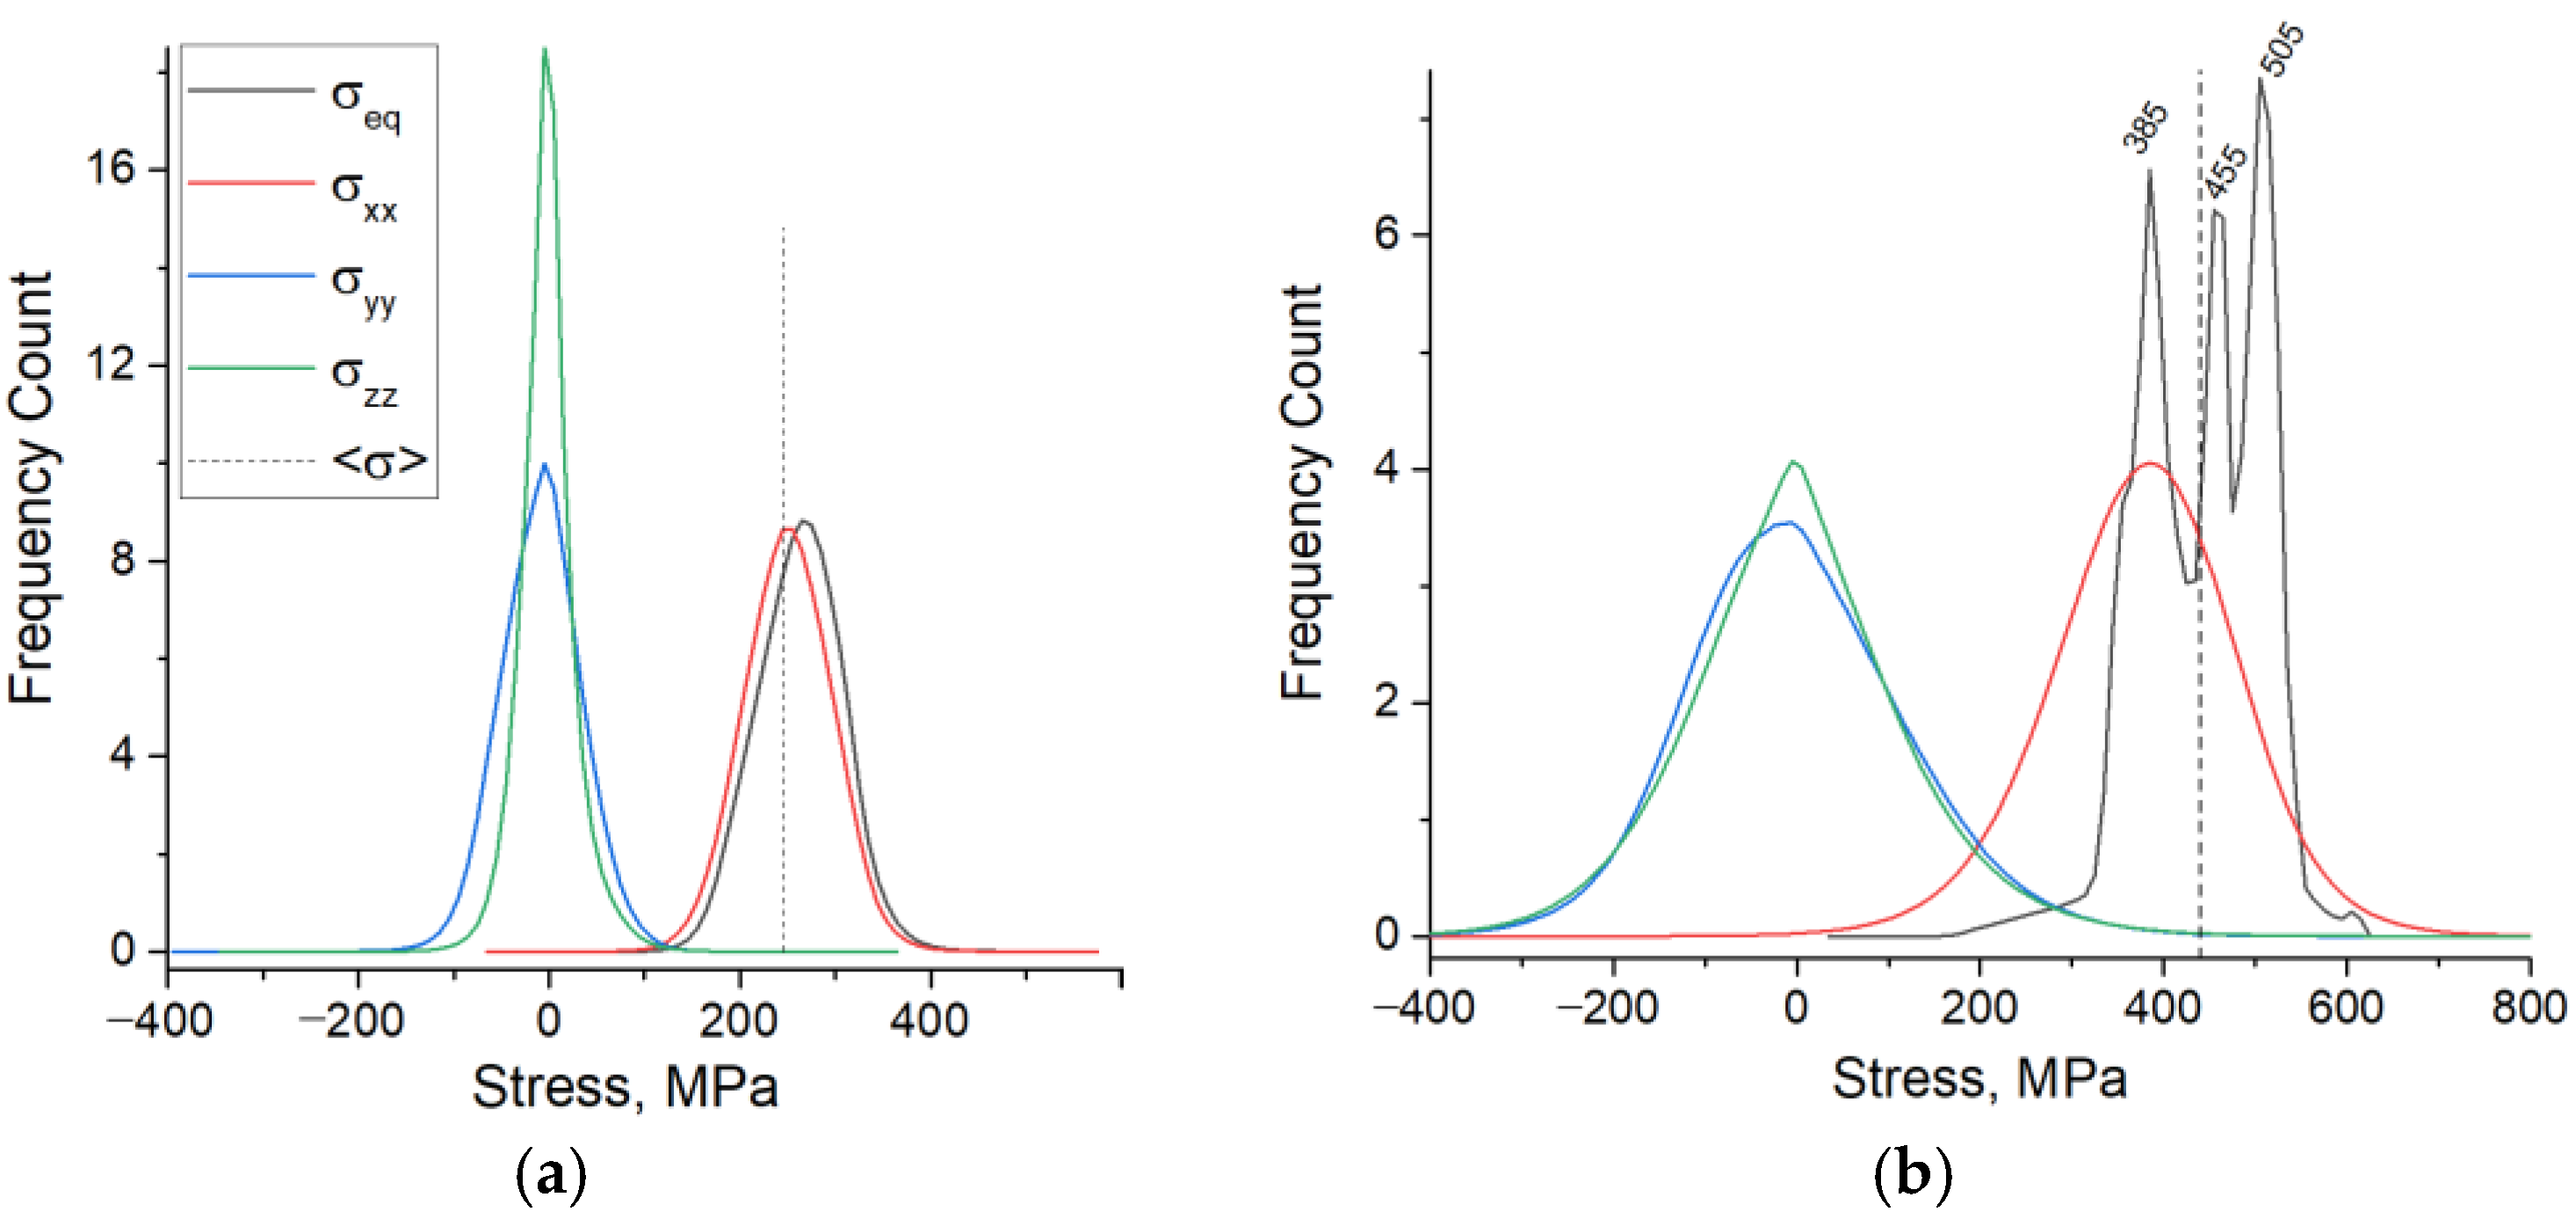
Macroscopically, the largest contribution to the equivalent stress under uniaxial tension is made by the stress tensor component along the tensile axis, with the other stresses equaling zero. At the grain scale, however, all of the stress tensor components were found to make comparable contributions to the deformation behavior, deviating significantly from their average values. As an illustration, the frequency count distributions for the stress tensor diagonal components are plotted in Figure 10 for 0.22% and 5% tensile strains. The frequency count of the σeq values in the very beginning of the plastic deformation obeys a normal distribution and are therefore the other stress tensor components (Figure 10a). At the later deformation stage, however, the σeq frequency count transforms into a multimodal distribution, with one peak corresponding to the mean value < σ > (the dashed line in Figure 10b) and two others located on its right and left sides. According to these statistics, a large portion of the grains exhibit higher or lower stress than that shown in the stress-strain curve for the same degree of tensile strain (Figure 4a).
The macroscopic conditions of uniaxial tension require that the average values of the stresses acting perpendicular to the tensile axis are zero in order to keep the force balance. Consistently, the frequency curves for the σyy and σzz stresses demonstrate a normal distribution with respect to zero (Figure 10). In the meantime, the standard deviations of approximately 120 MPa from the mean zero value indicate that the grains exerting nonzero positive or negative stresses occupy a considerable area already at 5% strain (Figure 10b). The stress fields in Figure 11 show that the nonzero stress values in the very top layer of the polycrystalline model are mainly observed along the grain boundaries. However, at a depth of half the grain diameter, most grains undergo compressive or tensile stresses normal to the tensile axis. The regions of positive and negative stresses compensate each other to provide an average zero stress, thus meeting the force equilibrium conditions. The nonzero local stresses acting from the bulk perpendicular to the surface plane are associated with the corresponding strains and displacements, thus, giving rise to surface roughening.

6.2. Relationship between Mesoscale Roughness and In-Plane Plastic Strain

Experimental methods for evaluating plastic strains in loaded materials are commonly based on either analyzing certain microstructural features (e.g., texture, dislocation density, phase composition, etc.) or calculating the strain distributions from the displacement fields. The former methods require, as a rule, rather complex experimental techniques and, yet, are not applicable for non-destructive testing. A drawback of the second group of methods is the requirement for the in-situ monitoring of the surface displacements during the entire deformation process, using, e.g., DIC or preliminary drawn surface grids, which are often not readily applicable for real structures. Contrastingly, the roughness assessments rely on the comparison of the out-of-plane surface displacements with the initially flat surface and thus do not require the knowledge of the loading history.
In order to establish a quantitative relationship between the mesoscale roughness and in-plane plastic strains, the experimental Rd, Ra, and DF data were brought into correspondence with the subsection strains εsub (Figure 12). The Rd vs. εsub data (Figure 12a) are approximated by a linear curve with a 0.99 determination coefficient, which bears witness to a strong correlation between the two quantities. Similarly, the Ra values correlate linearly with the in-plane strains of the corresponding subsections; however, with a larger scatter and a lower determination coefficient of 0.91. Note that this plot does not include the neck region where the Ra measurements are invalid even for filtered profiles.
The DF values measured in the specimen subsections are plotted against the subsection strains εsub in Figure 12c. While the subsection strains monotonously increase, the fractal dimension changes in a sawtooth fashion. As an example, the DF dependence for the neck region is shown in Figure 12c through the triangle symbols connected by the blue line. The DF value deviates up and down from the mean (the MM’ line in Figure 12c) as εsub increases and drops abruptly when the neck is formed.
To gain a better understanding of what we can learn about surface morphology using different roughness parameters, we analyzed some simplified cases of sinusoidal profiles (Figure 13b–h), defined by the analytical functions listed in Table 2. The Ra, RRMS, Rd, and DF values calculated for the analytical curves are represented by a bar graph in Figure 13a and summarized in Table 2.
Intuition suggests that the roughness intensity of the sine profiles should increase from (b) towards (h), following the tendency that the larger the sine frequency and amplitude, the stronger the surface irregularity. Accordingly, the Rd value progressively increases for the curves in Figure 13b–h, from top to bottom, taking on the largest value for the profile (h), defined by the sum of the two sine functions with the largest amplitude and the highest frequency. The standard roughness parameters Ra and RRMS increase with the sine amplitude, but do not depend on the frequency. For instance, the Ra and RRMS demonstrate different values for the two sets of curves plotted in Figure 13c–e and Figure 13f–h, but remain nearly unchanged within each group. The fractal dimension DF tends to increase with the frequency for the sine functions of the same kind (cf. DF values for the curves (c)–(e) or (f)–(h)). However, the appearance of low-frequency components in the sum may decrease the DF value even though the amplitude of the resulting curve becomes larger (cf., e.g., the red, blue, and magenta bars corresponding to the sine functions (b), (c), and their sum (f), respectively). Going back to the experimental results, the DF sawtooth pattern observed in the specimen subsections can be related to the appearance of low-frequency components in the structure of the surface profiles.

7. Conclusions

The main findings are summarized as follows:
(i)
Deformation-induced roughening is attributed to inhomogeneous stress-strain fields acting from the bulk across the surface. The surface begins to roughen well before the macroscopic yield point, when some plastically deformed grains start moving perpendicular to the surface plane to form isolated hills and dimples.
(ii)
Plastically deformed grains united into mesoscale clusters are capable of accommodating larger out-of-plane deformation. As deformation develops, the small grain clusters are united into larger ones to form even higher and longer ridges and valleys. Noticeably, the peaks and valleys that appeared in the profiles in the early deformation stage became higher or deeper with straining, but did not change their positions relative to each other.
(iii)
The FFT decomposition of the roughness profiles revealed that the contribution of low-frequency components progressively increases with the plastic strain; this suggests roughness intensification due to the formation of increasingly large mesoscale surface undulations.
(iv)
A strong correlation with a determination coefficient of 0.99 is revealed between the dimensionless roughness parameter Rd and the corresponding in-plane plastic strains. The standard roughness parameters Ra and RRMS correlate linearly with the in-plane strains, but only for moderate tensile deformation, which is a result of filtering out low-frequency components in the surface profiles.
(v)
The fractal dimension DF changes with the subsection strains in a sawtooth fashion, with an abrupt drop in the neck region. The descent portions of the DF dependences are supposedly related to the appearance of low-frequency components in the structure of the surface profiles.

Author Contributions

Conceptualization, V.R., R.B. and E.E.; methodology, V.R. and R.B.; software, V.R., E.E. and M.P.; validation, E.E. and M.P.; investigation, O.Z., E.E. and M.P.; writing—original draft preparation, E.E., M.P. and O.Z.; writing—review and editing, V.R. and R.B.; visualization, E.E. and M.P.; supervision, V.R.; project administration, V.R.; funding acquisition, V.R. and R.B. All authors have read and agreed to the published version of the manuscript.

Funding

This work is supported by Russian Science Foundation (Project No. 20-19-00600). The design of polycrystalline geometrical models and roughness estimations for experimental and numerical surface profiles were performed using in-house software packages (No. 2020664434 and 2022682243, respectively) developed within the Government research assignment for ISPMS SB RAS, project FWRW-2021-0002.

Institutional Review Board Statement

Not applicable.

Informed Consent Statement

Not applicable.

Data Availability Statement

The data are available upon request.

Acknowledgments

Microstructural studies were carried using the equipment of Tomsk Regional Core Shared Research Facilities Center of National Research Tomsk State University.

Conflicts of Interest

The authors declare no conflict of interest.

References

  1. Strantza, M.; Van Hemelrijck, D.; Guillaume, P.; Aggelis, D.G. Acoustic Emission Monitoring of Crack Propagation in Additively Manufactured and Conventional Titanium Components. Mech. Res. Commun. 2017, 84, 8–13. [Google Scholar] [CrossRef]
  2. Khan, T.I.I.; Rashid, A.A.; Hidaka, R.; Hattori, N.; Islam, M. Fatigue Crack Analysis of Ferrite Material by Acoustic Emission Technique. J. Mech. Eng. Sci. 2019, 13, 5074–5089. [Google Scholar] [CrossRef]
  3. Soldatenkov, A.P.; Naydenkin, E.V.; Shanyavsky, A.A.; Mishin, I.P.; Eremin, A.V.; Bogdanov, A.A.; Panin, S.V. A Mesoscale Study of Fatigue Fracture of Near β Titanium Alloy VT22 after Radial Shear Rolling with Subsequent Aging. Phys. Mesomech. 2022, 25, 537–548. [Google Scholar] [CrossRef]
  4. Skripnyak, V.V.; Skripnyak, V.A. Mechanical Behavior of Alpha Titanium Alloys at High Strain Rates, Elevated Temperature, and under Stress Triaxiality. Metals 2022, 12, 1300. [Google Scholar] [CrossRef]
  5. Trusov, P.V.; Shveykin, A.I.; Kondratyev, N.S.; Yants, A.Y. Multilevel Models in Physical Mesomechanics of Metals and Alloys: Results and Prospects. Phys. Mesomech. 2021, 24, 391–417. [Google Scholar] [CrossRef]
  6. Wu, X.; Kalidindi, S.; Necker, C.; Salem, A. Prediction of Crystallographic Texture Evolution and Anisotropic Stress–Strain Curves during Large Plastic Strains in High Purity α-Titanium Using a Taylor-Type Crystal Plasticity Model. Acta Mater. 2007, 55, 423–432. [Google Scholar] [CrossRef]
  7. Vraneš, M.; Cvjetićanin, N.; Papović, S.; Pavlović, M.; Szilágyi, I.; Gadžurić, S. Electrochemical Study of Anatase TiO2 Nanotube Array Electrode in Electrolyte Based on 1,3-Diethylimidazolium Bis(Trifluoromethylsulfonyl)Imide Ionic Liquid. Ionics 2019, 25, 5501–5513. [Google Scholar] [CrossRef]
  8. Amiri Delouei, A.; Emamian, A.; Karimnejad, S.; Li, Y. An Exact Analytical Solution for Heat Conduction in a Functionally Graded Conical Shell. J. Appl. Comput. Mech. 2020, 1–16. [Google Scholar] [CrossRef]
  9. Kolubaev, E.A.; Rubtsov, V.E.; Chumaevsky, A.V.; Astafurova, E.G. Micro-, Meso- and Macrostructural Design of Bulk Metallic and Polymetallic Materials by Wire-Feed Electron-Beam Additive Manufacturing. Phys. Mesomech. 2022, 25, 479–491. [Google Scholar] [CrossRef]
  10. Saberi, A.; Bakhsheshi-Rad, H.R.; Karamian, E.; Kasiri-Asgarani, M.; Ghomi, H.; Omidi, M.; Abazari, S.; Ismail, A.F.; Sharif, S.; Berto, F. Synthesis and Characterization of Hot Extruded Magnesium-Zinc Nano-Composites Containing Low Content of Graphene Oxide for Implant Applications. Phys. Mesomech. 2021, 24, 486–502. [Google Scholar] [CrossRef]
  11. Kawano, Y.; Mitsuhara, M.; Mayama, T.; Deguchi, M. Formation Mechanism of High-Strain Bands in Commercially Pure Titanium. Mater. Sci. Eng. A 2023, 867, 144670. [Google Scholar] [CrossRef]
  12. Li, H.; Fu, M. Inhomogeneous Deformation-Induced Surface Roughening Defects. In Deformation-Based Processing of Materials; Elsevier: Amsterdam, The Netherlands, 2019; pp. 225–256. ISBN 978-0-12-814381-0. [Google Scholar]
  13. Popov, V.L. Coefficients of Restitution in Normal Adhesive Impact between Smooth and Rough Elastic Bodies. Rep. Mech. Eng. 2020, 1, 103–109. [Google Scholar] [CrossRef]
  14. Daghbouj, N.; Sen, H.S.; Callisti, M.; Vronka, M.; Karlik, M.; Duchoň, J.; Čech, J.; Havránek, V.; Polcar, T. Revealing Nanoscale Strain Mechanisms in Ion-Irradiated Multilayers. Acta Materialia 2022, 229, 117807. [Google Scholar] [CrossRef]
  15. Haritos, G.K.; Hager, J.W.; Amos, A.K.; Salkind, M.J.; Wang, A.S.D. Mesomechanics: The Microstructure-Mechanics Connection. Int. J. Solids Struct. 1988, 24, 1081–1096. [Google Scholar] [CrossRef]
  16. Romanova, V.; Balokhonov, R.; Emelianova, E.; Sinyakova, E.; Kazachenok, M. Early Prediction of Macroscale Plastic Strain Localization in Titanium from Observation of Mesoscale Surface Roughening. Int. J. Mech. Sci. 2019, 161–162, 105047. [Google Scholar] [CrossRef]
  17. Ma, X.; Zhao, J.; Du, W.; Zhang, X.; Jiang, L.; Jiang, Z. Quantification of Texture-Induced Ridging in Ferritic Stainless Steels 430 and 430LR during Tensile Deformation. J. Mater. Res. Technol. 2019, 8, 2041–2051. [Google Scholar] [CrossRef]
  18. Qin, L.; Van Houtte, P.; Seefeldt, M. Meso-Scale Modelling on Ridging or Roping of Aluminium Alloys. Mater. Sci. Technol. 2013, 2, 1274–1283. [Google Scholar]
  19. Shimizu, I.; Abe, T. Surface Roughening and Fractal Dimension during Plastic Deformation of Polycrystalline Iron. JSME Int. Journal. Ser. A Mech. Mater. Eng. 1994, 37, 403–411. [Google Scholar] [CrossRef] [Green Version]
  20. Kuznetsov, P.V.; Panin, V.E.; Schreiber, J. Fractal Dimension as a Characteristic of Deformation Stages of Austenite Stainless Steel under Tensile Load. Theor. Appl. Fract. Mech. 2001, 35, 171–177. [Google Scholar] [CrossRef]
  21. Li, G.-Q.; Wang, Y.-B. (Eds.) Behavior and Design of High-Strength Constructional Steel; Woodhead Publishing Series in Civil and Structural Engineering; Woodhead Publishing: Cambridge, UK, 2021; ISBN 978-0-08-102932-9. [Google Scholar]
  22. Emelianova, E.; Romanova, V.; Zinovieva, O.; Pisarev, M.; Balokhonov, R. A Microstructure-Based Mechanical Model of Deformation-Induced Surface Roughening in Polycrystalline α-Titanium at the Mesoscale. Mech. Adv. Mater. Struct. 2022, 29, 7364–7374. [Google Scholar] [CrossRef]
  23. Romanova, V.; Balokhonov, R. A Method of Step-by-Step Packing and Its Application in Generating 3D Microstructures of Polycrystalline and Composite Materials. Eng. Comput. 2021, 37, 241–250. [Google Scholar] [CrossRef]
  24. Diard, O.; Leclercq, S.; Rousselier, G.; Cailletaud, G. Evaluation of Finite Element Based Analysis of 3D Multicrystalline Aggregates Plasticity. Int. J. Plast. 2005, 21, 691–722. [Google Scholar] [CrossRef]
  25. Roters, F.; Eisenlohr, P.; Hantcherli, L.; Tjahjanto, D.D.; Bieler, T.R.; Raabe, D. Overview of Constitutive Laws, Kinematics, Homogenization and Multiscale Methods in Crystal Plasticity Finite-Element Modeling: Theory, Experiments, Applications. Acta Mater. 2010, 58, 1152–1211. [Google Scholar] [CrossRef]
  26. Hutchinson, J.W. Bounds and Self-Consistent Estimates for Creep of Polycrystalline Materials. Proc. R. Soc. Lond. A 1976, 348, 101–127. [Google Scholar] [CrossRef]
  27. Romanova, V.; Balokhonov, R.; Emelianova, E.; Zinovieva, O.; Zinoviev, A. Microstructure-based simulations of quasistatic deformation using an explicit dynamic approach. Facta Univ. Ser. Mech. Eng. 2019, 17, 243. [Google Scholar] [CrossRef]
  28. Emelianova, E.S.; Romanova, V.A.; Balokhonov, R.R.; Pisarev, M.; Zinovieva, O.S. A Numerical Study of the Contribution of Different Slip Systems to the Deformation Response of Polycrystalline Titanium. Phys. Mesomech. 2021, 24, 166–177. [Google Scholar] [CrossRef]
  29. Hurst, H.E. Long-Term Storage Capacity of Reservoirs. T. Am. Soc. Civ. Eng. 1951, 116, 770–799. [Google Scholar] [CrossRef]
  30. Mandelbrot, B.B.; Wallis, J.R. Robustness of the Rescaled Range R/S in the Measurement of Noncyclic Long Run Statistical Dependence. Water Resour. Res. 1969, 5, 967–988. [Google Scholar] [CrossRef]
  31. Zhao, Y.; Wang, G.-C.; Lu, T.-M. Characterization of Amorphous and Crystalline Rough Surface: Principles and Application; Experimental Methods in the Physical Sciences; Academic Press: San Diego, CA, USA, 2001; ISBN 978-0-12-475984-8. [Google Scholar]
  32. Sánchez Granero, M.A.; Trinidad Segovia, J.E.; García Pérez, J. Some Comments on Hurst Exponent and the Long Memory Processes on Capital Markets. Phys. A Stat. Mech. Appl. 2008, 387, 5543–5551. [Google Scholar] [CrossRef]
  33. Ceballos, R.F.; Largo, F.F. On The Estimation of the Hurst Exponent Using Adjusted Rescaled Range Analysis, Detrended Fluctuation Analysis and Variance Time Plot: A Case of Exponential Distribution. Imp. J. Interdiscip. Res. 2017, 3, 424–434. [Google Scholar] [CrossRef]
  34. Annis, A.A.; Lloyd, E.H. The Expected Value of the Adjusted Rescaled Hurst Range of Independent Normal Summands. Biometrika 1976, 63, 111–116. [Google Scholar] [CrossRef]
  35. Peters, E.E. Fractal Market Analysis: Applying Chaos Theory to Investment and Economics; Wiley Finance Editions; J. Wiley & Sons: New York, NY, USA, 1994; ISBN 978-0-471-58524-4. [Google Scholar]
  36. Ottenklev, F.; Adell, M.; Orlov, D. Non-Monotonic Evolution of Surface Roughness in a Stainless Steel during Cold Deformation. Mater. Sci. Eng. A 2021, 799, 140150. [Google Scholar] [CrossRef]
  37. Fomin, V.M.; Golyshev, A.A.; Kosarev, V.F.; Malikov, A.G.; Orishich, A.M.; Filippov, A.A. Deposition of Cermet Coatings on the Basis of Ti, Ni, WC, AndB4C by Cold Gas Dynamic Spraying with Subsequent LaserIrradiation. Phys. Mesomech. 2020, 23, 291–300. [Google Scholar] [CrossRef]
  38. Kolesnikov, V.I.; Kudryakov, O.V.; Zabiyaka, I.Y.; Novikov, E.S.; Manturov, D.S. Structural Aspects of Wear Resistance of Coatings Deposited by Physical Vapor Deposition. Phys. Mesomech. 2020, 23, 570–583. [Google Scholar] [CrossRef]
  39. ISO 21920-2:2021; Geometrical product specifications (GPS) — Surface texture: Profile — Part 2: Terms, definitions and surface texture parameters. ISO: Geneva, Switzerland. Available online: https://www.iso.org/standard/72226.html (accessed on 24 January 2023).
  40. Nečas, D.; Valtr, M.; Klapetek, P. How Levelling and Scan Line Corrections Ruin Roughness Measurement and How to Prevent It. Sci. Rep. 2020, 10, 15294. [Google Scholar] [CrossRef]
  41. Yoshida, K. Effects of Grain-Scale Heterogeneity on Surface Roughness and Sheet Metal Necking. Int. J. Mech. Sci. 2014, 83, 48–56. [Google Scholar] [CrossRef]
  42. Zuñiga Tello, I.F.; Milković, M.; Domínguez Almaraz, G.M.; Gubeljak, N. Ultrasonic and Conventional Fatigue Endurance of Aeronautical Aluminum Alloy 7075-T6, with Artificial and Induced Pre-Corrosion. Metals 2020, 10, 1033. [Google Scholar] [CrossRef]
  43. Hopperstad, O.S.; Børvik, T.; Berstad, T.; Lademo, O.-G.; Benallal, A. A Numerical Study on the Influence of the Portevin–Le Chatelier Effect on Necking in an Aluminium Alloy. Modelling Simul. Mater. Sci. Eng. 2007, 15, 747–772. [Google Scholar] [CrossRef]
  44. GOST 1497:1984. Available online: https://docs.cntd.ru/document/1200004888 (accessed on 7 February 2023).
Figure 1. Specimen surfaces prepared for investigating with contact profilometry (a) and digital image correlation (b).
Metals 13 00440 g001
Figure 2. Model microstructure consisting of 12,000 grains shown in the IPF colors for the Z direction (a) and the crystalline and orthonormal coordinate frames of a hexagonal lattice (b).
Metals 13 00440 g002
Figure 3. Microstructural data for commercially pure titanium: an EBSD map (a), the grain size distribution (b), and the (0001) and ( 10 1 ¯ 0 ) pole figures (c).
Metals 13 00440 g003
Figure 4. Stress-strain curves (a) and surface profiles at 5% tensile strain (b) obtained experimentally and numerically.
Metals 13 00440 g004
Figure 5. Strain fields εxx obtained using DIC at tensile strains of 10% (a), 15% (b), 20% (c), and 25% (d). Dimensionless roughness parameter (e) and in-plane strain distributions (f) along the tensile axis (g), and the optical surface image and a roughness profile in a neck region (h).
Metals 13 00440 g005
Figure 6. In-plane strains εsub (a), Rd and Ra roughness parameters (b,c) and fractal dimension DF (d) for specimen subsections versus specimen tensile strain.
Metals 13 00440 g006
Figure 7. Calculated roughness patterns (a,d), and equivalent plastic strain (b,e) and stress fields (c,f) for 0.22% (ac) and 5% tensile strains (df) (the vertical mesh displacements are scaled with a factor of 3).
Metals 13 00440 g007
Figure 8. Surface profiles (a,b) and corresponding FFT spectra (c,d) obtained experimentally (a,c) and numerically (b,d).
Metals 13 00440 g008
Figure 9. Normalized amplitude-frequency characteristics for the maximum-amplitude FFT components for different strains.
Metals 13 00440 g009
Figure 10. Frequency count distributions of the stress tensor components calculated for 0.22% (a) and 5% tensile strain (b).
Metals 13 00440 g010
Figure 11. Stress tensor components acting perpendicular to the tensile axis for 0.22% (a) and 5% tensile strain (b).
Metals 13 00440 g011
Figure 12. The Ra (a), Rd (b) and DF values (c) versus in-plane plastic strains of specimen subsections.
Metals 13 00440 g012
Figure 13. Bar graphs of the Ra, RRMS, Rd, and DF values (a) calculated for analytically defined sinusoidal curves (bh).
Metals 13 00440 g013
Table 1. Material constants and model parameters [6, 16].
ParameterValue
C 1111 , GPa162
C 1122 , GPa92
C 1133 , GPa69
C 3333 , GPa181
C 2323 , GPa47
τ 0 p r i s m a t i c , MPa60
τ 0 b a s a l , MPa120
τ 0 p y r a m i d a l , MPa180
k, MPa14
b0.06
Table 2. Roughness estimates for sinusoidal curves.
Curve y(x)DFRaRRMSRd
(b)sin(x)1.0060.580.670.23
(c)0.5sin(5x)1.360.320.350.94
(d)0.5sin(10x)1.540.320.352.39
(e)0.5sin(20x)1.70.320.355.48
(f)sin(x) + 0.5sin(5x)1.160.6520.761.02
(g)sin(x) + 0.5sin(10x)1.340.6320.762.44
(h)sin(x) + 0.5sin(20x)1.520.6320.755.5
Disclaimer/Publisher’s Note: The statements, opinions and data contained in all publications are solely those of the individual author(s) and contributor(s) and not of MDPI and/or the editor(s). MDPI and/or the editor(s) disclaim responsibility for any injury to people or property resulting from any ideas, methods, instructions or products referred to in the content.