Article

A Comprehensive Analysis of Surface Roughness, Vibration, and Acoustic Emissions Based on Machine Learning during Hard Turning of AISI 4140 Steel

1
Mechanical Engineering Department, Necmettin Erbakan University, Konya 42130, Turkey
2
Mechanical Engineering Department, Technology Faculty, Selcuk University, Konya 42130, Turkey
3
Niğde Technical Hight College, Omer Halis Demir University, Niğde 51000, Turkey
4
Metallurgical and Material Engineering Department, Technology Faculty, Selcuk University, Konya 42130, Turkey
*
Author to whom correspondence should be addressed.
Metals 2023, 13(2), 437; https://doi.org/10.3390/met13020437
Submission received: 29 January 2023 / Revised: 15 February 2023 / Accepted: 19 February 2023 / Published: 20 February 2023

Abstract

:
Industrial materials are materials used in the manufacture of products such as durable machines and equipment. For this reason, industrial materials have importance in many aspects of human life, including social, environmental, and technological elements, and require further attention during the production process. Optimization and modeling play an important role in achieving better results in machining operations, according to common knowledge. As a widely preferred material in the automotive sector, hardened AISI 4140 is a significant base material for shaft, gear, and bearing parts, thanks to its remarkable features such as hardness and toughness. However, such properties adversely affect the machining performance of this material system, due to vibrations inducing quick tool wear and poor surface quality during cutting operations. The main focus of this study is to determine the effect of parameter levels (three levels of cutting speed, feed, and cutting depth) on vibrations, surface roughness, and acoustic emissions during dry turning operation. A fuzzy inference system-based machine learning approach was utilized to predict the responses. According to the obtained findings, fuzzy logic predicts surface roughness (88%), vibration (86%), and acoustic emission (87%) values with high accuracy. The outcome of this study is expected to make a contribution to the literature showing the impact of turning conditions on the machining characteristics of industrially important materials.

1. Introduction

Industrially important materials have a critical place in the market since companies make an investment in innovative ideas and methods for such material products. AISI 4140 alloyed steels are broadly preferred in various industrial areas due to their high hardness, weldability, and toughness properties. Seemingly, a hardened version of AISI 4140 is a good alternative for prominent sectors to fabricate significant parts such as shaft, gear, and bearing parts for the automotive sector [1]. However, extreme hardness makes these materials difficult to cut, since the severe plastic deformation causes excessive cutting forces and leads to chatter vibrations [2]. As a result of this, the initial condition of the cutting tool geometry can be lost quickly due to various wear mechanisms and resultant wear patterns [3]. During this period, the main elements in the cutting tool material disappear by rupturing from the body or diffusing into the chip [4]. Consequently, the cutting ability of the tool edge diminishes or fails. In the other scenario, work material welds or joins on to the cutting tool face, leading to a new cutting edge called a build-up edge. All these developments decrease the remaining useful lifetime of cutting tools. Such abnormalities reduce machining quality and pave the way for poor surface integrity, i.e., surface roughness [5]. Hence, the machining of such materials requires further precautions. Otherwise, time, expense, and labor consumed during machining operations turn into waste, which is not desired in today’s competitive machining industry.
In a basic cutting operation, machine tools, workpiece material, and cutting tools have several parameters affecting the sustainability index and quality of the process. In this respect, keeping some of these factors and related parameters is logical, and it provides practical solutions to attain better cutting performance. Considering the complex nature of machining environments, entrepreneurs have tried several approaches for improving machinability. In the past, researchers focused on three fundamental approaches for better machining. Some of them can be sorted as: (i) selecting the optimal machining parameters [6], (ii) using advanced cooling and lubricating environments [7], (iii) utilizing different types of coating technologies to elongate tool life [8], (iv) using textured cutting tools for machining enhancement [9], and (v) modeling the cutting environment to replicate the experiments productively [10]. This study focuses on two of these approaches in a turning operation. Modeling and optimization of cutting parameters play a key role in determining the best production conditions for any material [11]. In the modeling process, a software-based application is used in order to observe the relationship between input and output parameters. This is highly useful and brings important advantages, namely low cost and time inputs for the managers, operators, and researchers. The optimization stage allows for the selection of the best parameter combinations to obtain responses in a desired range. Therefore, consolidation of two basic methods is an effective approach in many respects. This study considers a commercially available material, i.e., AISI 4140, for integration of these two approaches during a turning operation.
When looking at the machinability investigations of AISI 4140, a series of published papers are encountered in the open literature. Arrazola et al. [12] assessed the impact of machining operation on the thermal variations during the cutting of AISI 4140 steel. They correlated the improved machining with reduced temperature regions, which can be quite useful to overcome uncertainties. Later, the same team [13] reported the effect of the tool and coating along with the operation on thermal zones for the same material. They evaluated the cutting forces and temperatures as outputs, considering the influence of cutting parameters. Khrais et al. [14] evaluated the cutting performance of coated tools regarding the progressive wear mechanisms under determined operational ranges. They showed that abrasive wear, chipping, attrition, and fatigue play a huge role in coated tools during the cutting of AISI 4140. Aslan et al. [15] investigated the influence of basic cutting parameters on surface roughness and wear using an orthogonal design and statistical approach. They determined the best solutions for achieving maximized tool life and surface quality. Elbah et al. [16] evaluated the surface roughness parameters during the machining of hardened AISI 4140 alloy steel. They concluded that the feed rate and cutting depth have a dramatic impact on surface quality. Das et al. [17] focused on the influence level of main turning parameters on surface roughness, chip morphology, and flank wear while cutting AISI 4140. Abrasive wear was found as the governing mechanism and feed rate was detected as the most influential factor on the surface roughness. Dhar et al. [18] evaluated the effectiveness of cryogenic cooling for improving performance measures of AISI 4140. The superiority of the cryogenic facility was observed on the finished surface, tool wear and temperature. Hadad et al. [19] compared dry and wet turning with minimum quantity lubrication assistant operation while machining AISI 4140 steel. For temperature reduction, the minimum quantity lubrication strategy was found to be the most effective method, followed by the conventional cooling and dry methods. Sayuti et al. [1] utilized nanofluid in hard turning of AISI 4140 steel for minimization of tool wear and surface roughness. The authors reduced the total cost and improved surface quality via fuzzy logic and Taguchi-based optimization methods. Saikaew et al. [20] compared different coating materials and their machinability performance under dry-cutting conditions. They determined the best intervals of cutting speed to reach acceptable turning performance in turning of AISI 4140. Seemingly, ploughing, chipping and abrasive wear were observed as wear developments in such an environment. Gürbüz et al. [21] applied a minimum quantity lubrication technique by changing the flow rate on AISI 4140 machining operation. The results of the paper showed that increasing the flow rate ratio has a good impact on cutting forces but no important effect on surface quality. Aouici et al. [22] compared different inserts during the hard turning of AISI 4140 material using main turning parameters. They analyzed the superiority and inferiority of two different cutting inserts for better cutting forces and flank wear.
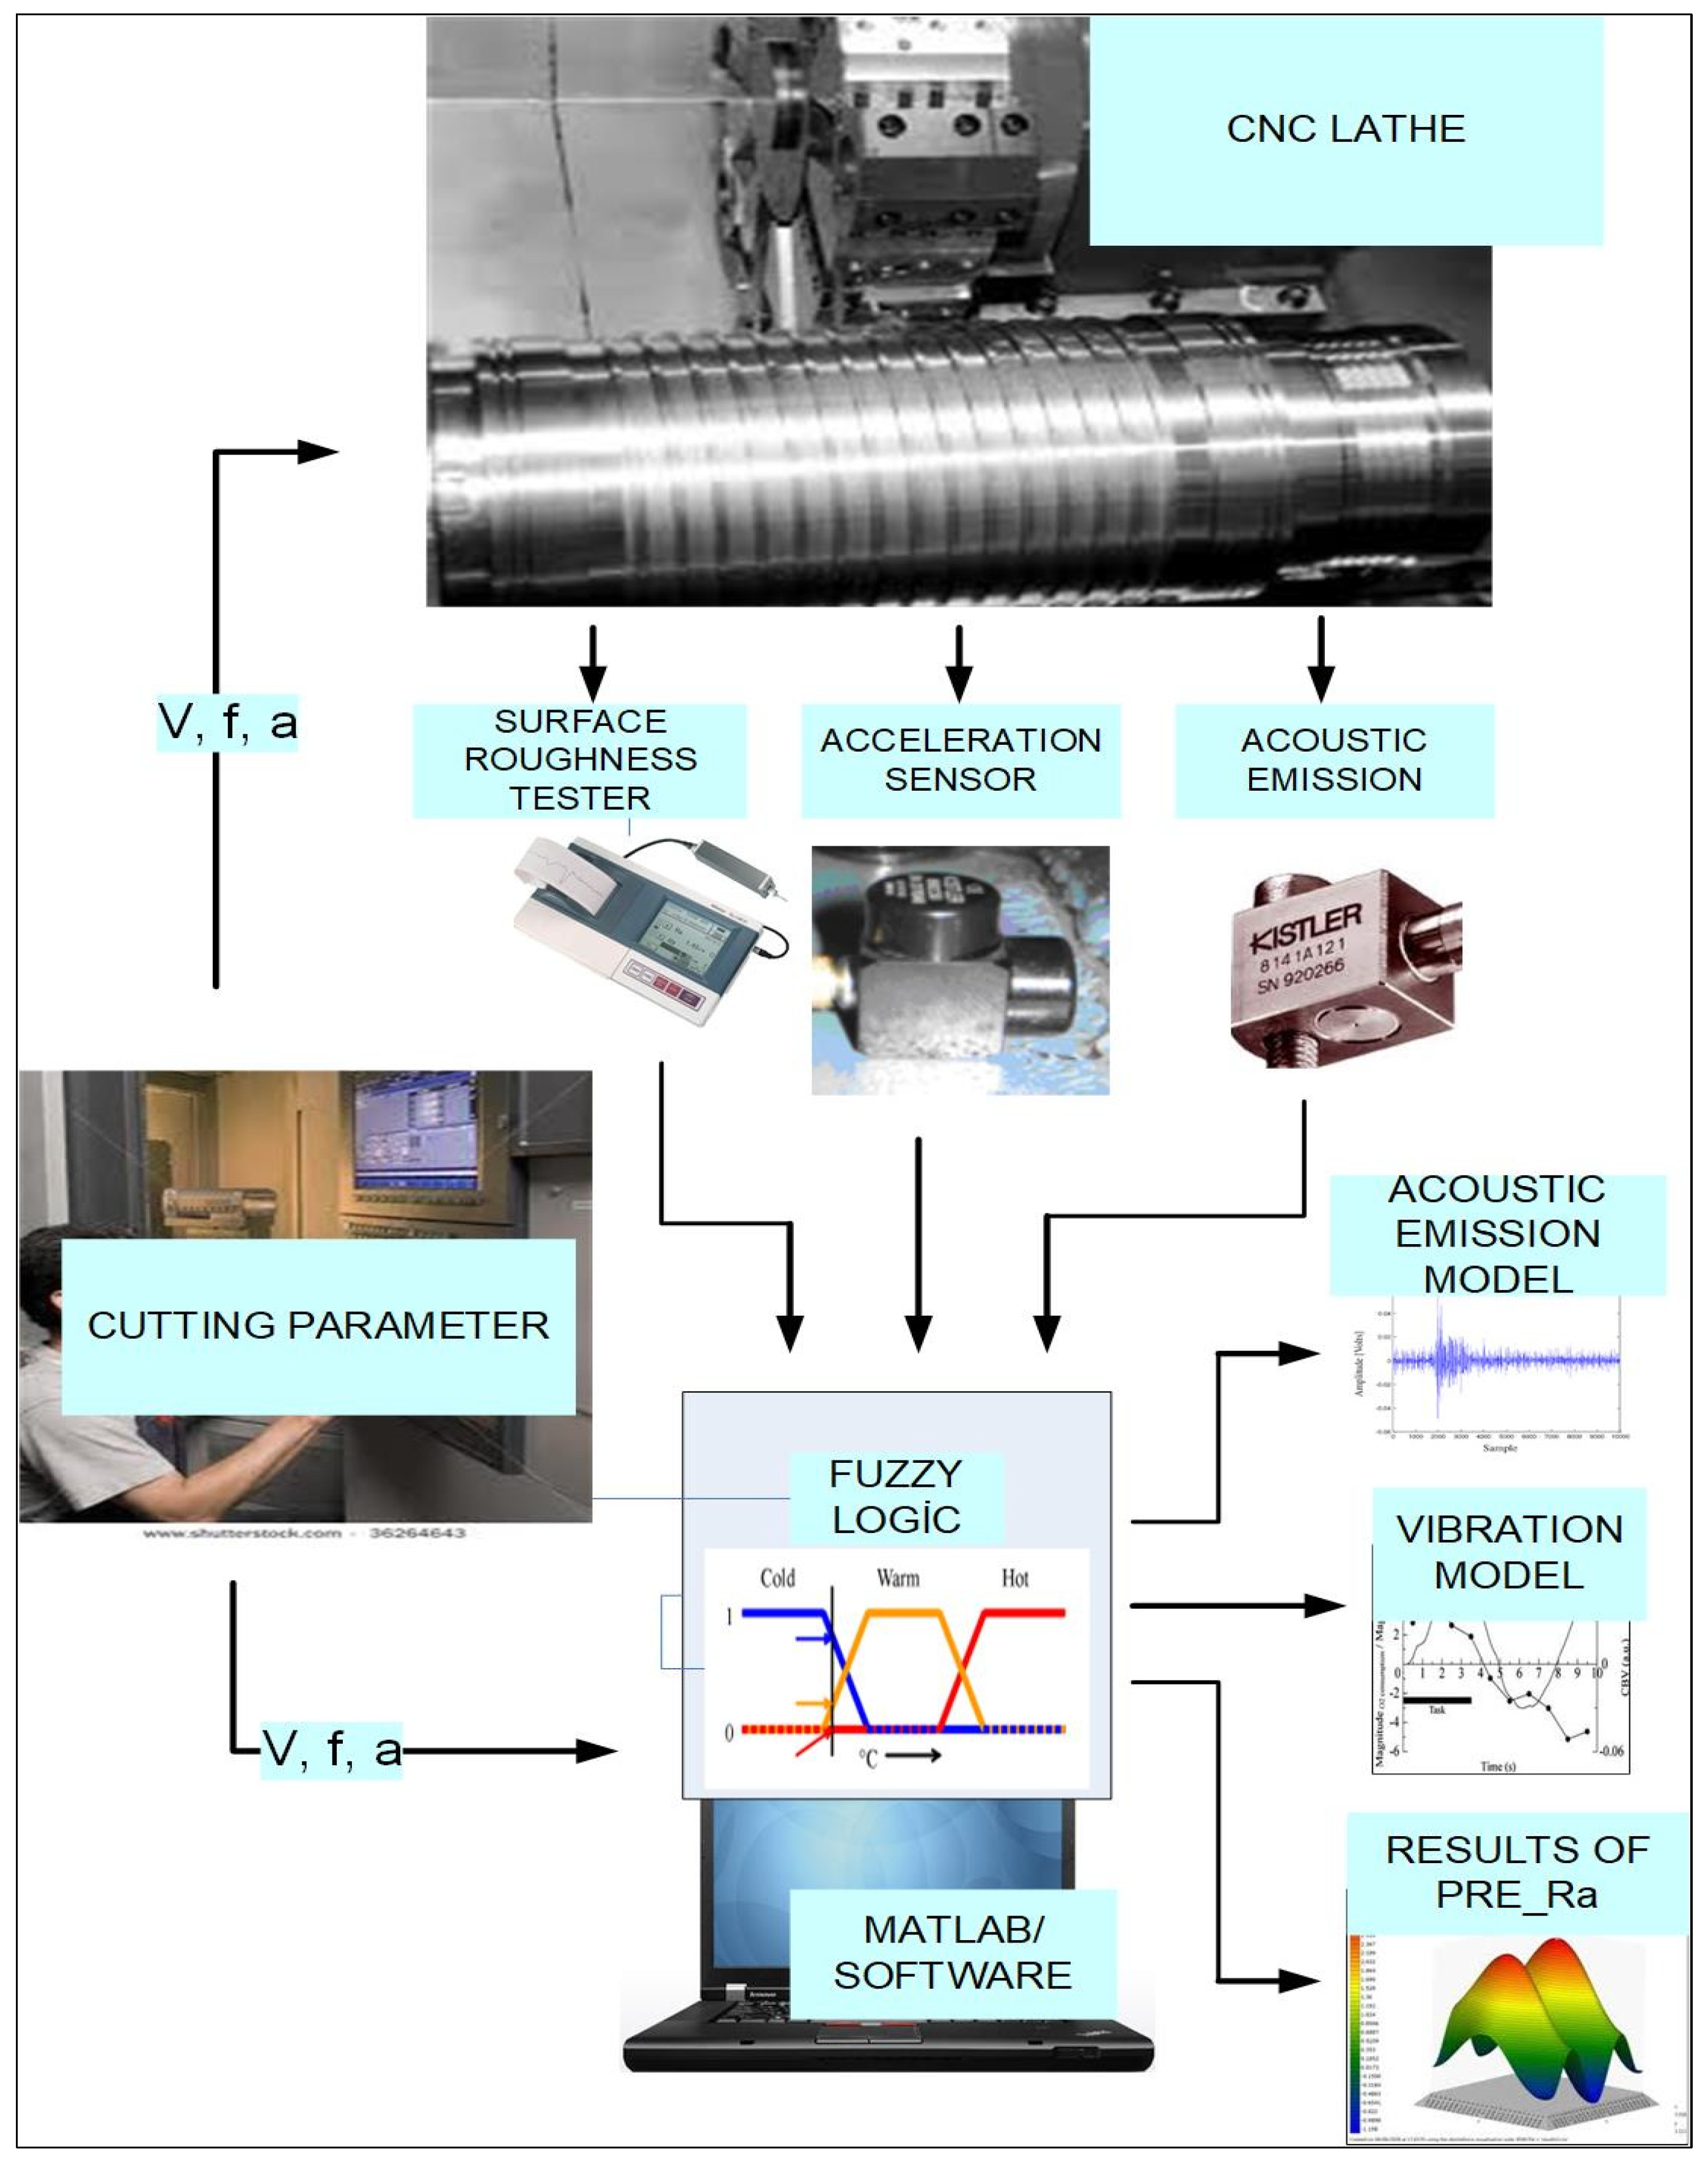
The comprehensive literature analysis showed that the cutting of AISI 4140 steel is a challenging process, especially when heat treatment was applied. In such instances, the cutting process becomes highly severe while creating destructive wear mechanisms, reducing the surface quality. Although parametric research studies have been completed previously, they are limited for such a popular work material. Moreover, despite the additional economic burden of cooling and lubricating methods, they cannot improve surface quality. At this point, it should be noted that dry machining is a simple way to reach zero waste machining with minimum costs. Despite a good number of papers about the machinability of AISI 4140 having been published, a proportion of them was carried out on a lathe, and none of them was interested in parameter optimization and prediction under dry cutting conditions. In addition, it is necessary to verify the validity of previous findings to create an up-to-date database for machining operations, owing to the broad utilization of these materials in privileged areas. In light of the above information, this work aims to fill a gap in the literature by investigating the effects of turning parameters, namely, speed, feed, and cutting depth, on surface roughness and vibrations while machining AISI 4140 steels. In this context, 3D graphs were utilized for in-depth analysis of main and intermediate levels of the cutting parameters. Additionally, estimation of the response parameters was carried out using a machine learning technique, i.e., fuzzy logic. Hopefully, this work will be useful for practitioners in the industry and young researchers in academia regarding the integration of various techniques into the machining of industrial products with sustainable machining methods.

2. Materials and Methods

2.1. Preparation of Test Samples

For the test sample, AISI 4140 (SAE 4140, DIN 42CrMo4) correction steel was used with Ø110 × 600 mm2 dimensions. AISI 4140 steel was used for the stage of high-strength machine parts, stepped wheels, connection parts, commands, pins, and axles. The chemical constituents of the used test sample are given in Table 1. Before the parts were heat-treated, face and surface turning were performed, and two center holes were drilled. Thermally, the material can be diluted at 920 °C and tempered at 350 °C for 2.5 h. The hardness of these materials was reduced to 62 HRC. The crust formed on the surface due to heat treatment was removed by turning. The experimental setup is shown in Figure 1. In Figure 1, a summary of the machine tools used, sensors, machinability input parameters, the methods used, and the machinability output parameters obtained in the experimental studies are given.

2.2. Cutting Tool and Tool Holder

As a cutting tool, ISCAR brand WNMA 080,408 IC5005 CVD-coated cutting inserts with a tip radius of 0.8 mm were used. The tool surface was coated with Al2O3 and TiC. The insert used in the experiments is shown in Figure 2. ISCAR MWLNR 2525M-0.8W was used as a tool holder and the dimensions of the tool holder are given in Figure 3.

2.3. Data Acquisition Equipment

A Kistler brand 5134-type accelerometer was used for vibration measurement. Figure 4 shows the vibration measurement sensor and the placement of the vibration measurement sensor in the system. A Mitutoyo brand SJ 201 surface roughness measuring device was used to measure the surface roughness values of the processed samples. The device is shown in Figure 5.

2.4. Data Acquisition Equipment

The experiments were carried out on the NL 2500 CNC lathe belonging to Mori Seiki at the Manufacturing Systems Automation and Computer-Aided Design Production Research and Application Center (ISOMER) at Selcuk University. No coolant or gas was used in the experiments, and sawdust was removed under dry-cutting conditions. The shape of the lathe is given in Figure 6, and the specifications of the lathe are given in Table 2. Three different cutting speeds (V), three different feed rates (f), and three different cutting depths (a) were determined as cutting parameters according to the manufacturer’s catalog. In the experimental design, 27 different combinations of experiments were designed using the full factorial method. Table 3 shows the parameters used in the experiment and their levels.

2.5. Fuzzy Logic Model for Parameter Estimation

The rule-based fuzzy logic model was created with three inputs (cutting speed, feed, and depth of cut) and three outputs (surface roughness, vibration, acoustic emission) via the Fuzzy Logic Toolbox of the Matlab (Matrix Laboratory) package program. The Mamdani approach was chosen as a fuzzy logic inference mechanism. Centroid (center of gravity) was chosen as the defuzzification method. Figure 7 shows the generated fuzzy logic model.

3. Results and Discussion

In the context of this paper, the response parameters such as vibration, surface roughness, and acoustic emission were evaluated using 3D graphs. This type of research will shed light on the effect of the input parameters on outputs. At the same time, the estimation of the response parameters provides an opportunity for quick optimization between ranges of operational parameters.

3.1. Graphical Evaluation of the Vibration

Mechanical vibrations cause damage to the parts of any system since they deteriorate the natural flow of running and lead to excessive and sudden loads [23]. In a machining environment, vibrations play an important role in ensuring the stable cutting mechanism protects the cutting tool from fast-wearing and spoiled workpiece surfaces, as the interaction between the cutting tool and workpiece produces some vibrations as a result of high cutting speeds, the resistance of materials to plastic deformation, hard-to-predict wear mechanisms, inhomogeneity of work materials, etc. Therefore, the influence of the basic cutting parameters on machining characteristics can show alterations according to time and place. In the meantime, increasing vibrations induce elevated cutting forces, triggering several wear mechanisms [24]. When looking at hardened steels or alloyed materials, it can be said that the vibrations demonstrate an increasing trend compared to conventional metals. Thus, the determination of the conditions that convey a high amount of vibration should be eliminated to avoid poor machinability. This can be achieved by organizing the entirety of the machining environment so as to include the fundamental cutting parameters, namely cutting speed, feed rate, and depth of cut. Therefore, this paper examines the influence of combined parameters on vibrations using 3D surfaces in graphs, as shown in Figure 8. Such an approach seeks to achieve the intermediate values of parameter ranges, approximately representing an optimization method. Since the machined material is hardened steel, the cutting mechanism is open for forced vibrations as a result of rapidly accelerating tool wear. Seemingly, the maximum feed rate and depth of cut produce the highest vibration, according to Figure 8C. Material volume removed from the surface reaches peak value under these circumstances, placing extreme force on the cutting tool and triggering the vibration mechanism. In addition, it can be clearly seen that the medium cutting speed values are responsible for the high levels of vibration, according to Figure 8A,C. A dramatic reduction is also seen from this value to extreme values, especially at low feed rates (Figure 8A). It is difficult to explain the outcome since the behavior of vibration depends on many factors including tool wear, chip formation, etc. On the other hand, it exhibits the general trend of vibration curves, which is useful in designing machining parameter ranges. Figure 8B,C demonstrates much more regular dwindling/growing behavior compared to the feed/speed combination effect. This is attributed to the reason that high-level cutting depth has an ever-increasing impact on vibrations, irrespective of cutting speed and feed rate (Figure 8B,C). From the above-mentioned results, it can be inferred that the feed rate and cutting speed combination have to be arranged to avoid excessive vibrations in the cutting of hardened steels, while the depth of cut has a much more consistent effect.

3.2. Graphical Evaluation of the Surface Roughness

Surface roughness is one of the most determinative indicators in terms of the machined workpiece for improved machining quality. Surface roughness is also known as roughness is a member of surface integrity [25]. Since the roughness profile reflects the irregularities on the surface with the calculation approach based on the depth of peaks and hollows, it is possible through this method to evaluate the machining conditions [26]. It is highly difficult to produce the desired roughness value range, especially for hard materials. Therefore, modeling the cutting conditions provide a chance for an in-depth analysis of machining outcomes. Therefore, it is a reliable and sustainable method for surface characterization around the world. Notwithstanding that there are several roughness parameters in detecting surface quality, the most prominent one is the arithmetic average of surface heights (Ra), which is widely used in academia and industry [27]. Figure 9 summarizes the effect of cutting parameters on surface roughness in 3D graphs. It should be noted there is a range that varies between 1 µm–4.5 µm under the applied cutting combinations. Accordingly, feed rate plays the most influential role on average surface roughness, as expected when looking at Figure 9A,C. This was previously determined by the authors several times, using experimental and theoretical methods [28,29,30]. Indeed, it is understandable by the fact that the horizontal motion of the cutting tool on the workpiece determines the waviness according to the feed speed. However, it is also important to note that different levels of cutting speed and cutting depth have an effect on the roughness. This is a natural result of the relative motion between the cutting tool and the workpiece material. Therefore, it can be said that the feed rate acts as a determinant actor on this response with the help of cutting speed and the depth of cut. As a result, the true selection of the cutting parameters verifies the numerical equations by showing the actual impacts. According to Figure 9A,B, increasing cutting speed reduces the surface roughness slightly at all levels of cutting depth and low values of feed rate. It is known that the high levels of cutting speed make metal cutting easier, by reducing the cutting forces. On the other hand, high levels of feed rate do not permit the roughness reduction through the effect of high cutting speeds. It is thought that the extreme values of feed rate and cutting speed increase the material removal rate. In addition, the feed rate dominates the roughness variation, prohibiting the speed effect. When compared with cutting speed and feed rate, the depth of cut has no important influence on surface roughness, as seen in Figure 9B,C. At this point, it is recommended for future works that different levels of cutting depth need to be considered for manipulating the surface roughness in turning such hardened steels.

3.3. Graphical Evaluation of the Acoustic Emission

Acoustic emission is a term which defines stress wave propagation from the materials that are exposed to external forces causing plastic deformations. In this context, it is highly critical to determine the acoustic waves in each cutting operation to correlate with the effect of machining parameters and outcomes. Because identification of the chip morphology and cutting tool wear index have the utmost significance in determining the relationship between deformation rates, such variations determine the surface integrity of the workpiece. This study focuses on the effect of parameter combinations on acoustic emissions while turning hard steel. At this point, it is important to mention that the high hardness of the material forces the cutting tool, triggering the plastic deformations. Figure 10 shows these effects with dual combinations of cutting speed, feed rate, and cutting depth, respectively, in 3D graphs. There are complex results in terms of the effect of the basic cutting parameters, as can be seen from these graphs. It can be said that the maximum values of cutting parameters produce the highest acoustic emissions, and vice versa (Figure 10A–C). This is logical since the increase in these parameters’ material removal rate reaches its peak value and plastic deformation elevates. On the other hand, variations of the cutting parameters have a changeable role according to their levels and versus parameters. Therefore, in here, singular parameter influences are not considered. Seemingly, increasing cutting speed reduces acoustic emissions under low feed rate values (Figure 10A). Depth of cut shows an increasing trend up to a certain value and then lowers until its high level, as seen in Figure 9B. A wide part of the combination of feed rate and cutting depth does not influence acoustic emissions (Figure 10C). Cutting depth in this graph has a similar effect on the acoustic signals at low feed rate values. From this comprehensive analysis, it is critical to note that the determination of the acoustic emissions is highly challenging, as a result of depending on the combined effects of cutting parameters and the complexity of machining operations.

3.4. Estimation of the Response Parameters via a Fuzzy Logic Method

Three membership degrees and triangular membership functions (trimf) are defined for cutting speed, feed rate, and depth of cut. Table 4 shows the ranges of membership degrees established for cutting parameters.
Eleven membership degrees and triangular membership functions (trimf) are defined for surface roughness, vibration, and acoustic emission values. Membership degrees have been determined for ease of translation into the same linguistic expressions and for uniformity in practice. Table 5 shows the ranges of membership degrees established for surface roughness, vibration, and acoustic emission.
After the membership functions are determined, the rule base must be carefully determined in order to obtain successful results from the fuzzy logic model. Table 6 shows the rules. The rules were created according to the experimental results. In the table, the cutting speed is expressed as “V”, the feed rate “f”, and the depth of cut “a”.
Table 7 shows the test results obtained for surface roughness, vibration, and acoustic emission, and the fuzzy logic model estimation results.
Percentage errors are easily calculated to see the accuracy of the fuzzy logic prediction model. Percentage error was calculated using Equations (1) and (2).
Difference = Experimental result-Fuzzy logic result,
Percent Error = (100 × Difference)/Experimental result,
Table 8 shows the percent error values. When the table is examined, it is seen that the fuzzy logic predicts the surface roughness, vibration, and acoustic emission values with high accuracy (surface roughness is about 88%; vibration is about 86%; acoustic emission is about 87%).

3.5. Statistical Analysis of the Machinability Criteria

Statistical analysis of the machining characteristics is also important for evaluating the impact of the design parameters, which gives more accurate results utilizing numerical pieces of evidence [31]. To this end, statistical analysis-based evaluations of the cutting parameters were carried out for surface roughness, vibration, and acoustic emission in this study. The findings obtained from the analysis are given in Table 9 according to the analysis of variance method. For each criterion, singular and synergistic effects of the cutting speed, feed rate, and depth of cut were evaluated. One of the advantageous aspects of the statistical approach is that it is capable of giving results with different outcomes. As seen, the F value, p value, and percent contributions were listed in the table where all these values support each other in proving the effects of all parameters. Seemingly, the feed rate was detected as the most significant parameter regarding surface roughness, with an influence rate of 87.7%. However, depth of cut was found to be the dominant parameter for vibration signals, at about 28.6%. Lastly, cutting speed was seen as the most important parameter for acoustic emissions, with a contribution rate of 34.16%. In addition to the singular effects, the synergistic effect of the feed rate and depth of cut was found to be very important, according to the percent contribution rate of about 23.79%.

4. Conclusions

In this study, AISI 4140 steel was turned on a CNC machine. Surface roughness, vibration, and acoustic emission values were measured after turning experiments.
A rule-based fuzzy logic model was created with the Matlab program. Experimental results and fuzzy model results were compared.
It is concluded that rule-based fuzzy logic modeling is a decision alternative for surface roughness, vibration, and acoustic emission in the turning process.
The margin of error should always be taken into account in forecasting models, and the aim is to keep these errors at minimal levels and shed light on future studies. When the experimental results and the prediction results made by fuzzy modeling are compared, it is seen that the rule-based fuzzy logic model is successful.
In future studies, the error rates can be further reduced with more linguistic expressions of membership degrees. The effects of different membership functions on the error can also be investigated.

Author Contributions

Conceptualization, M.K. and İ.A.; methodology, M.K. and İ.A.; validation, M.K., İ.A., R.B., H.A. and E.S.; formal analysis, M.K., İ.A., R.B., H.A. and E.S.; investigation, M.K., İ.A., R.B., H.A. and E.S.; resources, İ.A.; data curation, İ.A.; writing—review and editing, M.K., İ.A., R.B., H.A. and E.S.; visualization, M.K., İ.A., R.B., H.A. and E.S.; supervision, M.K. and İ.A.; project administration, İ.A.; funding acquisition, İ.A. All authors have read and agreed to the published version of the manuscript.

Funding

This research received no external funding.

Institutional Review Board Statement

Not applicable.

Informed Consent Statement

Not applicable.

Data Availability Statement

Not applicable.

Conflicts of Interest

The authors declare no conflict of interest.

References

  1. Sayuti, M.; Sarhan, A.A.; Salem, F. Novel uses of SiO2 nano-lubrication system in hard turning process of hardened steel AISI4140 for less tool wear, surface roughness and oil consumption. J. Clean. Prod. 2014, 67, 265–276. [Google Scholar] [CrossRef]
  2. Wang, Z.; Rajurkar, K. Cryogenic machining of hard-to-cut materials. Wear 2000, 239, 168–175. [Google Scholar] [CrossRef]
  3. Pimenov, D.Y.; Mia, M.; Gupta, M.K.; Machado, Á.R.; Pintaude, G.; Unune, D.R.; Khanna, N.; Khan, A.M.; Tomaz, Í.; Wojciechowski, S. Resource saving by optimization and machining environments for sustainable manufacturing: A review and future prospects. Renew. Sustain. Energy Rev. 2022, 166, 112660. [Google Scholar] [CrossRef]
  4. Kuntoğlu, M.; Sağlam, H. ANOVA and fuzzy rule based evaluation and estimation of flank wear, temperature and acoustic emission in turning. CIRP J. Manuf. Sci. Technol. 2021, 35, 589–603. [Google Scholar] [CrossRef]
  5. Sarıkaya, M.; Güllü, A. Multi-response optimization of minimum quantity lubrication parameters using Taguchi-based grey relational analysis in turning of difficult-to-cut alloy Haynes 25. J. Clean. Prod. 2015, 91, 347–357. [Google Scholar] [CrossRef]
  6. Hazir, E.; Ozcan, T. Response surface methodology integrated with desirability function and genetic algorithm approach for the optimization of CNC machining parameters. Arab. J. Sci. Eng. 2019, 44, 2795–2809. [Google Scholar] [CrossRef]
  7. Şap, S.; Usca, Ü.A.; Uzun, M.; Kuntoğlu, M.; Salur, E.; Pimenov, D.Y. Investigation of the effects of cooling and lubricating strategies on tribological characteristics in machining of hybrid composites. Lubricants 2022, 10, 63. [Google Scholar] [CrossRef]
  8. Değirmenci, Ü.; Usca, Ü.A.; Şap, S. Machining characterization and optimization under different cooling/lubrication conditions of Al-4Gr hybrid composites fabricated by vacuum sintering. Vacuum 2023, 208, 111741. [Google Scholar] [CrossRef]
  9. Alagan, N.T.; Zeman, P.; Hoier, P.; Beno, T.; Klement, U. Investigation of micro-textured cutting tools used for face turning of alloy 718 with high-pressure cooling. J. Manuf. Process. 2019, 37, 606–616. [Google Scholar] [CrossRef]
  10. Sivaiah, P.; Chakradhar, D. Modeling and optimization of sustainable manufacturing process in machining of 17-4 PH stainless steel. Measurement 2019, 134, 142–152. [Google Scholar] [CrossRef]
  11. Asiltürk, I.; Neşeli, S. Multi response optimisation of CNC turning parameters via Taguchi method-based response surface analysis. Measurement 2012, 45, 785–794. [Google Scholar] [CrossRef]
  12. Arrazola, P.; Arriola, I.; Davies, M.; Cooke, A.; Dutterer, B. The effect of machinability on thermal fields in orthogonal cutting of AISI 4140 steel. CIRP Ann. 2008, 57, 65–68. [Google Scholar] [CrossRef]
  13. Arrazola, P.; Arriola, I.; Davies, M. Analysis of the influence of tool type, coatings, and machinability on the thermal fields in orthogonal machining of AISI 4140 steels. CIRP Ann. 2009, 58, 85–88. [Google Scholar] [CrossRef]
  14. Khrais, S.K.; Lin, Y. Wear mechanisms and tool performance of TiAlN PVD coated inserts during machining of AISI 4140 steel. Wear 2007, 262, 64–69. [Google Scholar] [CrossRef]
  15. Aslan, E.; Camuşcu, N.; Birgören, B. Design optimization of cutting parameters when turning hardened AISI 4140 steel (63 HRC) with Al2O3+ TiCN mixed ceramic tool. Mater. Des. 2007, 28, 1618–1622. [Google Scholar] [CrossRef]
  16. Elbah, M.; Yallese, M.A.; Aouici, H.; Mabrouki, T.; Rigal, J.-F. Comparative assessment of wiper and conventional ceramic tools on surface roughness in hard turning AISI 4140 steel. Measurement 2013, 46, 3041–3056. [Google Scholar] [CrossRef]
  17. Das, S.R.; Dhupal, D.; Kumar, A. Experimental investigation into machinability of hardened AISI 4140 steel using TiN coated ceramic tool. Measurement 2015, 62, 108–126. [Google Scholar] [CrossRef]
  18. Dhar, N.; Paul, S.; Chattopadhyay, A. Machining of AISI 4140 steel under cryogenic cooling—Tool wear, surface roughness and dimensional deviation. J. Mater. Process. Technol. 2002, 123, 483–489. [Google Scholar] [CrossRef]
  19. Hadad, M.; Sadeghi, B. Minimum quantity lubrication-MQL turning of AISI 4140 steel alloy. J. Clean. Prod. 2013, 54, 332–343. [Google Scholar] [CrossRef]
  20. Saikaew, C.; Paengchit, P.; Wisitsoraat, A. Machining performances of TiN plus AlCrN coated WC and Al2O3+ TiC inserts for turning of AISI 4140 steel under dry condition. J. Manuf. Process. 2020, 50, 412–420. [Google Scholar] [CrossRef]
  21. Gürbüz, H.; Gönülaçar, Y.E.; Baday, Ş. Effect of MQL flow rate on machinability of AISI 4140 steel. Mach. Sci. Technol. 2020, 24, 663–687. [Google Scholar] [CrossRef]
  22. Aouici, H.; Elbah, M.; Yallese, M.; Fnides, B.; Meddour, I.; Benlahmidi, S. Performance comparison of wiper and conventional ceramic inserts in hard turning of AISI 4140 steel: Analysis of machining forces and flank wear. Int. J. Adv. Manuf. Technol. 2016, 87, 2221–2244. [Google Scholar] [CrossRef]
  23. Korkmaz, M.E.; Gupta, M.K.; Li, Z.; Krolczyk, G.M.; Kuntoğlu, M.; Binali, R.; Yaşar, N.; Pimenov, D.Y. Indirect monitoring of machining characteristics via advanced sensor systems: A critical review. Int. J. Adv. Manuf. Technol. 2022, 120, 7043–7078. [Google Scholar] [CrossRef]
  24. Salur, E. Understandings the tribological mechanism of Inconel 718 alloy machined under different cooling/lubrication conditions. Tribol. Int. 2022, 174, 107677. [Google Scholar] [CrossRef]
  25. Benardos, P.; Vosniakos, G.-C. Predicting surface roughness in machining: A review. Int. J. Mach. Tools Manuf. 2003, 43, 833–844. [Google Scholar] [CrossRef]
  26. Zhang, S.; To, S.; Wang, S.; Zhu, Z. A review of surface roughness generation in ultra-precision machining. Int. J. Mach. Tools Manuf. 2015, 91, 76–95. [Google Scholar] [CrossRef]
  27. Kant, G.; Sangwan, K.S. Prediction and optimization of machining parameters for minimizing power consumption and surface roughness in machining. J. Clean. Prod. 2014, 83, 151–164. [Google Scholar] [CrossRef]
  28. He, C.; Zong, W.; Zhang, J. Influencing factors and theoretical modeling methods of surface roughness in turning process: State-of-the-art. Int. J. Mach. Tools Manuf. 2018, 129, 15–26. [Google Scholar] [CrossRef]
  29. Şahinoğlu, A.; Rafighi, M. Investigation of vibration, sound intensity, machine current and surface roughness values of AISI 4140 during machining on the lathe. Arab. J. Sci. Eng. 2020, 45, 765–778. [Google Scholar] [CrossRef]
  30. Sarıkaya, M.; Güllü, A. Taguchi design and response surface methodology based analysis of machining parameters in CNC turning under MQL. J. Clean. Prod. 2014, 65, 604–616. [Google Scholar] [CrossRef]
  31. Usca, Ü.A.; Şap, S.; Uzun, M.; Kuntoğlu, M.; Salur, E.; Karabiber, A.; Pimenov, D.Y.; Giasin, K.; Wojciechowski, S. Estimation, optimization and analysis based investigation of the energy consumption in machinability of ceramic-based metal matrix composite materials. J. Mater. Res. Technol. 2022, 17, 2987–2998. [Google Scholar] [CrossRef]
Figure 1. Experimental scheme.
Metals 13 00437 g001
Figure 2. WNMA 080408 IC5005 CVD-coated cutting inserts.
Metals 13 00437 g002
Figure 3. Cross-sections and dimensions of the tool holder (mm).
Metals 13 00437 g003
Figure 4. Placement of the sensor for vibration measurement in the experimental setup.
Metals 13 00437 g004
Figure 5. Mitutoyo brand SJ 201 surface roughness measuring device.
Metals 13 00437 g005
Figure 6. CNC lathe used in experiments.
Metals 13 00437 g006
Figure 7. Created fuzzy logic model.
Metals 13 00437 g007
Figure 8. The effect of cutting parameters on vibration in 3D graphs. (A) Feed rate-Cutting speed, (B) Depth of cut-Cutting speed, (C) Depth of cut-Feed rate.
Metals 13 00437 g008
Figure 9. The effect of cutting parameters on surface roughness in 3D graphs. (A) Feed rate-Cutting speed, (B) Depth of cut-Cutting speed, (C) Depth of cut-Feed rate.
Metals 13 00437 g009
Figure 10. The effect of cutting parameters on acoustic emission in 3D graphs. (A) Feed rate-Cutting speed, (B) Depth of cut-Cutting speed, (C) Depth of cut-Feed rate.
Metals 13 00437 g010
Table 1. Chemical composition of AISI 4140 steel.
C (wt%)Si (wt%)Mn (wt%)P (wt%)S (wt%)Cr (wt%)Mo (wt%)Ni (wt%)Al (wt%)Cu (wt%)Sn (wt%)
0.400.280.880.0160.0020.910.170.190.0170.130.008
Table 2. Features of the Mori Seiki NL 2500 lathe.
Max. turning diameter366 mm
Max. turning length705 mm
X-axis machining260 mm
Z-axis machining795 mm
Max. pressure3 MPa
Bench power10 kW
Round per minute4000 rpm
Number of turret sets12
Sensitivity0.001 mm
Table 3. Three-level values of cutting parameters.
Cutting ParametersLevels
I.II.III.
Cutting speed (m/min)90120150
Feed (mm/rev)0.180.270.36
Cutting depth (mm)0.20.40.6
Table 4. Membership degrees determined for input values.
Cutting Speed (V)Feed Rate (f)Depth of Cut (a)Membership Degree
90–1200.18–0.270.2–0.4Low (L)
90–1500.18–0.360.2–0.6Middle (M)
120–1500.27–0.360.4–0.6High (H)
Table 5. Membership degrees determined for surface roughness, vibration, and acoustic emission.
RaVibrationAcoustic EmissionMembership Degree
0.85–1.185.20–7.550.59–0.84Very Very Very Very Low (VVVVL)
0.85–1.515.20–9.890.59–1.08Very Very Very Low (VVVL)
1.18–1.847.55–12.240.84–1.33Very Very Low (VVL)
1.51–2.179.89–14.581.08–1.57Very Low (VL)
1.84–2.5112.24–16.931.33–1.82Low (L)
2.17–2.8414.58–19.271.57–2.07Middle (M)
2.51–3.1716.93–21.621.82–2.31High (H)
2.84–3.5019.27–23.962.07–2.56Very High (VH)
3.17–3.8321.62–26.352.31–2.80Very Very High (VVH)
3.50–4.1623.96–28.652.56–3.05Very Very Very High (VVVH)
3.83–4.1626.31–28.652.80–3.05Very Very Very Very High (VVVVH)
Table 6. Created fuzzy logic rules.
v f a Ra Vibration Acoustic Emission
1LandLandLThenVLandVVVLandVVVVL
2LandLandMThenVVVVLandVVVLandVVVVH
3LandLandHThenVVVLandVVLandVVVL
4LandMandLThenVLandVVVLandVVL
5LandMandMThenVLandVLandVVVVL
6LandMandHThenMandMandVVVL
7LandHandLThenVHandVVVVLandVL
8LandHandMThenVHandVVLandVVVVL
9LandHandHThenVHandVHandVVVL
10MandLandLThenVVVLandVVLandVVVL
11MandLandMThenVVLandVVLandVL
12MandLandHThenVVVLandVVVVHandM
13MandMandLThenLandVVLandVVL
14MandMandMThenLandVLandVVVL
15MandMandHThenLandMandVVL
16MandHandLThenVVHandVVLandVL
17MandHandMThenVVVHandVHandVVVL
18MandHandHThenHandHandVL
19HandLandLThenVVVVLandVVVLandVL
20HandLandMThenVVVLandVLandVL
21HandLandHThenVVVLandVVVLandL
22HandMandLThenLandVVVLandM
23HandMandMThenMandVHandH
24HandMandHThenMandVHandM
25HandHandLThenVVVVHandHandM
26HandHandMThenVVVHandVVLandM
27HandHandHThenVVVHandVVVHandL
Table 7. Experimental results and fuzzy logic prediction results.
Experimental ResultsFuzzy Logic Prediction Results
Case NumberRaVibrationAcoustic EmissionRaVibrationAcoustic Emission
11.768.250.591.847.550.67
20.857.413.050.957.552.97
31.219.230.861.189.890.84
41.717.701.091.847.551.08
51.7311.340.621.8412.200.67
62.4718.280.762.5116.900.84
73.285.201.333.175.911.33
83.159.600.623.179.890.67
93.1722.330.743.1721.600.84
101.0910.710.741.189.890.84
111.558.751.321.519.891.33
121.3028.651.751.1827.901.82
132.249.651.032.179.891.08
142.0811.340.832.1712.200.84
152.1117.700.992.1716.901.08
163.5210.071.283.509.891.33
173.7421.920.873.8321.600.84
182.8420.341.282.8419.301.33
190.946.601.450.957.551.33
201.2611.381.321.1812.201.33
211.248.351.501.187.551.57
222.177.611.862.177.551.82
232.5921.211.962.5121.602.07
242.3722.291.792.5121.601.82
254.1618.761.714.0619.031.82
263.8610.001.753.839.891.82
273.6625.651.583.8326.301.57
Table 8. Percent error values.
Case NumberRaVibrationAcoustic Emission
15813
21223
3273
4821
5687
62810
73140
8138
90313
108813
113131
12934
13335
14481
15349
16124
17213
18054
191149
20671
215104
22012
23325
24632
25216
26114
27530
Table 9. Analysis of variance for machining characteristics.
SourceDegree of FreedomTotal Sum of SquareF Valuep ValuePercent
Contribution
Surface roughness
Cutting speed21.6620.510.6190.4
Feed rate2350.26949.510.00087.7
Depth of cut20.0670.0000.9980.1
Cutting speed × feed rate47.8010.480.7521.9
Cutting speed × depth of cut413.8831.070.4383.4
Feed rate × depth of cut43.6900.290.8770.9
Remaining error722.380--5.6
Total25399.753--100
Vibration
Cutting speed224.9271.580.27212.2
Feed rate215.6631.100.3847.7
Depth of cut274.7574.110.06637
Cutting speed × feed rate416.3170.480.7518
Cutting speed × depth of cut45.0200.100.9812.4
Feed rate × depth of cut48.3300.250.9004.1
Remaining error758.056--28.6
Total25203.071--100
Acoustic emission
Cutting speed2114.4604.120.06634.16
Feed rate24.1120.170.8511.2
Depth of cut20.3450.010.9850.1
Cutting speed × feed rate429.0030.580.6868.65
Cutting speed × depth of cut421.3000.430.7826.3
Feed rate × depth of cut479.5901.620.27223.79
Remaining error786.224--25.8
Total25335.033--100
Disclaimer/Publisher’s Note: The statements, opinions and data contained in all publications are solely those of the individual author(s) and contributor(s) and not of MDPI and/or the editor(s). MDPI and/or the editor(s) disclaim responsibility for any injury to people or property resulting from any ideas, methods, instructions or products referred to in the content.

