Abstract
Aluminum (Al)–copper (Cu)–lithium (Li) alloys are susceptible to environmental degradation, which limits the in-service lifetime of the components. Because of their complex composition, there are seldom studies focusing on corrosion behavior influenced by one single element, which is essential to clarify the corrosion mechanism. Herein, the sole influence of Mg on the corrosion behavior of Al–Cu–Li–xMg alloys was analyzed. Results revealed that the addition of Mg can affect the nucleation and precipitation process of the T1 precipitate, resulting in a difference of potential between grain interior and grain boundary. The precipitation of the T1 precipitate was promoted in a 0.7Mg alloy while impeded in a 1.1Mg alloy, due to the competition of Cu atoms and nucleation sites between T1 and S′. Two types of corrosion behavior of Al–Cu–Li–xMg alloys appeared due to the potential difference and continuity of grain boundaries. Continuous precipitates in grain boundaries and less precipitates within the grain are likely to cause intergranular corrosion (IGC), while more precipitates within the grain will result in pitting.
1. Introduction
Aluminum (Al)–copper (Cu)–lithium (Li) alloys have been generally utilized in the aerospace field due to their low density, high strength, low fatigue–crack growth rate, and great corrosion resistance [1,2,3,4,5]. With 1% increase in Li content, the density of Al–Cu–Li alloys can be reduced by approximately 3% and elastic modulus increased by about 6%, respectively [6]. However, Al–Cu–Li alloys are liable to corrosion in harsh environments such as wet and salt spray, which shows a significant decrease in the strength and mechanical properties, even causing the failure. To improve the stability of this alloy in the application process and to make it more competitive, it is worth investigating the corrosion properties associated with the Mg content of Al–Cu–Li alloys.
The corrosion behavior of alloys is tightly connected to the characteristic of precipitates [7,8,9,10,11,12,13]. Previous studies have shown that enhanced phase particles will precipitate during aging, such as T1(Al2CuLi), S′(Al2CuMg), θ′(Al2Cu) and δ′(Al3Li) [14], demonstrating that the corrosion potential can be affected by the chemical composition of these precipitates. For instance, Li and Mg (about −1.7 VSSCE) have more active electrochemical properties than the Al matrix, which means that the precipitated phases containing more Li and Mg element have a negative potential and are susceptible to corrosion [15], such as T1 and S′ precipitates [16,17]. On the contrary, the corrosion resistance of precipitates is improved with the increasement of Cu content (such as θ′ precipitates) because the corrosion potential of the Cu element is higher than that of the Al matrix [18]. In addition, the distribution of precipitates has a crucial impact on the corrosion behavior of Al–Cu–Li alloys. Studies shows that corrosion occurs preferentially along where T1 has precipitated, such as grain boundaries and subgrain boundaries [19,20,21,22], confirming that the activated phases aggregated at the grain boundary are responsible for intergranular corrosion.
As mentioned above, the connection between the precipitates and the corrosion behavior of the Al–Cu–Li alloy was illustrated. Furthermore, the microstructure and corrosion behavior of the Al–Cu–Li alloy will be significantly tuned by the addition of micro-alloying elements. For instance, adding Zn into the Al–Cu–Li alloy can form Zn-rich phases at grain boundaries, which achieves an improved corrosion resistance by reducing the difference of potential between grain and grain boundaries [23]. Similarly, appropriate amounts of Sc will consume Cu atoms in the Al–Cu–Li alloy, reducing the density of T1 precipitates [24].
Additionally, Mg is one of the most important micro-alloyed elements in Al–Cu–Li alloys. Mg present with Zn and Ag has a great influence on the precipitation of the age-enhanced phases, such as T1, S′ and θ′. Studies have shown that Mg, together with Ag, can promote the precipitation of the T1 precipitates [25,26,27,28]. Furthermore, the addition of Ag in Mg-containing Al–Cu–Li alloys leads to the increase of GP zones, which will correspondingly increase the density of T1 precipitates [25]. The effect of Mg in the alloy varies with its concentration by influencing the formation of precipitates. The precursors tend to change into θ′ precipitates in the matrix when the Mg content is scarce, while the addition of Mg (>0.35 wt.%) results in the formation of precursors containing Mg and Cu at the dislocations, which promotes the precipitation of the GP zones and S′ phases in the Al–Cu–Li alloys, and further inhibits the precipitation of T1 precipitates [27]. The S′ precipitates were formed with the loss of T1 and θ′ precipitates when the Mg concentration increased to 0.8 wt.%. It can be concluded that the addition of excessive Mg is helpful to the nucleation and growth of Mg-containing phases, while restricting them from T1 precipitates [29]. The high addition of Mg (1.1 wt.%) in the Al–Cu–Li alloys leads to sluggish precipitation strengthening, which was explained by a competition mechanism between T1 precipitates and S′ precipitates [30]. These studies have shown the influence of Mg concentration on precipitates, which can adjust the corrosion properties of Al–Cu–Li alloys. However, most of studies investigated the addition of Mg + Ag + Zn or the control of Mg + X [25,26,27,28], while there are few studies on the sole influence of Mg concentration on corrosion behavior.
The effect of Mg content on the corrosion behavior of Al–Cu–Li alloys was investigated from the general immersion tests, OCP and potentiodynamic polarization tests. To further clarify the influence of microstructure on corrosion, the alloys were characterized by transmission electron microscope (TEM) and optical microscope (OM), which revealed the sluggish precipitation of T1 phase in high Mg alloys. This work can help the design of Al–Cu–Li alloys and shed light on corrosion behaviors.
2. Experimental
2.1. Material Preparation
Three alloys were used in this study, prepared by conventional casting with a steel mold which was protected by Ar atmosphere, followed by three respective steps of homogenization, at 360 °C for 4 h, 410 °C for 8 h and 510 °C for 20 h, using a 5x-12-10 resistance furnace. It was then homogenized in three different processes for 32 h. The alloys were designated as Mg-free alloys, 0.7Mg alloy, and 1.1Mg alloy in terms of the Mg concentration. The chemical composition of the three alloys was shown in Table 1. The surface of the samples was ground out and subsequently rolled to a thickness of 2 mm. The alloys aged at 150 °C from 6 h to 140 h followed by homogenization, water quenching and 5% pre-deformation.

Table 1.
Chemical composition of investigated alloys (all in wt.%).
2.2. IGC Tests
The IGC test was performed in accordance with the 7998–2005 GB/T standard. The samples after different aging time were immersed at 35 ± 2 °C for 6 h in the IGC solution, which consisted of 57 g/L NaCl and 10 mL/L H2O2. Afterward, the sectional surfaces of the corroded samples were ground to 2000 grit by silicon carbide paper and subsequently polished by diamond paste. Then the sectional surfaces were characterized by Leica DMILM metallographic microscope (Leica Instrument Co., Ltd., Wetzlar, Germany). The maximum corrosion depth was carried out three times for each sample.
2.3. Electrochemical Tests
The samples were cut into approximately 15 mm × 15 mm sheets with a thickness of 2 mm, and the samples were sanded and polished before each experiment. The open circuit potential (OCP) and potentiodynamic polarization curves were analyzed in NaCl solution (3.5 wt.%) using a parstat3000adx electrochemical workstation. The flat cell uses a silver/silver chloride electrode (SSCE) as reference electrode, a platinum plate served as the counter electrode, and the test area of samples was 1 cm2. OCP testing was recorded for 10 min with a potential scan rate of 1 mV/s. Potentiodynamic polarization tests were carried out after the OCP test with the same potential scan rate. For each sample, electrochemical tests were performed at least three times at least.
2.4. Characterization
TEM samples of different Mg content and aging time were prepared. The aged specimens were electro-polished using RL-I electropolisher with 30% HNO3 + 70% CH3OH at −40 °C to −30 °C. Tecnai G20 and F20 transmission electron microscopes (Royal Dutch Philips Electronics Ltd., Amsterdam, the Netherlands), operating at 200 kV with bright field (BF) and high-angle annular dark field (HAADF) modes, were used in this study.
2.5. DSC Measurement
DSC thermal analysis was carried out on model TA Q20 dynamic thermos-flowmeter scanning calorimeter (NETZSCH Scientific Instruments Trading Ltd., Selb, Germany). The instrument was corrected before the experiment, including temperature correction, furnace constant correction and baseline T1 correction. The DSC measurements were started at an initial temperature of room temperature and a final temperature of 400 °C, with a heating rate of 50 °C/min under an atmosphere of a high-purity nitrogen flux. After solution treatment at 510 °C, all samples were subjected to DSC tests after 12 days of natural aging. Before measurement, the samples were polished with sandpaper to keep the samples clean and cut to 2 mm × 2 mm squares with a thickness of 1 mm to fit in the dedicated pure aluminum crucibles. Meanwhile, the sample weight was measured for normalization (range of sample weights: 10–20 mg).
3. Results
3.1. Electrochemical Performance
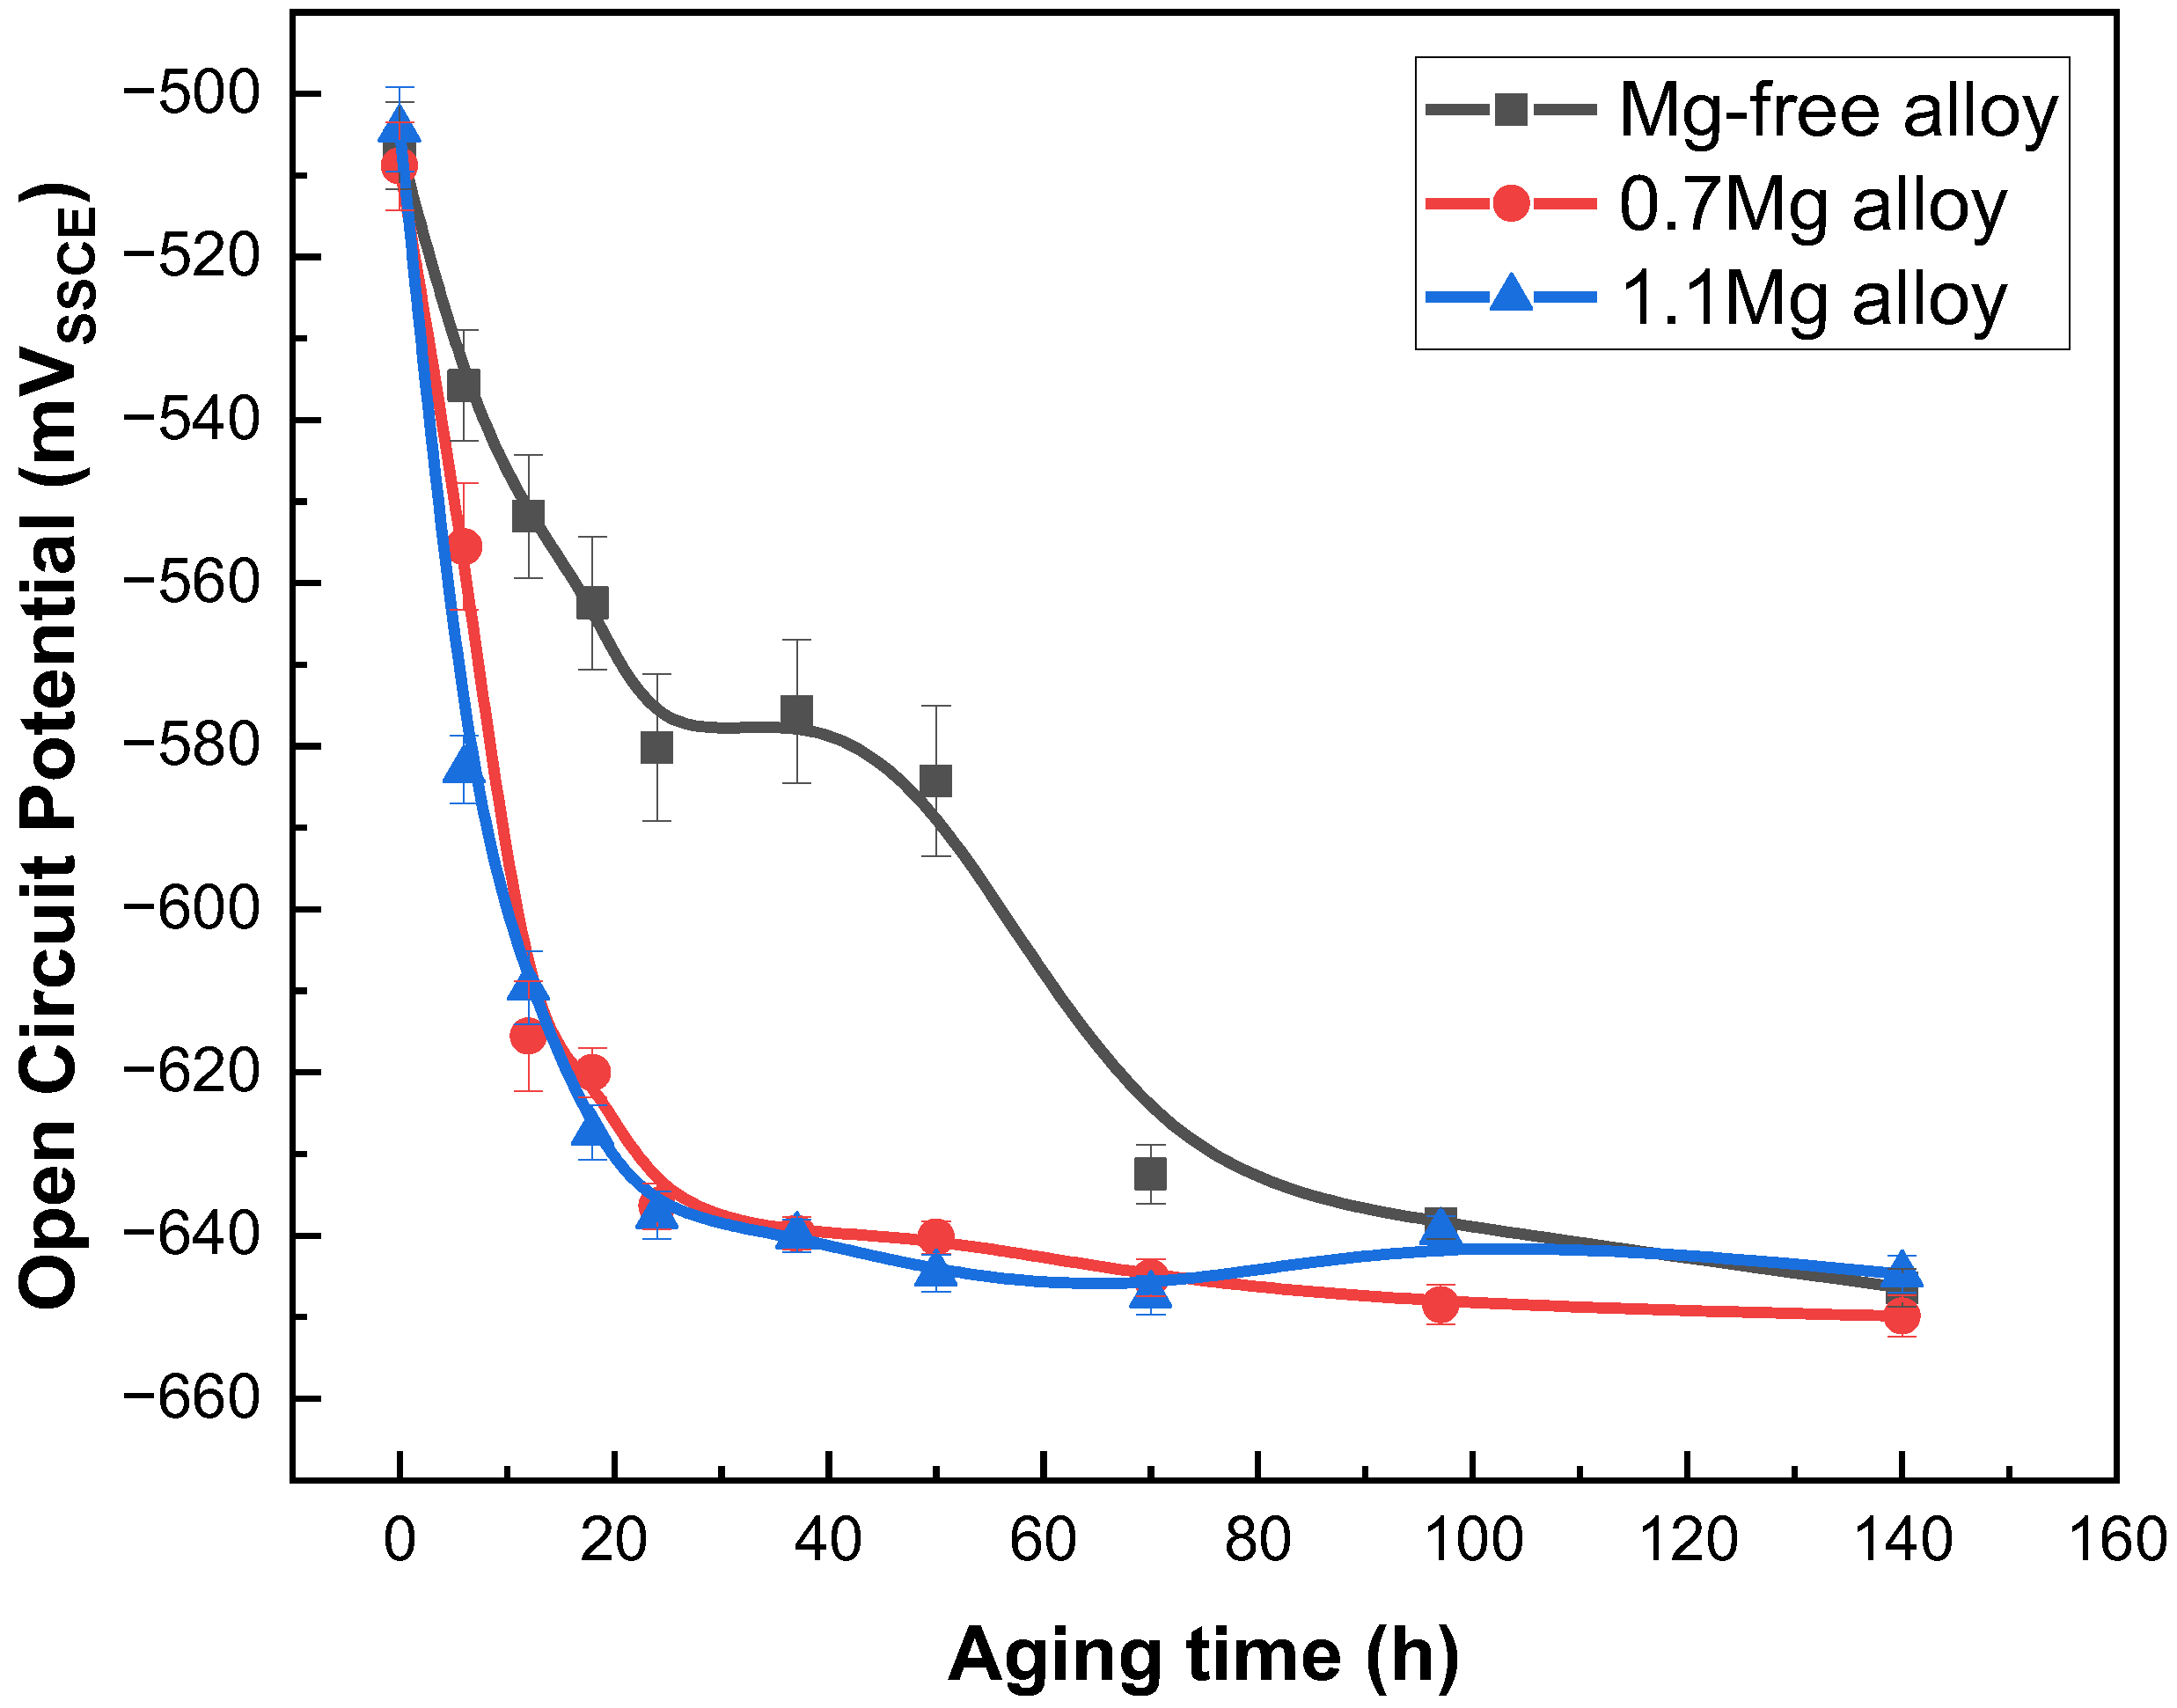
The OCP of Al–Cu–Li alloys with different Mg content after aged at 150 °C for 0–140 h are shown in Figure 1 as a function of aging time. After aging for 24 h, the OCP of Mg-free alloy declines from −506 mVSSCE (solution state) to −580 mVSSCE, and gradually drops to −646 mVSSCE after aging for 140 h. However, the OCP of the 0.7Mg alloy lowers from −508 mVSSCE (solution state) to −615 mVSSCE after aging for 24 h, and finally falls to −649 mVSSCE with 140 h of aging. The evolution trend of the OCP of the 1.1Mg alloy is basically consistent with that of the 0.7Mg alloy.

Figure 1.
Open circuit potential of Al–Cu–Li alloys with different Mg content after aging at 150 °C for 0–140 h.
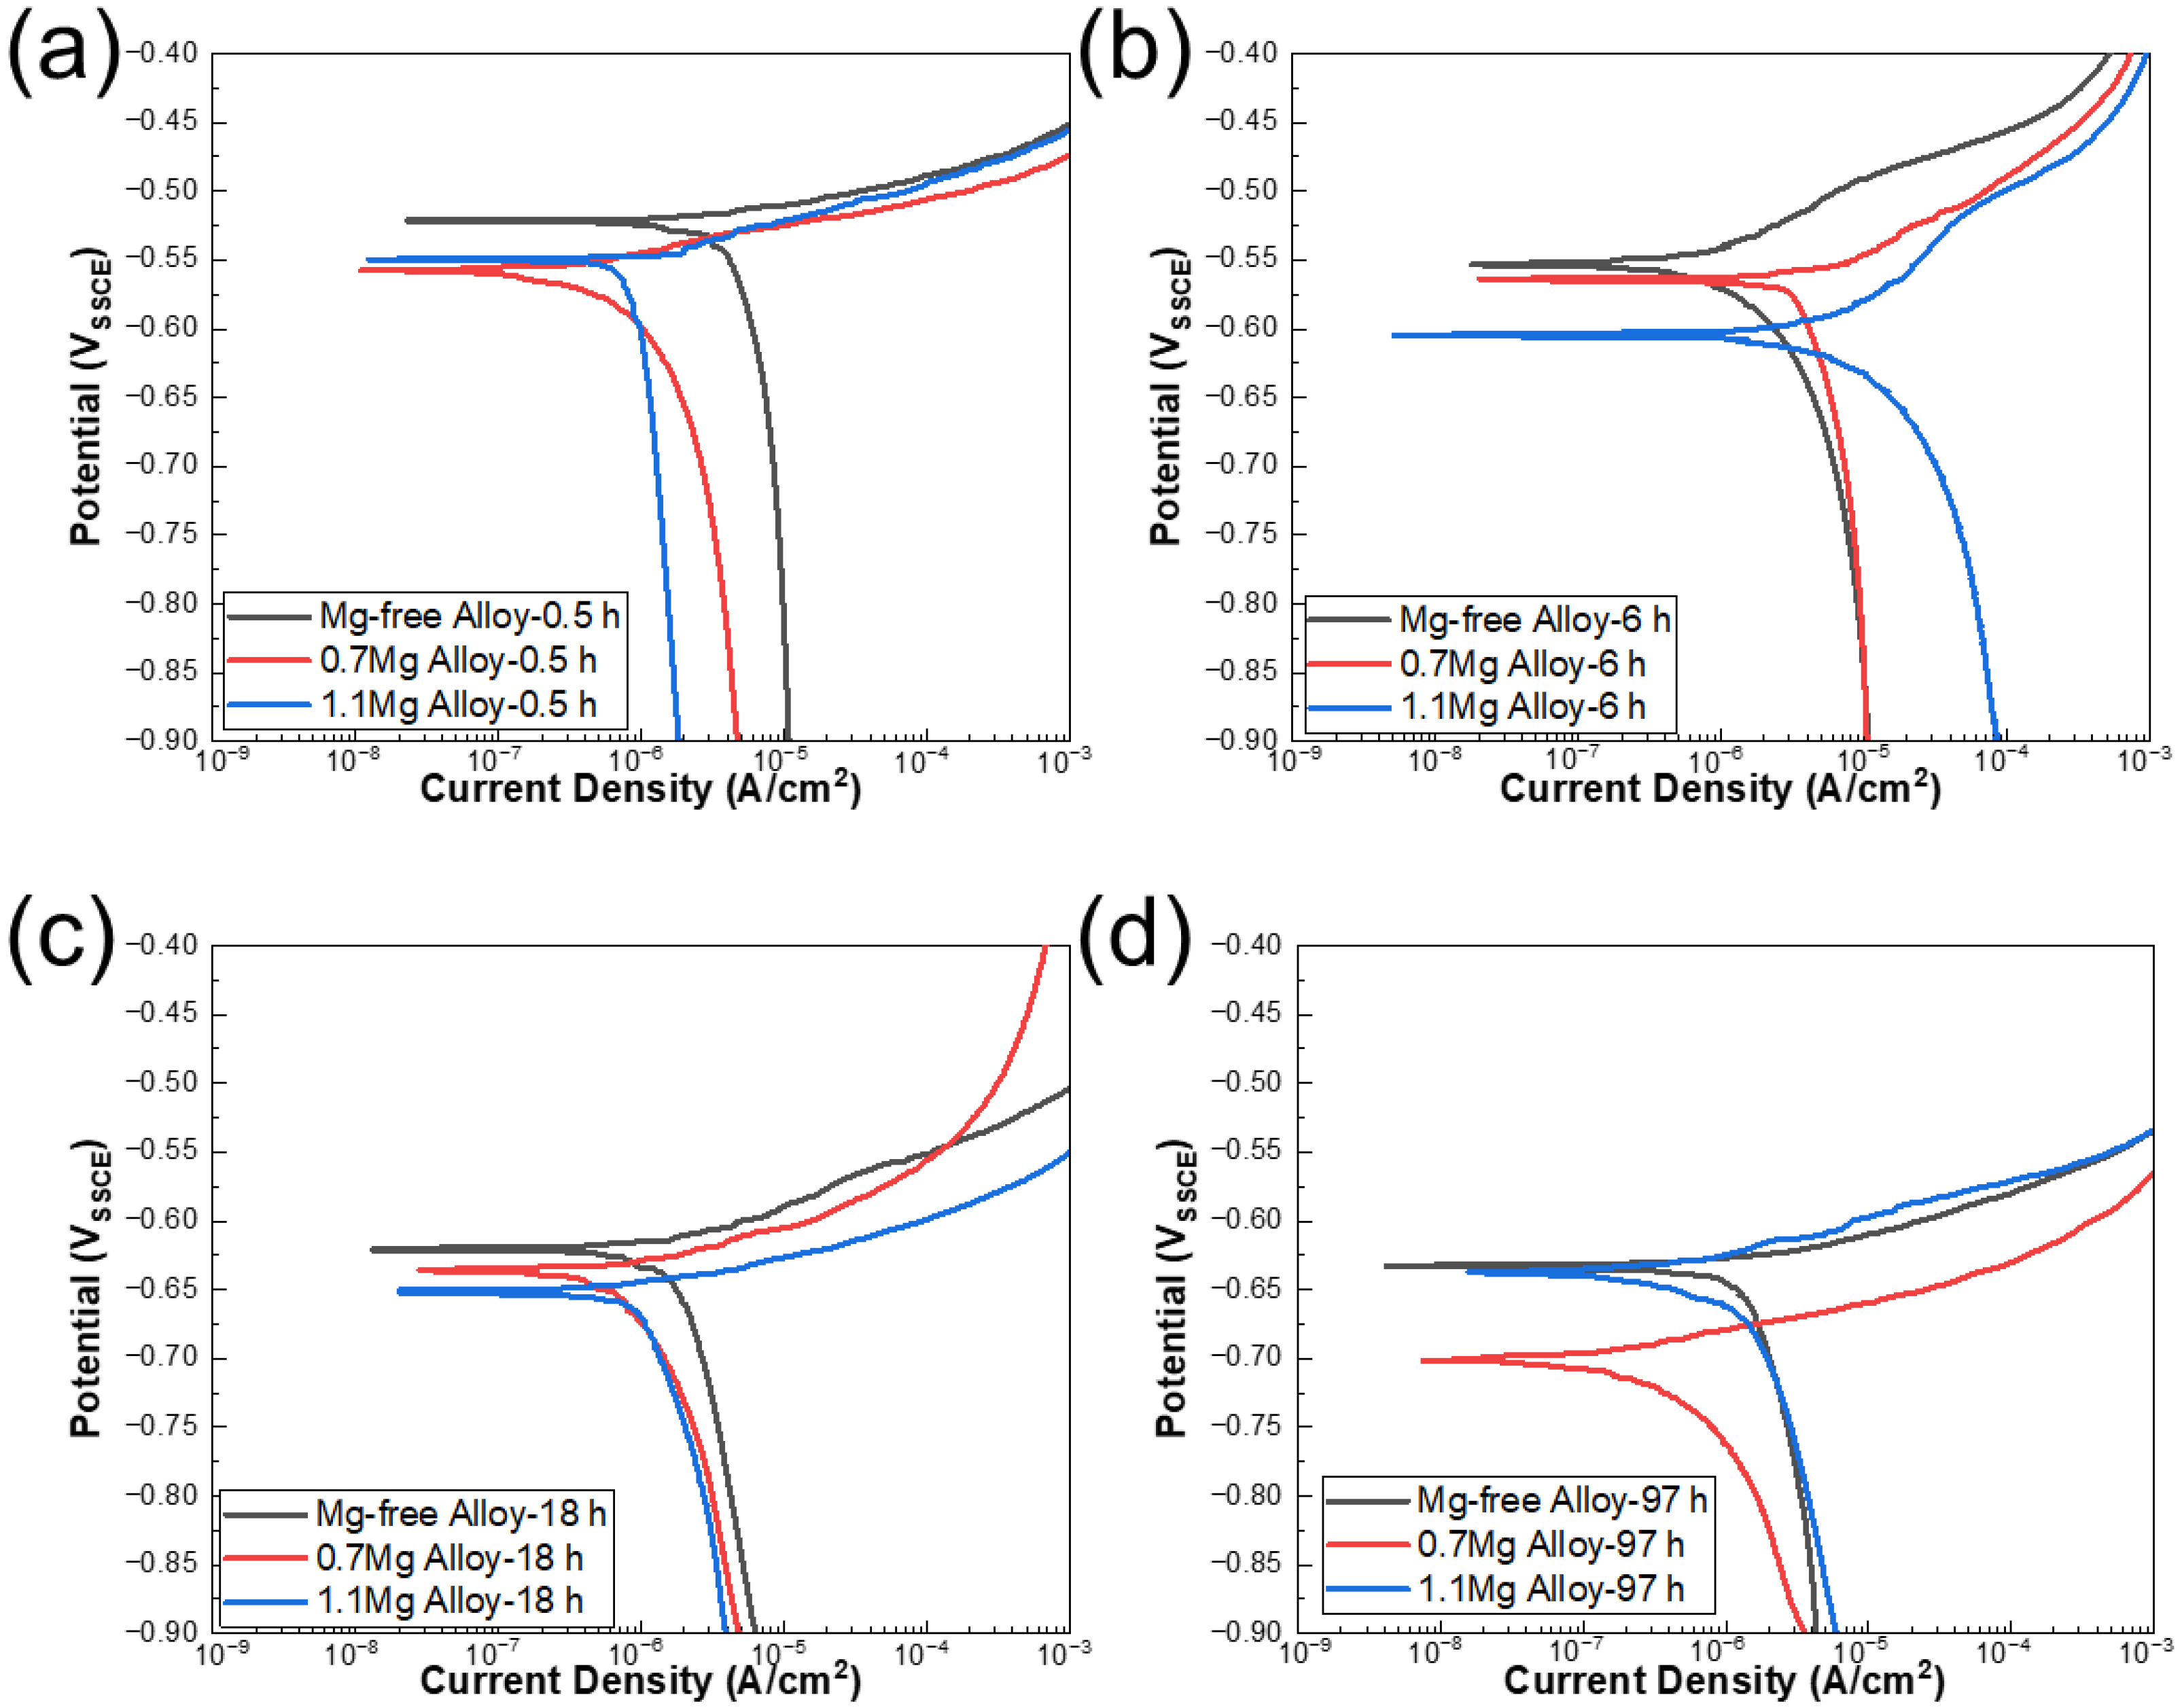
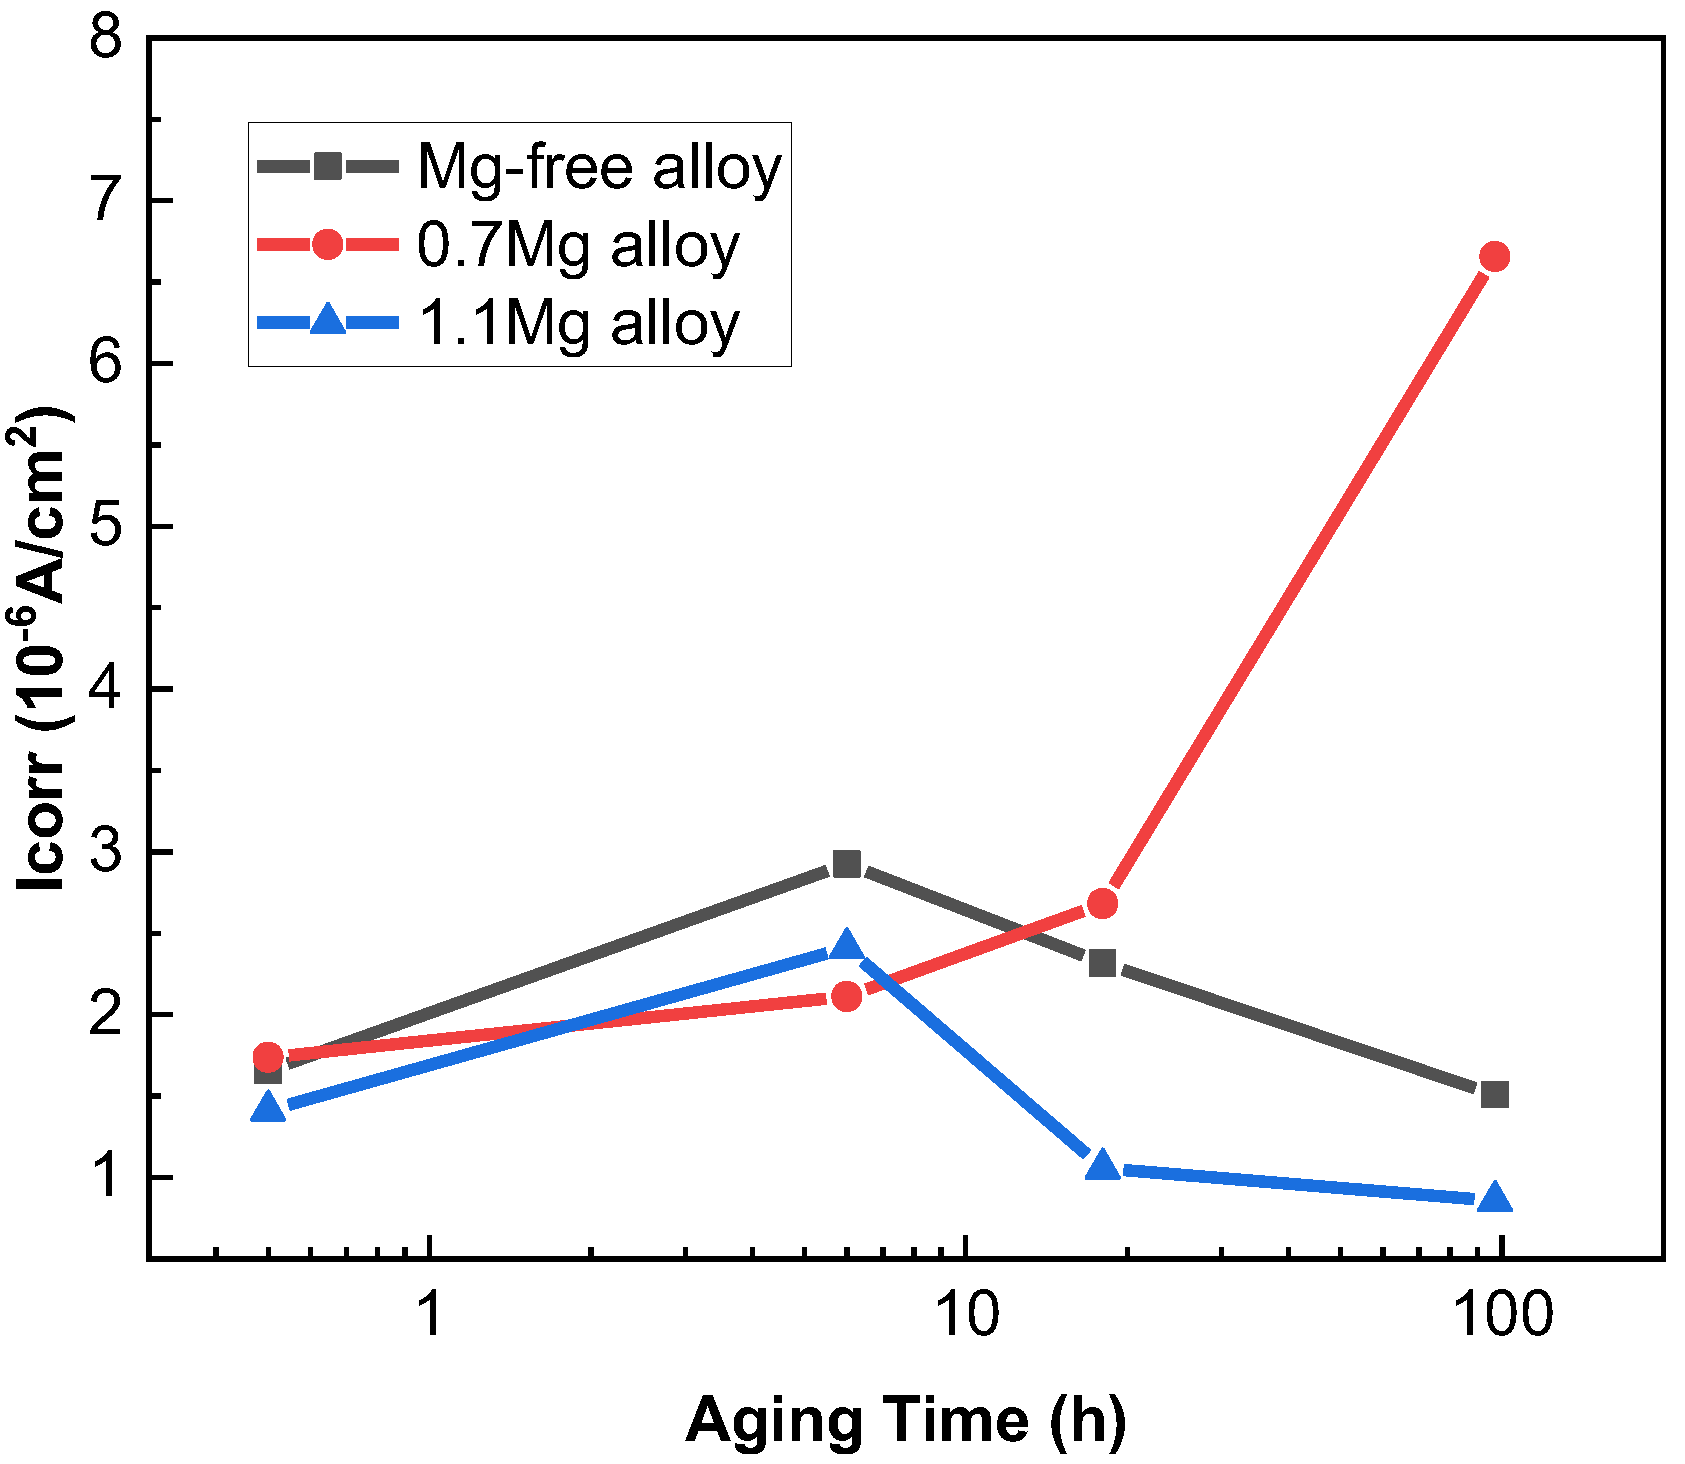
The potentiodynamic polarization curves of Al–Cu–Li alloys with different Mg content aged at 150 °C for various times are displayed in Figure 2. According to the IGC test experimental results, the polarization curves of 0.5 h, 6 h, 18 h and 97 h were detected. The corrosion potential (Ecorr) and corrosion current density (Icorr) of three alloys with different Mg content are shown in Table 2, and Icorr values of Al–Cu–Li–xMg alloys extracted from potentiodynamic polarization studies in Figure 2 are shown in Figure 3. The Ecorr decrease with aging progress and Mg content are consistent with the OCP. The Ecorr of three alloys with different aging times basically follows the following pattern: 1.1Mg alloy < 0.7Mg alloy < Mg-free alloy. The 0.7Mg Alloy aged for 97 h exhibited a high Icorr of 6.656 × 10⁻⁶ A/cm2, which was approximately 3–4 times higher than the other samples.
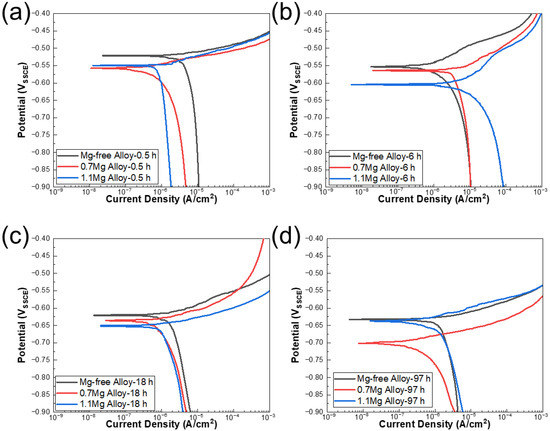
Figure 2.
Potentiodynamic polarization curves of Al–Cu–Li alloys with different Mg content aged at 150 °C for (a) 0.5 h, (b) 6 h, (c) 18 h, (d) 97 h in 3.5% NaCl solution at near neutral pH.
Table 2.
Ecorr and Icorr values of Al–Cu–Li–xMg alloys extracted from potentiodynamic polarization studies in Figure 2.

Figure 3.
Icorr values of Al–Cu–Li–xMg alloys extracted from potentiodynamic polarization studies in Figure 2.
3.2. Corrosion Modes and IGC Microstructure
Representative cross-sectional corrosion morphologies of Al–Cu–Li alloys with different Mg content immersed for 6 h in 1 M NaCl + 0.1 M H2O2 solution are shown in Figure 4. Only a small portion of the surface appears with local IGC, as seen in Figure 4a. In addition to local IGC, pitting is another typical corrosion morphology. Local IGC with pitting is a particular type of corrosion mode where a specific level of IGC can be observed near the border of the pit, as illustrated in Figure 4b. Generally, this type of corrosion mode takes place during the interval between local IGC and pitting. In this work, two distinct forms of pitting are detected, one of which is defined as pitting 1, as shown in Figure 4c. Some shallow and discontinuous pitting can remain in this kind of pitting. The other is defined as pitting 2 and is displayed in Figure 4d, which has a deeper and wider range of corrosion, simultaneously keeping an almost uncorroded grain boundary. The corrosion mode and IGC depth of the alloys aged at 150 °C for different times are displayed in Table 3, demonstrating that all alloys exhibit IGC susceptibility during the early stages of aging. Furthermore, the IGC of the 0.7Mg alloy disappeared earliest while the 1.1Mg alloy lasted the longest.
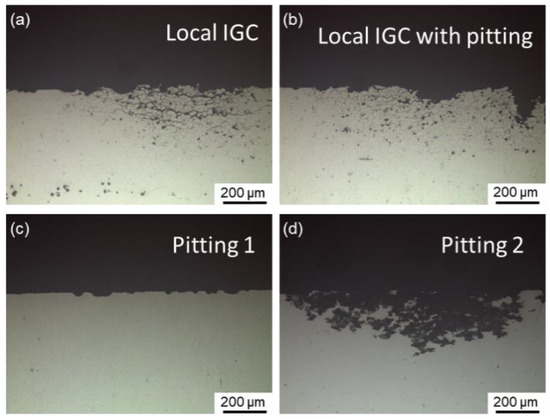
Figure 4.
Representative cross-sectional corrosion morphologies of Al–Cu–Li alloys with different Mg content immersed for 6 h in 1 M NaCl + 0.1 M H2O2 solution, representing: (a) local IGC (1.1Mg alloy aged for 0.5 h) and (b) local IGC (1.1Mg alloy aged for 1 h) with pitting, (c) pitting 1 (Mg-free alloy aged for 97 h) and (d) pitting 2 (0.7Mg alloy aged for 50 h).
Table 3.
Corrosion mode, maximum and average depth of investigated alloys aged for different times.
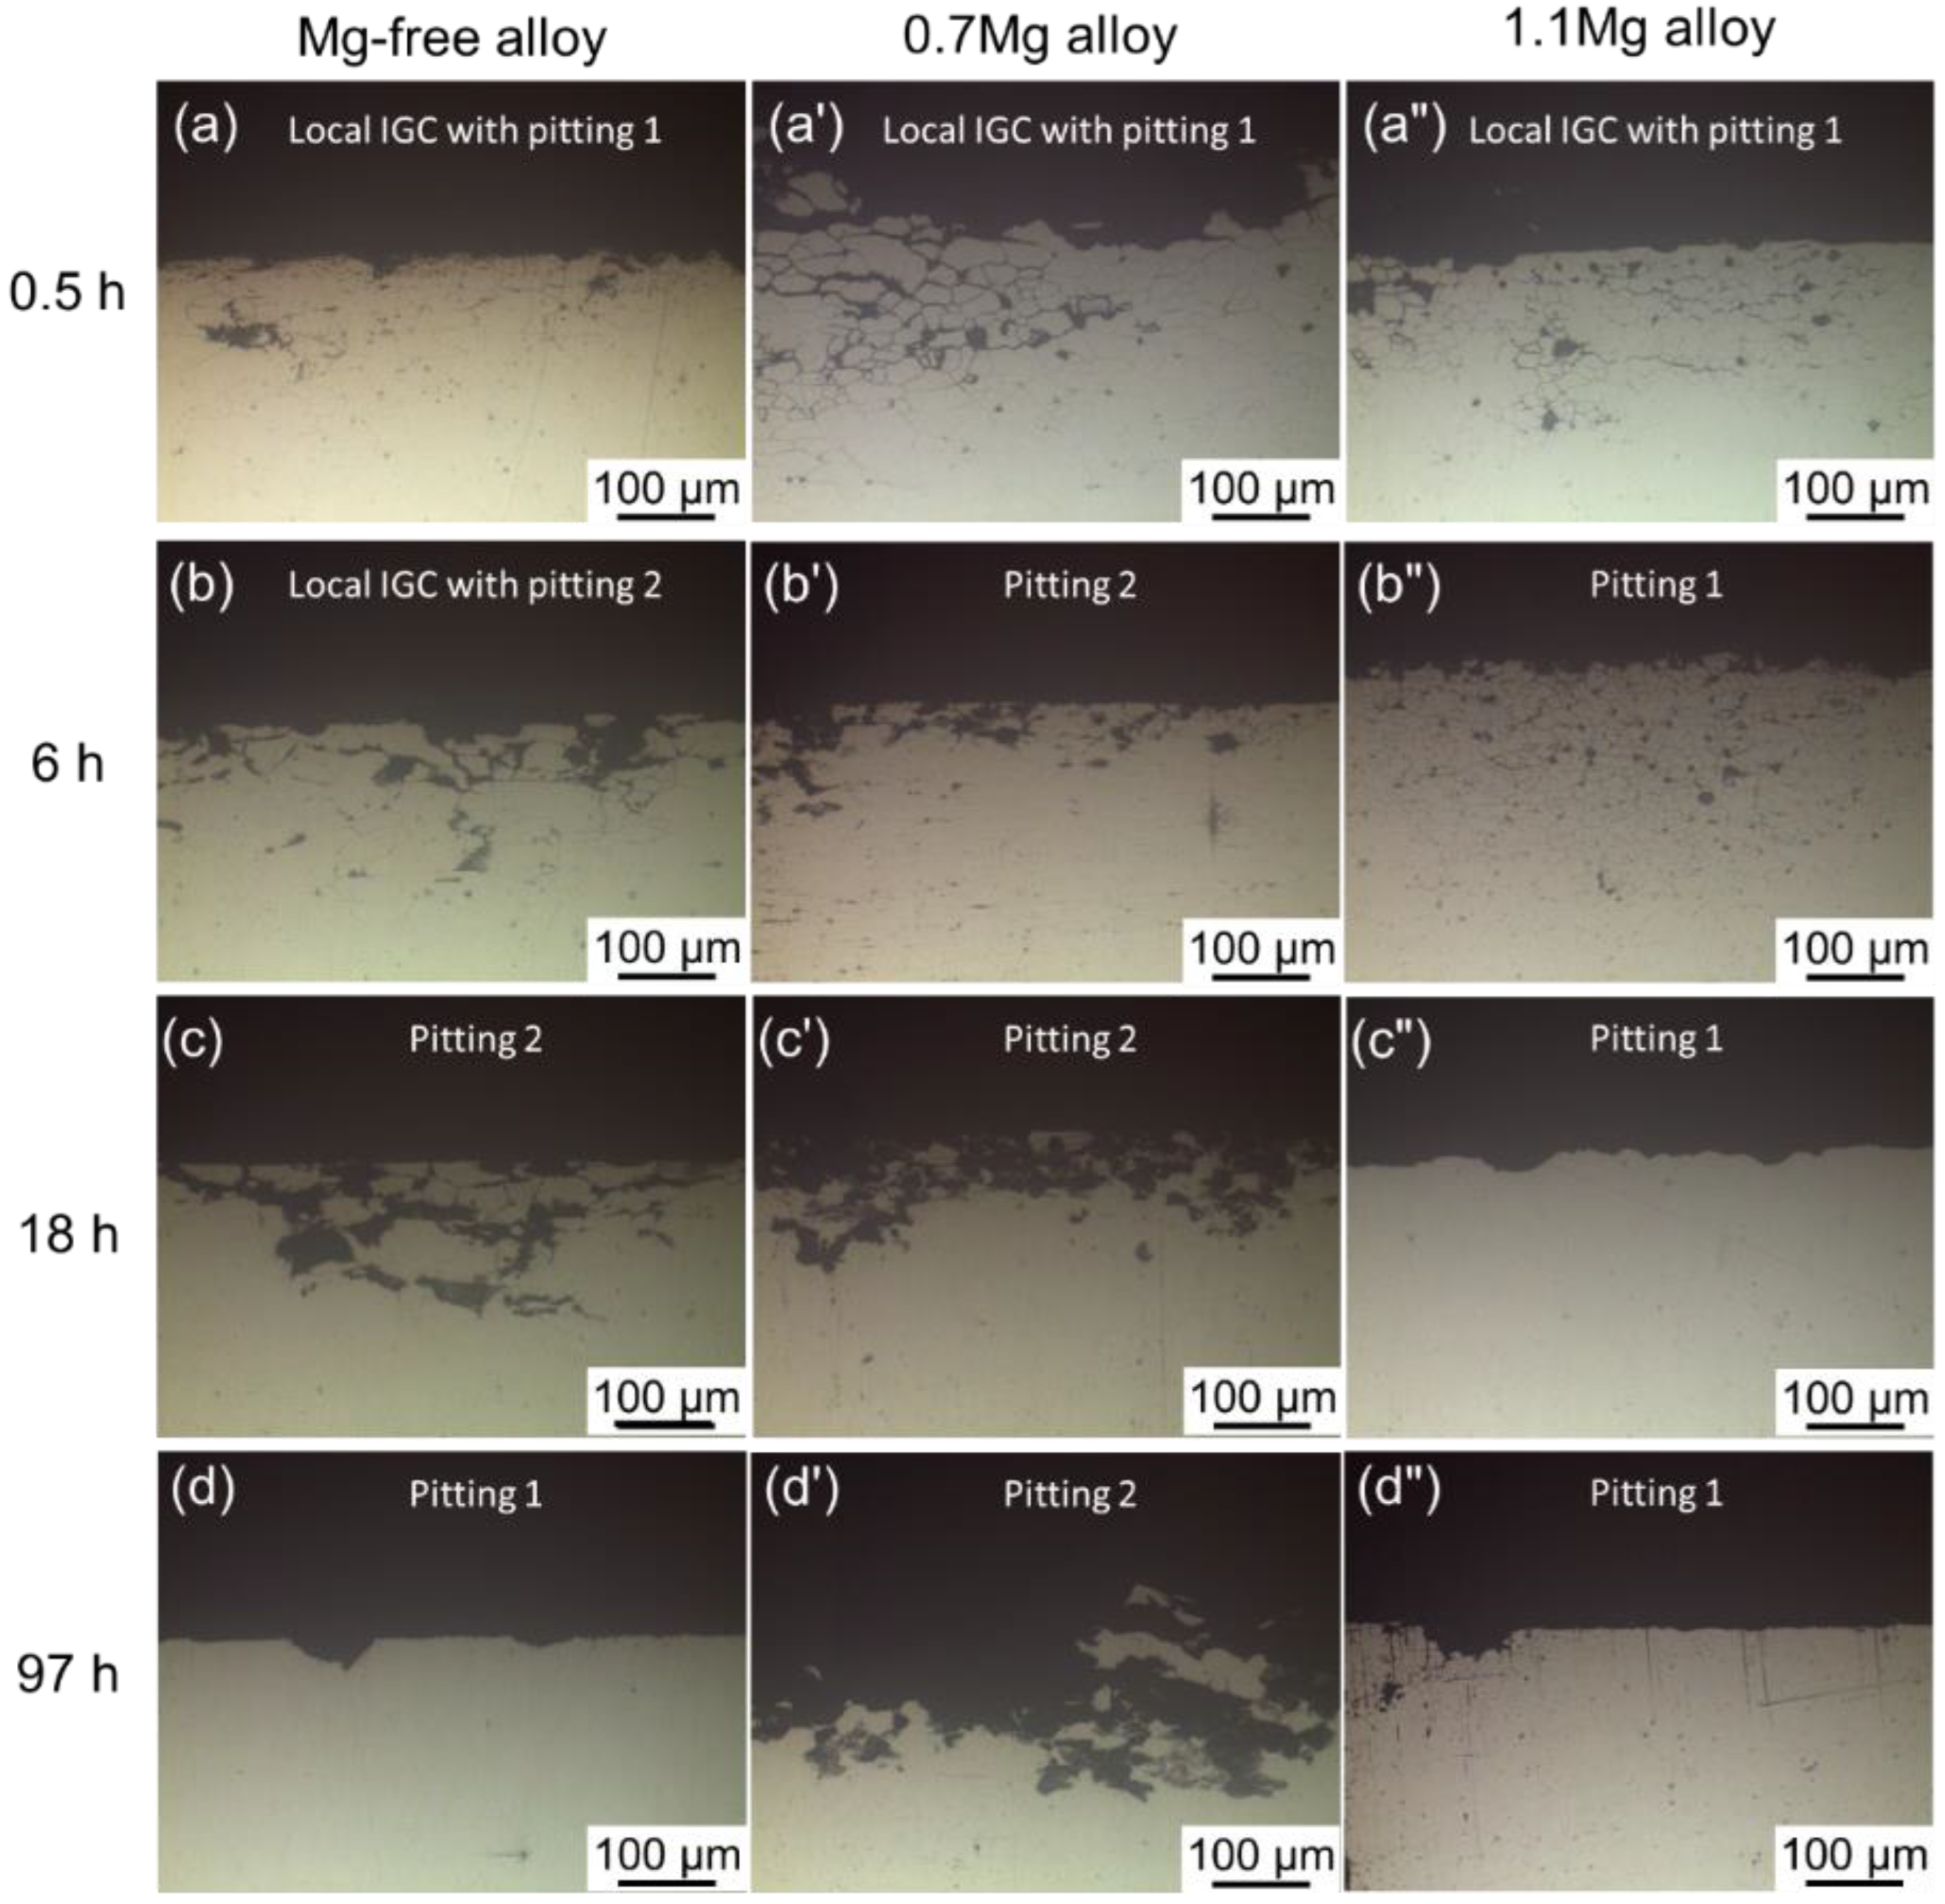
The Cross-sectional micrographs of three alloys with different Mg content aging at 150 °C for 0.5–97 h are displayed in Figure 5. Among the three alloys with various Mg content, the corrosion mode followed a similar order: local IGC with pitting, pitting. After being aged for 0.5 h, the Mg-free alloy exhibits local IGC with pitting, becomes pitting 2 until 12 h, and finally appears as pitting 1. The corrosion mode of the 0.7Mg alloy transfers from local IGC and pitting 1 to pitting 2 with age. The corrosion mode of the 1.1Mg alloy transfers following the order of aging time: local IGC with pitting 1, pitting 1. Local IGC with pitting is identified after being aged for 0.5 h and persists for 18 h, then formed to pitting 1.
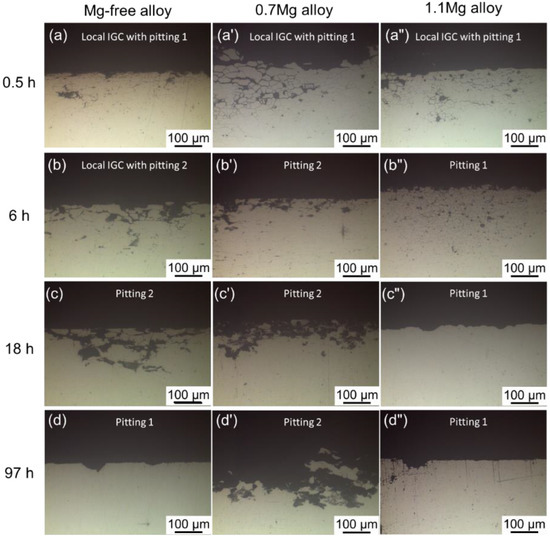
Figure 5.
Cross-sectional micrographs of Mg-free alloy aging at 150 °C for (a) 0.5 h, (b) 6 h, (c) 18 h, (d) 97 h; 0.7Mg alloy aging at 150 °C for (a’) 0.5 h, (b’) 6 h, (c’) 18 h, (d’) 97 h; 1.1Mg alloy aging at 150 °C for (a”) 0.5 h, (b”) 6 h, (c”) 18 h, (d”) 97 h.
3.3. Microstructure
The dark field (DF) TEM images and corresponding selected area electron diffraction (SAED) patterns for Al–Cu–Li alloys with different Mg content aged at 150 °C for 37 h are presented in Figure 6. The SAED patterns along <112>Al for the three alloys show that the T1 precipitates have formed [31]. A minor number of T1 precipitates were seen in the TEM DF image of the Mg-free alloy after being aged for 37 h (Figure 6a). T1 precipitates are finer and more noticeable with the increasement of Mg content (Figure 6b,c). In addition, multiple S′ precipitates can be seen in the 1.1Mg alloy. The SAED patterns along <100>Al for the three alloys indicate the presence of θ′ precipitates. Some GP zones were found in the Mg-free alloy (Figure 6d), which is the precursor of θ′ precipitates. Few θ′ precipitates are visible in the 0.7Mg alloy (Figure 6e) and almost no precipitate was found in the 1.1Mg alloy (Figure 6f).
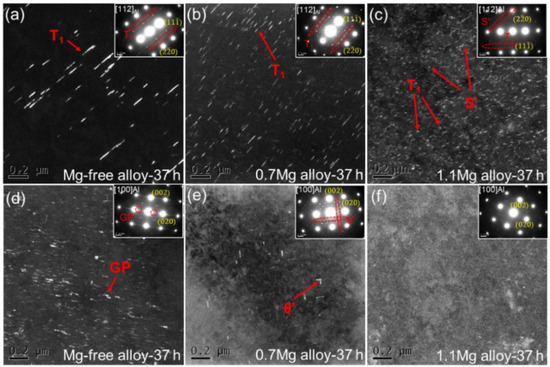
Figure 6.
DF TEM images and corresponding SAED patterns for Al–Cu–Li alloys with different Mg content (Mg-free alloy (a,d), 0.7Mg alloy (b,e), 1.1Mg alloy (c,f)) aged at 150 °C for 37 h.
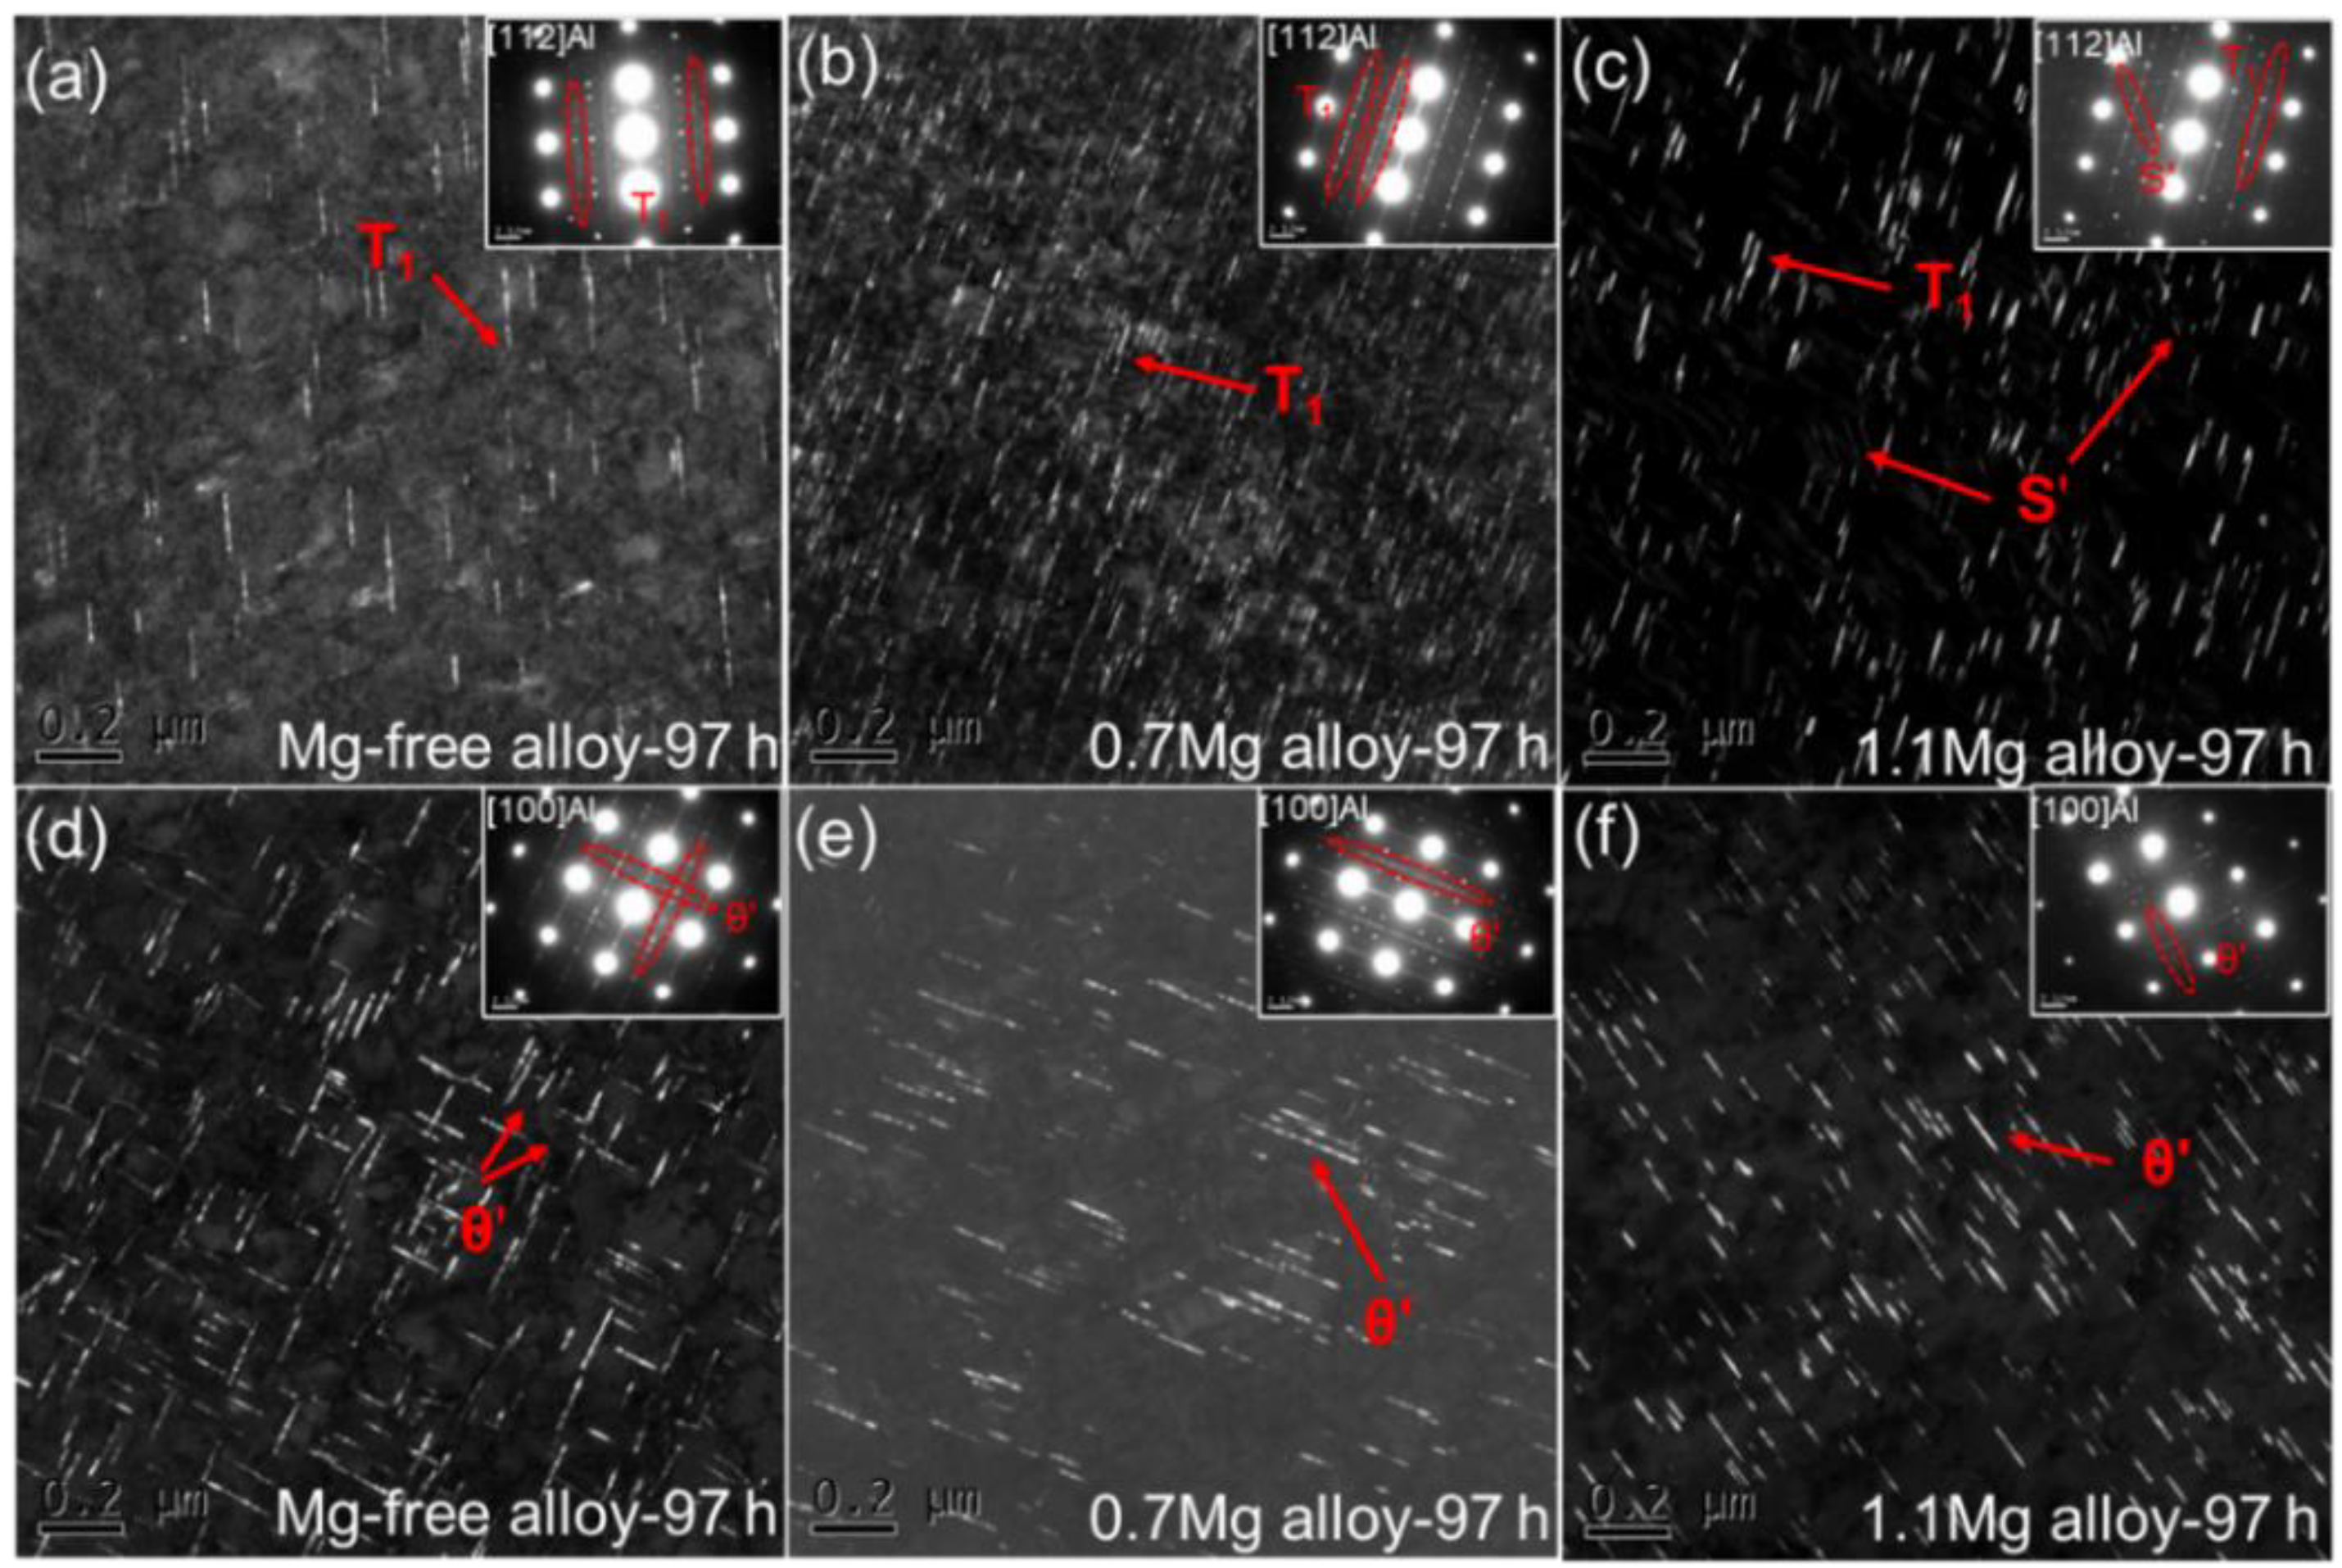
DF TEM images and corresponding SAED patterns for Al–Cu–Li alloys with different Mg content aged at 150 °C for 97 h are displayed in Figure 7. The SAED patterns along <112>Al for Al–Cu–Li alloys with various Mg content show the existence of T1 precipitates. There are few T1 precipitates in the Mg-free alloy aged at 150 °C for 97 h (Figure 7a), which is similar with the Mg-free alloy aged at 150 °C for 37 h. It is worth mentioning that a substantial number of fine T1 precipitates can be seen in the 0.7Mg alloy (Figure 7b) while there are coarser T1 precipitates in the 1.1Mg alloy (Figure 7c), with a minor number of the S′ precipitates present as well. When Mg is added in the proper quantity, the T1 precipitates are accelerated while θ′ precipitates are inhibited.
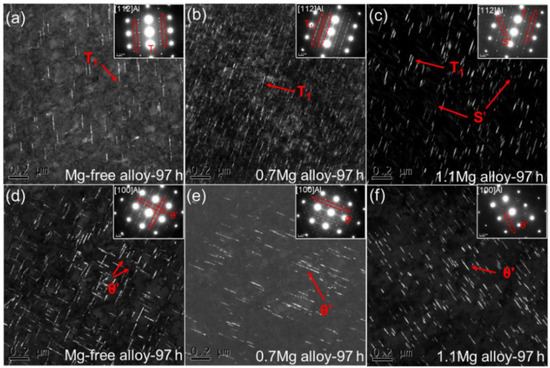
Figure 7.
DF TEM images and corresponding SAED patterns for Al–Cu–Li alloys with different Mg content (Mg-free alloy (a,d), 0.7Mg alloy (b,e), 1.1Mg alloy (c,f)) aged at 150 °C for 97 h.
BF TEM images of Al–Cu–Li alloys with different Mg content aged at 150 °C for 37 h and 97 h are shown in Figure 8. Fine and continuous phases emerge at the high-angle grain boundary of the Mg-free alloy after being aged for 37 h (Figure 8a). The phases near the grain boundaries of the Mg-free alloy tend to disappear as the aging time increased to 97 h, while the intragranular phases appear (Figure 8d). The precipitates at the grain boundaries of the 0.7Mg alloy aged at 150 °C for 37 h (Figure 8b) are coarser than those of the Mg-free alloy, and the precipitates start to become discontinuous at grain boundaries. The precipitates at the grain boundaries become coarser and more discontinuous after aged for 97 h (Figure 8e). At grain boundaries, the 1.1Mg alloy aged for 37 h (Figure 8c) and 97 h (Figure 8f) shows essentially no visible precipitates.
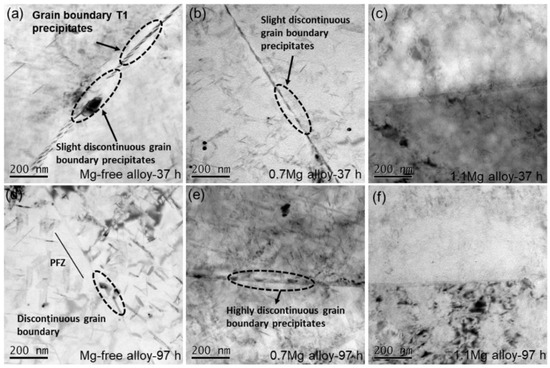
Figure 8.
BF TEM images of Al–Cu–Li alloys with different Mg content (Mg-free alloy (a,d), 0.7Mg alloy (b,e), 1.1Mg alloy (c,f)) aged at 150 °C for 37 h (a–c) and 97 h (d–f).
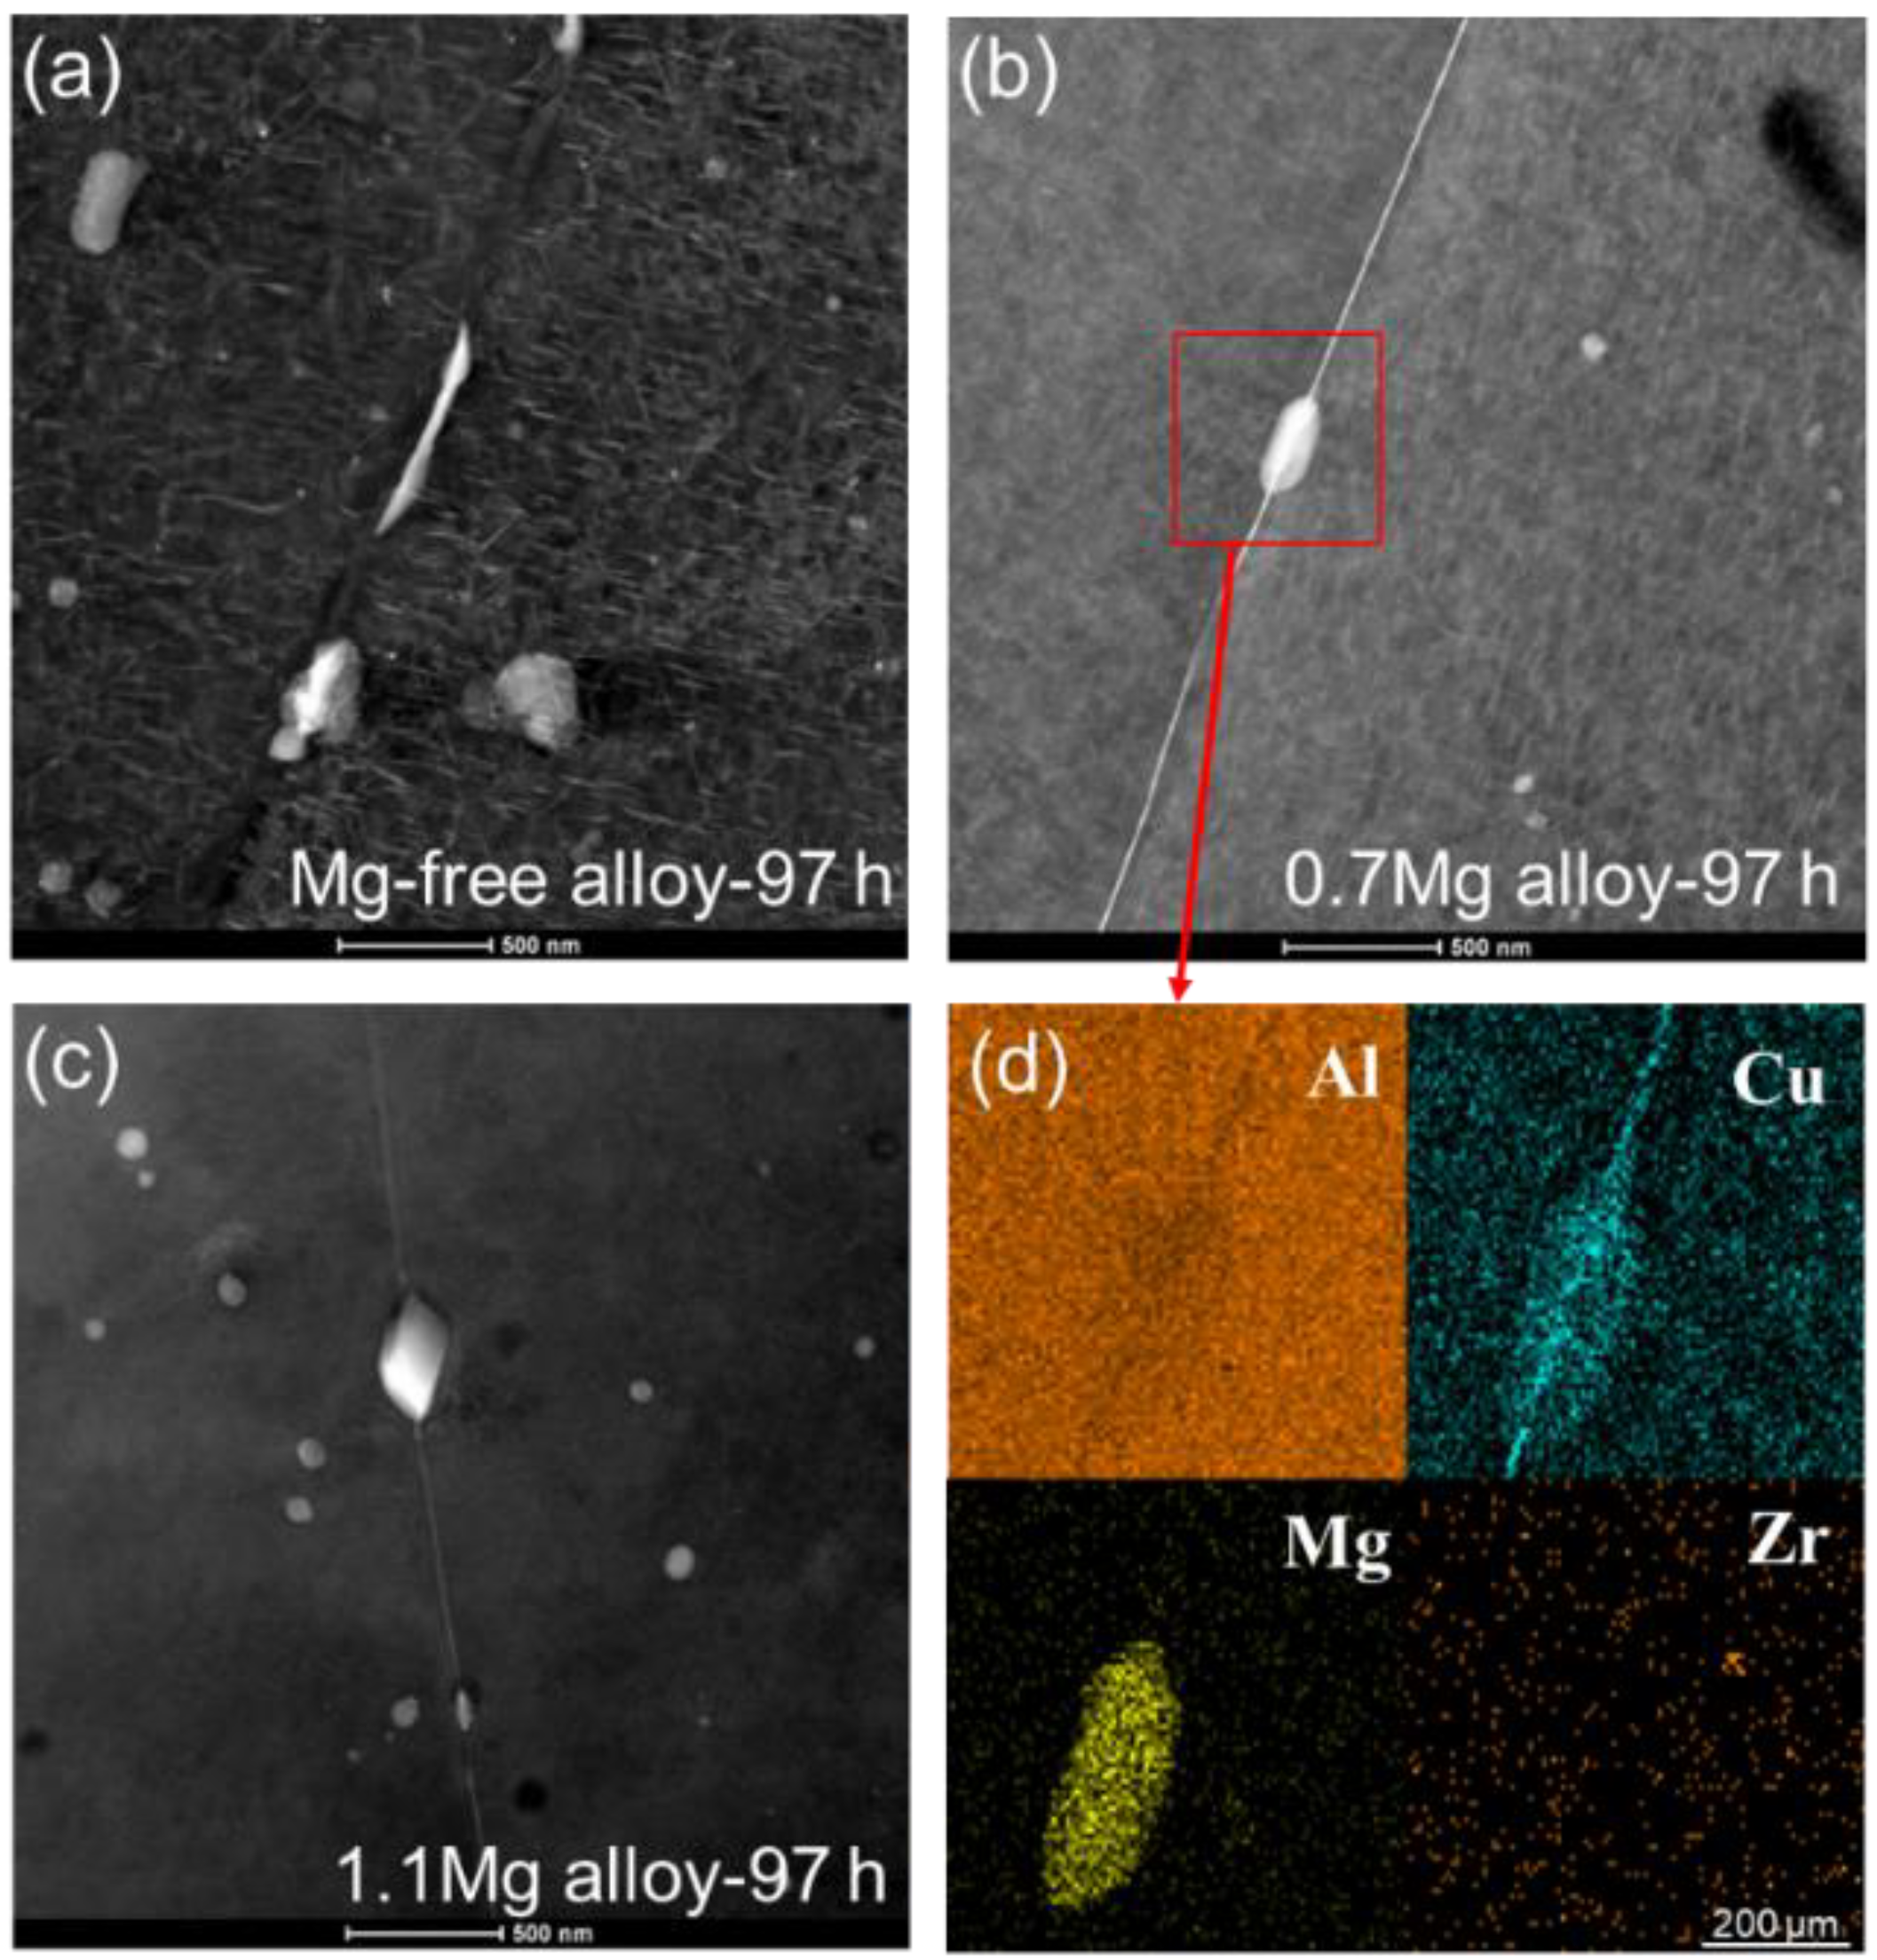
HAADF STEM images after being aged at 150 °C for 97 h for Al–Cu–Li alloys with different Mg content and corresponding EDS mapping images of Figure 8b are displayed in Figure 9. According to Figure 9a, the phases at the grain boundary of the Mg-free alloy aged for 97 h are discontinuous, which is consistent with Figure 8c. The grain boundary contains some coarse secondary phase particles, with almost no phases near them. After 97 h of aging, coarse secondary phase particles can also be seen in the HAADF STEM images of the 0.7Mg alloy (Figure 9b). However, there is a precipitate band in the other grain boundary areas close to the coarse phases. The EDS mapping images of Figure 9b are displayed in Figure 9d, demonstrating that the Mg–Cu phases make up the coarse secondary phase particles. When the 1.1Mg alloy is aged for 97 h, coarse particles only occur in the grain boundary, as shown in Figure 9c.
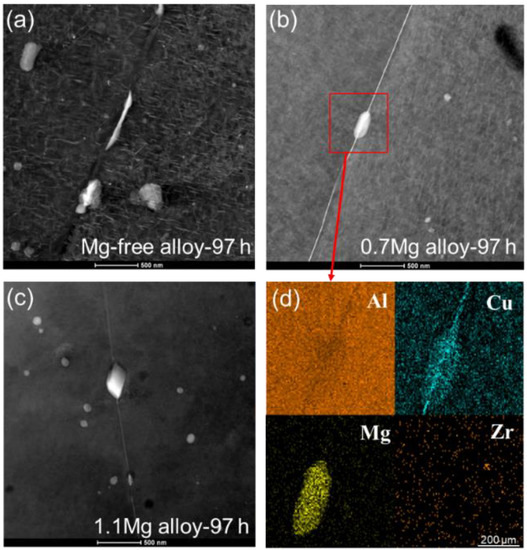
Figure 9.
HAADF STEM images after being aged at 150 °C for 97 h for Al–Cu–Li alloys with different Mg content (Mg-free alloy (a), 0.7Mg alloy (b), 1.1Mg alloy (c)), and corresponding EDS mapping images of Figure 8b (d).
3.4. DSC
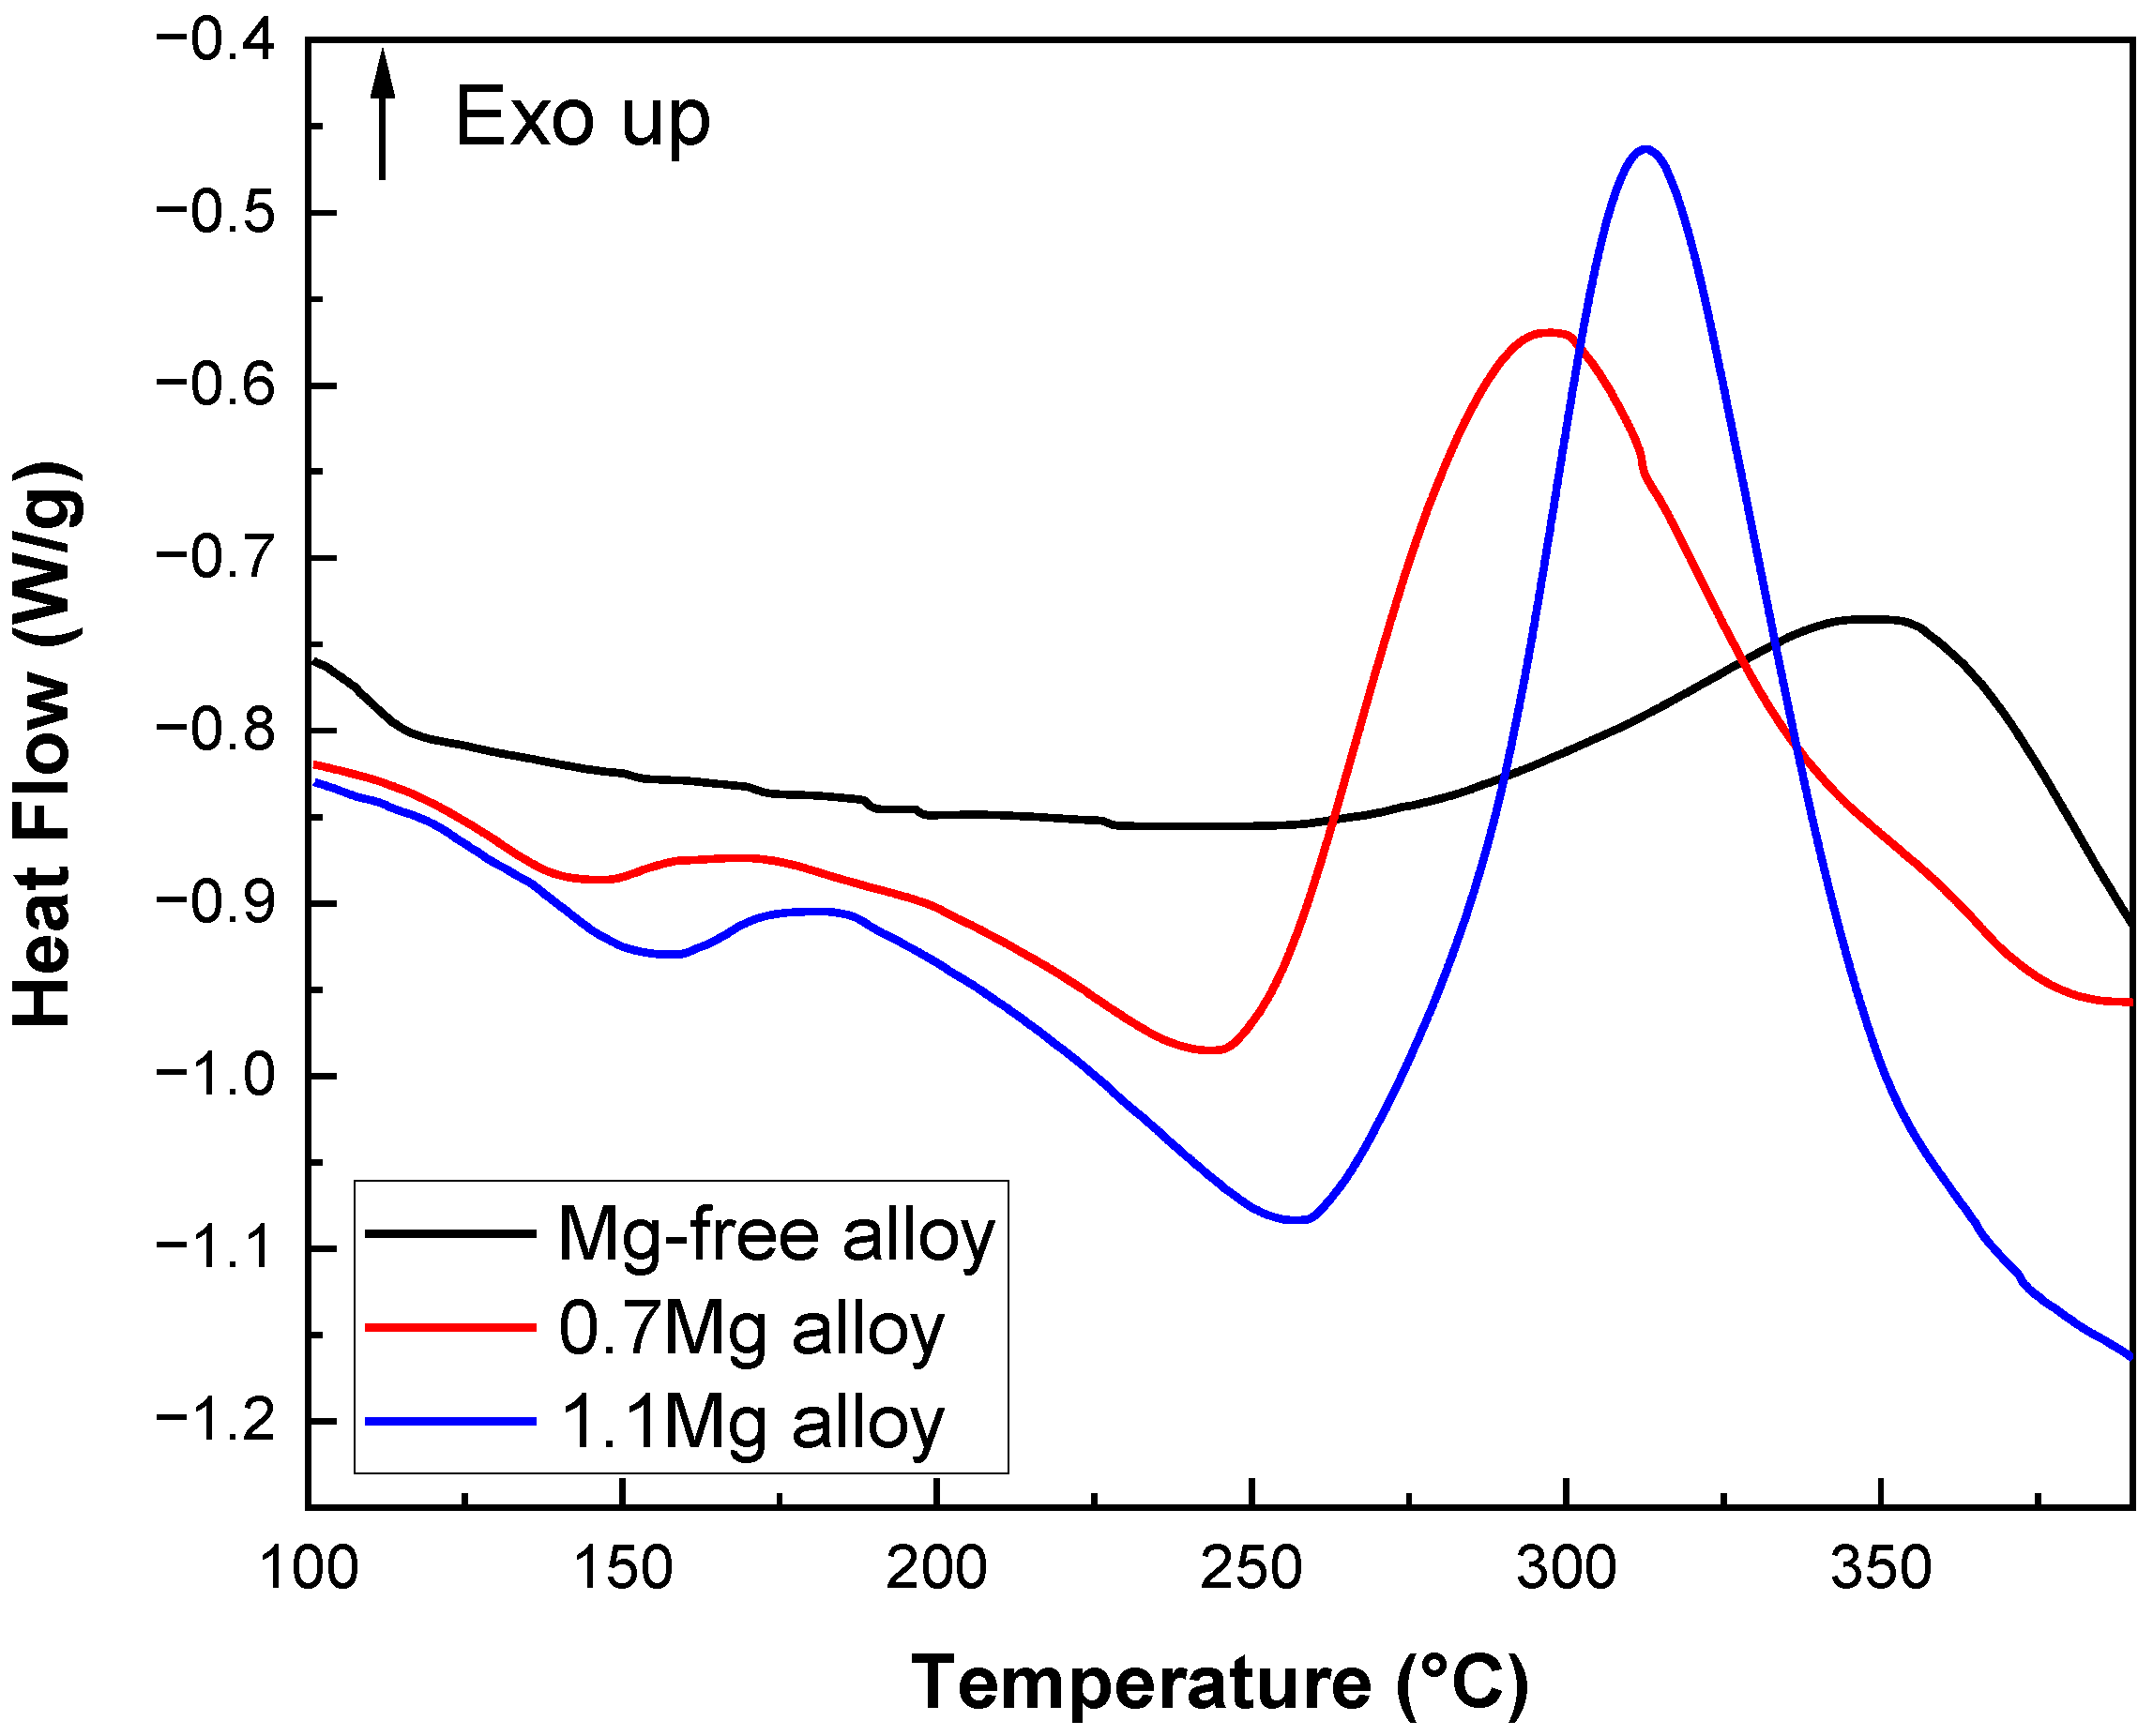
DSC heat flow curves of Al–Cu–Li alloys with different Mg content are shown in Figure 10 (upward is the direction of exothermic). The Mg-free alloy only exhibits an exothermic peak at about 350 °C (peak A) and no observable endothermic peak. The 0.7Mg alloy exhibits a clear exothermic peak at 300 °C (peak C) and an endothermic peak at 150 °C (peak B). The 1.1Mg alloy shows an exothermic peak at 315 °C (peak E) and an endothermic peak between 163 °C (peak D) and 262 °C.
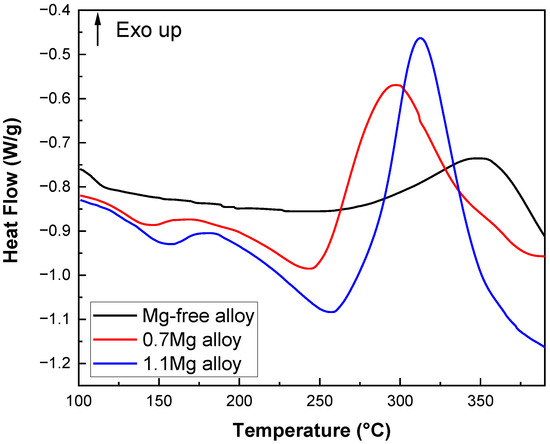
Figure 10.
DSC heat flow curves of Al–Cu–Li alloys with different Mg contents.
4. Discussion
4.1. OCP, Microstructure and Corrosion Mode with the Aging Process
The microstructure of Al–Cu–Li alloys is significantly affected by the aging process, which also changes their electrochemical performance. The type and quantity of precipitates in alloys after various aging times are clearly distinct, as illustrated in Figure 6 and Figure 7. Several studies have simulated the corrosion potential and current density of different precipitates [15], as shown in Table 4. The precipitates at grain boundaries and inside the grains have an important impact on the corrosion behavior. It is hard for corrosion to occur without a sufficient difference of potential, which is typically provided by the precipitates and matrix. The Al–Cu–Li alloys develop a galvanic cell due to a difference of potential, leading to the dissolution of the anode. The main precipitates of the studied Al–Cu–Li alloys in this paper are T1, θ′ and S′ precipitate. The corrosion potential of the T1 and θ′ precipitate is −1.751 VSSCE and −0.744 VSSCE, which normally acts as anode and cathode in corrosion, respectively. The nearby matrix of θ′ precipitate also is regarded as anode due to the higher concentration of Cu. The S′ precipitate is a common phase in 2xxx aluminum alloys, which contain the active element Mg, resulting in the decrease of OCP. Therefore, the OCP and Ecorr dropped as a result of the precipitation during aging process, especially T1 and S′ precipitates [32]. In addition, the distribution of precipitated phases at the grain boundary during the aging process causes a decrease of potential, which further influences IGC susceptibility. This study proved that the coarsening phases and discontinuous precipitates in grain boundaries lead to the decrease of IGC susceptibility, due to the balance of potential between grain boundaries and grains [33,34]. The corrosion mechanism of Al–Cu–Li alloys followed a consistent pattern with aging time for the three alloys: local IGC with pitting → pitting.
Table 4.
Corrosion potential and current density of precipitates phase.
In this work, the three corrosion modes—local IGC with pitting, pitting 1 and pitting 2—are correlated with characteristics of precipitates. T1 precipitates preferentially formed near dislocation, grain boundary and subgrain boundary. Anodic dissolution happens preferentially at grain boundaries because of the large difference of potential between the T1 precipitate and the matrix. Grain boundary potential is lower than the grain due to the continuous distribution of grain boundary phases during the early stage of the aging process. There are seldom intragranular precipitates, resulting in the significant potential variation across grain boundaries and intragranular without precipitates, which then causes high susceptibility to IGC. The corrosion mode turns from IGC to pitting with the aging process. Firstly, the precipitation increases with the aging process, resulting in a lower potential within the grain so that the difference of potential with the grain boundaries was decreased. Secondly, the precipitates at grain boundaries are discontinuous, which obstructs the pathway of corrosion and then reduces IGC susceptibility. The precipitates at grain boundaries become more discontinuous when arriving at over-aged, which leads to less difference of potential between the grain and the grain boundary. It is also insufficient to trigger IGC due to the low intragranular potential. These two factors contribute to the susceptibility to corrosion in grains and two pitting morphologies, which are defined as pitting 1 and pitting 2, respectively. The precipitates at grain boundaries are discontinuous and resistant to corrosion, while the intragranular precipitates are more susceptible to corrosion. Therefore, pitting 1 takes place within the grain, while the corrosion of pitting 2 takes place at both intragranular and intergranular levels.
4.2. OCP, Microstructure, Corrosion Mode with Mg Content
Although Mg is a micro-alloying element in Al–Cu–Li alloys, its concentration has an important effect on the aging precipitates. In the Mg-free alloy, the main precipitate is θ′, while in the 0.7Mg alloy, it is T1. However, S’ increased in the 1.1Mg alloy while the T1 and θ′ precipitates decreased. This suggests that the T1 precipitates may be dramatically accelerated and θ′ precipitates can be significantly inhibited with the addition of proper Mg [27]. Excessive Mg may prevent the production of T1 precipitates while promoting the emergence of θ′ and S′ precipitates [29].
It is proven that the precipitation in Mg-containing alloys increases rapidly compared to Mg-free alloys during artificial aging [35]. Several Mg–Cu vacancy clusters were easily produced after adding trace Mg, which aided in the nucleation process of T1 precipitates. Simultaneously, Mg facilitates the formation of GP zones, which encourages the nucleation process and the increase in nucleation sites of T1 [25]. However, a higher Mg content retards the precipitation process of the T1 precipitates. A single Mg atom has a lower binding energy with a vacancy than a Li atom, which creates Mg-Vacancy atomic pairs in place of Li-Vacancy atomic pairs, and then furthers the growth of Cu–Mg atomic clusters. In addition, the formation of clusters contributes to the nucleation and precipitation of the S′ precipitates since they are precursors of S′ precipitates. Cu atoms are required to generate the T1 and the S′ precipitates, which both develop on the dislocation. The nucleation sites of T1 precipitates are occupied by the precipitation of S′ precipitates, which prevent the precipitation process of T1 precipitates in the early stages of aging. Additionally, the Cu diffusion rate is slowed down by the concentration of atoms in the vicinity of the S′ precipitates, which also prevents the precipitation of T1. The T1 precipitates in the 1.1Mg alloy are still forming after 37 h of aging, but a significant number of S′ precipitates have appeared (Figure 6 and Figure 7). Figure 9 depicts the Mg-rich zone in Mg-containing alloys, which may have an impact on the corrosion sensitivity [36]. Hence, T1 precipitates progressively formed after 97 h of aging because S′ precipitates do not compete with T1 for the Cu atom and nucleation site (Figure 7c).
The evidence that Mg content impacts the precipitation process can be found based on the DSC results. The experiment demonstrates that the T1 precipitates are the main phase of the alloy during the aging process, from ambient temperatures to 375 °C [37,38]. The Mg-free alloy does not exhibit an endothermic peak, but the 0.7Mg alloy and 1.1Mg alloy do. The disintegration of GP zones or atomic clusters that were previously present in the Al–Cu–Li alloys causes endothermic peaks B and D to appear. As a result, it resembles the endothermic peak found in samples that have aged naturally, which denotes the breakdown of solute clusters generated at ambient temperatures [39]. Further evidence that the inclusion of Mg encourages the development of atomic clusters in the alloys is shown in Figure 10 by the exothermic peak of alloys containing Mg. Combining Figure 10 and the literature, peak A has a wider span and correlates to the growth and precipitation processes of T1 precipitates, while peak C and peak E have smaller spans. Peak A might be the peak where T1 and θ′ precipitates first formed, given that the θ′ peak can be seen at 375 °C. The fact that peak A (350 °C) is around 50 °C later than peaks C (300 °C) and E (315 °C) shows that the addition of Mg is thermodynamically more favorable for the nucleation process of the T1 precipitates.
The OCP of Al–Cu–Li alloys with various Mg content reduces quickly in the early aging stage, then gradually lowers to a dynamic stability. In particular, the 0.7Mg alloy and 1.1Mg alloy reach a lower potential than the Mg-free alloy aged for 24 h. The key factors impacting the OCP are the characteristics of inter-metallics [32,40] and the matrix. The precipitates with more negative potential than the matrix will lead to the decrease of the OCP. These two reasons (the aged precipitates and the lower potential of Mg) lead to the decrease of the OCP in the Mg-containing alloy. Figure 6a,b shows that the number of T1 precipitates of the 0.7Mg alloy is greater than that of the Mg-free alloy. Additionally, the potential of the T1 precipitate is around −1.751 VSSCE, which is lower than the matrix (about −0.900 VSSCE). Thus, the OCP of the 0.7Mg alloy decreased dramatically as soon as aging occurred. A small amount of T1 precipitate may be seen in the 1.1Mg alloy, although the amount is still greater than in the Mg-free alloy. Therefore, the OCP of the 1.1Mg alloy is still lower than that of the Mg-free alloy. Correspondingly, the Ecorr gradually decreased with Mg content due to the existence of precipitates. It can be seen from Table 2 that the Icorr of the Al–Cu–Li alloy with different Mg concentration in the early aging period is relatively close. However, the corrosion current density of the samples aged 97 h varies more with the Mg content. The Icorr of the 0.7Mg alloy is as high as 6.656 × 10⁻⁶ A/cm2 while that of the 1.1Mg alloy is only 0.857 × 10⁻⁶ A/cm2, which shows the excellent corrosion resistance of the 1.1Mg alloy and that the 0.7Mg alloy is prone to corrosion. It can be clearly reflected by the IGC tests (Figure 5) that the 0.7Mg alloy has a maximum corrosion depth compared to others. The polarization resistance (Rp) and corrosion rate displayed in Table 2 also show a better corrosion resistance of the 1.1Mg alloy, due to the higher Rp and lower corrosion rate than other alloys.
Some studies have thought that there are two reasons for the corrosion of S′ precipitates [41,42,43]: At first, the S′ precipitates contain Mg and Al, which have a low corrosion potential and are both active elements, so the S′ precipitates act as the anode at the beginning of the corrosion. Then the high corrosion potential Cu content increases, and the S′ precipitates were transformed into the cathode and were protected, resulting in the corrosion of the aluminum base. There is also a view that the S′ precipitates do not dissolve, but the particles around them do. However, the specific corrosion process still needs further research.
5. Conclusions
The OCP, corrosion behavior and microstructure of Al–Cu–Li alloys with different Mg content were investigated in this paper. Based on the study herein, the conclusions are summarized as follows:
- (1)
- The concentration of Mg has an important effect on the aging precipitates. The T1 precipitates are dramatically accelerated and θ′ precipitates can be significantly obstructed with the addition of medium Mg. It is worth mentioning that the process of T1 precipitates was prevented in the alloy with excessive Mg.
- (2)
- The interaction between the low potential of Mg and the acceleration of T1 precipitates produced a negative OCP value in Mg-containing alloys at the early stages of aging. Similarly, the Ecorr of Al–Cu–Li alloy with various Mg content decreased with the aging process and Mg content.
- (3)
- The conversion of the corrosion mode in the Al–Cu–Li alloys is caused by variations in the precipitates at the grain and grain boundaries. Firstly, continuous grain boundaries and low levels of precipitation in the grain result in IGC. Secondly, continuous grain boundaries and higher levels of precipitation in the grain produce pitting 2. Finally, discontinuous precipitates in grain boundaries and higher levels of precipitates in the grain produce pitting 1. The corrosion mode exhibited a similar pattern, from local IGC to pitting with age and time.
- (4)
- The 1.1Mg alloy displayed higher polarization resistance and a lower corrosion rate than the Mg-free alloy and 0.7Mg alloy, which shows that excessive Mg (1.1 wt.%) is beneficial to the corrosion protection of Al–Cu–Li alloys.
Author Contributions
Literature search, figures, study design, data collection, data analysis, data interpretation, writing, R.W.; study design, data collection, Z.L. (Zhenzhen Liu); study design, data collection, data analysis, H.N.; data analysis, manuscript review, D.L.; data analysis, manuscript review, Z.L. (Zhihao Liu); literature search, data collection, Y.M.; study design, manuscript review, J.L.; literature search, study design, manuscript review, R.Z. All authors have read and agreed to the published version of the manuscript.
Funding
This research was funded by the Natural Science Foundation of Hunan Province (grant number 2021JJ40773).
Data Availability Statement
Not applicable.
Acknowledgments
Special thanks are given to Guang Zeng for his support of the DSC test.
Conflicts of Interest
The authors declare that there are no conflict of interest in this work.
References
- Rioja, R.; Liu, J. The evolution of Al-Li base products for aerospace and space applications. Metall. Mater. Trans. A 2012, 43, 3325–3337. [Google Scholar] [CrossRef]
- Chen, Y.; Pan, S.P.; Liu, W.; Liu, X.; Tang, C.P. Morphologies, orientation relationships, and evolution of the T-phase in an Al-Cu-Mg-Mn alloy during homogenization. J. Alloy. Compd. 2017, 709, 213–226. [Google Scholar] [CrossRef]
- Arbo, S.; Tomovic-Petrovic, S.; Aunemo, J.; Dahle, N.; Jensrud, O. On weldability of aerospace grade Al-Cu-Li alloy AA2065 by wire-feed laser metal deposition. J. Adv. Join. Process. 2022, 5, 100096. [Google Scholar] [CrossRef]
- Dursun, T.; Soutis, C. Recent developments in advanced aircraft aluminium alloys. Mater. Des. 2014, 56, 862–871. [Google Scholar] [CrossRef]
- Yin, D.Y.; Liu, H.Q.; Chen, Y.Q.; Yi, D.Q.; Wang, B.; Wang, B.; Shen, F.H.; Fu, S.; Tang, C.; Pan, S.P. Effect of grain size on fatigue-crack growth in 2524 aluminium alloy. Int. J. Fatigue 2016, 84, 9–16. [Google Scholar] [CrossRef]
- El-Aty, A.A.; Xu, Y.; Guo, X.Z.; Zhang, S.H.; Ma, Y.; Chen, D.Y. Strengthening mechanisms, deformation behavior, and anisotropic mechanical properties of Al-Li alloys: A review. J. Adv. Res. 2018, 10, 49–67. [Google Scholar] [CrossRef]
- Zhang, R.; Qiu, Y.; Qi, Y.; Birbilis, N. A closer inspection of a grain boundary immune to intergranular corrosion in a sensitised Al-Mg alloy. Corros. Sci. 2018, 133, 1–5. [Google Scholar] [CrossRef]
- Donatus, U.; Terada, M.; Ospina, C.R.; Queiroz, F.M. On the AA2198-T851 alloy microstructure and its correlation with localized corrosion behaviour. Corros. Sci. 2018, 131, 300–309. [Google Scholar] [CrossRef]
- Ma, Y.; Zhou, X.; Huang, W.; Thompson, G.E.; Zhang, X.; Luo, C.; Sun, Z. Localized corrosion in AA2099-T83 aluminum-lithium alloy: The role of intermetallic particles. Mater. Chem. Phys. 2015, 161, 201–210. [Google Scholar] [CrossRef]
- Zhang, X.; Lv, Y.; Zhou, X.; Hashimoto, T.; Ma, Y. Corrosion behaviour of 2A97-T8 Al-Cu-Li alloy extrusion. J. Alloy. Compd. 2022, 898, 162872. [Google Scholar] [CrossRef]
- Ren, W.; Li, J.F.; Zheng, Z.Q.; Chen, W. Localized corrosion mechanism associated with precipitates containing Mg in Al alloys. Trans. Nonferrous Met. Soc. China 2007, 17, 727–732. [Google Scholar] [CrossRef]
- Buchheit, R.G.; Moran, J.P.; Stoner, G.E. Localized corrosion behavior of alloy 2090-the role of microstructural heterogeneity. Corrosion 1990, 46, 610–617. [Google Scholar] [CrossRef]
- Lin, Y.; Lu, C.; Wei, C.; Zheng, Z. Effect of aging treatment on microstructures, tensile properties and intergranular corrosion behavior of Al-Cu-Li alloy. Mater. Charact. 2018, 141, 163–168. [Google Scholar] [CrossRef]
- Yin, D.; Xiao, Q.; Chen, Y.; Liu, H.; Yi, D.; Wang, B.; Pan, S. Effect of natural ageing and pre-straining on the hardening behaviour and microstructural response during artificial ageing of an Al-Mg-Si-Cu alloy. Mater. Des. 2016, 95, 329–339. [Google Scholar] [CrossRef]
- Li, J.F.; Zheng, Z.Q.; Ren, W.; Chen, W.; Zhao, X.; Li, S. Simulation on function mechanism of T1(Al2CuLi) precipitate in localized corrosion of Al-Cu-Li alloys. Trans. Nonferrous Met. Soc. China 2006, 16, 1268–1273. [Google Scholar] [CrossRef]
- Proton, V.; Alexis, J.; Andrieu, E.; Delfosse, J.; Deschamps, A.; De Geuser, F.; Lafont, M.C.; Blanc, C. The influence of artificial ageing on the corrosion behaviour of a 2050 aluminium-copper-lithium alloy. Corros. Sci. 2014, 80, 494–502. [Google Scholar] [CrossRef]
- de Sousa Araujo, J.; Donatus, U.; Queiroz, F.M.; Terada, M.; Milagre, M.X.; de Alencar, M.C.; Costa, I. On the severe localized corrosion susceptibility of the AA2198-T851 alloy. Corros. Sci. 2018, 133, 132–140. [Google Scholar] [CrossRef]
- Li, J.F.; Zheng, Z.Q.; Na, J.; Chengyu, T. Chengyu, Localized corrosion mechanism of 2×××-series Al alloy containing S(Al2CuMg) and θ′(Al2Cu) precipitates in 4.0% NaCl solution at pH 6.1. Mater. Chem. Phys. 2005, 91, 325–329. [Google Scholar] [CrossRef]
- Zhang, X.; Zhou, X.; Hashimoto, T.; Lindsay, J.; Ciuca, O.; Luo, C.; Sun, Z.; Zhang, X.; Tang, Z. The influence of grain structure on the corrosion behaviour of 2A97-T3 Al-Cu-Li alloy. Corros. Sci. 2017, 116, 14–21. [Google Scholar] [CrossRef]
- Zhang, X.; Zhou, X.; Hashimoto, T.; Liu, B.; Luo, C.; Sun, Z.; Lu, F.; Ma, Y. Corrosion behaviour of 2A97-T6 Al-Cu-Li alloy: The influence of non-uniform precipitation. Corros. Sci. 2018, 132, 1–8. [Google Scholar] [CrossRef]
- Jiang, B.; Wang, C.; Song, R.; Li, S.; Cao, F.; Yi, D. Effect of creep ageing on the corrosion behaviour of an Al-Cu-Li alloy. Corros. Sci. 2022, 202, 110314. [Google Scholar] [CrossRef]
- Zhu, Y.; Poplawsky, J.D.; Li, S.; Unocic, R.R.; Bland, L.G.; Taylor, C.D.; Locke, J.S.; Marquis, E.A.; Frankel, G.S. Localized corrosion at nm-scale hardening precipitates in Al-Cu-Li alloys. Acta Mater. 2020, 189, 204–213. [Google Scholar] [CrossRef]
- Li, J.; Birbilis, N.; Liu, D.Y.; Chen, Y.L.; Zhang, X.H.; Cai, C. Intergranular corrosion of Zn-free and Zn-microalloyed Al–xCu–yLi alloys. Corros. Sci. 2016, 105, 44–57. [Google Scholar] [CrossRef]
- Huang, L.; Huang, J.; Liu, W.; Cao, L.; Li, S. Effect of minor Sc additions on precipitation and mechanical properties of a new Al-Cu-Li alloy under T8 temper. J. Alloy. Compd. 2022, 927, 166860. [Google Scholar] [CrossRef]
- Itoh, G.; Cui, Q.; Kanno, M. Effects of a small addition of magnesium and silver on the precipitation of T1 phase in an Al-4%Cu-1.1%Li-0.2%Zr alloy. Mater. Sci. Eng. A 1996, 211, 128–137. [Google Scholar] [CrossRef]
- Murayama, M.; Hono, K. Role of Ag and Mg on precipitation of T1 phase in an Al-Cu-Li-Mg-Ag alloy. Scr. Mater. 2001, 44, 701–706. [Google Scholar] [CrossRef]
- Gumbmann, E.; Lefebvre, W.; Deschamps, A. The effect of minor solute additions on the precipitation path of an Al-Cu-Li alloy. Acta Mater. 2016, 115, 104–114. [Google Scholar] [CrossRef]
- Donnadieu, P.; Shao, Y.; De Geuser, F.; Botton, G.A.; Lazar, S.; Cheynet, M.; de Boissieu, M.; Deschamps, A. Atomic structure of T1 precipitates in Al-Li-Cu alloys revisited with HAADF-STEM imaging and small-angle X-ray scattering. Acta Mater. 2011, 59, 462–472. [Google Scholar] [CrossRef]
- Wang, X.M.; Li, G.A.; Jiang, J.T.; Shao, W.Z.; Zhen, L. Influence of Mg content on ageing precipitation behavior of Al-Cu-Li-x alloys. Mater. Sci. Eng. A 2019, 742, 138–149. [Google Scholar] [CrossRef]
- Liu, Z.Z.; Li, J.F.; Liu, D.; Ma, Y.; Du, Y.; Chen, Y.; Zhang, X.; Gupta, R.K.; Chen, X.; Zhang, R. Sluggish precipitation strengthening in Al-Li alloy with a high concentration of Mg. J. Mater. Res. Technol. 2021, 11, 1806–1815. [Google Scholar] [CrossRef]
- Ning, H.; Li, J.F.; Ma, P.C.; Chen, Y.L.; Zhang, R.F. Evolution of aging precipitates in an Al-Li alloy with 1.5 wt% Li concentration. Vacuum 2020, 182, 109677. [Google Scholar] [CrossRef]
- Li, J.F.; Li, C.X.; Peng, Z.W.; Chen, W.J.; Zheng, Z.Q. Corrosion mechanism associated with T1 and T2 precipitates of Al-Cu-Li alloys in NaCl solution. J. Alloy. Compd. 2008, 460, 688–693. [Google Scholar] [CrossRef]
- Huang, J.Y.; Ming, W.Q.; Wu, C.L. Effect of microstructure on corrosion behaviour of Al-Cu-Li alloys. Mater. Charact. 2022, 194, 112416. [Google Scholar] [CrossRef]
- Zhang, R.F.; Li, J.F.; Li, Q.; Qi, Y.S.; Zeng, Z.R.; Qiu, Y.; Chen, X.B.; Kairy, S.K.; Thomas, S.; Birbilis, N. Analysing the degree of sensitisation in 5xxx series aluminium alloys using artificial neural networks: A tool for alloy design. Corros. Sci. 2019, 150, 268–278. [Google Scholar] [CrossRef]
- Gumbmann, E.; De Geuser, F.; Sigli, C.; Deschamps, A. Influence of Mg, Ag and Zn minor solute additions on the precipitation kinetics and strengthening of an Al-Cu-Li alloy. Acta Mater. 2017, 133, 172–185. [Google Scholar] [CrossRef]
- da Silva, R.M.P.; Milagre, M.X.; Izquierdo, J.; Betancor-Abreu, A.M.; de Oliveira, L.A.; Araujo, J.V.d.S.; Antunes, R.A.; Souto, R.M.; Costa, I. Surface finishing effects on the corrosion behavior and electrochemical activity of 2098-T351 aluminum alloy investigated using scanning microelectrochemical techniques. Mater. Charact. 2022, 191, 112130. [Google Scholar] [CrossRef]
- Dorin, T.; Deschamps, A.; De Geuser, F.; Lefebvre, W.; Sigli, C. Quantitative description of the T1 formation kinetics in an Al-Cu-Li alloy using differential scanning calorimetry, small-angle X-ray scattering and transmission electron microscopy. Philos. Mag. 2014, 94, 1012–1030. [Google Scholar] [CrossRef]
- Araullo Peters, V.; Gault, B.; Cairney, J.; Deschamps, A.; Cairney, J.M. Microstructural evolution during ageing of Al-Cu-Li-x alloys. Acta Mater. 2014, 66, 199–208. [Google Scholar] [CrossRef]
- Decreus, B.; Deschamps, A.; De Geuser, F.; Donnadieu, P.; Sigli, C.; Weyland, M. The influence of Cu/Li ratio on precipitation in Al-Cu-Li-x alloys. Acta Mater. 2013, 61, 2207–2218. [Google Scholar] [CrossRef]
- Davó, B.; de Damborenea, J.J. Use of rare earth salts as electrochemical corrosion inhibitors for an Al-Li-Cu (8090) alloy in 3.56% NaCl. Electrochim. Acta 2004, 49, 4957–4965. [Google Scholar] [CrossRef]
- Holscher, A.A. A field emission retarding potential method for measuring work functions. Surf. Sci. 1966, 4, 89–102. [Google Scholar] [CrossRef]
- Strayer, R.W.; Mackie, W.; Swanson, L. Work function measurements by the field emission retarding potential method. Surf. Sci. 1973, 34, 225–248. [Google Scholar] [CrossRef]
- Buchheit, R.G.; Grant, R.P.; Hlava, P.F. Local dissolution phenomena associated with S Phase (Al2CuMg) particles in aluminum alloy 2024. J. Electrochem. Soc. 1997, 8, 2621–2627. [Google Scholar] [CrossRef]


Disclaimer/Publisher’s Note: The statements, opinions and data contained in all publications are solely those of the individual author(s) and contributor(s) and not of MDPI and/or the editor(s). MDPI and/or the editor(s) disclaim responsibility for any injury to people or property resulting from any ideas, methods, instructions or products referred to in the content. |
© 2023 by the authors. Licensee MDPI, Basel, Switzerland. This article is an open access article distributed under the terms and conditions of the Creative Commons Attribution (CC BY) license (https://creativecommons.org/licenses/by/4.0/).