Article

Effectiveness of Design Procedures in Counteracting Second Order Effects in Steel Moment Resisting Frames

Department of Civil Engineering and Architecture, University of Catania, 95100 Catania, Italy
*
Author to whom correspondence should be addressed.
Metals 2023, 13(2), 321; https://doi.org/10.3390/met13020321
Submission received: 27 December 2022 / Revised: 25 January 2023 / Accepted: 1 February 2023 / Published: 4 February 2023

Abstract

:
The seismic response of structures is always influenced by second order (P–Δ) effects. The importance of these effects becomes significant when the structure experiences large plastic deformations. Seismic codes indicate that P–Δ effects may be counteracted by means of an increase of the lateral strength required by a first order analysis, but the expressions of the Strength Amplification Factor (SAF) given in codes are often criticized by researchers. This paper proposes and validates a formulation of the SAF for Moment Resisting Frames (MRFs), which is a generalization of that derived in the past by some of the authors based on the response of SDOF systems. To this end, in a first stage of the research a set of steel MRFs is designed and analyzed neglecting P–Δ effects. The seismic response is determined by nonlinear static and incremental dynamic analyses and the mean annual frequency of exceedance of the Significant Damage (SD) and Near Collapse (NC) limit states is computed. In a second stage, each structure is re-designed and analyzed considering P–Δ effects. P–Δ effects are counteracted in design according to provisions of European, American and Canadian seismic codes or according to other formulations proposed in literature, such as that proposed by Bernal and that proposed by the authors. The accuracy of the design provisions accounting for P–Δ effects is determined by comparing the response of the structures designed in the first and in the second stages.

1. Introduction

When analyzing the seismic response of structures, equilibrium equations should be written with reference to the deformed configuration of the system because the common hypothesis that lateral displacements are small may become unrealistic. In fact, the overturning moment due to gravity loads produces an increase of the lateral displacements obtained from a first order analysis and, consequently, a reduction of the lateral stiffness (P–Δ effect).
Most of the studies carried out in the past and intended to estimate the influence of P–Δ effects on the seismic response of structures were carried out on Single Degree of Freedom systems (SDOFs) [1,2,3,4,5,6,7,8,9], which generally consist of a rigid bar connected to the base through a pin-connection and a rotational spring (Figure 1a). In these systems, the rotational spring is characterized by an elastic perfectly plastic behavior and the sensitivity to second order effects is measured by the elastic Interstory Drift Sensitivity Coefficient (IDSC) θel.
θ el = P u 0 V h
where u0 is the lateral top displacement of the elastic system, P and V are the vertical and lateral forces applied on the top of the SDOF system and h is the height of the system. For the considered SDOF system, the elastic IDSC also represents the ratio of the post-yielding stiffness to the elastic stiffness (Figure 1b). Thus, it is intended to represent a measure of the sensitivity of the structural response to P–Δ effects in both the elastic and inelastic ranges of behavior.
Different design strategies have been proposed to counterbalance P–Δ effects based on the seismic response of the abovementioned systems. In particular, an increase of either the lateral strength or the lateral stiffness of the system, or both, has been proposed. Bernal [1] proposed a Strength Amplification Factor (SAF), which is calculated as a function of the elastic IDSC and the ductility demand μ of the system as follows.
α B ( μ , θ el ) = 1 + 1.87 ( μ 1 ) θ el 1 θ el
A limit on the maximum ductility demand is also proposed to ensure that permanent displacements will not undermine the gravity load carrying capacity of the system.
Fenwick et al. [3] proposed to mitigate the Strength Amplification Factor of SDOF systems characterized by long periods of vibration. Research studies also investigated the influence of (1) the hysteretic model adopted [5], (2) the vertical seismic acceleration [6] and (3) the equivalent viscous damping ratio [2].
A new formulation of the SAF was proposed in reference [8] by some of the authors. The SAF was calibrated so that, for a given seismic intensity, the ductility demand of the system designed and analyzed considering P–Δ effect be equal to the ductility demand of the system designed and investigated neglecting P–Δ effects. According to this formulation, the SAF αm is equal to the static amplification factor αel times a coefficient Cm depending on the equivalent viscous damping ratio ξ, the ductility demand μ and the inelastic IDSC θ, i.e.,
α m = C m ( ξ , μ , θ ) α el
where
α el = 1 1 θ el
C m = 1 + θ ( 0.025 μ 2 + 0.45 μ 2.6 ξ 0.65 ) α el
In the above relationships, θ is the inelastic IDSC, i.e., the product of the elastic IDSC θel and the behavior factor.
Only a few studies were carried out to estimate the influence of second order effects in multi-story structures. Regarding steel Moment Resisting Frames (MRFs), it has been pointed out that these structures mainly differ from SDOF systems because of two reasons. The first is related to the significant overstrength that generally characterizes MRFs. Indeed, SDOF systems are designed to sustain the design base shear force only, while multi-degree of freedom systems (MDOFs) are designed based on different design situations (e.g., gravity loads in the non-seismic design situation) [10]. The adoption of commercial profiles with predefined cross-sections further increases the overstrength of the system. The second reason is related to the nonlinear response of the MDOFs. Indeed, in the absence of P–Δ effects, the nonlinear response of SDOF systems is generally represented by an elastic-perfectly plastic relationship. Thus, once yielding has developed a sudden decrease of stiffness occurs because of P–Δ effects and the slope of the post-yield stiffness becomes negative and provided by the elastic IDSC. Conversely, in MRF systems designed according to capacity design principles, yielding gradually spreads at the ends of beams and at the base of first story columns. This leads to a nonlinear hardening behavior [10]. In addition, in MDOFs the sensitivity to P–Δ effects depends on the collapse mechanism [11,12]. These aspects are often neglected in provisions given by seismic codes. To overcome these limits, a rigorous accounting of second-order effects was proposed [12] based on the concept of collapse mechanism equilibrium curve, which is the base of the Theory of Plastic Mechanism Control.
In this paper, the design procedure proposed in [10] to counterbalance second order effects in steel MRFs is more in detail formulated. The effectiveness of the procedure is also validated based on the results of both nonlinear static and Incremental Dynamic Analyses (IDA). Further, the effectiveness of the design procedure is compared to that of provisions given in some seismic codes and to that resulting from the application of the SAF proposed by Bernal.

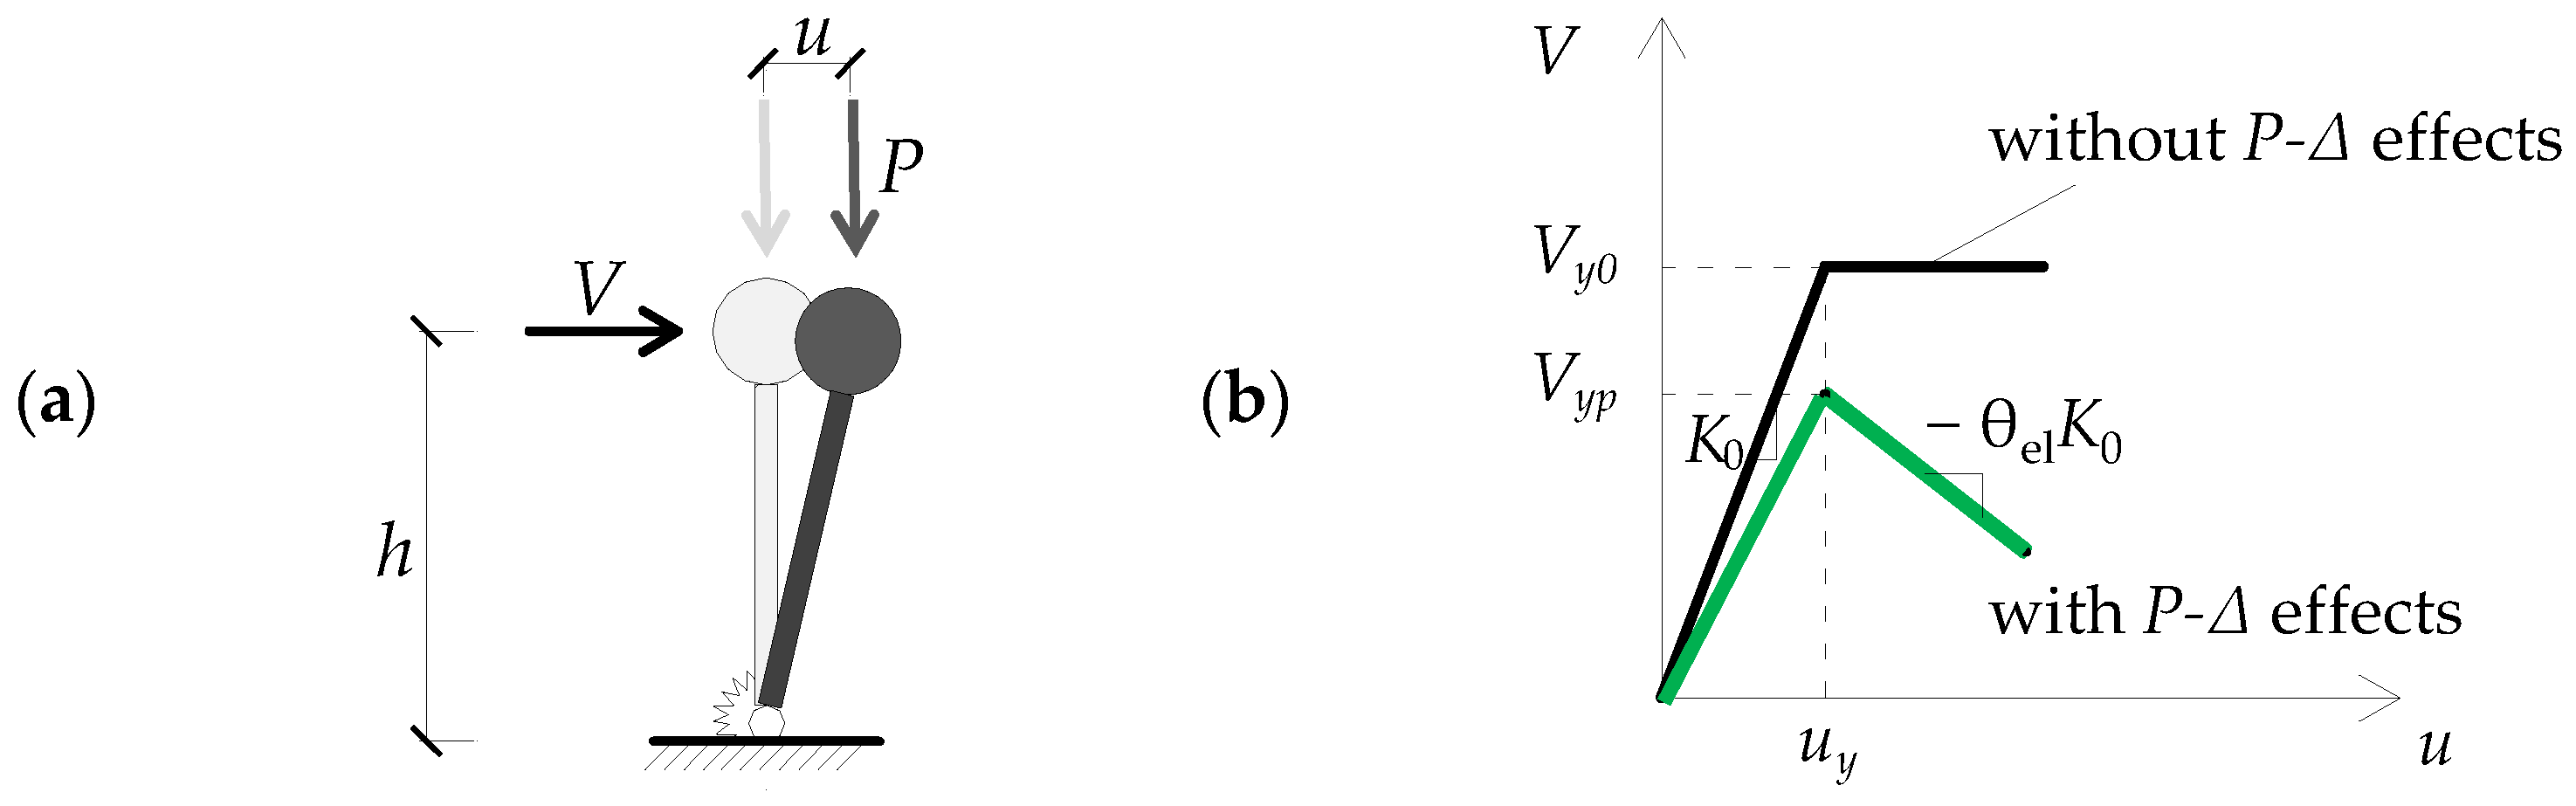
2. P–Δ Effects in Seismic Codes

Seismic codes generally require to amplify internal forces and displacements determined by the design analysis by means of a SAF that depends on IDSC.
As an example, in the current version of Eurocode 8 (EC8) [13], in the draft of the new version of EC8 [14] and in American standard ASCE/SEI 2010 [15], the SAF α is calculated as
α = 1 / ( 1 θ )
However, the abovementioned codes use different measures of the IDSC. Specifically, in the current version of EC8 [13], the IDSC is calculated at each story as
θ EC 8 = P Δ u EC 8 V d h
where P is the total gravity load at and above the story considered in the seismic design situation, Vd is the total seismic design story shear, h is the interstory height and ΔuEC8 is the inelastic interstory drift produced by the seismic design forces, i.e., the elastic design interstory drift Δud produced by the shear force Vd times the displacement behavior factor qdisp
q disp = { q if T 1 T C 1 + ( q 1 ) T C T 1 if   T 1 < T C
In the equation above, q is the behavior factor, T1 is the first period of vibration of the system and TC is the corner period at the upper limit of the constant acceleration region of the elastic spectrum.
Equation (7) implicitly assumes that the nonlinear static response of the MDOFs determined by a first order analysis is simulated by means of a bilinear curve characterized by a plastic resistance equal to Vd. In other words, the overstrength as well as the hardening behavior of MRFs designed to provide a global collapse mechanism are neglected. Further, the SAF provided by Equation (6) is such that, in the system with P–Δ effects, the shear strength of the ideally defined system with elastic perfectly plastic behavior is equal to Vd at the occurrence of the displacement demand Δud.
According to EC8, no amplification of the seismic action effects is required if θEC8 ≤ 0.1. If 0.1 < θEC8 ≤ 0.2, second order effects may be considered in a simplified way by means of the SAF given in Equation (6). If θEC8 > 0.2, the simplified approach is not applicable, and a second order analysis is needed. Values of θEC8 > 0.3 cannot be accepted.
In the draft of the new version of EC8 [14], the expression of the IDSC has been modified to consider the effect of the overstrength and hardening behavior due to the gradual yielding of beam ends [16]. These two effects are considered by multiplying the design story shear by the rates of the behavior factor named as qs and qr.
θ EC 8 , 2020 = P Δ u EC 8 q r q s V d h
For steel MRFs, factors qs and qr are assumed equal to 1.5 and 1.3, respectively. Once again, no amplification of the seismic action effects is required if θEC8,2020 ≤ 0.1. If 0.1 < θEC8,2020 ≤ 0.2, second order effects may be considered in a simplified way by the strength amplification factor given in Equation (6). If θEC8,2020 > 0.2, the simplified approach is not applicable, and a second order analysis must be performed. Values of θEC8,2020 > 0.3 cannot be accepted.
The mathematical expression of the IDSC given in the American code ASCE/SEI 7-2010 [15] is formally the same as that reported in EC8; however, the design story shear Vd is multiplied by the deflection amplification factor Cd and the IDSC is calculated by the following relation.
θ ASCE = P Δ u ASCE V d h C d
where ΔuASCE is the elastic design interstory drift times the deflection amplification factor. In other words, θASCE is based on the elastic stiffness of the system.
The above code does not require any amplification of the seismic action effects if θASCE ≤ 0.1. Values of θASCE larger than the minimum value between 0.5/(β Cd) and 0.25 cannot be accepted, where β is the story shear demand to capacity ratio.
Finally, according to the Canadian building code (NBC) [17] and steel design standard (CSA) [18], P–Δ effects are accounted for by the U2 amplification factor.
U 2 = 1 + C f R d Δ f V f h
where Cf is the cumulated compressive force associated with the gravity component of load case in the seismic design situation, Vf is the story shear force, Δf is the interstory drift produced by the lateral forces and Rd is the ductility-related force amplification factor.
It should be noted that, in the case of long period systems (T1 > Tc) the term C f R d Δ f / V f h s is equivalent to the coefficient θEC8,2020. Indeed, the behavior factor q that amplifies the displacement demand in Equation (9) is obtained as qs qr qd, where qd is the behavior factor component accounting for the deformation capacity and energy dissipation capacity. Differently from the new draft of EC8, the stiffness of the structure is deemed to be acceptable if U2 is smaller than 1.40.

3. The Proposed Procedure

The proposed procedure to counterbalance P–Δ effects is summarized in Figure 2 and is an extension of the one derived in [8] based on the response of SDOF systems. In particular, the procedure requires the following steps:
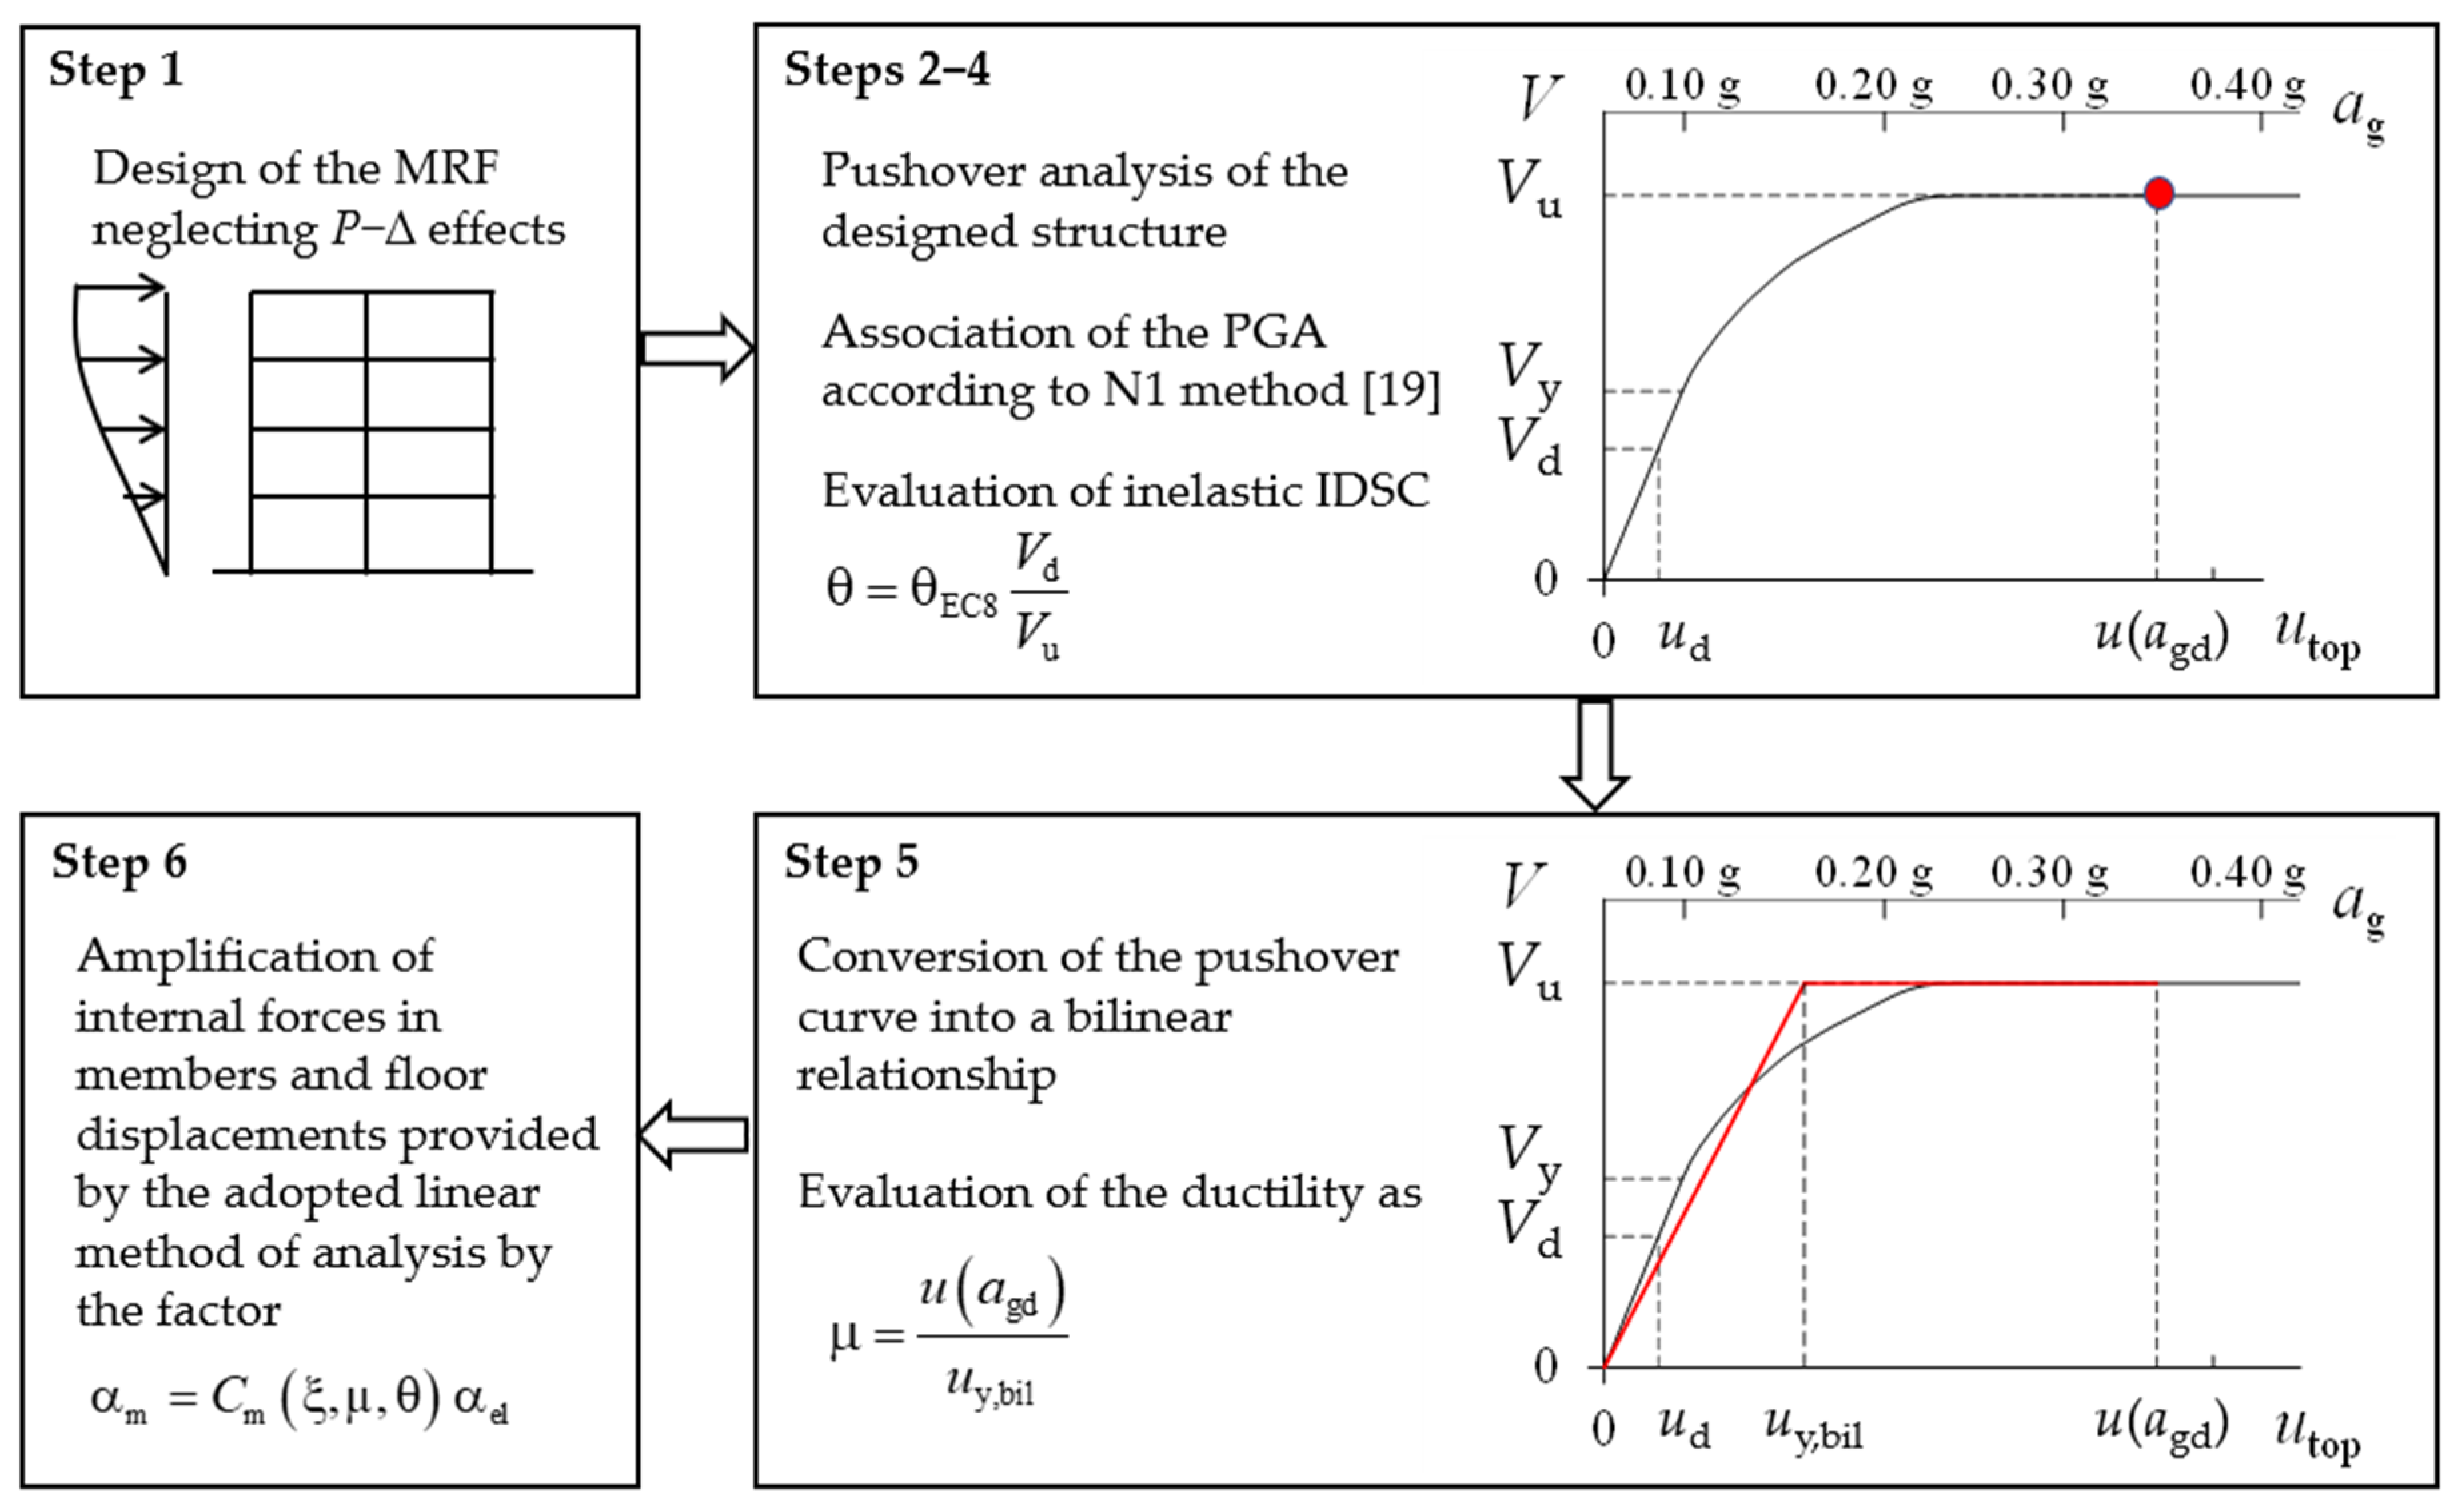
  • MRFs are preliminarily designed based on internal forces derived by a first order analysis (with a design base shear equal to Vd);
  • A pushover analysis of the designed structure is carried out assuming a distribution of equivalent horizontal seismic forces proportional to the first mode of vibration. The Peak Ground Acceleration (PGA) associated with the points of the pushover curve is determined according to the N1 method [19];
  • The base shear corresponding to the top displacement u(agd) associated with the design value of the PGA, agd, is considered as the ultimate lateral strength Vu;
  • The interstory drift sensitivity coefficient to be used in Equation (5) is
θ = θ EC 8 V d V u
5.
The pushover curve is transformed into a bilinear relationship in the relevant range of displacements and the ductility demand μ is determined as the ratio of the inelastic displacement demand to the top displacement at yield (uy,bil);
6.
Internal forces in members and floor displacements provided by the linear method of analysis are increased by means of the amplification factor given in Equation (3).
It should be noted that, in keeping with the approach followed for SDOF systems, the proposed amplification depends on the seismic intensity and is intended to lead to a structure that has the same ductility demand μ of the equivalent structure designed and analyzed neglecting P–Δ effects.

4. Methodology

To validate the proposed procedure, steel MRFs characterized by different values of IDSC are analyzed following the procedure summarized below:
  • Step #1a: Each structure is designed by modal response spectrum analysis without P–Δ effects;
  • Step #1b: The seismic response of the structures above is determined by either nonlinear static or nonlinear incremental dynamic analysis without P–Δ effects. The response and the performance levels of these structures are assumed as the target in following analyses;
  • Step #2a: Each structure is redesigned considering P–Δ effects in keeping with provisions of seismic codes or according to the formulation proposed by Bernal or that proposed by the authors;
  • Step #2b: The nonlinear seismic response of the structures designed in Step 2a is determined with P–Δ effects.
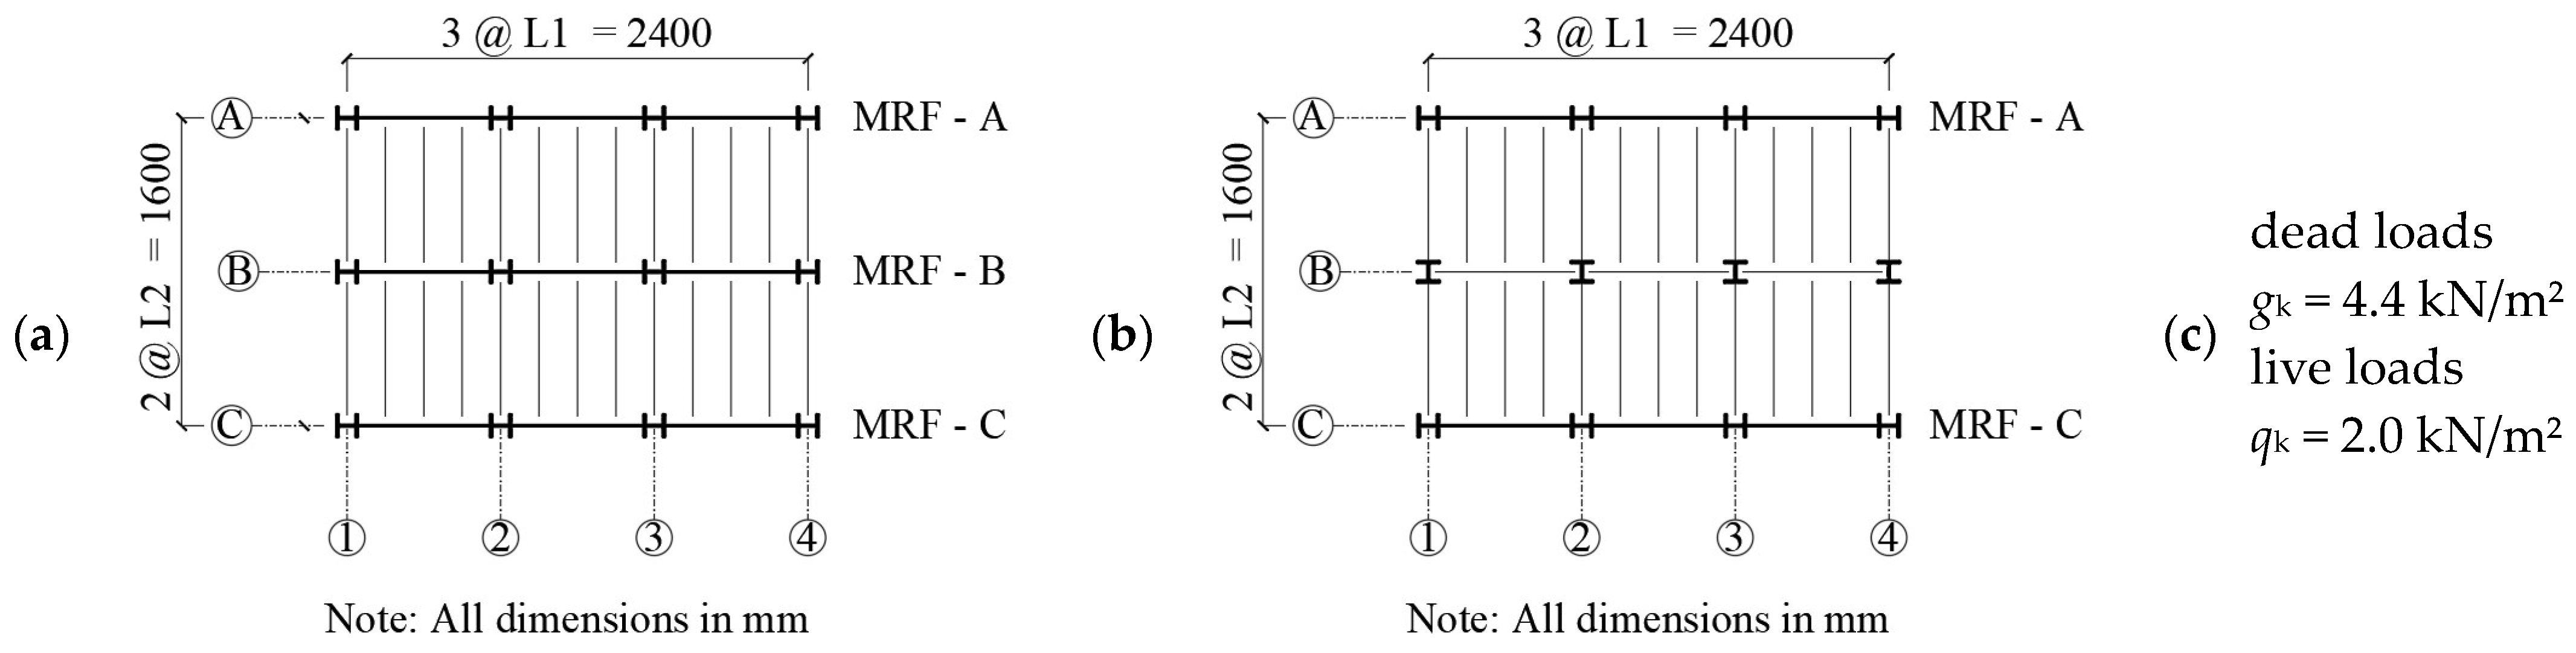
If P–Δ effects are properly considered in the design phase, the performance levels obtained by structures designed and analyzed in Step #2 should be similar to the target values (i.e., to the performance of structures designed and analyzed in Step #1).

5. Case-Study

To investigate systems characterized by different values of IDSC, the considered steel MRFs are extracted from two layouts of buildings. In the first case (Figure 3a), an interior moment resisting frame (MRF-B) is considered; in the second case (Figure 3b), instead, the moment resisting frame located along the perimeter of the building (MRF-A) is designed. The number of levels is equal to 4 or 6 and the interstory height h is equal to 3.3 m. The same loads are considered at all stories (Figure 3c).
Buildings are founded on soft soil (Soil C according to EC8) and are located in a high seismicity area characterized by a PGA equal to 0.35 g for seismic events with a probability of exceedance of 10% in 50 years. MRFs are designed to fulfill both the Ultimate Limit State requirement and the Damage Limitation (DL) requirement.

5.1. Buildings Designed without P−Δ Effects

All the buildings are first designed according to the provisions of the current version of EC8 and neglecting P–Δ effects. Internal forces in beams are determined by modal response spectrum analysis assuming a value of the behavior factor q equal to 5.5. This value is lower than the maximum value suggested in EC8 because structures designed with higher values of q would not satisfy the DL requirement.
Beams cross-sections are selected to sustain bending moments produced by (1) gravity loads in the non-seismic design situation and (2) the combined effects of gravity loads (MEd,G) and seismic actions (MEd,E) in the seismic design situation.
At the ends of beams the overstrength is calculated as
Ω = M pl , Rd M Ed , G M Ed , E
where Mpl,Rd is the plastic flexural resistance of the beam.
Columns cross sections are designed to sustain shear force VEd and the combined effect of axial force NEd and bending moment MEd evaluated according to capacity design principles. Specifically, the contribution provided by the seismic action to the internal forces is amplified by 1.1 γov Ωmin, where Ωmin is the minimum value of the overstrength of all the beams in which dissipative zones are located and γov is the material overstrength factor, assumed equal to 1.25, i.e.,
N Ed = N Ed , G + 1.1 γ ov Ω min N Ed , E M Ed = M Ed , G + 1.1 γ ov Ω min M Ed , E V Ed = V Ed , G + 1.1 γ ov Ω min V Ed , E
Further, to promote a collapse mechanism in which dissipative zones are located at the ends of beams, it has been verified that the sum of the design values of the plastic resistances M N , Rd c of the columns (reduced because of the axial load) framing into the joint be larger than 1.3 times the sum of the plastic resistances of the beams framing into the same joint, i.e.,
M N , Rd c 1.3 M pl , Rd
Moment resisting frames are also designed to fulfil the DL requirement. In particular, interstory drifts produced by seismic events with a probability of occurrence of 63% in 50 years are verified to be smaller than 0.010 times the interstory height h.
To consider the lower return period of the seismic action associated with the DL limit state, the inelastic interstory drifts determined by the design method of analysis Δu are reduced by means of a coefficient ν. Based on the analysis of seismic parameters on the Italian territory, the parameter ν is assumed equal to 0.28.
The fundamental period of vibration of the designed structures (T1), the structural weight (Ws), the minimum overstrength of all the beams in which dissipative zones are located, and the IDSC determined according to the different considered formulations are summarized in Table 1. In particular, to consider the effects of different steel grades on the weight of the equivalent structure with steel grade S235, the weight of the single members is multiplied by the ratio fy/235, where fy is the characteristic value of the yield strength of steel in MPa.
As a general trend, interior moment resisting frames are characterized by a larger overstrength because the selection of the beam cross-sections is often governed by the bending moments produced by the gravity loads in the non-seismic design situation.

5.2. Buildings Designed with P−Δ Effects

The structures presented in the previous sub-section have been redesigned considering P–Δ effects. The percentage increase in the structural weight of frames designed including P–Δ effects according to the different considered procedures is reported in Table 2.
Based on EC8 requirements, only for one of the considered buildings, i.e., MRF-B-4st, the seismic effects can be amplified by the SAF (θEC8 < 0.20). Due to the overstrength of the beams (Ωmin = 1.56), the increase produced by the SAF in the seismic internal forces did not require any modification of the selected cross-sections. When considering perimeter MRFs, instead, the application of the code provisions has required an increase of the lateral stiffness in order to reduce the IDSC. In the case of the 6-story interior MRF (MRF-B-6st), which is characterized by 0.20 < θEC8 < 0.30, the lateral stiffness of the frame has been only moderately increased. This increase is not strictly necessary but has been considered here to reduce θEC8 below 0.2 so that P–Δ effects can be accounted for by the simplified approach given in EC8. According to the authors, this choice is in keeping with the design approach followed by practical engineers. As a result, the percentage increase in the structural weight is up to 32%.
When the procedure reported in the draft of the new EC8 is used, a moderate increase in the lateral stiffness is assigned only in the case of frame MRF-A-6st (θEC8,2020 > 0.20). An increase of strength is required for frames MRF-A-4st and MRF-B-6st, with SAF equal to 1.23 and 1.17, respectively. To account for this increase, the steel grade of some cross-sections has been increased for frame MRF-A-4st, whereas no modifications has been required in the case of frame MRF-B-6st.
When ASCE procedure is used, no increase is required in the cross-sections because θASCE < 0.10 for all the considered buildings.
According to the NBC and CSA standard, all the structures have adequate lateral stiffness because U2 is always lower than 1.4. Accordingly, only the strength of the frames has been increased considering the relevant SAF. Due to the overstrength of the systems designed neglecting second order effects, only in the case of MRF-A-4st and MRF-A-6st the steel grade of a few members has been increased.
The use of the formulation proposed by Bernal leads to SAFs ranging from 1.06 (MRF-B-4st) to 1.24 (MRF-A-6st). Such values of SAF required the increase of the steel grade of a few members in structure MRF-A-4st, leading to the same structure designed according to Canadian Standard. In the case of MRF-A-6st, the use of the same formulation required an increase of (i) some beams cross-sections and (ii) the steel grade of interior columns at lower stories. It should be noted that the increase of the beam cross-section was preferred to the increase of the beam steel grade to reduce the overall required modification with respect to the original design.
Finally, when the proposed procedure is used, the target PGA is assumed equal to 0.35 g. As a consequence, the maximum values of θpro are in the range from 0.05 to 0.27 and the corresponding SAFs are in the range from 1.02 (MRF-B-4st) to 1.10 (MRF-A-6st), but no modification is required in the design due to the overstrength of members. Hence, these frames are identical to those designed by ASCE procedure.

6. Numerical Analyses and Response Parameters

The seismic response of the considered frames has been determined by either nonlinear static or incremental dynamic analysis. The single analysis is carried out by the OpenSEES computer program [20].
Beams and columns are modelled as ‘Beam with Hinges’ elements. The length Lpl of the plastic hinge is equal to the cross-section depth. Within the hinge region, the cross-section is discretized into fibers. The Menegotto-Pinto uniaxial material [21], named Steel02 in OpenSEES, is assigned to the fibers. Specifically, the strength of the material is set equal to the characteristic value of the yield strength of steel, the elastic modulus is equal to 210,000 MPa, the strain hardening ratio is equal to 0.3% and the coefficients R0, cR1 and cR2, which control the transition from the elastic to the plastic branch of behavior are equal to 20, 0.925 and 0.15, respectively. No isotropic strain hardening is considered.
To simulate the rigid deck, the ends of the beams are constrained to develop equal horizontal displacements. However, to avoid fictitious axial forces in beams, a horizontal translational uniaxial spring characterized by low axial stiffness is inserted at the first end of these members [22].
A linear transformation is assigned to beams and columns. To simulate P–Δ effects a leaning column is added to the model. The gravity load applied at each story of the leaning column is that corresponding to the seismic mass.
When the nonlinear static analysis is carried out, the distribution of forces is proportional to the first mode of vibration of the structure.
When nonlinear incremental dynamic analyses are considered, the seismic input consists of 30 artificially generated ground motions, which are compatible with the elastic spectrum defined in EC8 for Soil C and equivalent damping ratio equal to 5%. Details about the considered ground motions are reported in reference [8].
Mass is lumped at floor levels and viscous damping forces are calculated by means of the Rayleigh formulation considering the committed stiffness matrix. An equivalent viscous damping ratio equal to 0.03 is fixed for the first and second modes of vibration of the systems.
The response is determined in terms of plastic rotation demand-to-capacity ratios (DI = θpllim) at the ends of beams and columns. In particular, the plastic rotation demand θpl is calculated as
θ pl ( t ) = [ χ ( t ) M ( t ) E I ] L pl
where χ and M are the curvature and the bending moment recorded at the integration point located at the ends of the member at the generic time t, I is the moment of inertia of beam or column cross-sections and E is the elastic modulus of steel.
The rotation capacity θlim of beams and columns with axial load ratios lower than 0.3 is determined according to EC8-part 3 [23] for the NC limit state, i.e.,
θ lim = 8 θ y for class 1 cross - sec tions θ lim = 3 θ y for class 2 cross - sec tions
In the equation above, θy is the chord rotation at yield, calculated as a function of the plastic resistance of the cross-section MN,Pl,Rd (reduced because of the axial load) and of the length L of the member:
θ y = M N , Pl , Rd L 6 E I
A value of DI equal to 1.0 is representative of the achievement of the NC limit state; a value of DI equal to 0.75 is representative of the achievement of the Significant Damage (SD) limit state.

7. Response of the Considered Structures

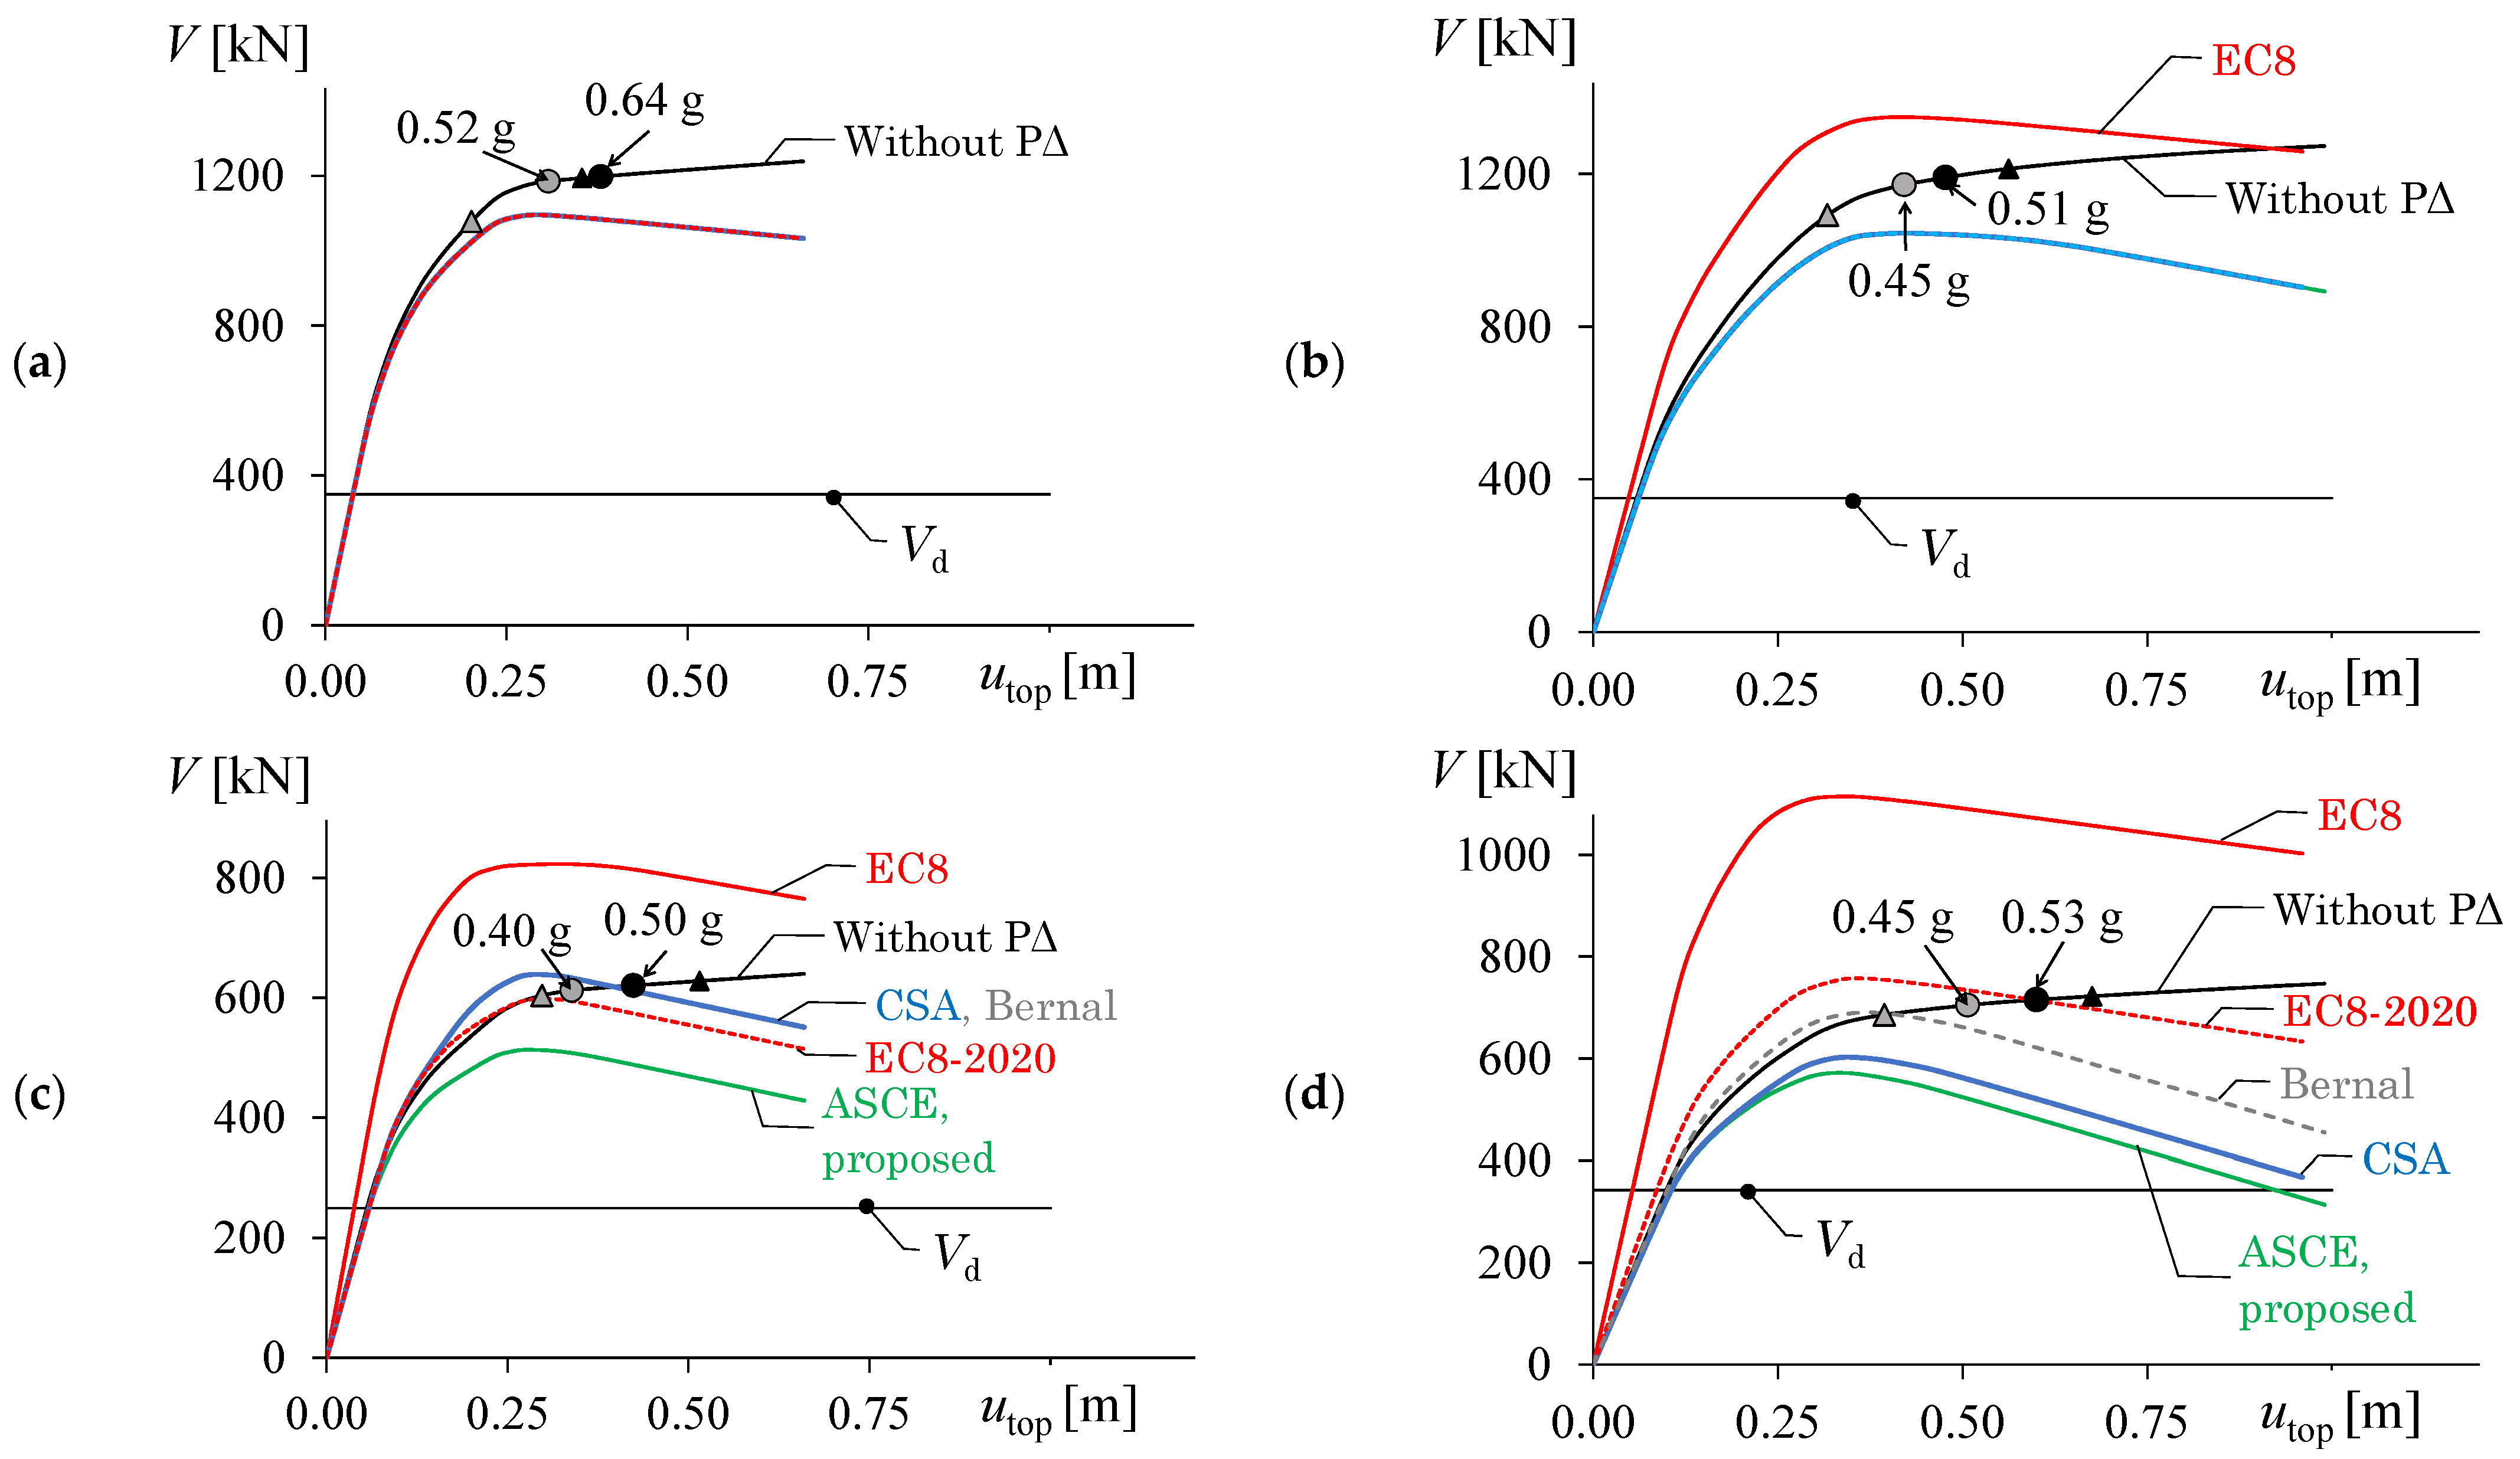
7.1. Capacity Curves

The response of the considered structures in terms of pushover curve is represented in Figure 4. For each structure, a maximum number of 6 curves is plotted. The continuous solid black line represents the response of structures designed and analyzed neglecting P–Δ effects. The red solid and dashed lines represent the response of the structures re-designed considering P–Δ effects using the provisions reported in the current and upcoming version of EC8, respectively; the blue line represents the response of structures in which P–Δ effects are considered according to NBC and CSA standard. The green line represents the response of structures designed according to ASCE code or the proposed procedure, the dashed grey line represents the response of structures designed based on Bernal’s SAF. In cases where the provisions given in the upcoming version of EC8 and in CSA codes or the SAFs proposed by Bernal lead to a structure equal to that obtained by the proposed procedure, the corresponding curves are not reported.
In the pushover curve representing the response of the structure designed and analyzed neglecting P–Δ effects four points are highlighted. Specifically, grey and black dots pinpoint the first achievement of a plastic rotation demand equal to the plastic rotation capacity at the SD and NC limit states, respectively. The PGA corresponding to the achievement of these capacities (ag,SD and ag,NC) is also reported for the sake of completeness. Grey and black triangles, instead, pinpoint the seismic demand related to PGA equal to 0.35 g (grey triangle) and 0.60 g (black triangle). The first value of the PGA is the one considered in the design phase and for this seismic intensity the structures are expected to fulfil the SD limit state. The PGA equal to 0.60 g corresponds to seismic excitations with a probability of exceedance of 2% in 50 years. For this intensity level, structures are expected to fulfil the NC limit state. Finally, the design value of the base shear is reported by a horizontal line.
All the structures designed and analyzed neglecting P–Δ effects fulfil the SD limit state (grey dots are located at the right of grey triangles). Indeed, the PGA leading to a plastic rotation demand-to-capacity ratio equal to 0.75 is in the range from 0.40 g to 0.52 g. In regard to the NC limit state, only in a single case (MRF-B-4st) the PGA leading to the achievement of the limit rotation capacity is higher than 0.60 g. However, the PGA is always higher than 0.45 g, i.e., the value corresponding to seismic excitations with a probability of exceedance of 5% in 50 years. This latter probability of exceedance is that associated with the NC limit state according to the Italian seismic code.
To estimate the accuracy of the considered design provisions, Figure 5 shows the comparison of the PGA leading to the SD and NC limit states of structures designed and analyzed considering P–Δ effects ( a g , SD P Δ , a g , NC P Δ ) to that of structures designed and analyzed neglecting P–Δ effects.
The figure shows that when the ASCE and the proposed procedure are used (green bars) the ratios of the PGAs a g , SD P Δ and a g , NC P Δ to the corresponding values obtained for structures designed and analyzed neglecting P–Δ effects are always close to unity; in the worst case, the P–Δ effects produce a reduction of the PGA leading to SD and NC limit states equal to 10% and 12% respectively. However, in any case a g , SD P Δ is larger than 0.35 g and a g , NC P Δ is larger than 0.45 g.
When the provisions of the current version of EC8 are used (red bars) a significant increase in the values of a g , SD P Δ and a g , NC P Δ (up to 50%) is achieved. This confirms that these provisions are over-conservative. A moderate increase in the abovementioned PGA is achieved when the provisions provided in CSA, in the upcoming version of EC8 and suggested by Bernal are used (dashed red, blue and dashed grey bars).

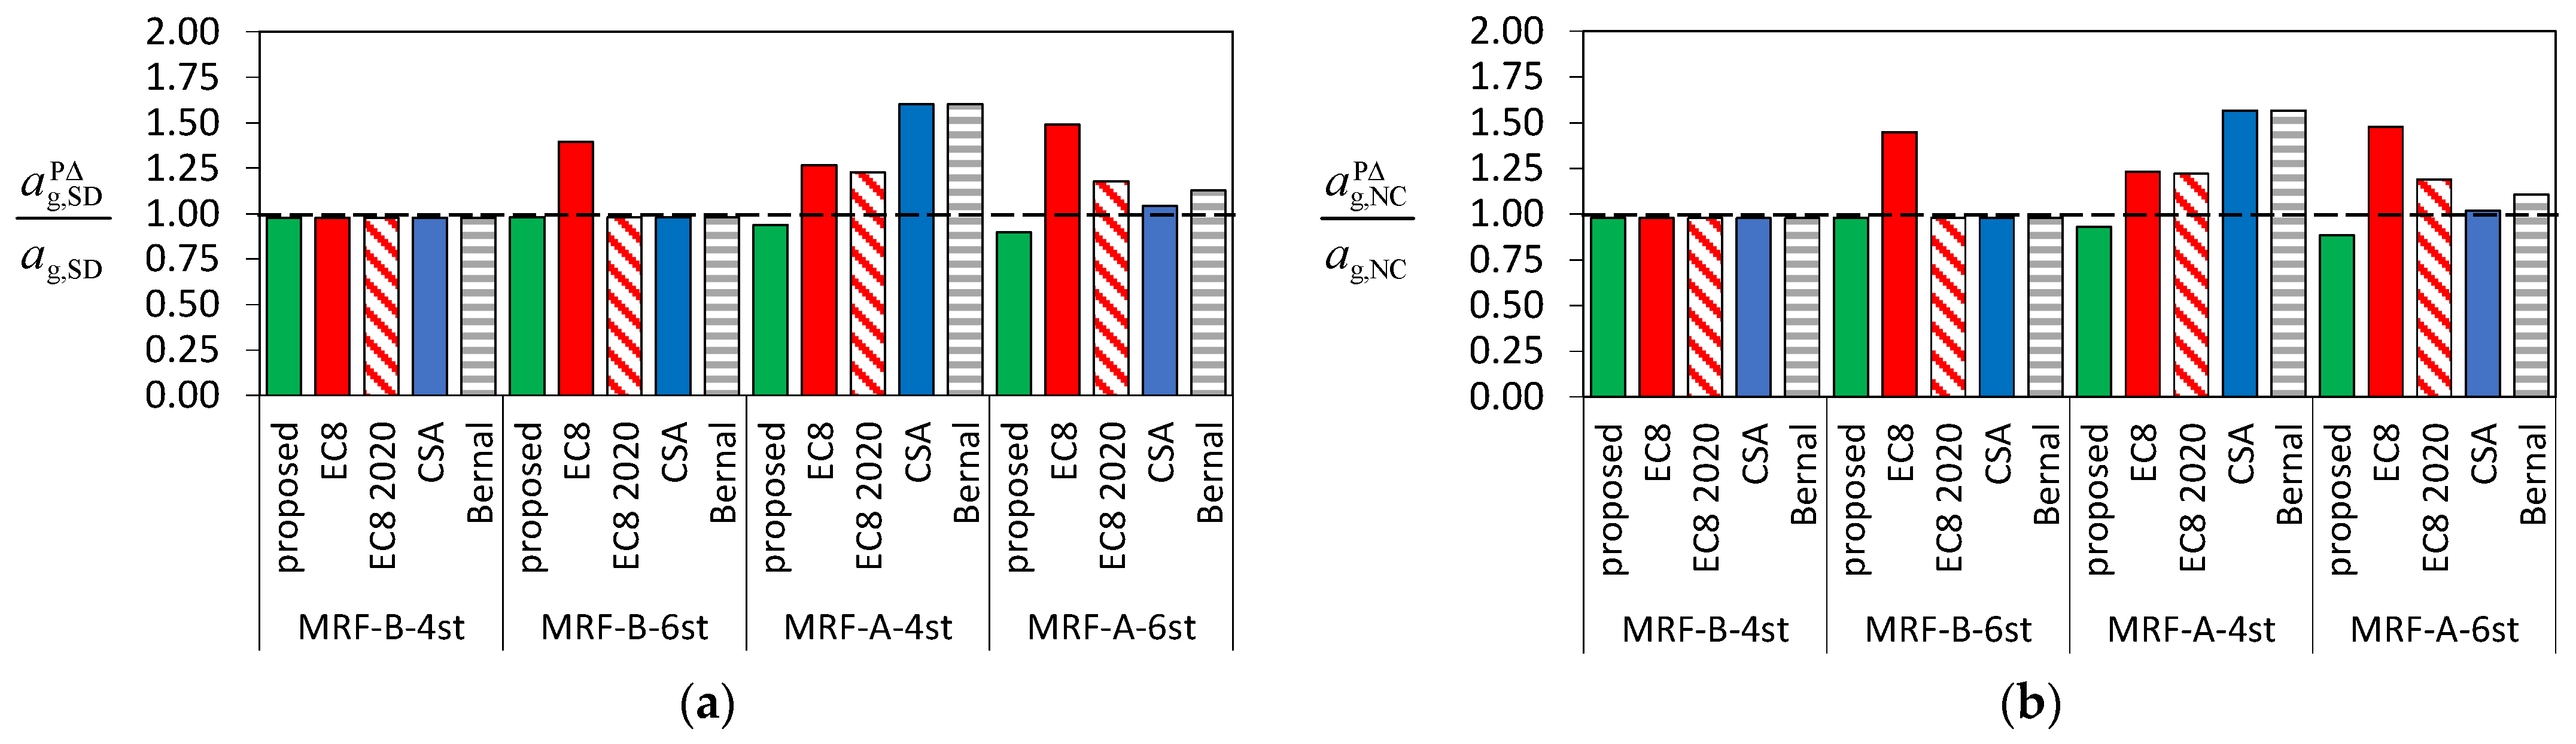
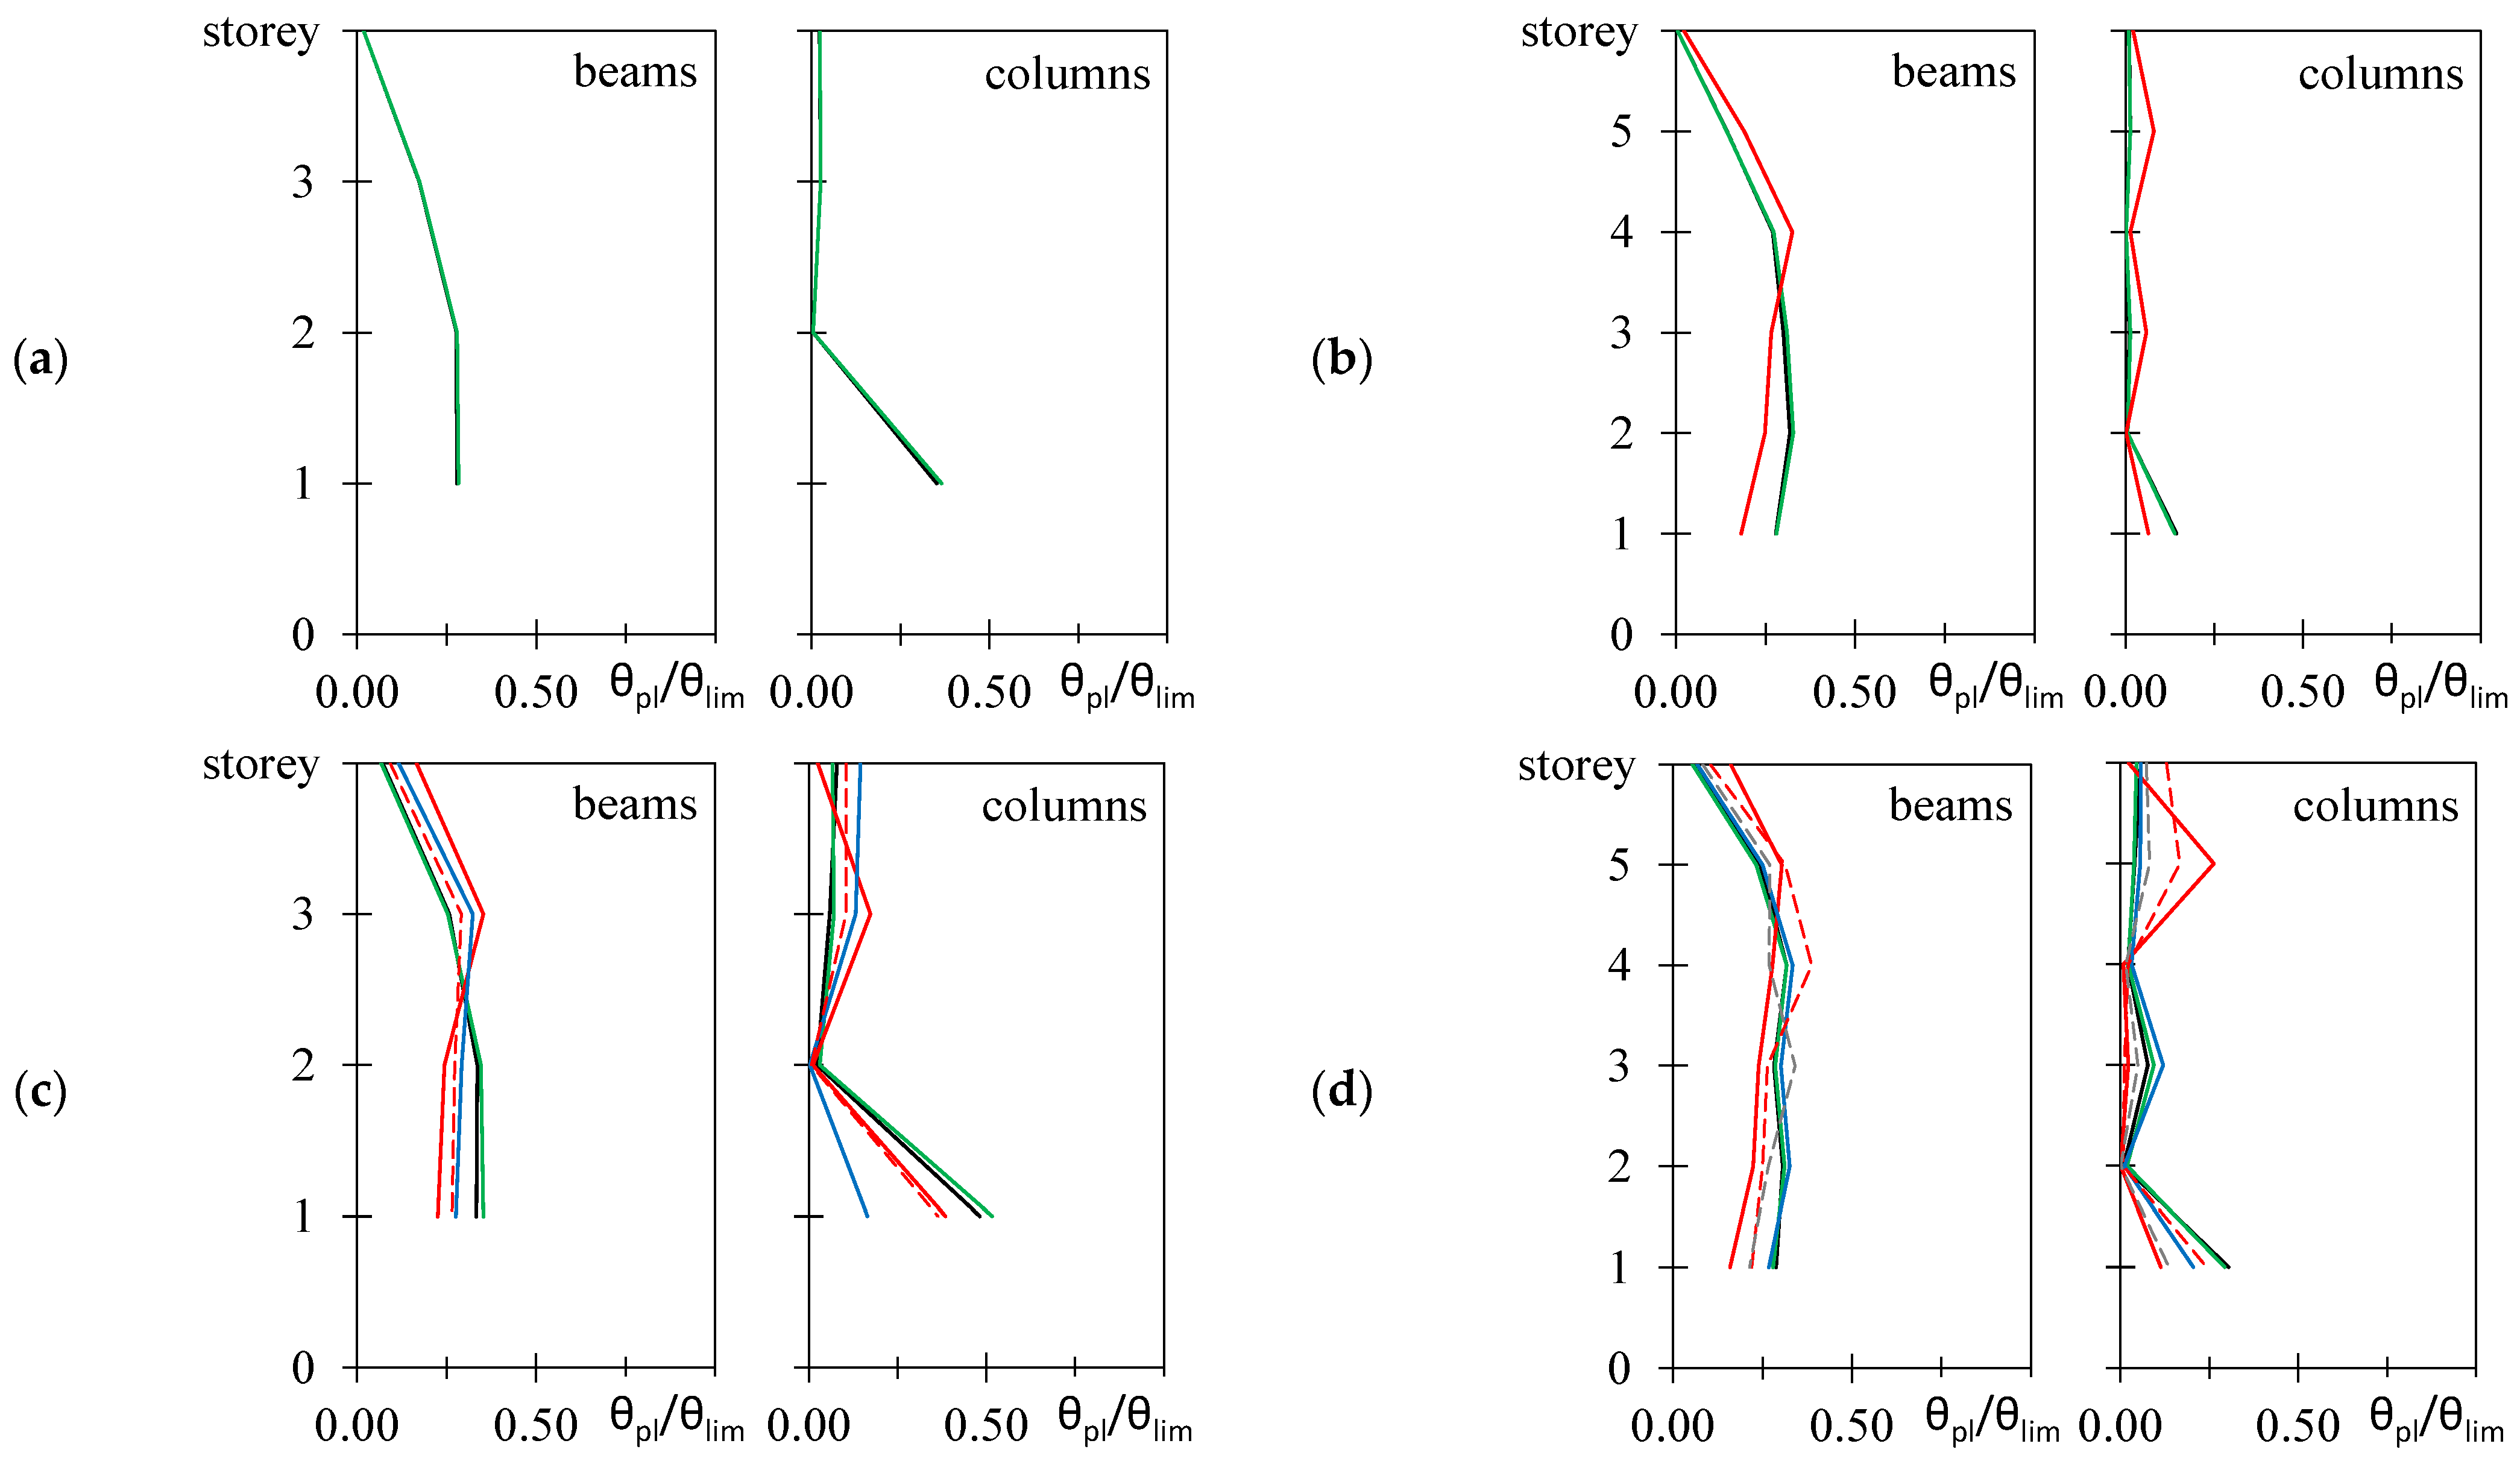
7.2. Response at the Design Level

The response at the design level (ag = 0.35 g) is determined by nonlinear dynamic analyses. For each considered accelerogram, the maximum value of the time history of the rotation demand to capacity ratio is calculated for each beam and column and then averaged over the number of accelerograms. Then, at each story, the maximum of the obtained values for either beams and columns is determined and plotted in Figure 6. In the case of the interior frames MRF-B-4st and MRF-B-6st (Figure 6a,b), as predicted by all the considered design procedures with the sole exception of the current version of EC8, P–Δ effects are negligible. Indeed, the black, green, blue, dashed red and grey lines are coincident. In the case of building MRF-B-6st, the increase of the cross-section required by EC8 leads to a reduction of the rotation demand to capacity ratio of beams and columns at the bottom story but to an increase of the same ratio at other stories. Thus, independently of the adopted procedure, the maximum demand to capacity ratio is similar.
In the case of frames MRF-A-4st and MRF-A-6st (Figure 6c,d) the considered procedure is that leading to values of rotation demand to capacity ratios which present the smallest differences with respect to the target values (black lines). This confirms the accuracy of the proposed formulation.
All the other procedures, instead, modify the heightwise distribution of the rotation demand to capacity ratio and, in case of MRF-A-4st, lead to an increase in the demand at the two top stories. In case of MRF-A-6-st the increase in the demand occurs at the two top stories when the current and upcoming version of EC8 are used and at the third story when CSA and the SAF proposed by Bernal are used.

7.3. Fragility Curves

Results of nonlinear incremental dynamic analyses are used to evaluate the fragility curves related to the SD and NC limit states. The fragility function, i.e., the probability of exceedance of the limit state (LS) at different peak ground accelerations, is defined by a lognormal cumulative distribution function.
P ( C | I M = x ) = Φ ( ln x / θ σ )
where IM is the ground motion intensity measure (in this case the PGA), x is the assigned value of IM and θ and σ are the mean and standard deviation of the logarithms of the PGAs corresponding to the achievement of the considered LS (ag,LS). In particular, θ and σ are computed by means of the following relationships [24].
ln θ = 1 n i = 1 n ln a g , LS , i
σ = 1 n 1 [ i = 1 n ln ( a g , LS , i θ ) ] 2
where n is the number of accelerograms.
The median values of the PGA leading to the considered LS in systems designed and analyzed neglecting P–Δ effects are reported in Table 3. These values are compared to those obtained in systems designed and analyzed considering P–Δ effects in Figure 7.
The values of ag,SD and ag,NC reported in Table 3 are always larger than the corresponding values determined by nonlinear static method of analysis, thus confirming that this latter procedure is generally conservative. The differences are significant at the NC limit state. Indeed, with the sole exception of building MRF-A-4st, all the considered systems have a median value of ag,NC larger than the value 0.6 g.
When P–Δ effects are considered, the proposed procedure leads to a maximum reduction of ag,NC equal to 10%, i.e., the ductility demand to capacity ratios of members for the given ag in systems with P–Δ effects is only moderately larger than that of systems analysed without P–Δ effects at the same ag. It is interesting to note that this increase of the ductility demand is moderate even if the values of ag,NC are much larger than the value 0.35 g assumed in design to estimate the proposed SAF.
In addition, despite the increase of lateral stiffness and strength required by the current version of EC8 in building MRF-B-6st, the reduction in ag,NC obtained considering this procedure is larger than that recorded when all the other procedures are used (about 15%).

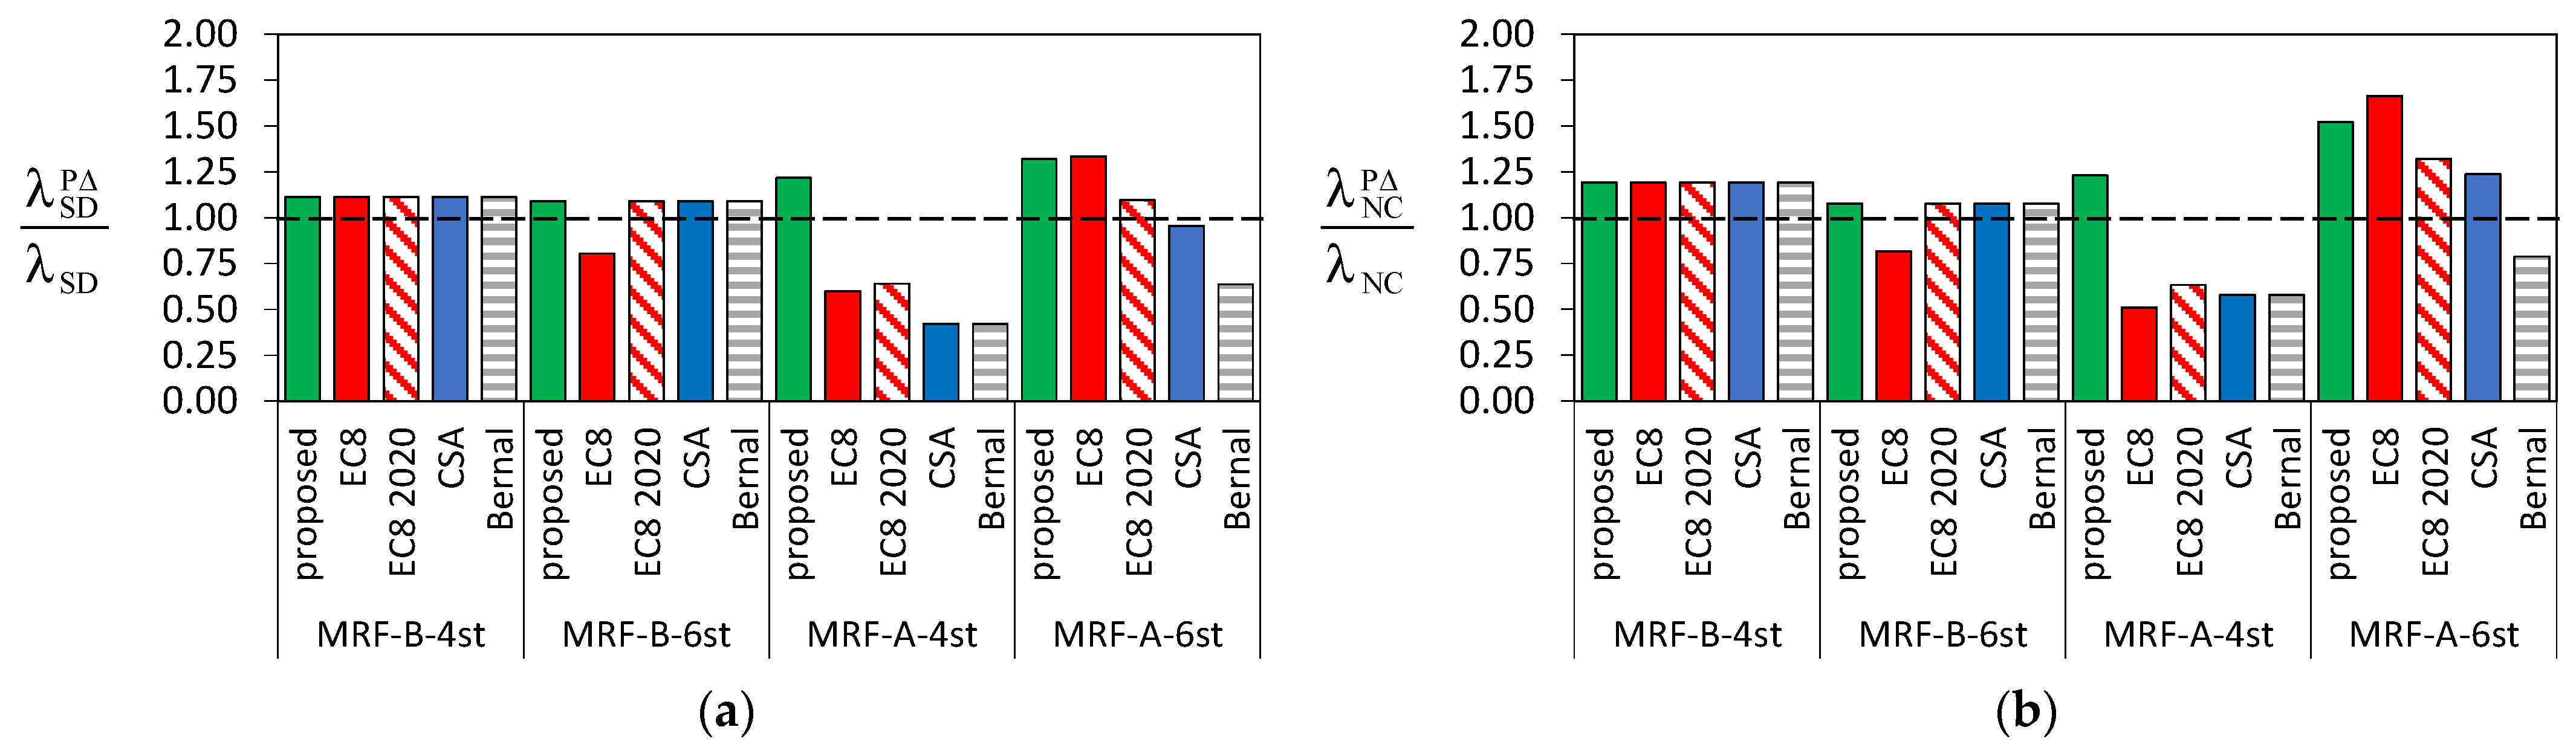
7.4. Mean Annual Frequency of Exceedance of the Considered Limit States

To have a synthetic measure of the seismic performance of the examined structures, the mean annual frequency of exceedance of the SD and NC limit states is calculated for all the considered structures. For each given LS, the mean annual frequency of exceedance λLS is calculated as
λ LS = 0 p LS ( s ) | d λ ¯ S ( s ) d s | d s i = 1 n p LS ( s i ) | Δ λ ¯ i |
where pLS(s) is the probability of exceedance of the assigned limit state (fragility curve) and is the probability of exceedance of the assigned peak ground acceleration (mean seismic hazard curve) and s is the intensity measure. The considered hazard curve is that derived in [25].
The mean annual frequency of exceedance of the considered LS in systems designed and analyzed neglecting P–Δ effects are reported in Table 4 as well as the limit values (i.e., 4.7 × 10⁻³ and 2.3 × 10⁻³) suggested in [26] for existing buildings classified as class II (ordinary buildings). The values of the mean annual frequency of exceedance are compared to those obtained in systems designed and analyzed considering P–Δ effects in Figure 8.
When the proposed procedure is used, the mean annual frequency of exceedance of the SD limit state is higher than that obtained when P–Δ effects are neglected. Specifically, the ratio λ SD P Δ / λ SD ranges from 1.09 to 1.32 and the mean annual frequency of exceedance is always significantly lower than the limit value. When considering the NC limit state, the maximum ratio λ NC P Δ / λ NC reaches the value 1.66 for frame MRF-B-6st. Thus, the increase in the mean annual frequency of exceedance is not negligible for frame MRF-B-6st. However, it should be noted that the proposed SAF has been determined to counterbalance P–Δ effects for a peak ground acceleration equal to 0.35 g whereas the median peak ground acceleration leading the abovementioned frame to the NC limit state is equal to 0.970 g.
In terms of mean annual frequency of exceedance, the smallest variation with respect to the results obtained in absence of P–Δ effects are recorded when using the formulation reported in Canadian Standard and in the upcoming version of EC8, even if for structure MRF-B-4st both these codes lead to a significant reduction of λLS.

8. Conclusions

Since structural response is influenced by P–Δ effects, especially when structures undergo large deformations, seismic codes provide Strength Amplification Factors (SAFs) to increase the lateral strength required by a first order analysis. This paper formulates and validates a procedure to counterbalance P–Δ effects. The SAF used herein is determined as a function of the equivalent viscous damping ratio, the ductility demand and the inelastic interstory drift sensitivity coefficient.
To validate the proposed formulation of the SAF, a set of steel MRFs is first designed neglecting P–Δ effects and analyzed by means of nonlinear static and incremental dynamic analyses without P–Δ effects (Stage #1). Second, each structure is re-designed considering P–Δ effects according to the proposed procedure, the SAF proposed by Bernal and the provisions of (i) current version of EC8, (ii) new draft of EC8, (iii) ASCE, (iv) NBC and CSA (Stage #2).
The seismic response of the structures designed in the second stage has been determined considering P–Δ effects. The response of the structures in Stage #1 and Stage #2 is evaluated in terms of capacity curves, plastic rotation demand-to capacity ratios at the design level and PGA leading to the Significant Damage (SD) and Near Collapse (NC) limit states. Further, the mean annual frequency of exceedance of the SD and NC limit states is computed.
The main conclusions obtained are reported here presenting pros and cons for each of the considered design procedure.
The procedure reported in the current version of EC8:
  • requires the highest increase of the lateral stiffness of the frame, especially in the case of perimeter frames;
  • leads to values of the PGA corresponding to the attainment of SD and NC limit states in Stage #2 that are about 30% higher than those determined in Stage #1 when nonlinear static analysis is used to assess the seismic performance;
  • significantly alters the heightwise distribution of the plastic rotation demand to capacity ratio. The above ratio is often increased at the top stories;
  • despite the required significant increase of lateral stiffness and strength, leads to PGA corresponding to the attainment of SD and NC limit states in Stage #2 that are higher than those in Stage #1 for only two cases when IDA is considered to assess the seismic performance;
  • leads to mean annual frequencies of exceedance of SD and NC limit states in Stage #2 that can be either smaller or higher than those in Stage #1.
The procedure reported in the draft of the new version of EC8, in Canadian Standard and the application of the SAF proposed by Bernal:
  • require only a moderate increase of the lateral stiffness and strength;
  • lead to values of the PGA corresponding to the attainment of SD and NC limit states in Stage #2 that are about 12% higher than those determined in Stage #1 when nonlinear static analysis is used to assess the seismic performance;
  • in the occurrence of the design value of the PGA, lead to ductility demand to capacity ratio at the single story of buildings that can be even significantly larger than that of the same buildings in Stage #1. However, the maximum ductility demand to capacity ratios along the height of the frame are similar in Stage #1 and #2;
  • lead to PGA corresponding to the attainment of SD and NC limit states in Stage #2 that can be smaller (up to 10%) or higher (up to about 30%) than those in Stage #1 when IDA is considered to assess the seismic performance;
  • lead to mean annual frequencies of exceedance of SD and NC limit states in Stage #2 that can be either smaller or higher than those in Stage #1.
  • Both the proposed procedure and ASCE prescriptions:
  • do not require any increase of the cross section of the members, thus these two procedures lead to the cheapest structural solution;
  • lead to values of the PGA corresponding to the attainment of SD and NC limit states in Stage #2 that are about 6% lower than those determined in Stage #1 when nonlinear static analysis is used to assess the seismic performance. However, the PGAs are larger than the reference values given in the Italian seismic code for the SD and NC limit states (i.e., 0.35 g and 0.45 g, respectively);
  • lead to values and heightwise distribution of the plastic rotation demand to capacity ratio that are similar in Stage #1 and in Stage #2 for a PGA equal to the design level;
  • lead to values of the PGA corresponding to the attainment of SD and NC limit states in Stage #2 that are about 5% lower than those determined in Stage #1 when nonlinear incremental dynamic analysis is used to assess the seismic performance;
  • lead to mean annual frequencies of exceedance of SD and NC limit states in Stage #2 that are higher than those in Stage #1, but lower than the limit values reported in CNR-DT-212/2013.
Finally, it is worth noting that the proposed SAF has been calculated considering a design PGA equal to 0.35 g, whereas the median peak ground acceleration leading the considered buildings to the NC limit state are in the range from 0.60 g to 0.970 g.

Author Contributions

Conceptualization, F.B., M.B., A.F., E.M.M. and P.P.R.; methodology, F.B., M.B., A.F., E.M.M. and P.P.R.; formal analysis, F.B., M.B., A.F., E.M.M. and P.P.R.; writing—original draft preparation, F.B., M.B., A.F., E.M.M. and P.P.R.; writing—review and editing, F.B., M.B., A.F., E.M.M. and P.P.R. All authors have read and agreed to the published version of the manuscript.

Funding

This research received no external funding.

Data Availability Statement

Not applicable.

Conflicts of Interest

The authors declare no conflict of interest.

Abbreviations

This table lists the main acronyms used in the paper.
AcronymMeaning
DLDamage Limitation
IDAIncremental Dynamic Analysis
IDSCInterstory Drift Sensitivity Coefficient
LSLimit State
MDOFMulti Degree Of Freedom
MRFMoment Resisting Frame
NCNear Collapse
SAFScale Amplification Factor
SDSignificant Damage
SDOFSingle Degree Of Freedom

References

  1. Bernal, D. Amplification factors for inelastic dynamic P-Δ effects in earthquake analysis. Earthq. Eng. Struct. Dyn. 1987, 15, 635–651. [Google Scholar] [CrossRef]
  2. Chung, B.T. Dynamic Behaviour of Multi-Story Buildings; School of Engineering Report No. 492; University of Auckland: Auckland, New Zealand, 1991. [Google Scholar]
  3. Fenwick, R.C.; Davidson, B.J.; Chung, B.T. P-delta actions in seismic resistant structures. Bull. N. Zeal. Soc. Earthq. 1992, 25, 56–72. [Google Scholar] [CrossRef]
  4. MacRae, G.A. P-Δ effects on single-degree-of-freedom structures in earthquakes. Earthq. Spectra 1994, 10, 539–568. [Google Scholar] [CrossRef]
  5. Tremblay, R.; Duval, C.; Léger, P. Effects of viscous damping models, hysteretic models and ground motion characteristics on seismic P-delta strength amplification factors. In Stability and Ductility of Steel Structures; Usami, T., Itoh, Y., Eds.; Elsevier: Oxford, UK, 1998; pp. 103–118. [Google Scholar]
  6. Williamson, E.B. Evaluation of damage and P-Δ effects for systems under earthquake excitation. J. Struct. 2003, 129, 1036–1046. [Google Scholar] [CrossRef]
  7. Humar, J.; Mahgoub, M.; Ghorbanie-Asl, M. Effect of second-order forces on seismic response. Can. J. Civ. Eng. 2006, 33, 692–706. [Google Scholar] [CrossRef]
  8. Amara, F.; Bosco, M.; Marino, E.M.; Rossi, P.P. An accurate strength amplification factor for the design of SDOF systems with P-Δ effects. Earthq. Eng. Struct. Dyn. 2014, 43, 589–611. [Google Scholar] [CrossRef]
  9. De Francesco, G.; Sullivan, T.J. P-delta effects on short-period systems subjected to earthquake excitation. Eng. Struct. 2022, 254, 113642. [Google Scholar] [CrossRef]
  10. Barbagallo, F.; Bosco, M.; Ghersi, A.; Rossi, P.P. A Strength Amplification Factor to Counterbalance P–Δ Effects in Steel Moment Resisting Frames. Lect. Notes Civ. Eng. 2022, 262, 1048–1055. [Google Scholar]
  11. Piluso, V. Parameters for measuring structural sensitivity to second-order effects: Seismic code critical issues. In Proceedings of the XXVIII Conference “the Italian Steel Days” (CTA), Francavilla a Mare, Italy, 29 September–1 October 2022. [Google Scholar]
  12. Dell’Aglio, G.; Montuori, R.; Nastri, E.; Piluso, V. Consideration of second-order effects on plastic design of steel moment resisting frames. Bull. Earthq. Eng. 2019, 17, 3041–3070. [Google Scholar] [CrossRef]
  13. CEN. EN 1998-1:2004; Eurocode 8. Design of Structures for Earthquake Resistance–Part 1: General Rules, Seismic Actions and Rules for Buildings. European Committee for Standardization: Brussels, Belgium, 2003.
  14. prEN 1998-1-2:2022; Eurocode 8:—Design of Structures for Earthquake Resistance—Part 1–2: Buildings. Version of prEN 1998-1-2:2022 Submitted to TC 250 for Preparation to ENQ Stage. European Committee for Standardization: Brussels, Belgium, 1998.
  15. ASCE/SEI. Minimum Design Loads for Buildings and Other Structures; ASCE 7-10; American Society of Civil Engineers/Structural Engineering Institute: Reston, VA, USA, 2010. [Google Scholar]
  16. Tartaglia, R.; D’Aniello, M.; Landolfo, R. Seismic performance of Eurocode-compliant ductile steel MRFs. Earthq. Eng. Struct. Dyn. 2022, 51, 2527–2552. [Google Scholar] [CrossRef]
  17. National Research Council of Canada (NRCC). National Building Code of Canada and Structural Commentaries Part 4 of Division B; National Research Council of Canada (NRCC): Ottawa, ON, Canada, 2015. [Google Scholar]
  18. Canadian Standards Association (CSA). Limit States Design of Steel Structures, S16-14; Canadian Standards Association (CSA): Mississauga ON, Canada, 2014. [Google Scholar]
  19. Bosco, M.; Ghersi, A.; Marino, E.M. On the evaluation of seismic response of structures by nonlinear static methods. Earthq. Eng. Struct. Dyn. 2009, 38, 1465–1482. [Google Scholar] [CrossRef]
  20. Mazzoni, S.; McKenna, F.; Scott, M.H.; Fenves, G.L.; Jeremic, B. Open System for Earthquake Engineering Simulation Command Language Manual, Pacific Earthquake Engineering Research Center; University of California: Berkeley, CA, USA, 2007. [Google Scholar]
  21. Menegotto, M.; Pinto, P.E. Method of analysis for cyclically loaded reinforced concrete plane frames including changes in geometry and non-elastic behaviour of elements under combined normal force and bending. In IABSE Symposium of Resistance and Ultimate Deformability of Structures Acted on by Well-Defined Repeated Loads; International Association of Bridge and Structural Engineering: Lisbon, Portugal, 1973; Volume 13, pp. 15–22. [Google Scholar]
  22. Barbagallo, F.; Bosco, M.; Marino, E.M.; Rossi, P.P. On the fibre modelling of beams in RC framed buildings with rigid diaphragm. Bull. Earthq. Eng. 2020, 18, 189–210. [Google Scholar] [CrossRef]
  23. CEN. EN 1998-3; EuroCode 8: Design of Structures for Earthquake Resistance. Part 3: Assessment and Retrofitting of Buildings. European Committee for Standardization: Brussels, Belgium, 2005.
  24. Backer, J.W. Efficient analytical fragility functions fitting using dynamic structural analysis. Earthq. Spectra 2015, 31, 579–599. [Google Scholar] [CrossRef]
  25. Barbagallo, F.; Bosco, M.; Marino, E.M.; Rossi, P.P. Seismic performance and cost comparative analysis of steel braced frames designed in the framework of EC8. Eng. Struct. 2021, 240, 112379. [Google Scholar] [CrossRef]
  26. CNR-DT 212/2013; Instruction for the Probabilistic Assessment of the Seismic Performance of Existing Buildings. Consiglio Nazionale delle Ricerche: Roma, Italy, 2014. (In Italian)
Figure 1. P–Δ effects in SDOF system.
Metals 13 00321 g001
Figure 2. Outline of the proposed procedure.
Metals 13 00321 g002
Figure 3. Layouts of the buildings considered for the design of (a) MRF-B; (b) MRF-A; (c) loads.
Metals 13 00321 g003
Figure 4. Capacity curves of the considered frames (a) MRF-B-4st; (b) MRF-B-6st; (c) MRF-A-4st; (d) MRF-A-6st.
Metals 13 00321 g004
Figure 5. Variation of the PGA leading to (a) SD limit state; (b) NC limit state in systems designed and analyzed considering P–Δ effects (nonlinear static analysis).
Metals 13 00321 g005
Figure 6. Capacity curves of the considered frames (a) MRF-B-4st; (b) MRF-B-6st; (c) MRF-A-4st; (d) MRF-A-6st (black line = P−Δ neglected, red solid line = EC8, red dashed line = EC8 2020, blue line = CSA, green line = ASCE and proposed procedure, dashed grey line = Bernal).
Metals 13 00321 g006
Figure 7. Variation of the PGA leading to (a) SD limit state; (b) NC limit state in systems designed and analyzed considering P–Δ effects (incremental nonlinear dynamic analysis).
Metals 13 00321 g007
Figure 8. Variation of the mean annual frequency of exceedance of the (a) SD limit state; (b) NC limit state in systems designed and analyzed considering P–Δ effects.
Metals 13 00321 g008
Table 1. Properties of the structures designed neglecting P–Δ effects.
BuildingMRF-A-4stMRF-A-6stMRF-B-4stMRF-B-6st
T1 [s]1.482.001.011.53
Ws [kN]104.3170.0165.7264.8
Ωmin1.161.081.561.43
θEC80.370.480.170.28
θEC8,20200.190.240.090.14
θASCE = θel0.070.090.030.05
U21.191.241.091.14
θpro0.170.270.050.08
Table 2. Percentage increase in the structural weight because of P–Δ effects.
BuildingMRF-A-4stMRF-A-6stMRF-B-4stMRF-B-6st
EC818.3%32.4%0.0%5.6%
EC8,20208.7%10.6%0.0%0.0%
ASCE0.0%0.0%0.0%0.0%
CSA13.8%2.2%0.0%0.0%
BERNAL13.8%10.5%0.0%0.0%
PROPOSED0.0%0.0%0.0%0.0%
Table 3. Median PGA leading to the SD and NC limit states in systems designed and analyzed neglecting P–Δ effects.
BuildingMRF-A-4stMRF-A-6stMRF-B-4stMRF-B-6st
ag,SD (g)0.4870.6880.5640.804
ag,NC (g)0.5940.8760.6800.970
Table 4. Mean annual frequency of exceedance of the SD and NC limit states in systems designed and analyzed neglecting P–Δ effects.
Limit ValueMRF-A-4stMRF-A-6stMRF-B-4stMRF-B-6st
λSD (×10−3)4.70.9380.3190.5750.220
λNC (×10−3)2.30.5210.1480.3250.124
Disclaimer/Publisher’s Note: The statements, opinions and data contained in all publications are solely those of the individual author(s) and contributor(s) and not of MDPI and/or the editor(s). MDPI and/or the editor(s) disclaim responsibility for any injury to people or property resulting from any ideas, methods, instructions or products referred to in the content.

