Article

Static Crystallization, an Alternative Methodology for Synthesis of High-Purity Aluminum

by
Michaela Gotenbruck
,
Danilo C. Curtolo
,
Semiramis Friedrich
*,
Clemens J. Müller
,
Nico Rademacher
and
Bernd Friedrich
IME Institute, RWTH Aachen University, 52056 Aachen, Germany
*
Author to whom correspondence should be addressed.
These authors contributed equally to this work.
Metals 2023, 13(2), 280; https://doi.org/10.3390/met13020280
Submission received: 28 November 2022 / Revised: 26 January 2023 / Accepted: 27 January 2023 / Published: 31 January 2023
(This article belongs to the Special Issue Separation and Purification of Metals)

Abstract

:
Due to its outstanding properties and wide range of applications, high-purity to ultra-high-purity aluminum represents a strategic material for meeting the future challenges of the 21st century. The purification of aluminum towards higher purity levels is usually performed via a combination of three-layer electrolytic refining and fractional crystallization using zone-melting processes. New methods and processes are being researched in the search for more time-saving and less costly options. Metal refining using static crystallization represents one of these new, alternative processes. This work investigated the feasibility of metal refining by means of a static crystallization furnace using aluminum as an example metal. In particular, the effects of the temperature gradient and the cooling rate on the reduction factor of the impurities iron (Fe), silicon (Si), and lead (Pb) were investigated. In addition, the effects of the process parameters on the grain structure formed were investigated, and correlations to the resulting purity level were made.

1. Introduction

Due to property improvements at higher purity levels, high-purity aluminum is used in semiconductors, microchips, displays, and also in low-temperature applications in the range below 30 K [1,2]. The purification of aluminum towards higher-purity grades is usually carried out via a combination of three-layer electrolytic refining and fractional crystallization, using zone melting. The problem regarding zone melting is the long process times, whereas the three-layer electrolysis requires a high energy consumption [3].
Therefore, alternative methodologies are being researched to look for more time-saving and less costly ways to purify aluminum. One of these methodologies is the cooled finger, which is a rotating and internally gas-cooled crystallizer. As soon as it is immersed in the molten metal bath, the fractional crystallization principle takes place, and a growth front forms, moving radially toward the crucible wall. A homogeneous mixing of the melt and a stable boundary layer, which assures an optimal segregation of impurities, are achieved by the rotational mechanism [4,5].
In this paper, another alternative methodology, also based on fractional crystallization, was developed and investigated at IME, RWTH Aachen. This so-called static crystallization furnace works similarly to the “vertical gradient freeze”, a single-crystal production technique. However, the equipment has the refining and not the single crystal growth as its focus. In the following paper, the general principles of fractional crystallization as well as the vertical gradient freeze are represented. A low energy consumption compared to current electrolysis technology [6] and the absence of complex moving mechanisms are considered as advantages of static crystallization.

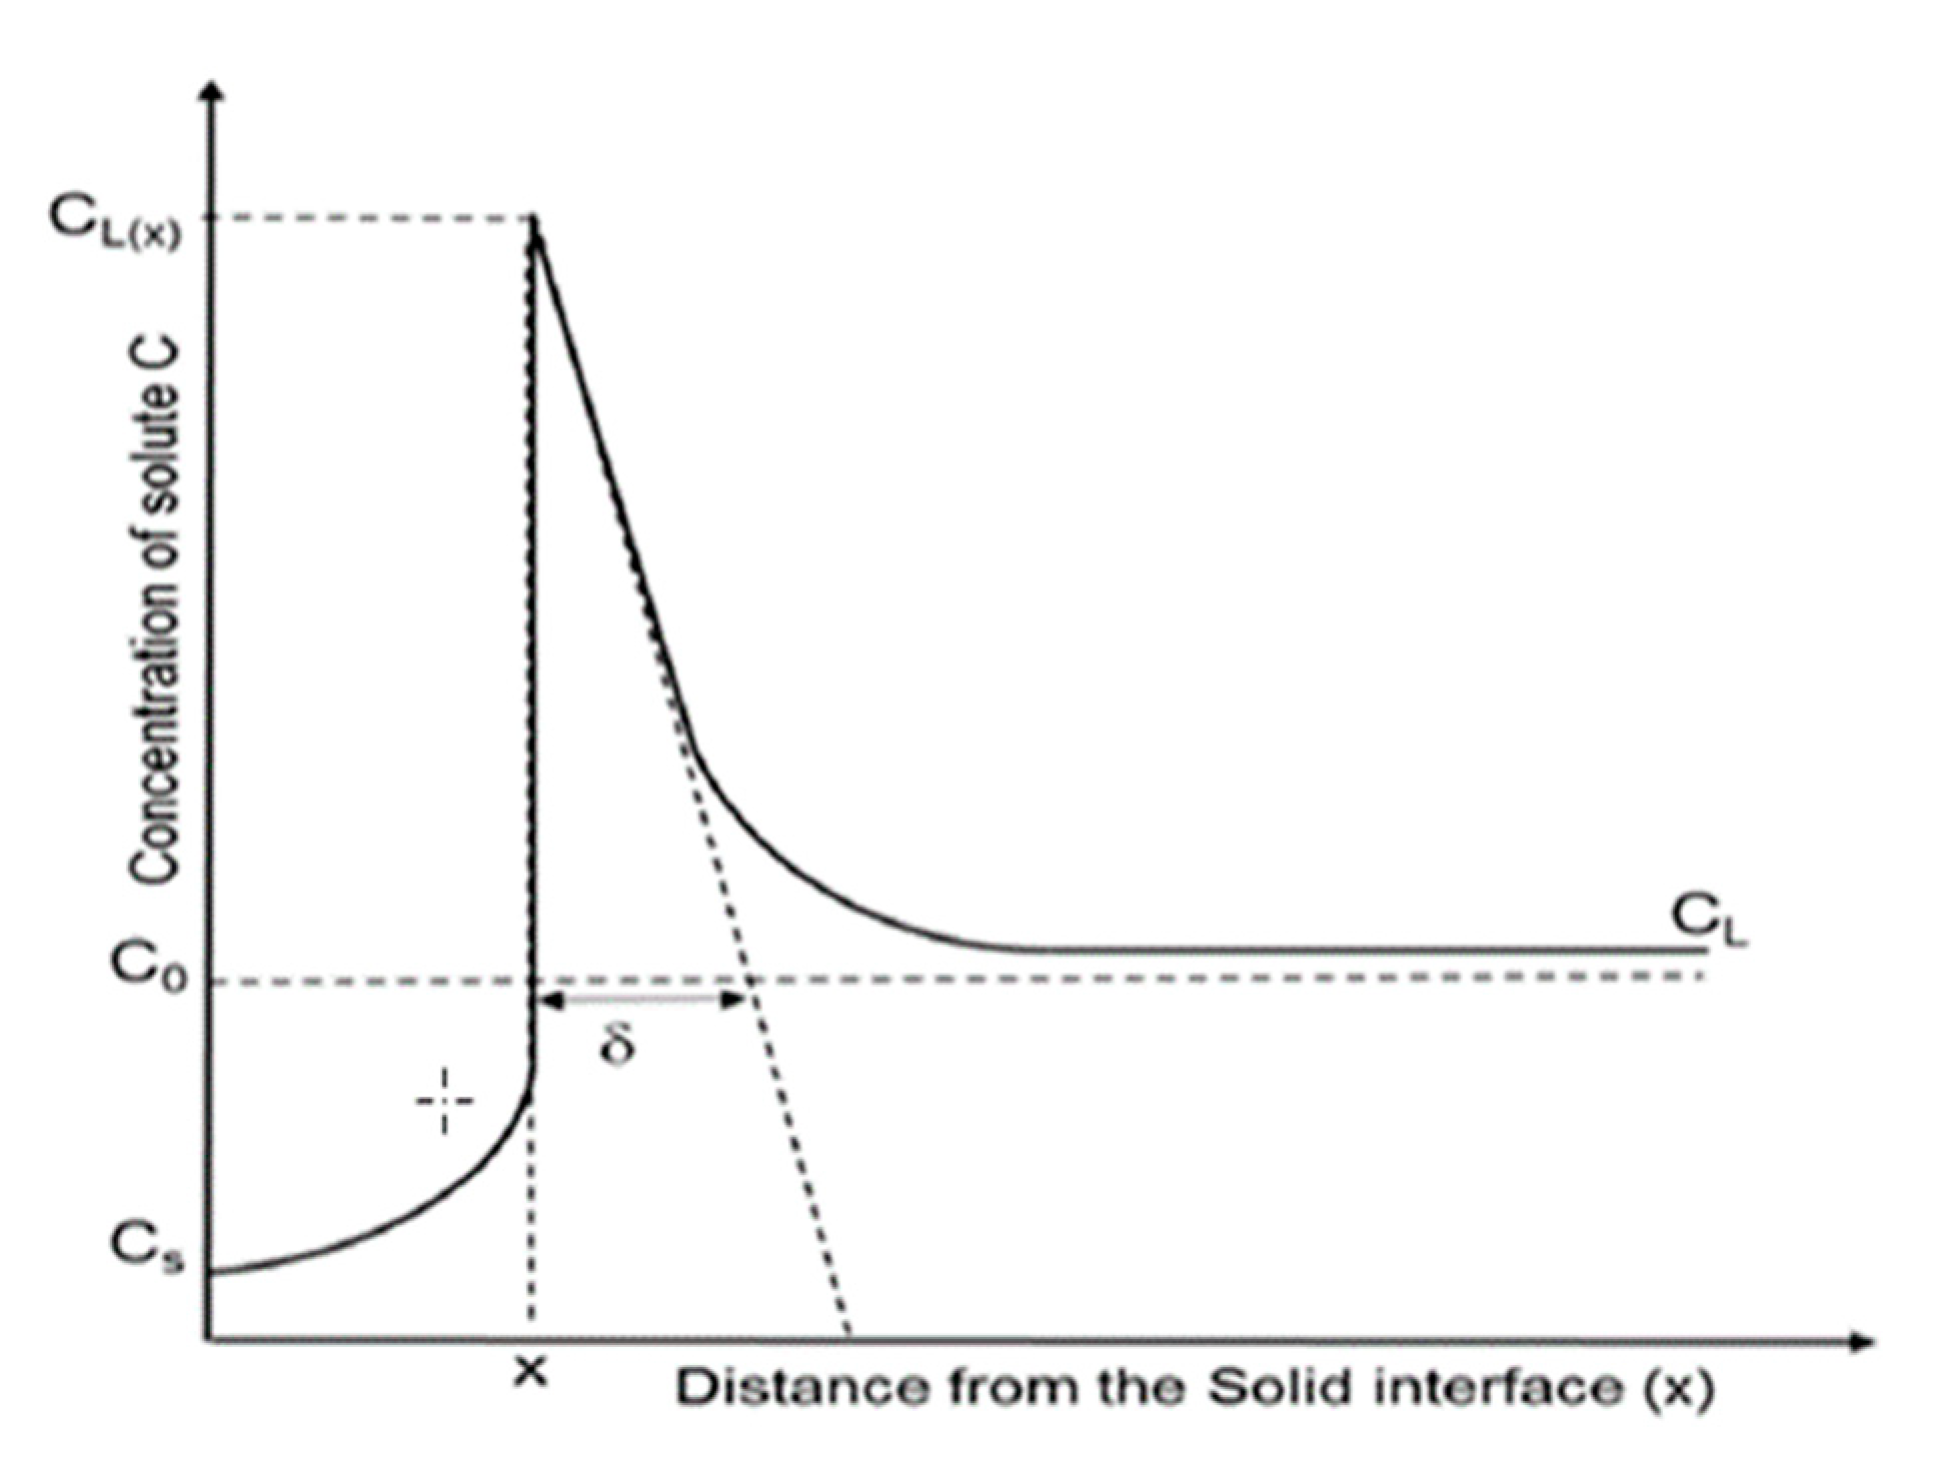
1.1. Fractional Crystallization

Fractional crystallization is a pyrometallurgical refining technique that can be characterized by the successive solidification of different phase components. Due to the solubility differences in liquid and solid phases, individual impurities will be enriched in different regions so that a concentration gradient of the dissolved impurities can be established. This prerequisite is described by the distribution coefficient (k), which indicates how high the concentration of a substance in the solid phase (CS) compared to the concentration in the liquid phase (CL) is. This factor gives then a direction on the maximum theoretical impurity removal (see Equation (1)).
k = C S C L
When the distribution coefficient of an impurity is lower than unity, that impurity tends to stay in the liquid phase upon crystallization. In contrast, the impurities with distribution coefficients bigger than unity tend to be incorporated in the foremost solidified phase during crystallization. Fractional crystallization, however, cannot be applied for those impurities, whose distribution coefficients are equal to one [7,8]. Table 1 below shows the values of distribution coefficients for many various impurities in aluminum, according to literature references.
Despite giving a good indication on the process direction, the use of distribution coefficient k shown in Equation (1) is only valid under the assumption of the complete diffusion of the released solid in the liquid phase. Therefore, a more detailed analysis can be made considering the growth rate of the solid, the diffusion of the impurity in the melt, and the thickness of the diffusion boundary layer. For that, the effective distribution coefficient (keff—Equation (2)), first described in detail by Burton, Prim, and Slichter (BPS model), can be used [8,11,12]. This model accounts for the growth rate (V), the distribution coefficient (k0 = CS/C0), and a boundary region with thickness δ ahead of the crystallization front (Figure 1), within which the impurities can only move by diffusion, according to their distribution coefficient D.
k eff = k 0 k 0 + ( 1 k 0 ) · e ( V δ D )
The closer keff is to k, the more the process approaches the maximum degree of purification for the investigated impurity. According to the BPS model, the two most effective ways to decrease the keff are to (1) decrease the velocity of the moving growth interface i.e., growth rate, and (2) decrease the thickness of the diffusion layer, allowing the impurities to dilute themselves into the bulk melt. While the first approach may impact productivity, the second can be well achieved by, e.g., promoting a strong convection or any other mixing ahead of the growth front, thus removing the solute built up from the growth interface [15].
Another important aspect for the effectiveness of the solute removal during the crystallization is the morphological stability of the growth front. A cellular or, in the worst case, a dendritic growth will entrap the segregated impurities between the grains or dendrites, leading to the entrapment of the segregated solute, and thus a poor purification effect. The morphological stability of the growth front is achieved if the relation for constitutional undercooling abides by Equation (3), where G is the temperature gradient, V the growth rate, ΔT0 the solidification interval, and DL the diffusion coefficient in the melt.
G V Δ T 0 D L
From the relation above, it can be concluded that a simultaneous high temperature gradient and low growth rate would lead to the best effect on the interface stabilization. On the other hand, impurities with very small diffusion coefficients and/or large solidification intervals would destabilize the growth interface [16,17].

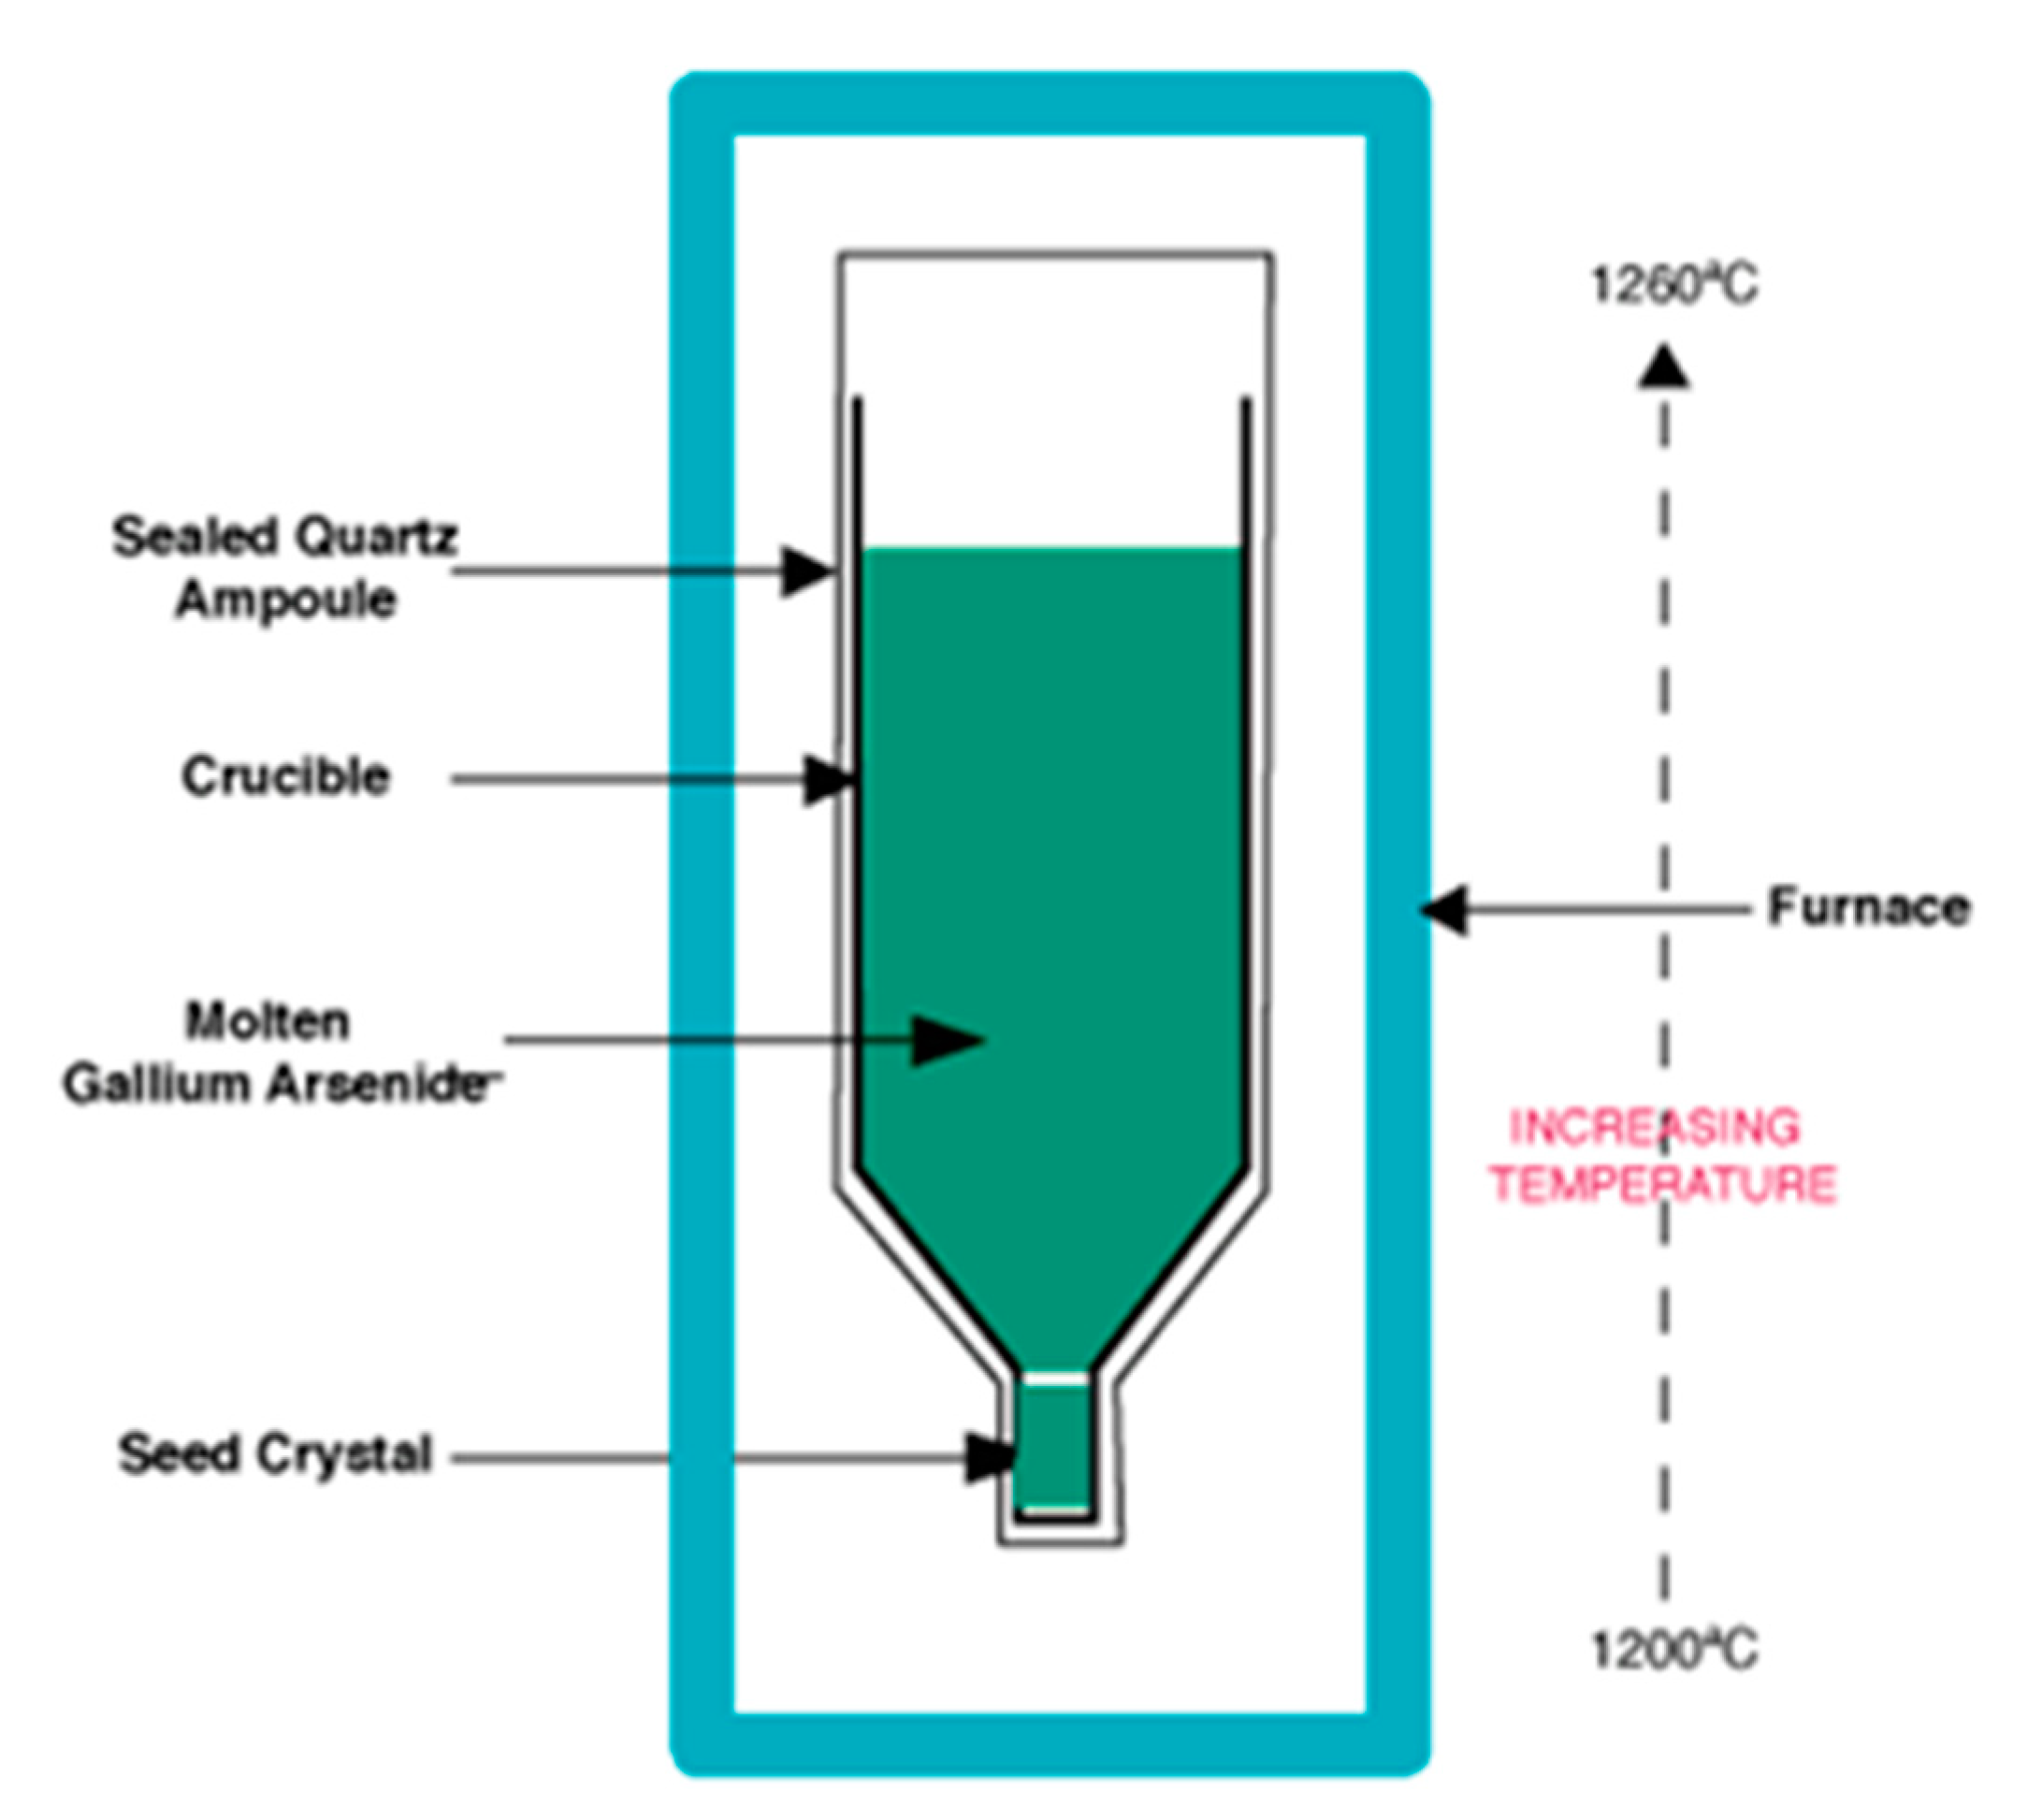
1.2. Vertical Gradient Freeze as a Prototype for Static Crystallization

The vertical gradient freeze (VGF) process works with a traveling vertical temperature gradient and is a widely used method for crystal growth. It is almost the state-of-the-art technique, for example, to produce infrared light-emitting and laser diodes as well as bulk compound semiconductor crystals like gallium arsenide (GaAs) or indium phosphide (InP), which are used in particular for the manufacturing of high-power and high-frequency electronics [18,19,20].
Figure 2 shows the basic structure of a setup for the vertical gradient freeze process. A crucible contains the material, which should be melted and then solidified vertically upwards by controlled cooling. For the controlled cooling, the crucible is surrounded by several individually controlled heating zones. Additional heating elements are located above and below the crucible to prevent uncontrolled heat loss. At the bottom of the crucible a single crystalline seed is placed, which guides the crystal growth into a specific crystallographic orientation [21,22].
The process begins with the melting of the material in the crucible, where the seed crystal should not be destroyed. Afterwards, the temperature of the heating devices has to be adjusted so that the melt solidifies in a desired manner from the bottom to the top. The seed crystal provides a fresh interface for crystal growth between the melt and the seed crystal during the controlled cooling. It is important that the solid–liquid interface maintain a planar shape and that the growth rate (i.e., the velocity of the solid–liquid interface) and the temperature gradient at the phase boundary remain at a certain level throughout the process, as they contribute significantly to the quality of the grown crystal [21].
As mentioned before, this process was taken as a pattern to design the static crystallization equipment used in this work. However, the biggest difference is the lack of a seed crystal, as well as the main target of metal refining instead of crystal growth.

2. Materials and Methods

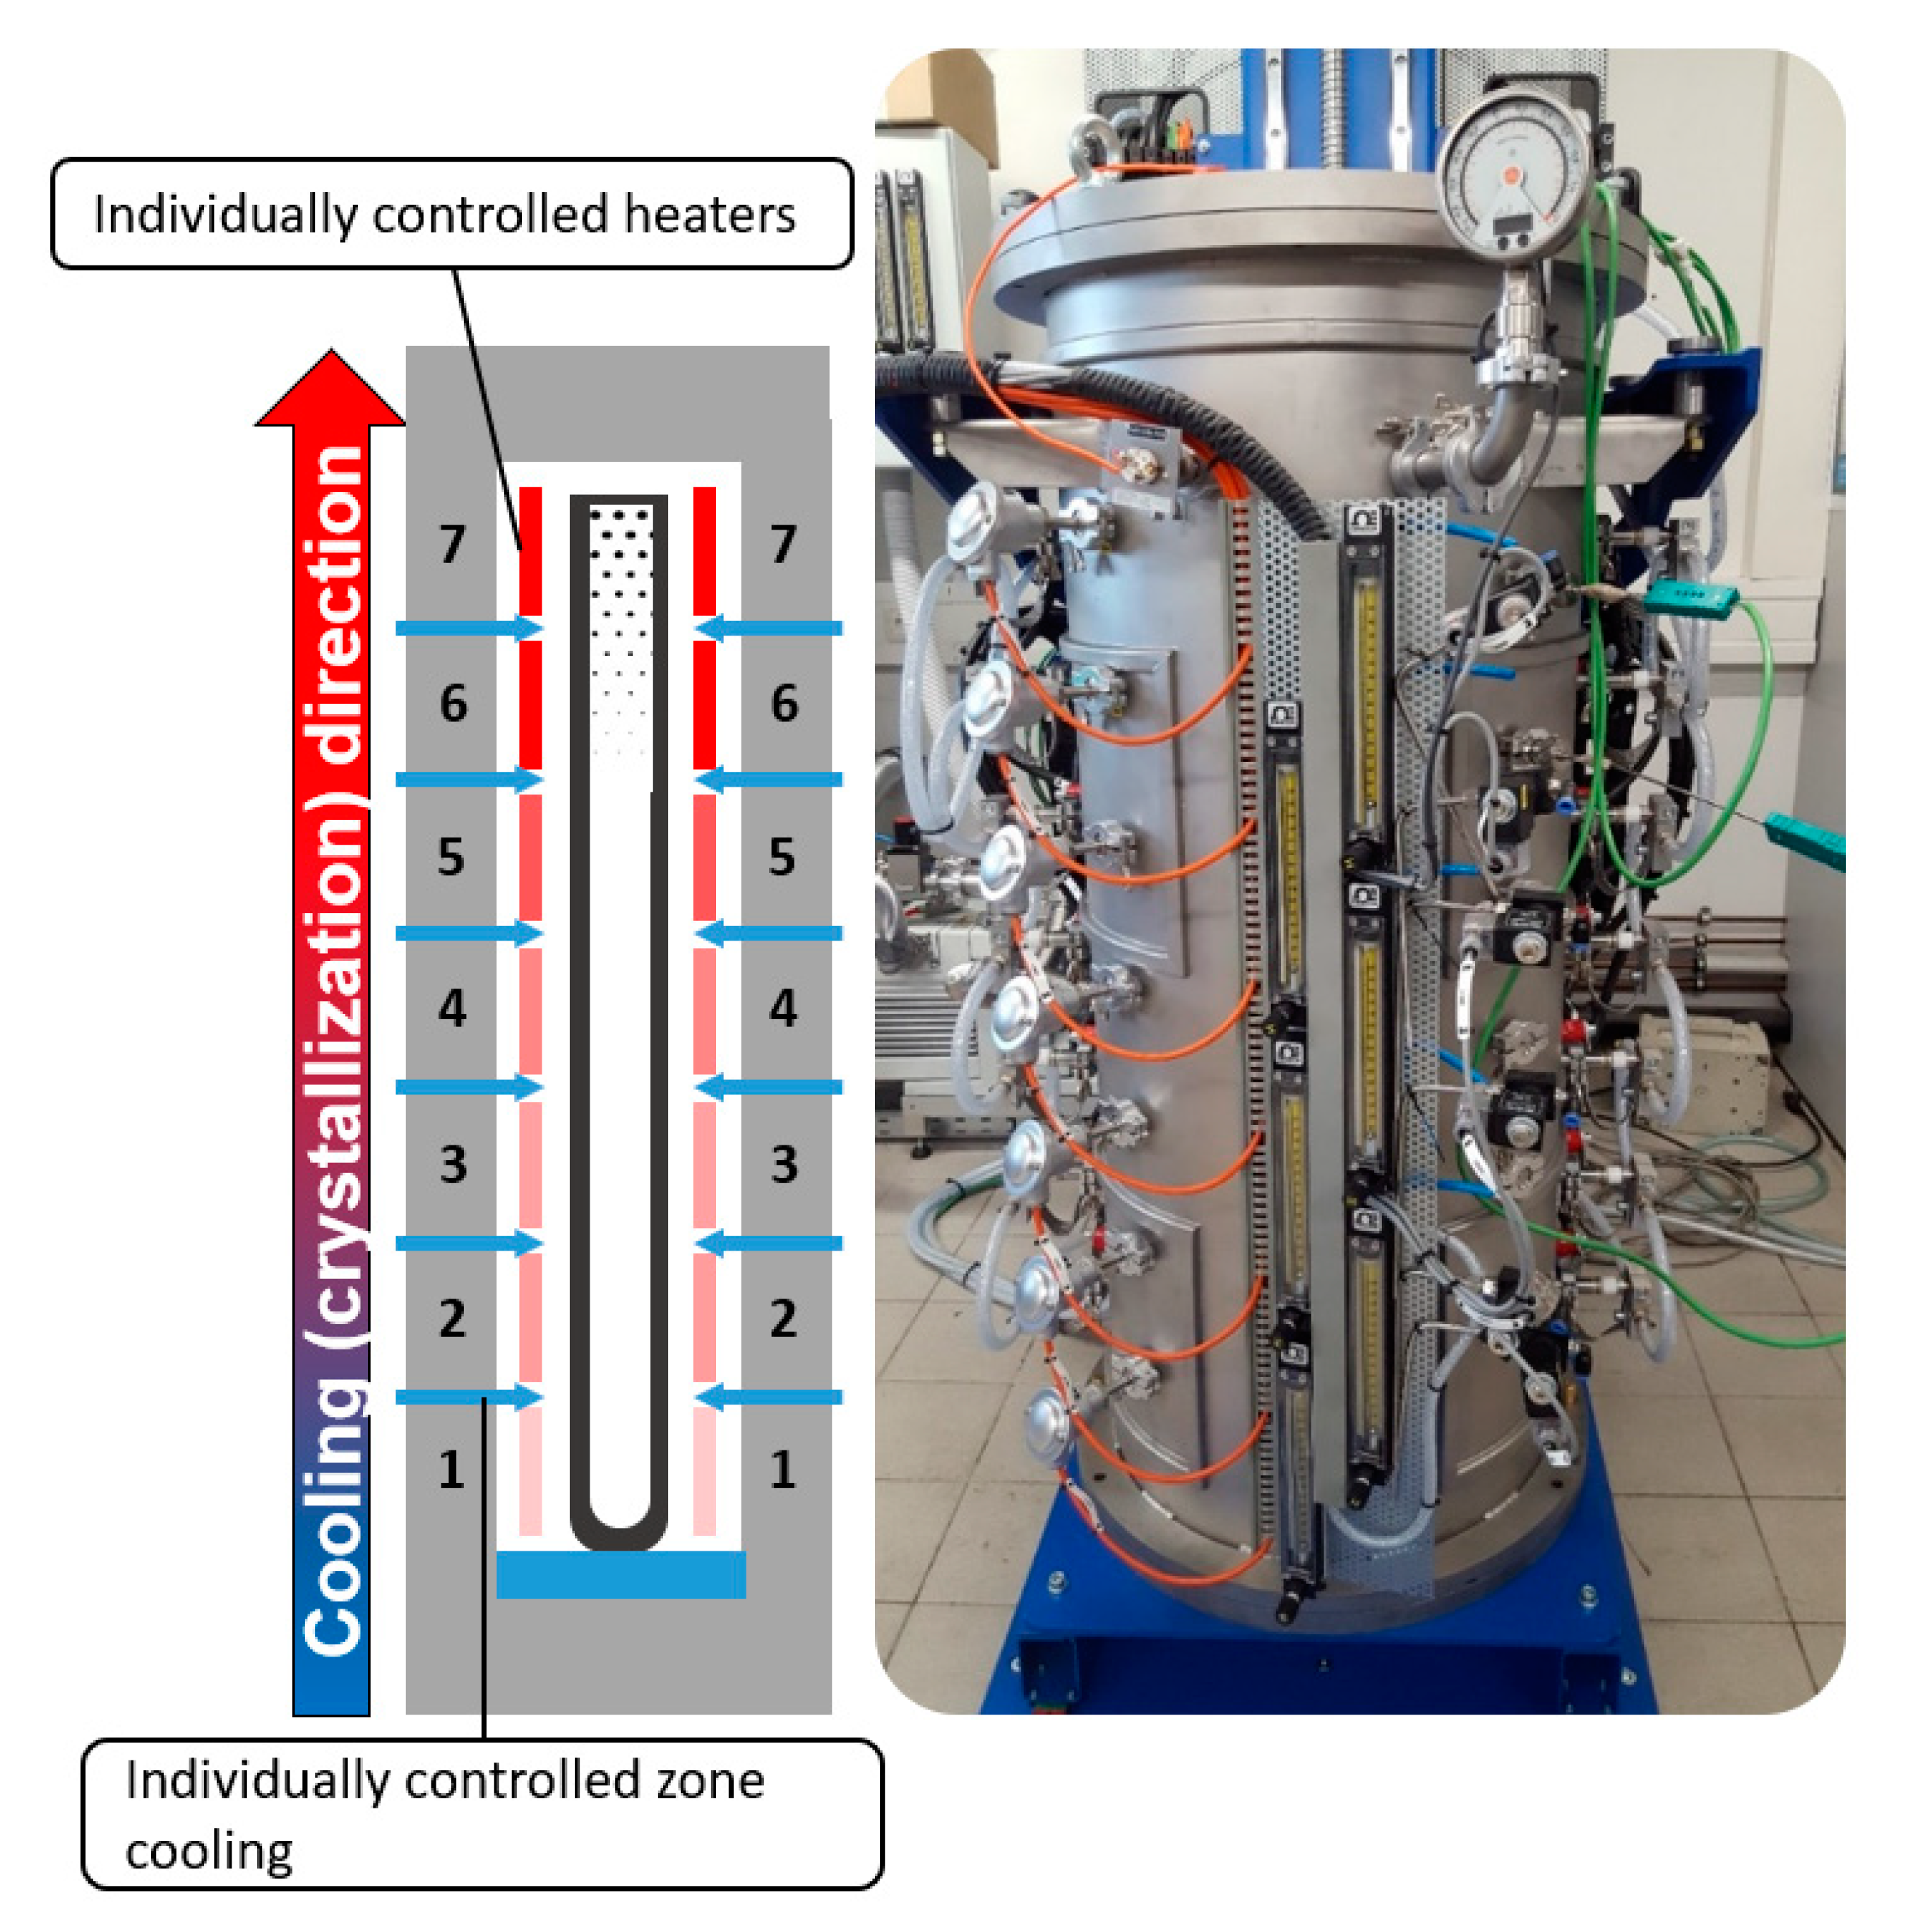
2.1. Static Crystallization Furnace

The facility employed in this series of experiments is a vertical static crystallization furnace equipped with a vacuum pump and seven heating zones, all able to operate and be controlled individually. It allows to firstly remelt all the materials in the crucible homogenously and then slowly cool them down from the bottom to the top (see Figure 3, left). By selecting a very small temperature gradient between every two zones, a desired crystallization as well as the shifting of impurities (with k << 1) upwards along the crucible can be achieved. The furnace is provided with a one-meter-long highly pure graphite crucible, as well as an argon cooling system at the bottom. It is also able to run under 10−2 mbar vacuum or 800 mbar inert gas (Ar). As the entire crystallization process in this furnace takes place in the lack of any mechanical movement or agitation, this equipment (designed and developed at IME/RWTH Aachen) has received the name of “static crystallization furnace”.

2.2. Initial Material

As raw material to be investigated in this research, aluminum with an initial purity level of 99.77% and main impurities of silicon, iron, and lead was selected. The chemical composition of the mixed charges of this raw material, determined via spark spectrometry, is represented in Table 2.

2.3. Experimental Methodology

A total of six trials with different parameter combinations were conducted. Variable trial parameters were the temperature gradient between the different heating zones of the furnace and the cooling rate of the individual zones.
Firstly, the vacuum was sucked up to 10−2 mbar to assure the absence of air, then the chamber was flooded with the inert gas (Ar) up to 800 mbar. Afterward, all seven heating zones ran simultaneously up to achieving the temperature of 700 °C in the crucible and melting the whole material homogenously. Then, the zones started to be cooled down, from zone one to zone seven. Using the central panel, their powers were reduced to 660 °C, as it is the liquidus temperature of aluminum under which everything is solidified. As Table 3 illustrates, not only the cooling rates (10, 20, 50 K/h) but also the temperature gradients (10, 15, 20, 30 K) were selected and combined precisely and their effect investigated deeply.
It is also important to note that the aluminum material was filled only to zone six, while zone seven—the one at the top—stayed empty but hot. This guaranteed the heating at the top as well as avoided the heat loss of the crystallization zones via the furnace lid.

2.4. Sample Preparation and Analysis

For all analyses, the crystallized ingots were sectioned by the height, corresponding with the middle of the furnace’s heating zones I to VI, as shown in Figure 4. Each cut section of the crystallized ingot received a nomenclature according to its position along the ingot and the trial ID. For example, the bottommost section of Trial 1 was identified as Section 1.1, followed by the Section 1.2, and so on. The sections half-designated for the macrograph received the letter A added (e.g., Sample 1.2.A). The discs cut for the spark spectrometry analyses received similar nomenclature, e.g., the lowest sample from Trial 1 was identified as 1(1), followed by 1(2), etc.
Each sectioned region was cut in half and polished on the longitudinal side. The A side was etched with Tucker’s reagent for circa 30 s until the sample macro structure was revealed. In between each sectioned zone, a circular section was cut, polished, and analyzed per spark spectrometry (MAXx Funkenspektrometer) to obtain the experimental impurity distribution along the length of the crystallized ingot.
Following the etching, individual photos were taken of the etched samples with an SLR camera. In addition, images were taken of the sample halves strung together, on which the grain structure becomes visible over the entire bar height, as seen later in Figure 5 and Figure 6. The photos were then post-processed using an edge-smoothing filter to bring the highest resolution and sharpness of the morphology to bear.

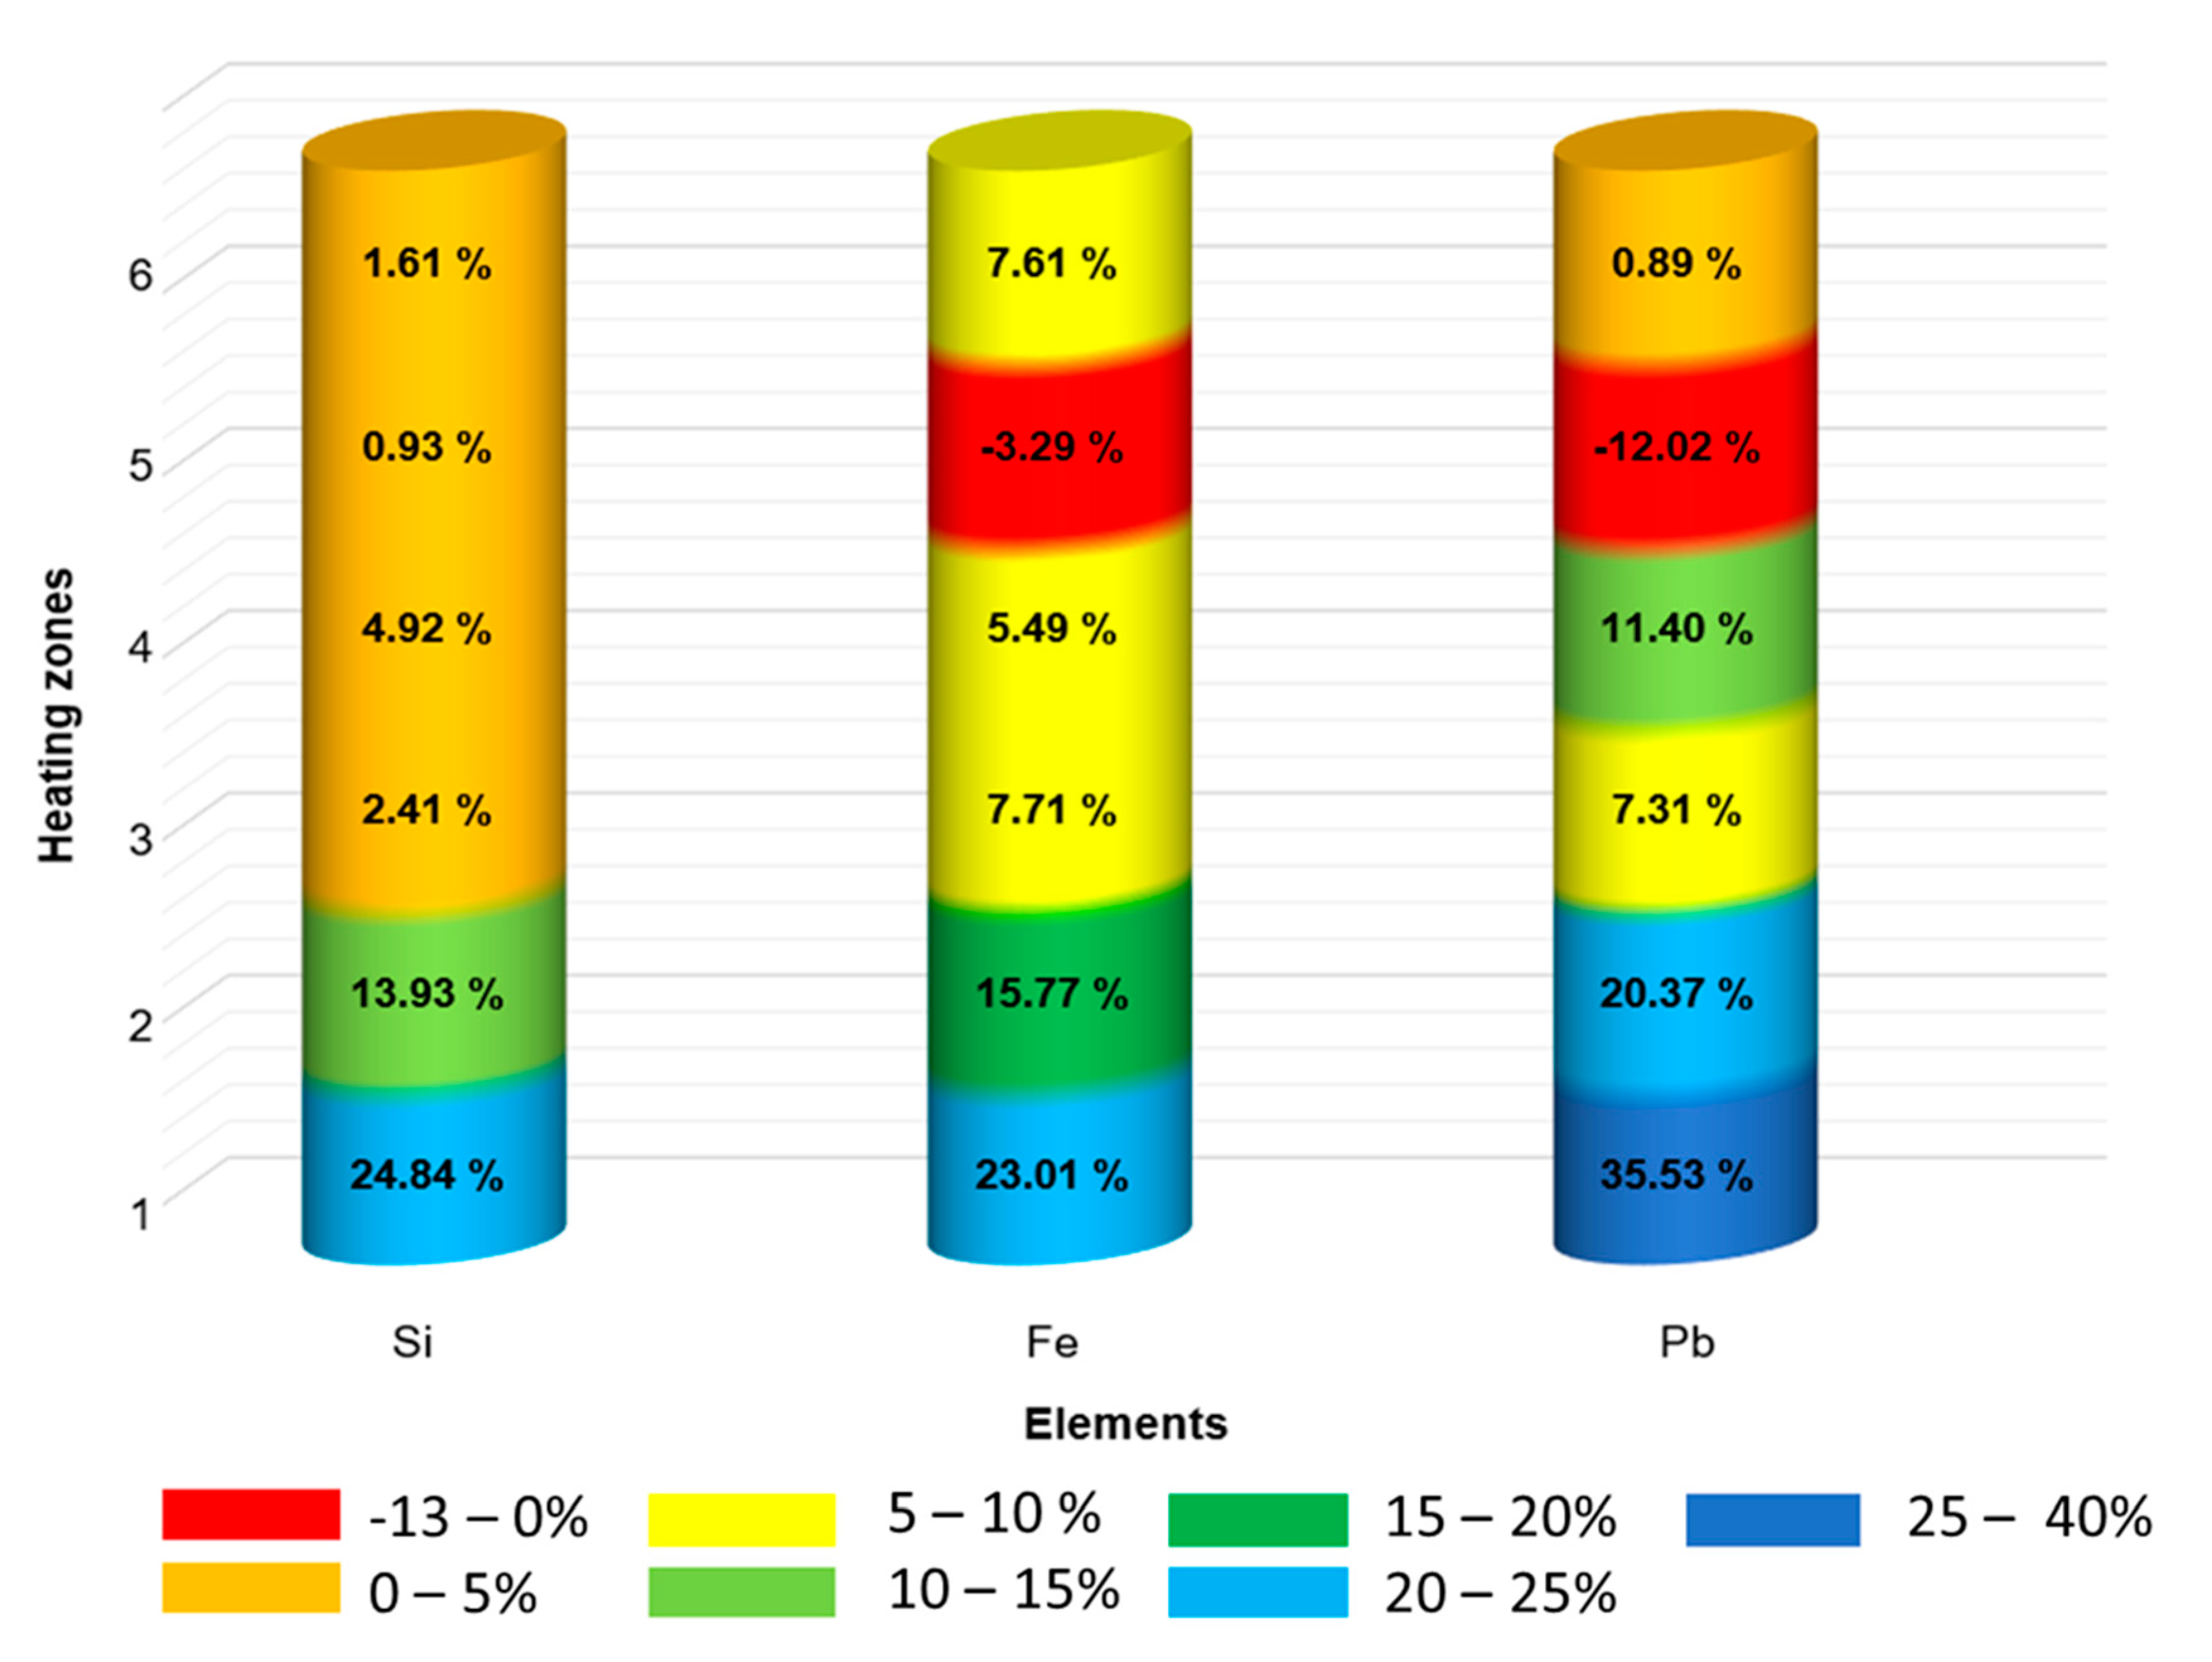
3. Results and Discussion

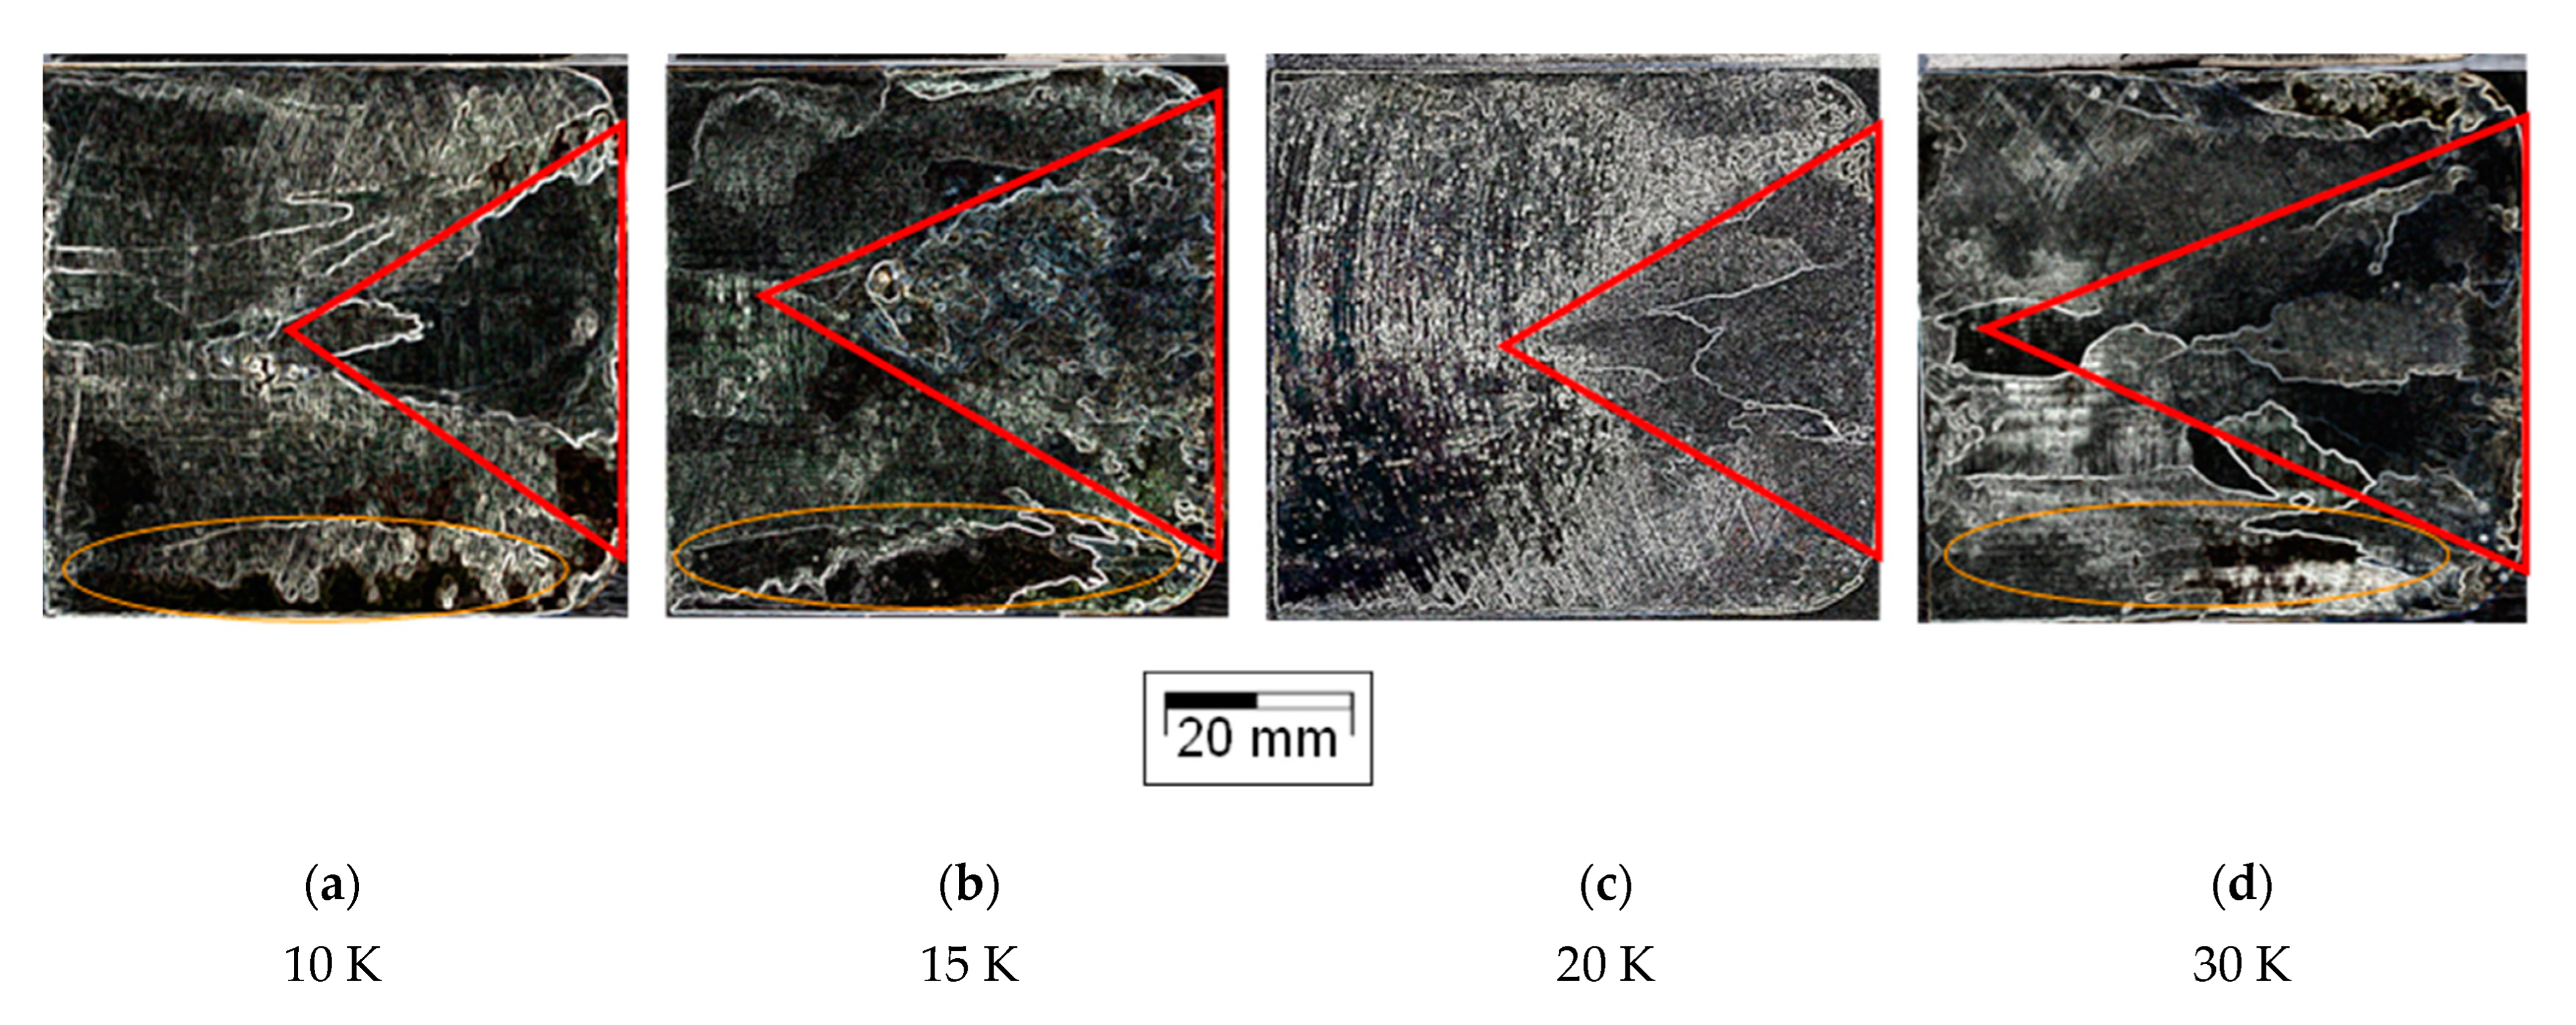
3.1. Macrographic Analysis

The grain morphology of the bottom section—Samples X.1.—of crystallized ingot was analyzed for all the investigated process parameters. At the beginning of the crystallization, several grains were nucleated on the bottom of the crucible due to the absence of a seed. As the crystallization moves forward, the grains begin to merge with each other, leaving predominantly grains with an upwards growth orientation. Due to some disorders on the inner wall of the crucible, some other grains would probably nucleate along the crucible wall during crystallization, but they would mostly be eliminated by the predominant grains growing upwards. Therefore, this macrographic analysis will focus only on the bottom region of the crucible.
Figure 5 shows the grain morphology at the bottom of the ingot, where the crystallization first started, for different cooling rates. The marked red area shows the region where the grains annulated themselves, enabling the predominant grain growth direction. As described from Equation (3), the slowest growth rate (10 K/h), induced by the lowest cooling rate, yielded the best result in terms of shifting the sample grain morphology from several grains with multiple orientations to a few big grains with similar upwards grain directions, assuring the interface stability. In contrast, by increasing the cooling rate to 50 K/h, the morphology became more chaotic.
Figure 6 shows the bottom structures of ingots crystallized with a constant cooling rate of 10 K/h at different temperature gradients (10, 15, 20, and 30 K). The regions within the red marked area show a much better interface stabilization for the sample crystallized at 20 K. While, theoretically, a higher temperature gradient would yield better interface stability (Equation (3)), the results for the highest temperature gradient (30 K) showed that the grains nucleated and grew from the furnace bottom already with an upwards growth direction, without cancelling each other. This results in a greater number of grains growing parallel to each other and can lead to the entrapment of solute. Therefore, among the process parameter ranges investigated in this work, the best results in terms of structure morphology and interface stabilization were achieved with a cooling rate of 10 K/h and a temperature gradient of 20 K.

3.2. Chemical Analysis

To gain a better insight into how the cleaning process took place over the whole length of the ingot, the samples related to the trial with the best conditions of the macrography analysis (10 K/h, 20 K) were analyzed using spark spectrometry. The results of the impurity content in the trial sample (C1) were compared with those of the initial sample (C0) and expressed as the reduction factor, as seen in Equation (4).
E x = 100 % · ( 1 C 1 C 0 )
That means the reduction factor describes the percentage by which the amount of the individual elements was changed after passing through the trial, in comparison to the initial sample. If it has a positive value, it means that the impurity content has been decreased after the process, while a negative value indicates the opposite situation.
Theoretically, the aluminum content in the lower region of the solidified ingot would be constantly above the content of the initial melt and would only drop towards the end, because the majority of the impurities would be driven with the melt to the upper side of the ingot during solidification. Therefore, the impurities are normally expected to have a consistently positive reduction factor until just before the upper end of the ingot. The concentration of impurities from measurements in the first heating zone, before and after the crystallization, is shown in Table 4.
The aforementioned theory, however, assumes an optimum distribution coefficient “k” for all impurities. The actual results of the sample are displayed in Figure 7. There is a clear variation in the purification ratio along the ingot.
One possible explanation is the different k-factor of the three impurities. Just taking the k-factor into consideration, lead should have the best reduction factors over the whole length of the crucible, followed by iron and then silicon. The results of Figure 7, however, differ from this theoretical expectation. That means that other factors may have an impact on the reduction factor as well. While the melt is slowly cooled down, the impurities are pushed up, accompanying the melt at the liquid–solid phase interface, to the next heating zone. Therefore, the concentration of the impurity in the molten part constantly increases, which leads to a thickening of the diffusion layer and consequently decreases the refining efficiency of the process. Comparing to a usual inductive heated zone melting, whose principle is more or less the same, the process here suffers from the lack of a natural as well as forced convection. That causes the increase in the diffusion layer thickness and downgrades the process efficiency strongly. Another influencing factor on the fluctuating reduction factor could be the density of the impurities and their difference to each other. In addition, the number of “passes” is very essential, as only one running pass in this work insufficient. From this point of view, this is very similar to the classic zone melting. All these possibly influencing points shall be subject to future investigations.

4. Conclusions

The basic feasibility of a cleaning process by means of the static crystallizer for aluminum was demonstrated. Clear differences in the variation of the cooling rate and the temperature gradient on the result of the fractional crystallization could be seen in the micrographic analysis.
The macrographic analysis proved to be essential for understanding the effect of the growth rate and temperature gradient on the stability of the interface during the first stages of crystallization. The formation of a “good” grain structure with the fewest grains possible can lead to an improved impurity segregation. This effect will be investigated in a future work.
Regarding the results of the spark spectrometry, the cleaning of the aluminum from Si, Fe, and Pb succeeded especially at the bottom of the ingot. However, the cleaning efficiency decreases strongly when moving upwards. A stronger convection within the system could increase the purification effect. The lack of any additional forced convection such as stirring, inductive mixing, etc., as well as the higher temperature in the upper regions of the melt result in the absence of any form of convection within the melt. This ultimately leads to the overaccumulation of the segregated solute ahead of the crystallization front. This enriched liquid can lead to the destabilization of the interface morphology, causing the breakdown of the planar interface into a cellular or dendritic structure, which in turn entraps the enriched solute during the crystallization.
To improve the transport of solute from the crystallization interface towards the bulk melt, it is suggested to apply a forced convection in the system. This can be, for example, in the form of mechanical mixing, an induction field, etc.

Author Contributions

Methodology, D.C.C. and S.F.; Validation, D.C.C. and S.F.; Investigation, M.G., D.C.C., C.J.M. and N.R.; Resources, B.F.; Data curation, D.C.C.; Writing—original draft, M.G. and D.C.C.; Writing—review & editing, S.F.; Supervision, S.F.; Project administration, S.F.; Funding acquisition, B.F. All authors have read and agreed to the published version of the manuscript.

Funding

This research received the funding (AZ 2016-4-16.12.20) from OTTO JUNKER foundation for the manufacturing of the static crystallization furnace.

Data Availability Statement

Data sharing not applicable.

Conflicts of Interest

The authors declare no conflict of interest.

References

  1. Tanaka, I.; Hoshikawa, H.; Megumi, T. Refining Technology and Low Temperature Properties for High Purity Aluminium; Sumitomo Chemical Co., Ltd.: Tokyo, Japan, 2013; pp. 1–12. [Google Scholar]
  2. Zhang, J.; Sun, B.; He, B. Principle and control of new-style purification equipment of 5N high purity aluminum. Chin. J. Mech. Eng. 2006, 42, 64. [Google Scholar] [CrossRef]
  3. Ostermann, F. Anwendungstechnologie Aluminium; Springer: Berlin/Heidelberg, Germany, 2014; pp. 171–180. [Google Scholar]
  4. Kondo, M.; Maeda, H.; Mizuguchi, M.J.J. The production of high-purity aluminum in Japan. JOM 1999, 42, 36–37. [Google Scholar] [CrossRef]
  5. Curtolo, D.C.; Friedrich, S.; Bellin, D.; Nayak, G.S.; Friedrich, B.J.M. Definition of a first process window for purification of aluminum via “Cooled Finger” crystallization technique. Metals 2017, 7, 341. [Google Scholar] [CrossRef]
  6. Yan, X.Y.; Fray, D.J. Molten salt electrolysis for sustainable metals extraction and materials processing—A review. In Electrolysis: Theory, Types and Applications; Nova Science Publishers: New York, NY, USA, 2010; pp. 255–302. [Google Scholar]
  7. Pfann, W.G. Zone Melting: This technique offers unique advantages in purification and in control of composition in various substances. Science 1962, 135, 1101–1109. [Google Scholar] [CrossRef] [PubMed]
  8. Cheung, N.; Bertazzoli, R.; Garcia, A. Experimental impurity segregation and numerical analysis based on variable solute distribution coefficients during multi-pass zone refining of aluminum. J. Cryst. Growth 2008, 310, 1274–1280. [Google Scholar] [CrossRef]
  9. Widiatmo, J.V.; Harada, K.; Yamazawa, K.; Arai, M. Estimation of impurity effect in aluminium fixed-point cells based on thermal analysis. Metrologia 2006, 43, 561. [Google Scholar] [CrossRef]
  10. Barthel, J.; Buhirg, E.; Al, E. Kristallisation aus Schmelzen; Verlag für Grundstoffindustrie: Leipzig, Germany, 1982; p. 356. [Google Scholar]
  11. Burton, J.; Prim, R.; Slichter, W. The distribution of solute in crystals grown from the melt. Part I. Theoretical. J. Chem. Phys. 1953, 21, 1987–1991. [Google Scholar] [CrossRef]
  12. Burton, J.; Prim, R.; Slichter, W. The distribution of solute in crystals grown from the melt. Part II. Experimental. J. Chem. Phys. 1953, 21, 1991–1996. [Google Scholar] [CrossRef]
  13. Tiller, W.; Jackson, K.; Rutter, J.; Chalmers, B. The redistribution of solute atoms during the solidification of metals. Acta Metall. 1953, 1, 428–437. [Google Scholar] [CrossRef]
  14. Ostrogorsky, A.G.; Glicksman, M.E. Segregation and component distribution. In Handbook of Crystal Growth; Elsevier: Amsterdam, The Netherlands, 2015; pp. 995–1047. [Google Scholar]
  15. Aleks, G.O.; Martin, E.G. Segregation and Component Distribution. In Handbook of Crystal Growth: Bulk Crystal Growth, 2nd ed.; Elsevier: Amsterdam, The Netherlands, 2014; Volume 2, pp. 1000–1018. ISBN 9780444633064. [Google Scholar] [CrossRef]
  16. Viardin, A.; Böttger, B.; Apel, M. Phase field assisted analysis of a solidification based metal refinement process. Mater. Theory 2022, 6, 1–22. [Google Scholar] [CrossRef]
  17. Kurz, W.; Fisher, D.J. Fundamentals of Solidification; Trans Tech Publications: Zürich, Switzerland, 1992; pp. 46–48. [Google Scholar]
  18. Ecklebe, S.; Woittennek, F.; Winkler, J. Control of the vertical gradient freeze crystal growth process via backstepping. IFAC-PapersOnLine 2020, 53, 7758–7764. [Google Scholar] [CrossRef]
  19. Wang, X.; Ma, N.; Bliss, D.; Iseler, G. Solute segregation during modified vertical gradient freezing of alloyed compound semiconductor crystals with magnetic and electric fields. Int. J. Heat Mass Transf. 2006, 49, 3429–3438. [Google Scholar] [CrossRef]
  20. Birkmann, B.; Rasp, M.; Stenzenberger, J.; Müller, G. Growth of 3″ and 4″ gallium arsenide crystals by the vertical gradient freeze (VGF) method. J. Cryst. Growth 2000, 211, 157–162. [Google Scholar] [CrossRef]
  21. Monberg, E.; Gault, W.; Simchock, F.; Dominguez, F. Vertical gradient freeze growth of large diameter, low defect density indium phosphide. J. Cryst. Growth 1987, 83, 174–183. [Google Scholar] [CrossRef]
  22. Brice, J.C.; Rudolph, P. Crystal Growth. In Ullmann’s Encyclopedia of Industrial Chemistry; Wiley-VCH: Weinheim, Germany, 2007; pp. 559–560. [Google Scholar]
  23. Wafer Technology Ltd. Available online: http://www.wafertech.co.uk/growth.htm (accessed on 27 November 2022).
Figure 1. Depiction of the boundary layer ahead of the crystallization front, adapted from [13,14].
Metals 13 00280 g001
Figure 2. An example (GaAs crystal growth) of the experimental setup for the vertical gradient freeze method, adapted from [23].
Metals 13 00280 g002
Figure 3. Static crystallization furnace.
Metals 13 00280 g003
Figure 4. Schematics of the sampling for the macrographic and chemical analysis.
Metals 13 00280 g004
Figure 5. Grain structure of samples 1.1.A (a), 2.1.A (b), and 3.1.A (c) at a temperature gradient of 20 K and cooling rates of 10, 20, and 50 K/h.
Metals 13 00280 g005
Figure 6. Grain structure of samples 4.1.A (a), 5.1.A (b), 1.1.A (c), and 6.1.A (d) at a cooling rate of 10 K/h and temperature gradient of 10, 15, 20, and 30 K.
Metals 13 00280 g006
Figure 7. Reduction factor over the heating zones of silicon, iron, and lead at a cooling rate of 10 K/h and a temperature gradient of 20 K.
Metals 13 00280 g007
Table 1. Distribution coefficients of impurities in aluminum [5,9,10].
ElementkElementk
Fe0.018–0.053Ti7–11
Cu0.15–0.153Si0.082–0.12
Ag0.2–0.3K0.56
Au0.18Zr2.3–3
Zn0.35–0.47Pb0.0007
Ni0.004–0.09P<0.01
Mn0.55–0.9Sc0.9
Mg0.29–0.5Sb0.09
Ca0.06–0.08V3.3–4.3
Cr1.8Na0.013
Table 2. Chemical composition of the starting alloy for the cast melts.
ElementsMelt 1 (wt.%)Melt 2 (wt.%)Melt 3 (wt.%)Average (wt.%)
Al99.741499.794799.773799.770
Si0.11600.09080.10400.104
Fe0.04260.03240.03330.036
Pb0.04690.04750.05020.048
Table 3. Process parameters of the six trials.
TrialCooling Rate (K/h)Temperature Gradient (K)
11020
22020
35020
41010
51015
61030
Table 4. Concentration of impurities in the first zone (1) before and after crystallization.
ImpuritiesHighest
Purification Factor
C0 (wt.%)Cs (wt.%)
Si24.84%0.1040.078
Fe23.01%0.0360.028
Pb35.53%0.0480.031
Disclaimer/Publisher’s Note: The statements, opinions and data contained in all publications are solely those of the individual author(s) and contributor(s) and not of MDPI and/or the editor(s). MDPI and/or the editor(s) disclaim responsibility for any injury to people or property resulting from any ideas, methods, instructions or products referred to in the content.

