Abstract
The temperature dependences of the kinematic viscosity during heating and cooling have been investigated in Co-B melts with a boron content of up to 30.8 at. A liquid–liquid structural transition was found, which is accompanied by an increase in the activation energy and cluster size, as well as a significant decrease in the density of the melt. The liquid–liquid structural transition was associated with the formation of clusters with a short-range order of Co23B6 in the intermediate temperature region. At low and high temperatures, clusters of the order of an atomic size are active participants in the viscous flow. It was shown that with an increase in the cluster size, the activation energy increases and the viscosity of melts decreases. The formation of large Co23B6 clusters during the cooling of melt with low boron content leads to undercooling and the appearance of the transition temperature region with high activation energy, although this region does not exist during the heating stage.
1. Introduction
The activation of atoms (molecules and clusters) in a liquid is associated with the transfer of energy sufficient to overcome the energy barrier by the atoms. The activation theory of a viscous fluid represents the temperature dependence of the kinematic viscosity in the form of an Arrhenius equation, which includes the activation energy. Liquid multicomponent alloys have a microheterogeneous structure [1]. The difference in the energy of interatomic bonds is the reason for the formation of clusters of different composition, structure, and size that have different stability. The composition and cluster size change with temperature. Most often, in liquid metals, the cluster size decreases with increasing temperature.
A liquid can have several thermodynamic states, the transition between which is a liquid–liquid transition [2]. Liquid–liquid structure transition (LLST) is accompanied by structural transformations [3]. LLST is revealed as anomalies in the temperature dependence of structurally sensitive properties such as density [4], viscosity [5], electrical resistivity [6], internal friction [7], and magnetization [8]. The discontinuous change in the structure during the heating of the melt is accompanied by an endothermic peak [9] as well as a decrease in the coordination number [10].
Co-B alloys are the subject of numerous studies. These alloys served as the basis for the creation of amorphous soft magnetic materials with high permeability, in which boron contributes to the formation of an amorphous structure [11,12]. Co-B alloys are used as hydrogen storage materials [13] and as transducers to detect acoustic propagation and heat transport at the interface [14]. During the manufacturing process, most materials go through a melting stage. In ref. [15], the temperature dependences of the kinematic viscosity and density of Co-B melts with different boron contents were studied. Upon cooling, a stable Co2B phase [16] or metastable phases Co3B and Co23B6 [17] are formed in an alloy with a boron content of less than 35 at.%. The phase composition of the alloy after solidification strongly depends on the overheating temperature of the melt [18] and solidification pathways [19,20].
In this work, we studied the activation energy of viscous flow and LLST in Co-B melts with a boron content of up to 30.8 at.%.
2. Materials and Methods
Master alloy Co61B39 was melted in a vacuum arc furnace from a pressed briquette of electrolytic cobalt and amorphous boron. Alloy samples were obtained by melting the master alloy with cobalt. The chemical composition was determined using a DFS-500 Optical Emission Spectrometer, OKB Spectr, Saint-Petersburg, Russia. We studied Co100−xBx alloys with a boron content of x = 4.4, 8.7, 18.6, 25.6, and 30.8 at.%. The Co81.4B18.6 alloy is eutectic, while the Co74.4B25.6 alloy corresponds to the metastable Co3B compound. The kinematic viscosity was measured using oscillating cup viscometer in an atmosphere of pure helium at a pressure of 105 Pa [21]. The samples were placed in a beryllium oxide cup suspended by a torsion wire. The oscillation of the cup was dampened by the frictional force between the layers of the liquid. The melt was kept at a predetermined temperature for 5 min to stabilize the structural state. During heating and cooling, the temperature of the melt was changed by a step of 30 K. The kinematic viscosity was calculated from the results of measuring the decrement based on the Shvidkovskiy algorithm. The activation energy Ea was calculated from the temperature dependence of the viscosity in the linear sections of the Arrhenius plot. The error in measuring the kinematic viscosity was 3%. The melt density was measured by the sessile drop method in a helium atmosphere. The error in measuring the density did not exceed 3%.
3. Results
The temperature dependence of the kinematic viscosity can be represented by the Arrhenius equation:
where ν is the kinematic viscosity (m2·s−1), ν0 is a pre-exponential factor with the dimension of the kinematic viscosity, Ea is the activation energy of the viscous flow (J·mol−1), R is the gas constant (J·K−1·mol−1), and T is the absolute temperature (K). After taking the logarithm of Equation (1), we obtain the Arrhenius plot:
where Ea·(RT)−1 is the reduced activation energy, which compares the activation energy Ea with the thermal energy RT. At constants ν0 and Ea, the logarithm of the kinematic viscosity is a linear function of the inverse absolute temperature.
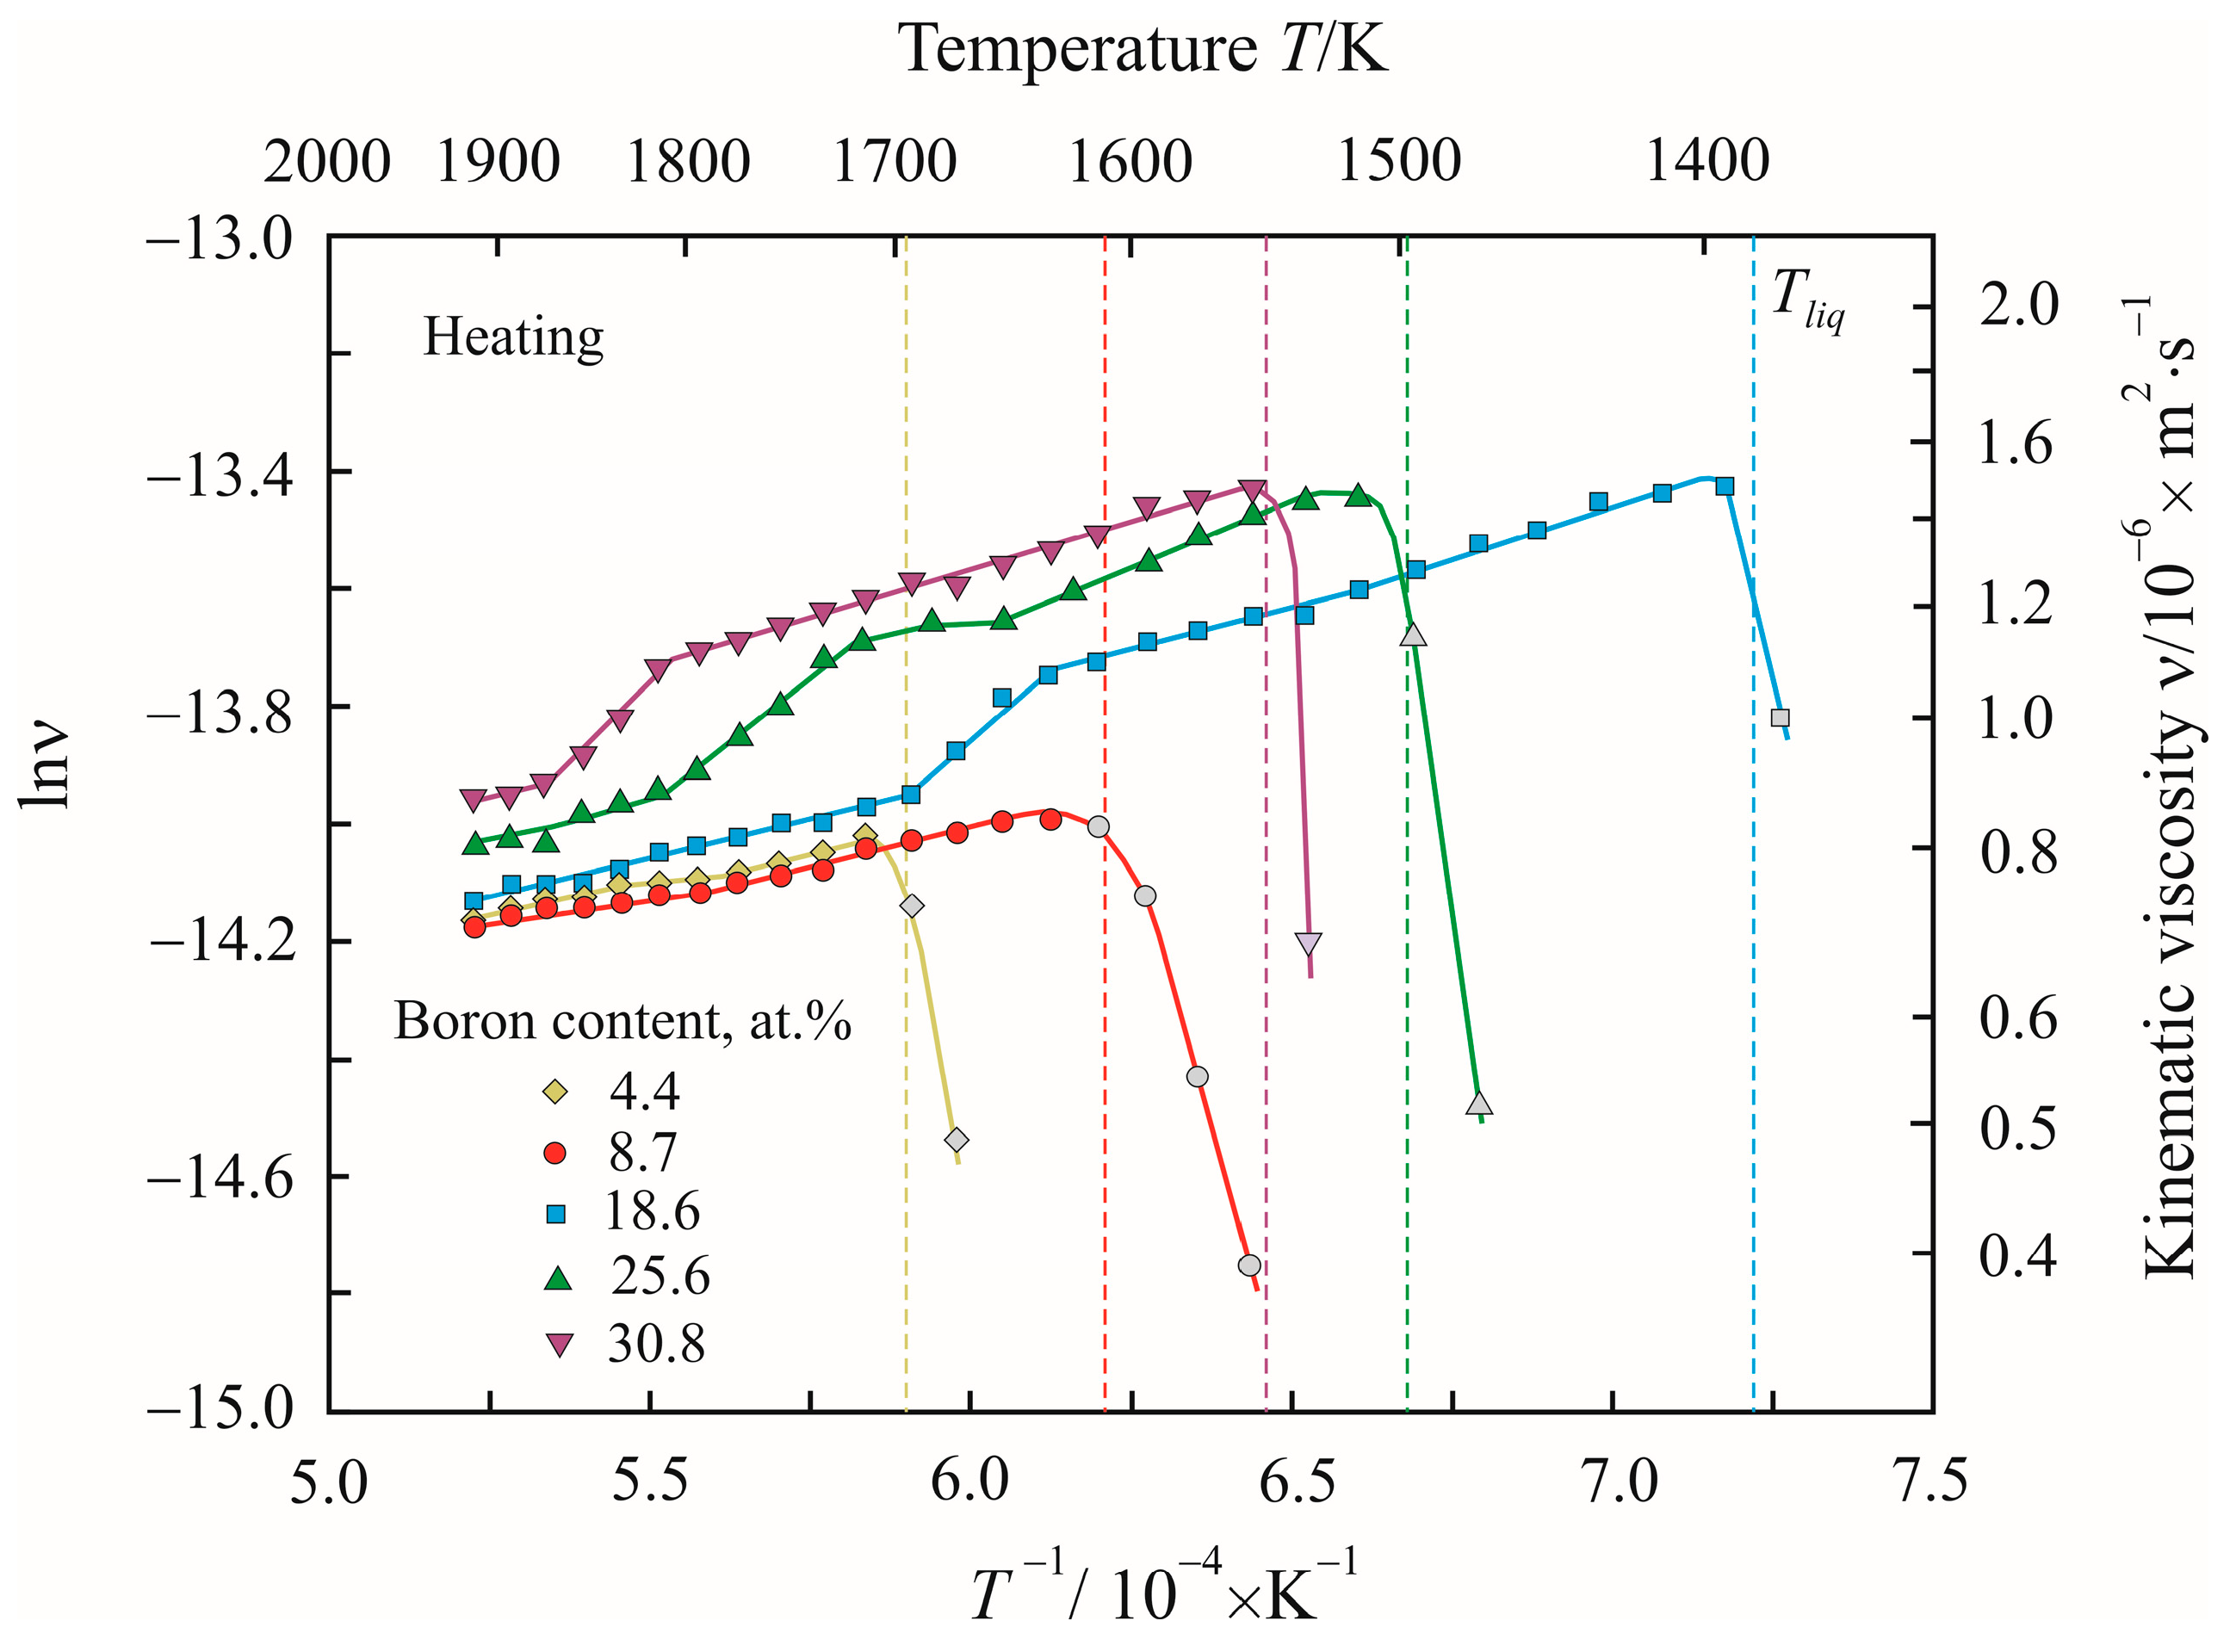
Figure 1 shows Arrhenius plots as the dependences of the natural logarithm of the kinematic viscosity lnν on the reciprocal temperature T−1 when Co100−xBx alloys are heated to a temperature of 1914 K. The vertical dashed lines show the liquidus temperature Tliq, the value of which is taken from [16]. The color of the dashed lines matches the color of the temperature curves for alloys with the same boron content. At a temperature above Tliq, the alloy is in a liquid state, and the viscosity of the melt naturally decreases with increasing temperature. Points below the liquidus temperature are highlighted in gray. In an oscillating cup viscometer, the decrement is related to the mass of fluid that is in contact with the solid surface of the oscillating body. Therefore, the steep rise of gray dots during heating in this temperature range indicates an increase in the fraction of the liquid phase in the solid–liquid state upon melting. From Figure 1, it follows that in alloys with high boron content, when heated, Arrhenius plots have linear sections at low and high temperatures. At intermediate temperatures, there is a transition region in which the slope of the Arrhenius plots is noticeably greater. In alloys with low boron content, there is no transition temperature region. In addition, viscosity increases with increasing boron content. A minor exception is alloys with boron content between 8.7 and 4.4 at.%.
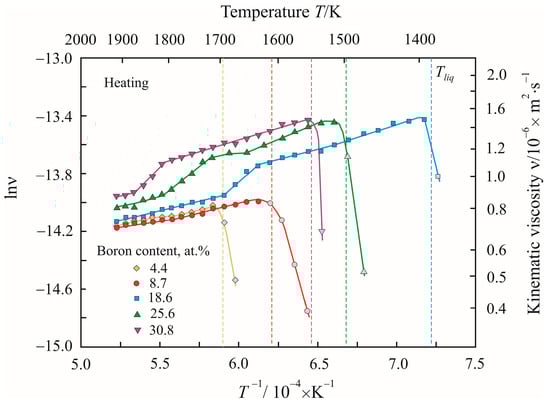
Figure 1.
Dependences of the natural logarithm of the kinematic viscosity lnν on the reciprocal temperature T−1 during heating of Co100−xBx alloys. The vertical dashed lines show the liquidus temperatures Tliq. The gray dots refer to the solid–liquid state.
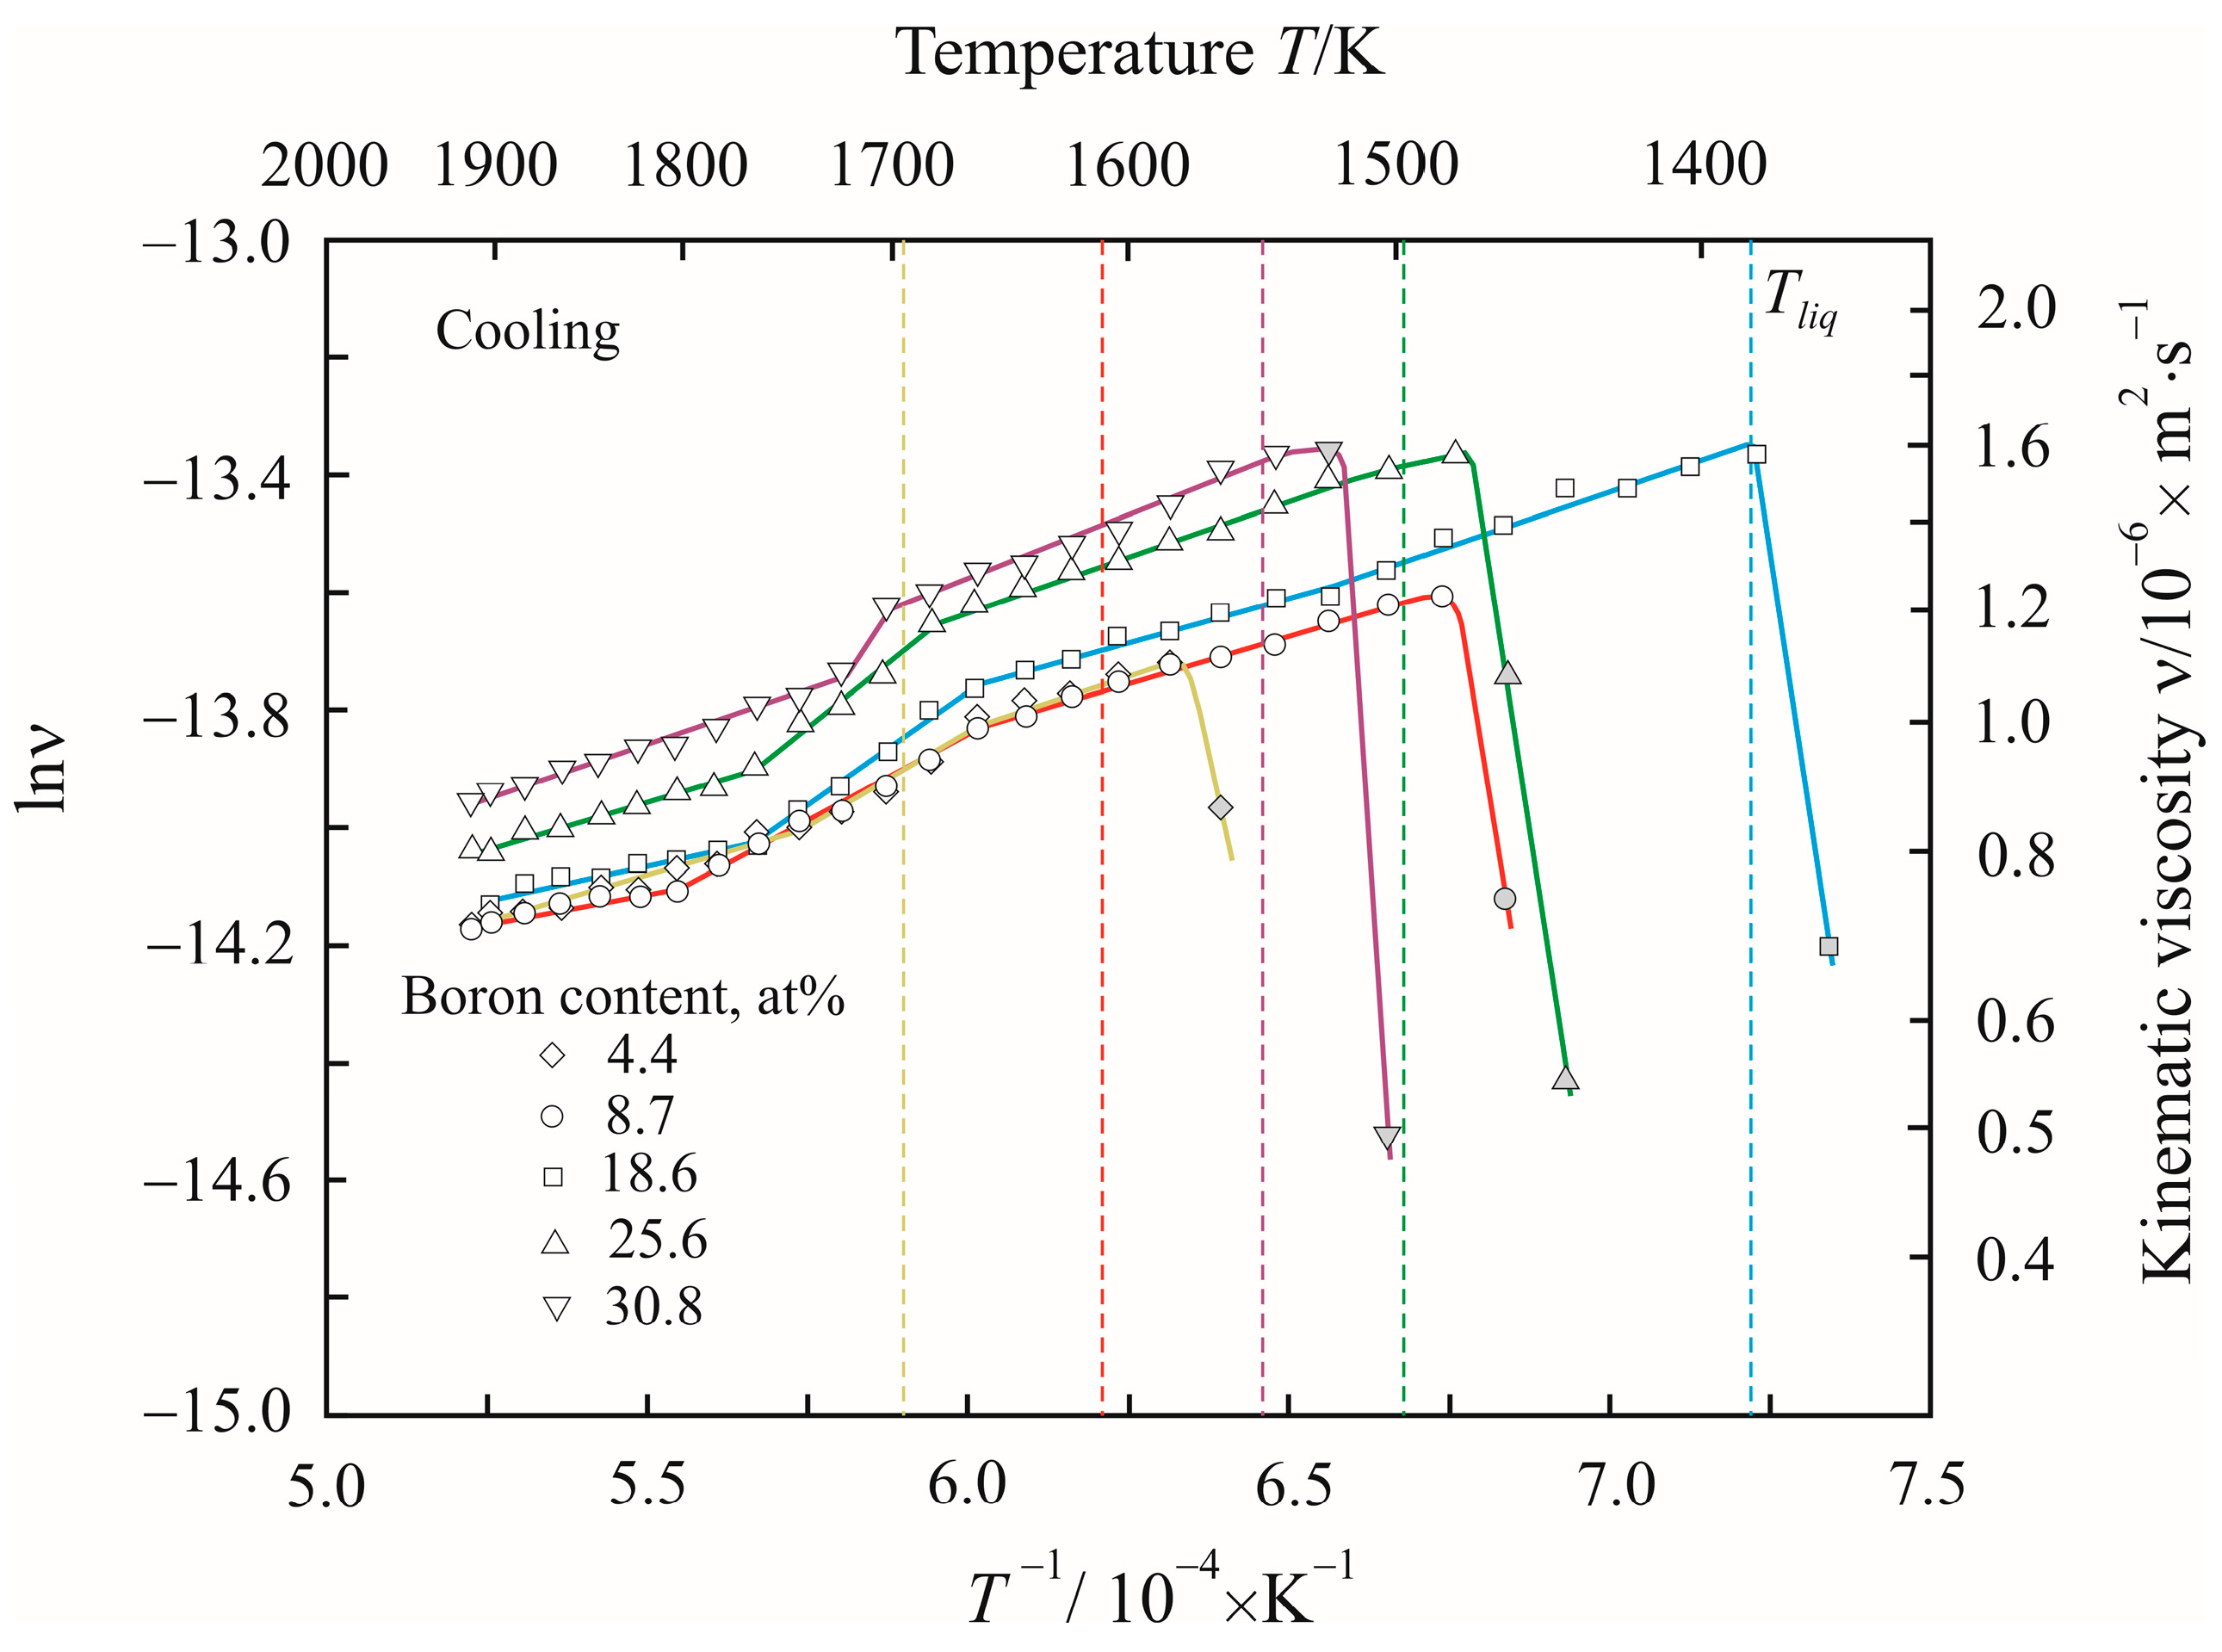
Figure 2 shows Arrhenius plots as the dependences of the natural logarithm of the kinematic viscosity lnν on the reciprocal temperature T−1 during cooling of Co100−xBx alloys at a temperature of 1914 K. At cooling, some alloys remain in the liquid state below the liquidus temperature and pass into the undercooled state. In the undercooling state, a transition temperature region appears in alloys with low boron content.
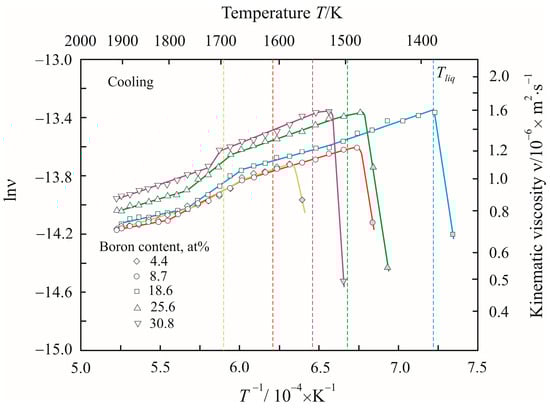
Figure 2.
Dependences of the natural logarithm of the kinematic viscosity lnν on the reciprocal temperature T−1 during cooling of Co100−xBx alloys. The vertical dashed lines show the liquidus temperatures Tliq. The gray dots refer to the solid–liquid state.
In general, from Figure 1 and Figure 2, it follows that the kinematic viscosity increases with increasing boron content. Linear segments can be distinguished by the dependence of lnν on T−1. In the intermediate temperature range from 1650 to 1850 K, the slope of the linear segments is noticeably greater. During heating (Figure 1) in alloys with a low boron content of 4.4 and 8.7 at.%, there is no transition temperature region. With an increase in the boron content, the transition region shifts towards a high temperature. On cooling (Figure 2), the intermediate region shrinks with increasing boron content.
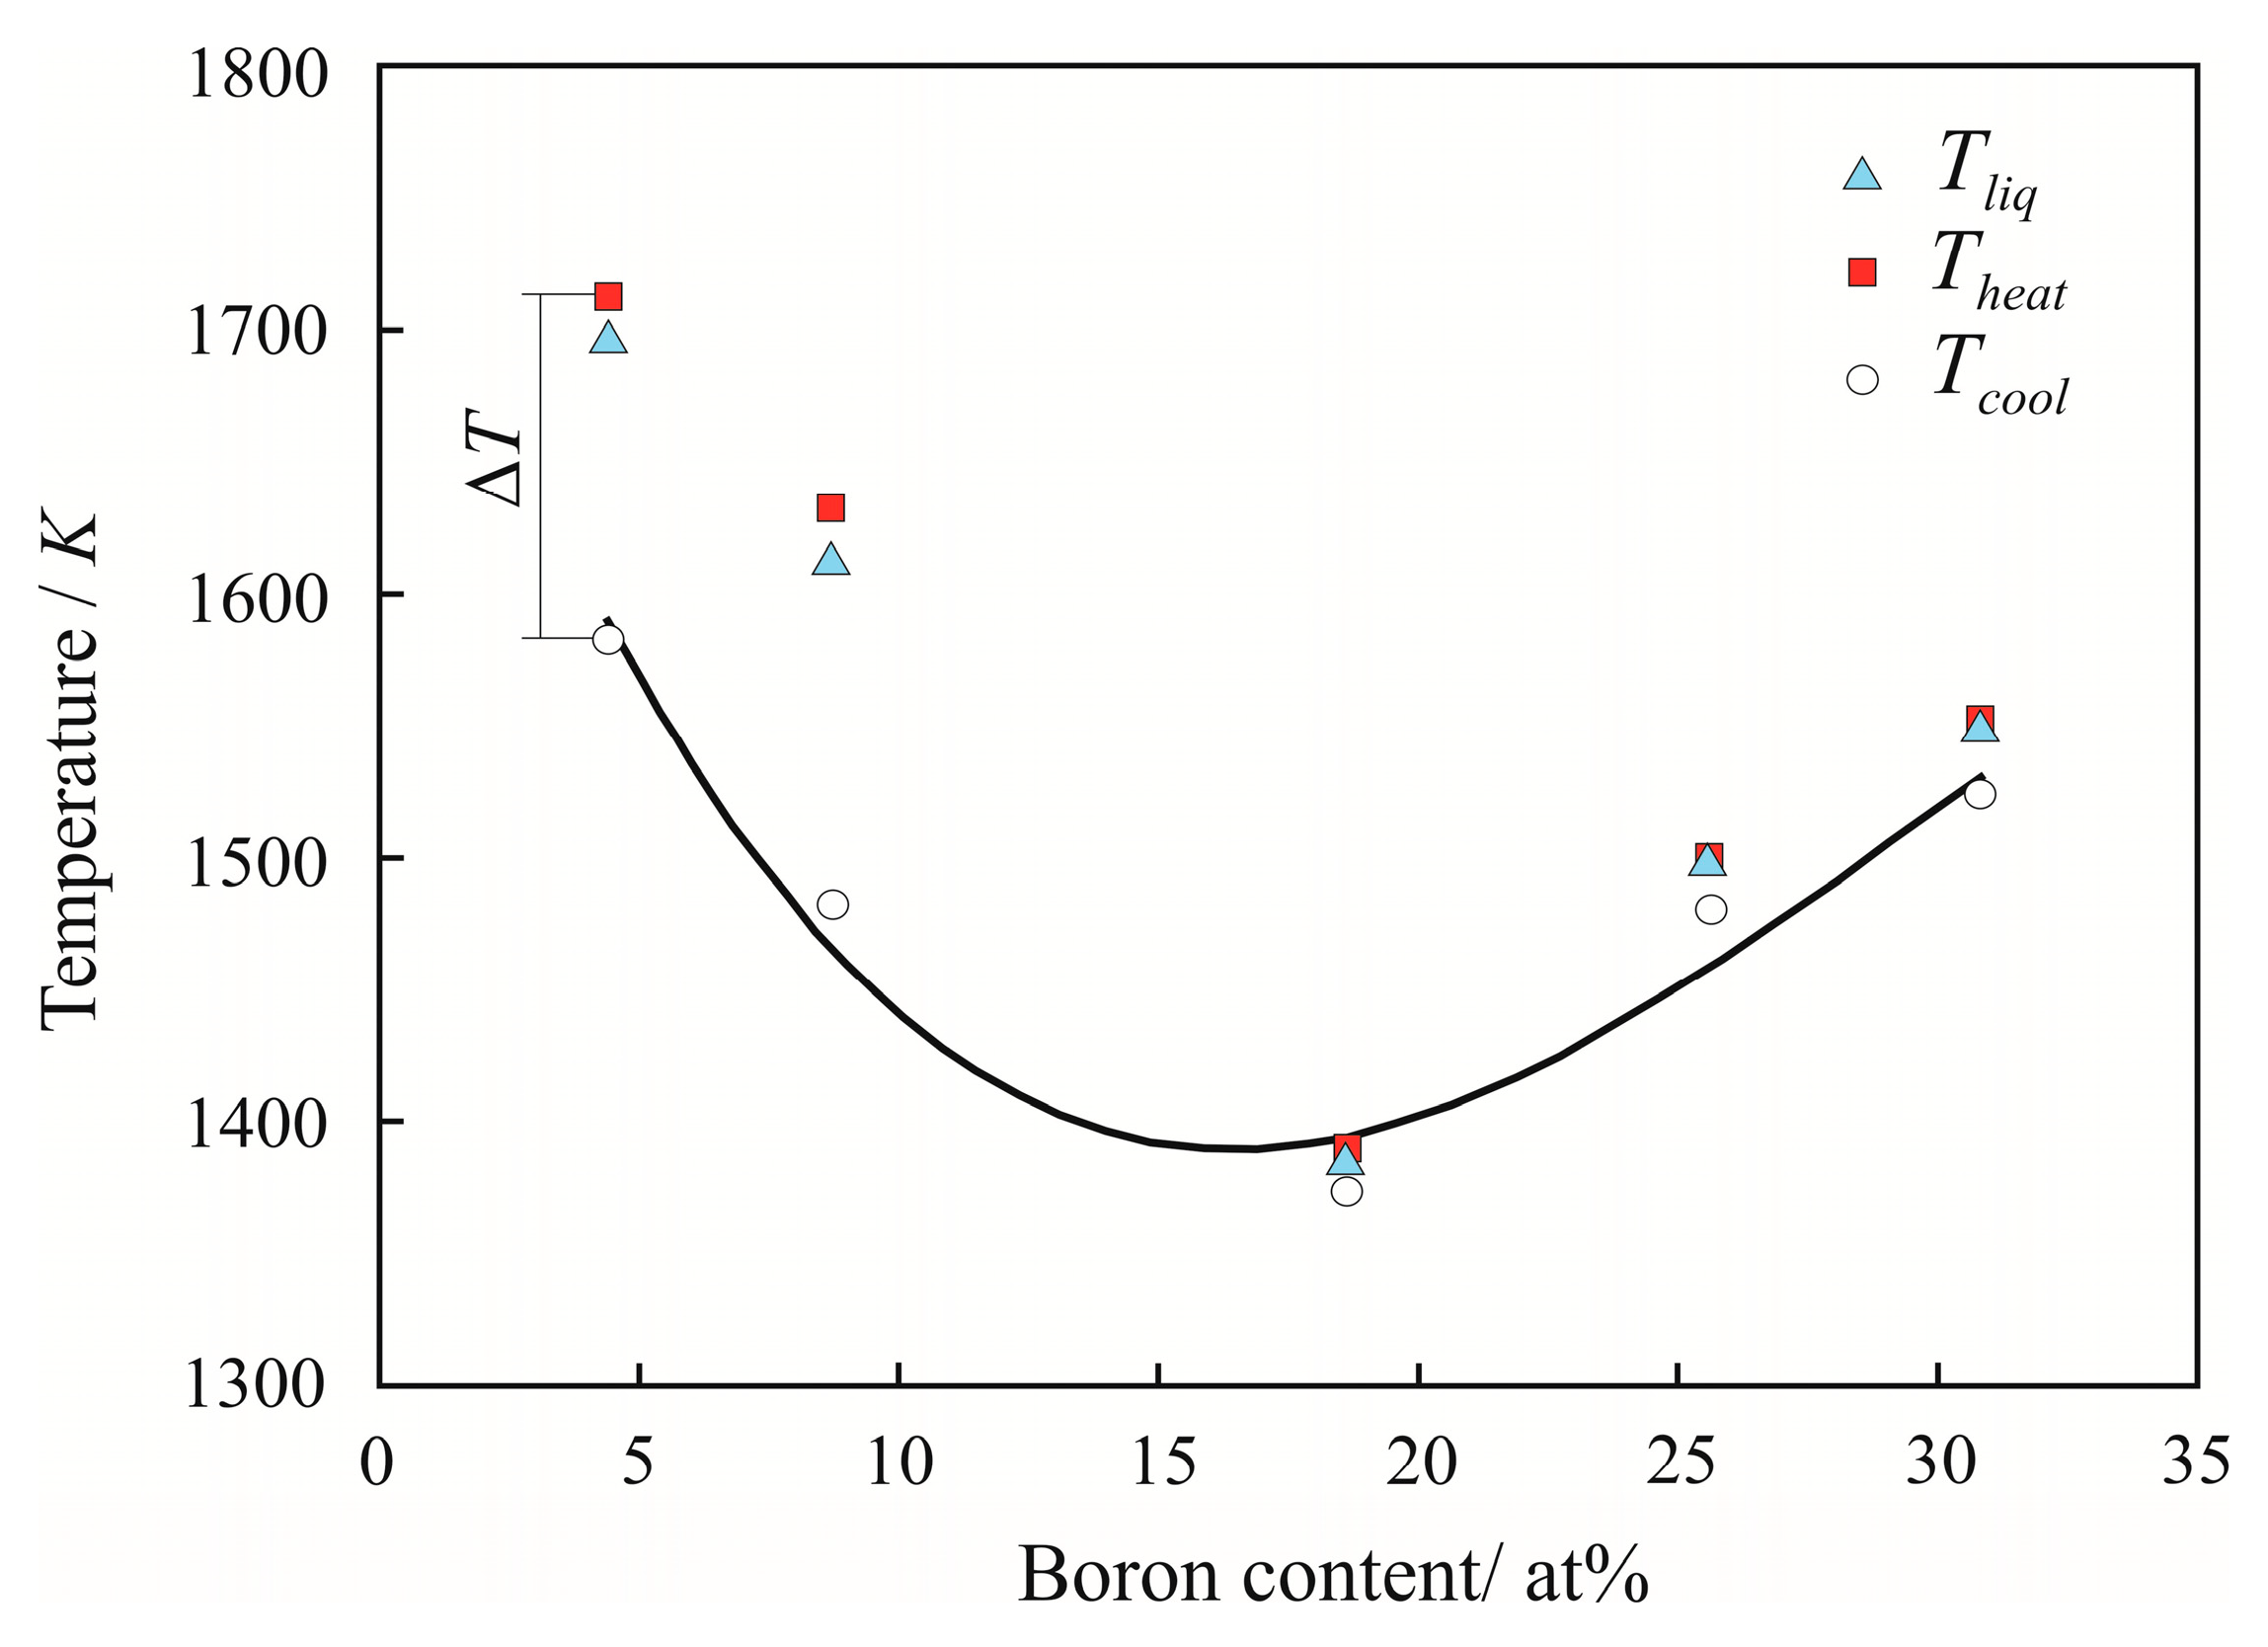
Figure 3 shows the effect of the boron content on the liquidus temperature Tliq [16], as well as on the temperatures Theat and Tcool. The quantities Theat and Tcool indicate the temperature below which the calculated viscosities drop steeply upon heating and cooling, respectively, and the difference between these temperatures, ΔT = Theat − Tcool can be taken as the undercooling temperature. It can be seen that alloys with a low boron content have the highest undercooling.
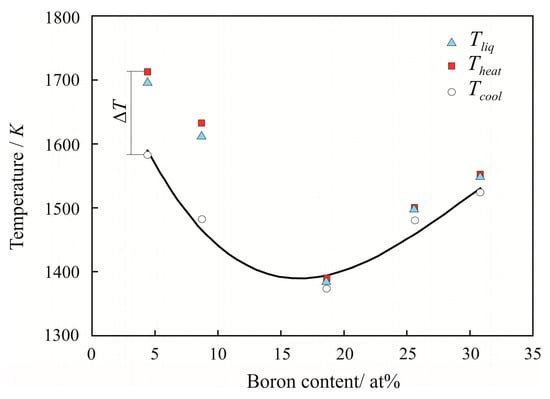
Figure 3.
Effect of boron content on the liquidus temperature Tliq, as well as on the temperatures Theat and Tcool, below which the calculated viscosities drop steeply upon heating and cooling, respectively. The undercooling ΔT = Theat − Tcool.
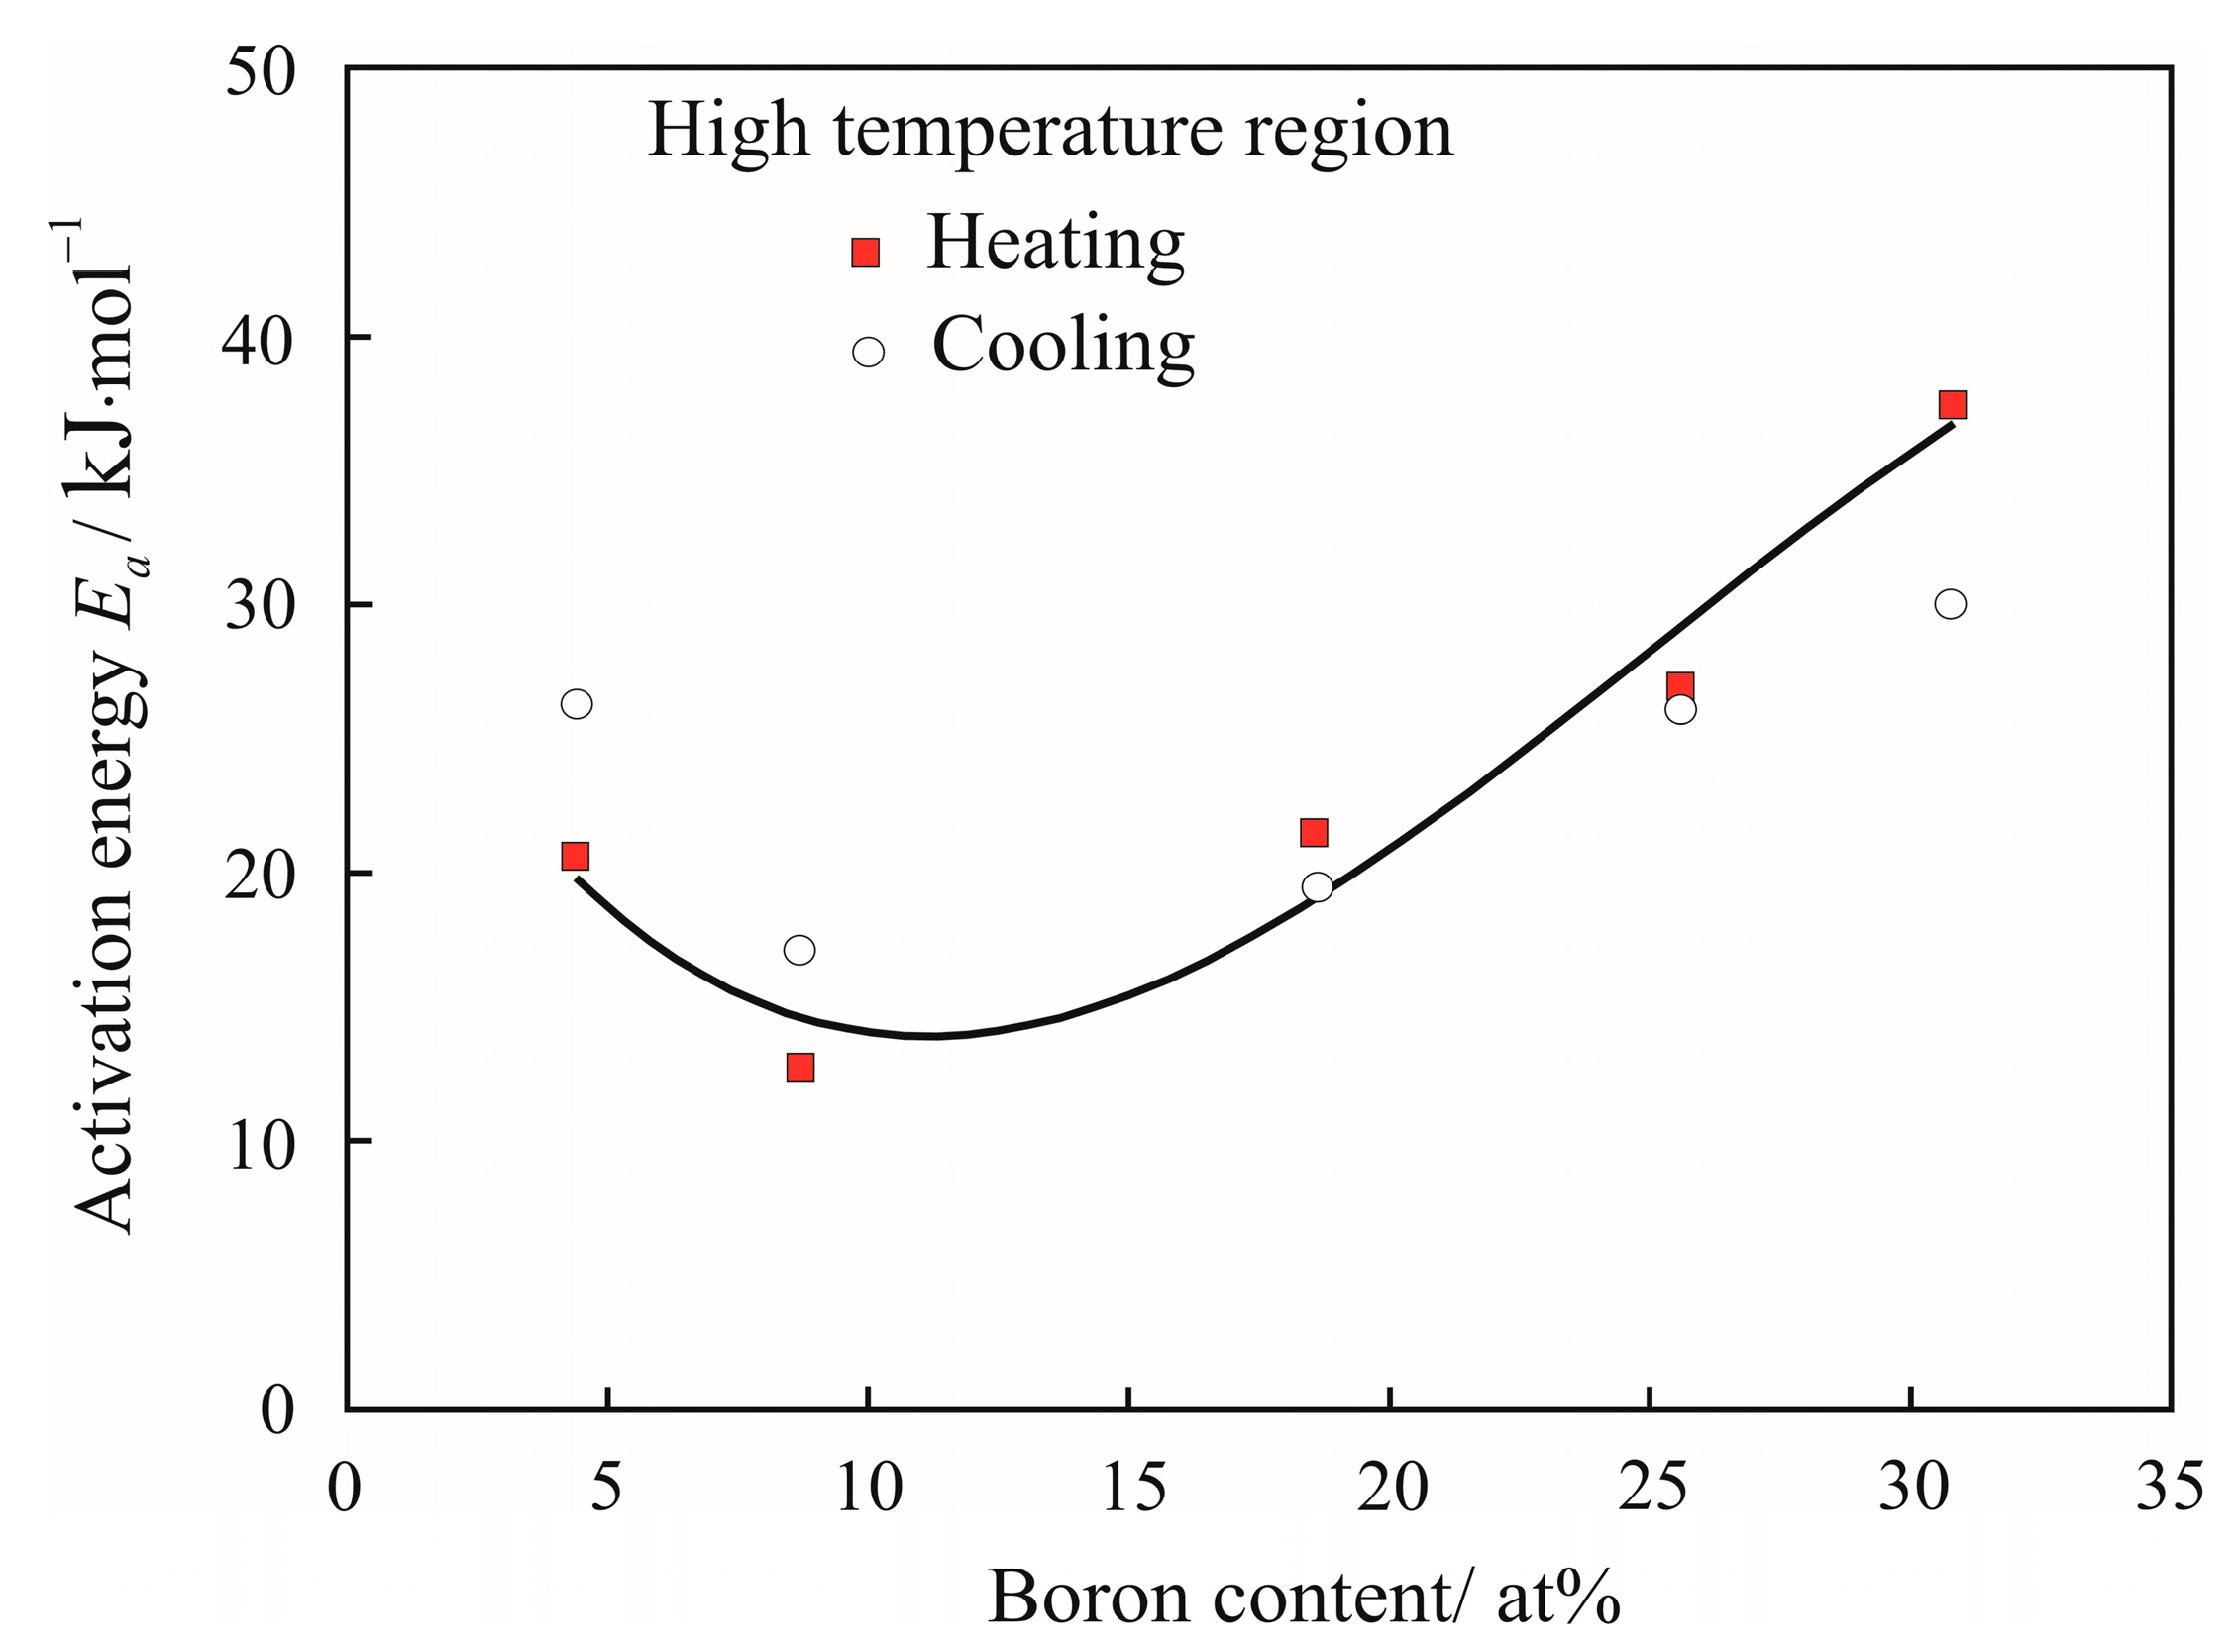
Figure 4 shows the effect of the activation energy Ea on the boron content during heating and cooling near a temperature of 1900 K. It can be seen that the activation energy increases with increasing boron content, although in the alloy with the lowest boron content, Co95.6B4.4, there is a trend towards an increase in the activation energy.
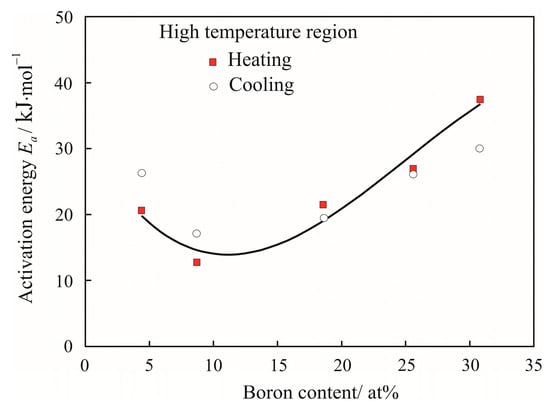
Figure 4.
Effect of boron content on activation energy Ea in Co100−xBx alloys during heating and cooling near 1900 K.
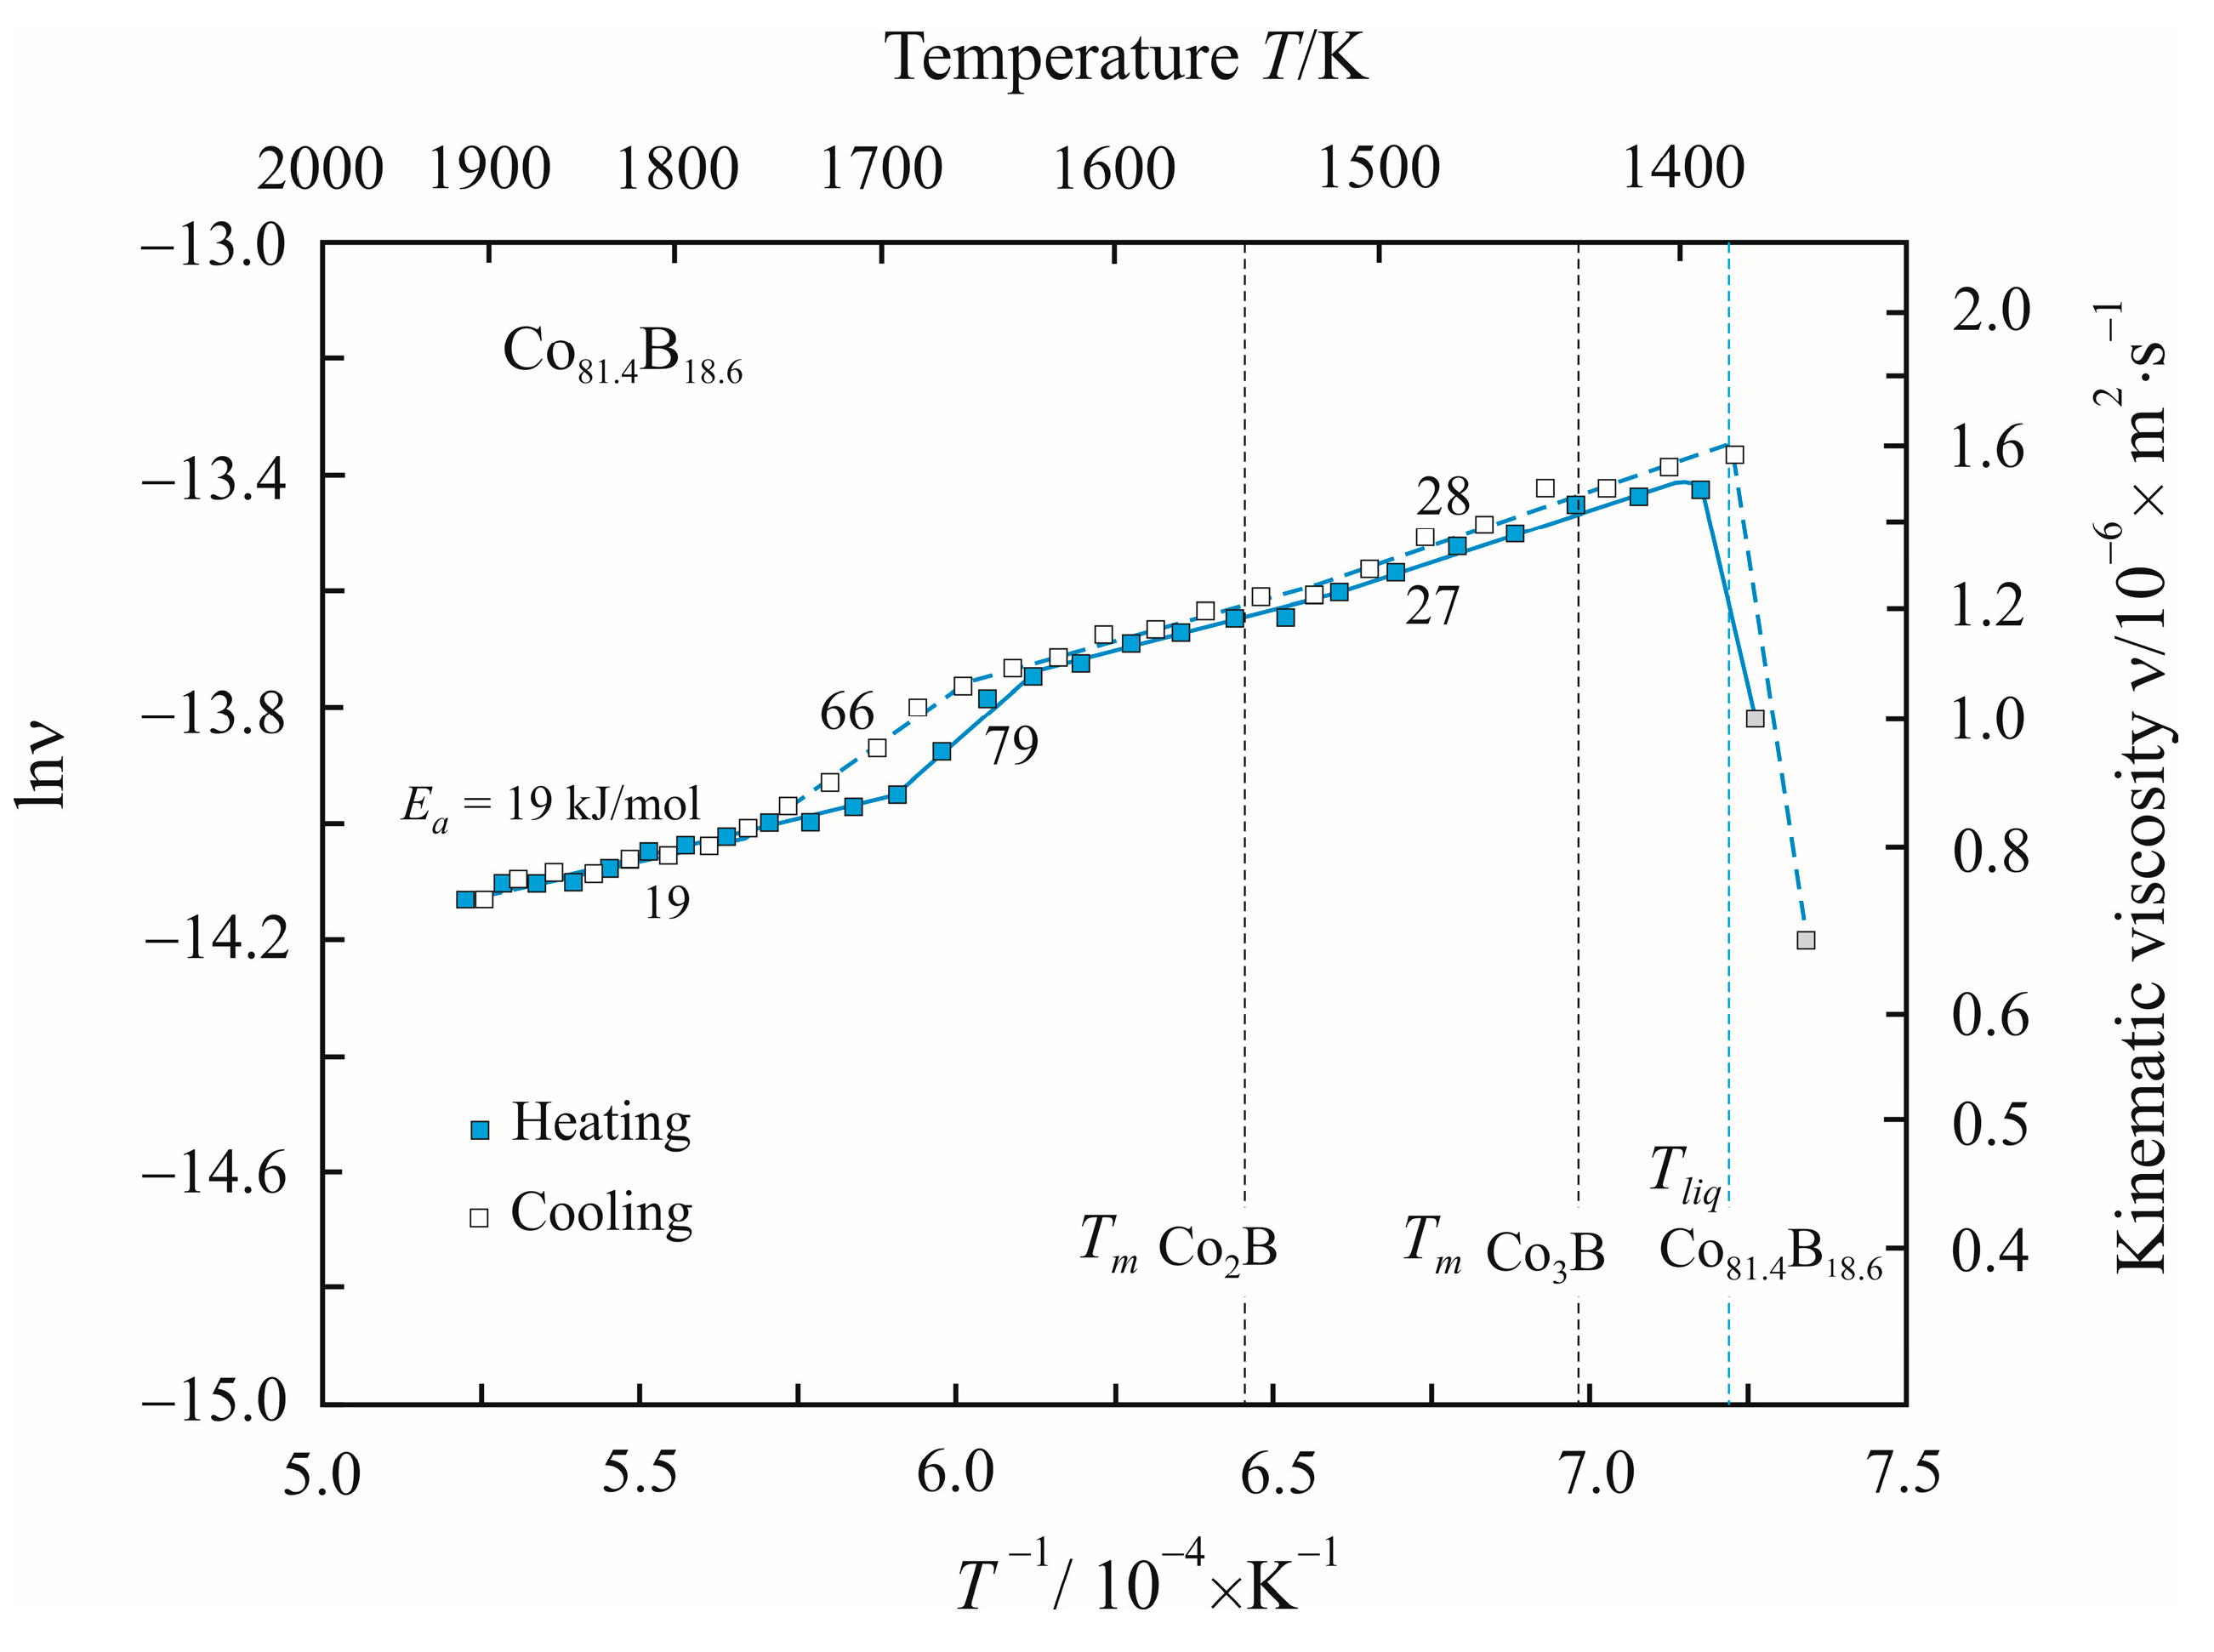
Figure 5 shows Arrhenius plots of the dependence of the natural logarithm of the kinematic viscosity lnν on the reciprocal temperature T−1 during heating and cooling of the eutectic Co81.4B18.6 alloy. The numbers next to the curves represent the activation energy Ea in the corresponding temperature interval. It can be seen that the activation energy is minimal in the high-temperature region and slightly higher in the low-temperature region, and the highest activation energy falls in the intermediate region. If, at high and low temperatures, the heating and cooling curves are combined, then there is a discrepancy in forming a hysteresis loop in the intermediate region. The constancy of the activation energy in a certain temperature interval allows us to assume that the structure of the melt in this interval is almost unchanged.
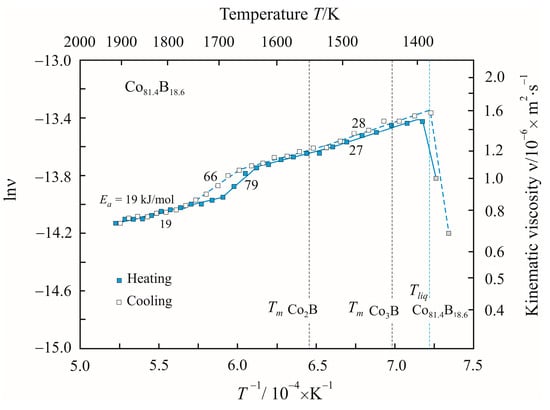
Figure 5.
Dependences of the natural logarithm of the kinematic viscosity lnν on the reciprocal temperature T−1 during heating and cooling of the eutectic Co81.4B18.6 alloy. The vertical dashed lines show the liquidus temperature for Co81.4B18.6 and the melting points for Co2B and Co3B compounds. The numbers next to the curves represent the activation energy Ea in the corresponding temperature interval.
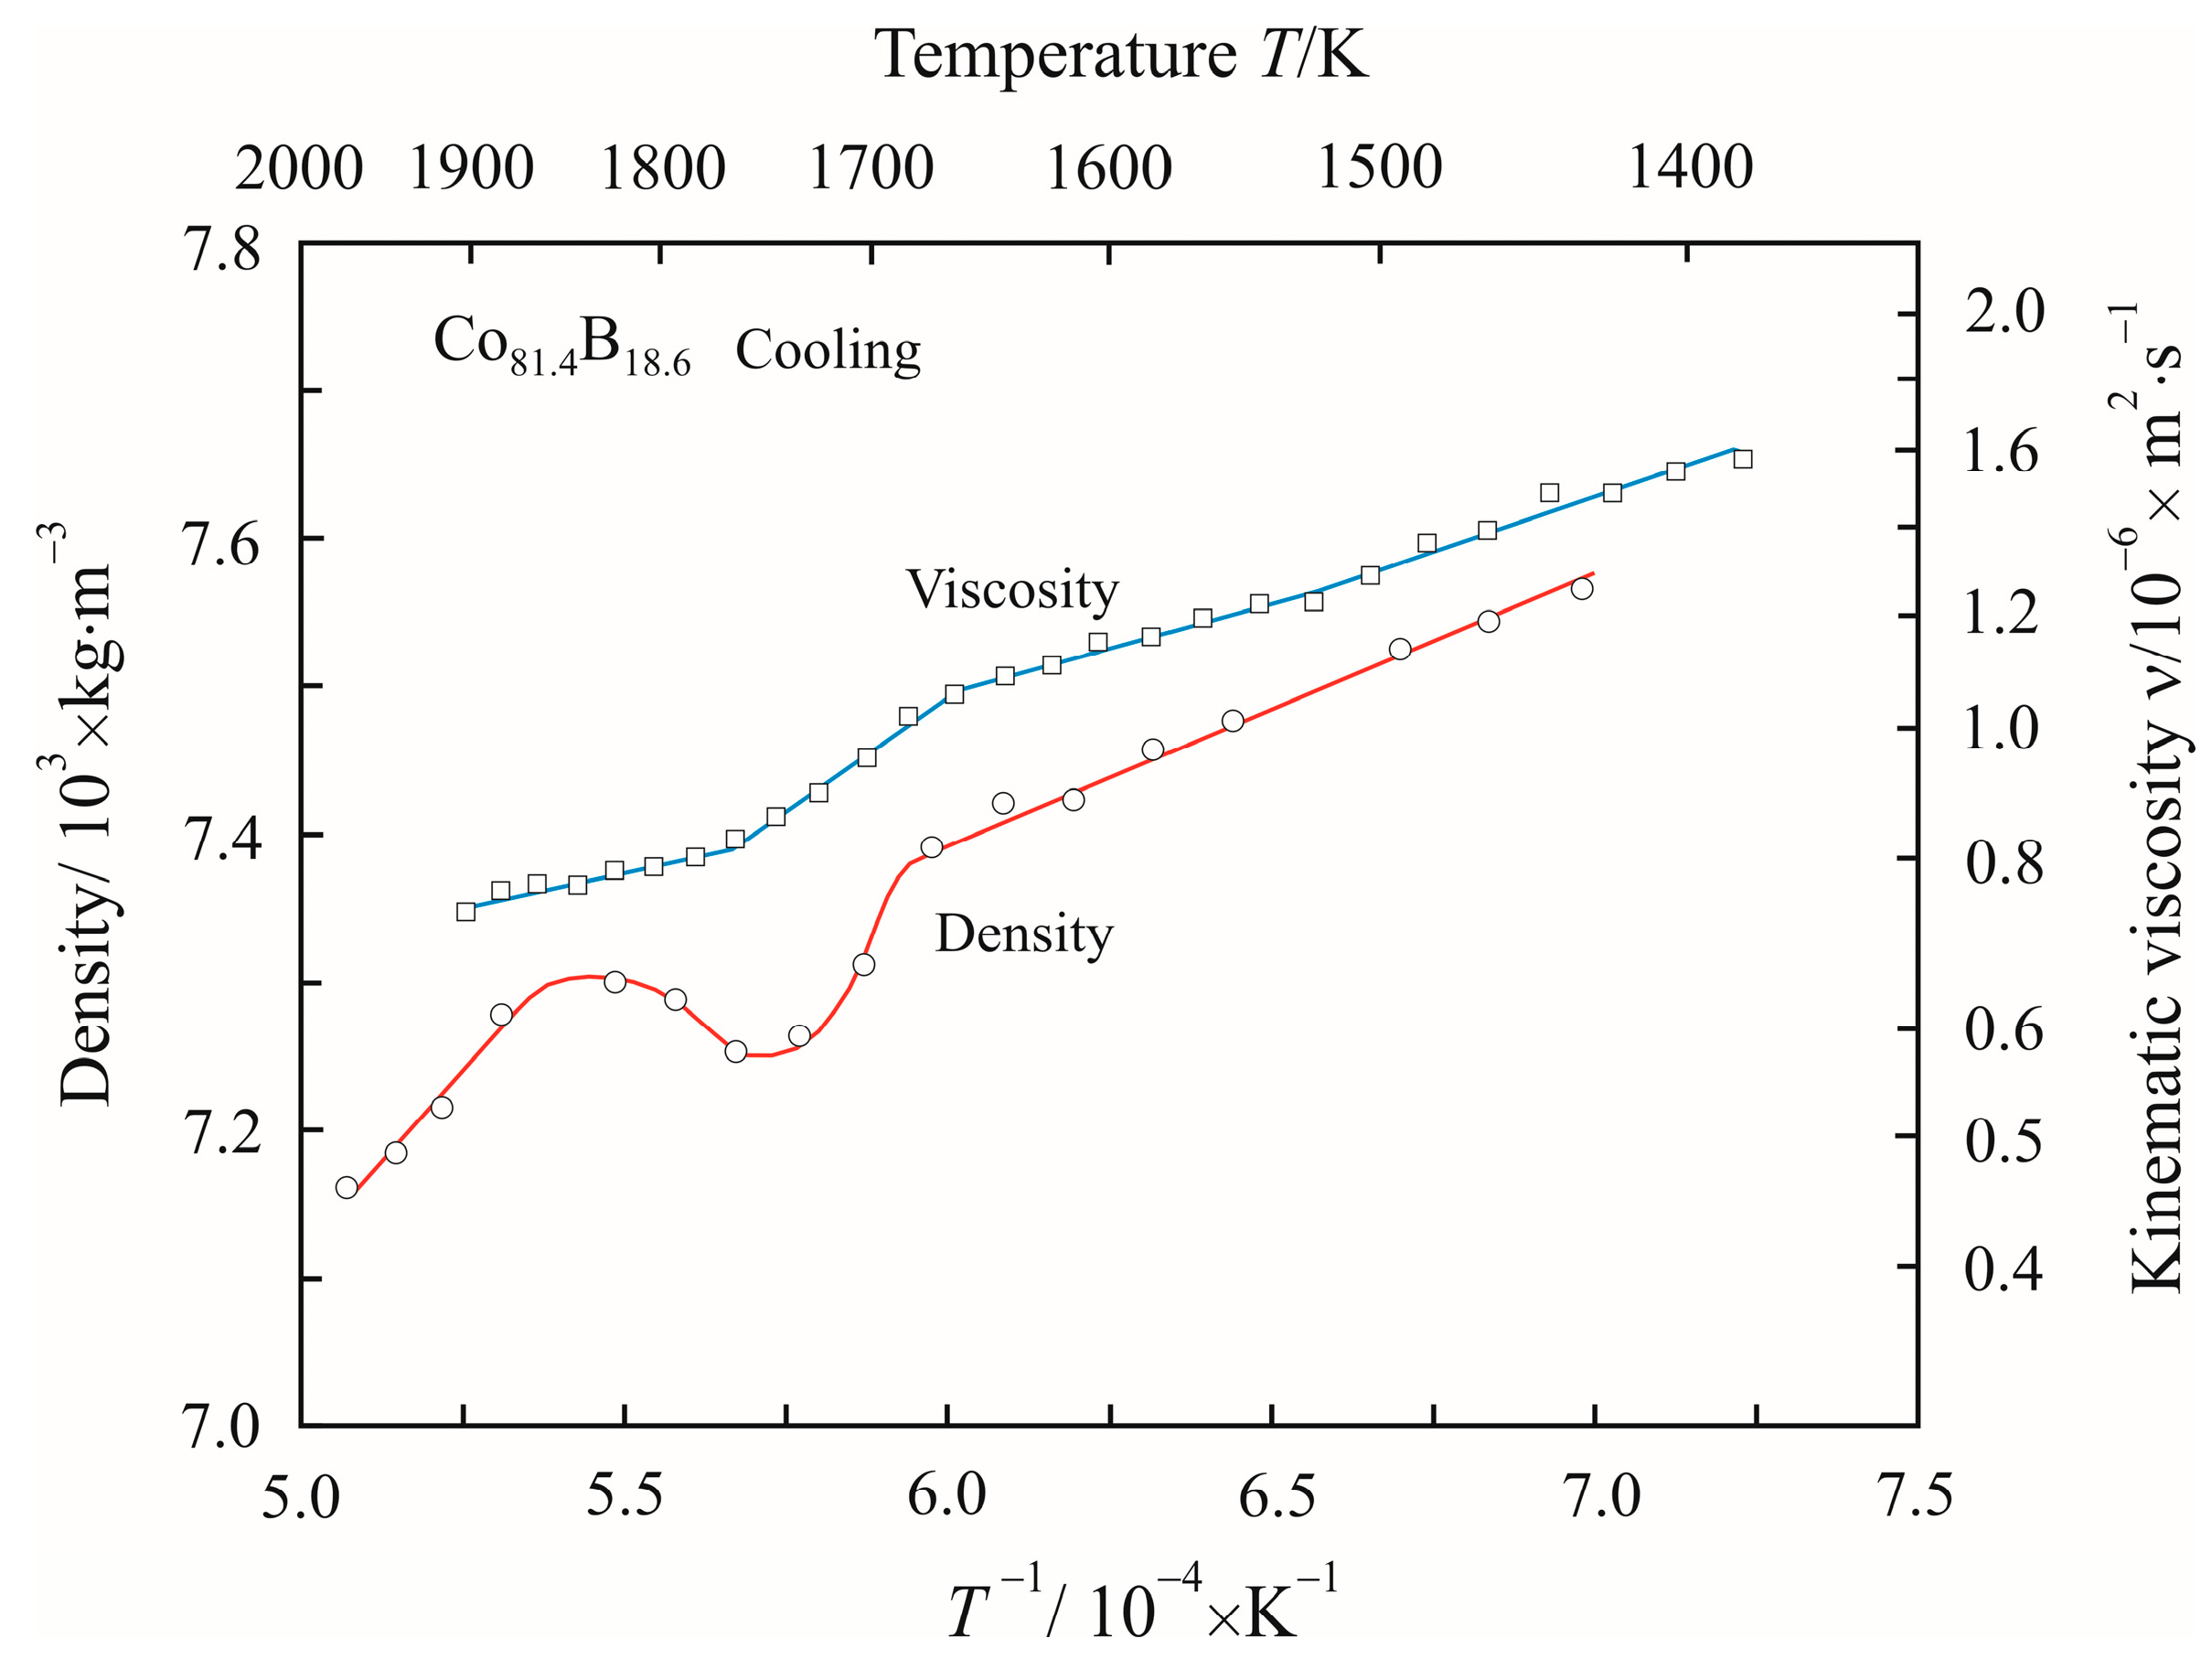
Figure 6 shows the dependence of the melt density ρ on the reciprocal temperature T−1 at the cooling stage of the eutectic Co81.4B18.6 alloy. Here, for comparison, the corresponding dependence of the kinematic viscosity is plotted. It follows from Figure 6 that in the intermediate region, along with an increase in the activation energy, the density of the melt sharply decreases.
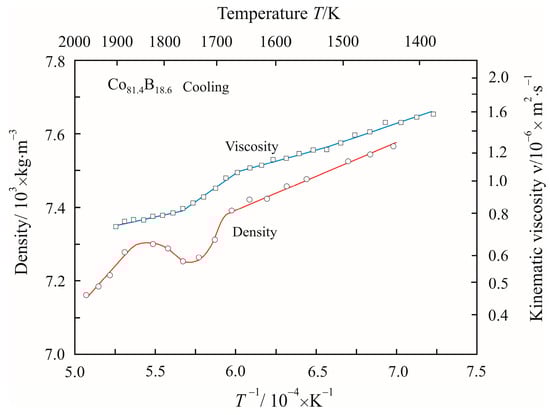
Figure 6.
Dependences of density ρ and natural logarithm of kinematic viscosity lnν on reciprocal temperature T−1 during cooling of eutectic Co81.4B18.6 alloy.
4. Discussion
Equation (1) can be written as:
In the hole model [22], the space available for the motion of atoms and clusters is a free volume. The motion of one liquid layer relative to another is associated with the transition of atoms or clusters from an equilibrium state to a free hole. This mechanism of particle motion in the theory of transition states gives the pre-exponential factor ν0 as [5,22]:
where Vf/V is the relative free volume, V is the specific volume (m−3·kg), ρ is the density (kg·m−3), a is the atom or cluster size (m), and kB is the Boltzmann constant (J·K−1). Then, at a fixed temperature, Equation (3) can be represented as:
where C(T) is the constant that depends on the temperature. Thus, at a constant temperature, the activation energy increases with an increase in the size of the clusters involved in the viscous flow. An increase in the activation energy with an increase in the cluster size is typical not only for viscous flow but also for other transport phenomena [23,24].
From Equation (4), it is possible to estimate the size of the particles involved in the viscous flow:
Density ρ and pre-exponential factor v0 will be found from experimental data. The relative free volume Vf/V was determined from the Batschinski equation [25,26]:
which demonstrates that the kinematic viscosity is inversely proportional to the relative free volume:
In Equations (7) and (8), the specific volume V = ρ−1, c is the constant with the dimension of kinematic viscosity, the value ω corresponds to the specific volume of liquid with infinitely high viscosity, and the difference (V − ω) represents the specific free volume Vf. From Equations (7) and (8), it follows that the inverse kinematic viscosity is a linear function of the density:
The value ω = 1.25 × 10⁻⁷ m3·kg−1 for the Co81.4B18.6 melt was found from Equation (9) in the low-temperature region. The relative free volume Vf/V can now be determined using formula (8).
Table 1 shows the calculated parameters of the liquid eutectic Co81.4B18.6 alloy and cluster sizes involved in viscous flow at the cooling stage. At low and high temperatures, the clusters have a size close to the atomic size of 0.1 nm, and the cluster size is larger in the low-temperature region. In the intermediate region, the size of the clusters is much larger. It can be assumed that, at low temperatures, the melt viscosity is mainly associated with the movement of individual atoms or small clusters. With an increase in temperature, large clusters are involved in the flow, which then break up into atoms.

Table 1.
Design parameters of the liquid eutectic Co81.4B18.6 alloy and cluster sizes involved in viscous flow at the cooling stage.
Table 1 also shows the reduced activation energy Ea·(RT)−1, which compares the activation energy Ea with the thermal energy RT. Thermal energy is a source that accelerates the movement of clusters and lowers the energy barrier. An increase in the reduced activation energy to 4.6 at 1720 K indicates a decrease in the number of moved clusters. But the movement of one cluster is accompanied by the displacement of a significant number of atoms, and the number of atoms in a cluster grows non-linearly with an increase in its size [27]. Thus, large clusters move a larger number of atoms, and this will lead to a decrease in the melt viscosity. Previously, it was shown [28] that the viscosity decreases with increasing cluster size. A similar dependence takes place in a nanofluid [29].
Electronegativities on the Luo–Benson scale for Co and B are 1.83 and 3.66, respectively [30]. Boron atoms are most strongly associated with cobalt atoms since this pair of elements has distinct electronegativity. In the Co50B50 alloy, all cobalt atoms are bonded to boron atoms, and the stable CoB compound has the highest liquidus temperature (Table 2). With an increase in boron content, when excess cobalt atoms appear, they will still tend to move closer to the boron atoms. An increase in temperature increases the mobility of atoms, and this simultaneously weakens the Co-B bond but increases the probability that free cobalt atoms will approach boron atoms. At a sufficiently high temperature, borides begin to accumulate free cobalt atoms, forming short-range order Co2B. When the ratio of the number of cobalt atoms to boron atoms is 2:1, a stable Co2B compound with a high local liquidus temperature is formed. With a further increase in the cobalt content, the same mechanism should lead to the formation of a short-range order, first Co3B and then Co23B6. In the series of compounds CoB, Co2B, Co3B, and Co23B6, the fraction of cobalt bound to boron increases successively. It follows from Table 2 that an increase in the fraction of cobalt in the compound leads to a decrease in formation energy, liquidus temperature, and an increase in mole volume, which indicates a weakening of the bond between atoms.
Table 2.
Design parameters of the compounds.
The as-cast Co81.4B18.6 eutectic alloy consists of Co and the orthogonal Co3B phase, with a small amount of the tetragonal Co2B phase [18]. Therefore, when melting the Co81.4B18.6 alloy, the clusters in the low-temperature region have mostly a short-range order of Co3B. The structure of the low-temperature melt is dominated by small clusters and free atoms, which confirms the small cluster size (Table 1) and low activation energy (Figure 5). In the low-temperature region, it is quite expected that the size of the particles that participate in viscous flow is close to the atom size. In the region just below the melting point, most atoms vibrate around equilibrium positions in the crystal lattice. In the liquid state, just above the melting point, there are more free atoms that can move a considerable distance. As the temperature increases, the number of free atoms increases, but they are not isolated from each other and continue to interact, gathering into clusters.
In Figure 5, the heating and cooling Arrhenius plots form a hysteresis loop. The nature of hysteresis is always associated with the presence of a large number of metastable states in the material. As a result, the trajectory of changes in the melt structure with temperature can vary greatly. Thus, a supercooled alloy can have a different structure during cyclic heating and cooling (see [17,19]). We thermally cycled our melts. In general, the characteristic temperatures on the viscosity curves are repeated, but the paths through the heating–cooling cycles are somewhat different. In magnetic hysteresis, it is necessary to make at least 10 cycles to reach a stable loop trajectory.
As the temperature rises, the bond between atoms weakens, and this can facilitate the transition to the short-range order of Co23B6. The stimulus for LLST in the eutectic Co81.4B18.6 melt is the desire to have a uniform distribution of cobalt and boron atoms at high temperatures. A uniform distribution can be obtained in the Co79.4B20.6 alloy, in which the ratio of cobalt and boron atoms exactly corresponds to the Co23B6 compound. The transition to a short-range order of Co23B6 confirms the large cluster size (Table 1) and high activation energy (Figure 5), as well as a sharp decrease in melt density (Figure 6). Table 2 shows that the Co23B6 compound has a high molar volume. It was previously noted that when the eutectic melt is heated above 1650 K, the undercooling ΔT increases significantly, and the metastable Co23B6 phase is formed [18,20]. The boundary temperature of 1650 K just coincides with the onset temperature of LLST in the eutectic alloy in Figure 5.
In the high-temperature region, the reduced activation energy is close to 1 (Table 1), so the energy barrier for cluster movement is very low. An estimate of the cluster size (Table 2) shows that at high temperatures, the viscous flow is associated with individual atoms.
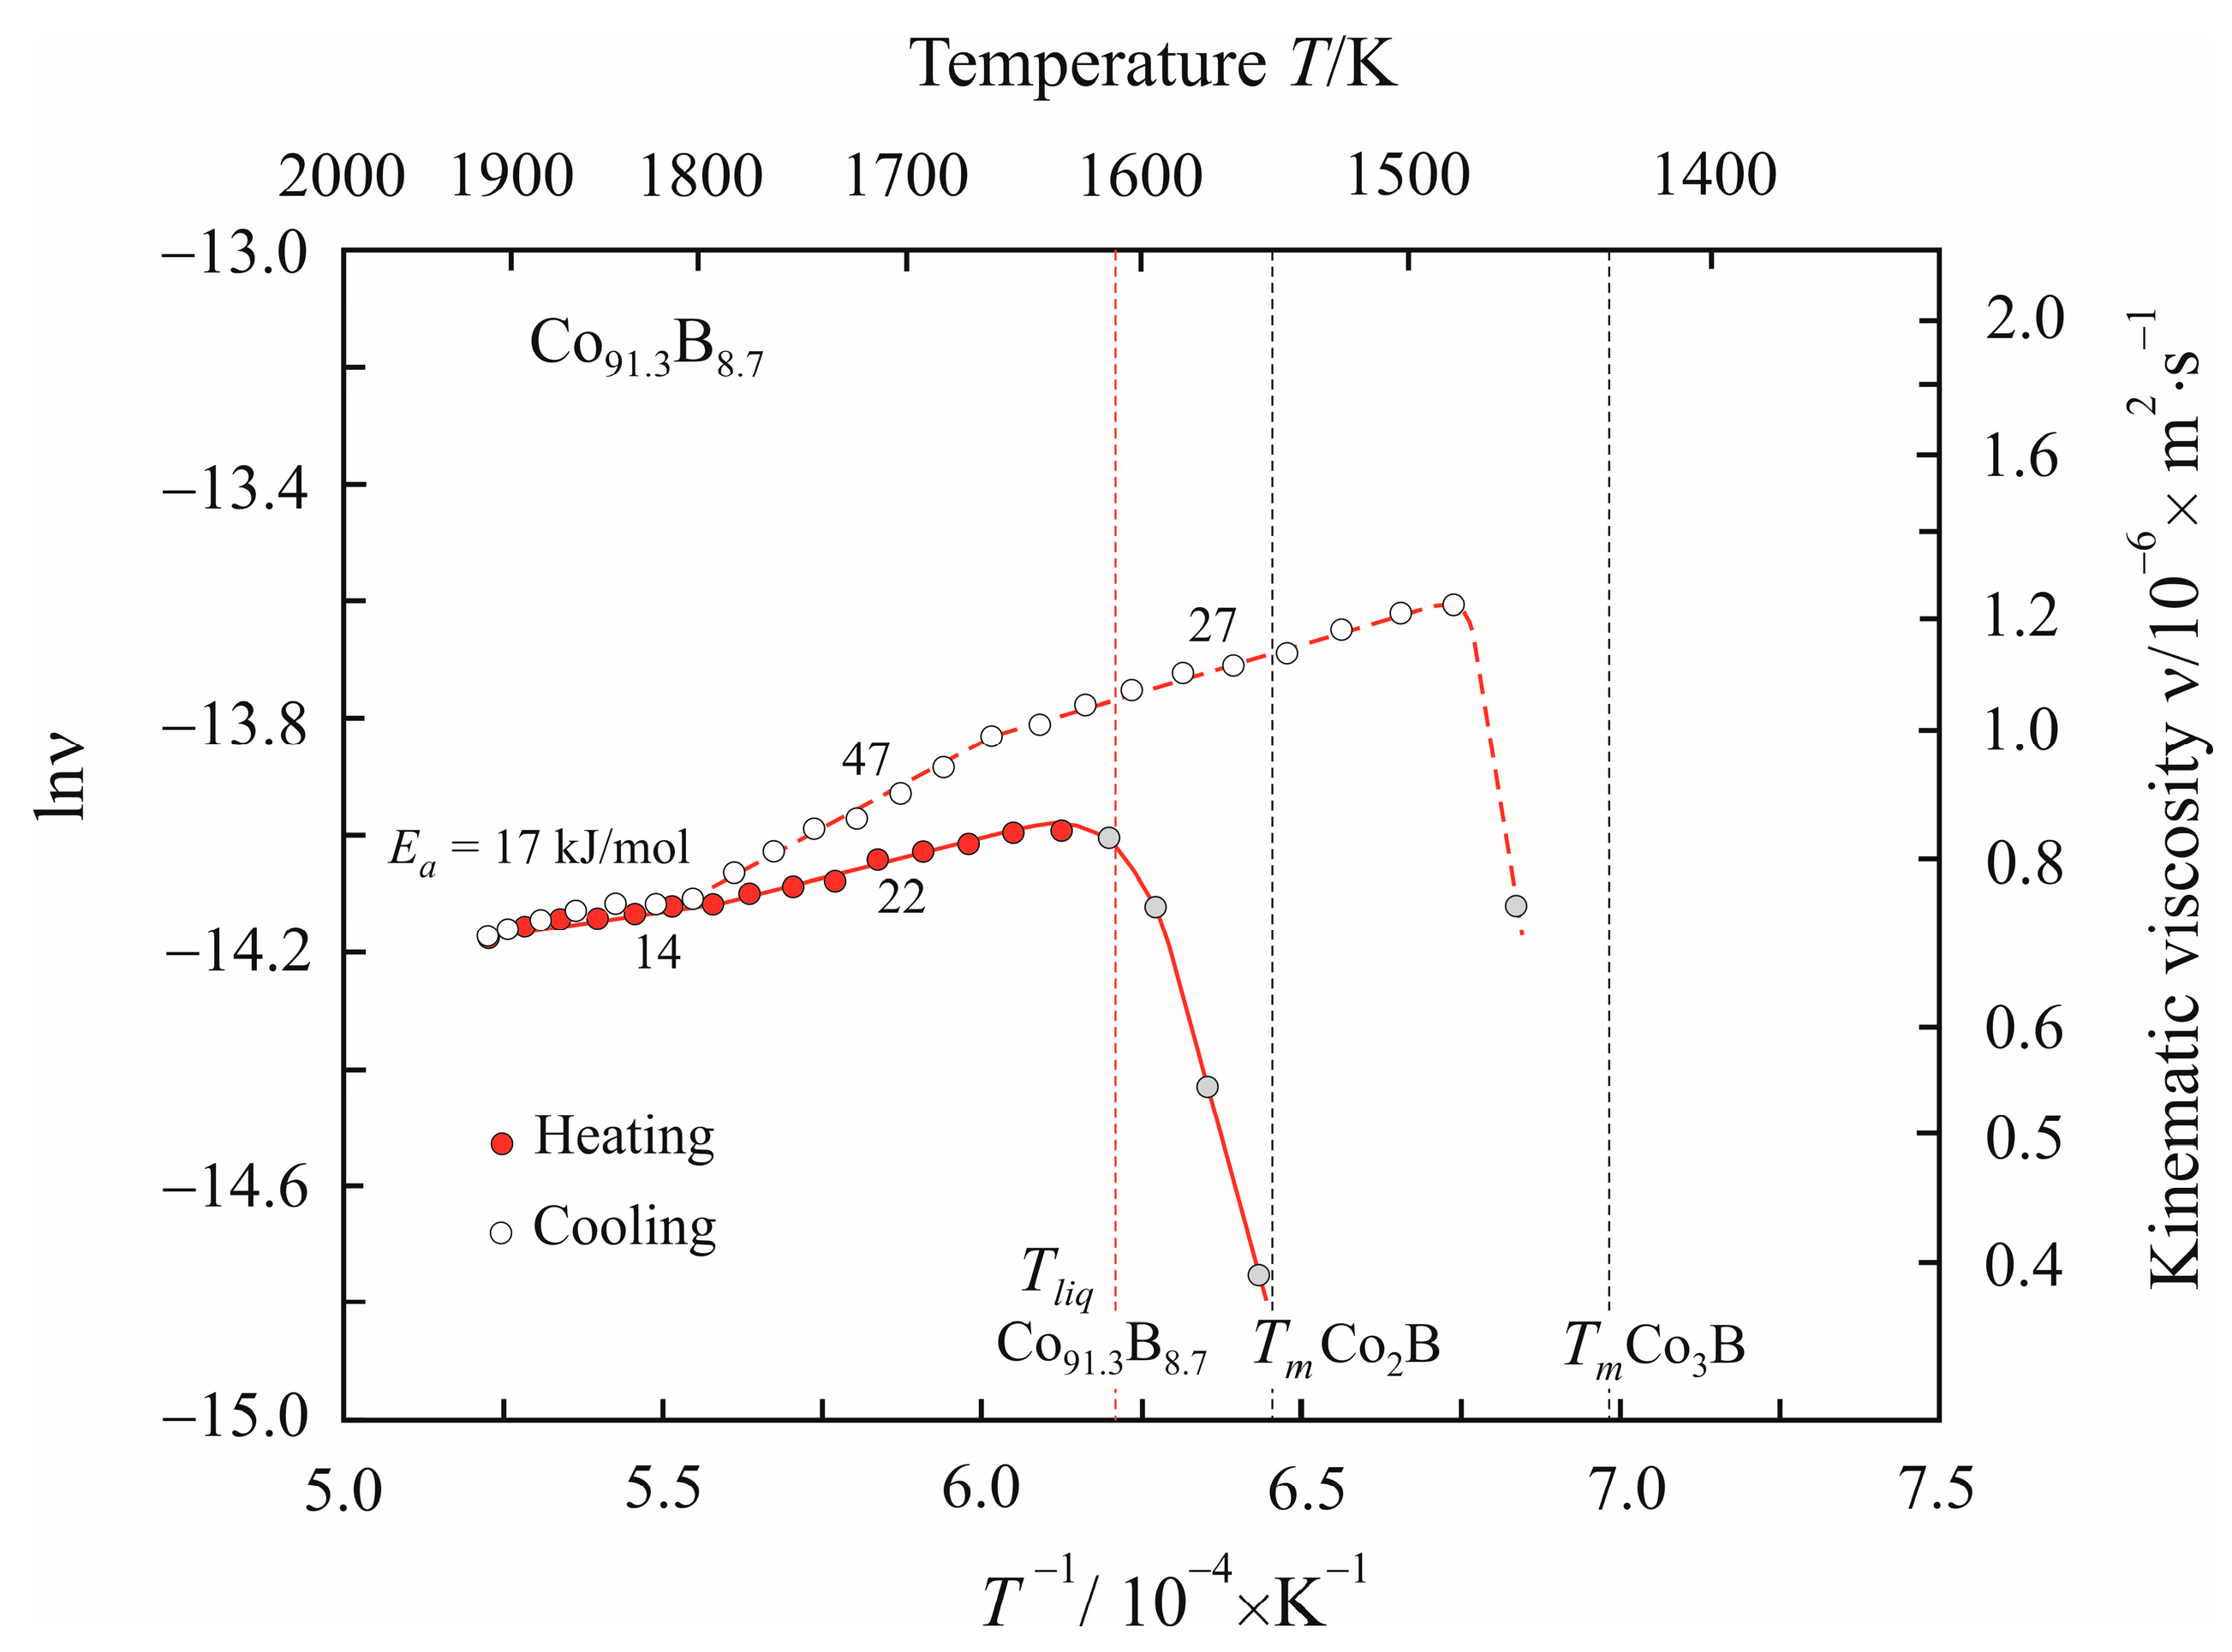
The low-boron as-cast alloys consist of Co and the orthogonal Co3B phase [32], with a significant proportion of free cobalt. Therefore, during the heating of the Co91.3B8.7 melt, the movement of individual atoms and small clusters dominates, which corresponds to a low activation energy (Figure 7). An excess of cobalt in this melt prevents the formation of large Co23B6 clusters, and upon heating, a transition region with a high activation energy is not observed in Figure 7. Upon reaching a high temperature of 1914 K, the activation energy decreases to 14 kJ/mol. Thus, the cooling of the melt begins in the state in which individual atoms predominate. The Co91.3B8.7 alloy has a significant undercooling ΔT. Undercooling is associated with the formation of clusters with icosahedral short-range order [33], which have fivefold symmetry and inhibit the growth of the nuclei of regular crystals. Experimentally, the icosahedral short-range order was found in undercooled Co melts [34]. Fe23B6-type quasicrystal-like structures were found in Fe-based metallic glass [35]. Undercooling of the Co91.3B8.7 melt expands the temperature range of the liquid state, and an intermediate region appears at the cooling stage. Thus, the formation of large Co23B6 clusters leads to the undercooling of the alloy. In the intermediate region, the activation energy of 47 kJ/mol is lower than in the eutectic melt, which can be explained by an increase in the fraction of unbound cobalt atoms.
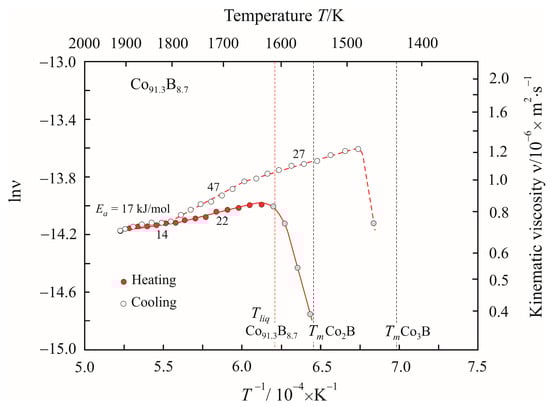
Figure 7.
Dependences of the natural logarithm of the kinematic viscosity lnν on the reciprocal temperature T−1 during heating and cooling of the Co91.3B8.7 alloy. The vertical dashed lines show the liquidus temperature for Co91.3B8.7 and the melting points for Co2B and Co3B compounds. The numbers next to the curves represent the activation energy Ea in the corresponding temperature interval.
In the Co79.4B20.6 melt, the ratio of cobalt and boron atoms corresponds to the Co23B6 compound. In alloys with a boron content of less than 20.6 at%, that is, with an excess cobalt content compared to Co23B6, the kinematic viscosity during cooling is higher than during heating. The hysteresis loop in Figure 5 shows the premature LLST during heating and cooling. Premature LLST indicates that the short-range order of Co23B6 is more preferable in low-boron alloys.
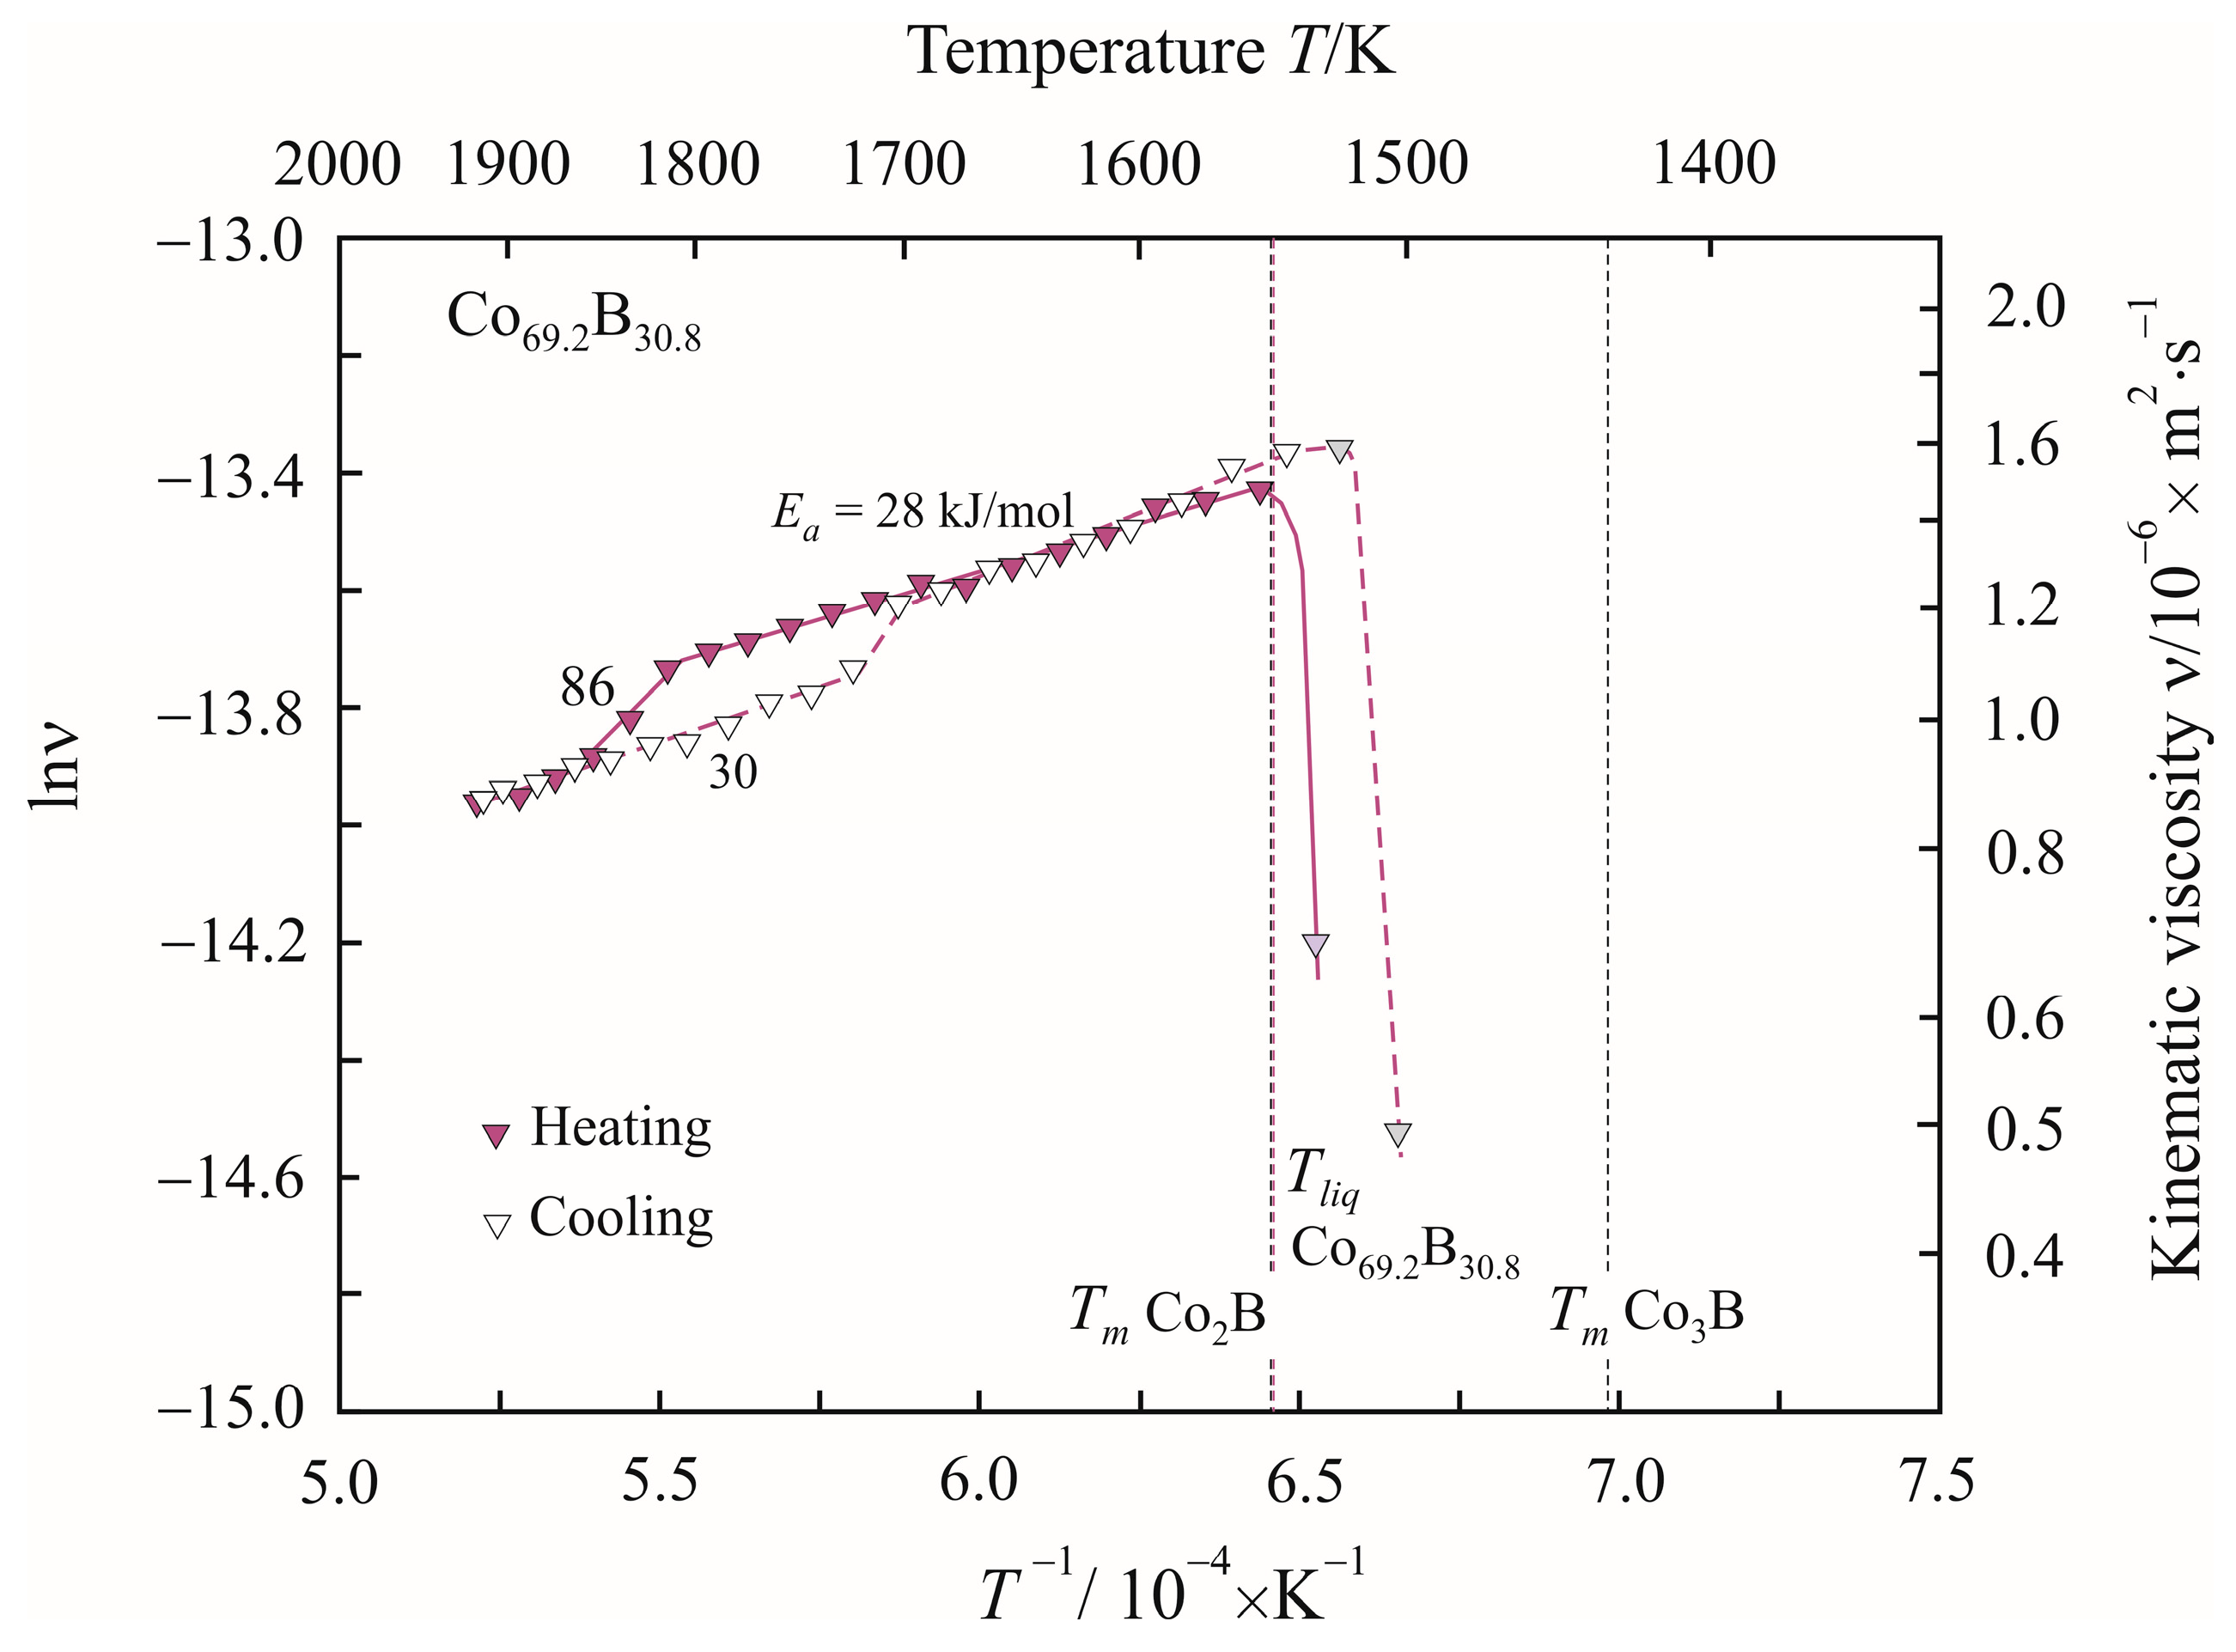
In the as-cast alloys with a high boron content, the tetragonal Co2B phase predominates [32]. Figure 8 shows the dependence of the natural logarithm of the kinematic viscosity lnν on the reciprocal temperature T−1 during heating and cooling of the Co69.2B30.8 alloy. This alloy has an excess boron content compared to Co23B6, and the kinematic viscosity when cooled is lower than when heated. High boron content in the melt promotes the preservation of a stable short-range order of Co2B and inhibits the formation of a short-range order of Co23B6. The wide hysteresis loop in Figure 8 shows the delay in the onset of LLST, which occurs in a narrow temperature range. The onset temperature of LLST at the stage of heating and cooling differs by 100 K.
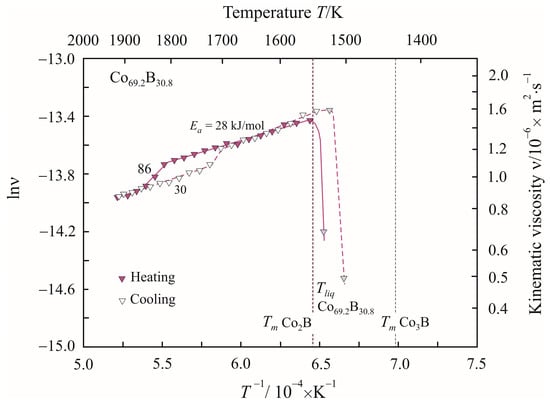
Figure 8.
Dependences of the natural logarithm of the kinematic viscosity lnν on the reciprocal temperature T−1 during heating and cooling of the Co69.2B30.8 alloy. The vertical dashed lines show the liquidus temperature for Co69.2B30.8 and the melting points for Co2B and Co3B compounds. The numbers next to the curves represent the activation energy Ea in the corresponding temperature interval.
5. Conclusions
Temperature dependences of the kinematic viscosity during heating and cooling have been investigated in Co-B melts with a boron content of up to 30.8 at.%. The activation energy of the viscous flow Ea and the reduced activation energy, which compares the activation energy with the thermal energy RT, were calculated from the experimental results. To estimate the size of moving clusters, we used the transition state theory and the Batschinski equation, which relate viscosity to relative free volume. As the cluster size increases, the activation energy of the viscous flow increases, and the viscosity of the melt decreases. At low and high temperatures, clusters of the order of an atomic size are active participants in the viscous flow. In the intermediate temperature region, the activation energy and cluster size increase, and the melt density sharply decreases. Corresponding changes were associated with the liquid–liquid structure transition, in which large clusters with a short-range order of Co23B6 are formed. The mechanism of the liquid–liquid structure transition is proposed, which confirms the characteristic shape of hysteresis loops on the temperature dependence of kinematic viscosity at the stage of heating and cooling. When a melt with a low boron content is heated, an intermediate-temperature region with high activation energy for viscous flow does not form on the Arrhenius plot. The formation of large Co23B6 clusters at the cooling stage after heating melts to a high temperature leads to undercooling and the appearance of the high activation energy region.
Author Contributions
Conceptualization, Y.N.S., V.S.T., V.V.K. and N.P.T.; methodology, Y.N.S. and V.V.K. software, V.S.T.; validation, Y.N.S. and V.V.K.; formal analysis, V.S.T. and N.P.T.; investigation, V.S.T. and V.V.K.; resources, V.S.T. and N.P.T.; data curation, V.S.T.; writing—original draft preparation, Y.N.S.; writing—review and editing, Y.N.S.; visualization, Y.N.S.; supervision, V.S.T. and V.V.K.; project administration, V.S.T.; funding acquisition, V.S.T. All authors have read and agreed to the published version of the manuscript.
Funding
This research received no external funding.
Data Availability Statement
The data presented in this study are available on request from the corresponding author.
Acknowledgments
The article was made within the framework of state work No. FEUZ-2023-0015.
Conflicts of Interest
The authors declare no conflict of interest. Yuri N. Starodubtsev was employed by the company Gammamet Research and Production Enterprise. The remaining authors declare that the research was conducted in the absence of any commercial or financial relationships that could be construed as a potential conflict of interest.
References
- Calvo-Dahlborg, M.; Popel, P.S.; Kramer, M.J.; Besser, M.; Morris, J.R.; Dahlborg, U. Superheat-dependent microstructure of molten Al-Si alloys of different compositions studied by small angle neutron scattering. J. Alloys Compd. 2013, 550, 9–22. [Google Scholar] [CrossRef]
- Tanaka, H. Liquid-liquid transition and polyamorphism. J. Chem. Phys. 2020, 153, 130901. [Google Scholar] [CrossRef]
- He, Y.-X.; Li, J.-S.; Wang, J.; Beaugnon, E. Liquid-liquid structure transition in metallic melt and its impact on solidification: A review. Trans. Nonferrous Met. Soc. China 2020, 30, 2293–2310. [Google Scholar] [CrossRef]
- Rusanov, B.A.; Sidorov, V.E.; Moroz, A.I.; Svec, P.; Janickovic, D. Density and electrical resistivity of Al-Ni-Co-Sm(Tb) alloys. Tech. Phys. Lett. 2021, 47, 770–772. [Google Scholar] [CrossRef]
- Starodubtsev, Y.N.; Tsepelev, V.S.; Tsepeleva, N.P. Kinematic viscosity of multicomponent FeCuNbSiB-based melts. Nanomaterials 2021, 11, 1042. [Google Scholar] [CrossRef] [PubMed]
- Tyagunov, A.; Tyagunov, G.; Milder, O.; Tarasov, D. Detection of the liquid-liquid transitions in superalloys melts upon overheating and relaxation by the electromagnetic method. J. Appl. Phys. 2021, 129, 015107. [Google Scholar] [CrossRef]
- Zu, F.Q.; Zhu, Z.G.; Gu, L.J.; Zhang, B.; Shui, J.P.; Liu, C.S. Liquid-liquid phase transition in Pb-Sn melts. Phys. Rev. B 2001, 64, 180203. [Google Scholar] [CrossRef]
- He, Y.; Li, J.; Li, L.; Wang, J.; Yildiz, E.; Beagnon, E. Composition dependent characteristic transition temperature of Co-B melts. J. Non-Cryst. Solids 2019, 522, 119583. [Google Scholar] [CrossRef]
- Dong, B.; Zhou, S.; Qin, J.; Li, Y.; Chen, H.; Wang, Y. The hidden disintegration of cluster heterogeneity in Fe-based glass-firming alloy melt. Prog. Nat. Sci. Mater. Intern. 2018, 28, 696–703. [Google Scholar] [CrossRef]
- Hou, J.X.; Zhan, C.W.; Tian, X.L.; Chen, X.C.; Kim, Y.-S.; Choe, H. Structure of Cu-Sn melt at high temperature. Metall. Mater. Trans. A 2012, 43, 4023–4027. [Google Scholar] [CrossRef]
- Tsepelev, V.; Starodubtsev, Y.; Zelenin, V.; Belozerov, V.; Konashkov, V. Temperature affecting the magnetic properties of the Co79−xFe3Cr3Si15Bx amorphous alloy. J. Alloys Compd. 2015, 643, S280–S282. [Google Scholar] [CrossRef]
- Baghbaderani, H.A.; Masud, A.; Alvarez, K.L.; Lordan, D.; Vancatesan, M.; Mathúna, C.Ó.; McCloskey, P.; Stamenov, P. Composition engineering of ultra-soft-magnetic Co-based alloys. J. Alloys Compd. 2022, 924, 166366. [Google Scholar] [CrossRef]
- Gao, P.; Yang, S.; Xue, G.; Liu, G.; Zhang, G.; Wang, L.; Li, G.; Sun, Y.; Chen, Y. High energy ball-milling preparation of Co-B amorphous alloy with high electrochemical hydrogen ability. J. Alloys Compd. 2012, 539, 90–96. [Google Scholar] [CrossRef]
- Jian, L.; Choi, G.M. Using amorphous Co-B alloy as transducer to detect acoustic propagation and heat transport at interface. Appl. Sci. 2021, 11, 5155. [Google Scholar] [CrossRef]
- Olyanina, N.V.; Bel’tyukov, A.L.; Lad’yanov, V.I. Viscosity of Co-B melts. Russ. Metall. Met. 2016, 2016, 150–155. [Google Scholar] [CrossRef]
- Du, Y.; Schuster, C.; Austin Chang, Y.; Jin, Z.; Huang, B. A thermodynamic description of the B-Co system: Modeling and experiment. Int. J. Mater. Res. 2002, 93, 1157–1163. [Google Scholar] [CrossRef]
- Wei, X.X.; Xu, W.; Kang, J.L.; Ferry, M.; Li, J.F. Metastable Co23B6 phase solidified from deeply undercooled Co79.3B20.7 alloy melt. J. Mater. Sci. 2016, 51, 6436–6443. [Google Scholar] [CrossRef]
- He, Y.; Li, J.; Wang, J.; Kou, H.; Beagunon, E. Liquid-liquid structure transition and nucleation in undercooled Co-B eutectic alloys. Appl. Phys. A 2017, 123, 391. [Google Scholar] [CrossRef]
- Liu, L.; Yang, L.; Li, J. Solidification pathways in highly undercooled Co79.3B20.7 alloy. Metall. Mater. Trans. A 2021, 52, 4324–4330. [Google Scholar] [CrossRef]
- He, Y.; Wu, Y.; Bu, F.; Zhang, Y.; Zhang, Y.; Hei, B.; Zhang, J. Re-examination of the microstructural evolution in undercooled Co-18.5at.%B eutectic alloy. Materials 2022, 15, 1315. [Google Scholar] [CrossRef]
- Konashkov, V.V.; Tsepelev, V.S.; V’yukhin, V.V.; Povadator, A.M.; Podoľskaya, A.I. A computer-aided plant for studying the kinamatic viscosity of high-temperature metallic melts. Instrum. Exp. Tech. 2011, 54, 284–285. [Google Scholar] [CrossRef]
- Glasstone, S.; Laidler, K.; Eyring, H. The Theory of Rate Processes: The Kinetics of Chemical Reactions, Viscosity, Diffusion and Electrochemical Phenomena; McGraw Hill: New York, NY, USA; London, UK, 1941; pp. 477–490. [Google Scholar]
- Coleman, P.G. Activation energies for vacancy migration, clustering and annealing in silicon. J. Phys. Conf. Ser. 2011, 265, 012001. [Google Scholar] [CrossRef]
- Welle, F. Diffusion coefficients and activation energies of diffusion of organic molecules in polystyrene below and above glass transition temperature. Polymers 2021, 13, 1317. [Google Scholar] [CrossRef]
- Batschinski, A.J. Untersuchungen über die innere Reibung der Flüssigkeiten. Z. Phys. Chem. 1913, 84, 643–706. [Google Scholar] [CrossRef]
- Tsepelev, V.; Starodubtsev, Y.; Konashkov, V.; Wu, K.; Wang, R. Melt viscosity of nanocrystalline alloys in the model of free volume. J. Alloys Comp. 2019, 790, 547–550. [Google Scholar] [CrossRef]
- Poole, C.P., Jr.; Owens, F.J. Introduction to Nanotechnology; John Wiley & Sons: Hoboken, NJ, USA, 2003; pp. 12–15. [Google Scholar]
- Starodubtsev, Y.N.; Tsepelev, V.S. Analysis of the kinematic viscosity and self-diffusion of liquid metals at the melting temperature. High Temp. 2021, 59, 306–311. [Google Scholar] [CrossRef]
- Koca, H.D.; Doganay, S.; Turgut, A.; Tavman, I.H.; Saidur, R.; Mahbubul, I.M. Effect of particles size on viscosity of nanofluids: A review. Renew. Sust. Energy Rev. 2018, 82, 1664–1674. [Google Scholar] [CrossRef]
- Filippov, G.G.; Gorbunov, A.I. Novel approach to selection of practical scale of electronegativity of atoms. Ross. Chim. Zh. 1995, 39, 39–43. [Google Scholar]
- The Materials Project. Available online: http://next-gent.materialsproject/materials (accessed on 20 June 2023).
- Faria, M.I.S.T.; Leonardi, T.; Coelho, G.C.; Nunes, C.A.; Avillez, R.R. Microstructural characterization of as-cast Co-B alloys. Mater. Charact. 2007, 58, 358–362. [Google Scholar] [CrossRef]
- Kelton, K.F.; Lee, G.W.; Gangopadhyay, A.K.; Hyers, R.W.; Rathz, T.J.; Rogers, J.R.; Robinson, M.B.; Robinson, D.S. First X-ray scattering studies on electrostatically levitated metallic liquids: Demonstrated influence of local icosahedral order on the nucleation barrier. Phys. Rev. Lett. 2003, 90, 195504. [Google Scholar] [CrossRef]
- Holland-Moritz, D.; Schenk, T.; Bellissent, R.; Simonet, V.; Funakoshi, K.; Merino, J.M.; Buslaps, T.; Reutzel, S. Short-range order in undercooled Co melts. J. Non-Cryst. Solids 2002, 312–314, 47–51. [Google Scholar] [CrossRef]
- Hirata, A.; Hirotsu, Y.; Amiya, K.; Nishiyama, N.; Inoue, A. Fe23B6-type quasicrystal-like structures without icosahedral atomic arrangement in an Fe-based metallic glass. Phys. Rev. B 2009, 80, 140201. [Google Scholar] [CrossRef]
Disclaimer/Publisher’s Note: The statements, opinions and data contained in all publications are solely those of the individual author(s) and contributor(s) and not of MDPI and/or the editor(s). MDPI and/or the editor(s) disclaim responsibility for any injury to people or property resulting from any ideas, methods, instructions or products referred to in the content. |
© 2023 by the authors. Licensee MDPI, Basel, Switzerland. This article is an open access article distributed under the terms and conditions of the Creative Commons Attribution (CC BY) license (https://creativecommons.org/licenses/by/4.0/).