Article

The Plasma Electrolytic Oxidation of Aluminum Using Microsecond-Range DC Pulsing

by
Kristina Mojsilović
,
Stevan Stojadinović
and
Rastko Vasilić
*
Faculty of Physics, University of Belgrade, Studentski trg 12-16, 11000 Belgrade, Serbia
*
Author to whom correspondence should be addressed.
Metals 2023, 13(12), 1931; https://doi.org/10.3390/met13121931
Submission received: 16 October 2023 / Revised: 10 November 2023 / Accepted: 21 November 2023 / Published: 24 November 2023

Abstract

:
This manuscript presents the results of our recent work focused on the plasma electrolytic oxidation of aluminum in a sodium tungstate solution using a microsecond-range pulsed DC signal. DC pulses of 50, 300 and 900 μs were followed by 5- and 25-times longer pauses between the pulses, showing the effect of the pulse duration and duty cycle on the morphological, phase and chemical properties of formed oxide coatings. It is shown that all coatings are partially crystalline with gamma-alumina, WO3 and metallic W phases present in formed PEO coatings. A higher duty cycle value results in the higher crystallization of the obtained PEO coatings. Although the chemical composition of the obtained coatings is not very sensitive to processing parameters, their roughness and porosity change significantly, as well as their thickness. The photocatalytic activity and photoluminescence properties of the obtained coatings are dependent on their morphology and chemical composition, i.e., on the processing time. The highest photoactivity and photoluminescence intensity is observed for the coating formed with ton = 300 μs and toff = 25 ton. A comparable application potential is found for the sample processed with ton = 50 μs and toff = 25 ton, which requires considerably less energy for PEO processing.

1. Introduction

Plasma electrolytic oxidation (PEO) is an efficient and sustainable process used on various metals (e.g., Al, Mg, Ta, Ti, Zr, etc.) and their alloys to transform them into their oxides. The PEO process is characterized by the usage of high voltages (greater than the dielectric breakdown voltage of the original oxide film) and typically diluted alkaline electrolytes. The main distinction of PEO from classical anodization is the appearance of numerous micro-discharges on the metal surface, accompanied by gas evolution and locally increased temperature and pressure, indicating that plasma has been formed. The newly achieved thermal and chemical conditions influence the structure, morphology and composition of the emerging oxide coatings. The oxide coatings obtained through this process contain elements from both the substrate and the electrolyte solution, and have good electrical and thermal properties, strong adhesion, high corrosion and wear resistance [1,2,3]. One of the ways to modify these characteristics is by applying a different electrical regime with a DC, pulsed DC or AC power source, thus varying the micro-discharge intensity in order to obtain oxide coatings of desired properties [3]. This can be achieved by varying electrical parameters such as the voltage and current density, as well as by setting the duration of pulses (ton) and the time between two consecutive pulses (toff), which allows the system to return to its equilibrium. By controlling the duration of pulses and intercepting pauses, one can control the duration of micro-discharges, and through this, control the morphology, chemical and phase composition of obtained PEO coatings as well [4,5,6].
Aside from the clearly visible advantages of PEO processing over other surface treatment techniques of light metals and their alloys, the high energy consumption required for PEO processing still limits its larger-scale utilization [2]. By changing the voltage (or current) pulse duration time and duty cycle, it may be possible to find a balance between the constructive effect of micro-discharges (the inclusion of electrolyte species, oxide coating growth and densification) and their destructive effect (large craters, increased roughness and porosity) [4,5]. By adjusting the pulse duration time, as well as the time between the consecutive pulses, it may be possible to adjust the behavior of the micro-discharges and spend less energy during PEO processing.
Over the last few years, a number of papers investigating pulsed DC PEO processing in a microsecond range were published [7,8,9]. These papers exploited the finding that both the life of the micro-discharges and the incubation period between an individual micro-discharge and a cascade of micro-discharges are in the microsecond range [10] with the aim to influence the properties of the PEO coatings. These studies also suggest that the duty cycle directly influences the microstructure and morphology of the deposited coatings. Furthermore, papers by Martin et al. [11] and Yerokhin et al. [12] reported on post-discharge cooling rates of the oxide layer of about 107 K/s, suggesting that a toff value lower than 1 ms is sufficient for the successful cooling of the oxide layer between consecutive micro-discharges. Therefore, it seems reasonable to perform pulsed DC PEO in a microsecond range, because the lifetime of micro-discharges will be influenced, which in return will result in changing the microstructure, phase and chemical composition of the oxide film.
In present paper, a newly developed power supply was used for the PEO processing of Al, providing microsecond-range pulses of 50, 300 and 900 µs, with two different pause durations of 5 ton and 25 ton. The selected electrolyte was sodium tungstate, as it is shown that the utilization of sodium tungstate as an addition to the electrolyte results in a decrease in the breakdown voltage and an increase in the coatings’ thickness, density and corrosion resistance [13,14,15]. Furthermore, WO3, which forms on Al substrates during PEO processing, is widely investigated as a possible photocatalyst, as it can be excited with visible light [16,17]. The surface morphology and chemical composition were investigated by employing atomic force microscopy (AFM) and scanning electron microscopy equipped with energy dispersive spectroscopy. The phase composition of the obtained PEO coatings was investigated by utilizing an X-ray diffraction instrument. The obtained PEO coatings were tested for their photocatalytic and photoluminescent properties. The selection of promising candidates for possible applications is based both on the properties of the formed PEO coatings and on the energy required for their preparation.

2. Materials and Methods

Rectangular aluminum samples (99.0% purity) were used as the anode material and sealed in insulation resin, leaving an active surface area of 3.0 cm2 available to make contact with the electrolyte solution. Two platinum wires (10 cm long, 2 mm in diameter) were connected and used as the cathode in this experiment. PEO processing was carried out in a double-walled electrolytic cell containing a water solution of 0.01 M sodium tungstate (Na2WO4·2H2O). The electrolyte solution was prepared using double-distilled and deionized water and a PA (pro analysis)-grade chemical compound. The electrolyte solution circulated through a chamber reservoir system in order to keep the temperature of the electrolyte solution under 25 °C during the entire PEO process. A pulsed voltage power supply that consisted of a DC power supply (Kepco (Flushing, NY, USA), 0–2 kV, 0–100 mA), a bank of capacitors, a HV switching unit (MOSFET technology) and a rectangular pulse generator (2–999 µs pulse width, 0.1–100% duty cycle) was employed for this study. The PEO processing was performed under a constant current of 9 A (corresponding to the current density of about 3.0 A/cm2) for 15 min with 50, 300 and 900 µs pulse widths and duty cycles (Dt) of 3.85% (pause/pulse = 25) and 16.67% (pause/pulse = 5) (Table 1). The voltage evolution was recorded using a Tektronix TDS 2022 digital storage oscilloscope and a high-voltage probe, which was connected directly to the power supply (Figure 1).
A scanning electron microscope (SEM, JEOL 840A (Tokyo, Japan)) was used to examine the cross-sections of the obtained PEO layers as well as their surface morphologies. For cross-sectional SEM analyses, samples were embedded in epoxy resin and polished with 220, 1000 and 4000 SiC abrasive papers, followed by polishing with 1 μm diamond paste. Energy dispersive X-ray spectroscopy (Oxford Instruments, Abingdon, UK) was attached to the SEM and it served as a tool for determining the chemical composition of both the top-view and cross-section samples. An atomic force microscope (AFM; Veeco Instruments (Plainview, NY, USA), model Dimension V) was used to further characterize the morphology of the obtained coatings (the surface roughness was estimated using the Nanoscope 7.0 software, while the porosity was estimated using the ImageJ software (v. 1.53t, LOCI, Madison, WI, USA) from AFM images).
A Rigaku Ultima IV diffractometer with a Ni-filtered CuKα radiation source (40 kV, 40 mA) was used for the identification of crystal phases in the formed PEO coatings. Corresponding X-ray diffraction patterns were collected in the Bragg–Brentano mode, in a 2θ range from 10° to 90° with a step of 0.02° and a scanning rate of 2°/min. Phase identification was conducted using the PDXL2 software, functioning with the crystallography open database (COD).
Photoluminescence (PL) spectral measurements were performed utilizing a Horiba Jobin Yvon Fluorolog FL3-22 spectrofluorometer, which operated at room temperature, using a 450 W xenon lamp as the excitation light source. The recorded PL emission spectra were in the range of 350 nm to 695 nm, with 285 nm used as the excitation wavelength. The obtained spectra were corrected for the spectral response of the measuring system and spectral distribution of the Xe lamp.
The photocatalytic activity of the obtained coatings on the Al substrate was inspected by degrading methyl orange (MO) at room temperature. MO, which has a complex molecular structure and toxic effects on human health, is used as a model organic pollutant in this study because it is widely used in various industrial applications. The typical concentration of MO in industrial wastewater effluents is in the range of 2.5 mg/L to 10 mg/L [18]. The samples were immersed into 10 mL of an 8 mg/L aqueous MO solution and placed on a perforated holder 5 mm above the bottom of the reactor, with a magnetic stirrer underneath. The MO solution was irradiated using a simulated solar spectrum lamp (Osram Vitalux lamp, 300 W), which was placed approximately 25 cm above the top surface of the solution. Every hour, a fixed amount of the MO solution was removed to measure the absorption at 464 nm using a UV-Vis spectrophotometer, Agilent Carry 60. Before irradiation, the solution and the catalyst were magnetically stirred in the dark for 30 min to achieve an adsorption–desorption equilibrium. After each measurement, the aliquot was returned to the photocatalytic reactor. Prior to photocatalysis, the MO solution was tested for photolysis in the absence of the photocatalyst, and the lack of change in the MO concentration after 6 h of irradiation revealed that the MO was stable under applied conditions, and that any degradation was only due to the presence of the photocatalyst. The presented photocatalysis results are the averaged results of three measurements (three samples treated under the same PEO conditions).

3. Results and Discussion

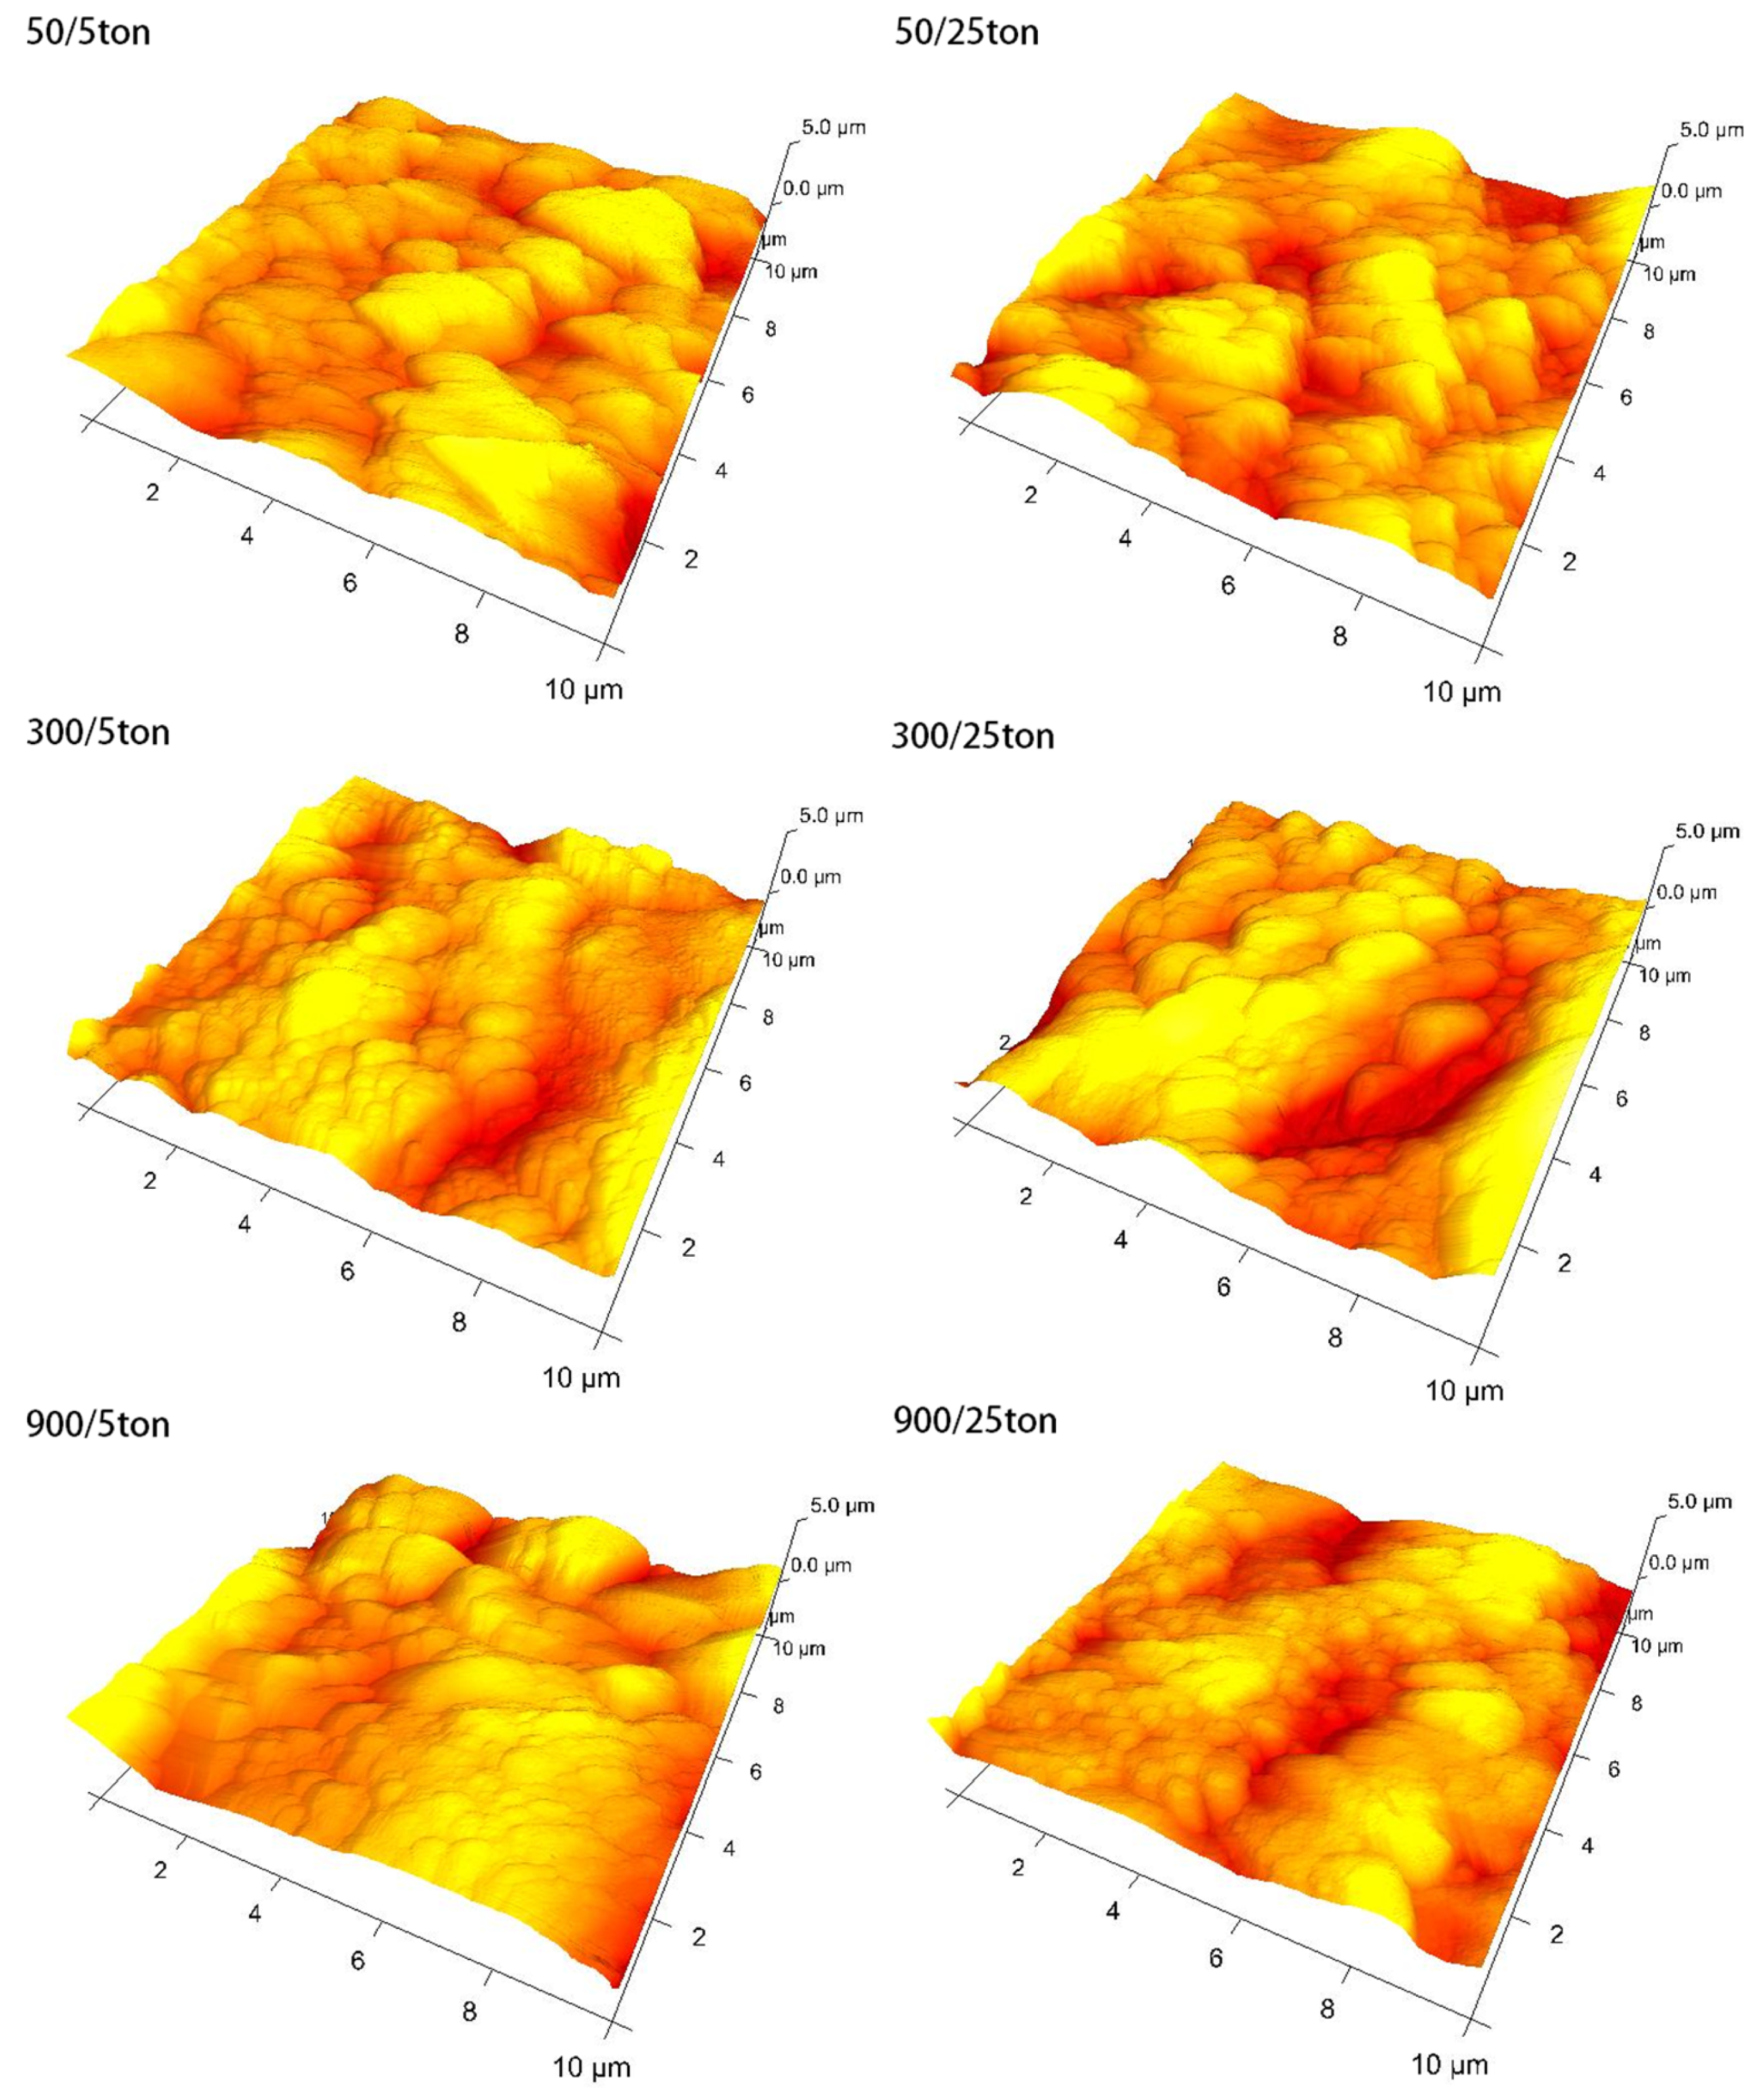
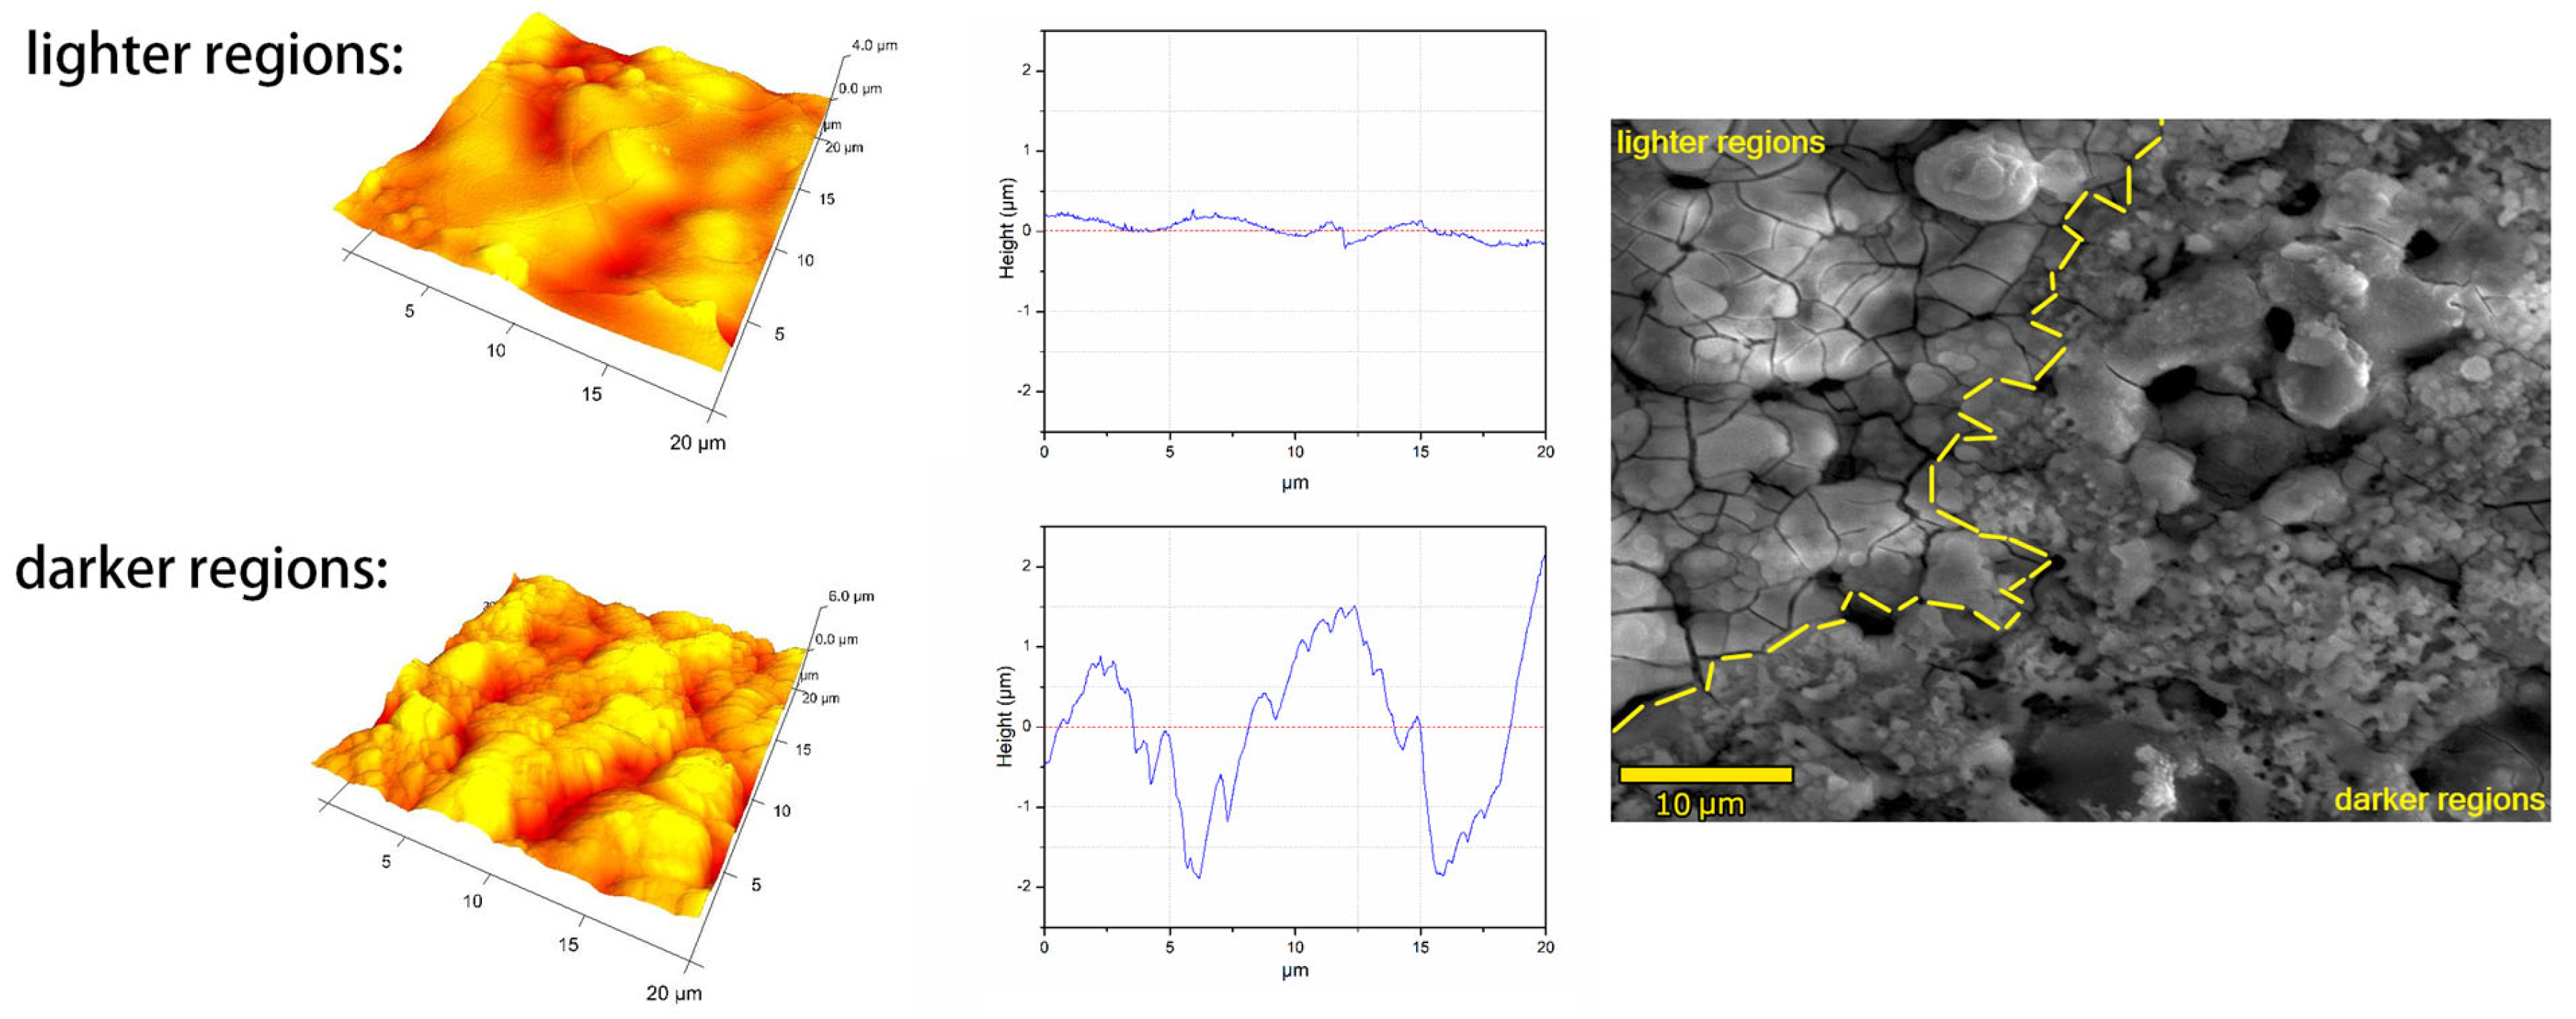
3.1. Phase Composition, Surface Morphology and Chemical Composition of the PEO Coatings

Oxide coatings formed via PEO processing in a microsecond-pulsed DC regime on an aluminum substrate were examined for their crystallinity and phase composition using X-ray diffraction (XRD). The survey XRD patterns of the obtained PEO coatings in focusing (Bragg–Brentano) mode are presented in Figure 2. For the sake of comparison, the XRD pattern of the aluminum substrate used in this study is also presented in the same figure.
XRD maxima originating from the Al substrate and low maxima originating from γ-Al2O3 (denoted as Al and γ) were detected for all PEO coatings formed in this study. For both investigated duty cycle values and for all three pulse length times, the formed PEO coatings display the presence of both W and WO3 crystalline phases, while the diffraction maxima originating from the Al substrate decrease as a result of the increasing coating thickness. All samples show relatively high levels of crystallization of the oxide coating, with a partially amorphous segment at 2θ values of 20° to 30°, which is more or less transformed into a WO3 crystalline phase, depending on the applied duty cycle. One of the factors that influence the formation of phases in the coatings formed during PEO processing is the temperature and reaction time of the formed compounds, which are directly related to the pulse duration time and the time elapsed between two consecutive pulses.
By comparing the diffraction maxima heights of the WO3 and W crystalline phases appearing in the diffraction patterns presented in Figure 2, one can observe that the duty cycle influences the crystallinity of the obtained coatings. Obviously, for all ton values, coatings with a toff equal to 25 ton show a lower level of crystallization than samples with a toff equal to 5 ton; i.e., a lower duty cycle value corresponds to a lower level of crystallization in the formed PEO coatings. It is also observable that coatings with higher ton times are more crystallized for the same toff time, suggesting that adding more power to the system (through increasing the pulse length) results in better crystallization of the formed PEO coatings.
The incorporation of tungsten into the PEO coatings is possible through the following chemical reactions [19,20]:
2 A l s o l i d 3 + + W O 4   e l e c t r o l y t e 2 + 6 H 2 O W O 3 + A l 2 O 3 + 4 H 3 O +
W O 4   e l e c t r o l y t e 2 + 2 H 3 O + W O 3 + 3 H 2 O
During anodization, some WO42− anions are drawn from the electrolyte into the discharge channels via a strong electric field, where they are decomposed:
2 W O 4   e l e c t r o l y t e 2 2 W O 3 + 4 e + O 2
Since Al is abundant in the micro-discharge channels, WO3 can react with Al under high-temperature conditions:
W O 3 + 2 A l A l 2 O 3 + W
The latter reaction represents how metallic W could be incorporated into PEO oxide coatings, as its diffraction maxima are present in all oxide coatings’ XRD patterns presented in Figure 2.
Figure 3 shows the SEM micrographs of the coatings formed during this study. The obtained top-view SEM micrographs show a common appearance that is inherent to PEO coatings. As has been reported numerous times in the literature, the observed PEO surfaces are decorated with a number of micro-discharge channels of various shapes and sizes, which are surrounded by the areas formed due to the rapid cooling of molten material that was ejected from micro-discharging channels. Although such surfaces are considered inappropriate (for corrosion protection, for example), these porous surfaces can be very valuable for photocatalytic and/or luminescence applications, since they feature a well-developed and open surface area.
An estimate of the chemical composition of the surfaces of the prepared oxide coatings was carried out by utilizing the EDS measurements (Table 2). The main chemical elements present in the coatings are Al, O and W, showing that elements from both the substrate and the electrolyte solution are present in the formed PEO coatings. Taking into account the precision of this method for estimating chemical compositions, via EDS, it is evident that the content of all elements is very similar for all coatings (Table 2), i.e., it does not depend on either the pulse duration or the duty cycle value. However, one can notice that all formed PEO coatings show a relatively high content of W, especially compared to other works which included electrolytes or their additives containing W species [21,22].
The cross-sections of the formed PEO coatings (Figure 4) show continuous coatings, with varying thicknesses (please see Table 3) ranging from 1.7 to 3.7 µm. All formed PEO coatings are relatively compact, although the coatings produced with ton = 900 µs somehow appear the most compact. This is most probably because the high power that is delivered to the system during the longest 900 µs pulses causes the sintering and densification of the coating under the conditions of the locally high temperatures and pressures that are inherent to PEO processing [1]. On the other hand, it is clearly observable that for ton values of 50 µs and 300 µs, the coatings’ thickness increases with the decreasing duty cycle value, while in the case of 900 µs pulsing, decreasing the duty cycle value results in a significant thinning of the formed PEO coating. This finding is in agreement with the observation for our previously published work, where thin and fragmented coatings were observed when using high-power pulsing under low duty cycle conditions [21].
The EDS mapping of the coatings’ cross-sections shows the presence of W throughout the coating for selected samples (Figure 5), indicating that W is well-incorporated when using microsecond-range pulses for PEO processing. Although both formed PEO coatings are about 3 µm thick and show similar structures, it is observable that the 300/25ton coating has a larger content of voids in the outer region of the coating.
In order to estimate the change in the surface morphology of the obtained coatings, AFM characterization was conducted (Figure 6). Even though the roughness and porosity data can also be extracted from SEM images using suitable free distribution software, AFM images have a much better in-depth view and often deliver more precise information about the surface morphology (Table 3). As in the case of SEM, the coatings show similar characteristics, inherent to the PEO process itself, with variations dependent on the processing conditions. The lowest roughness is observed for the 300/5 ton sample, which is almost the same as the roughness estimated for the 900/5 ton sample. In fact, the roughness data extracted from the AFM images for the 300 µs and 900 µs pulses are very similar for both duty cycle values. In contrast to this, the extracted roughness values for the 50 µs pulses are considerably higher, which enabled the assumption that the power delivered to the system from 50 µs pulses is high enough to cause the appearance of micro-discharges, but it is not high enough to cause the melting of the wider area around the micro-discharge channel. This assumption is strengthened by the observation that the 50/25 ton sample features the lowest porosity among all formed PEO coatings. It is also worth noting that, in the case of the 900 µs pulses, the porosity increases with the decreasing duty cycle value, unlike in the case of 50 µs and 300 µs pulsing.
It is interesting to point out a phenomenon present in all formed PEO coatings, which is that they incorporate different areas on their surfaces. Namely, certain regions (named as lighter regions in Figure 7) have a cracked appearance, while other regions (named a as darker regions in Figure 7) show the typical PEO surface, with pores and so-called “pancake” structures (Figure 7). Something that should also be noted is that this phenomenon is more pronounced for coatings produced with shorter ton pulsing times, meaning that it is the least visible for the coatings prepared with ton = 900 µs. One of the possible explanations for this observation is that for shorter pulsing times, micro-discharges do not develop as much since they only last while the pulse is turned on, and therefore cover a smaller area of the sample actively during the PEO processing time, as already discussed above.

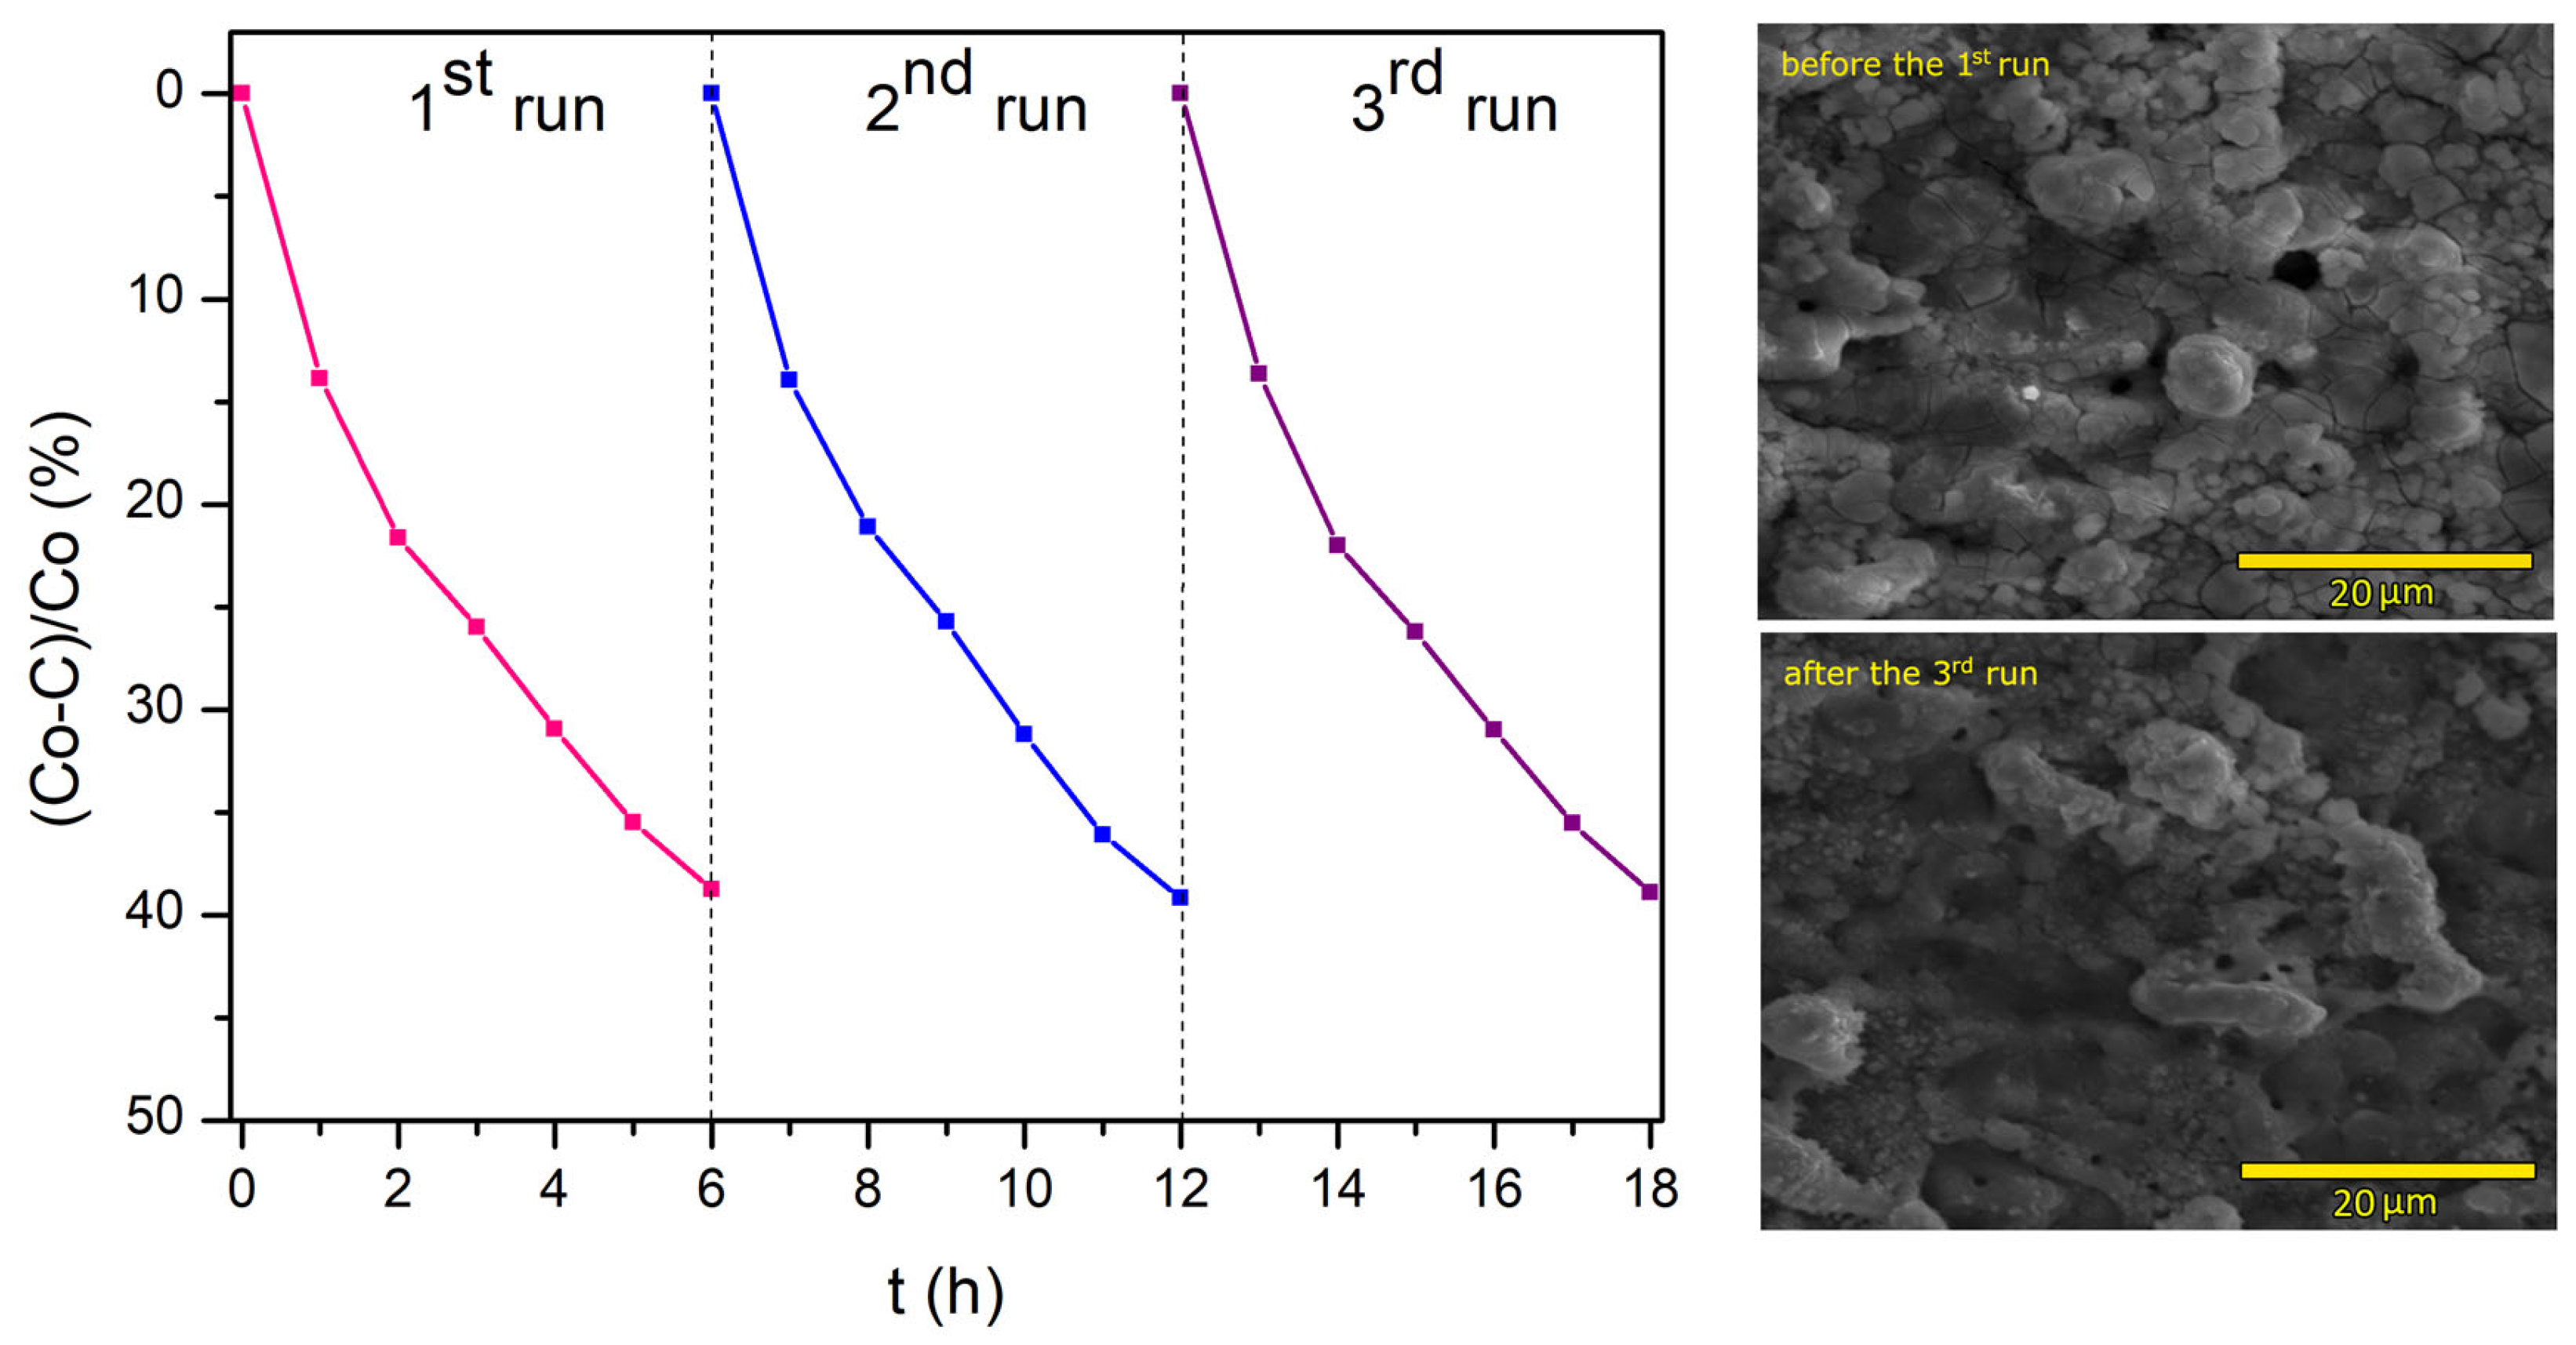
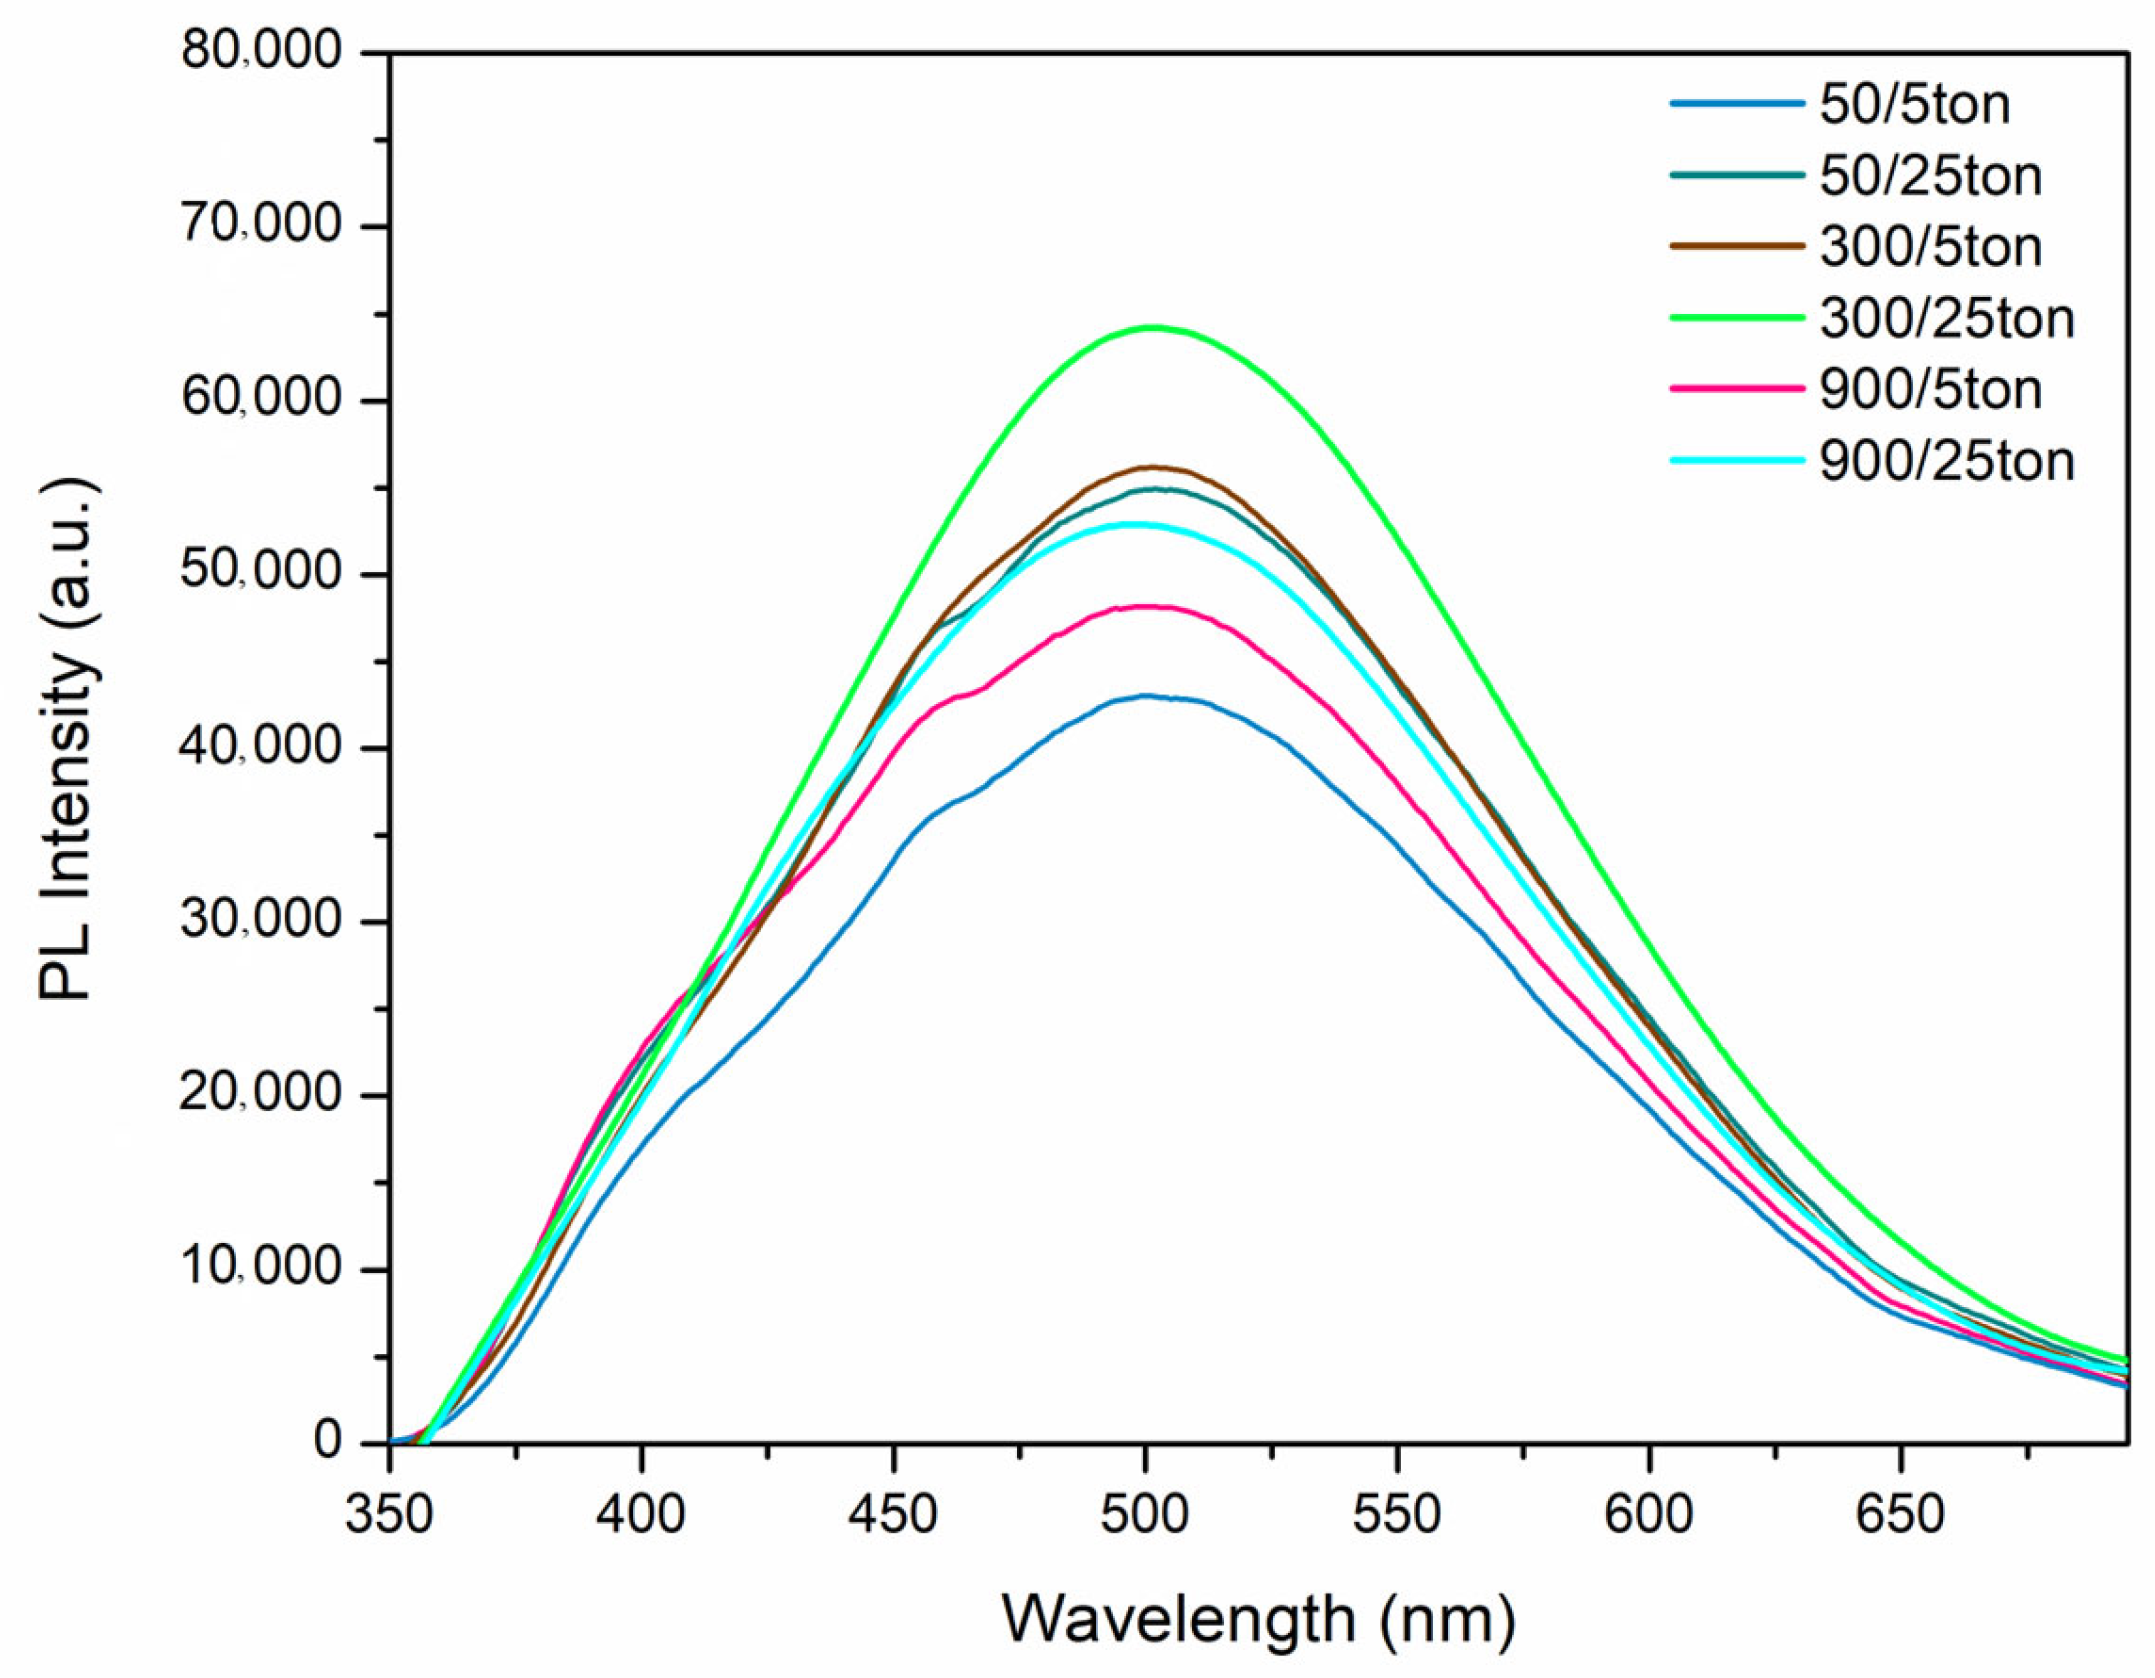
3.2. Photocatalytic Activity and Photoluminescence of the PEO Coatings

A number of recently published studies showed that PEO coatings formed on various substrates may be used for the photocatalytic degradation of organic pollutants, and among the substrates used, aluminum plays an important role due to its abundance and price [23]. The photocatalytic activity of the PEO coatings formed on an aluminum support after 6 h of irradiation is shown in Figure 8a. The results are given as ((C0 − C)/C0), where C0 is the initial MO concentration and C is the MO concentration after a given time in the dark. For all coatings, the measured photolysis in the dark was negligible (Figure 8b); therefore, the change in absorption registered during the photocatalytic tests is related solely to the photodegradation of methyl orange.
All obtained PEO coatings show a reasonable photocatalytic activity, the highest one being about 40% for the 300/25ton sample. However, the differences in the observed photocatalytic activities are not too pronounced, since the two main factors influencing photocatalytic activity, surface morphology, and phase and elemental composition are not too dissimilar among these samples. It is observable that PEO coatings that feature lower porosity and higher roughness (50/5ton and 50/25ton) have lower photocatalytic activity, while PEO coatings processed with lower duty cycle values feature higher photocatalytic activity than the corresponding PEO coatings processed with higher duty cycle values. This finding holds for all three pulse duration times used (50 µs, 300 µs and 900 µs). It is certainly worth noting that the photocatalytic activity values follow the exact order of the W content in the coatings (based on the EDS results), indicating the indisputable impact of the presence of metallic tungsten and its compounds on photocatalytic activity. This is especially true when bearing in mind that WO3 has been noted as one of the most important narrow-bandgap semiconductors developed as a visible-light-sensitive photocatalyst, due to its tunable stoichiometry and structure, suitable band gap (2.4–2.8 eV, responsive to ∼12% of the solar spectrum), strong photocatalytic oxidizing ability, high chemical stability and nontoxicity [16,17,24,25,26].
At the same time, it is worth highlighting one of the most prominent advantages of photocatalysts immobilized in an oxide coating, which is their very good repeatability with regard to the photocatalytic measurements. As presented in Figure 9, for the oxide coating with the highest photocatalytic activity registered in this study (300/25ton), changes in the photocatalytic activity over 6 h of immersion are barely noticeable for the three trial runs. The comparison of the tested oxide coating’s morphology before the photocatalysis measurements and after the last test also demonstrates the stability of the obtained coatings, since the coatings show very similar qualitative characteristics.
In order to further explain the observed photocatalytic activities, emission PL spectroscopy was performed following the photocatalytic activity tests. The recorded PL spectra for all PEO-processed Al samples under investigation in this study are shown in Figure 10. The PL spectra feature a pronounced spectral maximum at 500 nm, most probably originating from WO3 [27,28]. The PL intensity follows the same order as the photocatalytic activity, which was also correlated with the W content observed from the EDS results. Interestingly, higher PL intensities in general are noted for coatings with toff = 25 ton, suggesting that more surface oxygen vacancy defects are created within the oxide coating for lower duty cycles, contributing to both PL intensity and photocatalytic activity [29].
The highest photocatalytic activity is observed for the sample that also features the highest PL intensity (300/25ton), and from this point of view, the PEO processing parameters applied for the preparation of the noted sample may be considered as the best ones. This finding opposes a common opinion that PL intensity is inversely proportional to the photoactivity, which is based on the assumption that an increased PL signal is a result of fast photogenerated electron–hole recombination [30]. The highest Pl and PA are observed for the thickest coating formed in this study (see Table 3), which is related to the higher number of oxygen vacancy defects in thicker coatings, contributing to increases in both photoactivity and photoluminescence [31].
One of the main drawbacks of PEO processing is that it requires high-voltage and high-current processing conditions, thus limiting its wide-range development [2.3]. When taking into account the electrical efficiency of the preparation procedure, it is evident that the PEO coatings formed under lower duty cycle conditions, i.e., coatings with less energy used (due to longer pauses between the pulses), have better photoluminescent and photocatalytic properties. Aside from the duty cycle value, the pulse length plays an important role in energy efficiency because it determines how much power is delivered to the system in each pulse. Just by looking at Figure 8a, it is clearly observable that the PEO coating formed with the lowest pulse duration time (50 µs) under low-duty-cycle conditions features a photocatalytic activity that is easily comparable to the highest observed photocatalytic activity, which is observed for the sample with a pulse duration time of 300 µs (also under low-duty-cycle conditions). Therefore, bearing in mind how important energy efficiency is for possible industrial applications, it can be suggested that the most promising candidate for possible photocatalytic and/or photoluminescence application is the 50/25ton PEO coating.

4. Conclusions

The plasma electrolytic oxidation of aluminum in a sodium tungstate water-based electrolyte solution was performed using a pulsed DC power source working in a microsecond range. The set of electrical processing parameters (pulse duration time and duty cycle) varied, and based on the results, the following conclusions can be drawn:
(a)
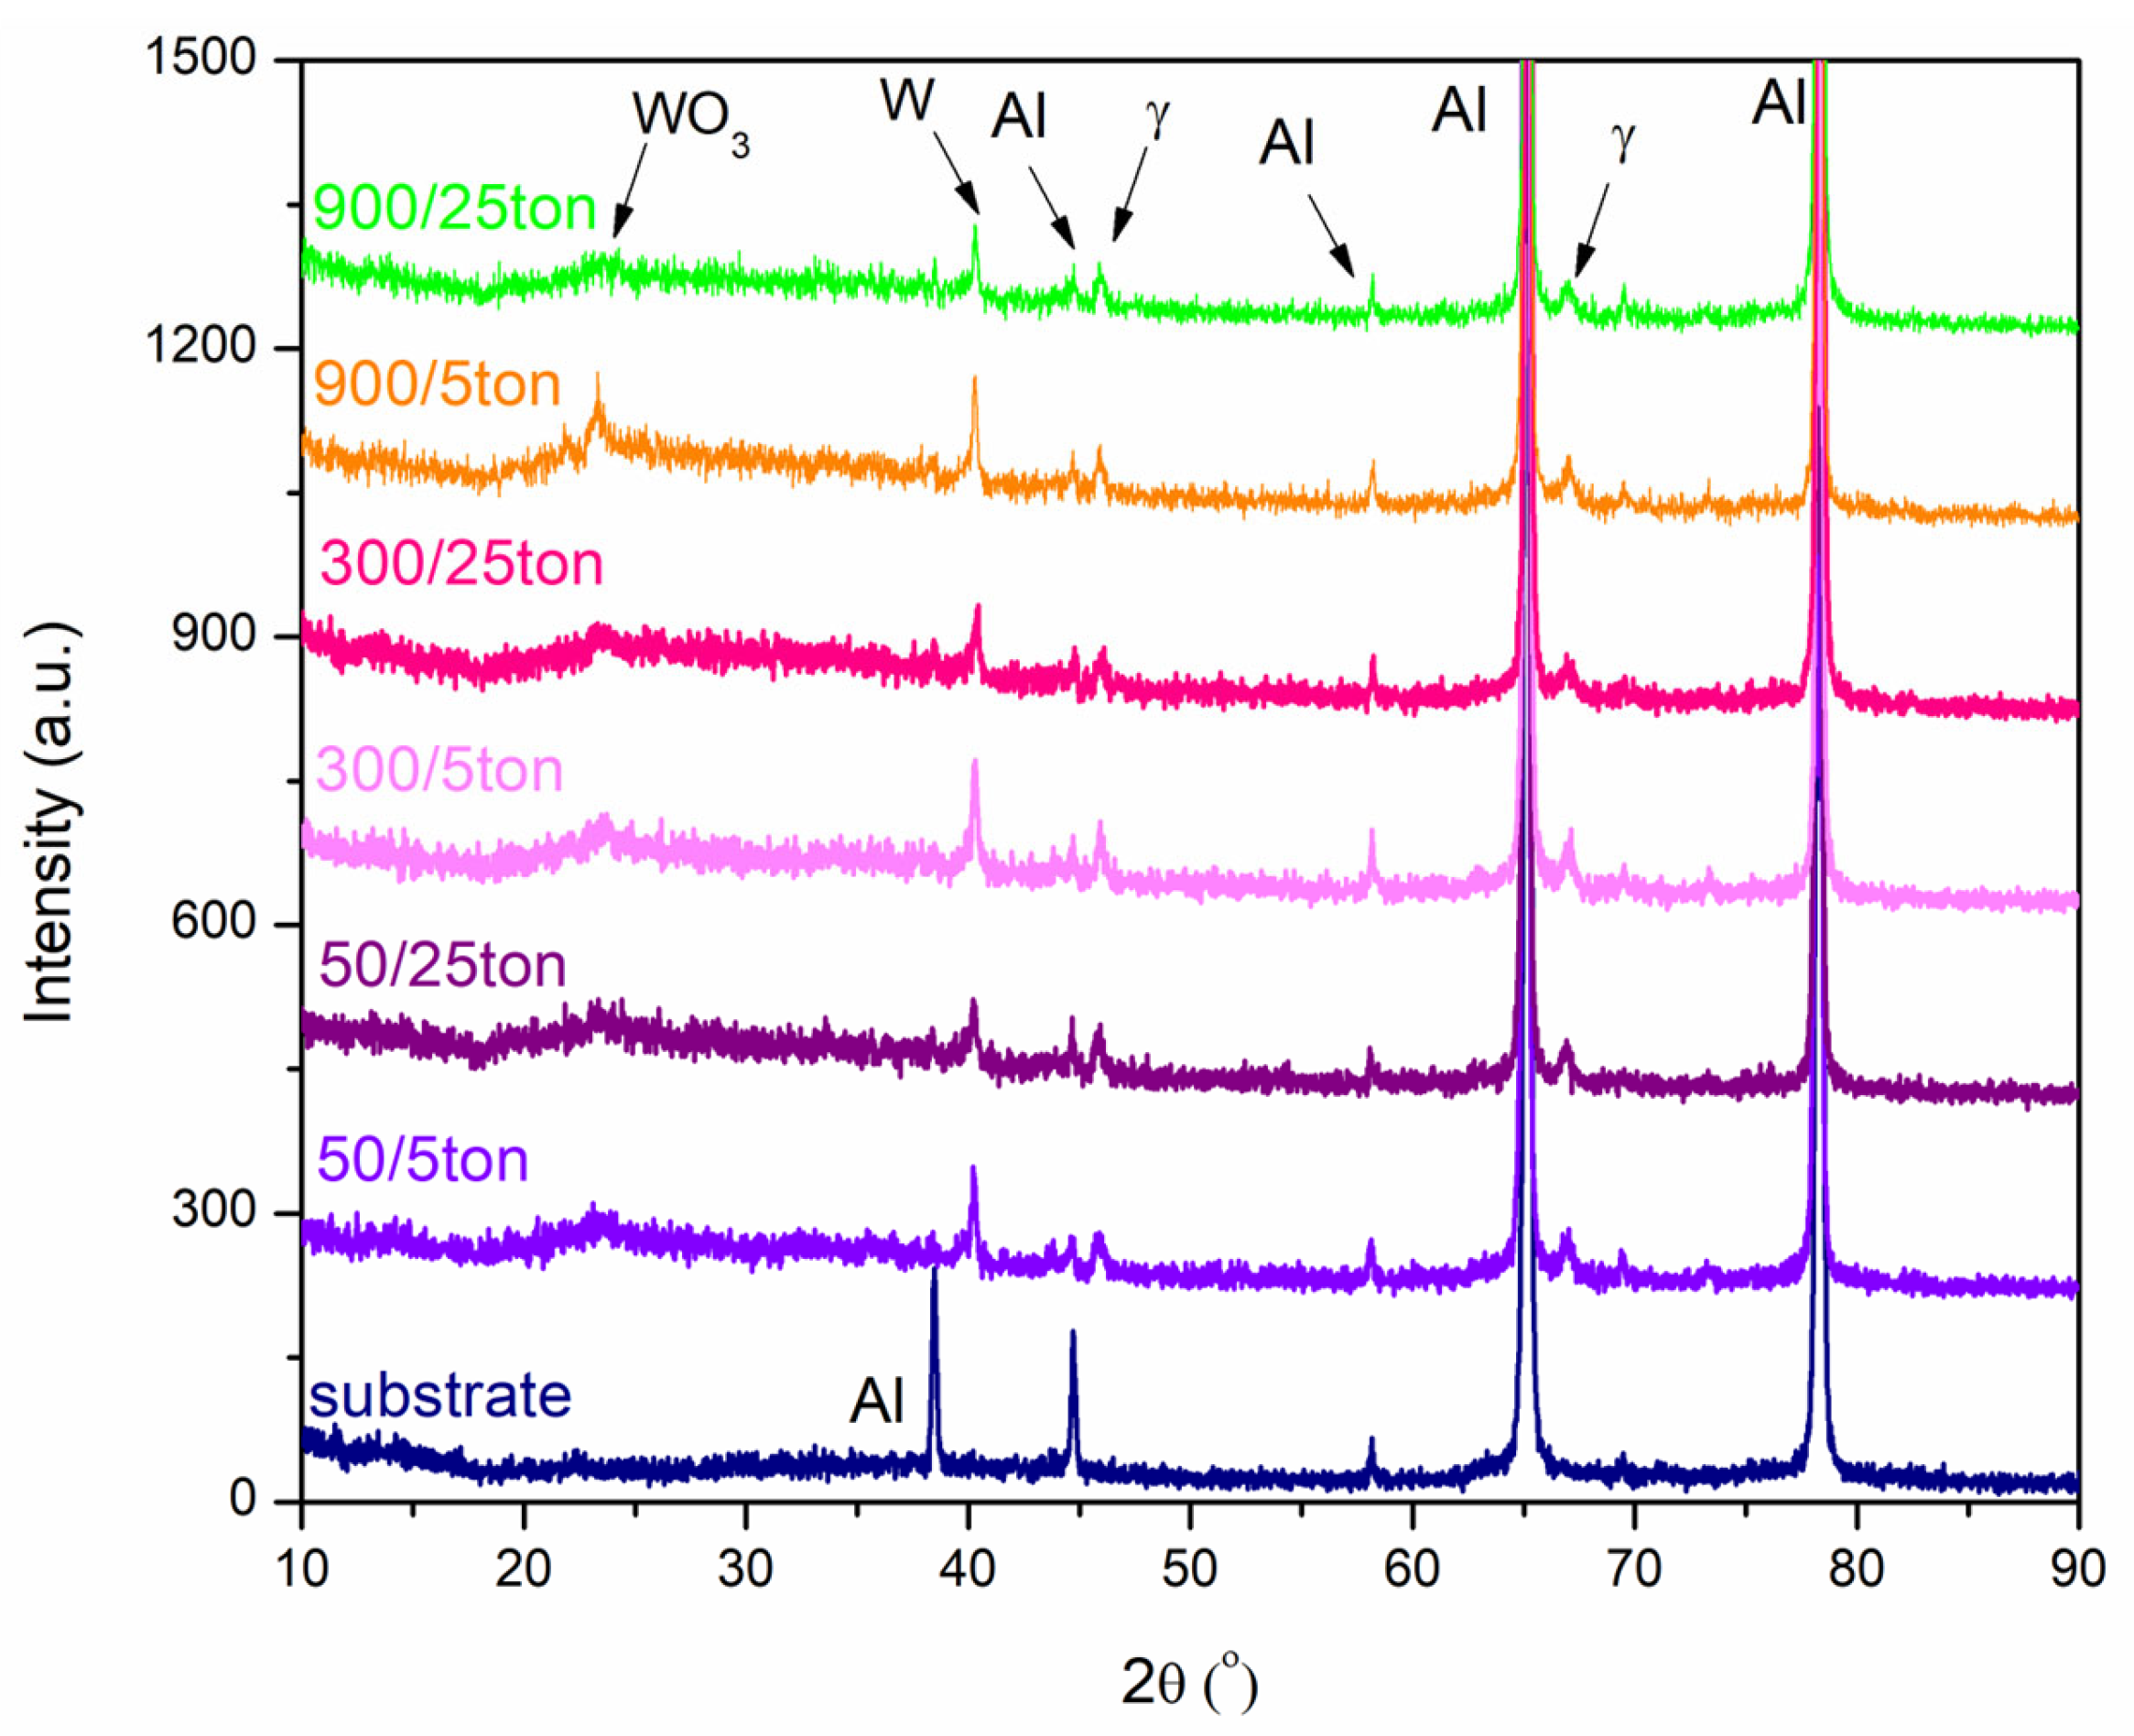
Changing the pulse length (ton = 50 μs, 300 μs, 900 μs) and duty cycle (toff = 5 ton, 25 ton) does not have a considerable influence on the phase and chemical composition of formed coatings. However, a higher level of crystallization in the formed PEO coatings is observed for higher duty cycle values. The formed oxide coatings contain species originating both from the substrate and the electrolyte solution, but their composition does not change dramatically when changing the processing conditions in the investigated range of electrical parameters;
(b)
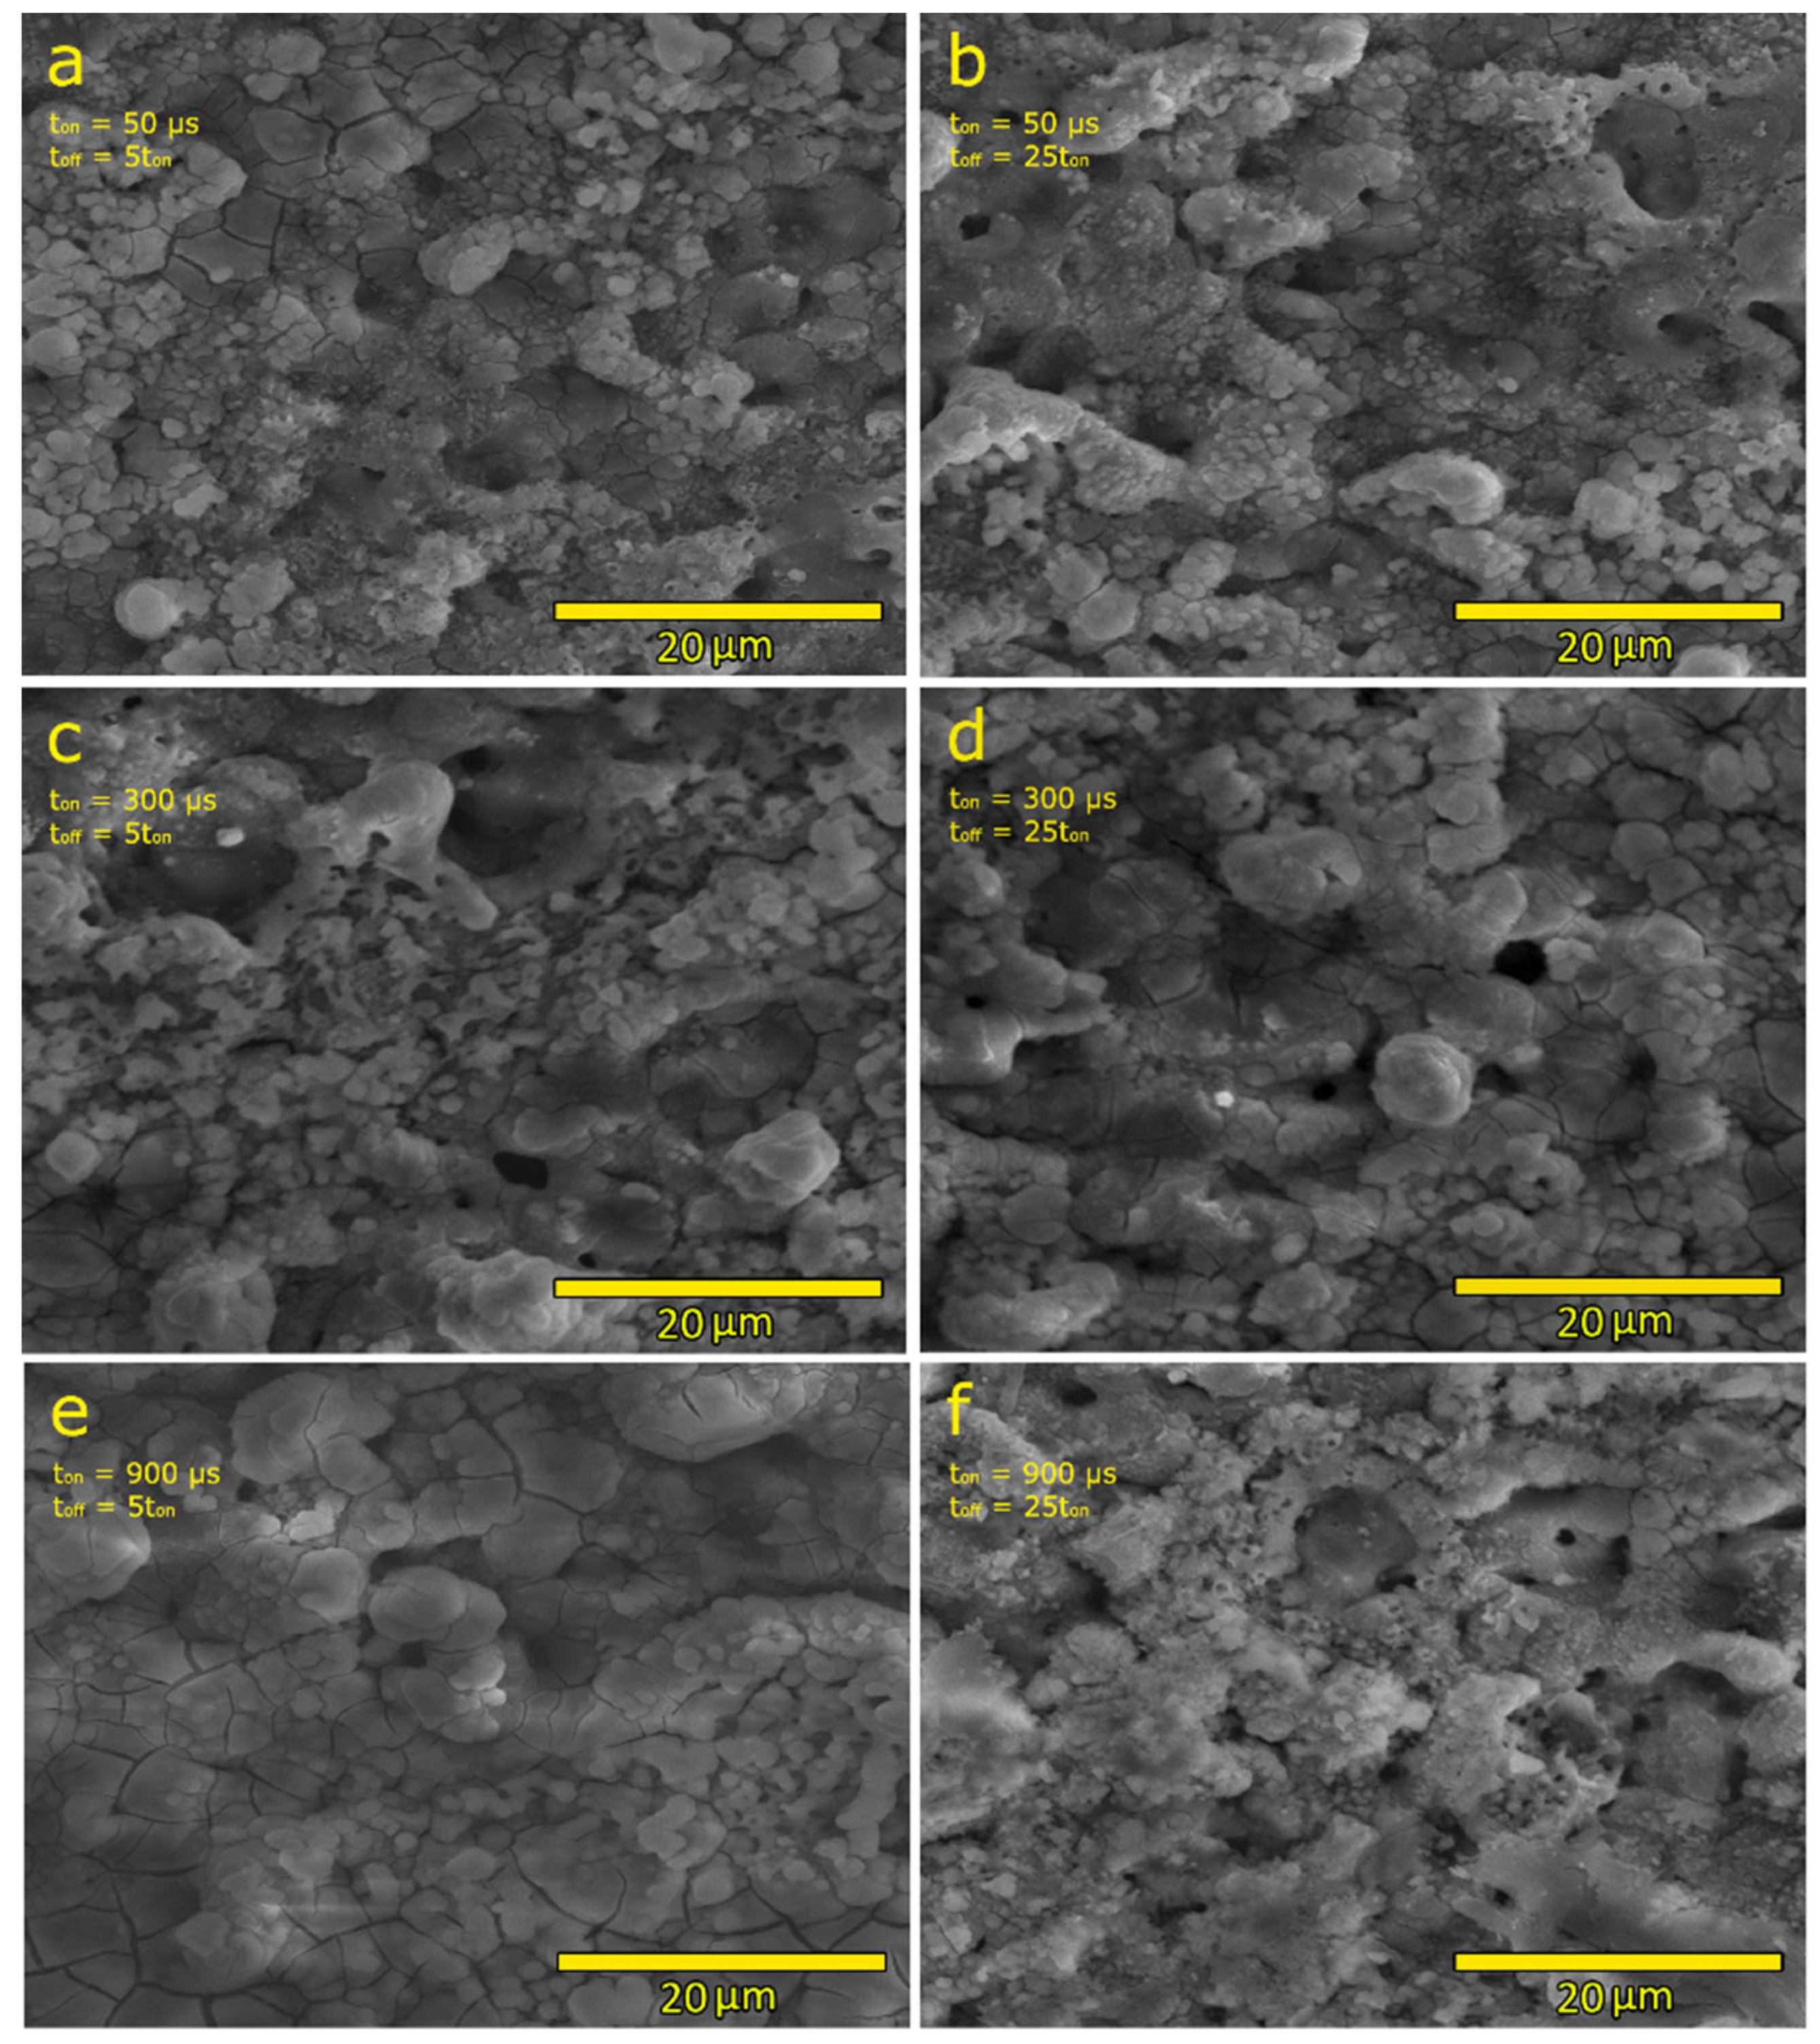
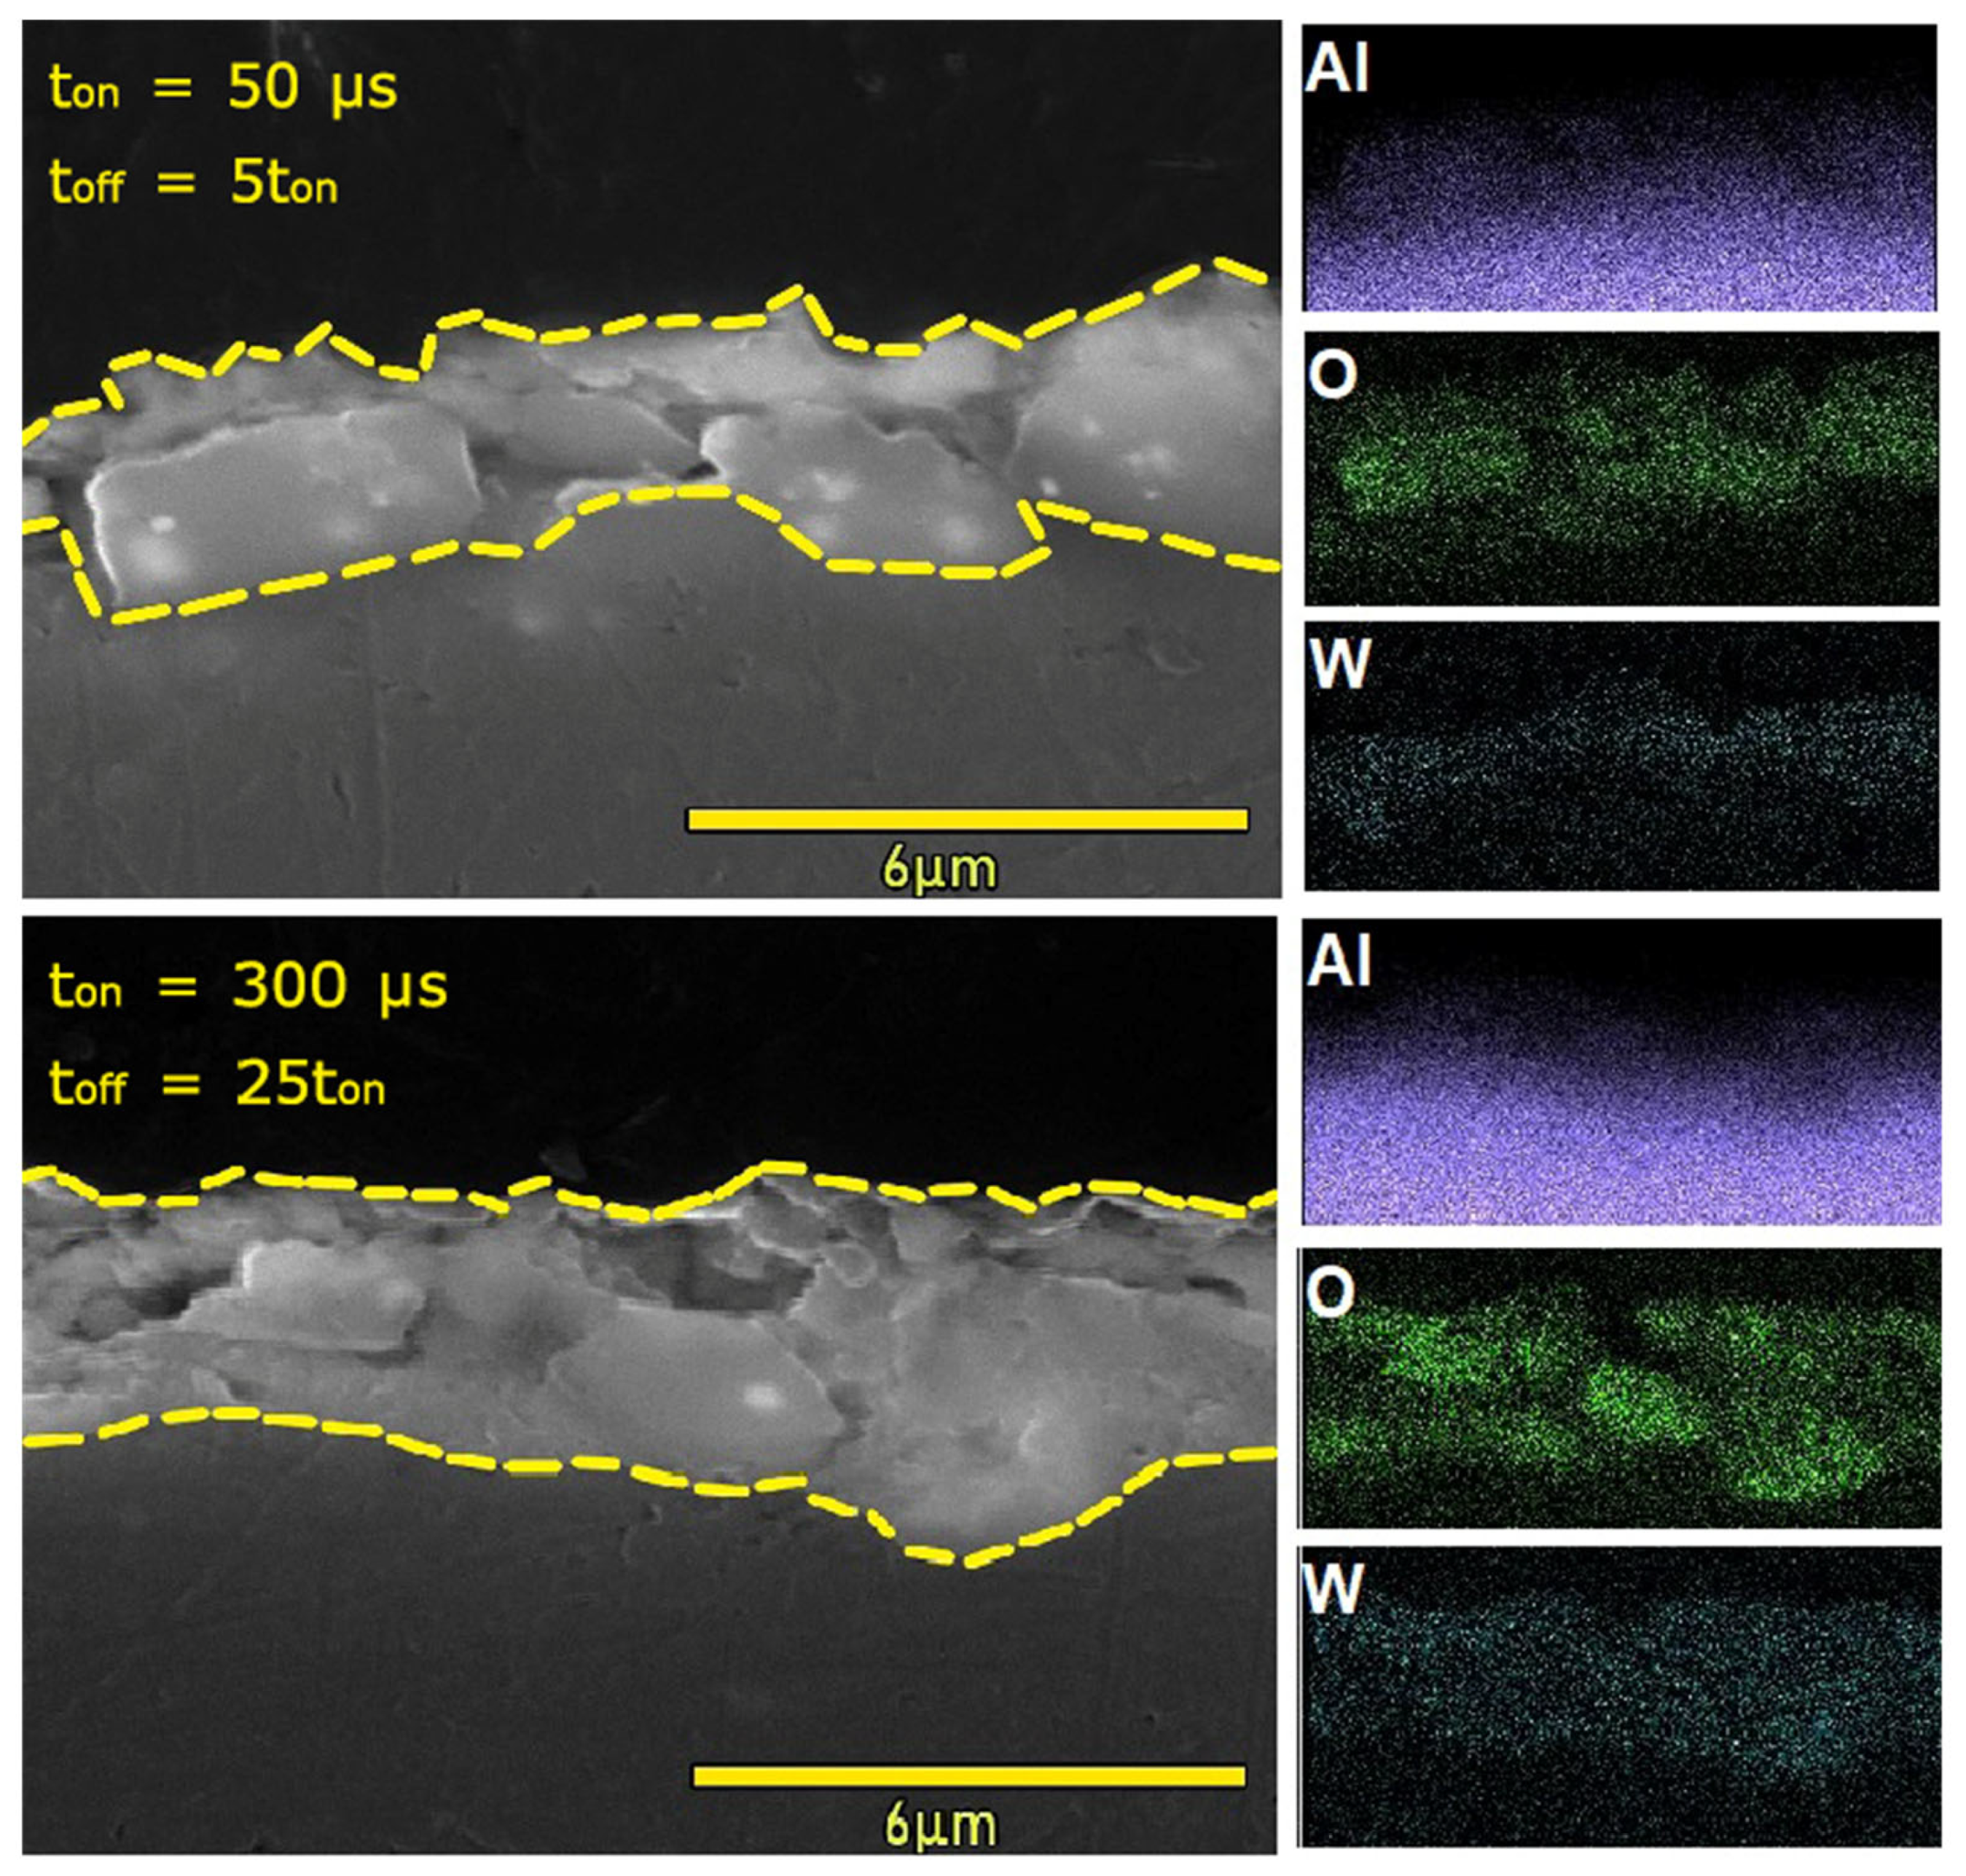
Processing conditions play an important role in the morphology of obtained coatings, especially in their thickness. For coatings with pulse lengths of 50 μs and 300 μs, the thickness increases with the lowering duty cycle, while for the coatings with a pulse length of 900 μs, an opposite trend is observed. Conversely, the porosity of the 900 μs pulse samples increases with the lowering duty cycle, while for the other two pulse lengths, the exact opposite trend is observed. The PEO coatings formed with 50 µs pulses (regardless of the duty cycle value) show higher roughness than the coatings formed with pulse lengths of 300 µs and 900 µs.
(c)
The photocatalytic activity and photoluminescence of formed PEO coatings are dependent on both their morphological properties and their chemical composition. The highest photoactivity is observed for the coatings with ton = 300 μs and toff = 25 ton, which coincides with the maximum PL intensity. However, comparable photocatalytic activity and photoluminescence are observed for the coating formed with ton = 50 μs and toff = 25 ton, which requires about six times less energy for PEO processing.

Author Contributions

Conceptualization, R.V.; methodology, S.S.; investigation, K.M.; data curation, K.M.; writing—original draft preparation, K.M.; writing—review and editing, K.M. and R.V.; visualization, K.M.; supervision, R.V. This manuscript was written with contributions from all authors. All authors have read and agreed to the published version of the manuscript.

Funding

This work was supported by the Ministry of Education, Science, and Technological Development of the Republic of Serbia (contract number: 451-03-47/2023-01/200162) and by the European Union Horizon 2020 research and innovation program under the Marie Sklodowska-Curie grant agreement no. 823942 (FUNCOAT).

Data Availability Statement

The data presented in this study are available in article.

Acknowledgments

The authors would like to thank Jovica Jovović from the Faculty of Physics, University of Belgrade, for the opportunity to work with his new power supply and for all the help he provided us with during the experimental work presented here.

Conflicts of Interest

The authors declare no conflict of interest.

References

  1. Yerokhin, A.L.; Nie, X.; Matthews, A.; Dowey, S.J. Plasma electrolysis for surface engineering. Surf. Coat. Technol. 1999, 122, 73–93. [Google Scholar] [CrossRef]
  2. Kaseem, M.; Fatimah, S.; Nashrah, N.; Ko, Y.G. Recent progress in surface modification of metals coated by plasma electrolytic oxidation: Principle, structure, and performance. Prog. Mater. Sci. 2021, 117, 100735. [Google Scholar] [CrossRef]
  3. Clyne, T.W.; Troughton, S.C. A review of recent work on discharge characteristics during plasma electrolytic oxidation of various metals. Int. Mater. Rev. 2019, 64, 127–162. [Google Scholar] [CrossRef]
  4. Dehnavi, V.; Luan, B.L.; Shoesmith, D.W.; Liu, X.Y.; Rohani, S. Effect of duty cycle and applied current frequency on plasma electrolytic oxidation (PEO) coating behavior. Surf. Coat. Technol. 2013, 226, 100–107. [Google Scholar] [CrossRef]
  5. de Lima, R.N.; Vitoriano, J.d.O.; Ferreira, M., Jr.; Alves Junior, C. Plasma species and coating compositions in aluminum treated by PEO using shot square pulse. Mater. Res. 2020, 23, e2019044. [Google Scholar]
  6. Bertuccioli, C.; Garzoni, A.; Martini, C.; Morri, A.; Rondelli, G. Plasma electrolytic oxidation (PEO) layers from silicate/phosphate baths on Ti-6Al-4V for biomedical components: Influence of deposition conditions and surface finishing on dry sliding behaviour. Coatings 2019, 9, 614. [Google Scholar] [CrossRef]
  7. Lee, J.-H.; Jung, K.-H.; Kim, S.-J. Characterization of ceramic oxide coatings prepared by plasma electrolytic oxidation using pulsed direct current with different duty ratio and frequency. Appl. Surf. Sci. 2020, 516, 146049. [Google Scholar] [CrossRef]
  8. Mojsilović, K.; Jovović, J.; Stojadinović, S.; Vasilić, R. Micro-second range pulsed DC plasma electrolytic oxidation on Ti and Nb. Solid State Sci. 2022, 133, 107018. [Google Scholar] [CrossRef]
  9. Frutuoso, F.G.S.d.O.; Vitoriano, J.d.O.; Alves-Junior, C. Controlling plasma electrolytic oxidation of titanium using current pulses compatible with the duration of microdischarges. Results Mater. 2023, 15, 100310. [Google Scholar] [CrossRef]
  10. Hryniewicz, T. Plasma electrolytic oxidation of metals and alloys. Metals 2018, 8, 1058. [Google Scholar] [CrossRef]
  11. Martin, J.; Nomine, A.; Ntomprougkidis, V.; Migot, S.; Bruyere, S.; Soldera, F.; Belmonte, T.; Henrion, G. Formation of a metastable nanostructured mullite during plasma electrolytic oxidation of aluminium in “soft” regime condition. Mater. Des. 2019, 180, 107977. [Google Scholar] [CrossRef]
  12. Yerokhin, A.L.; Snizhko, L.O.; Gurevina, N.L.; Leyland, A.; Pilkington, A.; Matthews, A. Discharge characterization in plasma electrolytic oxidation of aluminium. J. Phys. D Appl. Phys. 2003, 36, 2110–2120. [Google Scholar] [CrossRef]
  13. Toulabifard, A.; Hakimizad, A.; Di Franco, F.; Raeissi, K.; Santamaria, M. Synergistic effect of W incorporation and pulsed current mode on wear and tribocorrosion resistance of coatings grown by plasma electrolytic oxidation on 7075 Al alloy. Mater. Res. Express 2019, 6, 106502. [Google Scholar] [CrossRef]
  14. Bajat, J.R.; Vasilić, R.; Stojadinović, S.; Mišković-Stanković, V. Corrosion stability of oxide coatings formed by plasma electrolytic oxidation of aluminum: Optimization of process time. Corrosion 2013, 69, 693–702. [Google Scholar] [CrossRef]
  15. Lukiyanchuk, I.V.; Rudnev, V.S.; Andenko, N.A.; Kaidalova, T.A.; Panin, E.S.; Gordienko, P.S. Anodic-spark oxidation of aluminum alloy in tungstate electrlytes. Russ. J. Appl. Chem. 2002, 75, 573–578. [Google Scholar] [CrossRef]
  16. Quan, H.; Gao, Y.; Wang, W. Tungsten oxide-based visible light-driven photocatalysts: Crystal and electronic structures and strategies for photocatalytic efficiency enhancement. Inorg. Chem. Front. 2020, 7, 817–838. [Google Scholar] [CrossRef]
  17. Razali, N.A.M.; Salleh, W.N.W.; Aziz, F.; Jye, L.W.; Yusof, N.; Ismail, A.F. Review on tungsten trioxide as a photocatalysts for degradation of recalcitrant pollutants. J. Clean. Prod. 2021, 309, 127438. [Google Scholar] [CrossRef]
  18. Tian, J.; Shang, K.; Xue, X.; Yang, L. Degradation of methyl orange waste water by electrochemical oxidation method. J. Phys. Conf. Ser. 2013, 418, 012134. [Google Scholar] [CrossRef]
  19. Stojadinović, S.; Vasilić, R.; Radić, N.; Tadić, N.; Stefanov, P.; Grbić, B. The formation of tungsten doped Al2O3/ZnO coatings on aluminum by plasma electrolytic oxidation and their application in photocatalysis. Appl. Surf. Sci. 2016, 377, 37–43. [Google Scholar] [CrossRef]
  20. Thompson, G.E.; Skeldon, P.; Shimizu, K.; Wood, G.C. The composition of barrier-type anodic films formed on aluminium in molybdate and tungstate electrolytes. Phil. Trans. R. Soc. Lond. A 1995, 350, 143–168. [Google Scholar]
  21. Mojsilović, K.; Tadić, N.; Lačnjevac, U.; Stojadinović, S.; Vasilić, R. Characterization of Al-W oxide coatings on aluminum formed by pulsed direct current plasma electrolytic oxidation at ultra-low duty cycles. Surf. Coat. Technol. 2021, 411, 126982. [Google Scholar] [CrossRef]
  22. Zheng, H.Y.; Wang, Y.K.; Li, B.S.; Han, G.R. The effects of Na2WO4 concentration on the properties of microarc oxidation coatings on aluminum alloy. Mater. Lett. 2005, 59, 139–142. [Google Scholar] [CrossRef]
  23. Karbasi, M.; Nikoomanzari, E.; Hosseini, R.; Bahramian, H.; Chaharmahali, R.; Giannakis, S.; Kaseem, M.; Fattah-alhosseini, A. A review on plasma electrolytic oxidation coatings for organic pollutant degradation: How to prepare them and what to expect of them? J. Environ. Chem. Eng. 2023, 11, 110027. [Google Scholar] [CrossRef]
  24. Huang, Z.F.; Song, J.; Zhang, X.; Wang, L.; Zou, J.J. Tungsten Oxides for Photocatalysis, Electrochemistry, and Phototherapy. Adv. Mater. 2015, 27, 5309–5327. [Google Scholar] [CrossRef]
  25. Azmat, S.; Jan, T.; Ilyas, S.Z.; Hassan, A.; Habib, I.; Mahmood, Q.; Mahmood, A. Solar light triggered photocatalytic performance of WO3 nanostructures; waste water treatment. Mater. Res. Express 2018, 5, 115025. [Google Scholar] [CrossRef]
  26. Cheng, O.; Zhang, G.K. Enhanced photocatalytic performance of tungsten-based photocatalysts for degradation of volatile organic compounds: A review. Tungsten 2020, 2, 240–250. [Google Scholar] [CrossRef]
  27. Stojadinović, S.; Radić, N.; Vasilić, R.; Petković, M.; Stefanov, P.; Zeković, L.; Grbić, B. Photocatalytic properties of TiO2/WO3 coatings formed by plasma electrolytic oxidation of titanium in 12-tungstosilicic acid. Appl. Catal. B Environ. 2012, 126, 334–341. [Google Scholar] [CrossRef]
  28. Pancielejko, A.; Rzepnikowska, M.; Zaleska-Medynska, A.; Łuczak, J.; Mazierski, P. Enhanced Visible Light Active WO3 Thin films toward air purification: Effect of the Synthesis Conditions. Materials 2020, 13, 3506. [Google Scholar] [CrossRef]
  29. Wang, B.B.; Zhnong, X.X.; He, C.L.; Zhang, B.; Cvelbar, U.; Ostrikov, K. Solvent-dependent structures and photoluminescence of WO3-x nanomaterials grown in nonaqueous solutions. J. Alloys Compd. 2021, 854, 157249. [Google Scholar] [CrossRef]
  30. Liqiang, J.; Yichun, Q.; Baiqi, W.; Shudan, L.; Baojiang, J.; Libin, Y.; Wei, F.; Honggang, F.; Jiazhong, S. Review of photoluminescence performance of nano-sized semiconductor materials and its relationships with photocatalytic activity. Sol. Energy Mater. Sol. Cells 2006, 90, 1773–1787. [Google Scholar] [CrossRef]
  31. Wang, Z.; Lin, R.; Li, H.; Wang, L. Formation, detection, and function of oxygen vacancy in metal oxides for solar energy conversion. Adv. Funct. Mater. 2022, 32, 2109503. [Google Scholar] [CrossRef]
Figure 1. Waveforms used in experiments recorded during PEO processing.
Metals 13 01931 g001
Figure 2. XRD patterns of the formed PEO coatings on aluminum for different duty cycles, where γ represents γ-Al2O3.
Metals 13 01931 g002
Figure 3. Top-view SEM micrograph of formed oxide coatings: (a) 50/5ton, (b) 50/25ton, (c) 300/5ton, (d) 300/25ton, (e) 900/5ton, (f) 900/25ton.
Metals 13 01931 g003
Figure 4. Cross-sectional SEM micrographs of all obtained PEO coatings: (a) 50/5ton, (b) 50/25ton, (c) 300/5ton, (d) 300/25ton, (e) 900/5ton, (f) 900/25ton.
Metals 13 01931 g004
Figure 5. Cross-sectional EDS mapping for samples with the lowest (50/5ton) and the highest (300/25ton) content of W.
Metals 13 01931 g005
Figure 6. Three-dimensional AFM images of obtained PEO coatings.
Metals 13 01931 g006
Figure 7. Distinctive morphology for coatings obtained in this study.
Metals 13 01931 g007
Figure 8. (a) Photocatalytic activity of all coatings after 6 h of irradiation under a solar lamp; (b) photolysis in the dark after 6 h for the 900/5ton sample; (c) photodegradation after 6 h under a solar lamp for the 300/5ton sample.
Metals 13 01931 g008
Figure 9. Repeatability test for 300/25ton sample.
Metals 13 01931 g009
Figure 10. PL spectra for obtained PEO coatings.
Metals 13 01931 g010
Table 1. Sample denotation used in this study.
Sample Name
(ton/toff)
ton (µs)toff (μs)Dt
50/5ton5025016.66
50/25ton5012503.85
300/5ton300150016.66
300/25ton30075003.85
900/5ton900450016.66
900/25ton90022,5003.85
Table 2. EDS results for all obtained PEO coatings.
ElementAtomic Fraction (%)
50/5ton50/25ton300/5ton300/25ton900/5ton900/25ton
O64.3467.5370.8871.2575.3264.94
Al29.8925.2221.3220.8517.4728.15
W5.777.257.797.907.226.92
Table 3. Basic characteristics of obtained PEO coatings.
Sample NameThickness (µm)Porosity (%)Roughness (nm)
50/5ton1.7 ± 0.29.84 ± 0.15368 ± 18
50/25ton2.9 ± 0.26.43 ± 0.12495 ± 9
300/5ton2.8 ± 0.410.61 ± 0.19317 ± 7
300/25ton3.7 ± 0.39.41 ± 0.13419 ± 16
900/5ton3.1 ± 0.18.59 ± 0.13319 ± 14
900/25ton2.1 ± 0.311.13 ± 0.18421 ± 11
Disclaimer/Publisher’s Note: The statements, opinions and data contained in all publications are solely those of the individual author(s) and contributor(s) and not of MDPI and/or the editor(s). MDPI and/or the editor(s) disclaim responsibility for any injury to people or property resulting from any ideas, methods, instructions or products referred to in the content.

