Abstract
Due to their versatile advantages, the use of additively manufactured components is growing. In addition, new additive manufacturing processes are constantly being developed, so that a wide range of printing processes are now available for metal. Despite the same starting material, the microstructure and thus also the final mechanical properties differ greatly compared to conventional processes. In most cases, only direction-dependent characteristic values from the uniaxial tension are used to qualify a printing process before it is used. The literature, on the other hand, demonstrates that the results are not transferable to other loading conditions. In this work, several engineering tests were integrated into a single test specimen so that they can be determined on the same specimen. The test specimen can be used to test tooth root strength, bending strength, notched bar impact energy, and thread strength depending on the mounting direction, thus representing industrial loading cases. In this study, test specimens were fabricated by conventional manufacturing (machining), L-PBF (Laser Powder Bed Fusion), and WA-DED (Wire Arc Direct Energy Deposition), and the results were compared using statistical methods. Factors to capture manufacturing influence and buildup direction were statistically validated on 316L. The work shows a benchmark with a typical initial microstructure of rolled and milled material, L-PBF, and WA-DED parts on loads close to the application and thus simplifies an industry-oriented evaluation of a new manufacturing process.
1. Introduction
1.1. Additive Manufacturing
Additive manufacturing (AM) is a very promising manufacturing method that has been under research for a long time now. Yet, parts made by AM are still considered critical because of the large number of different AM technologies and their specific influences on the process and material, which significantly affect the mechanical properties. The currently available testing standards for conventional manufacturing methods (such as rolling, sheet metal forming, or machining) were considered. Newer technologies develop much faster than testing methods and the gathering of reliable results [1]. Therefore, derived guidelines and standards for testing AM processes and parts take a lot of effort and time to be drafted and evaluated. Especially for high-risk applications such as the aviation industry, the qualification procedure for the manufacturing process, the processed material, as well as the part/material testing method is a time- and cost-consuming progress [2]. At the moment the known testing standards are adapted for the testing of AM parts [3,4].
Two widely spread AM methods are Laser Powder Bed Fusion (L-PBF) and Wire Arc Direct Energy Deposition (WA-DED), which share the same layer-wise deposition principle. L-PBF is realised by distributing powder of a specified layer thickness with a coater on a moveable building platform. A laser source is used to melt the previous solid layer together with the distributed powder. The desired geometry is generated by guiding the laser via a high-speed mirror system. After finishing one layer, the platform moves downwards and the process cycle starts again. The most influential process parameters for L-PBF are the laser power, laser scanning speed, laser spot size, powder layer thickness, and hatch distance. A derived influence of the previously mentioned parameters is the transient temperature field, which also depends on the platform pre-heating or powder bed temperature, the thermal material properties, and the part geometry [5]. WA-DED instead uses conventional welding equipment like that for Gas Metal Arc Welding (GMAW). Here, a consumable electrode as filler wire is fed to a substrate plate. An electric arc, used as an energy source, melts the wire and the already deposited weld beads while generating a new layer. The control of the machine movement to generate the desired part geometry is mostly realised via NC code processed by a CNC machine or a robot. The process parameters with the most influence are the welding power, welding speed, and shielding gas composition [6,7,8]. Up to date, a wide range of possible AM processes covering different materials and energy sources are available. For different AM principles, a certain terminology is used. Yet, there exist manufacturer-specific individual process names. A more detailed description of those processes and the applied terminology can be found in [9,10].
AM processes need to be qualified to ensure the production of defect-free parts and the achievement of desired (minimal) mechanical properties like ultimate or yield strength. The easiest, and at the beginning of a qualification process the most informative testing method, are static tensile tests. The often-chosen geometries are therefore near net-shape geometries of tensile test samples or simple walls, where tensile test samples are extracted from. Further test geometries are specific, e.g., bending and shear or also crack propagation, which are also further separated in static and dynamic loads.
Complex AM parts, however, can experience combined tensile, compressive, bending, and shear loads at the same time. This causes a multi-axial load that can be calculated by equivalent stress, such as Von Mises [11]. The AM parts are usually tested in a testing rig that simulates the real operation conditions. While this allows for proving of the stability of the final AM part, a distinguished determination of strength for each different mechanical load (e.g., bending and shear strength) is not possible. Yet, those parameters are required for a sufficiently accurate design and simulation process.
1.2. Investigation of the Obtained Mechanical Properties by Destructive Test Methods
The testing of AM parts with their final geometry and under real operation conditions has not been widely common in the research area so far. The VDI 3405.2 provides guidelines for conducting a range of tests aimed at determining standard material parameters for additive manufactured parts [12]. The following section contains a detailed analysis of commonly used tests such as tensile, compression, and Charpy notched bar impact tests, followed by application-related tests such as bending or multiaxial loads, all of which allow for conclusions to be drawn about the quality of the components and the reliability of the processes in additive manufacturing.
The majority of researchers conduct tensile tests using standard geometries, such as those outlined in standards, e.g., ASTM or DIN/ISO. In the standard DIN EN ISO/ASTM 52927-14 (draft) are stated general principles for testing AM parts [13]. The standard also includes the stock material, geometrical, and surface aspects as well as load type and sample preparation methods for AM parts. An often-generated part geometry is a turbine blade, where tensile test specimens are extracted. Posch et al. used WA-DED to produce a blade-like geometry made of duplex stainless steel. They extracted tensile test samples from different regions of the blade-like geometry and showed that they have comparable mechanical tensile properties according to the material specification in an as-welded condition [14]. Liu et al. used WA-DED to repair a Ti6Al4V blade and obtained mechanical tensile properties for the as-welded condition, which are in the range of other manufacturing processes [15]. Yan et al. demonstrated the Laser Metal Deposition (LMD) process for a Ti6Al4V blade, where lower mechanical tensile properties than for WA-DED and the casting condition TC4 were achieved [16]. Rodriguez et al. showed the influence of the tensile test sample orientation and the bead orientation for a stainless-steel WA-DED part. They demonstrated that vertically oriented samples (beads perpendicular to the tensile test sample orientation) have a lower ultimate strength and yield strength than horizontally oriented samples (beads parallel to the sample orientation) [17]. Addison et al. examined the WA-DED process for a Ti6Al4V thin wall with a height of 155 mm. No influence of the extraction position (top or bottom) on the mechanical properties could be determined [18]. Bambach et al. manufactured a Ti6Al4V hybrid part by forming a preform and subsequent WA-DED to enhance the geometry. They stated that the obtained tensile mechanical properties exceeded the requirements according to DIN standards for casted and forged material [19]. Köhler et al. extracted tensile test samples from an aluminium wall made by WA-DED and also demonstrated that no significant influence on the tensile properties can be derived from the extraction height if the interlayer temperature is kept constant below the material’s maximum, but that it depends on the loading direction regarding the bead orientation [20]. Yildiz et al. created thin walls and a large prismatic block of low-alloy steel by means of WA-DED and determined the tensile properties as well as the hardness distribution. They showed that tensile strength is only slightly affected by heat input but is more so affected by sample orientation. Nearly the same tensile strength values were achieved by both the thin walls and the block. The hardness varies maximally around 20% for the thin wall, depending on the distance to the substrate. At half the height, the hardness has a global minimum, while the bottom and top parts have higher hardness values. For the block, the hardness slightly increases from the bottom to the top of the block with a deviation of about 10% [21].
Compression tests can be applied either to larger parts to simulate massive forming processes or to small samples to gain knowledge of microstructure development. In both cases, the forming behaviour is analysed as a crucial material parameter. Longhitano et al. investigated L-PBF-manufactured Ti6Al4V parts under tensile and compressive loads for biomedical applications, where a different material behaviour between tensile and compressive loads was observed. A heat treatment led to sufficient mechanical properties for use in implants by meeting ASTM requirements [22]. Abbaszadeh et al. analysed the results of the compression behaviour of WA-DED structures for different materials. They showed material-dependent anisotropic behaviour [23]. Bambach et al. examined the hot forming behaviour of Ti6Al4V made by AM. The findings allow for the design of optimised processing routes, which shall reduce forming forces and improve mechanical properties [24]. The buckling that occurs during compression load is often examined for lightweight-designed L-PBF parts. Clausen et al. state that the buckling load depends on the infill material and can be increased by optimisation [25]. Nazir et al. demonstrated the influence of design parameters on the buckling behaviour of lattice structures. Vertical beams have a higher tendency of buckling than horizontal or inclined beams. Also, the infill density is a significant design parameter [26]. Vastola et al. showed the impact of smooth corners that lead to a reduction in distortion. Also, the part width has a stronger impact on the distortion than the part height. Furthermore, a tubular cross-section causes significantly less distortion than a square-like cross-section [27].
The method of notched bar impact testing, as outlined in the DIN EN ISO 148 series of standards and commonly employed in both scientific and practical contexts, serves to determine the energy of notched bars under impact loads and consequently their corresponding behaviour [28]. The authors, Š. Hermanová et al., carried out a study on components manufactured through powder bed-based additive methods using 316L material. The study aimed to determine the maximum notched impact energy of these components [29]. Deng et al. (2019) performed a similar study and made a distinction between specimens that underwent heat treatment at 650 °C and those that did not [30]. In their study [31], Davies et al. conducted comparable investigations wherein they analysed samples taken both horizontally and vertically in their original state, as well as after undergoing heat treatments at 700 °C and 900 °C. Komorasamy et al. accomplished a comparative analysis of the behaviour of notched bar impact specimens extracted horizontally and vertically with respect to the direction of exposure as per DIN EN ISO 148 on Inconel 718 [23]. Yasa et al. examined the notched bar impact strength of L-PBF produced parts made of 316L, Ti6Al4V, and maraging steel. Here, they used a cuboid testing geometry with and without notches. The varied process parameters were the building orientation (x, y, z) and heat treatment. They found that the preparation (conventionally or by electrical discharge machining, EDM) of the notch and the building orientation showed no significant influence on the toughness [32]. Afkhami et al. investigated the influence of the weld orientation vertically and horizontally to the notch and found that there is no correlation [33].
The following are some notes on application-related tests that allow conclusions to be drawn about the quality of the additive manufacturing process. Ayan et al. used tensile test geometries to examine the bending fatigue properties of structural steel produced by WA-DED [34]. Concli et al. investigated the bending fatigue behaviour of 17-4PH gears produced by AM. They used a single-tooth bending fatigue approach to determine the bending strength. They found good bending strength without any further treatment but highlighted the importance of defects, which negatively affect the gear [35]. Schmitt et al. also applied dynamic mechanical testing to a gear made of 16MnCr5 processed by L-PBF to determine the tooth root bending strength. They showed that the achievable tooth root strength lies closely under the value of a conventional gear made of case-hardened steel. Additionally, this also showed the influence of the sample orientation, manufacturing process, and post-treatment on the tensile strength, which showed larger deviations [36].
Torsional fatigue behaviour of wrought and AM Ti6Al4V was examined by Fatemi et al. They showed the effects of different manufacturing processes, additional heat treatment, and surface conditions [37]. Furthermore, Fatemi et al. provide a novel sample geometry for fatigue testing of AM parts. Here, axial, torsion, and combined axial-torsion loads were applied to a hollow thin-walled sample. Experiments showed the general feasibility of the novel sample geometry without any significant negative effects of the geometrical shape on the fatigue life compared to conventional tensile test samples [38]. The effect of combined multi-axial bending and torsion on fracture surface parameters was examined by Macek et al. for high-strength steels produced by conventional and additive manufacturing. They state that surface topography parameters are influenced by the bending-to-torsion ratio and the fatigue life, as well as the von Mises stress range, all in a linear relationship [39]. Fatemi et al. also comprehensively examined the multi-axial fatigue behaviour of additively manufactured Ti6Al4V and 17-4PH [40].
Bambach et al. conducted a study involving mechanical load testing on a thread that was cut into an aluminium sheet that had been thickened through the use of laser metal deposition (LMD). A comparative analysis showed a statistically significant increase in the pull-out force of the AM-thickened sheet after subsequent curing by almost four times compared to the original sheet [41].
1.3. A Comparative Analysis of Manufacturing Technologies with Respect to Their Impact on Mechanical Properties
In some cases, tensile test results of ultimate strength or yield strength can be used to roughly estimate other mechanical properties such as bending strength. In general, the mechanical properties are empirically determined and individually proven but are not mathematically related to the manufacturing processes that define the geometrical shape.
A comprehensive overview of mechanical property gradients in AM parts and specimens is given by Kok et al. They state that anisotropic behaviour and heterogeneity are significantly affected by microstructural development, including grain morphology, crystallographic texture, lack-of-fusion defects, phase transformation, heterogeneous recrystallization, layer banding, and microstructural coarsening. While the requirements for the mechanical properties are often met, larger local variations in the strength parameters occur due to different building directions and AM process parameters [42].
For demonstration purposes, the variation in the yield strength depending on the manufacturing process and material condition of the data summarized by Kok et al. is shown in Figure 1 for Ti6Al4V.
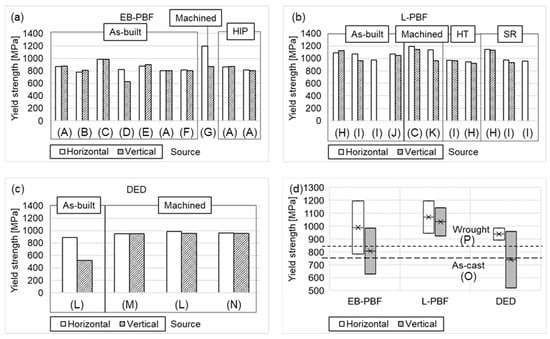
Figure 1.
Influence of the manufacturing process, material condition, and testing direction on the yield strength of Ti6Al4V from different literature sources for (a) EB-PBF, (b) L-PBF, (c) DED, and (d) summary of the range of yield strength values depending on the manufacturing process. The reference values of yield strength for as-cast (long-dashed line) and wrought condition (short-dashed line) are provided as well. Data from Ref. (A) = [43], (B) = [44], (C) = [45], (D) = [46], (E) = [47], (F) = [48], (G) = [49], (H) = [50], (I) = [51], (J) = [52], (K) = [53], (L) = [54], (M) = [55], (N) = [56], (O) = [57], (P) = [58].
The figures reveal the large deviations in the yield strength depending on the manufacturing process (Electron Beam Powder Bed Fusion (EB-PBF), L-PBF, DED), the material condition (as-built, hot-isostatic pressed HIP, machined, heat treated HT, stress relieved SR), and the testing direction, even for standardized materials. In relation to Kok et al., and in accordance with ASTM F F1108 [57] and ASTM 1472 [58], the reference values for yield strength for the as-cast condition is 758 MPa and for the wrought condition 860 MPa [42].
The yield strength in horizontal orientation of as-built samples shows a minimum of 783 MPa for Electron Beam Powder Bed Fusion (EB-PBF) [44] and a maximum of 1093 MPa by DED [50]. In vertical orientation, there is a range of 603 MPa between the minimum of 522 MPa by Powder Bed Fusion [54] and the maximum of 1125 MPa by DED [50]. Machining of the specimens improves the mechanical properties of the specimens due to the reduction in the notch effect. The minimum yield strength in horizontal orientation is 950 MPa by L-PBF method [55] and maximum yield strength is 1195 MPa by the PBF and the DED method. In vertical orientation, the characteristic values are between 869 MPa by the PBF method and 1143 MPa by the DED [45]. Heat treatment and stress relief annealing were only performed for the DED process. In horizontal orientation, the heat-treated samples obtain a minimum yield strength of 944 MPa and a maximum yield strength of 973 MPa [53]. In vertical orientation, yield strengths are between 937 MPa [50] and 964 MPa [50]. Stress relief annealing produces yield strengths between 958 MPa [51] and 1145 MPa in horizontal orientation [50]. In vertical orientation, the yield strength ranges between 937 MPa [51] and 1132 MPa [50]. Hot-isostatic pressing was only investigated for the EB-PBF process. The yield strength in horizontal orientation varies between 814 MPa and 866 MPa. In vertical orientation, yield strengths vary between 807 MPa and 868 MPa [50]. The minimum and maximum values of achievable yield strength over different manufacturing processes are shown in Figure 1d. Here, the large general range is visible, which can vary from approx. 520 MPa up to 1200 MPa. In some cases, the requirements of ASTM standards are not met.
The impact of the component geometry on mechanical properties is a well-known phenomenon that is duly considered in component design through the incorporation of notch and shape factors. The aforementioned factors enable the capture of distinct stress distributions, local plastic strains, notch effects, and inhomogeneous microstructure development, thereby obviating the need for component-specific tests during the design phase [59]. However, incorporation of the manufacturing process as a design factor is currently not feasible even for materials that are extensively utilized. So far, only surface treatments (e.g., shot peening) and/or heat treatments (e.g., induction heating) that can improve mechanical properties have been used as multiplicative factors in a range of 0.8–1.4 for the calculation [59]. These factors are only applicable to the calculation of fatigue strength.
Due to the different material behaviours in a wide range during AM processes, a distinction of the process-specific influences of different AM processes on the microstructure evolution andmechanical properties are challenging, respectively. As the manufacturing process has a significant impact on the final mechanical properties, it is of high interest to know which AM process leads to which microstructures and mechanical properties and what the causing mechanisms are. This knowledge about the relationship between mechanical properties and the AM process is strongly required for the design of parts. Furthermore, there is a lack of statements for basic design elements in a part geometry that are dependent on the entire manufacturing process, which typically consists of multiple processing steps.
1.4. Aim of the Paper
This work aims to develop a scalable and extensible benchmark geometry with an efficient test sequence and test specification. The results will be compared with the traditional manufacturing route of rolled material. The final outcome is a set of manufacturing factors for arbitrary process chains, from which design elements can be easily calculated. Statistics are employed as well to quantify the significance of the observed influencing factors.
2. Materials and Methods
2.1. Overview of the Analysis
The presentation of the material, test specimens, and methods is followed by the results in Section 3, which are discussed (Section 4) and lead to the conclusions. The results begin with density/defect and microstructure analyses of the built-up test specimens, ensuring the presence of a process-typical condition (Section 3.1). The force–displacement curves, test parameters, and manufacturing factors are then determined and assessed statistically (Section 3.2). Compression tests (Section 3.3.1) and selected microstructural investigations (Section 3.3.2) are used to validate the manufacturing factors. In Section 4, the proposed test specimen is first discussed in relation to VDI 3405.2 [12] (Section 4.1), and then all features are examined individually and in relation to the validation tests.
2.2. Materials
The metastable austenitic steel 316L is a widespread AM material and was used in this work. It has a high ultimate tensile strength, beneficial forming properties, and is corrosion resistant. It can be well-processed by a wide range of manufacturing processes, providing good flexibility for a wide range of products. The chemical composition of the powder for L-PBF comes from SLM Solutions Group AG, Lübeck, Germany, for the wire from MIGAL.CO GmbH, Landau an der Isar, Germany and for the sheet from Stahlhandel Gröditz GmbH, Gröditz, Germany (Table 1).

Table 1.
Chemical composition of the used feedstock materials.
The 316L powder particle analysis according to the manufacturer is provided in (Table 2). The median particle size is 35 µm and the powder is of spherical shape.
Table 2.
Powder particle size distribution of 316L for L-PBF.
2.3. Designed Sample Test Geometry and Device Setup for Mechanical Testing
2.3.1. Sample Test Geometry
The aim is to consider as many of the essential influencing parameters of the respective manufacturing process as possible and then to describe these with a manufacturing factor depending on the machine element. In this work, two additive manufacturing routes, the fast and cost-effective arc build-up welding (WA-DED) and the laser powder bed fusion (L-PBF), are compared with pure milling from sheet metal. The test specimen acts as both a demonstrator geometry and a test geometry. The first parameters considered are the manufacturing welding option with rework and the weld orientation, whereby the weld orientation has a significant influence on the mechanical properties (for more information, see Section 2.5 and Section 2.7). The weld sequence and base plate position are described in Section 2.5 and influence the microstructure. The test component is visualised in Figure 2; the essential tests for the individual features are given with the corresponding standards. On the outside, eight placeholders for machine elements were arranged on a diameter of 80 mm. The interior space was used with smaller specimens or for fixing the component in the testing machine.
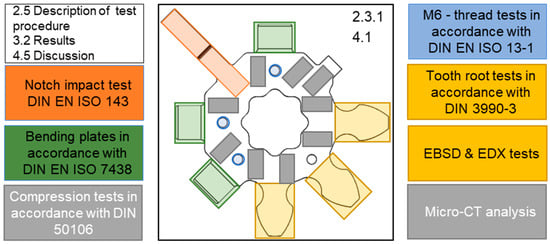
Figure 2.
Test component with the specific testing geometries.
The first machine element is an involute tooth in the three main directions. This tooth geometry is used in vehicle gearboxes [60] and thus has a high degree of practical relevance. In the design, attention is paid to the largest possible undercut at the tooth root so that a failure of the tooth root also occurs in the test and can be examined. This is a complex case of application for combined bending and shear stresses.
Following DIN EN ISO 7438 [61], bending specimens are arranged on the base diameter. Materials that have good formability will not fail. In addition to the force–displacement relationship, springback can also be investigated here. The last two placeholders in the 45° direction are designed in accordance with DIN EN ISO 148-1 [27] with a notched bar impact test specimen or a feather key according to DIN EN 6885 [62].
For another machine element, three M6 threads are planned whose maximal force can be determined in 0°, 45°, and 90° orientation.
The feather key, in particular, illustrates the possibility of integrating standard parts into additively manufactured components, which has already been tested with the additive manufacturing of plastic parts [63]. The technical drawing of the test geometry is shown in the Appendix A, in addition, the CAD file is attached as an supplementary file with the title “demonstrator_final.igs”.
2.3.2. Setup of the Test Device and Test Preparation
To carry out the various tests, a mounting and fixing tool for a universal testing machine was set up. Figure 3 depicts the tool mounted in the testing machine (Figure 3a), the tool mounting plate in the testing machine (Figure 3b), and the test specimen mounted in the fixation tool (Figure 3c).

Figure 3.
Complete test setup in a conventional universal testing machine (a), mounting plate (b), and the sample holder standing upwards (with test component and without mounting plate) (c).
The mandrels (Figure 3a.1) of the testing machine crosshead received the test punch (Figure 3a.3), which was locked by means of a bolt (Figure 3a.2) and had a 7 mm wide groove for guidance by means of the gear teeth. The bolt receptacles allowed the punch to be rotated 90 degrees (technical drawings are in the Appendix A). Figure 3a shows the mounting plate of the tool in the testing machine (Figure 3a.4), which was fixed directly in the groove table of the testing machine (Figure 3a.3). Details of the mounting plate with dimensions 160 × 125 mm are shown in Figure 3b. Four M16 countersunk holes (Figure 3b.1) were used to fix the specimen grip in the vertical direction and four M8 countersunk holes (Figure 3b.2) in the horizontal position. Feather keys (A 16 × 10 × 80 mm DIN 6885 [62], Figure 3b.3) and two pins (D4 × 20 mm, Figure 3b.4) ensured the repeatable positioning of the specimen grip.
This specimen holder was required for the testability of all test elements. In order to transmit the torque during the tooth test, as well as to ensure exact positioning in all eight directions in different directions, the fit of the octagonal internal geometry gearing (Figure 3c.1) of the demonstrator and the specimen holder was particularly important. An attached guide pin (Figure 3c.2) enabled a positionally accurate connection to the counter holder.
Components subject to high loads, such as the specimen holder and the counterholder, were manufactured from 1.2714 and provided with appropriate fits (see Appendix A) for easy specimen changing, during which only the counterholder was dismounted. This shortened the set-up time and improved repeatability. As already indicated, the specific geometry of the specimen and the large number of tests resulted in a preferred test sequence. First the teeth were tested, then the bending tabs, and finally the threads.
The bending test was carried out in a horizontal position, for which the clamping had to be tilted and the punch rotated by 90 degrees (see Figure 4a,b). The bending force was applied at a distance of five millimetres over the entire width of the lug with the help of the punch. Horizontal installation was also used for thread testing, as shown in Figure 4c. For this purpose, the punch insert was used and the fixture was moved so that the screw was centred below the punch. The test screws (M6, strength class 12.9) were first screwed in completely and then unscrewed by two turns. Markings were applied to the screw head for this purpose. The thread test was designed as a compression test.

Figure 4.
Test set-up for tooth root testing before screwing on the counterholder (a), bending test setup (b), and the thread test setup (c).
The test series was started with the tooth root bending tests in 0° orientation and the contact stiffnesses were balanced by preloads in the elastic load range. The load and termination parameters for the three tests are shown in Table 3. Figure 5 shows as an example the pre-load force–displacement curves for the samples k_04 for the tooth root (Figure 5a), the bending plate (Figure 5b), and the thread test (Figure 5c). It can be seen that from the third load onwards almost no changes in the force–displacement curve were to be expected and the test could be started. Equalisation of the stiffnesses had to be carried out after the fixture had been modified and each specimen changed. Internal specimens could only be taken after these tests have been carried out. The compression-test specimens could be used for CT scanning before their actual test.
Table 3.
Repetitive loads parameters.
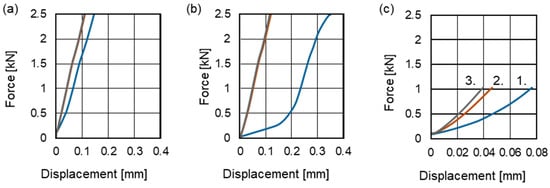
Figure 5.
Force displacement curve of (1) first, (2) second, and (3) third pre-loads of k_04 tooth tests (a); bending plates (b); thread tests (c); in 90° weld orientation.
2.4. Manufacturing of the Test Specimens
In this section, the manufacturing parameters of the different manufacturing routes are presented. The reference component was milled from rolled sheets with a CNC milling machine VF-2SS, Haas. For both additive manufacturing processes, the position of the part in the build space had a significant influence. The horizontal position, i.e., parallel to the building platform, and the vertical position in the direction of assembly were examined (see Figure 6). Other possible directions, such as 45° rotated or tilted, were not considered. Due to the direction-dependent design of the test specimen, the influence of anisotropy on the conventionally manufactured reference component could be visualised very easily. The same parameters and tools were used for milling. The dimensional tolerances were within the range of ±0.05 mm. As the testing parts always had the same geometry and used identical milling parameters, the mechanical behaviour due to the same geometrical tolerances and surface conditions was considered to be comparable among all examined processes.
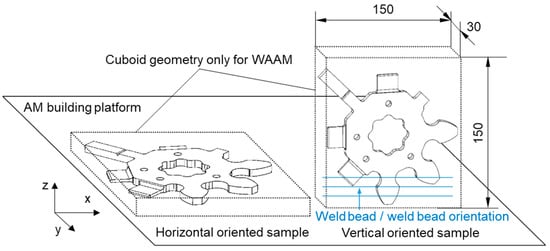
Figure 6.
Test component orientation for the additive manufacturing processes of L-PBF and WA-DED.
2.4.1. Manufacturing by L-PBF
The EOS M290 machine was used to produce the first L-PBF reference sample. This machine had an installation space of 250 × 250 × 325 mm and a laser power of 400 W and a maximum scanning speed of 7 m/s. The focus diameter of the laser was 100 µm [64]. The manufacturing parameters used in reference to [65] were the following (Table 4):
Table 4.
L-PBF manufacturing parameters. Data from Ref. [65].
Contrary to the manufacturer’s specifications, the L-PBF components were exposed without an angular offset between the individual build-up layers. This adjustment was made in order to make the influence of the exposure direction comparable with the influence of the weld orientation. In addition, an oversize of one millimetre was chosen for the L-PBF production in order to be able to rework the surface by machining. This enabled identical conditions for the tests to be carried out with the different manufacturing processes and eliminated stress peaks caused by notches or a rough surface.
2.4.2. Manufacturing by WA-DED
The WA-DED process was realized on a GEFERTEC M50 5-axis machine (see Figure 7). The welding power source was a Fronius TPSi500. For each two building orientations flat and upright, one solid block of dimensions 150 × 30 × 150 mm³ (length, width, height for flat orientation) was welded. This simplified geometry was chosen to better neglect geometry specific thermal influences regarding microstructure development. The substrate material was stainless steel 304 (1.4301) with a dimension of 200 × 200 × 10 mm³ (width × length × height) for the flat orientation (Figure 7c) and 60 × 200 × 10 mm³ for the upright orientation (Figure 7d), respectively. The WA-DED process parameters are shown in Table 5. A meander strategy (zig zag pattern) was used to have less welding start and end points and therefore a more stable WA-DED process with lower cooling rates of the weld beads. The start and end points rotated over the corners after finishing a layer to achieve a well distributed material deposition and to reduce material deficits or accumulation. Shielding gas ArC2 (98% argon, 2% carbon dioxide) with a gas flow rate of 15 L/min was used to protect the weld beads from oxidation. A machine-integrated pyrometer (emission coefficient set to ε = 1.0) measured the interlayer temperature to ensure that the interlayer temperature before the welding start was below 150 °C.
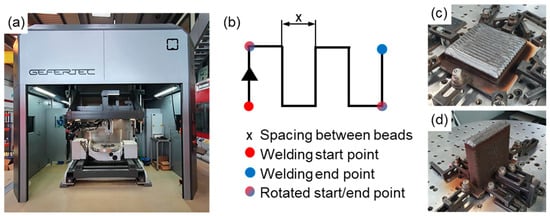
Figure 7.
WA-DED machine (a), process strategy (b), horizontally oriented (c), and vertically oriented WA-DED test component (d).
Table 5.
Manufacturing parameters WAAM process.
2.5. Testing Methods for the Experimental Determination of the Mechanical Properties
2.5.1. Notched Bar Impact Test
The notched bar impact test with a width of 5 mm was provided in 45° orientation according to CHARPY. This test is a standardised test according to DIN EN ISO 148, which has already been tested in numerous investigations.
- Width: 5 mm,
- Notch shape: V-notch,
- Thickness: 10 mm,
- Notch angle: 45°,
- Length: 55 mm,
- Notch depth: 1.25 mm,
- Notch radius: 0.25 mm.
The only difference between the specimen and the standard was the specimen’s width. The notched bar impact test was performed with a 150 Joule hammer, with the notched bar impact energy being the difference between the potential energy according to Formula (1):
2.5.2. Bending Plates
The dimensions of the bending plate with a width of 18 mm, length of 15 mm and thickness of 2 mm were taken from VDI 3405 and DIN EN ISO 7438. The plate was designed so that the thickness transition with a radius of 2 mm was aligned flush with the holding tool and therefore had no influence on the bending test. The bending stress was calculated from the bending moment (Mb) and bending resistance moment (Wb) [59]:
The tangential force (Ft) was measured during the test, and a critical and maximum force were determined. The punch to clamping device distance (x) was 5 mm. The width (b) was 18 mm and the height (h) was 2 mm.
2.5.3. Thread
The thread tests were carried out in accordance with DIN EN ISO 898-1 [66] and DIN EN ISO 3506-1 [67]. In our case, the threads were removed by 1.5 mm on each side so that precisely two load-bearing threads were tested. This procedure standardised the number of threads and reduced the influence of production-related chamfers. Due to the high scatter in the tests, only the maximum force was evaluated.
2.5.4. Involute Gear Tooth
In order to obtain a very simple static comparison value for the complex stress state of a tooth, a tangential force over the punch up to the tooth fracture was introduced in accordance with DIN 3990-3 [68]. While DIN 3990-1 [69] lists terms and general influencing factors, DIN 3990-3 discusses the calculation of the tooth root load capacity of cylindrical gears. This procedure allowed for a general statement about the local tooth root stress:
The form factor YFa considers the influence of the tooth form on the stress to be determined. It is independent of the mating gear and can be taken from corresponding tables for the different reference profiles. The stress correction factor YSa captures the stress-increasing effect of the tooth root notch/rounding. It is used to approximate the notch effect from table values in addition to the bending stress.
The overlap factor Yε is used to convert the force acting on the tooth tip into the force acting on the tooth root. This is calculated as follows:
For the calculation, εan = εα applies to the spur toothing. The profile overlap εα is a table value that can be determined from the tables of DIN 3990-3 or from common tables, depending on the reference profile. The last influencing variable to be determined is the inclination factor Yβ. It considers the line of contact that is not parallel to the tooth flank in helical gears. The calculation assumes straight gearing, which is why the helix factor is equal to one in this case.
When designing the involute tooth geometry, care was taken to ensure the largest possible undercut at the tooth root. This favoured the desired failure of the tooth root. The critical number of teeth in this respect was Z ≈ 14. To ensure the largest possible undercut and compliance with the maximum base area, a module of M = 12 and a number of teeth of Z = 8 were selected. Thus, the following dimensions result from the calculation forms described in [59]:
- Reference circle diameter: d 96 mm,
- Base circle diameter: db 90 mm,
- Tip diameter: da 120 mm,
- Root diameter: df 45°.
To quantify the critical local tooth root stress, the force–displacement curve and the stress–strain diagram were examined. First, the transition from elastic to plastic deformation was estimated following the tensile test. A linear approximation of the force increase was performed and the intersection at 0.2% of the total travel was extracted. The smallest coefficient of determination of all increases was R² = 0.9962. Figure 8 shows an example of the total force–displacement curve of the sample w_lu (Figure 8a) and the determination of the critical tooth root force (Figure 8b). The blue line represents an auxiliary to determine the critical force.
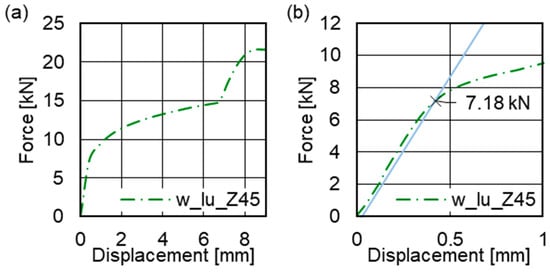
Figure 8.
Force–displacement curves of the tooth tests on specimen w_lu (a) and determination of the specific critical tooth root force (b).
The critical tooth root force was the basis for calculating the critical local tooth root stress occurring in the test specimen. The teeth were intentionally undercut so that failure at the tooth root was favoured. For this reason, the respective lower limit value with form factor 3.78 and stress correction factor 1.41 was assumed for these factors. Using (4), the overlap factor was determined from the factors ε1 = ε2 = 0.65 with Yε = 0.827. The overlap factor was determined assuming two identical gears. A resulting error in the calculation of the local tooth root stress had the same effect on all specimens, so that the comparability of the values among each other was given. For the present spur gearing, the helix factor Yβ was 1.
2.5.5. Feather Key
The feather key was considered to integrate the testing capability of a shaft connecting element. However, for this test and demonstrator design, the space was used for CT examinations and compression samples.
2.6. Design of Experiments
2.6.1. Statistical Evaluation—Descriptive and Inductive Statistics
The boxplot in Figure 9 was used as a tool for descriptive statistics and initial visualization of the collected data. This methodology plots the main parameters of location and variance, as shown in Figure 9b. The box itself resulted from the upper and lower quartiles [70]. For the lower (q0.25) and upper quartile (q0.75), the relative frequency sum of the sample parameters is 25% and 75% [71]. The difference between the quartiles is the interquartile range, or IQR. The empirical median (q0.5) lying in this area is shown as a horizontal line and the mean as a cross. The antennas end with the upper and lower whisker, respectively. They are the characteristic values for which x ≤ q0.75 + 1.5 × IQR or x ≤ q0.25 − 1.5 × IQR is true. Values which lay outside the whiskers are outliers. These should be excluded from the statistical analysis [70,72].

Figure 9.
Visualization of a boxplot and its essential parameters (a) and illustration of the Gaussian normal distribution with usual significance levels (b).
In order to confirm the results of the descriptive statistics, inductive investigations were added. This was used whenever samples were examined for significant influences and conclusions were to be drawn about a population. The null hypothesis assumed the absence of a difference. If there was statistically sufficient evidence for a deviation from the hypothesis, the null hypothesis was rejected in favour of the alternative hypothesis. Analysis of variance (ANOVA for short) was used for this purpose. Analysis of variance was calculated using the calculation methods described in [72] with the help of the data analysis tool in Excel. The application of ANOVA was subject to some prerequisites, such as the presence of normally distributed data. However, these prerequisites were not fulfilled due to the small amount of data [73]. In the literature, ANOVA is considered robust to the violation of the preconditions, which is why it was applied in the present case [74,75]. To check the results, the literature recommends an additional comparison of the results with the results of so-called non-parametric tests in case of violation of the assumptions. These are free of assumptions and therefore suitable for comparison. The non-parametric counterpart to ANOVA is the Kruskal–Wallis test, as described in [76].
Nevertheless, the use of the p-value method on its own is not recommended, as the results are highly dependent on the sample size. A 1-p value of less than 95% does not mean that there is no influence. It simply means that the magnitude of the difference between the study groups is not predictive of any of the usual levels of confidence in the results. In the present case, a deviation from the mean value of 5% was assumed as the accepted deviation from the target value. The sample sizes required in each case were assigned to the corresponding results in each case. If the Kruskal–Wallis test and the ANOVA already provide significant results, the deviation of the mean values of the individual test results is already sufficiently large to detect significant deviations. Otherwise, this does not mean that there is no difference per se, but only that it cannot be detected at one of the usual significance levels under the given conditions, as described in [72,77].
2.6.2. Definition of the Test Parameters Considering the Costs
In order to consider the position of the base plate, which influences the installation space height, the number of welding and exposure processes and finally the microstructure, the WA-DED specimens were manufactured in two different orientations. The conventional production of four comparative specimens each using conventional methods, the production of three WA-DED specimens per orientation and three horizontally produced L-PBF specimens, minus the preliminary tests, result4ed in the following test spaces.
The examination of the test rooms illustrated the versatility of the universal test geometry. The performance of over 220 tests was enabled by 16 demonstrator geometries. Consequently, the geometry enabled a cost-effective benchmark and validation of component-related tests through standardised examinations, such as the compression samples. In order to label the samples unambiguously, the nomenclature listed in Table 6 was applied, which first of all refers to the type of production.
Table 6.
Used labels for the specific test geometries.
The respective letter was followed by the degree of weld orientation in which the respective test geometry was arranged. For the gearing test of a vertically manufactured WA-DED specimen with a weld orientation of 90°, for example, the specimen designation was “w_s1_Z90”, and for a bending sheath test in 45° orientation of an L-PBF part it was: “s_l2_BL45”. Figure 10 depicts the individual orientations of the weld beads and the test load for vertically and horizontally oriented specimens, respectively.
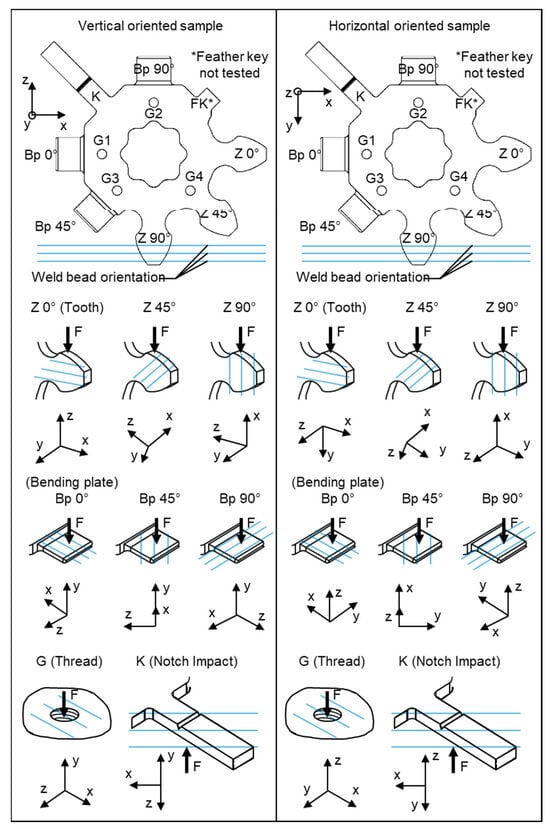
Figure 10.
Overview of the horizontal and vertical orientation of the test component in correspondence to the different testing geometries and their load direction.
2.7. Determination of the Comparison Factors
The aim of the investigations was to adapt the calculation of the respective stress to different manufacturing routes. For this purpose, the critical stresses for the design of the machine elements were determined (see Section 2.5.4, example for critical tooth root stress). In the following, the specific manufacturing factor was determined using this example.
In the first step, the endured tooth root stress for each orientation was calculated from the experimentally determined force curve. The mean value of the batch of a conventional test geometry (k_01 to k_04) served as a reference. The respective value or mean value was compared with a reference value by dividing it by the reference value. A value above one describes a comparatively higher resistance to the acting load. Values below one describe a comparatively poorer load behaviour. The mean value over the horizontal specimens was not calculated. Thus, the influence of the sampling height could be referenced. This overlaps with the influence of the weld orientation in the upright WA-DED specimens. Consequently, a clear separation of the two influences was no longer possible if only a single test was considered. The aim of the present work was a comparison of the different tests for a first attempt at estimating the influence of the individual influencing parameters. For this purpose, each of the individual design formulas for conventional components was extended by the addition of a comparison factor. This represents the specific influencing factor, such as the weld orientation or the manufacturing process. This general manufacturing factor GMf was inserted into the respective calculation formula in the same way as the formula for the local tooth root stress or was multiplied by the usual results. Therefore, the manufacturing-specific local tooth root stress σF0, Mf is:
As an example, for the 90°—weld orientation the formula would be:
2.8. Basic Examinations for the Validation of the Manufacturing Parameters
2.8.1. Compression Tests
The compression test was used to validate the yield limits from the tests of the machine elements. Due to the limited space and robustness, compression samples were taken with a diameter of 4 mm and a height of 8 mm. The compression tests were performed on the TA Instruments DIL 805A/D/T forming-dilatometer with a strain rate of 0.01 s−1 at room temperature and a force–displacement curve of the crosshead was recorded. In order to determine a robust characteristic value instead of Rp0.2 (tensile test) from the compression test, the yield strain in the range of φ = 0.04 to 0.12 was approximated with a straight line and the axis intercept point was determined. The regression in the plastic range proved to be very reproducible for the material tested (coefficient of determination 0.999). Figure 11 shows the procedure with linear regression and the determination of the yield point comparison value of 442 N/mm² from the compression test. In addition, a simplified tangent modulus was evaluated to describe the hardening behaviour in the example with 1574 N/mm².
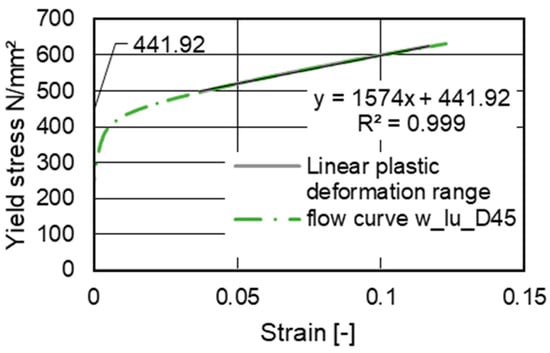
Figure 11.
Procedure for determining the modelled proof stress comparison value.
2.8.2. Microstructure and Defect Analysis
Different sample geometries were required for the microstructure and defect analysis because of limitations regarding targeted analysis quality, preparation procedures, and analysis method. The procedure for the analysis is shown in the following illustration (Figure 12). The analyses included light microscope analysis, micro-computed tomography (µCT), compression tests, and scanning electron microscope (SEM) with energy dispersive X-ray spectroscopy (EDX).

Figure 12.
Procedure of analysis for each manufacturing process.
The initial state for the optical analysis was considered for all manufacturing processes for the tooth load test samples, where no deformation occurs. This means the as-delivered condition for the conventional samples and the as-built condition for the L-PBF and WA-DED parts. For this assumption, the observed area was at a distance of approx. 10 mm of the tooth root. The specimens were extracted from the samples of each manufacturing process before compression only for compression tests. After extraction, the compression specimens were scanned with the µCT and tested. SEM analysis was performed on the teeth after mechanical testing.
For the microstructure analysis, the samples were cut by electrical discharge machining (EDM) and grinded using SiC grinding paper with grain number 220–1200 and water as lubricant. Polishing was performed with a diamond suspension with a particle size 6µm and a water-based lubricant. The samples were etched in a V2A etching agent for 10 s at 50 °C temperature. Light microscopic analysis was performed using a light microscope VHX6000 by Keyence (Neu-Isenburg, Germany) to determine the microstructural composition regarding phases and grain sizes. Analysis of the microstructure texture/grain orientation and element distribution was performed using a scanning electron microscope (SEM) AMBER X with Focused Ion Beam (FIB) by TESCAN (Brno, Czech Republic). The observed square area was 1 × 1 mm and was located in the non-deformed part of the tooth after mechanical testing. The prepared samples were embedded in electric conductive material or electric conductive tape was applied on top of the considered surface.
Defect analysis was realized by computer tomography (CT) with a CoreTOM µCT by TESCAN. A filter made of tin (Sn) with a thickness of 0.75 mm was used to provide high X-ray energy and reduce beam hardening. Due to the necessary scan parameters, the minimum detectable pore size was ≈50 µm, which was a good and practical approach for fast scanning. Similar stated values are given in [78]. Sample size (diameter) was reduced to 4 mm to enable a sufficient X-ray transmission and therefore good phase contrast. The micro-CT scanned samples were used later for compression tests. The area of extraction of the samples was close to the gear tooth root. Pore analysis was performed using the software VGSTUDIO MAX (V2022.1) by Volume Graphics. An overview of the scan parameters is shown in the following:
- Voltage: 140 kV,
- Exposure time: 5000 ms,
- Power: 15 W,
- Scan time: 105 min,
- Voxel size: 7 µm,
- CT filter Sn: 0.75 mm thick.
3. Results
3.1. Analysis of the Testing Specimens
3.1.1. µCT Analysis
The Micro-CT analysis was performed for three samples of each manufacturing process. An example for the analysis for a WA-DED and L-PBF sample is illustrated in Figure 13, which shows the slice view of two samples (Figure 13a,b) and the spatial distribution and pore size (Figure 13c,d). The pore diameter distribution for the range of 50–100 µm and >100 µm is shown in the histogram (Figure 13e). As can be seen, that the L-PBF processed samples (s) led to more pores than for WA-DED in both pore size ranges, where the maximum pore diameter was about 270 µm. In [79], it was reported that a pore size of <450 µm does not significantly affect the mechanical properties. Therefore, an influence of the pore size on the mechanical behaviour was not expected. The conventionally (k) processed rolled material showed smaller pore numbers. WA-DED processed samples showed the least number of pores. The porosity for L-PBF samples, which was the highest value for the complete study, was about 0.01%, which is an acceptable magnitude. As reported in [80], a porosity of ~1.5% still leads to nearly identical mechanical properties compared to a porosity <0.5%. Thus, it was expected that the observed low porosity in the examined samples and non-critical pore sizes did not have a significant influence on the mechanical properties.
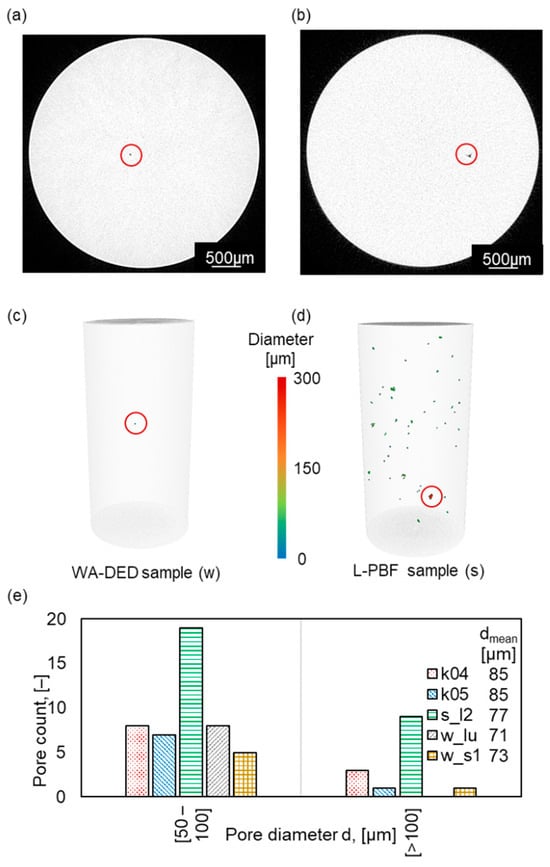
Figure 13.
CT analysis of compression samples. (a) Cross section of WA-DED sample, with defect (indicated by red circle), (b) cross section of L-PBF sample with defect (indicated by red circle), (c) spatial distribution of defect in WA-DED sample, (d) spatial distribution of defects in L-PBF sample, (e) histogram for pore diameters d.
3.1.2. EBSD and EDX Analysis
The EBSD and EDX results for the exemplary samples k_04_Z45, k_05_Z45, s_l2_Z45, and w_s1_Z45 are shown in Figure 14. The examined area was in a non-deformed location. No specific building orientations were present for k_04_Z45 and k_05_Z45. The orientation definition for EBSD was according to the samples s_l2 and w_s1. The building orientations for s_l2_Z45 and w_sl_Z45 were according to the described definition for the load testing above. Here, the building direction z was defined to match with the crystal orientation {001}. The first figures in Figure 14a–d display the phase map and show only the Fe-FCC orientation for all samples except k_05, where Fe-BCC orientation also appears with an amount of 51%. Fe-FCC indicates austenite (γ), while Fe-BCC can be ferrite (α or δ) or martensite (α’). As the process route of the conventionally manufactured stock material was unknown, forming and heat treatment microstructure evolution and induced martensite formation could not be verified. Due to the non-homogeneous distribution of the phase, which would be characteristic for rolled material, it was expected to be δ-ferrite. This could also be justified by the local deviations of the nickel (Ni) content measured with EDX (see Figure 14e–h). Nickel enables and stabilizes the formation of austenite. Here, a large deviation is visible in Figure 14f. The areas with higher Ni content (brighter) tend to form austenite, while lower Ni content (darker) tends to ferrite formation. This also matches with the phase map (Figure 14a–d). The complete formation of austenite for the other samples also with smaller local deviations in the Ni content was traced back to a lack of ferrite stabilizing elements such as chromium (Cr) (see Figure 14i–l) or the higher content of other austenite stabilizing chemical elements, such as manganese (Mn) (see Figure 14m–p). For both Cr and Mn, no significant concentration differences are visible. Thus, the variation in the Ni content is dominant for the austenite formation at this point. It has to be noted that the phase map illustrates only relative concentration intensities within one sample and cannot be used for comparison of absolute element concentration with other samples. Still, a small amount of ferrite can be formed for all samples, where the fine ferrite grains are placed at the grain boundaries with a grain size of a few microns, which may not be clearly visible in the phase map. Yet, these fine ferrite grains will then be visible in the pole figures. The austenite grain size for k_04_ and k_05 is quite similar with approx. 70 µm. For s_l2, the grain size is smaller at approx. 20–30 µm with big islands of approx. nearly 100 µm. Those islands are characteristic of L-PBF, as they indicate the laser scanning pattern (here chessboard) and the corresponding hatch distance of 100 µm. Sample w_s1 shows long grains oriented towards the building direction z and a grain size of approx. >1000 µm and also some small grains with a size of 400 µm. The thermal gradient is responsible for the grain growth in z direction. Figure 14q–t shows the EBSD results. The conventionally manufactured (formed and recrystallized) samples show a more dominant crystal orientation for ferrite. Sample k_04 has a weak texture with dominant crystals oriented at nearly 45° direction perpendicular to {001} for three orientations (Figure 14u). Those characteristic spots are probably small ferrite grains. Sample k_05 shows a different pole figure with a uniform distribution of the crystal orientation at 45° perpendicular to {001] for all orientations, forming a circular pattern (Figure 14v). A homogenous distribution for all crystal orientations of austenite can be seen for both k_04 and k_05 in Figure 14y,z. Here, k_04 shows a more homogenous but weaker texture than k_05, where {100} orientations are less dominant. This could imply that k_04 and k_05 were not subject to a rolling process. The sample s_l2 shows a similar ferrite pole figure to k_04 regarding the orientations, but stronger peaks (Figure 14w). A similar appearance can be seen for the austenite pole figures, where the texture is finer distributed for k_05 (Figure 14s), while k_04 has more discrete areas. The ferrite crystal orientation for sample w_s1 (Figure 14x) shows a similar distribution and peaks to the pole figure pattern as k_04, indicating crystal orientation to {100}, {010}, and {001}. For austenite, the pole figure pattern is remarkably different to the other samples (Figure 14a,b). Here, small discrete areas with a high peak are present. The austenite crystals are oriented in directions {100}, {010}, and {001}. Due to the appearance of even small single ferrite grains, the EBSD orientation map also shows intensity peaks. It has to be noted that the microstructure in 4a and the distribution of the nickel content in Figure 14e shows a different appearance. This may be due to the (unknown) processing of the stock material leading to a homogenous microstructure but the initial, more inhomogeneous nickel distribution remaining the same. Some characteristic points that identify the observed area (indicated by white arrows) in Figure 14e,f vanish in other element maps. These may be precipitations of Cr and Mn and therefore will not appear in the element maps as dark dots.
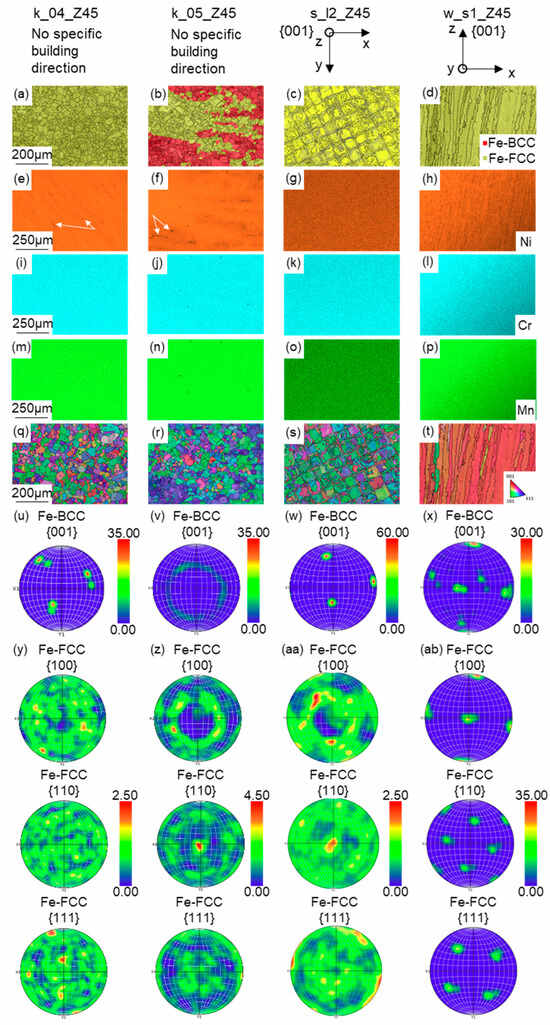
Figure 14.
Results of the EDX and EBSD analysis for each manufacturing process. (a–d) Fe-BCC and Fe-FCC map, (e–h) nickel content, (i–l) chromium content, (m–p) manganese content, (q–t) grain orientation, (u–x) pole figure for Fe-BCC with orientation {100}, (y–ab) pole figure for Fe-FCC with orientation {100}, {110} and {111]. White arrows indicate exemplatory characteristic identification points, that are only visible in (e,f).
In summary, the microstructural material properties of all demonstrators were typical for each manufacturing process. With the help of the CT scans, it could be shown that the conventionally rolled and WA-DED materials contain small pores, while larger pores were found in the L-PBF process, but their sizes are typical for the process in each case. For all cases, no negative effect of the small pores on the mechanical properties was expected. The EBSD and EDX results also agree with known characteristic grain structures and element distributions, so that there is a representative manufacturing condition for the demonstrator for all feedstock materials. Smaller local deviations in the chemical composition or the manufacturing process route were present for the conventionally manufactured components, which allow for a comparison of these different conditions.
3.2. Determination of the Manufacturing Factors
3.2.1. Tooth Root Strength Test
The samples shown in Figure 15 for the tooth root load capacity illustrate the five fundamentally different manufacturing groups. The selection of the samples shown was based on several factors. First, the variances within the specimens were compared. Secondly, the individual force–displacement curves of the individual specimen geometries were compared. For this purpose, the curves of the conventional specimens k_04 and k_05 form the reference value corridor. This procedure was repeated identically for all yield curves as described in Section 2.4.2.
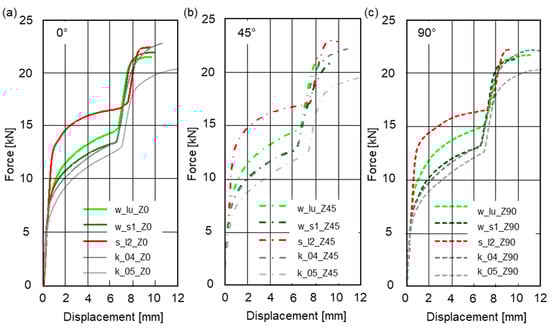
Figure 15.
Force–displacement curves of the tooth root tests for (a) 0°, 45° (b), 90° (c).
The curves show a very similar behaviour in most of the elastic range. However, the elastic load capacity is higher for the WA-DED and L-PBF specimens than for the conventional specimens. The maximum forces do not differ as much. For more detailed investigations, the respective local tooth root bending strength is determined to account for the geometric influences of the teeth. This results in the critical and maximum tooth root stresses shown in Table 7.
Table 7.
Critical and maximum tooth root stresses of selected geometries.
The investigation of the tooth root stress clarifies that the conventional batch two (k_05) shows a worse critical and maximum load behaviour than the reference sample of batch one (k_04) in all comparative orientations. The reference specimen of conventional batch two shows a worse critical loading behaviour in 45° orientation by almost 38%. This fact indicates a different history of the two conventionally fabricated reference batches, which is also consistent with the microstructure analyses. In contrast, the best-manufactured horizontal WA-DED specimen exhibits almost twice the critical tooth root load capacity, while the maximum loads are worse. This result indicates higher hardness and lower ductility of the additively manufactured material. The vertical comparison specimen exhibits lower critical load capacity than the horizontal WA-DED specimen in all orientation directions. For the maximum stress, this is observed for the 45° and 90° orientations. The reason for these results is assumed to be the removal height of the corresponding specimen or the respective demonstrator geometry. The tooth specimens in the 45° and 90° orientation were taken from a lower position in the welded wall and possibly exhibit a higher ductility than the 0° orientation due to the longer process temperature influence. The maximum load capacity is also highest in the 0° orientation. Consequently, a superposition of the influence of the weld orientation and the build-up height is assumed. Load applied orthogonally to the suture orientation results in a higher load-bearing capacity of the horizontal specimen. In contrast, the WA-DED specimen taken vertically has a higher load-bearing capacity when loaded in the weld orientation. Compared to the conventional reference specimen “k_04”, the vertically fabricated specimen “w_s1” has a higher load-bearing capacity in each comparison orientation. The L-PBF comparison specimen “s_l2” exhibits the highest load-bearing capacities in each orientation. This applies to both the critical and the maximum local tooth root stress. Consequently, the reason for this is considered to be that the strength of the L-PBF specimens is higher, resulting in a higher load capacity of each specimen.
The L-PBF specimens have almost identical elastic load capacities in 0° and 90° exposure orientations. These are higher than in 45° orientation. The maximum load-bearing capacity is also highest in the 45° orientation. Consequently, it is assumed that the positive effects of the 0° and 90° orientations overlap and that the applied load is optimally taken diagonally to the exposure direction. The corresponding boxplots are shown in Figure 16, which show the process-related shorter heat input. The resulting shorter cooling times provide fewer opportunities for recrystallization.
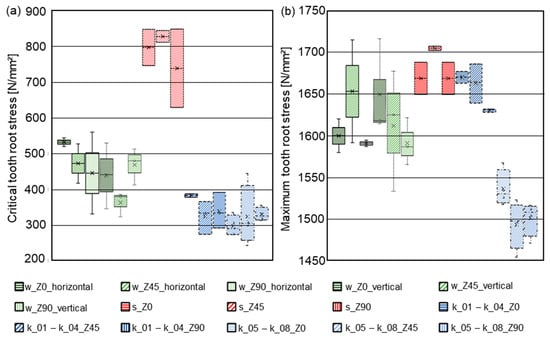
Figure 16.
Boxplot of the critical tooth root stress (a) and the maximum tooth root stress (b).
The descriptive statistics show that the different manufacturing processes withstand different critical tooth root loads. The weld orientation or exposure orientation, on the other hand, seems to have less influence. Consequently, three clusters can be identified for the critical tooth root stress according to the respective manufacturing processes.
The maximum load capacities are closer to each other. The WA-DED specimens, the L-PBF specimens, and the specimens from batch one show comparable load capacities. In addition, the samples from batch two are clearly found to have poorer maximum load properties than the other samples in all comparative orientations.
Table 8 illustrates the significance level for the studied influences in the common notation introduced in Section 2.7. The data follow the nomenclature (ANOVA result, Kruskal–Wallis test result). Should the ANOVA not lead to a significant result, the sample size that would theoretically be necessary to obtain a significant result under the given conditions, which is documented according to the respective significance statements. This calculation is not necessary if significant deviations are already present. Accordingly, a “-” is documented after the significance specification. Table 8 shows the results for the critical and maximum tooth root stresses.
Table 8.
Significance levels of the objects of investigation for the critical and maximum tooth root stress.
The descriptive statistics already suggest a significant influence of the manufacturing process on the critical tooth root load-bearing capacity. According to the ANOVA, this influence is confirmed as highly significant in all weld orientations. Comparison with the nonparametric Kruskal–Wallis test also confirms the significance of the influence of the manufacturing process in the 0° and 45° weld orientations. In the 90° orientation, the Kruskal–Wallis test provides a statistical confidence of only 94.80% and therefore does not reach any of the usual significance levels. For the influence of the build orientation, the 45° weld orientation results in a significant influence in both test methods. For the influence of the weld orientation, no significance was found for either of the two additive methods. This result, in conjunction with the other evaluations, indicates a superposition of the individual influences. More extensive follow-up investigations would be necessary for a specific separation of the influencing factors. The sample sizes required ceteris paribus for this purpose and are documented behind the results.
In contrast, when examining the maximum tooth root stresses in none of the weld orientations, significant differences are found for the different build orientations of the WA-DED specimens. Nevertheless, both the ANOVA and the Kruskal–Wallis test show significant differences between the manufacturing processes at an alpha level of at least 5%. Consequently, a significant influence of the manufacturing process both on the maximum local tooth root stress can be assumed with a statistical confidence of 95%. In 90° weld orientation, no significant result is obtained, although the theoretically required sample size could be reached. The reason for this is assumed to be the removal height. The 90° tooth geometry is the sample geometry taken lowest from the blank, which is why its sampling height corresponds approximately to that of the horizontal samples.
The result is similar for the influence of the weld orientation on the maximum tooth root loading capacity. The theoretically required number of specimens of four was reached. Nevertheless, no significant difference was found.
As described in Section 2.7, a factorial comparison was performed in the final step. The specific results for the tooth root bending stress are shown in Table 9.
Table 9.
Factorial comparison of the critical tooth root stresses.
To take the removal height into account, no mean values are calculated for the WA-DED specimens taken horizontally from the blank. The results represent the respective values for the manufacturing factor G_mf for the local tooth root stress. Almost all additively manufactured components exhibit a higher critical tooth root stress than the conventional components. The factorial comparison shows that the WA-DED specimens in the 0° and 90° orientation have up to 1.65 times, and the L-PBF specimens have up to 2.55 times, the critical load capacity of the conventional comparison specimens. In contrast, the maximum load capacity exceeds that of the conventional components only in the case of the L-PBF specimens.
Table 9 shows that significantly different characteristic values could be determined for the manufacturing process. In addition, significant differences were determined for the build-up direction in the WA-DED process for the critical tooth root stress in the 45° orientation. The other characteristic values represent approximations whose significant difference from the reference specimens could not yet be proven. All mentioned data can be found in the supplementary file “Results_tooth_root_test.xlsx”.
3.2.2. Bending Test
The analysis of the results of the bending tests also starts with the examination of the force–displacement curves. These are shown for the five representative specimen geometries in Figure 17.
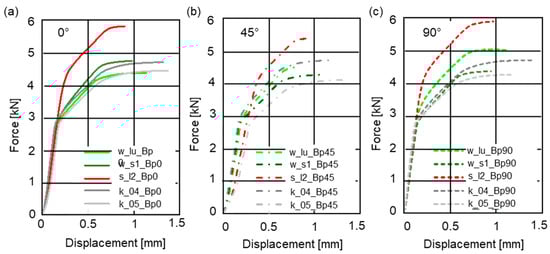
Figure 17.
Force–displacement curves of the bending plate tests for the selected specimens, (a) for sample orientation 0°, (b) for sample orientation 45° and (c) for sample orientation 90°.
The curves show comparable behaviour in the elastic range. Examination of the bending plates shows that the elastic load capacity of the WA-DED specimens is comparable to that of the conventional specimens. The L-PBF specimens exhibit higher elastic load capacities than the conventional specimens in all load directions. The same applies to the maximum forces.
The critical force of the bending plates was methodically determined identically to the critical tooth root forces. To calculate the bending stresses, the widths and thicknesses of the bending plates were measured to the hundredth of a millimetre. In order to take into account the geometric influences and the lever arm, the respective bending stress was determined according to Formula (2). The results are shown in Table 10.
Table 10.
Critical and maximum bending strength of selected geometries.
When examining the critical bending stress, it is evident that the conventional 0° comparison orientation of batch two exhibits worse loading behaviour than the reference sample of batch one. However, the discrepancy between batch one and two is greater at the maximum bending stress. The reference specimen of batch one exhibits higher maximum bending stress than that of batch two in all orientations. In the WA-DED specimens, the horizontal samples show identical critical bending stresses in the 0° and 90° orientations. The critical bending stress in the 0° weld orientation is higher than that of the upright comparison specimen. However, the one in 90° orientation is lower. Consequently, it can be assumed that the differences are due to the sampling heights. The 90° orientation of the vertically fabricated test geometries is taken at a higher height than the horizontally fabricated comparison specimen. Accordingly, the specimen is assumed to have higher hardness and ductility, resulting in higher load capacity. This is supported by the fact that the 45° weld orientation, which is the lowest bending specimen from the parent material of the standing specimen, has the lowest load capacity. Furthermore, the maximum bending stresses for the horizontally fabricated specimen are lower than for the vertically fabricated reference specimen in all weld orientations. Again, the L-PBF specimens exhibit the best critical and maximum load capacities. The reason for this is considered to be process-related shorter heat input. Consequently, there are shorter cooling times and thus fewer opportunities for recrystallization. Consequently, the strength of the L-PBF specimens is higher, which leads to a higher load-bearing capacity in each individual specimen. When examining the critical as well as the maximum bending stress, the load capacity is lowest in the 45° orientation. For the initial investigation of the data for the bending stresses, the boxplot was used (Figure 18).
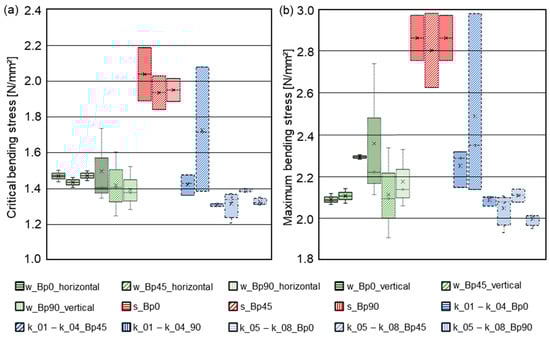
Figure 18.
Boxplot of the critical (a) and the maximum bending strength (b).
The investigations regarding the boxplot of the critical bending stresses give a comparable result and show a distribution of the data which is close to that of the critical local tooth root stresses. The L-PBF specimens exhibit the highest critical load capacity. The WA-DED specimens also show a higher average critical load capacity than the conventional specimens. In addition, the scatter of the results of the horizontally fabricated WA-DED specimens is lower than that of the vertically fabricated WA-DED specimens and the L-PBF specimens. In addition, the flexural pockets in the 0° and 90° weld orientation, for the horizontal specimens, show similar average flexural strengths. For the upright WA-DED specimens, the critical flexural strengths decrease at the 0°, 45° and 90° weld orientations.
The conventional specimens of the first batch show the largest variance in the 45° comparison orientation. In all other cases, the conventionally manufactured specimens can only be applied to lower average bending loads than the additively manufactured samples. In contrast to the results of the maximum load of the tooth root tests, the maximum bending stresses of the manufacturing processes do not converge. Only one specimen from conventional batch one shows a similar maximum bending stress as the L-PBF specimens. However, due to the limited data available, this cannot be determined as a statistical outlier and must therefore be included in the investigation. The associated results of inductive statistics are reported in Table 11.
Table 11.
Significance levels of the objects of investigation for the critical bending stress.
The results show a similar result for the critical bending stress as for the critical tooth root bending stresses. The ANOVA provides a significant difference between the manufacturing processes for all weld orientations. The Kruskal–Wallis test confirms this influence for the 45° and 90° orientations at an alpha level of five percent. For the 0° orientation, the statistical confidence is only 93.40%. Due to the small amount of data, a reliability of 93.40% indicates that there is also an influence for the 0° orientation.
The influence of the build orientation is significant in the Kruskal–Wallis test for the 45° orientation. The ANOVA does not find a significant influence for any of the weld orientations.
Regarding the influence of the weld orientation on WA-DED specimens, only the Kruskal–Wallis test yields a significant result at an alpha level of five percent. For the L-PBF specimens, a statistical certainty of only 89.80% is achieved when examining the influence of the exposure direction.
The inductive investigations of the maximum bending stresses show identical results to those of the critical bending stresses. The only difference is the consideration of the influence of the weld orientation on the maximum bending stress in the WA-DED method. At this point of the study, due to the insufficient number of specimens, no significant difference can be found at any of the usual significance levels. The factorial comparison is shown in Table 12.
Table 12.
Factorial comparison of the critical and maximum bending stresses.
The results show that the design of additively manufactured components should provide bending loads in the 0° and 90° orientation. In each case, the critical load capacities correspond to those of the conventional comparison components. The critical load capacities of the L-PBF components are up to 1.49 times higher than those of the conventional reference components. The maximum load capacities of the L-PBF specimen parts are also superior to those of the conventional reference parts in all orientation directions.
Furthermore, Table 12 shows that significantly different characteristic values could be determined for the manufacturing process. In addition, significant differences were determined for the build-up direction in the WA-DED process in the 45° orientation and for the weld orientation influence of the WA-DED process on the critical bending stress using the Kruskal–Wallis test. However, in contrast to the ANOVA, this represents a less sharp evaluation procedure. Accordingly, necessary sample sizes for significance determination were also determined for these results with the ANOVA under otherwise identical conditions. Consequently, these characteristic values represent approximations whose significant difference could only be partially proven. In order to validate the remaining comparative values, the sample sizes also given in Table 12 would have to be achieved under otherwise identical conditions.
3.2.3. Thread Tests
The analysis of the results of the thread tests also starts with the examination of the force–displacement curves. These are shown for the five representative specimen geometries in Figure 19.
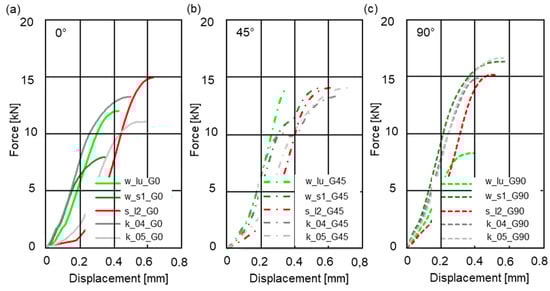
Figure 19.
Force–displacement curves of the thread tests for chosen test geometries, (a) for sample orientation 0°, (b) for sample orientation 45° and (c) for sample orientation 90°.
The force–displacement curves show comparable curves in the elastic range. In particular, a much higher variance can be identified in the case of the 0° weld orientation. In this particular case, the elastic load capacity of the WA-DED specimens is similar to that of the conventional specimens. In the 0° orientation, the L-PBF specimens show higher load capacities than the conventional specimens. However, for the other orientation directions, the L-PBF specimen shows lower load capacities than the specimen k_04. Due to the large scatter of results in the elastic load range, only the maximum forces were compared for the thread tests. These are shown in Table 13.
Table 13.
Maximum force thread test of selected geometries.
The conventional batch one maximum compressive force is only larger in the 0° comparison orientation than that of the conventional batch two. Examination of the WA-DED specimens illustrates that the maximum thread force is highest in the 45° orientation. In the 90° orientation, the load capacity of the horizontally fabricated WA-DED comparison specimen is almost identical to the load capacity of the vertically fabricated comparison specimen in the 0° orientation. Unlike all previous tests, the L-PBF specimen is not the one with the highest maximum load capacity in this case. In contrast to the WA-DED samples, the maximum thread breaking load of the L-PBF samples is lowest in the 45° orientation. The boxplot of the maximum thread breaking forces is shown in Figure 20.
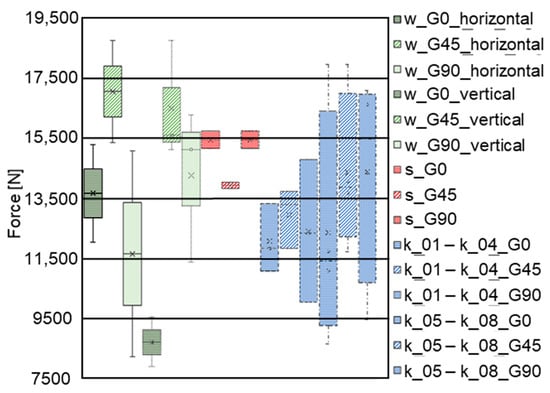
Figure 20.
Boxplot to visualize the maximum thread pressure forces.
The boxplot of the maximum thread breaking force shows that, as in the tests on the bending plates, the conventional specimens exhibit the greatest scatter. In addition, they have lower average fracture forces than the additive comparison specimens in most of the cases. Compared to the previous results, the additive specimens show almost opposite behaviour. The the 45° weld orientations have the highest fracture forces, while the 45° exposure orientation showed the lowest load capacities compared to the L-PBF specimens. The low scatter within the L-PBF specimens also indicates the sufficiently high repeatability of the test setup. The results of the significance tests are shown in Table 14.
Table 14.
Significance levels of the objects of investigation for the thread breaking force.
Regarding the influence of the weld orientation on the thread breaking force, significant results for the WA-DED samples are obtained using ANOVA and the Kruskal–Wallis test. However, the influence of the manufacturing process at the 45° weld orientation gives a result of 94.67% and 92.20%, which is almost significant at the usual alpha level of five percent. One possible reason for the non-significance is the high scatter in the conventional comparison samples. The difference in scatter between the tests results in a greatly different theoretical sample size is required to demonstrate significance. The smallest difference between the actual and theoretical sample size for significance detection is in the study of the influence of exposure direction of the L-PBF samples. The delta is only four samples. When investigating the influence of the build-up direction of the WA-DED specimens, it is greatest for the 90° weld orientation. For this point of investigation, ceteris paribus, there is a delta of 168 samples.
The summary of the manufacturing factor GMf for the maximum thread breaking load makes it clear that if the threads are arranged in the 45° weld orientation in the WA-DED process, it is possible to achieve load capacities up to 1.45 times higher than in conventional components. Placing the threads in the 45° orientation is also recommended in L-PBF components. Table 15 shows that significantly different characteristic values could only be determined for the weld orientation influence of the WA-DED process. Consequently, these remaining characteristic values represent approximations whose significant difference from the comparison samples could not yet be proven.
Table 15.
Factorial comparison of the maximum thread force.
3.2.4. Impact Test
Due to the design conditions, just one notched bar impact test could be provided in the demonstrator. The data basis for the evaluation of the notched bar impact test is consequently smaller. Table 16 shows an excerpt from the results of the Charpy impact test.
Table 16.
Charpy impact strength of selected geometries.
Remarkably, the conventional specimens absorb the highest impact energy and there are strong differences between batches one and two. The horizontal WA-DED specimen carries the lowest load capacity. The L-PBF specimen shows the next highest load-carrying capacity. The standard specimens confirm the previous assumptions that the conventional specimens have the highest ductility. Due to the fact that the weld orientations are identical, the higher notch impact energy of the upright WA-DED specimens is due to the higher removal height. However, this fact contradicts the assumption that ductility decreases with increasing removal height, while hardness increases. The notch impact energy of the L-PBF specimens, which so far have shown the highest strengths, are between those of the WA-DED specimens. The descriptive statistics were realized via a boxplot, as shown in Figure 21.
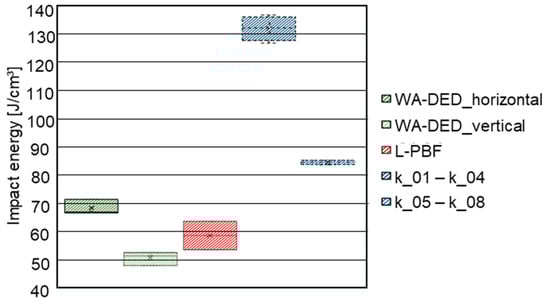
Figure 21.
Boxplot of the impact test results.
The results of the inductive statistics confirmed the descriptive statistics both when ANOVA was applied and through the impact test. They show in Table 17.
Table 17.
Significance levels of the objects of investigation for the notch impact test.
The ANOVA provides highly significant results for the influences of the manufacturing process and the build-up direction. The Kruskal–Wallis test confirms the significance at a reliability of 99.95% for the manufacturing process and at 95.00% percent for the building orientation. The notched bar impact test represents a standardized procedure. Consequently, the results are assumed to be highly reliable. This assumption correlates with the low variance in the results.
These results represent the respective values for the manufacturing factor Gmf for the notched bar impact test. The additively manufactured test specimens can be identified as having half the notched impact strength of the conventionally manufactured test specimens from batch one. The conventionally manufactured batch two also exhibits only 82% of the notched impact strength compared to batch one. This result correlates with the fracture behaviour of the tooth root, the bending tests, and the thread tests. In the tooth tests, only additively manufactured teeth showed brittle fractures. Table 18 shows that highly significant and significantly different characteristic values could be determined for the manufacturing process as well as for the building orientation.
Table 18.
Factorial comparison of the notched bar impact test.
3.3. Validation of the Manufacturing Factors
3.3.1. Mechanical Validation
The data basis for the evaluation is one of the largest for the shape behaviour analyses. Here, 125 specimens were taken, whereby in all cases except for the 0° orientation of demonstrator k_01, several specimens were taken per demonstrator/universal geometry and comparison orientation. Accordingly, mean values for the individual test geometries in the corresponding comparison orientations could be formed in advance. As a result, the statistical significance is also higher than in previous studies. The differences between the modelled yield strengths, which are already evident from the mean values in the sample specimens, are again examined using descriptive and inductive statistics. For the descriptive processing, a boxplot is used as visualized in Figure 22.
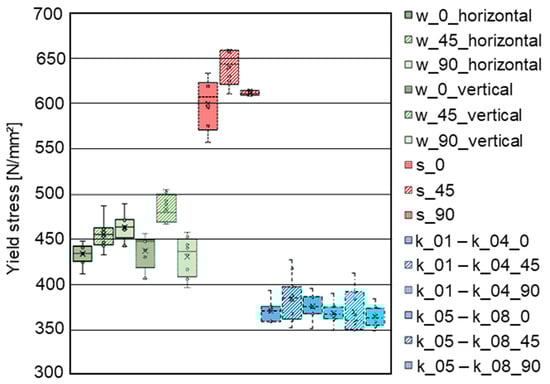
Figure 22.
Boxplot over all yield stresses calculated based on compression tests.
The descriptive statistics give a similar result for the modelled yield stresses from the forming behaviour tests compared to the modelled Rp0.2 values from the critical bending stress and the critical local tooth root stress. In this case, three distinct clusters can also be formed. The L-PBF samples show the highest yield stresses with mean values between 577 N/mm² and 659 N/mm². They are followed by the WA-DED samples, which have mean values between 429 N/mm² and 497 N/mm². The lowest yield point is found in the conventional samples. However, there is no significant difference between the individual batches. Both batches show mean values between 353 N/mm² and 364 N/mm².
The inductive statistics for the form behaviour analysis were carried out with the identical methods as for the other experiments. The results are summarized in Table 19 below.
Table 19.
Significance levels of the objects of investigation for the form behaviour analysis.
The inductive statistics clearly confirm the results of the descriptive statistics. They show an influence of the manufacturing process on the forming behaviour at a significance level of 0.1%. This result confirms the previous investigations at a statically highly significant level. The same applies to the influence of the weld orientation for the WA-DED-manufactured samples. The influence of the build orientation on the forming behaviour is only significant for the weld orientations of 45° and 90°, but at a significance level of 1%. An influence of the build-up direction in the 0° weld orientation could not be statistically proven. However, the theoretically required sample size of five was exceeded with an actual sample size of nine. Accordingly, a significant influence of the mounting direction in the 0° orientation should have been detected, so the results present a significantly different result. The comparison of the result with the boxplot shows that the mean values are almost identical and also suggests that there is no significant difference between samples taken lying down and samples taken standing up in the 0° orientation. The superposition of the influence of the weld orientation and the influence of the removal height is considered to be the cause, as highly significant results are obtained for the influence of the weld orientation. Accordingly, it is assumed that the influence of the weld orientation outweighs the influence of the removal height of the sample body and, thus, the direction of build-up.
Statistical investigations on the influence of the exposure orientation on the forming behaviour also showed a significant result. However, this is only at an alpha level of 5%. The factorial comparisons of modelled yield stresses were carried out and are visualized in Table 20.
Table 20.
Factorial comparison of the mean values of the modelled yield stress.
The modelled yield strengths and their mean values are part of the validation of the other tests. The results show that all additively manufactured specimens have a higher modelled yield strength than the conventional batches. In addition, the conventional batch two shows the lowest elastic deformability in all comparison orientations. Examination of the horizontal WA-DED specimens shows that the 90° weld orientation exhibits the highest yield strength. An average analysis of the upright specimens shows the highest factor in the 45° orientation.
3.3.2. Microstructure Analysis
316L is an austenitic meta-stable steel, which can lead to the formation of ferrite and even martensite. The Schaeffler chart allows for a prediction of the phases that are formed by using a Nickel (Nieq) and Chrome equivalent (Creq). For the 316L with the given chemical composition, a Nieq of approx. 14% and Creq of approx. 22% is predicted, with a small fraction of 5% -ferrite and the rest austenite. The real microstructure evolution and therefore the phase fractions and grain sizes are dependent on the manufacturing process and, thus, will be different for the considered processes. As a representative example, the following samples are examined and shall serve as a general explanation.
The metallographic results for tooth tests (45°) after cracking for k_04_Z45, w_s1_Z45, and s_l2_Z45 are shown in Figure 23. It is visible that the conventional manufactured part k_04_Z45 has an austenitic microstructure with a grain size of approx. 50 µm and fine -ferrite needles (Figure 23a). In the forming zone of the tension area (Figure 23b), the development of α’-martensite is visible, while the grain size remains approx. the same. In the area of compression (Figure 23c), the fraction of formed α’-martensite is much lower compared to the tension area, with a large fraction of austenitic microstructure and a similar grain size of approx. 50µm. In the austenitic area, twin formation takes place. Also, local twin formation occurs in the non-deformed part (Figure 23d). The fractured surface shows little fringing, which means a higher ductility. Yet, the obtained similar forces during the tooth tests compared to the AM processes indicate a comparable ultimate strength.

Figure 23.
Microstructure analysis of conventionally manufactured sample k_04_Z45 (a–d).
The WA-DED part w_s1_Z45 (Figure 24a) shows a fine austenitic microstructure with a grain size of approx. 30 µm, with dendritic -ferrite in the non-deformed area (Figure 24e). In the tension area (Figure 24b), there is a similar austenitic grain size with finely distributed -ferrite. The fringing at the fracture surface implies a brittle cracking with minimal ductility, which can be attributed to the ductile austenitic phase and the shear stress that, in combination with dislocations, tend to tearing. The same behaviour is also visible for the middle area of the fracture surface (Figure 24c). For both cases, the deformation of the grains is still visible but not as dominant as for the undeformed area. Of interest is the compression area, where no fringing occurs but a significant deformation of grains is present, which are oriented more counter-clockwise corresponding to the bead orientation. This also implies a good ductility. In all areas (deformed/non-deformed) for the WA-DED part, no significant formation of martensite was observed. This can be attributed to a lower induced plastic strain combined with a lower fracture toughness, which causes brittle cracking with low ductility.
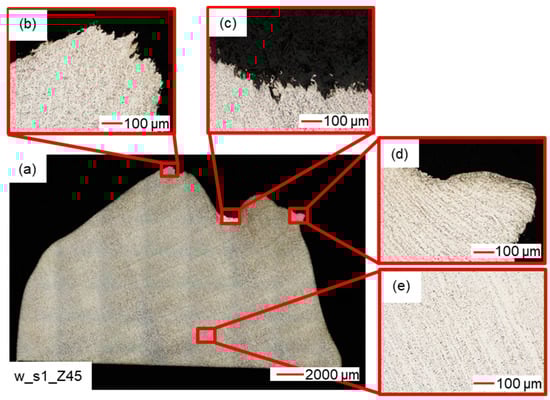
Figure 24.
Microstructure analysis of WA-DED sample W_s1_Z45 (a–e).
The L-PBF parts s_l2_Z45 microstructure is shown in Figure 25a. The characteristically “island”-structured fine austenitic microstructure with a very minor amount of -ferrite is present in all areas. For the tension area (Figure 25b), the deformation orientation of the grains with a grain size of approx. 100 µm is clearly visible, which corresponds to the tensile loading. It also shows a low ductility and brittle cracking at the fracture surface. The mid-part of the fracture surface (Figure 25c) shows an elongation of grains along the fracture direction, also presenting a lower ductility. Also, some pores with an approx. size of 10–20 µm are visible. The compression area (Figure 25d) shows similar grain sizes. The direction of deformation is tilted counter-clockwise. The non-deformed area (Figure 25e) shows lamellar homogeneous alignment of austenite grains with a grain size of approx. 30–50 µm. Inhomogeneities are attributed to the exposure strategy.

Figure 25.
Microstructure analysis of L-PBF samples s_l2_Z45 (a–e).
4. Discussion
4.1. Discussion of the Test Specimen Geometry
VDI 3405.2, as mentioned in the introduction, proposes standard tests for the qualification of AM processes. The tests can be separated into seven major groups, with four groups covering non-destructive, density, static, and dynamic mechanical property determination for the demonstrator and test geometry. The integrated tests in the benchmark geometry (Figure 10) are shown in green in Figure 26, while the tests with yellow backgrounds can be integrated without adaptation and the tests with white backgrounds cannot be integrated without changing the shape. The DIN 3990 tooth test does not appear in VDI 3405, but due to the complex stress state, it appeared to be an excellent instrument for testing practical loads. Finally, the figure shows the great potential of the benchmark geometry, which allows for a wide range of tests and thus allows for a benchmark for almost any manufacturing process.
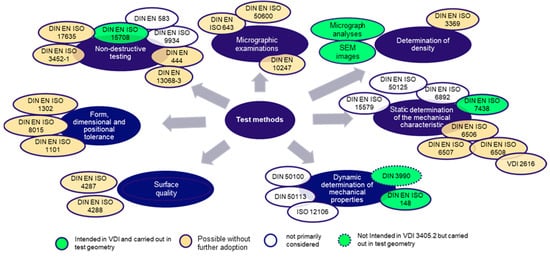
Figure 26.
Overview of available common test methods for AM processes according to VDI 3405.2.
Furthermore, the clamping device of the test specimen with the associated regulation simplifies the balancing of the stiffnesses. This ensures that the contact stiffnesses are minimised. By rotating and tilting the fixture, the bending test can be realised without loosening the specimen, which is not the case in standard bending tests.
In summary, it can be concluded that the test specification shows significant material and cost savings, which is particularly interesting for very expensive additive manufacturing routes. With one WA-DED block (dimensions: 150 mm, 150 mm, 25 mm) three test specimens can be produced. This means that 30 machine elements and 27 compression specimens can be tested, and numerous microstructure analyses and CT scans can be carried out.
The disadvantage is that the test sequence must be adhered to and some of the test bodies can only be carried out after the gears, bending plates, and threads have been tested. However, the base area would have to be enlarged in order to carry out further destructive tests.
4.2. Tooth Root Strength
The investigations of the critical and maximum tooth root stress showed significant differences between the manufacturing processes in all comparative orientations. The elastic load capacities of the L-PBF specimens are the highest, and those of the conventional specimen parts are the lowest. The maximum load capacity of the L-PBF parts was also the highest, but the conventional comparison parts of the first batch have similar load capacities. This was followed by the WA-DED parts, and the conventional parts of the second batch were the weakest. The influence of the installation space orientation and consequently the influence of the removal height showed significant differences in the critical observation in the 45° orientation. The samples taken lying down were significantly more resilient than the samples taken standing up. The reason for this is assumed to be the larger base area of the lying blanks. This promotes the cooling of the component and reduces the possibility of grain growth through recrystallization, which results in an improvement in the mechanical properties [81]. Due to the large scatter of the results, the required sample size to prove a significant influence of the weld orientation in the 0° and 90° orientation was not reached. For the maximum stress in the 90° orientation, the theoretically required sample size was reached. Nevertheless, no significant difference could be found. Consequently, it cannot be assumed that the 90° WA-DED specimens of the tooth root tests in the vertical and horizontal orientation actually differ. Following [81], the sampling height is considered to be the reason for this. An influence of the seam or exposure orientation suspected in the literature could not be proven to be significant on the basis of the available samples [17].
With the exception of the horizontal WA-DED samples, the results of the factorial comparison were averaged. The reason for this is the presumed influence of the sample height on the mechanical properties, which could not be statistically verified for all orientation directions, but is described in the literature [82]. Furthermore, the influence of the removal height is estimated to be lower than the influence of the seam orientation when examining the interlayer temperature during production [14]. A superposition of the influences of seam orientation and microstructure with the different component hardening over the component height is assumed, since different base surfaces are present [21]. Another significant influencing factor known in the literature [35] is material defects, but this is assumed not to be the case on the basis of the CT investigations and the validation tests using compression samples.
4.3. Bending Plates
The consideration of the influence of the installation space orientation, and consequently the influence of the extraction height, showed significant differences in the critical and maximum consideration at the 45° orientation. However, this only applies to the less accurate Kruskal–Wallis test. The theoretically required sample sizes for the ANOVA were not given for the removal height at the 0° and 90° orientation as well as for the influences of weld orientation and exposure orientation. As a result, possible differences between the samples could not be proven to be significant due to the small sample size. Studies in the technical literature indicate that influences of the extraction height are present for different components [21], but the influence of the weld orientation predominates [20].
4.4. Thread Testing
Even though the load-bearing threads were standardised, the investigation revealed a high scatter within the force–displacement curves. Consequently, only the maximum loads could be examined. In addition to the thread in the test body, the scatter is also strongly dependent on the surface and manufacturing tolerance of the screws. Large scatter occurred, especially with the conventional components, and is known in the literature.
Except for the influence of the seam orientation of the WA-DED specimens, no significant results could be obtained. The investigation of the influence of the seam orientation showed that the 45° seam orientation of the WA-DED specimens had the highest load-bearing capacities on average. In contrast, for the first time, the 45° exposure orientation of the L-PBF specimens was less load-bearing than the 0° and 90° exposure orientations. Due to the high scatter, higher sample numbers would be necessary for the other test specimens in order to obtain meaningful results. The highest deviation occurred when investigating the influence of the build-up direction in the 90° seam orientation. For this test specimen, ceteris paribus, 168 test specimens would have been required to achieve an alpha level of 5%. A comparison with similar investigations by Bambach et al. also shows differences in AM machined and conventional threads [41]. These investigations support the hypothesis of a significant difference between the methods. However, this could not be proven to be statistically significant in the present paper.
4.5. Impact Test
For the impact test, only one sample was chosen in the 45° orientation, but this also limits the evaluation to the influence of the manufacturing process and the installation direction of the WA-DED samples. Both tests show significant differences. For the first time, the conventional specimens are the most resilient and absorb the most impact energy. Again, batch one shows more performance, and is followed by batch two and the vertically manufactured WA-DED specimens. In the literature, a higher sampling point of WA-DED fabricated 316L notched impact specimens is also found to have higher notched impact energies [83]. Thus, it is concluded that multiple heating during over-welding has a positive effect on the hardness and ductility for the upright fabricated specimens. This conclusion is also supported by studies by Yasa et al. [32].
The L-PBF specimens performed similarly to the standing and lying WA-DED specimens and had the second lowest load capacity in the notched bar impact test. Comparable studies, such as those by Deng et al., show that heat-treated specimens exhibit more ductile material behaviour due to recrystallization and can thus absorb more impact energy [29]. The initially surprising result generally confirms that the additively manufactured specimens are less ductile [84].
4.6. Compression Test
The analysis of the compressive yield curve represents a verification test that was evaluated in such a way that the elastic limit can be concluded. With this very simple and low-cost test, it was possible to calculate comparative values with a good repeatability, so that these tests had the lowest scatter of all tests. Thus, significant results could be determined for all tests except for the 0° seam orientation. Here, although the theoretically required number of samples of five was reached, there was no significant difference between the modelled elasticity limits. The other results confirm the distribution of the tooth root and the bending tests and thus the determined general manufacturing factors for the additive processes. The material-dependent anisotropic behaviour of the compression specimens manufactured with the WA-DED method described by Abbaszadeh can consequently be confirmed [23]. Furthermore, Longhitano et al. determined anisotropic mechanical properties for L-PBF manufactured components [22]. These results correlate with the results of the present investigation.
4.7. Microstructure Influence on the Test Results
The influence of the martensite formation depending on the loading direction leads to an asymmetrical behaviour, which was reported by El-Tahawy et al. They state that the different phase compositions, textures, and dislocation densities developed during tension and compression are responsible. This effect is also indicated in the stress–strain curves and strain hardening rate [81]. The chemical composition has a major influence on the martensite formation. Small inhomogeneities in the distribution of the chemical elements were therefore responsible for local differences in martensite fractions.
Another parameter influencing the mechanical behaviour is the grain orientation. Anisotropic behaviour cannot only be seen regarding build orientation but also for thermal gradients causing a directed microstructure evolution. As mentioned before, porosity and pore size will be neglected, as their influence on the mechanical behaviour for this study is expected to be less significant than the microstructural aspects.
Further and more detailed analysis have to be performed to better differentiate the occurring microstructural development and their corresponding mechanical effects.
5. Conclusions
- Components made by AM have process-dependent material properties due to the process principle. The conducted analysis of manufactured 316L parts by conventional machining, WA-DED and L-PBF show global and local differences in the microstructure. On the basis of the obtained results, the conclusion can be drawn that each individual manufacturing process and the specific process parameters, like building orientation, should be considered as process-specific manufacturing factors for the design and production planning of components.
An efficient testing method and setup with a novel and extendable benchmark geometry were developed.
- One benchmark geometry allows for the testing of four integrated machine elements which are threads, bending plates, gear teeth, and one notched impact test. The influence of the building process and part orientation on mechanical properties was determined and showed remarkable differences. The benchmark could be extended, for example, with microhardness or corrosion investigations. With the concept of implementing all tests in one geometry, cost-efficient testing becomes possible.
- A combination of descriptive and inductive statistical evaluation allowed for the determination of process-specific manufacturing factors for the first time.
This leads to the final conclusion regarding the obtained results of the three manufacturing routes: conventional, WA-DED, and L-PBF:
- The distribution of the chemical elements in the conventionally manufactured parts has a significant impact on the manufacturing factors.
- Compared to AM parts, conventionally manufactured parts show higher notch impact energies.
- L-PBF parts have, in general, the highest mechanical strength (from 1.1 up to 1.9 times higher than conventionally manufactured parts).
- The manufacturing factors of the WA-DED parts are in between those of conventionally and L-PBF-manufactured parts. This is explained by the larger melt pool, which leads to a more inhomogeneous microstructure evolution due to different thermal fluxes. Yet, WA-DED parts allow for a rather high plastic deformation (e.g., tooth root strength or thread test 45°).
- The compression test seems to be suitable to globally estimate the mechanical material behaviour and validate the detailed results.
- If the range of manufacturing factors for repeat tests is determined and averaged over the different machine elements, the property stability for a process can be quantified. The L-PBF shows the highest (0.0250), the conventional material a medium (0.0725), and the WA-DED the lowest average stability (0.1125). The maximum loads of the four machine elements in the 45° direction were considered for all L-PBF, horizontal WA-DED, and batch 1.
In summary, the work shows that strength verifications for industrially relevant AM components should be carried out with application-oriented tests. For example, the yield stress from the compression test for the L-PBF method is between 1.62 and 1.66 times higher than for the conventional method. The maximum tooth root stress, however, is only 1.01 and 1.03 times higher. If the yield stress from the compression test were used for the design, the component would fail. Thus, the statistically verified manufacturing factors indirectly prove that when designing machine elements with complex stress conditions on the basis of conventional tension and compression tests, non-negligible calculation errors occur.
It is shown that the mechanical properties depend significantly on the manufacturing process if no post-treatment is applied. Another remarkable influence is given by the part geometry or the stress state, respectively. Manufacturing-process-specific factors were derived to consider these influences, which are proven by statistical methods. Because of the interactions between material and process parameters, the manufacturing factors shall be determined for a wider range of materials, processes, and process strategies, including mechanical, thermal, or thermo-mechanical post-treatment. This will provide better knowledge to plan complete process chains.
Supplementary Materials
The following supporting information can be downloaded at: https://www.mdpi.com/article/10.3390/met13111900/s1, File: demonstrator_final.igs, Results_tooth_root_test.xlsx.
Author Contributions
Conceptualization, J.B.; software, L.G.; investigation, L.G. and B.S.; writing—original draft preparation, L.G. and B.S.; writing—review and editing, R.W. and J.B.; supervision, R.W. and J.B. All authors have read and agreed to the published version of the manuscript.
Funding
This research received no external funding.
Data Availability Statement
CAD design file of the testing geometry and a data set of tooth root tests are provided. Remaining data presented in this study are available on request from the corresponding author.
Acknowledgments
The authors are very grateful for the support of Grit Rodenbeck for the mechanical testing and Sebastian Bolz for the EBSD analysis from Department metallurgy and materials at BTU Cottbus–Senftenberg.
Conflicts of Interest
The authors declare no conflict of interest.
Appendix A
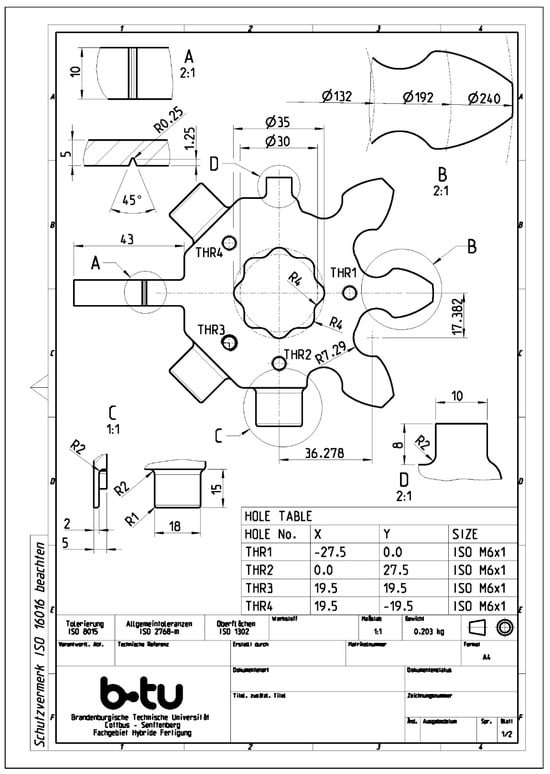
Figure A1.
Technical drawing 1 of the demonstrator.
Figure A1.
Technical drawing 1 of the demonstrator.

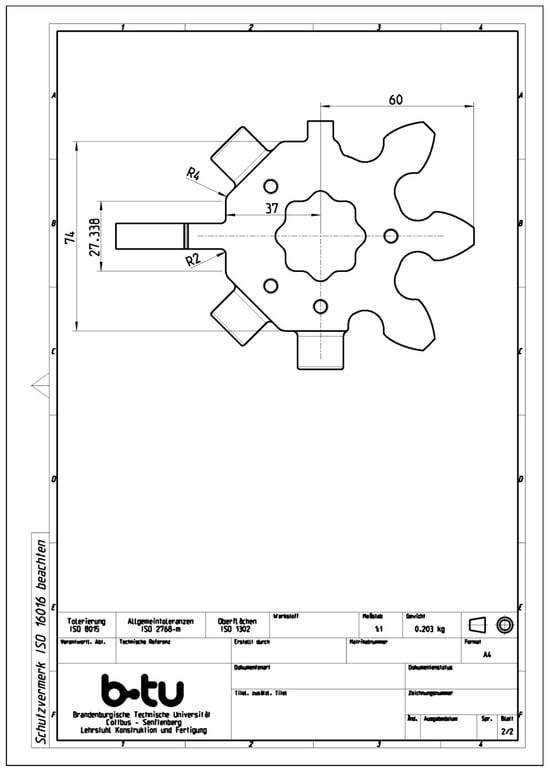
Figure A2.
Technical drawing 2 of the demonstrator.
Figure A2.
Technical drawing 2 of the demonstrator.


Figure A3.
Technical drawing of the demonstrator mounting plate.
Figure A3.
Technical drawing of the demonstrator mounting plate.
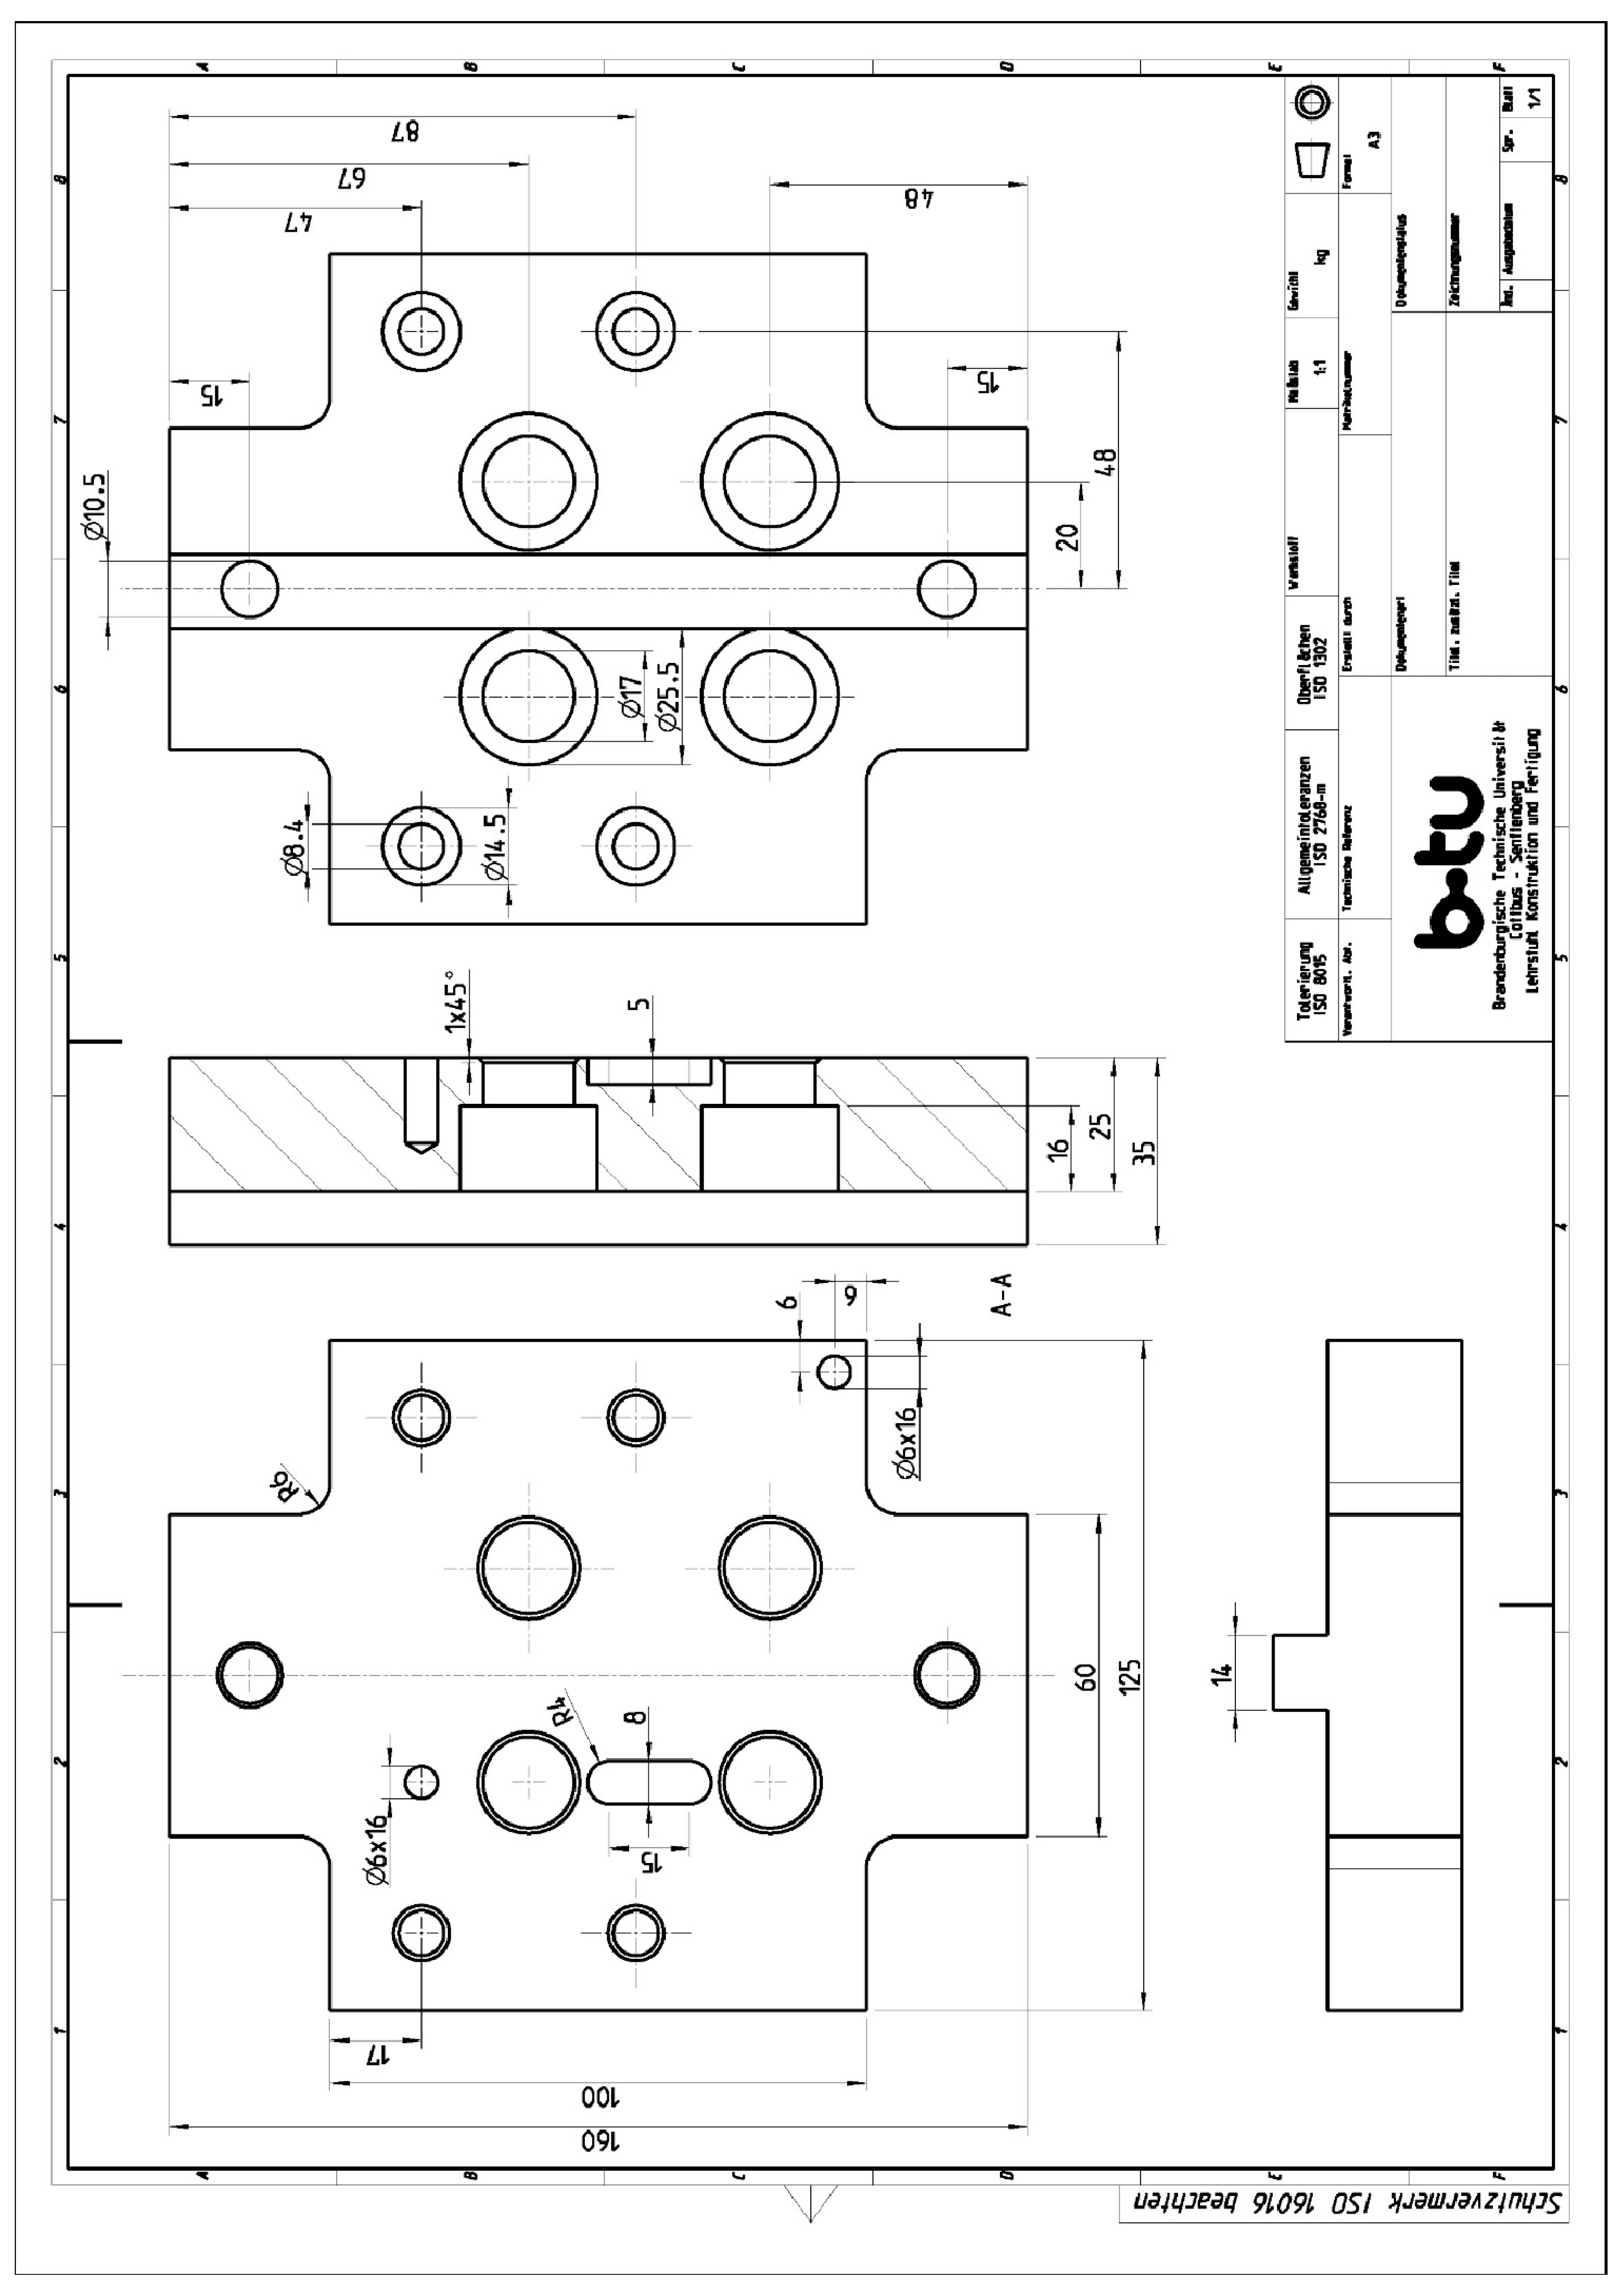
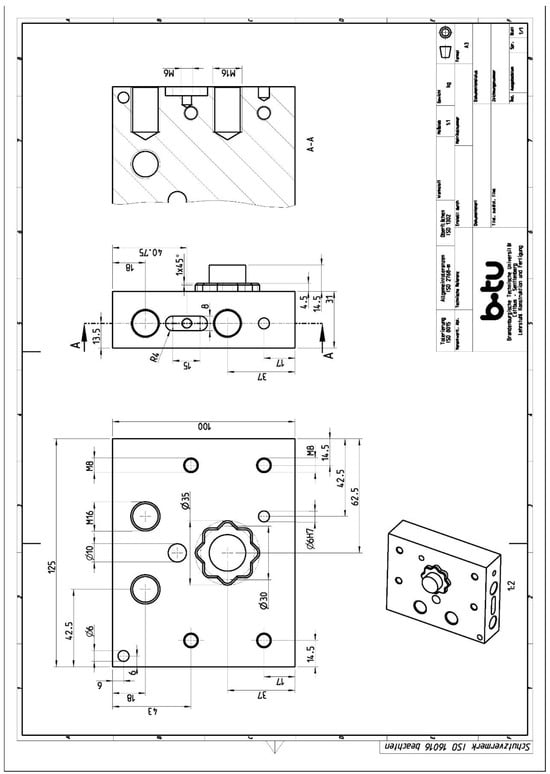
Figure A4.
Technical drawing of the specimen holder.
Figure A4.
Technical drawing of the specimen holder.
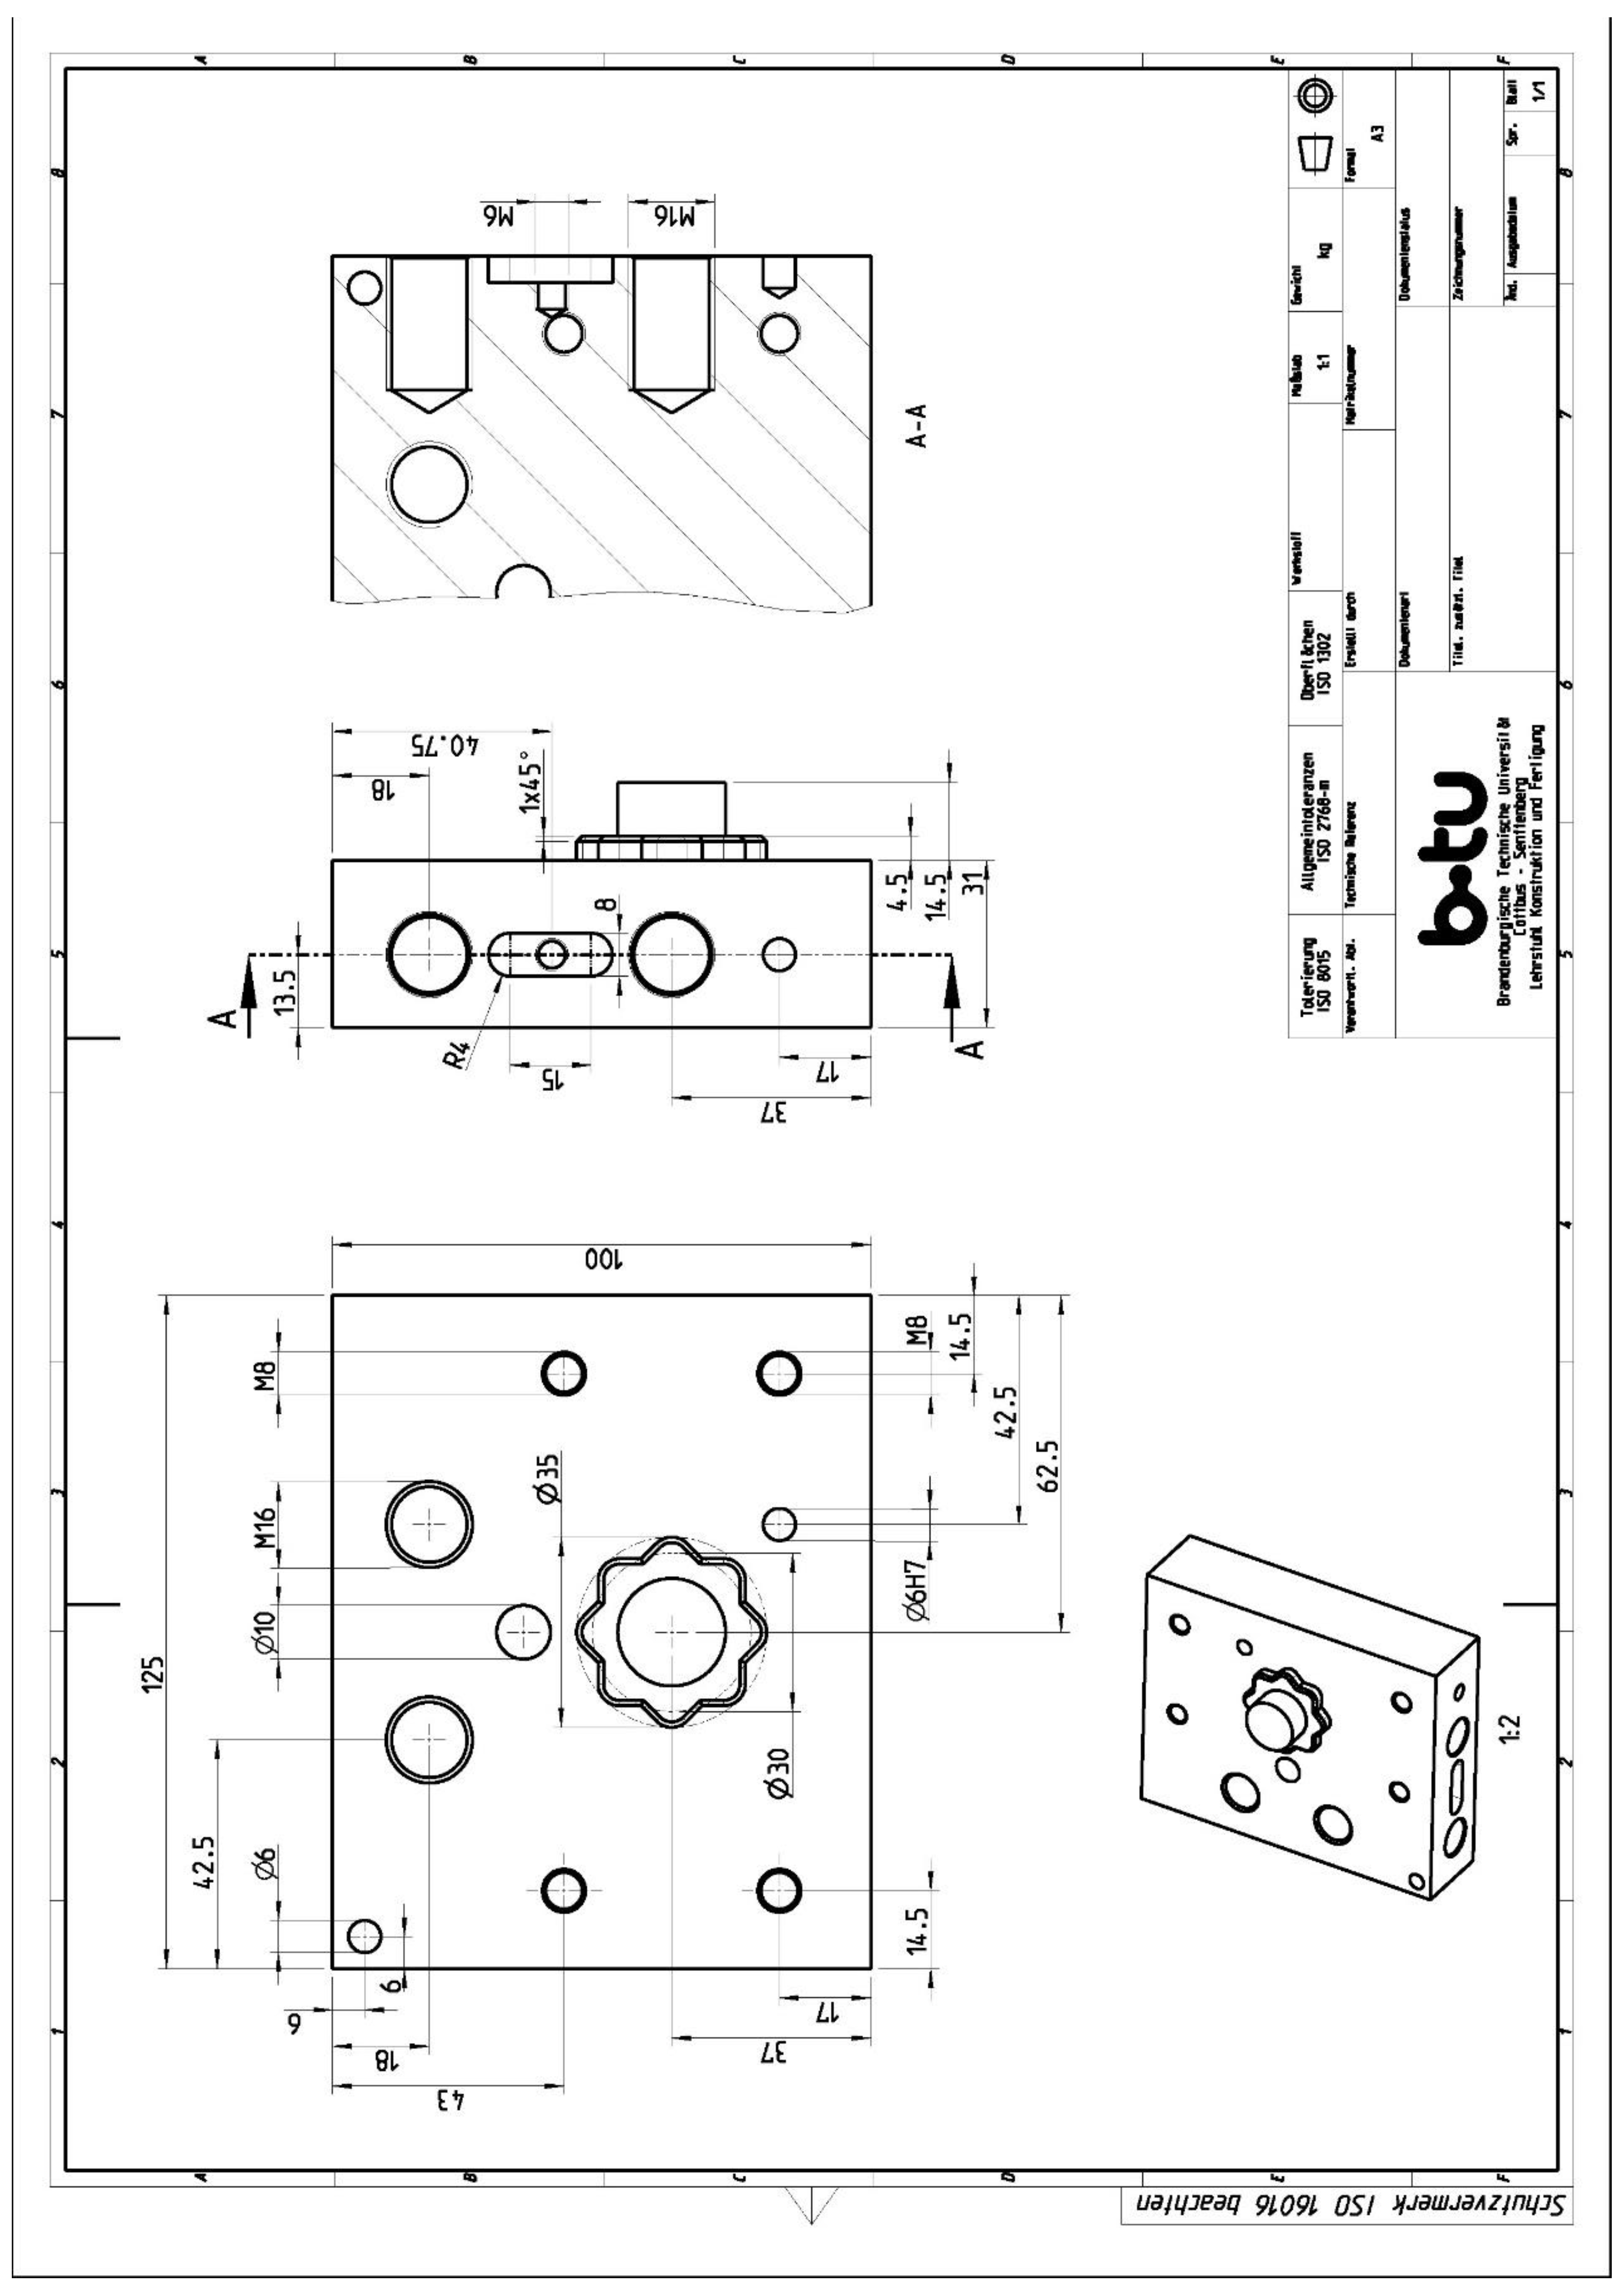
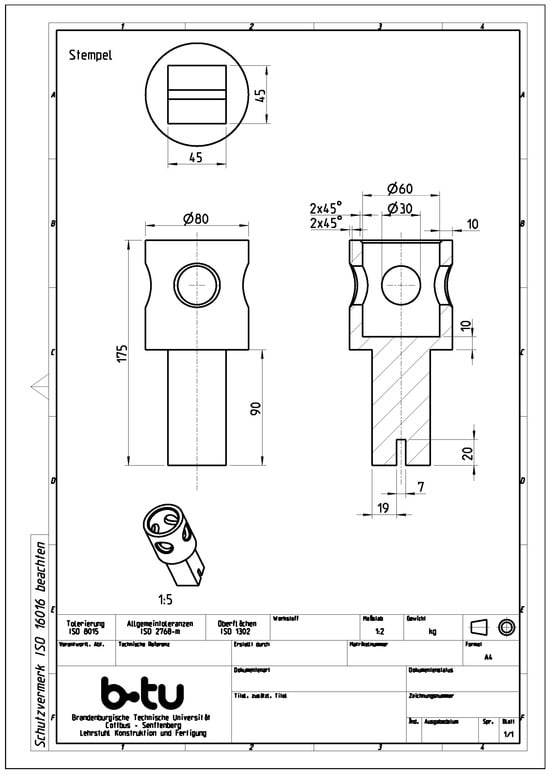
Figure A5.
Technical drawing of the punch.
Figure A5.
Technical drawing of the punch.
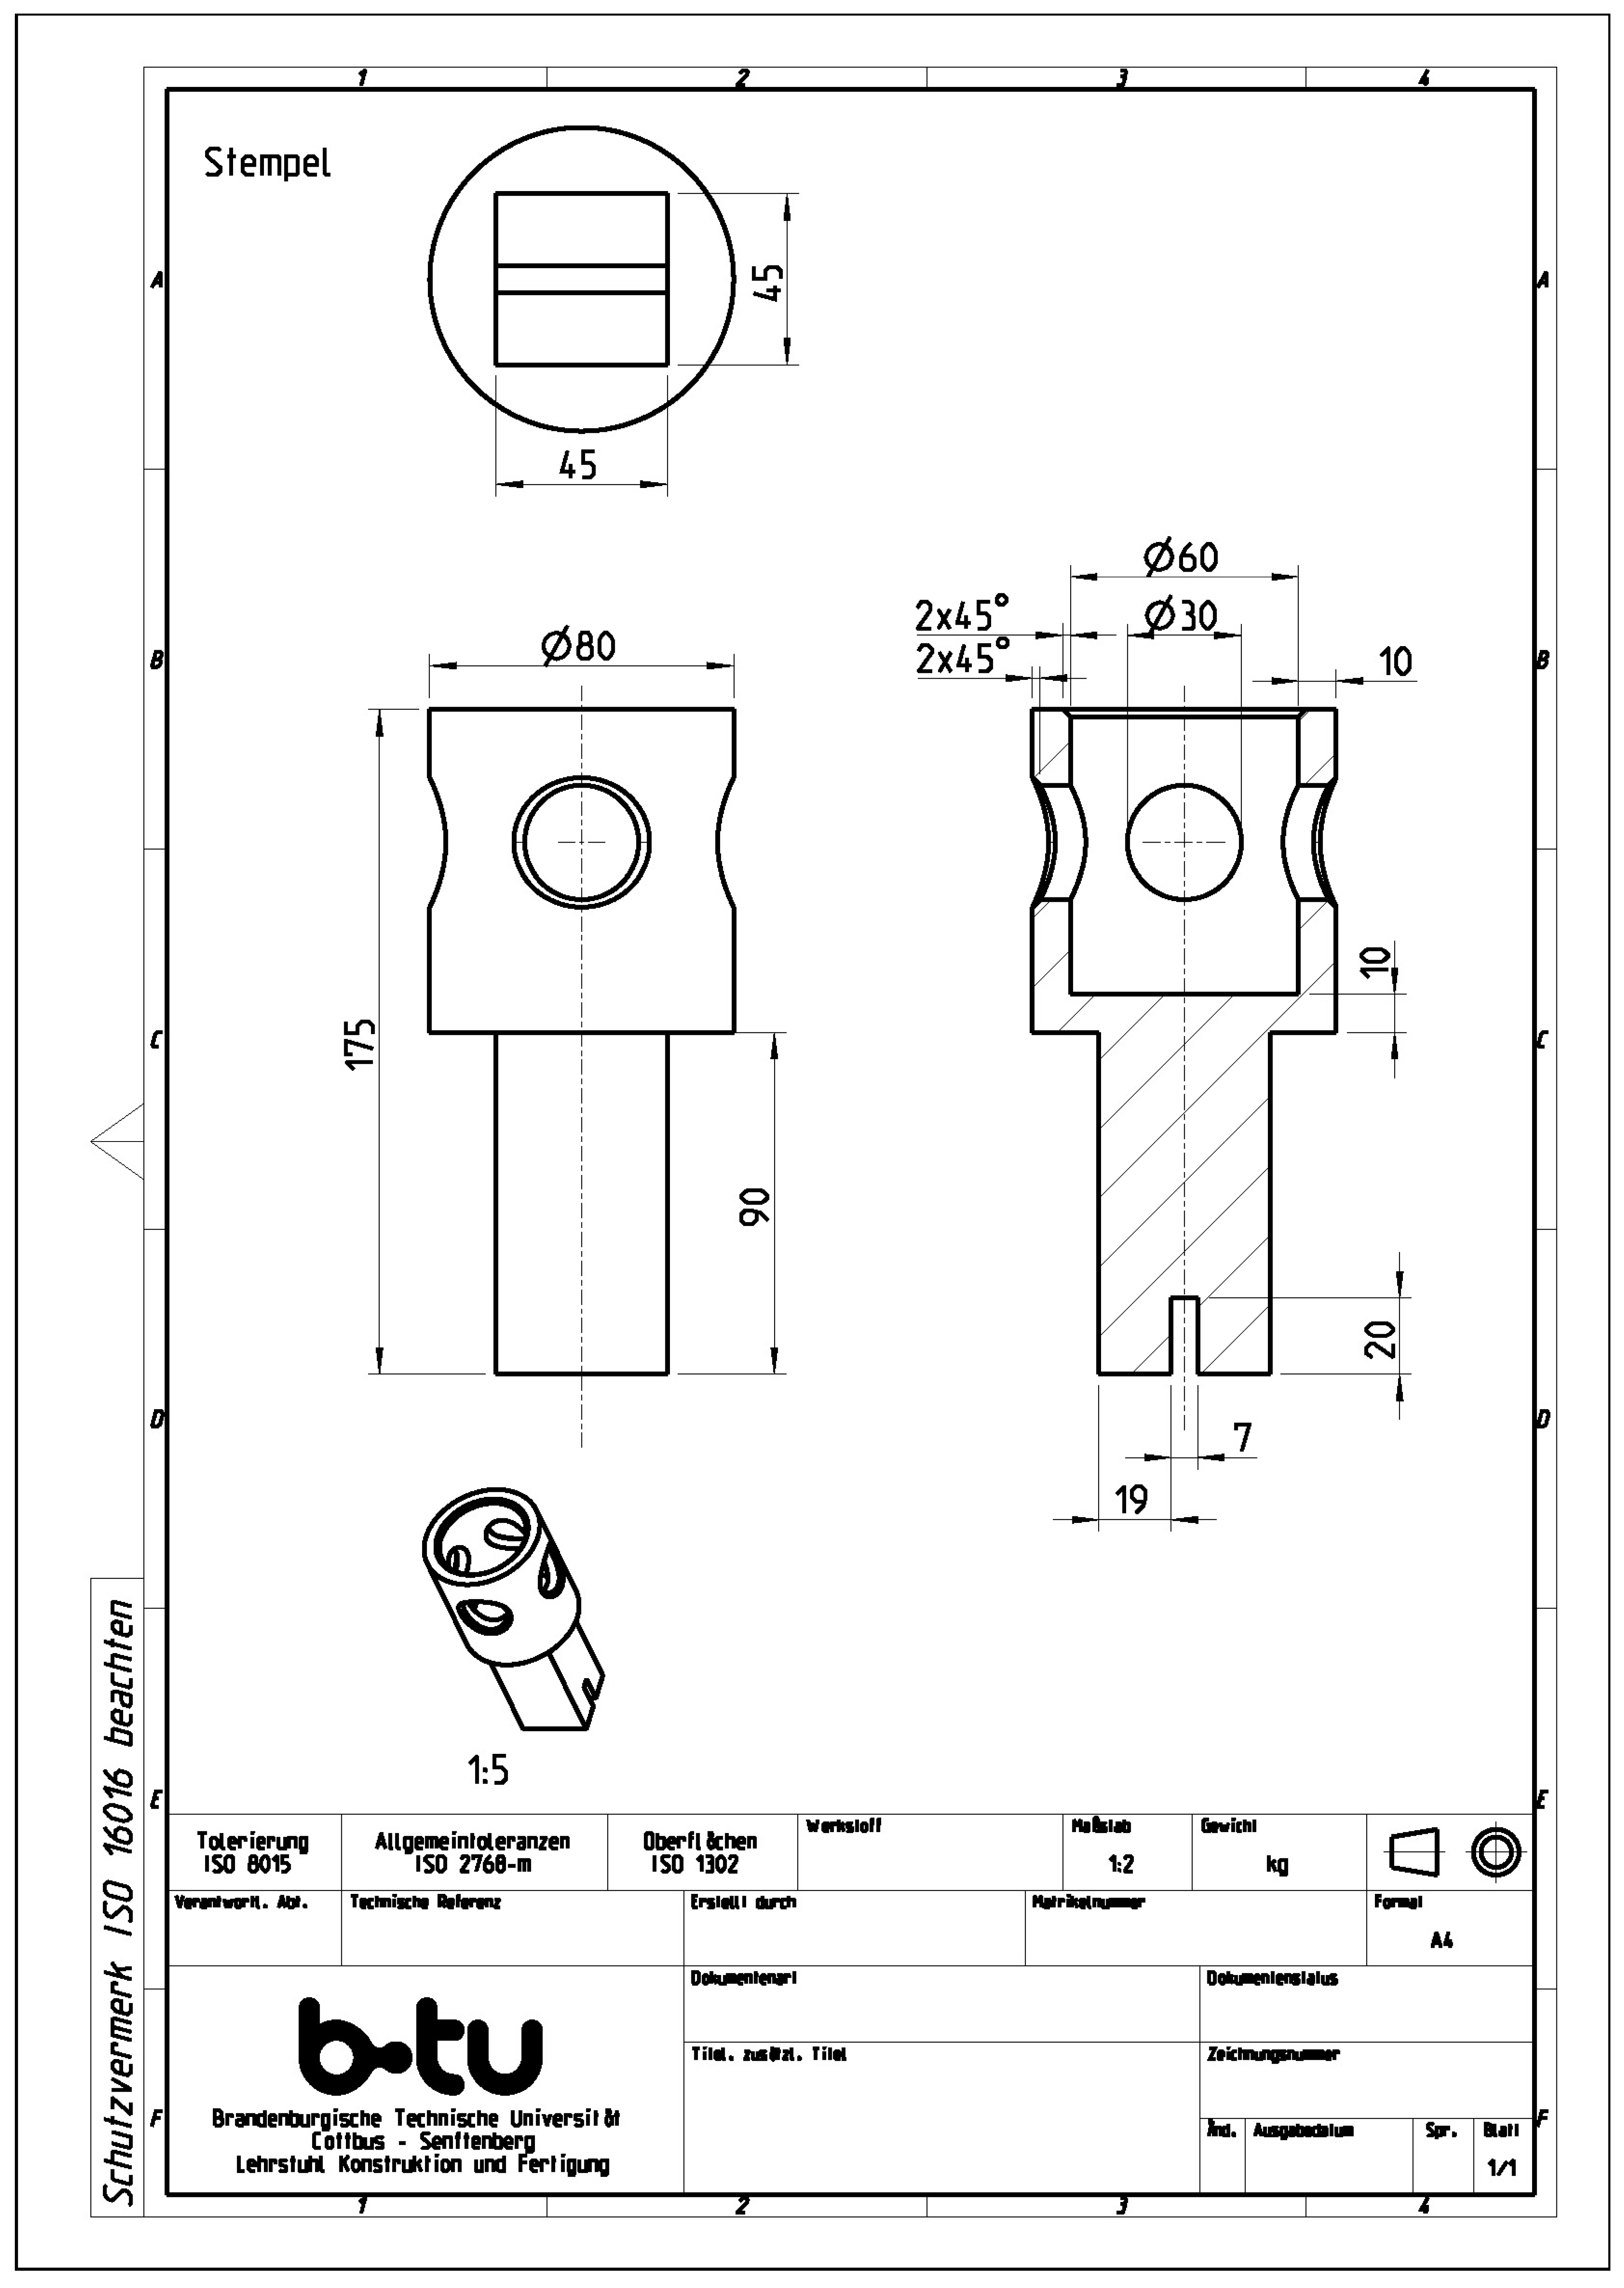
References
- Seifi, M.; Salem, A.; Beuth, J.; Harrysson, O.; Lewandowski, J.J. Overview of Materials Qualification Needs for Metal Additive Manufacturing. JOM 2016, 68, 747–764. [Google Scholar] [CrossRef]
- Saracyakupoglu, T. The Qualification of the Additively Manufactured Parts in the Aviation Industry. AJAE 2019, 6, 1. [Google Scholar] [CrossRef]
- Wagner, S.M.; Walton, R.O. Additive manufacturing’s impact and future in the aviation industry. Prod. Plan. Control. 2016, 27, 1124–1130. [Google Scholar] [CrossRef]
- Gibbons, D.W.; Serfontein, J.-P.L.; van der Merwe, A.F. Mapping the path to certification of metal laser powder bed fusion for aerospace applications. RPJ 2021, 27, 355–361. [Google Scholar] [CrossRef]
- Olakanmi, E.O.; Cochrane, R.F.; Dalgarno, K.W. A review on selective laser sintering/melting (SLS/SLM) of aluminium alloy powders: Processing, microstructure, and properties. Prog. Mater. Sci. 2015, 74, 401–477. [Google Scholar] [CrossRef]
- Rodrigues, T.A.; Duarte, V.; Miranda, R.M.; Santos, T.G.; Oliveira, J.P. Current Status and Perspectives on Wire and Arc Additive Manufacturing (WAAM). Materials 2019, 12, 1121. [Google Scholar] [CrossRef]
- Ding, D.; Pan, Z.; Cuiuri, D.; Li, H. Wire-feed additive manufacturing of metal components: Technologies, developments and future interests. Int. J. Adv. Manuf. Technol. 2015, 81, 465–481. [Google Scholar] [CrossRef]
- Israr, R.; Buhl, J.; Bambach, M. A study on power-controlled wire-arc additive manufacturing using a data-driven surrogate model. Int. J. Adv. Manuf. Technol. 2021, 117, 2133–2147. [Google Scholar] [CrossRef]
- Chen, Z.; Han, C.; Gao, M.; Kandukuri, S.Y.; Zhou, K. A review on qualification and certification for metal additive manufacturing. Virtual Phys. Prototyp. 2022, 17, 382–405. [Google Scholar] [CrossRef]
- Zhai, X.; Jin, L.; Jiang, J. A survey of additive manufacturing reviews. Mater. Sci. Addit. Manuf. 2022, 1, 21. [Google Scholar] [CrossRef]
- Gross, D.; Hauger, W.; Schröder, J.; Wall, W.A. Technische Mechanik 2; Springer: Berlin/Heidelberg, Germany, 2021; ISBN 978-3-662-61861-5. [Google Scholar]
- VDI 3405.2; Additive Fertigungsverfahren—Strahlschmelzen metallischer Bauteile-Qualifizierung, Qualitätssicherung und Nachbearbeitung. VDI-Verlag: Düsseldorf, Germany, 2013.
- DIN EN ISO ASTM 52927; Additive Fertigung-Grundlagen-Hauptmerkmale und entsprechende Prüfverfahren. Beuth Verlag GmbH: Berlin, Germany, 2022.
- Posch, G.; Chladil, K.; Chladil, H. Material properties of CMT—Metal additive manufactured duplex stainless steel blade-like geometries. Weld World 2017, 61, 873–882. [Google Scholar] [CrossRef]
- Liu, Y.; Jin, P.; Li, J.; Lin, T.; Li, F.; Hou, S.; Sun, Q.; Feng, J. Microstructural Characteristics and Mechanical Properties of Repaired Titanium Alloy Blade by Arc Additive Manufacturing Process. Adv. Eng. Mater. 2020, 22, 2000187. [Google Scholar] [CrossRef]
- Yan, Z.; Zhu, L.; Yang, Z.; Xue, P. Study on the geometrical dimensions and mechanical properties of Ti-6Al-4V alloy blade by laser metal deposition. Int. J. Adv. Manuf. Technol. 2021, 114, 695–707. [Google Scholar] [CrossRef]
- Rodriguez, N.; Vázquez, L.; Huarte, I.; Arruti, E.; Tabernero, I.; Alvarez, P. Wire and arc additive manufacturing: A comparison between CMT and TopTIG processes applied to stainless steel. Weld World 2018, 62, 1083–1096. [Google Scholar] [CrossRef]
- Addison, A.; Ding, J.; Martina, F.; Lockett, H.; Williams, S.; Zhang, X. Manufacture of Complex Titanium Parts Using Wire+Arc Additive Manufacture; Hilton Birmingham Metropol Hotel: Birmingham, UK, 2015. [Google Scholar]
- Bambach, M.; Sizova, I.; Sydow, B.; Hemes, S.; Meiners, F. Hybrid manufacturing of components from Ti-6Al-4V by metal forming and wire-arc additive manufacturing. J. Mater. Process. Technol. 2020, 282, 116689. [Google Scholar] [CrossRef]
- Köhler, M.; Fiebig, S.; Hensel, J.; Dilger, K. Wire and Arc Additive Manufacturing of Aluminum Components. Metals 2019, 9, 608. [Google Scholar] [CrossRef]
- Yildiz, A.S.; Davut, K.; Koc, B.; Yilmaz, O. Wire arc additive manufacturing of high-strength low alloy steels: Study of process parameters and their influence on the bead geometry and mechanical characteristics. Int. J. Adv. Manuf. Technol. 2020, 108, 3391–3404. [Google Scholar] [CrossRef]
- Longhitano, G.A.; Larosa, M.A.; Jardini, A.L.; Zavaglia, C.A.d.C.; Ierardi, M.C.F. Correlation between microstructures and mechanical properties under tensile and compression tests of heat-treated Ti-6Al–4 V ELI alloy produced by additive manufacturing for biomedical applications. J. Mater. Process. Technol. 2018, 252, 202–210. [Google Scholar] [CrossRef]
- Abbaszadeh, M.; Ventzke, V.; Neto, L.; Riekehr, S.; Martina, F.; Kashaev, N.; Hönnige, J.; Williams, S.; Klusemann, B. Compression Behaviour of Wire + Arc Additive Manufactured Structures. Metals 2021, 11, 877. [Google Scholar] [CrossRef]
- Bambach, M.; Sizova, I.; Szyndler, J.; Bennett, J.; Hyatt, G.; Cao, J.; Papke, T.; Merklein, M. On the hot deformation behavior of Ti-6Al-4V made by additive manufacturing. J. Mater. Process. Technol. 2021, 288, 116840. [Google Scholar] [CrossRef]
- Clausen, A.; Aage, N.; Sigmund, O. Exploiting Additive Manufacturing Infill in Topology Optimization for Improved Buckling Load. Engineering 2016, 2, 250–257. [Google Scholar] [CrossRef]
- Nazir, A.; Arshad, A.B.; Jeng, J.-Y. Buckling and Post-Buckling Behavior of Uniform and Variable-Density Lattice Columns Fabricated Using Additive Manufacturing. Materials 2019, 21, 3539. [Google Scholar] [CrossRef] [PubMed]
- DIN EN ISO 148-1; Metallische Werkstoffe—Kerbschlagbiegeversuch Nach Charpy Teil 1. Beuth Verlag: Berlin, Germany, 2017.
- Vastola, G.; Sin, W.J.; Sun, C.-N.; Sridhar, N. Design guidelines for suppressing distortion and buckling in metallic thin-wall structures built by powder-bed fusion additive manufacturing. Mater. Des. 2022, 215, 110489. [Google Scholar] [CrossRef]
- Hermanová, Š.; Kuboň, Z.; Čížek, P.; Kosňovská, J.; Rožnovská, G.; Dorazil, O.; Cieslarová, M. Study of Material Properties and Creep Behavior of a Large Block of AISI 316L Steel Produced by SLM Technology. Metals 2022, 12, 1283. [Google Scholar] [CrossRef]
- Deng, P.; Song, M.; Yang, J.; Pan, Q.; McAllister, S.; Li, L.; Prorok, B.C.; Lou, X. On the thermal coarsening and transformation of nanoscale oxide inclusions in 316L stainless steel manufactured by laser powder bed fusion and its influence on impact toughness. Mater. Sci. Eng. A 2022, 835, 142690. [Google Scholar] [CrossRef]
- Davies, C.M.; Withnell, O.; Ronnerberg, T.; Williams, R.; Hooper, P.A. Fracture Analysis of 316L Steel Samples Manufactured by Selective Laser Melting. Procedia Struct. Integr. 2018, 13, 1384–1389. [Google Scholar] [CrossRef]
- Yasa, E.; Deckers, J.; Kruth, J.-P.; Rombouts, M.; Luyten, J. Charpy impact testing of metallic selective laser melting parts. Virtual Phys. Prototyp. 2010, 5, 89–98. [Google Scholar] [CrossRef]
- Afkhami, S.; Dabiri, M.; Piili, H.; Björk, T. Effects of manufacturing parameters and mechanical post-processing on stainless steel 316L processed by laser powder bed fusion. Mater. Sci. Eng. A 2021, 802, 140660. [Google Scholar] [CrossRef]
- Ayan, Y.; Kahraman, N. Bending fatigue properties of structural steel fabricated through wire arc additive manufacturing (WAAM). Eng. Sci. Technol. Int. J. 2022, 35, 101247. [Google Scholar] [CrossRef]
- Concli, F.; Bonaiti, L.; Gerosa, R.; Cortese, L.; Nalli, F.; Rosa, F.; Gorla, C. Bending Fatigue Behavior of 17-4 PH Gears Produced by Additive Manufacturing. Appl. Sci. 2021, 11, 3019. [Google Scholar] [CrossRef]
- Schmitt, M.; Kamps, T.; Siglmüller, F.; Winkler, J.; Schlick, G.; Seidel, C.; Tobie, T.; Stahl, K.; Reinhart, G. Laser-based powder bed fusion of 16MnCr5 and resulting material properties. Addit. Manuf. 2020, 35, 101372. [Google Scholar] [CrossRef]
- Fatemi, A.; Molaei, R.; Sharifimehr, S.; Shamsaei, N.; Phan, N. Torsional fatigue behavior of wrought and additive manufactured Ti-6Al-4V by powder bed fusion including surface finish effect. Int. J. Fatigue 2017, 99, 187–201. [Google Scholar] [CrossRef]
- Fatemi, A.; Molaei, R. Novel specimen geometries for fatigue testing of additive manufactured metals under axial, torsion, and combined axial-torsion loadings. Int. J. Fatigue 2020, 130, 105287. [Google Scholar] [CrossRef]
- Macek, W.; Branco, R.; Trembacz, J.; Costa, J.D.; Ferreira, J.; Capela, C. Effect of multiaxial bending-torsion loading on fracture surface parameters in high-strength steels processed by conventional and additive manufacturing. Eng. Fail. Anal. 2020, 118, 104784. [Google Scholar] [CrossRef]
- Fatemi, A.; Molaei, R.; Phan, N. Multiaxial fatigue of additive manufactured metals: Performance, analysis, and applications. Int. J. Fatigue 2020, 134, 105479. [Google Scholar] [CrossRef]
- Bambach, M.; Ünsal, I.; Sviridov, A.; Hama-Saleh, R.; Weisheit, A. Hybrid manufacturing of sheet metals and functionalizing for joining applications via hole flanging. Prod. Eng. Res. Devel. 2021, 15, 223–233. [Google Scholar] [CrossRef]
- Kok, Y.; Tan, X.P.; Wang, P.; Nai, M.; Loh, N.H.; Liu, E.; Tor, S.B. Anisotropy and heterogeneity of microstructure and mechanical properties in metal additive manufacturing: A critical review. Mater. Des. 2018, 139, 565–586. [Google Scholar] [CrossRef]
- Svension, M.; Ackelid, U. Titanium Alloys Manufactured with Electron Beam Melting Mechanical and Chemical Properties. In Medical Device Materials V, Proceedings of the Materials and Processes for Medical Devices Conference, 2009; Gilbert, J., Ed.; ASM International: Materials Park, OH, USA, 2010; pp. 189–194. ISBN 9781615031412. [Google Scholar]
- Edwards, P.; O’Conner, A.; Ramulu, M. Electron Beam Additive Manufacturing of Titanium Components: Properties and Performance. J. Manuf. Sci. Eng. 2013, 135, 061016. [Google Scholar] [CrossRef]
- Rafi, H.K.; Karthik, N.V.; Gong, H.; Starr, T.L.; Stucker, B.E. Microstructures and Mechanical Properties of Ti6Al4V Parts Fabricated by Selective Laser Melting and Electron Beam Melting. J. Mater. Eng. Perform. 2013, 22, 3872–3883. [Google Scholar] [CrossRef]
- Hrabe, N.; Quinn, T. Effects of processing on microstructure and mechanical properties of a titanium alloy (Ti–6Al–4V) fabricated using electron beam melting (EBM), Part 2: Energy input, orientation, and location. Mater. Sci. Eng. A 2013, 573, 271–277. [Google Scholar] [CrossRef]
- Ladani, L.; Razmi, J.; Farhan Choudhury, S. Mechanical Anisotropy and Strain Rate Dependency Behavior of Ti6Al4V Produced Using E-Beam Additive Fabrication. J. Eng. Mater. Technol. 2014, 136, 96. [Google Scholar] [CrossRef]
- Wang, P.; Nai, M.L.S.; Tan, X.; Sin, W.J.; Tor, S.B.; Wei, J. Anisotropic Mechanical Properties in a Big-Sized Ti-6Al-4V Plate Fabricated by Electron Beam Melting. In TMS 2016 145th Annual Meeting & Exhibition; Springer International Publishing: Cham, Switzerland, 2016; pp. 5–12. ISBN 978-3-319-48624-6. [Google Scholar]
- Christensen, A.; Kirchner, R.; Lippincott, A. Qualification of electron beam melted (EBM) Ti6Al4V-ELI for orthopaedic applications. In Medical Device Materials IV: Proceedings of the Materials and Processes for Medical Devices, Palm Desert, CA, USA, 23–25 September; Gilbert, J., Ed.; ASM International: Palm Desert, CA, USA, 2007; pp. 48–53. [Google Scholar]
- Cain, V.; Thijs, L.; van Humbeeck, J.; van Hooreweder, B.; Knutsen, R. Crack propagation and fracture toughness of Ti6Al4V alloy produced by selective laser melting. Addit. Manuf. 2015, 5, 68–76. [Google Scholar] [CrossRef]
- Simonelli, M.; Tse, Y.Y.; Tuck, C. Effect of the build orientation on the mechanical properties and fracture modes of SLM Ti–6Al–4V. Mater. Sci. Eng. A 2014, 616, 1–11. [Google Scholar] [CrossRef]
- Qiu, C.; Adkins, N.J.; Attallah, M.M. Microstructure and tensile properties of selectively laser-melted and of HIPed laser-melted Ti–6Al–4V. Mater. Sci. Eng. A 2013, 578, 230–239. [Google Scholar] [CrossRef]
- Vilaro, T.; Colin, C.; Bartout, J.D. As-Fabricated and Heat-Treated Microstructures of the Ti-6Al-4V Alloy Processed by Selective Laser Melting. Met. Mater. Trans. A 2011, 42, 3190–3199. [Google Scholar] [CrossRef]
- Alcisto, J.; Enriquez, A.; Garcia, H.; Hinkson, S.; Steelman, T.; Silverman, E.; Valdovino, P.; Gigerenzer, H.; Foyos, J.; Ogren, J.; et al. Tensile Properties and Microstructures of Laser-Formed Ti-6Al-4V. J. Mater. Eng. Perform. 2011, 20, 203–212. [Google Scholar] [CrossRef]
- Qiu, C.; Ravi, G.A.; Dance, C.; Ranson, A.; Dilworth, S.; Attallah, M.M. Fabrication of large Ti–6Al–4V structures by direct laser deposition. J. Alloys Compd. 2015, 629, 351–361. [Google Scholar] [CrossRef]
- Carroll, B.E.; Palmer, T.A.; Beese, A.M. Anisotropic tensile behavior of Ti–6Al–4V components fabricated with directed energy deposition additive manufacturing. Acta Mater. 2015, 87, 309–320. [Google Scholar] [CrossRef]
- ASTM F1108; F04 Committee. Specification for Titanium-6Aluminum-4Vanadium Alloy Castings for Surgical Implants. ASTM International: West Conshohocken, PA, USA.
- ASTM F1472; F04 Committee. Specification for Wrought Titanium-6Aluminum-4Vanadium Alloy for Surgical Implant Applications. ASTM International: West Conshohocken, PA, USA.
- Wittel, H.; Jannasch, D.; Voßiek, J.; Spura, C. (Eds.) Roloff/Matek Maschinenelemente; Springer Fachmedien Wiesbaden: Wiesbaden, Germany, 2019. [Google Scholar]
- Baumgarten, H.; Böhmer, M.; Hinz, M.; Nijs, M.; Pischinger, S.; Souren, M.; Thewes, M.; Lindemann, B.; Flecke, T.; König, A.; et al. Antriebe. In Vieweg Handbuch Kraftfahrzeugtechnik; Pischinger, S., Seiffert, U., Eds.; Springer Fachmedien Wiesbaden: Wiesbaden, Germany, 2021; pp. 461–860. ISBN 978-3-658-25556-5. [Google Scholar]
- DIN EN ISO 7438; Metallische Werkstoffe—Biegeversuch; Deutsche Fassung. Beuth Verlag: Berlin, Germany, 2021.
- DIN EN 6885; Mitnehmerverbindungen ohne Anzug, Passfedern, Nuten - Hohe Form. Beuth Verlag: Berlin, Germany, 2021.
- Dennig, H.-J.; Zumofen, L.; Kirchheim, A. Feasibility Investigation of Gears Manufactured by Fused Filament Fabrication. In Industrializing Additive Manufacturing; Meboldt, M., Klahn, C., Eds.; Springer International Publishing: Cham, Switzerland, 2021; pp. 304–320. ISBN 978-3-030-54333-4. [Google Scholar]
- EOS GmbH. Datenblatt ESO M290. Available online: https://www.eos.info/de/additive-fertigung/3d-druck-metall/eos-metall-systeme/eos-m-290 (accessed on 23 February 2022).
- Ramirez-Cedillo, E.; Sandoval-Robles, J.A.; Ruiz-Huerta, L.; Caballero-Ruiz, A.; Rodriguez, C.A.; Siller, H.R. Process planning guidelines in selective laser melting for the manufacturing of stainless steel parts. Procedia Manuf. 2018, 26, 973–982. [Google Scholar] [CrossRef]
- DIN EN ISO 898-1; Mechanische Eigenschaften von Verbindungselementen aus Kohlenstoffstahl und legiertem Stahl-Teil 1: Schrauben mit festgelegten Festigkeitsklassen-Regelgewinde und Feingewinde. Beuth Verlag: Berlin, Germany, 2013.
- DIN EN ISO 3506-1; Mechanische Verbindungselemente-Mechanische Eigenschaften von Verbindungselementen aus korrosionsbeständigen nichtrostenden Stählen-Teil 1: Schrauben mit festgelegten Stahlsorten und Festigkeitsklassen. Beuth Verlag: Berlin, Germany, 2020.
- DIN 3990-3; Tragfähigkeitsberechnung von Stirnrädern; Berechnung der Zahnfußtragfähigkeit. Beuth Verlag: Berlin, Germany, 1987.
- DIN 3990-1; Tragfähigkeitsberechnung von Stirnrädern; Einführung und Allgemeine Einflußfaktoren. Beuth Verlag: Berlin, Germany, 1987.
- Bas, E. Einführung in Wahrscheinlichkeitsrechnung, Statistik und Stochastische Prozesse; Springer Fachmedien Wiesbaden: Wiesbaden, Germany, 2020; ISBN 978-3-658-32119-2. [Google Scholar]
- Brüggemann, H.; Bremer, P. Grundlagen Qualitätsmanagement; Springer Fachmedien Wiesbaden: Wiesbaden, Germany, 2020; ISBN 978-3-658-28779-5. [Google Scholar]
- Dietrich, E.; Conrad, S. Statistische Verfahren zur Maschinen- und Prozessqualifikation, 8., aktualisierte Auflage; Carl Hanser Verlag: München, Germany, 2022; ISBN 978-3-446-46504-6. [Google Scholar]
- Huber, F.; Meyer, F.; Lenzen, M. Auswertung von Experimenten mittels Varianzanalyse. In Grundlagen der Varianzanalyse; Huber, F., Meyer, F., Lenzen, M., Eds.; Springer Fachmedien Wiesbaden: Wiesbaden, Germany, 2014; pp. 43–88. ISBN 978-3-658-05665-0. [Google Scholar]
- Blanca, M.J.; Alarcón, R.; Arnau, J.; Bono, R.; Bendayan, R. Non-normal data: Is ANOVA still a valid option? Psicothema 2017, 29, 552–557. [Google Scholar] [CrossRef]
- Glass, G.V.; Peckham, P.D.; Sanders, J.R. Consequences of Failure to Meet Assumptions Underlying the Fixed Effects Analyses of Variance and Covariance. Rev. Educ. Res. 1972, 42, 237–288. [Google Scholar] [CrossRef]
- Harwell, M.R.; Rubinstein, E.N.; Hayes, W.S.; Olds, C.C. Summarizing Monte Carlo Results in Methodological Research: The One- and Two-Factor Fixed Effects ANOVA Cases. J. Educ. Stat. 1992, 17, 315–339. [Google Scholar] [CrossRef]
- Hirschauer, N.; Grüner, S.; Mußhoff, O. Fundamentals of Statistical Inference; Springer International Publishing: Cham, Switzerland, 2022; ISBN 978-3-030-99090-9. [Google Scholar]
- Du Plessis, A.; Yadroitsev, I.; Yadroitsava, I.; Le Roux, S.G. X-Ray Microcomputed Tomography in Additive Manufacturing: A Review of the Current Technology and Applications. 3D Print. Addit. Manuf. 2018, 5, 227–247. [Google Scholar] [CrossRef]
- Wilson-Heid, A.E.; Novak, T.C.; Beese, A.M. Characterization of the Effects of Internal Pores on Tensile Properties of Additively Manufactured Austenitic Stainless Steel 316L. Exp. Mech. 2019, 59, 793–804. [Google Scholar] [CrossRef]
- Liverani, E.; Toschi, S.; Ceschini, L.; Fortunato, A. Effect of selective laser melting (SLM) process parameters on microstructure and mechanical properties of 316L austenitic stainless steel. J. Mater. Process. Technol. 2017, 249, 255–263. [Google Scholar] [CrossRef]
- El-Tahawy, M.; Jenei, P.; Kolonits, T.; Han, G.; Park, H.; Choe, H.; Gubicza, J. Different Evolutions of the Microstructure, Texture, and Mechanical Performance During Tension and Compression of 316L Stainless Steel. Met. Mater Trans A 2020, 51, 3447–3460. [Google Scholar] [CrossRef]
- Schmidt, C. Konstruktive Randbedingungen bei Anwendung des WAAM-Verfahrens. In Konstruktion für Die Additive Fertigung 2019; Lachmayer, R., Rettschlag, K., Kaierle, S., Eds.; Springer Berlin Heidelberg: Berlin/Heidelberg, Germany, 2020; pp. 204–222. ISBN 978-3-662-61148-7. [Google Scholar]
- Vora, J.; Parmar, H.; Chaudhari, R.; Khanna, S.; Doshi, M.; Patel, V. Experimental investigations on mechanical properties of multi-layered structure fabricated by GMAW-based WAAM of SS316L. J. Mater. Res. Technol. 2022, 20, 2748–2757. [Google Scholar] [CrossRef]
- Barkia, B.; Aubry, P.; Haghi-Ashtiani, P.; Auger, T.; Gosmain, L.; Schuster, F.; Maskrot, H. On the origin of the high tensile strength and ductility of additively manufactured 316L stainless steel: Multiscale investigation. J. Mater. Sci. Technol. 2020, 41, 209–218. [Google Scholar] [CrossRef]
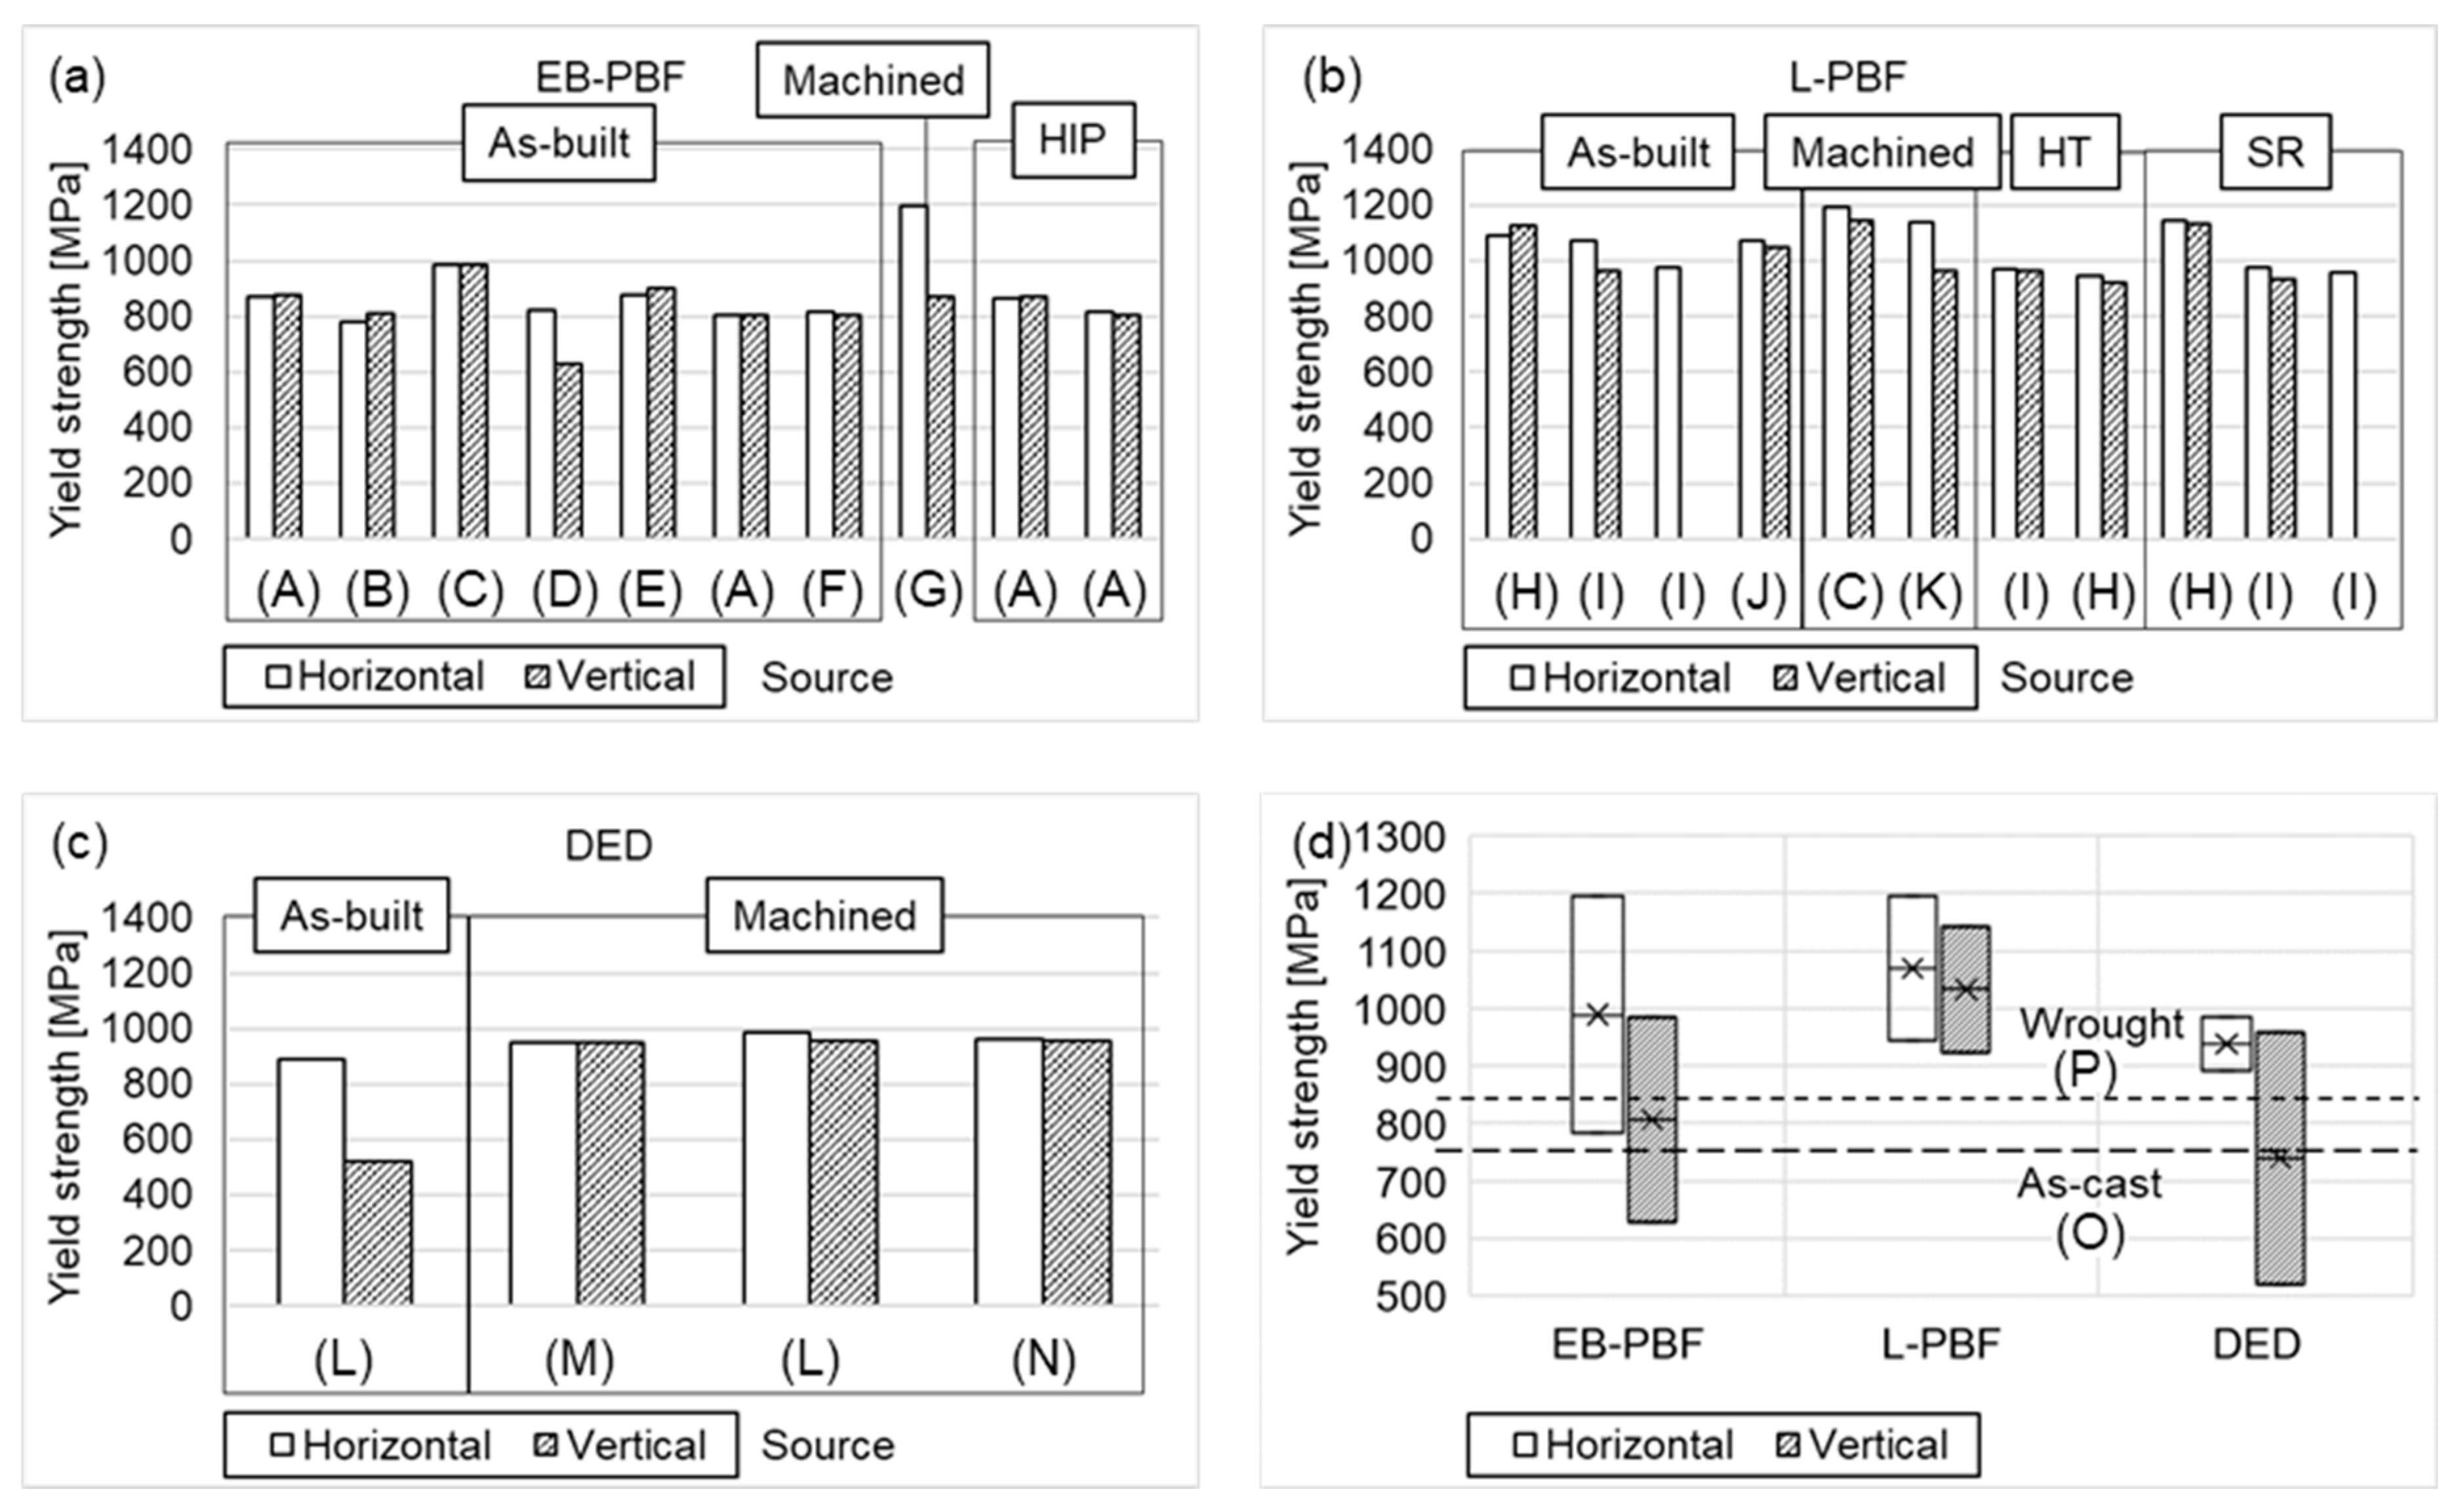
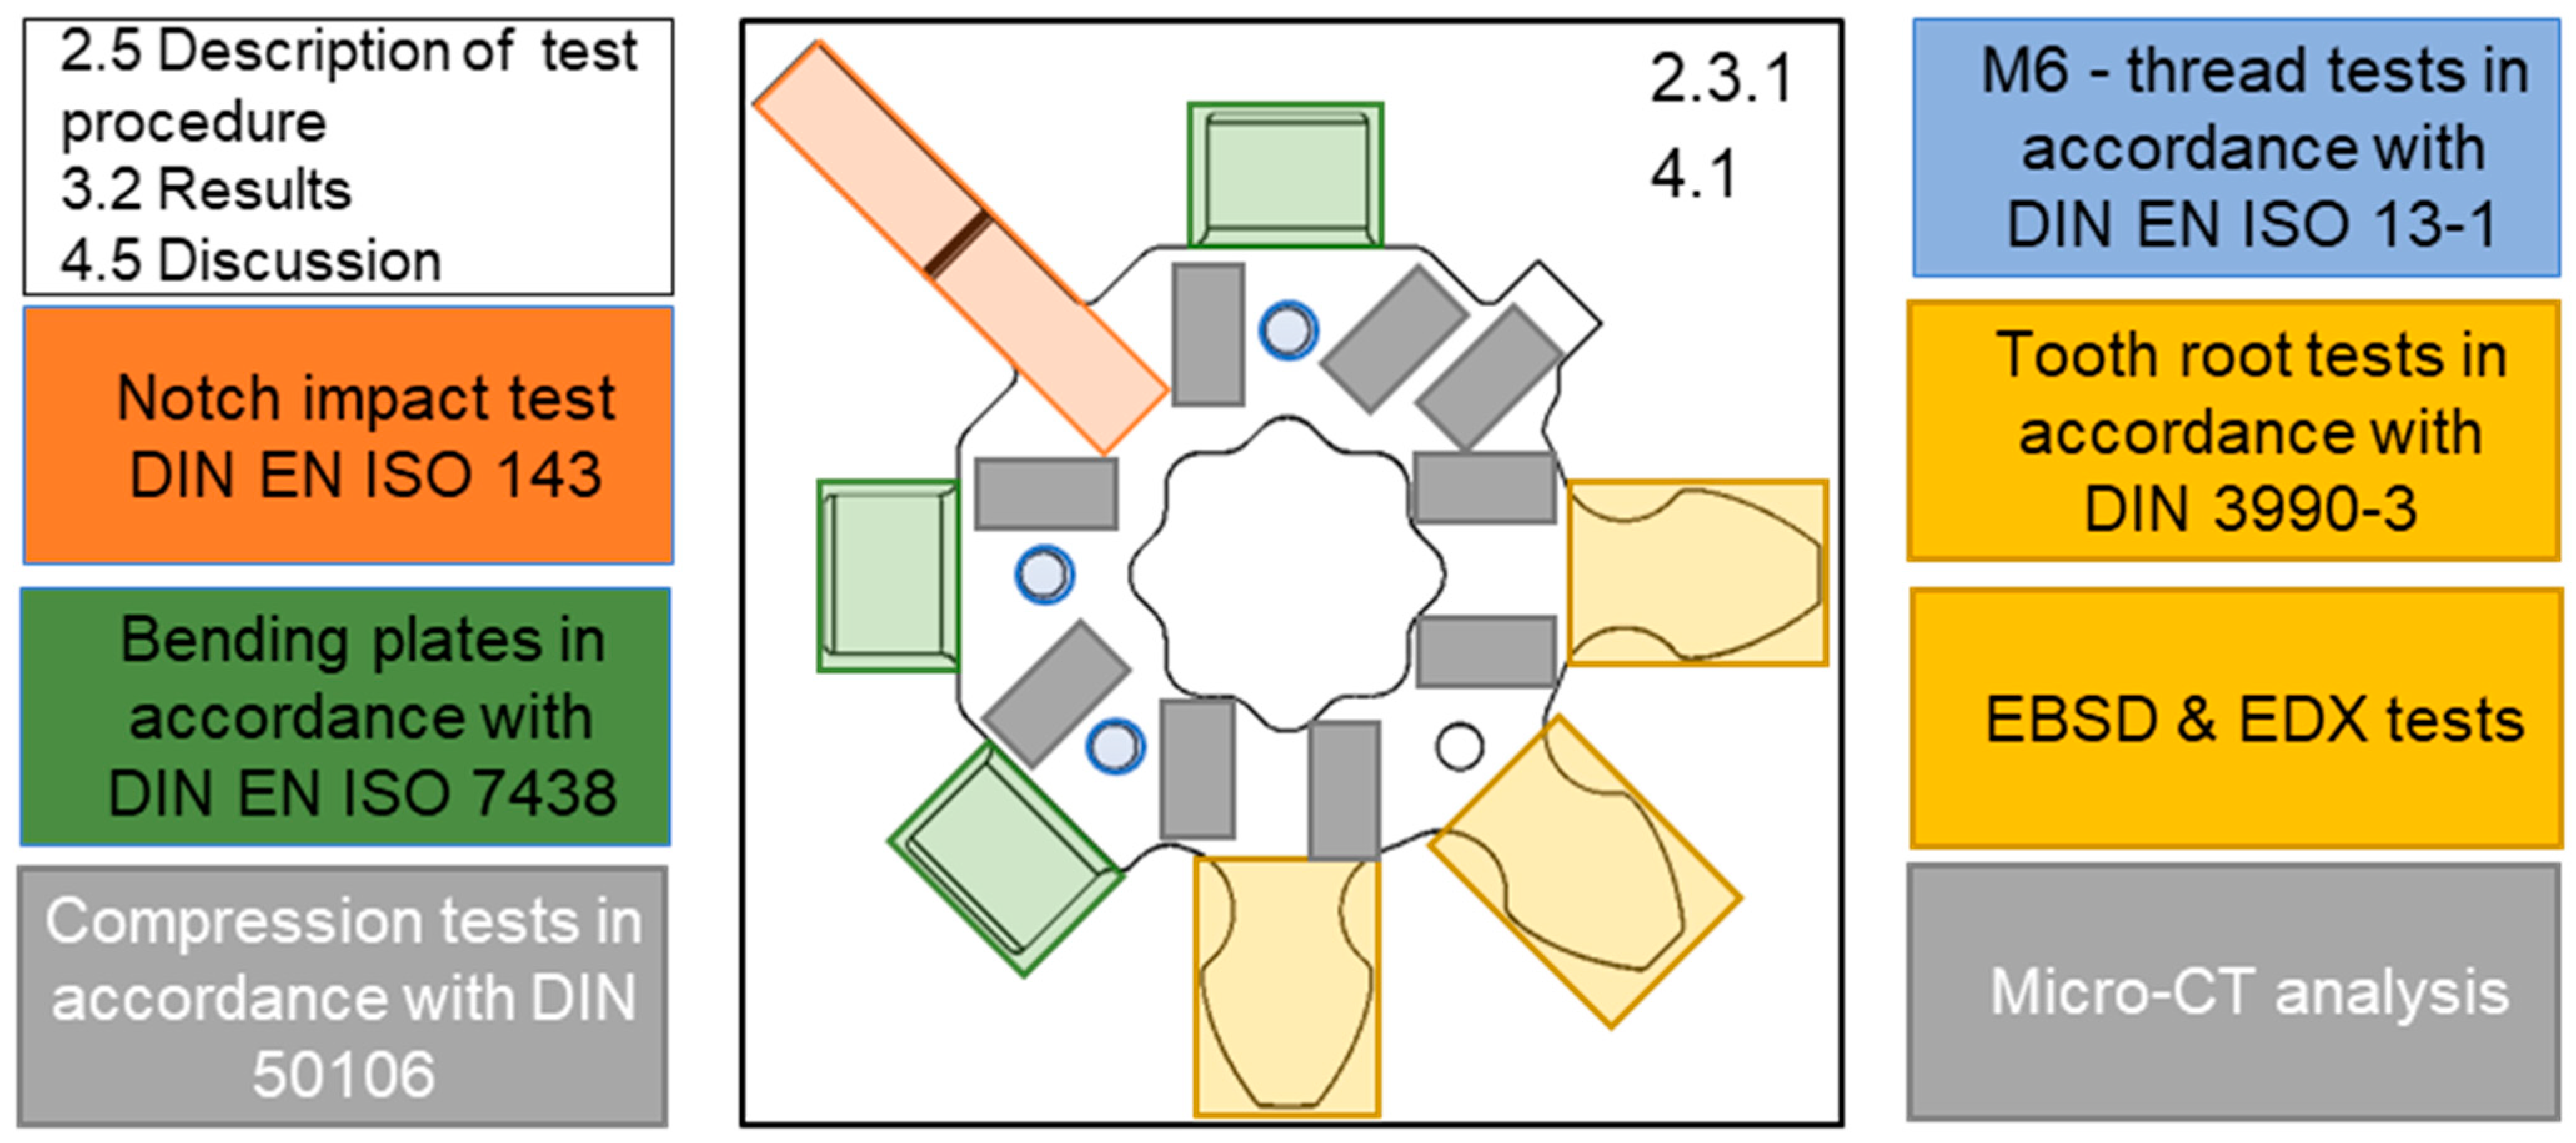
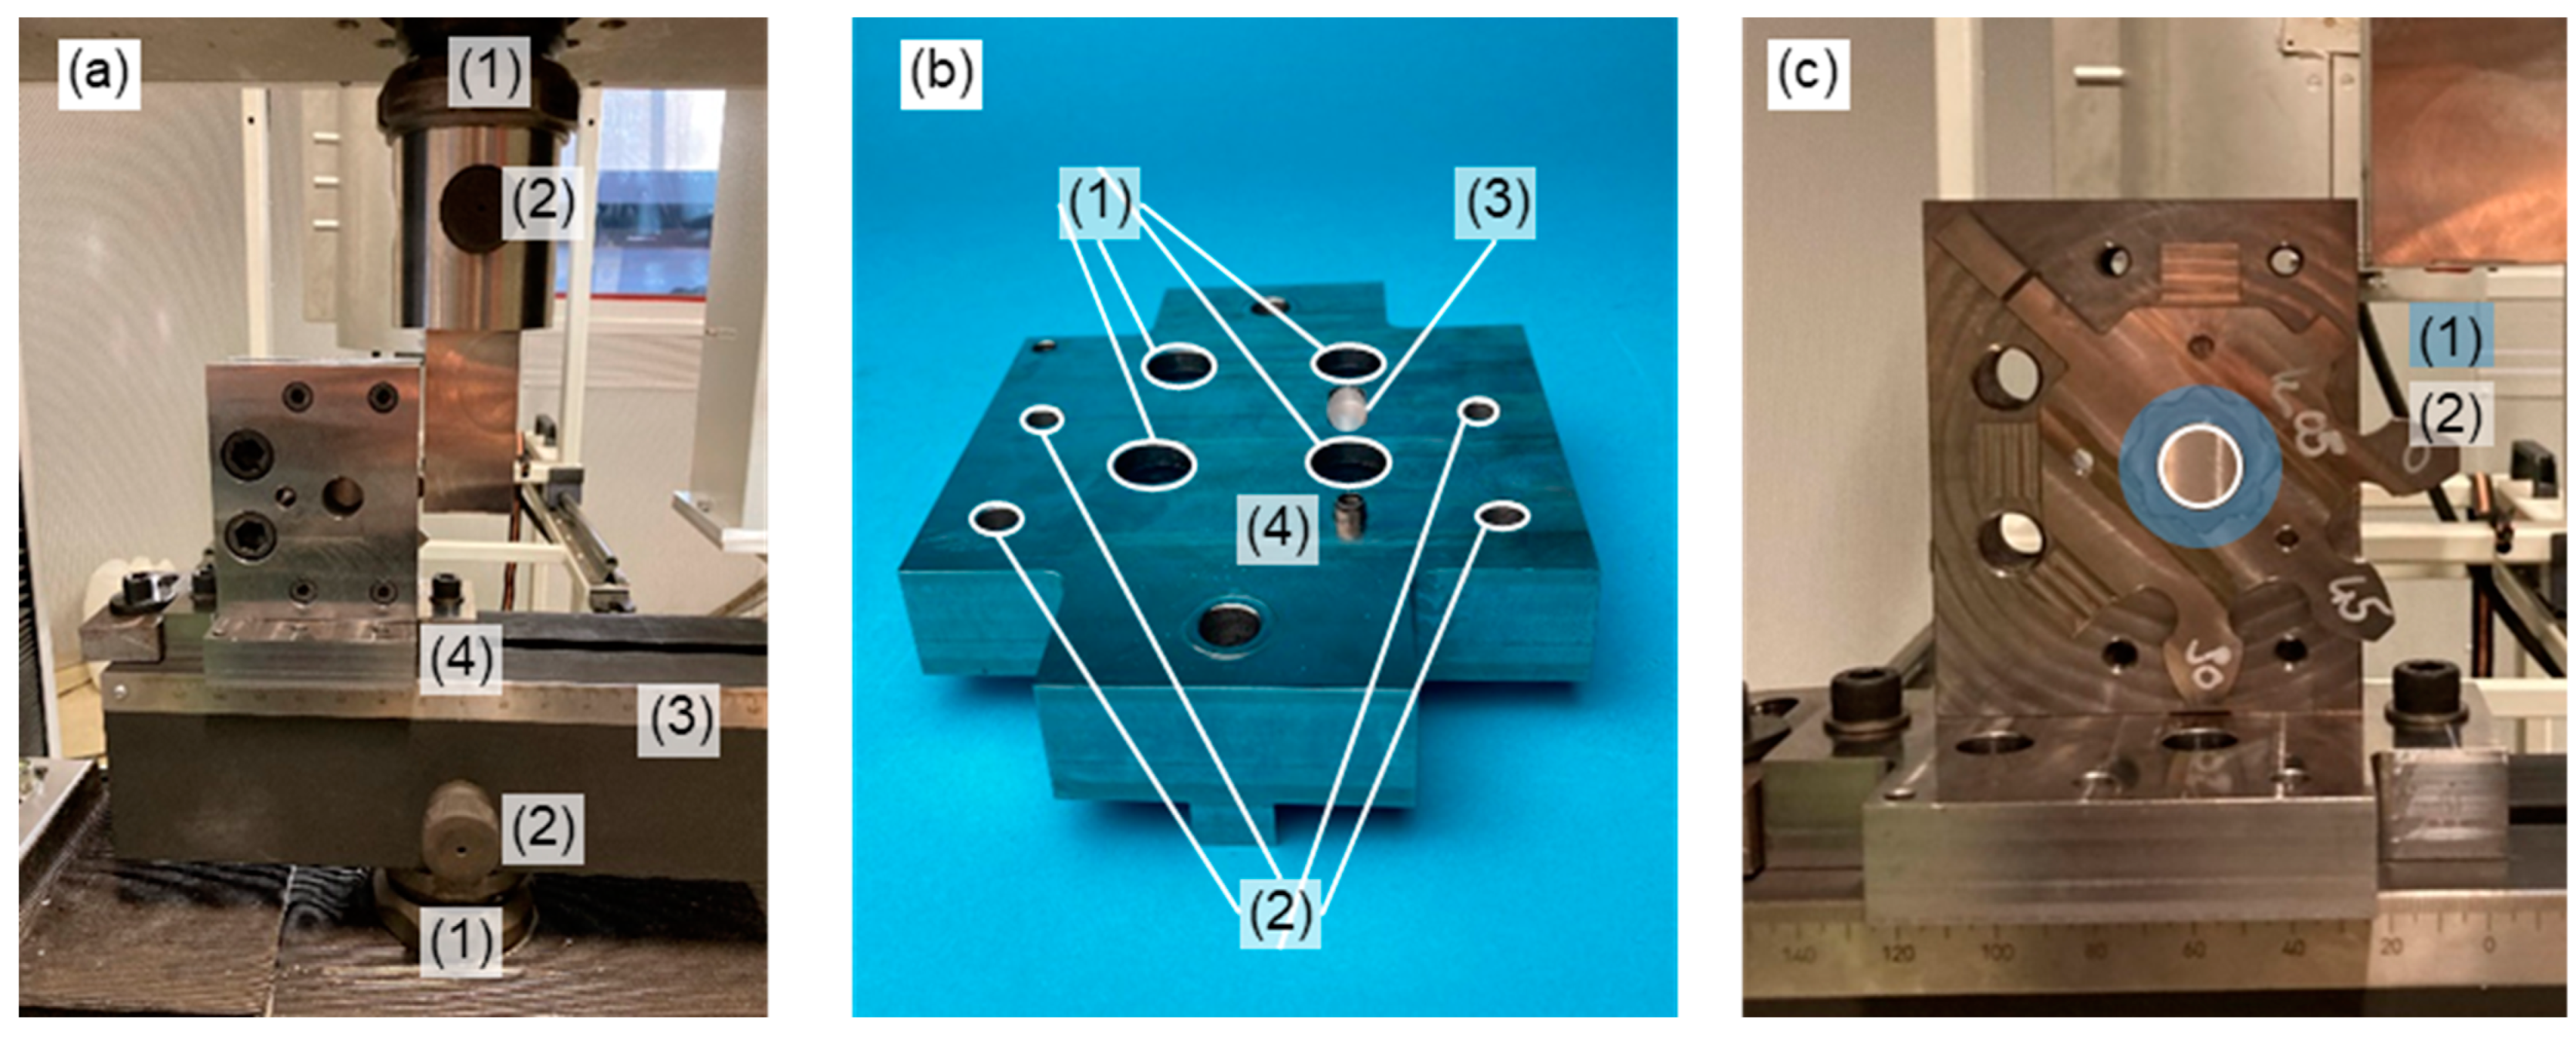
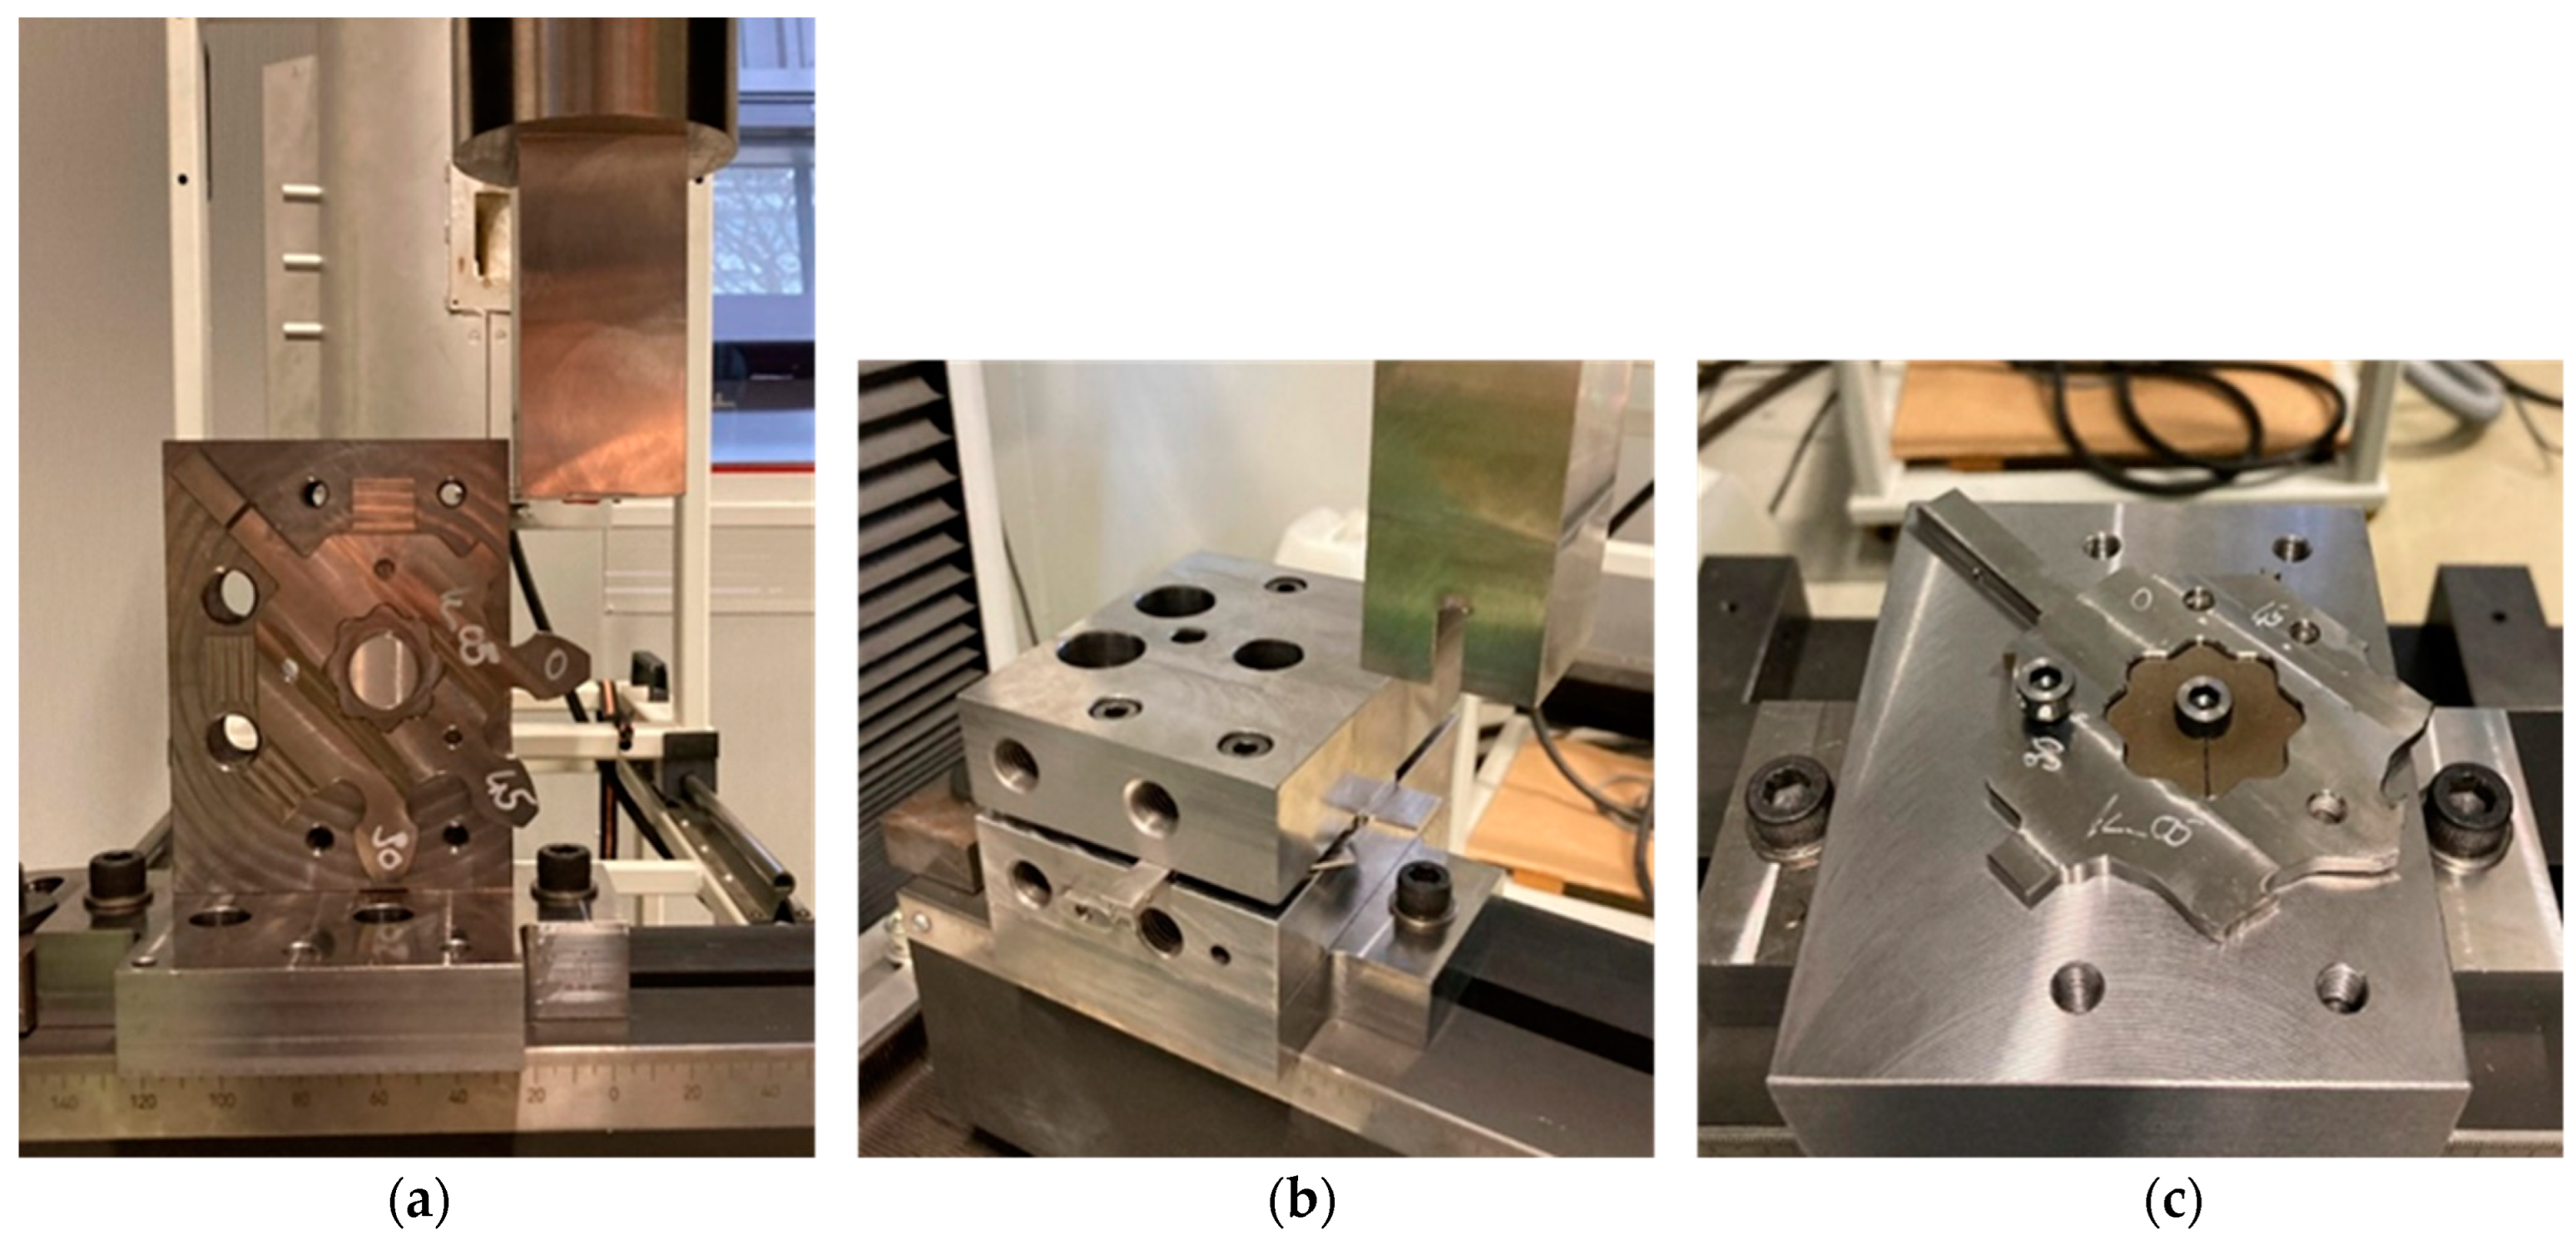
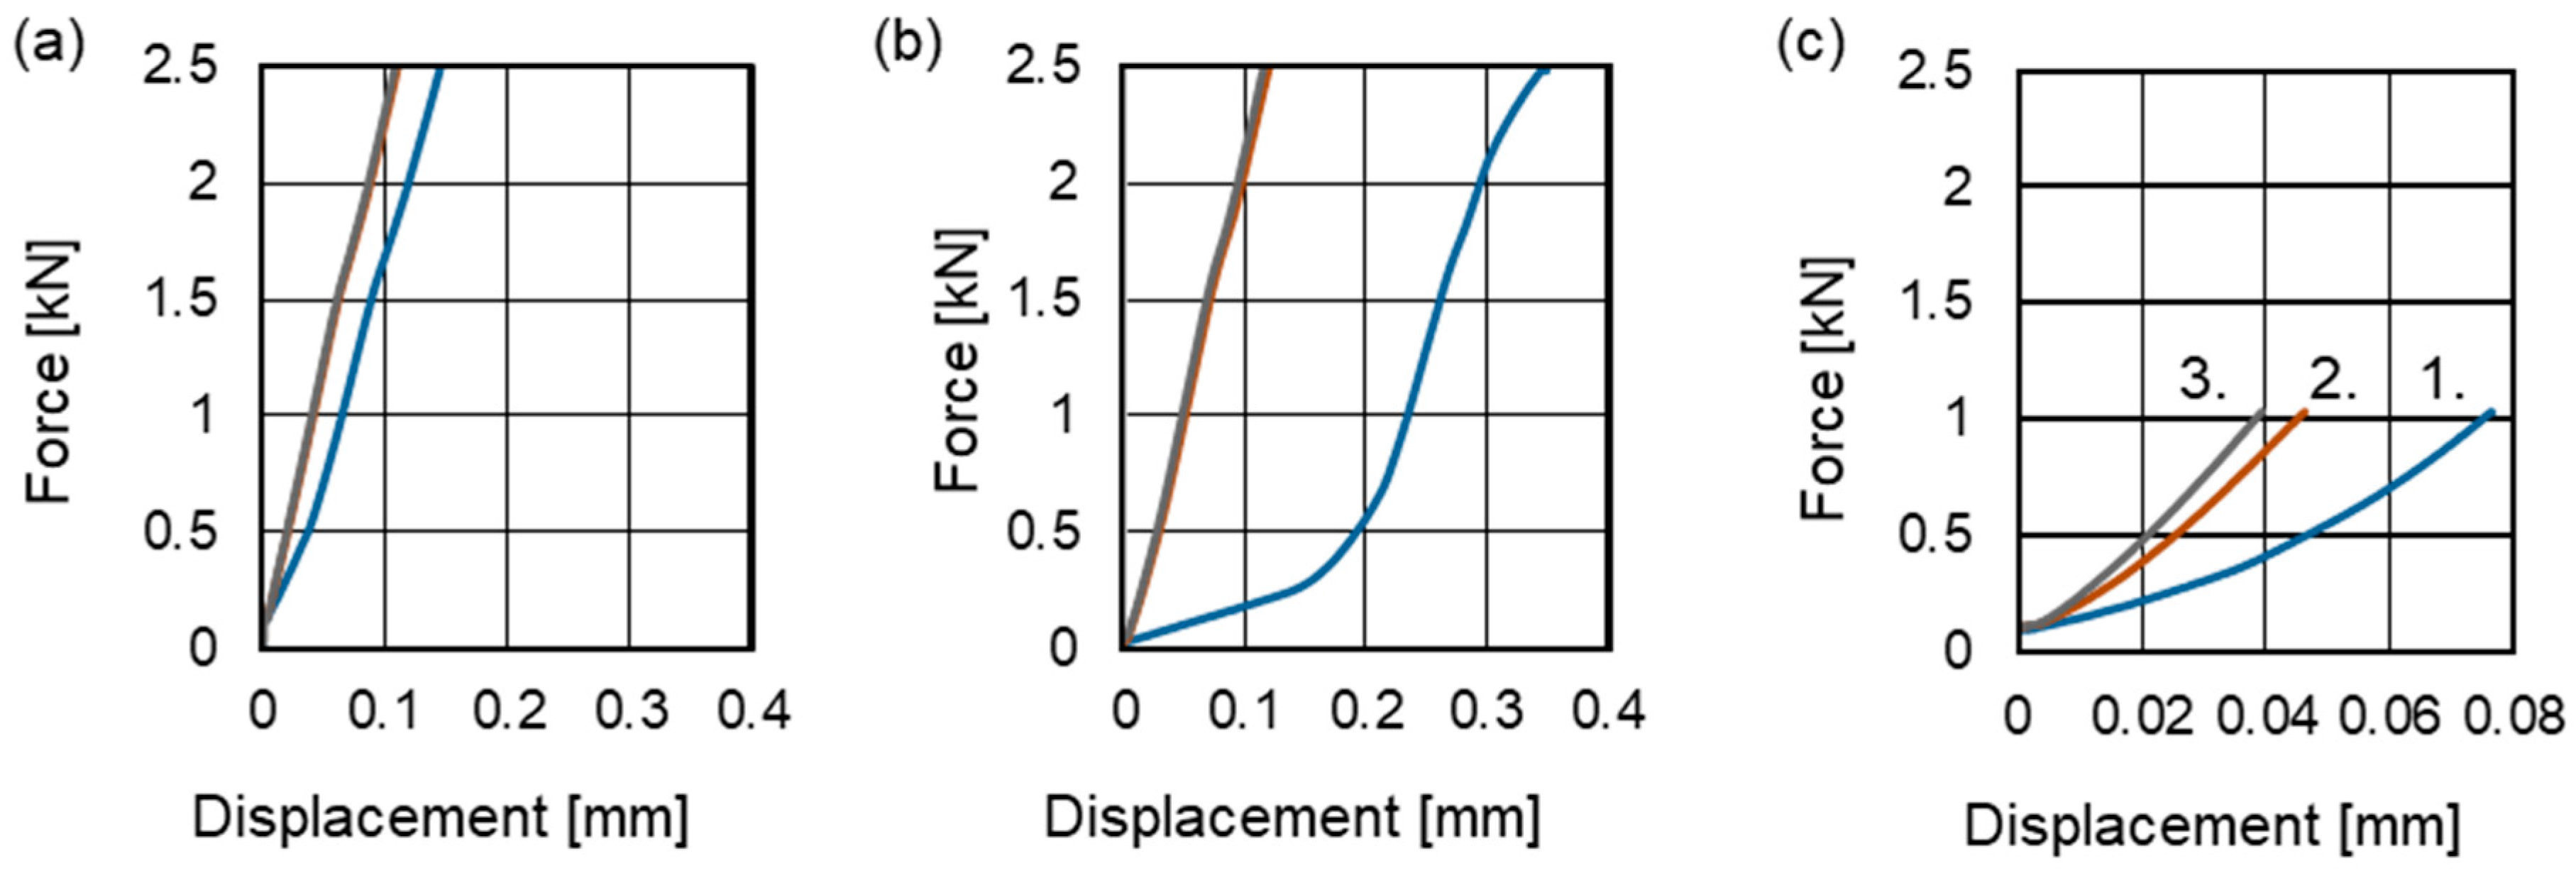
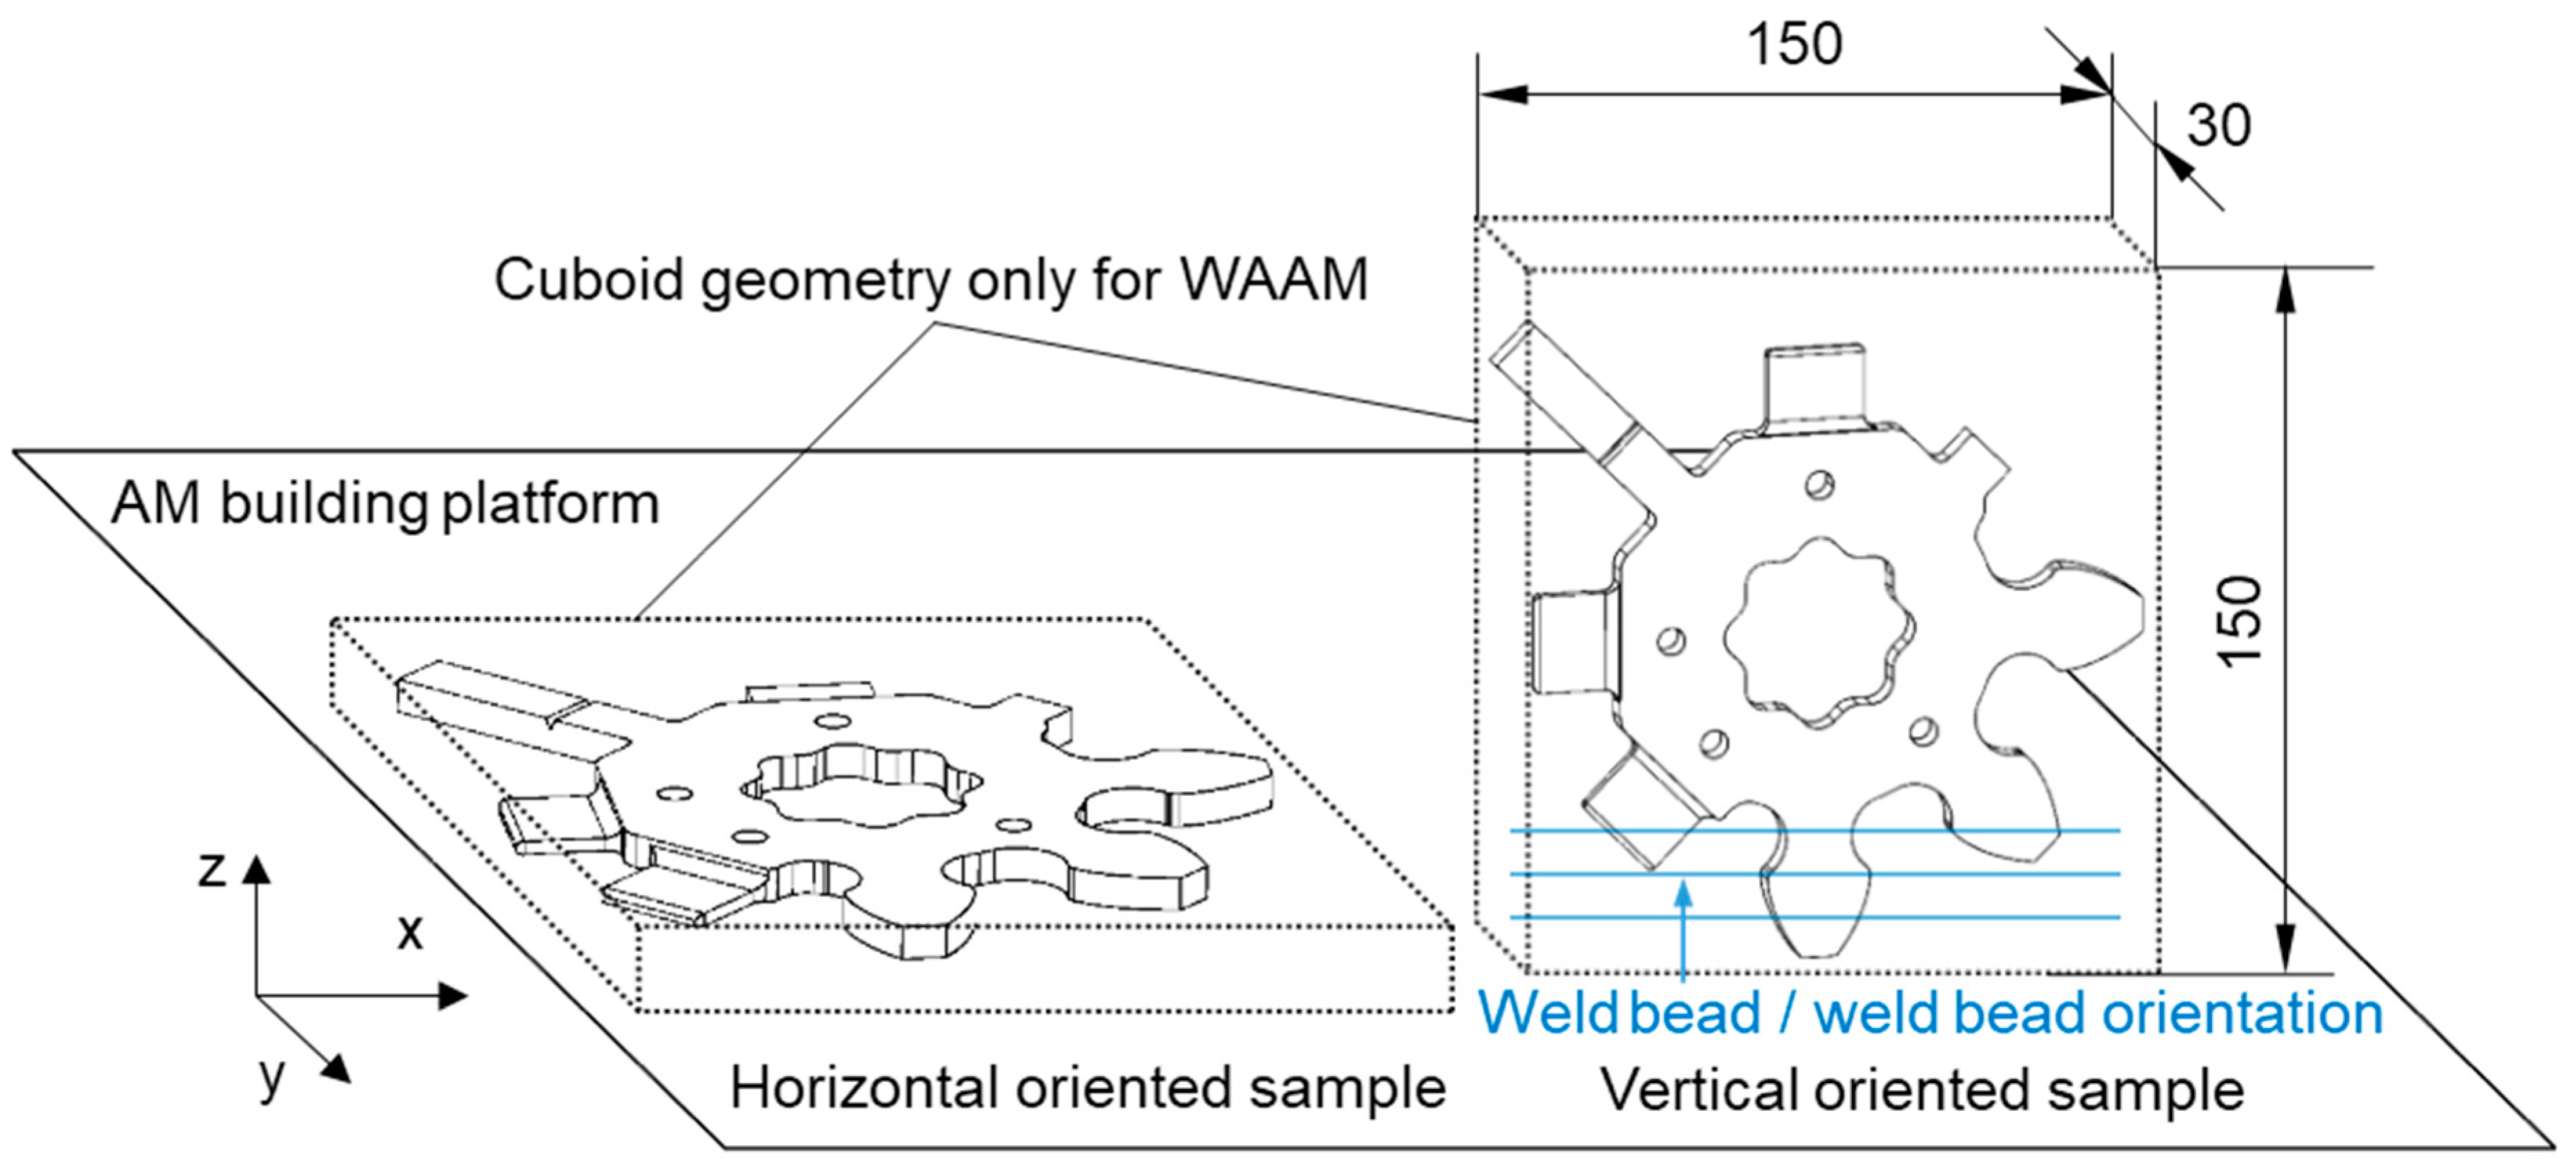
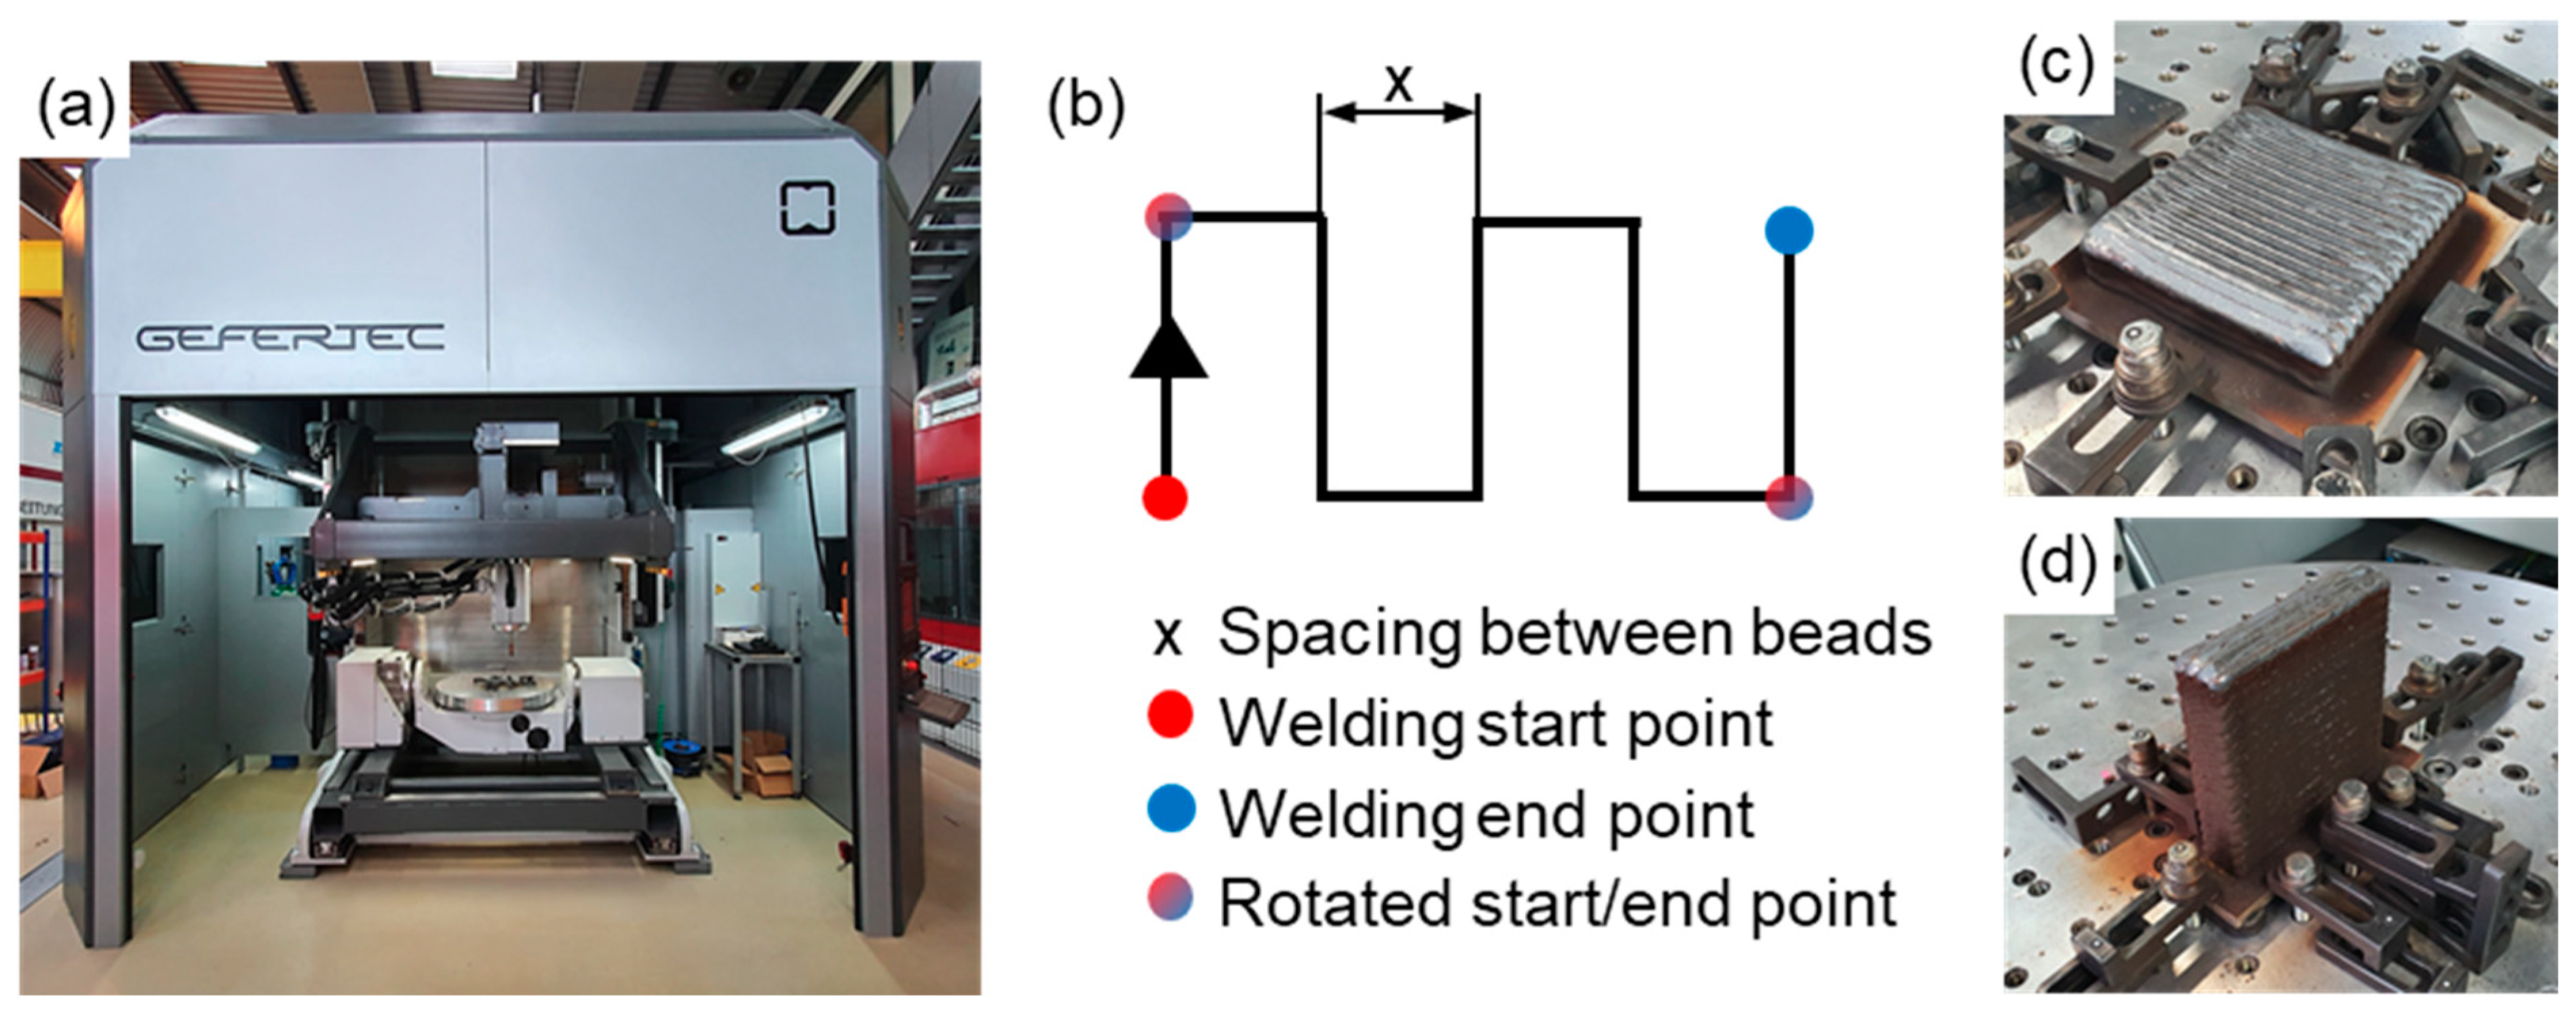
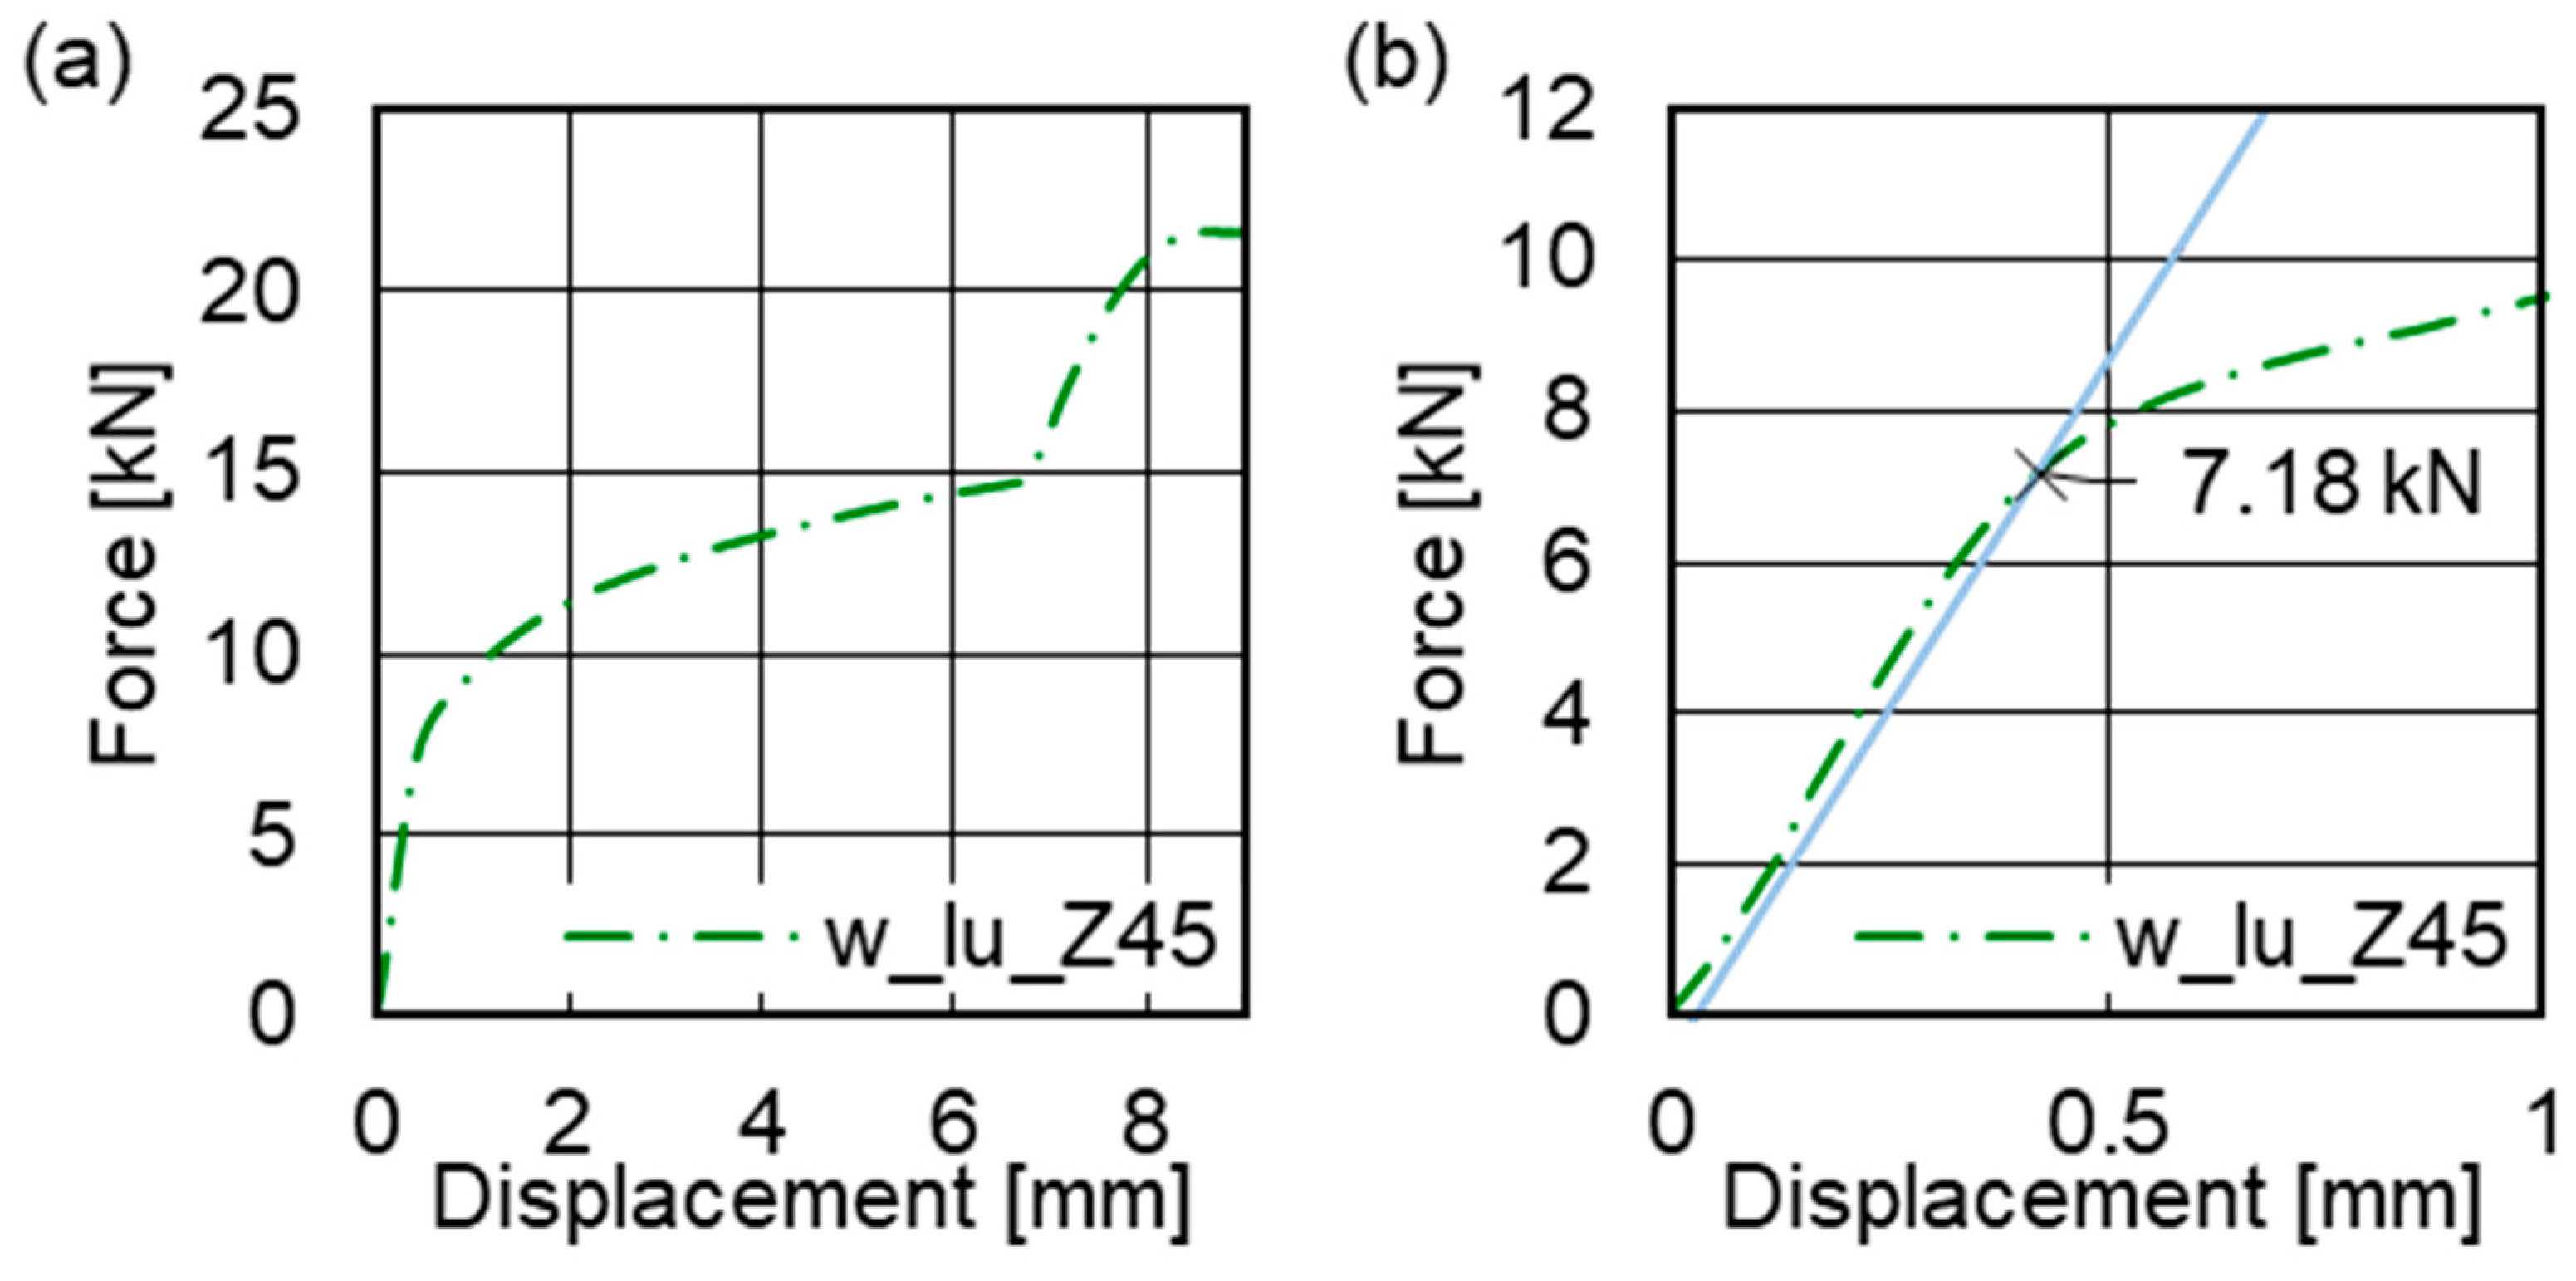
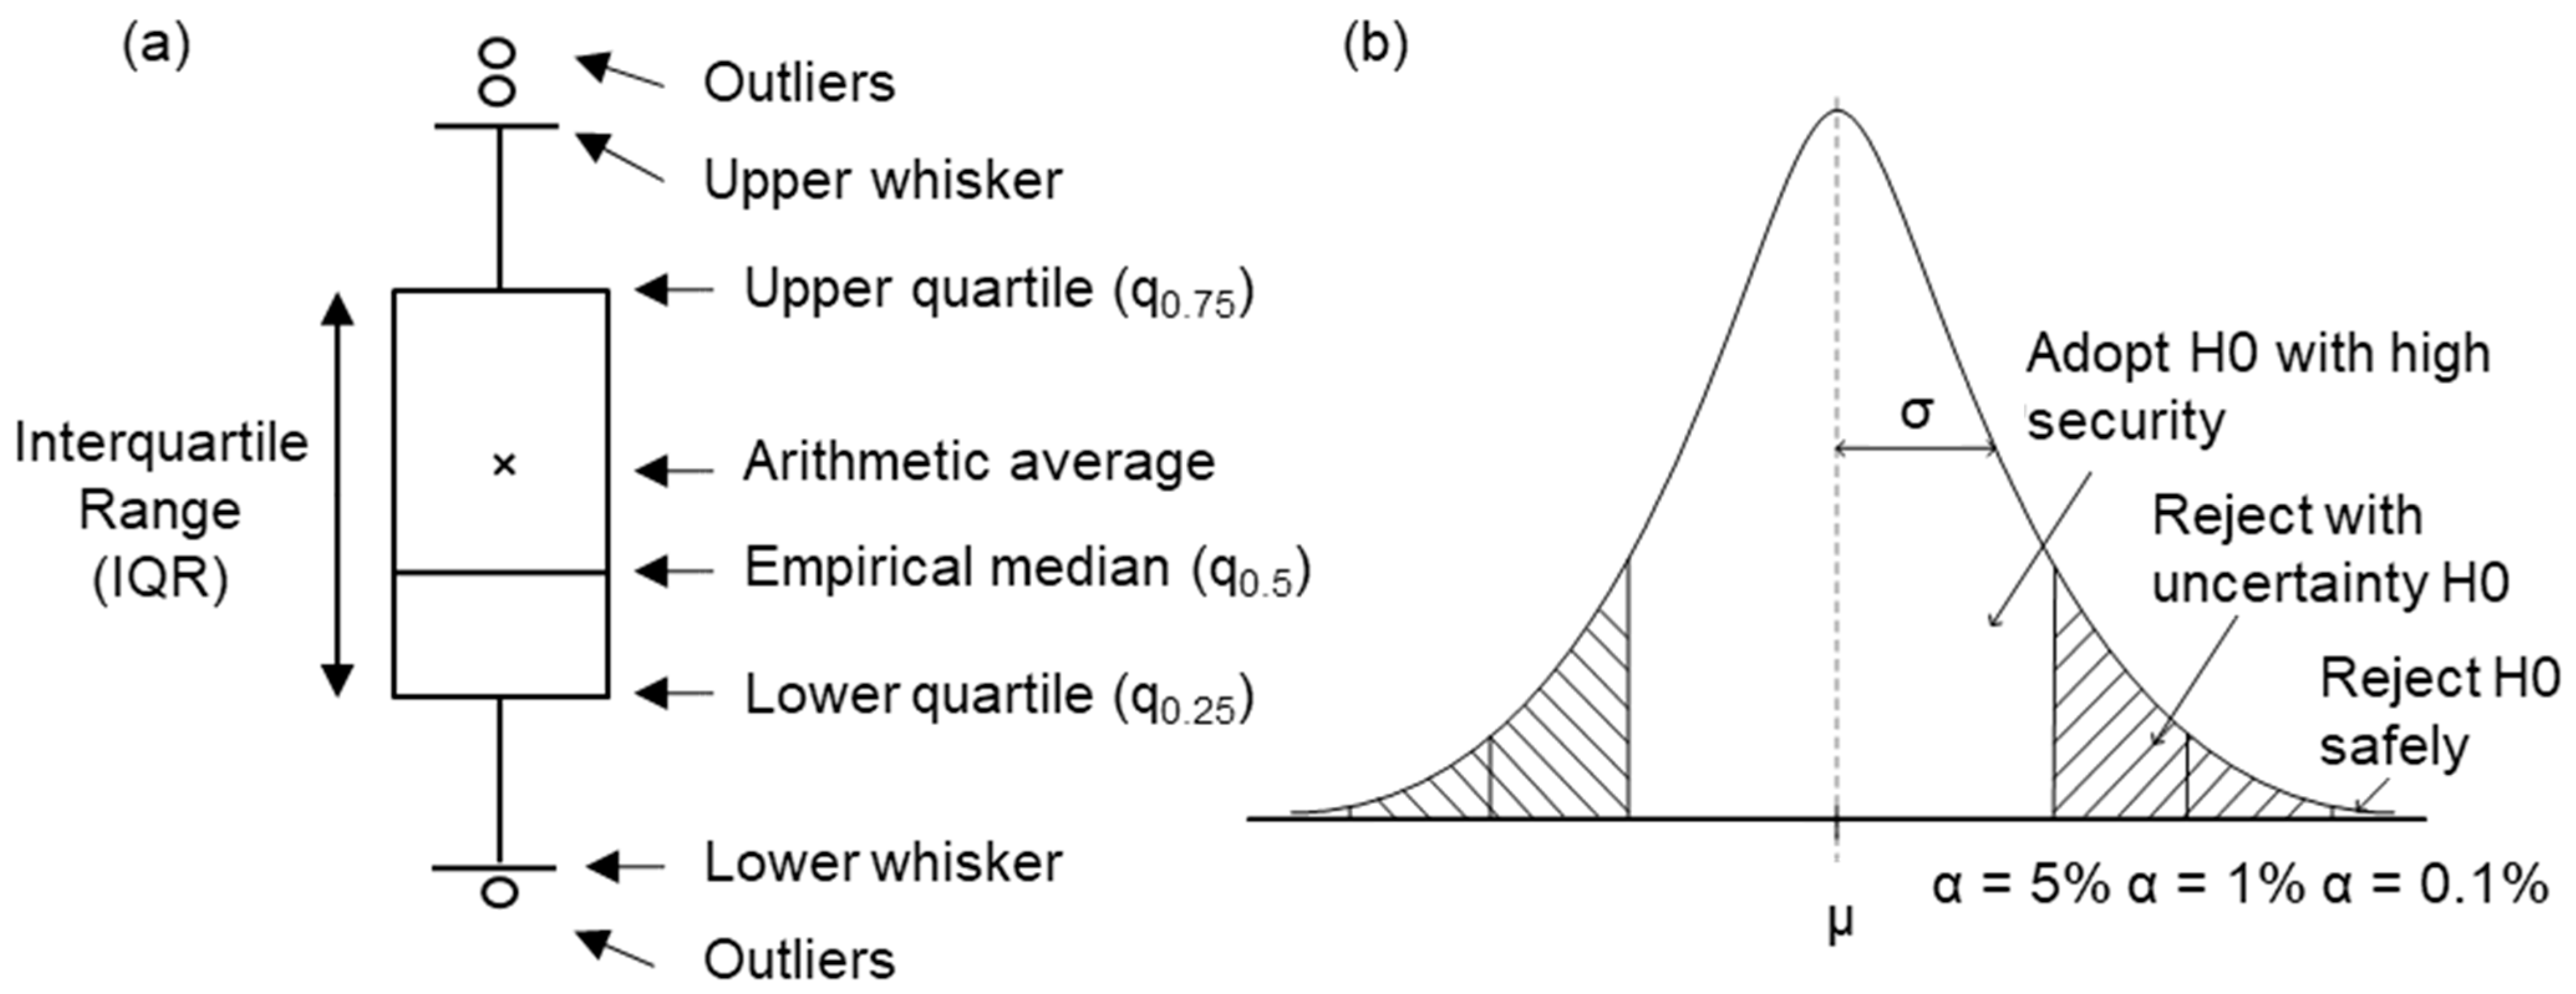
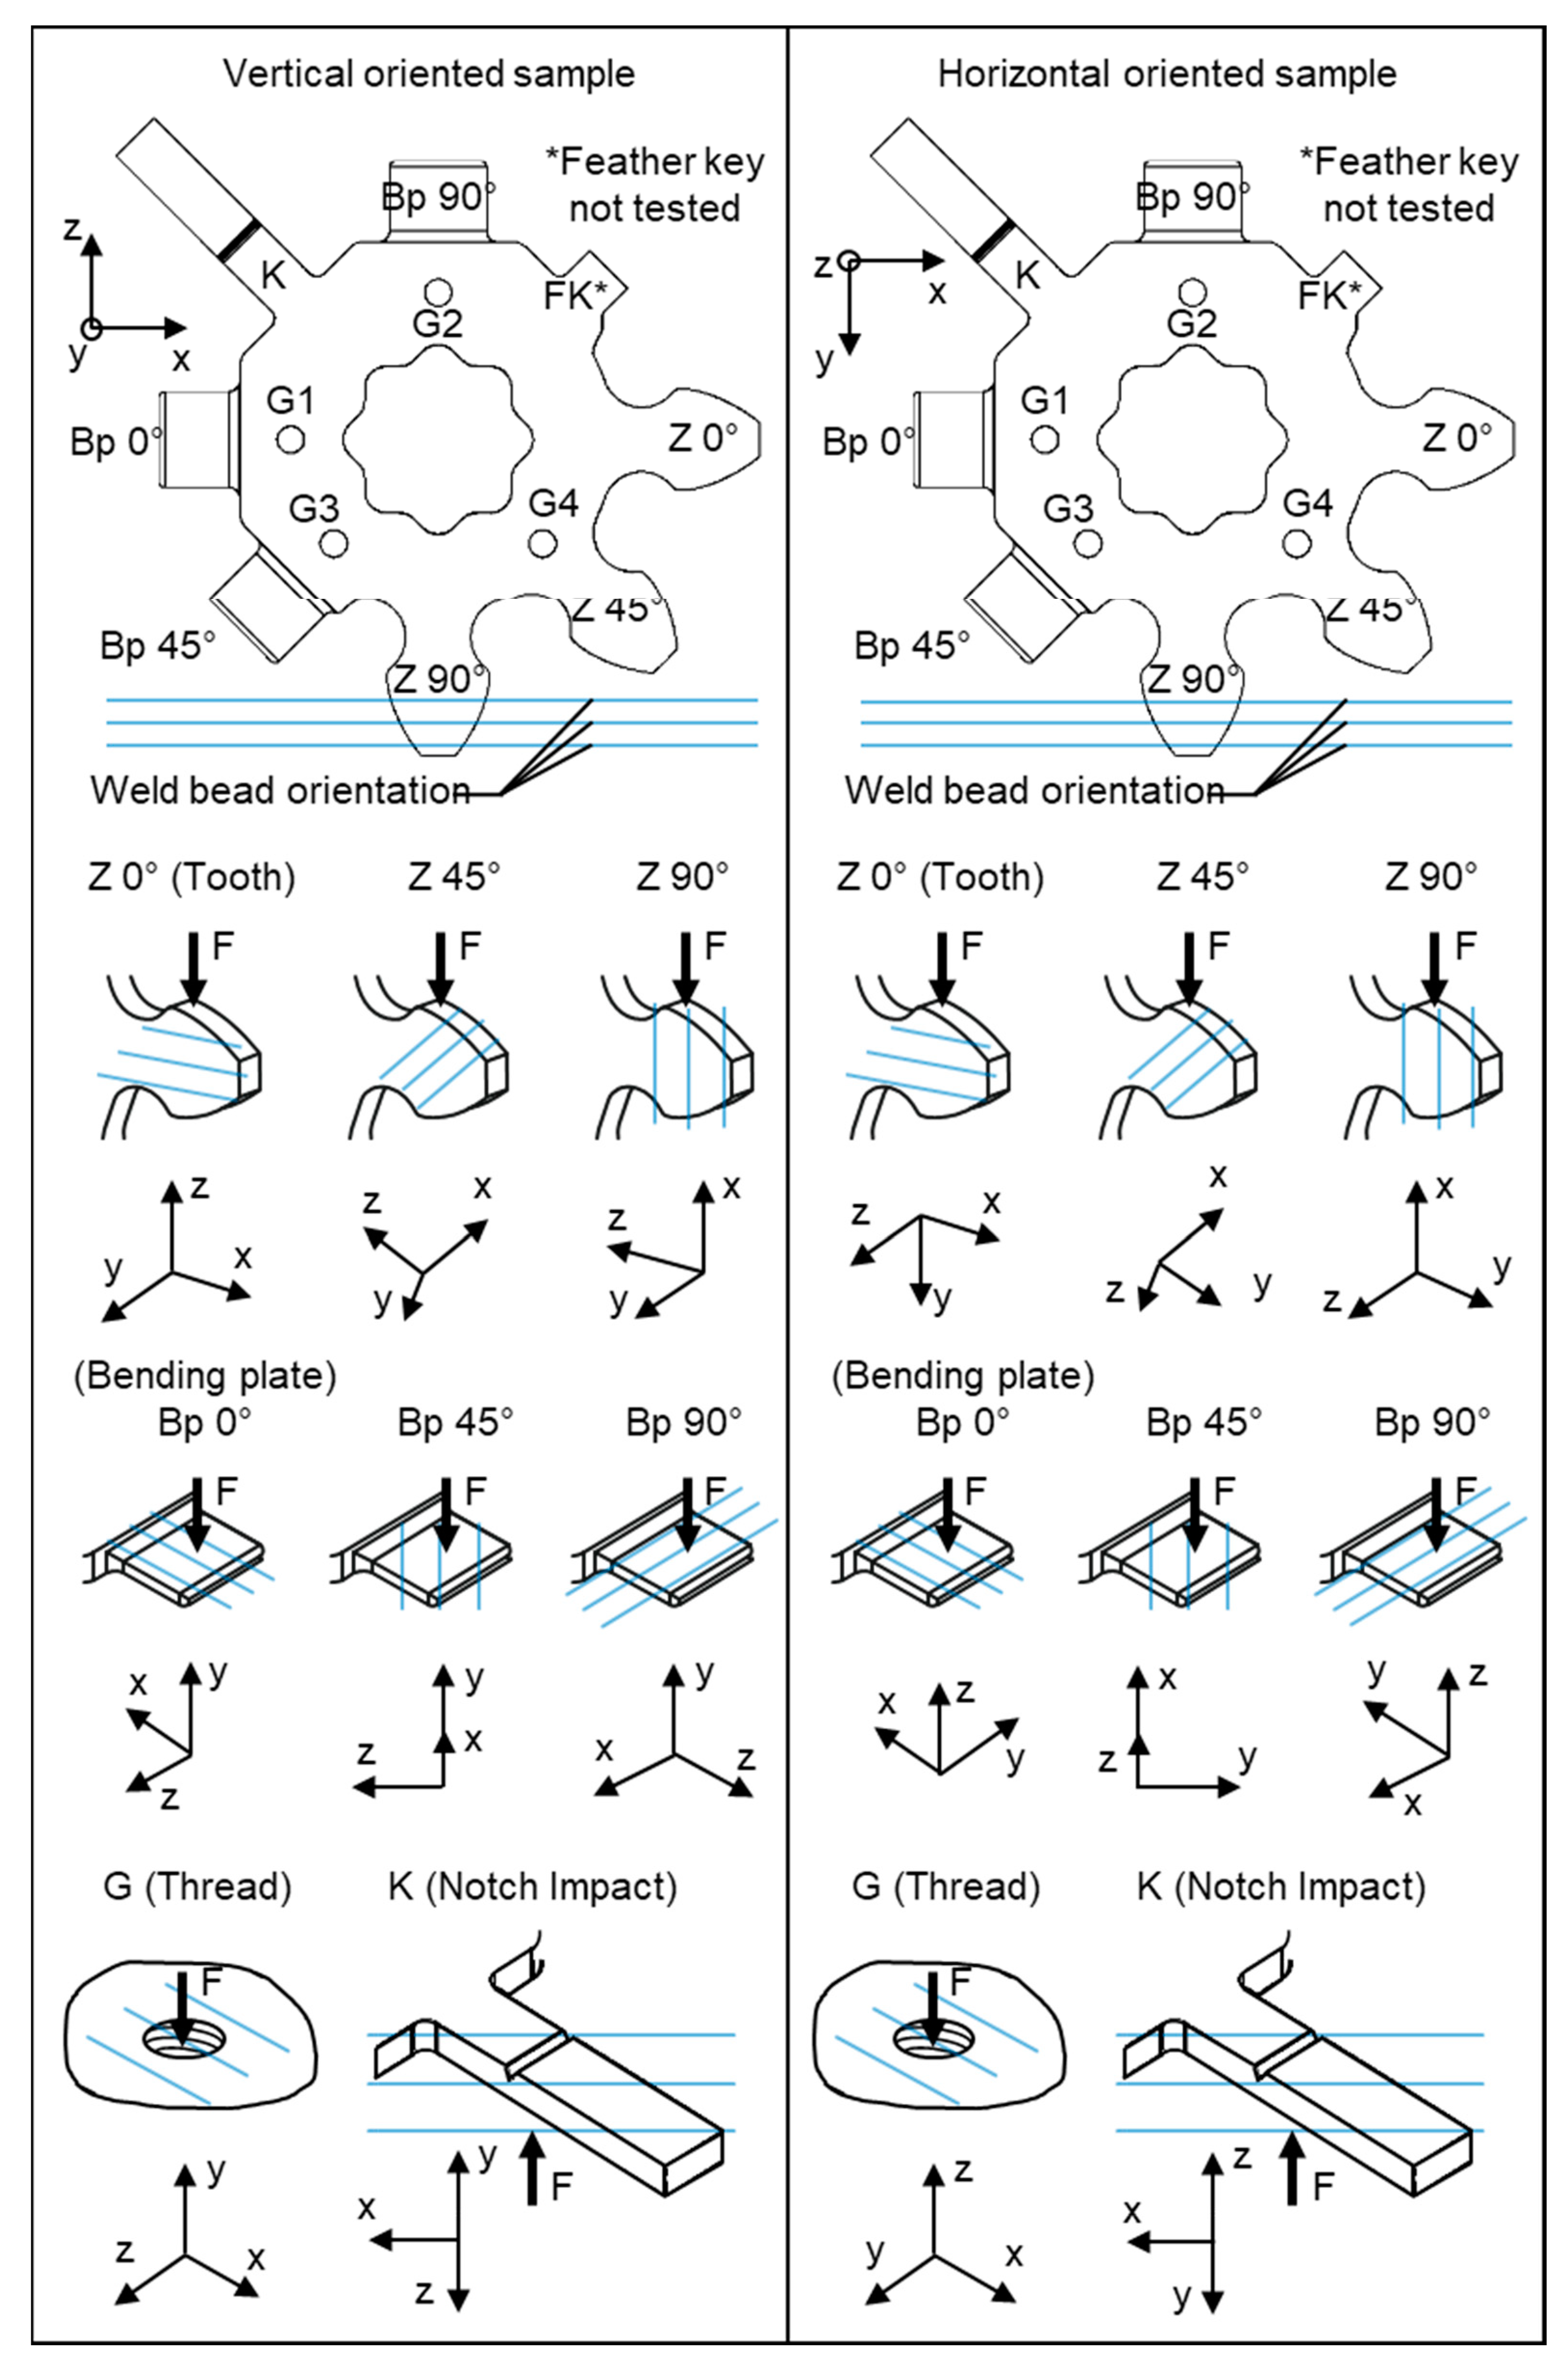
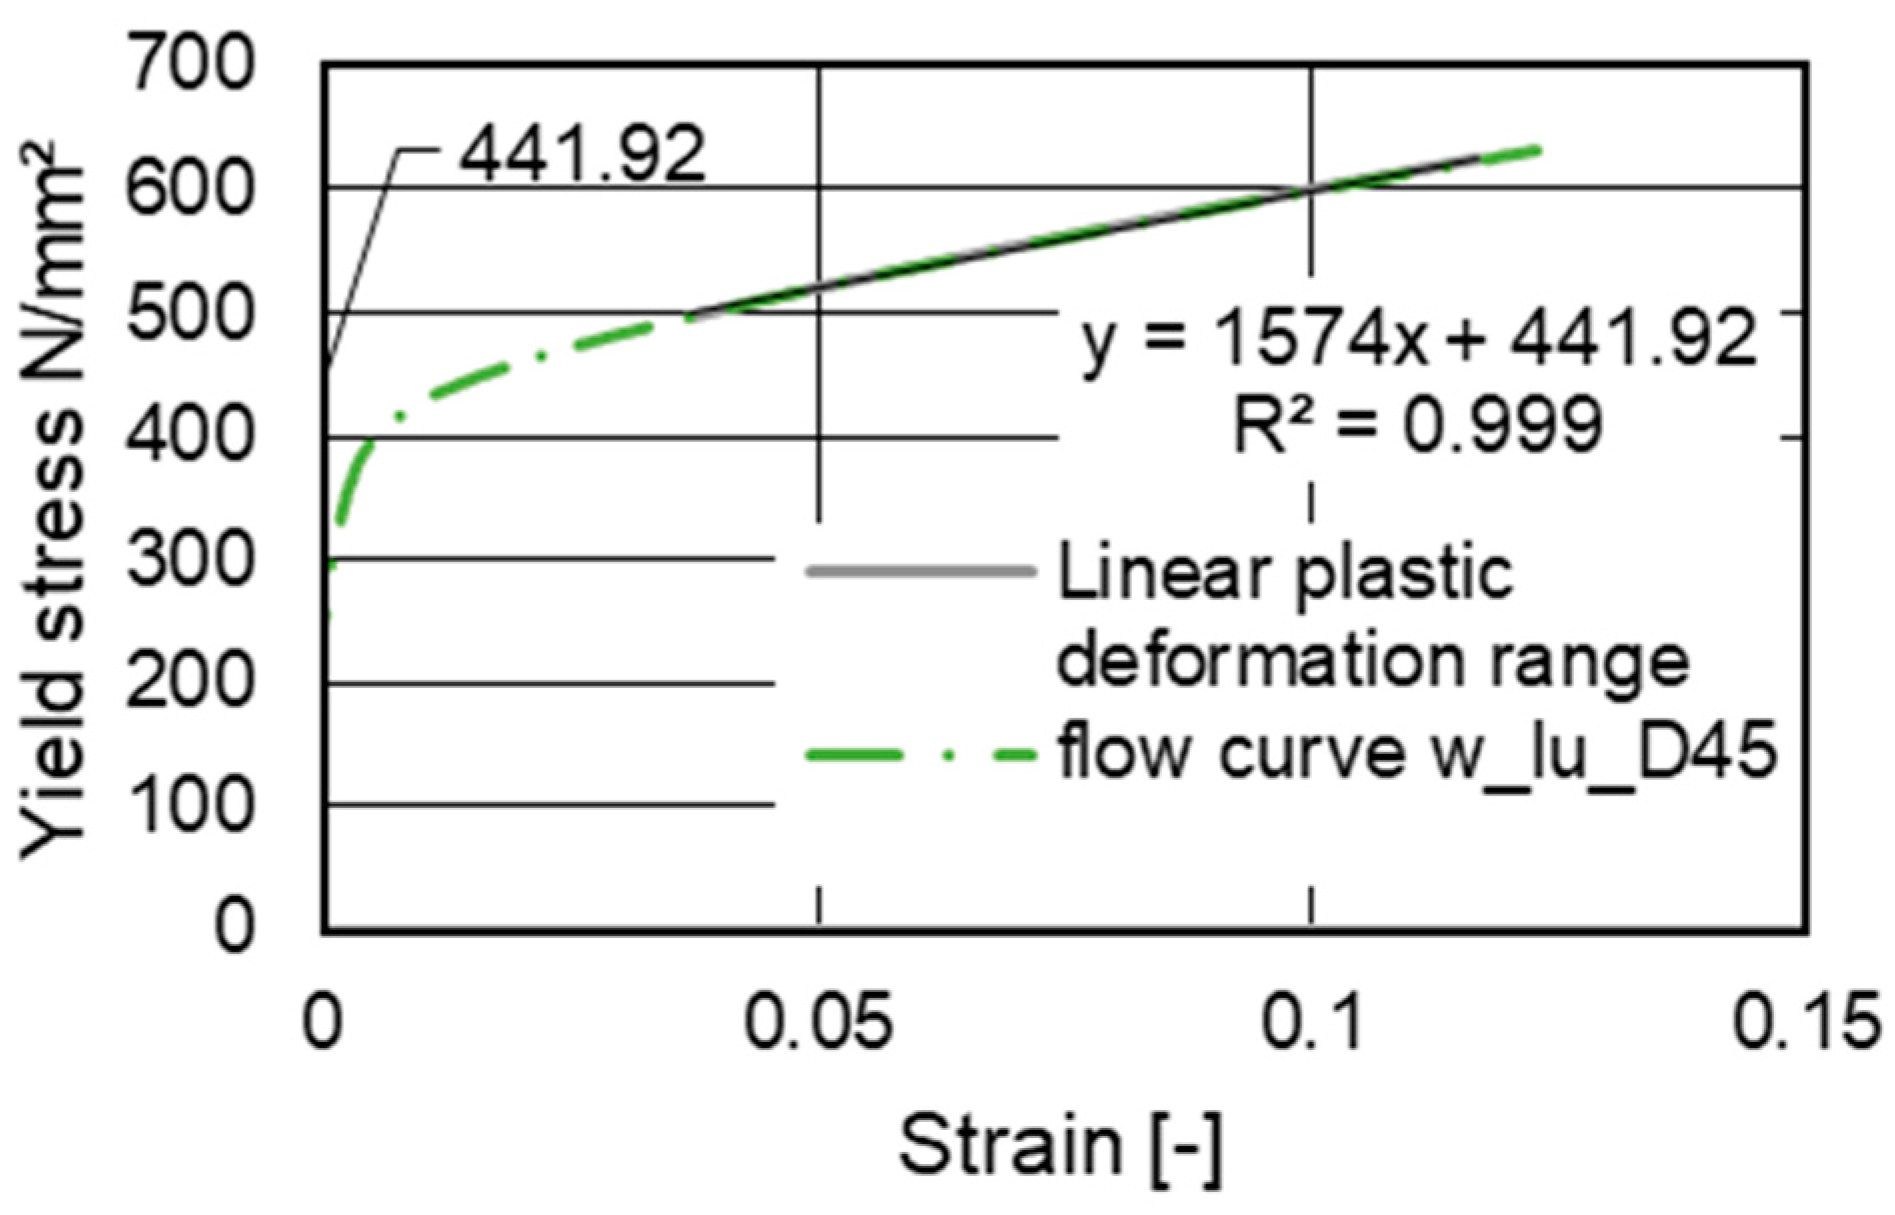
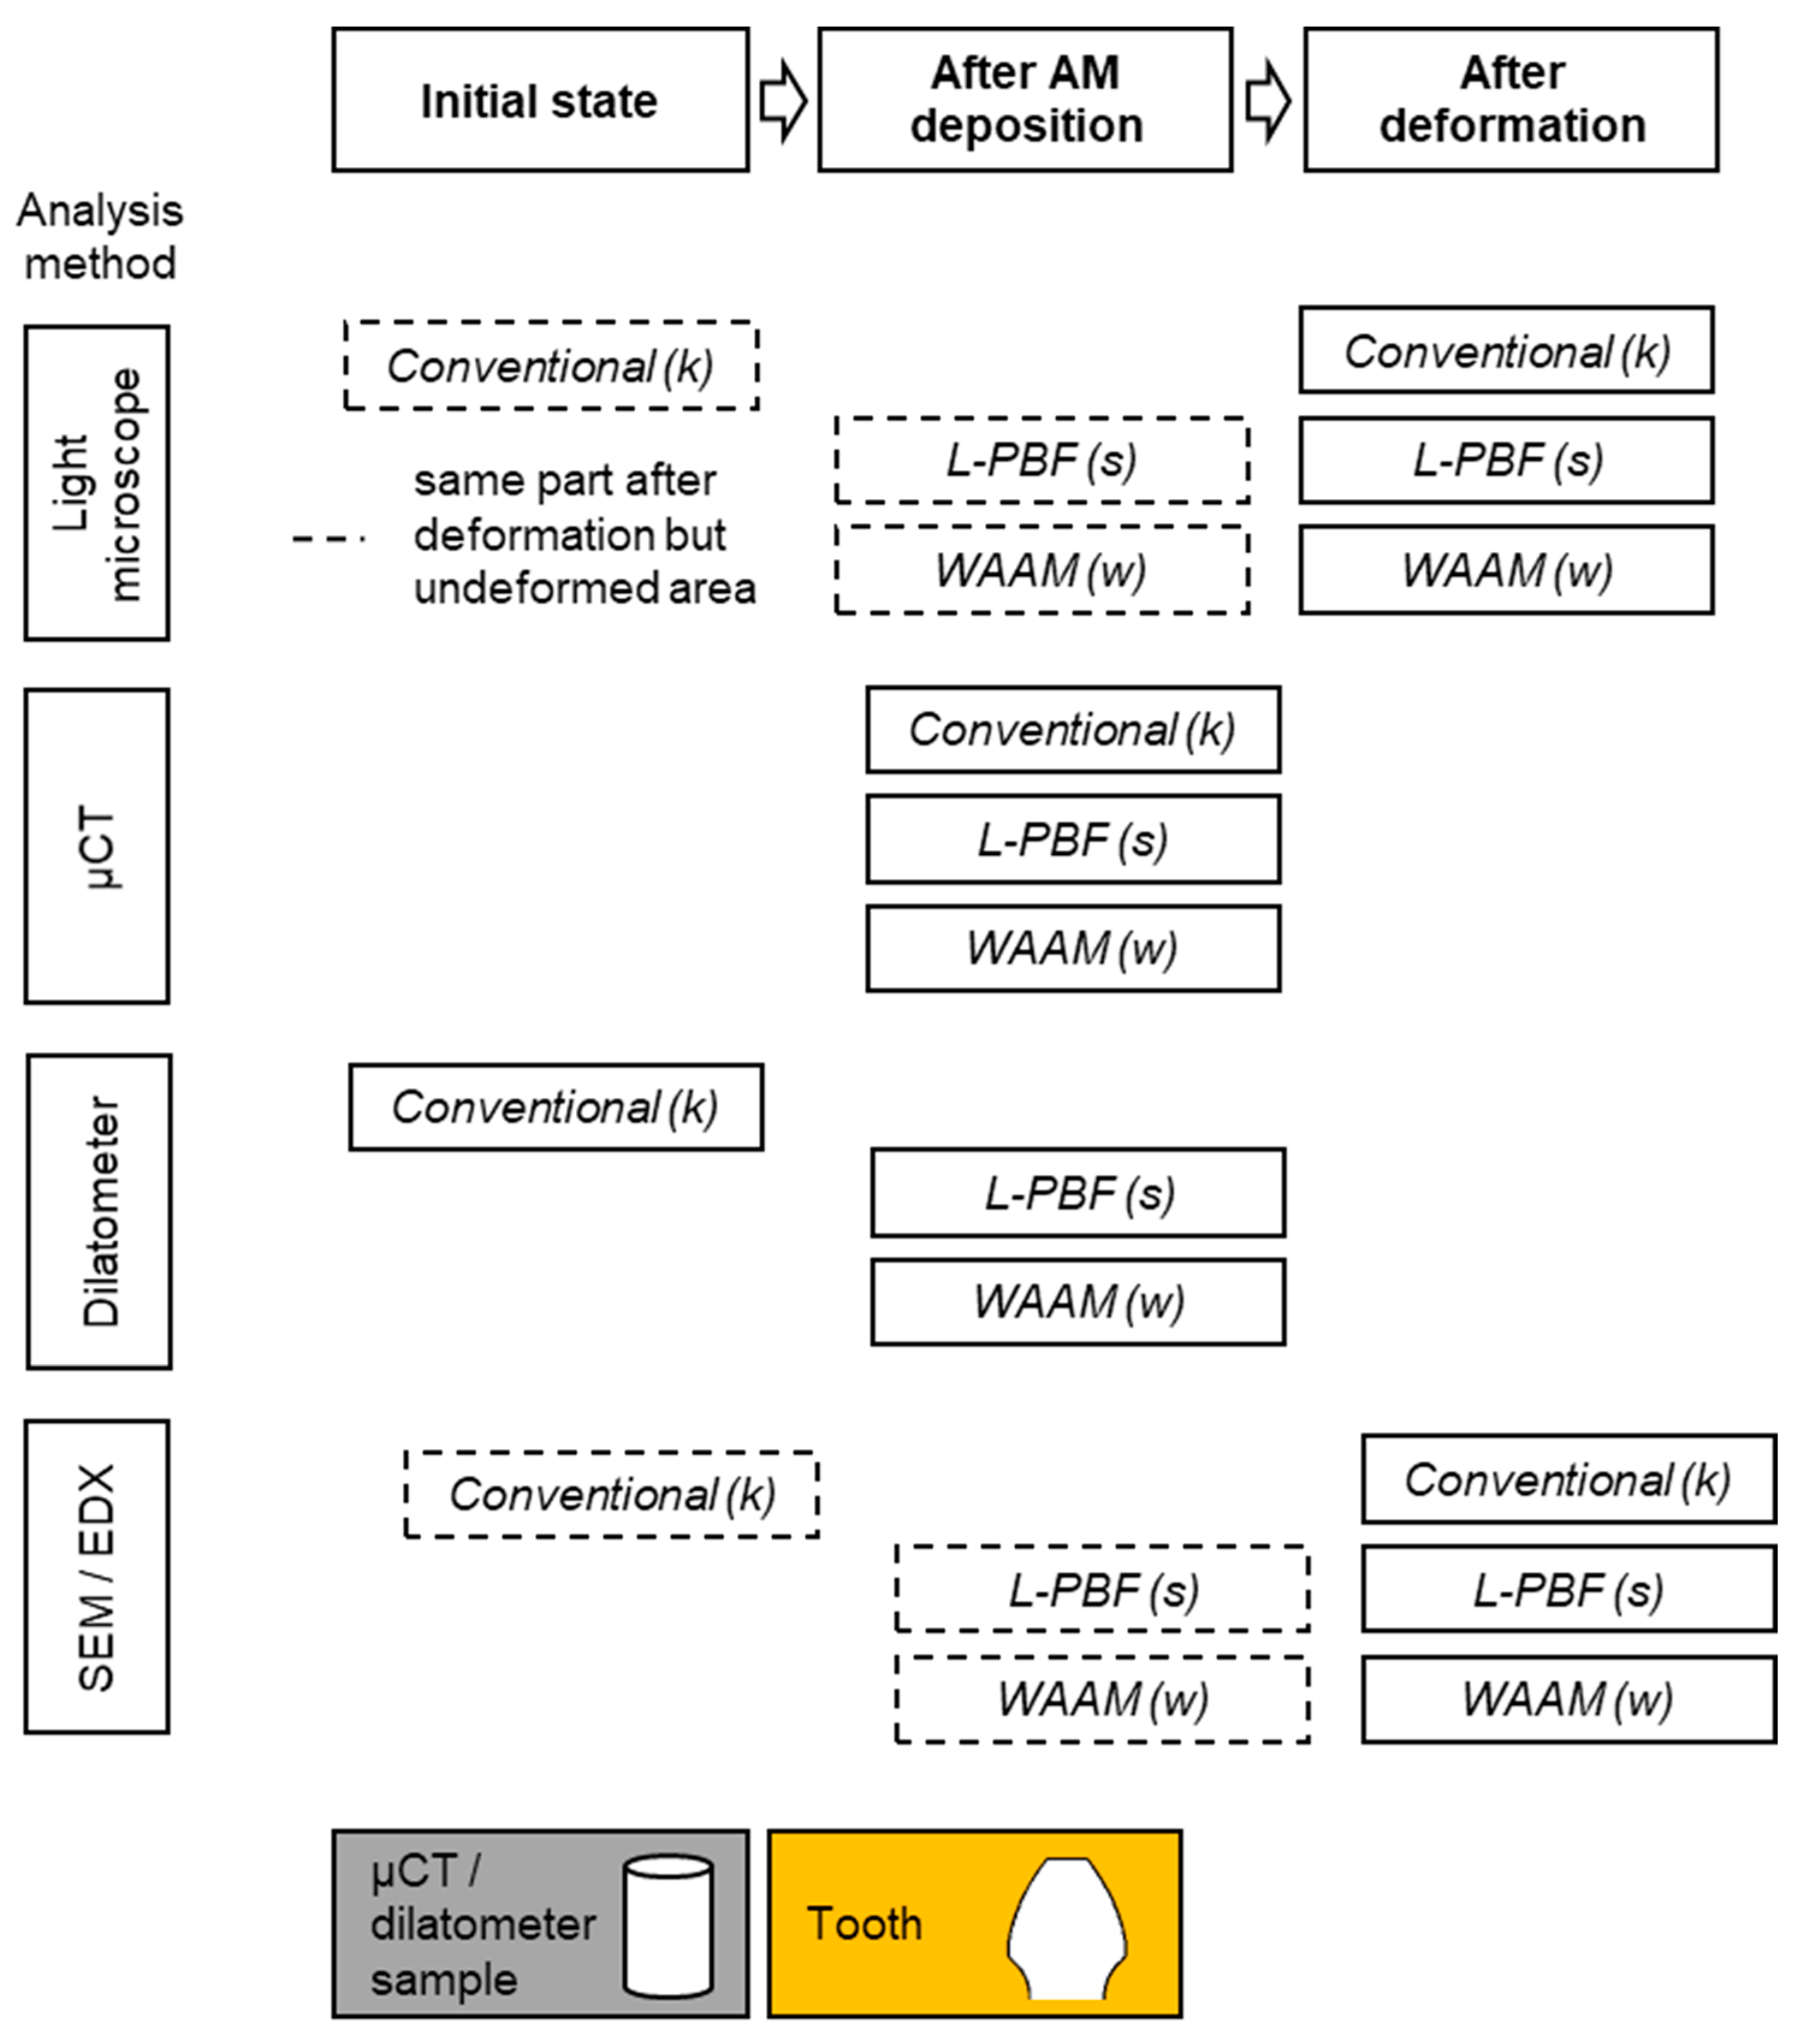
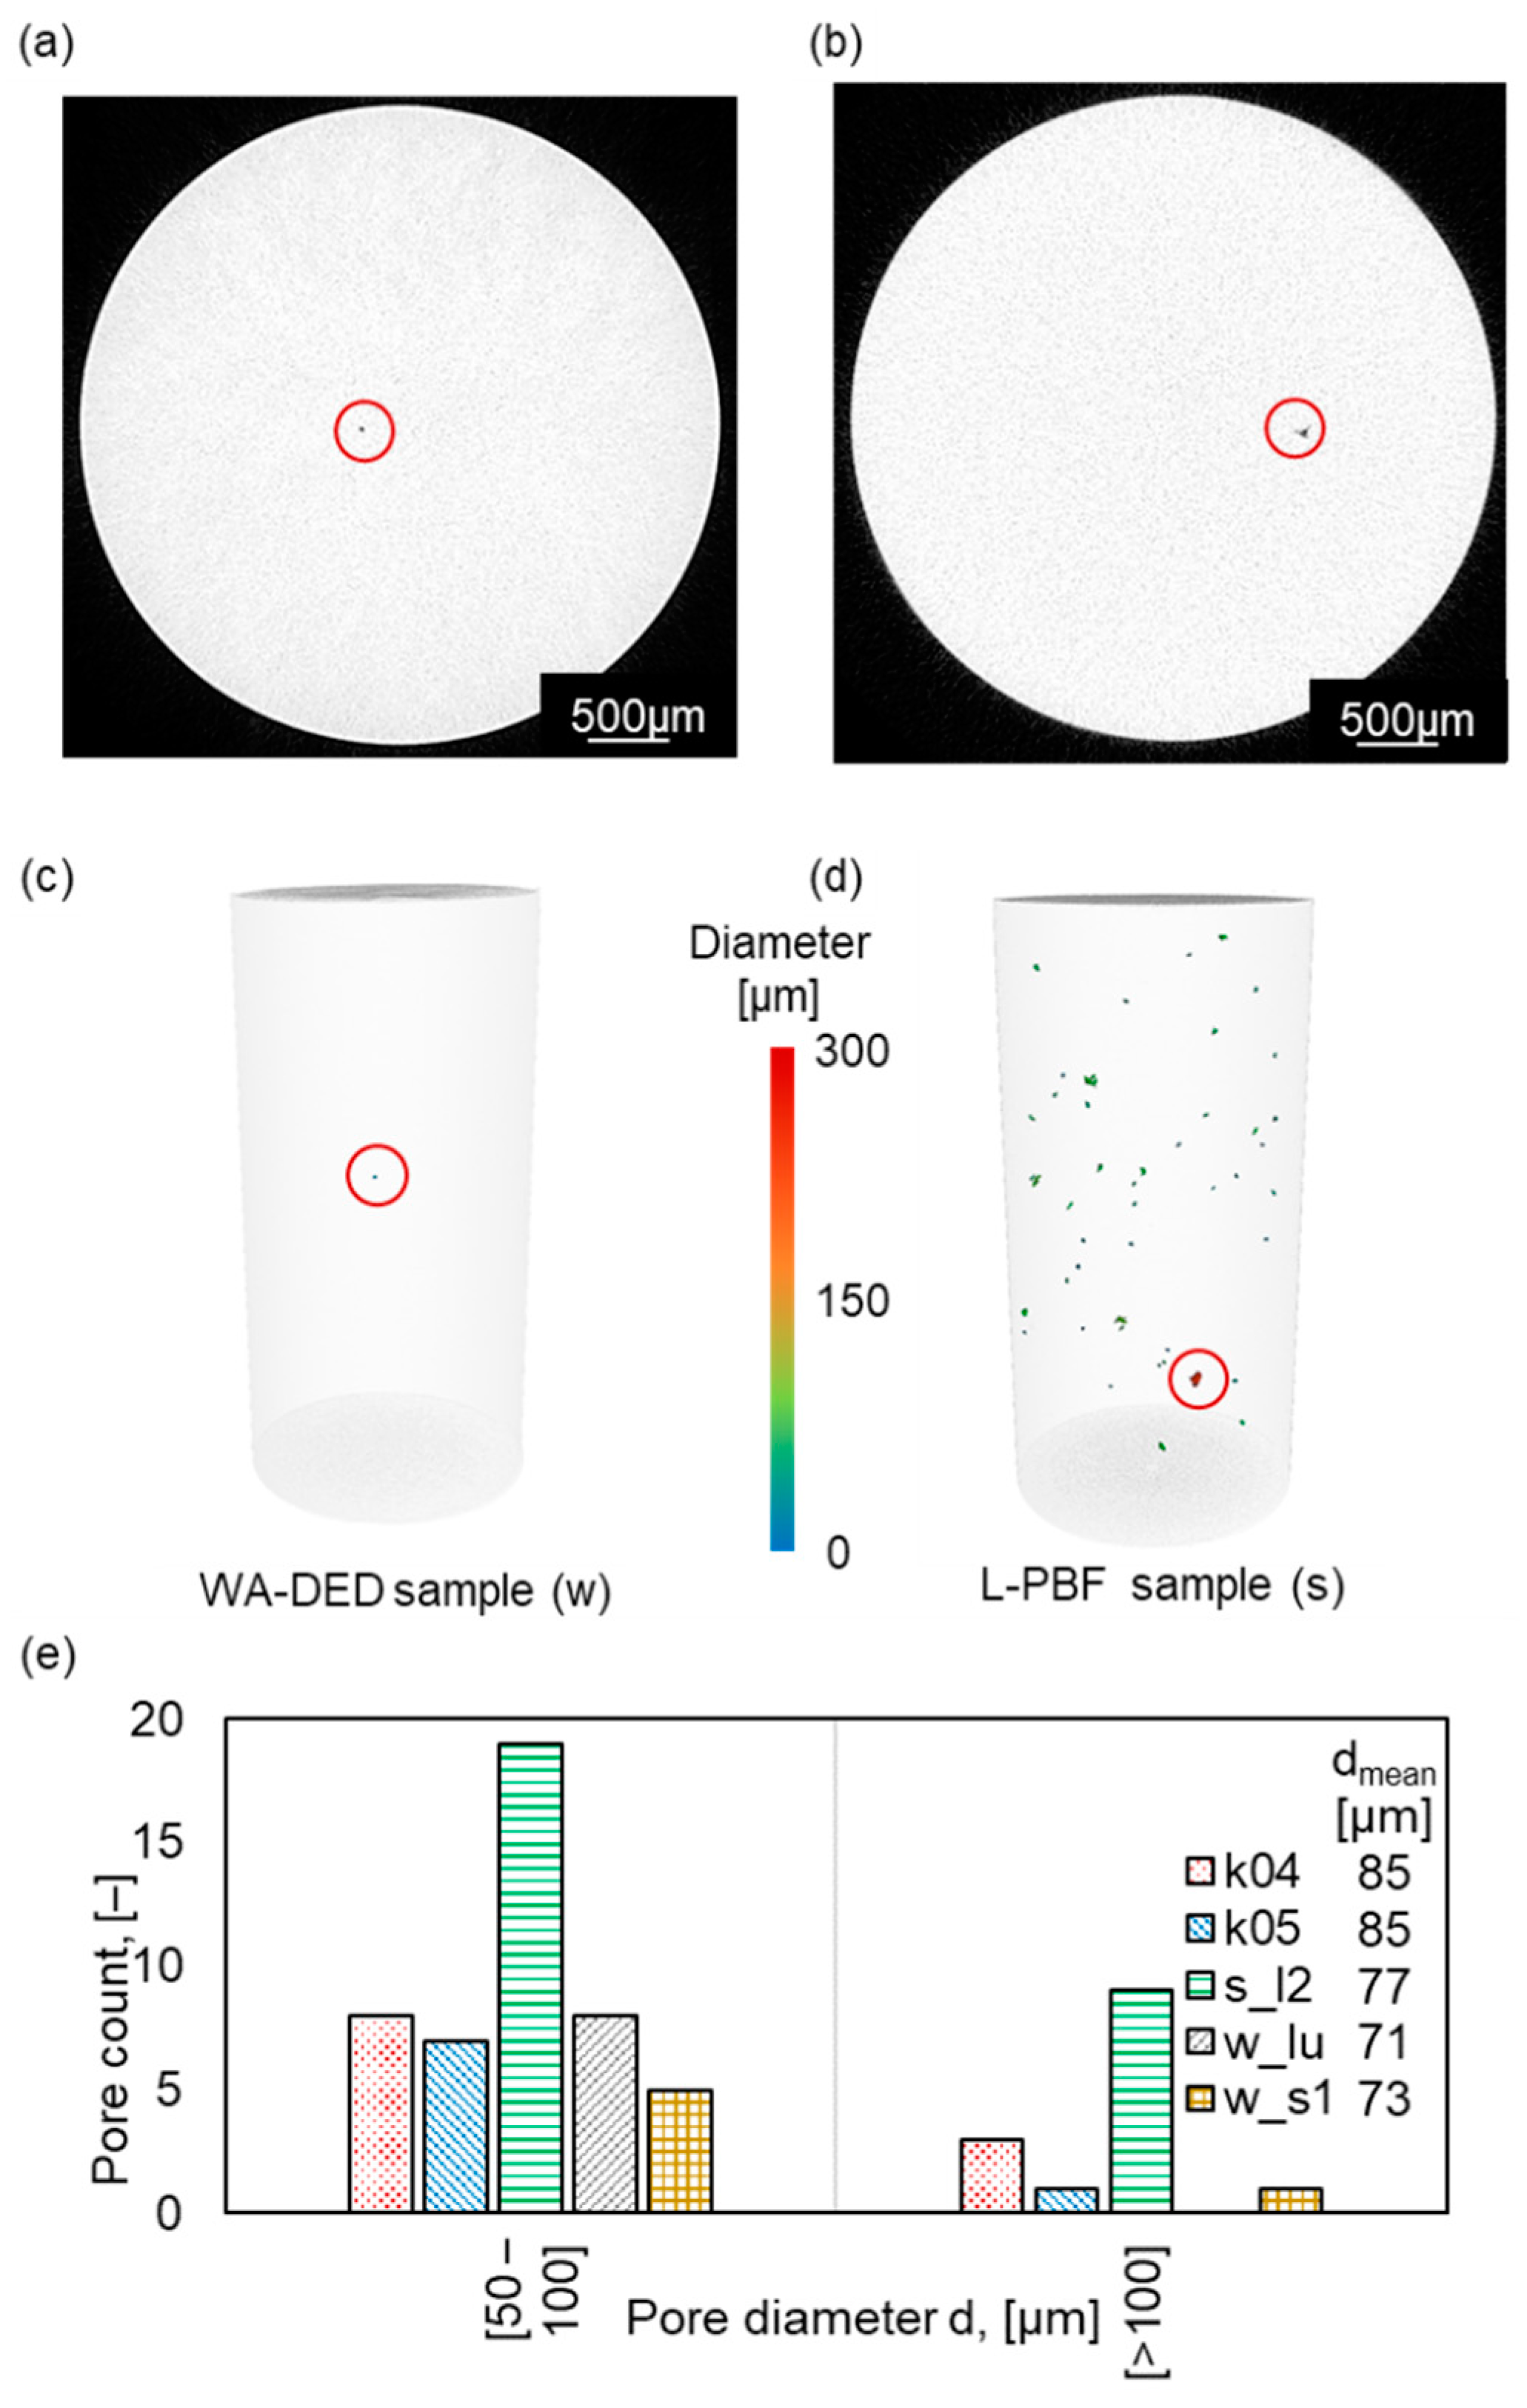
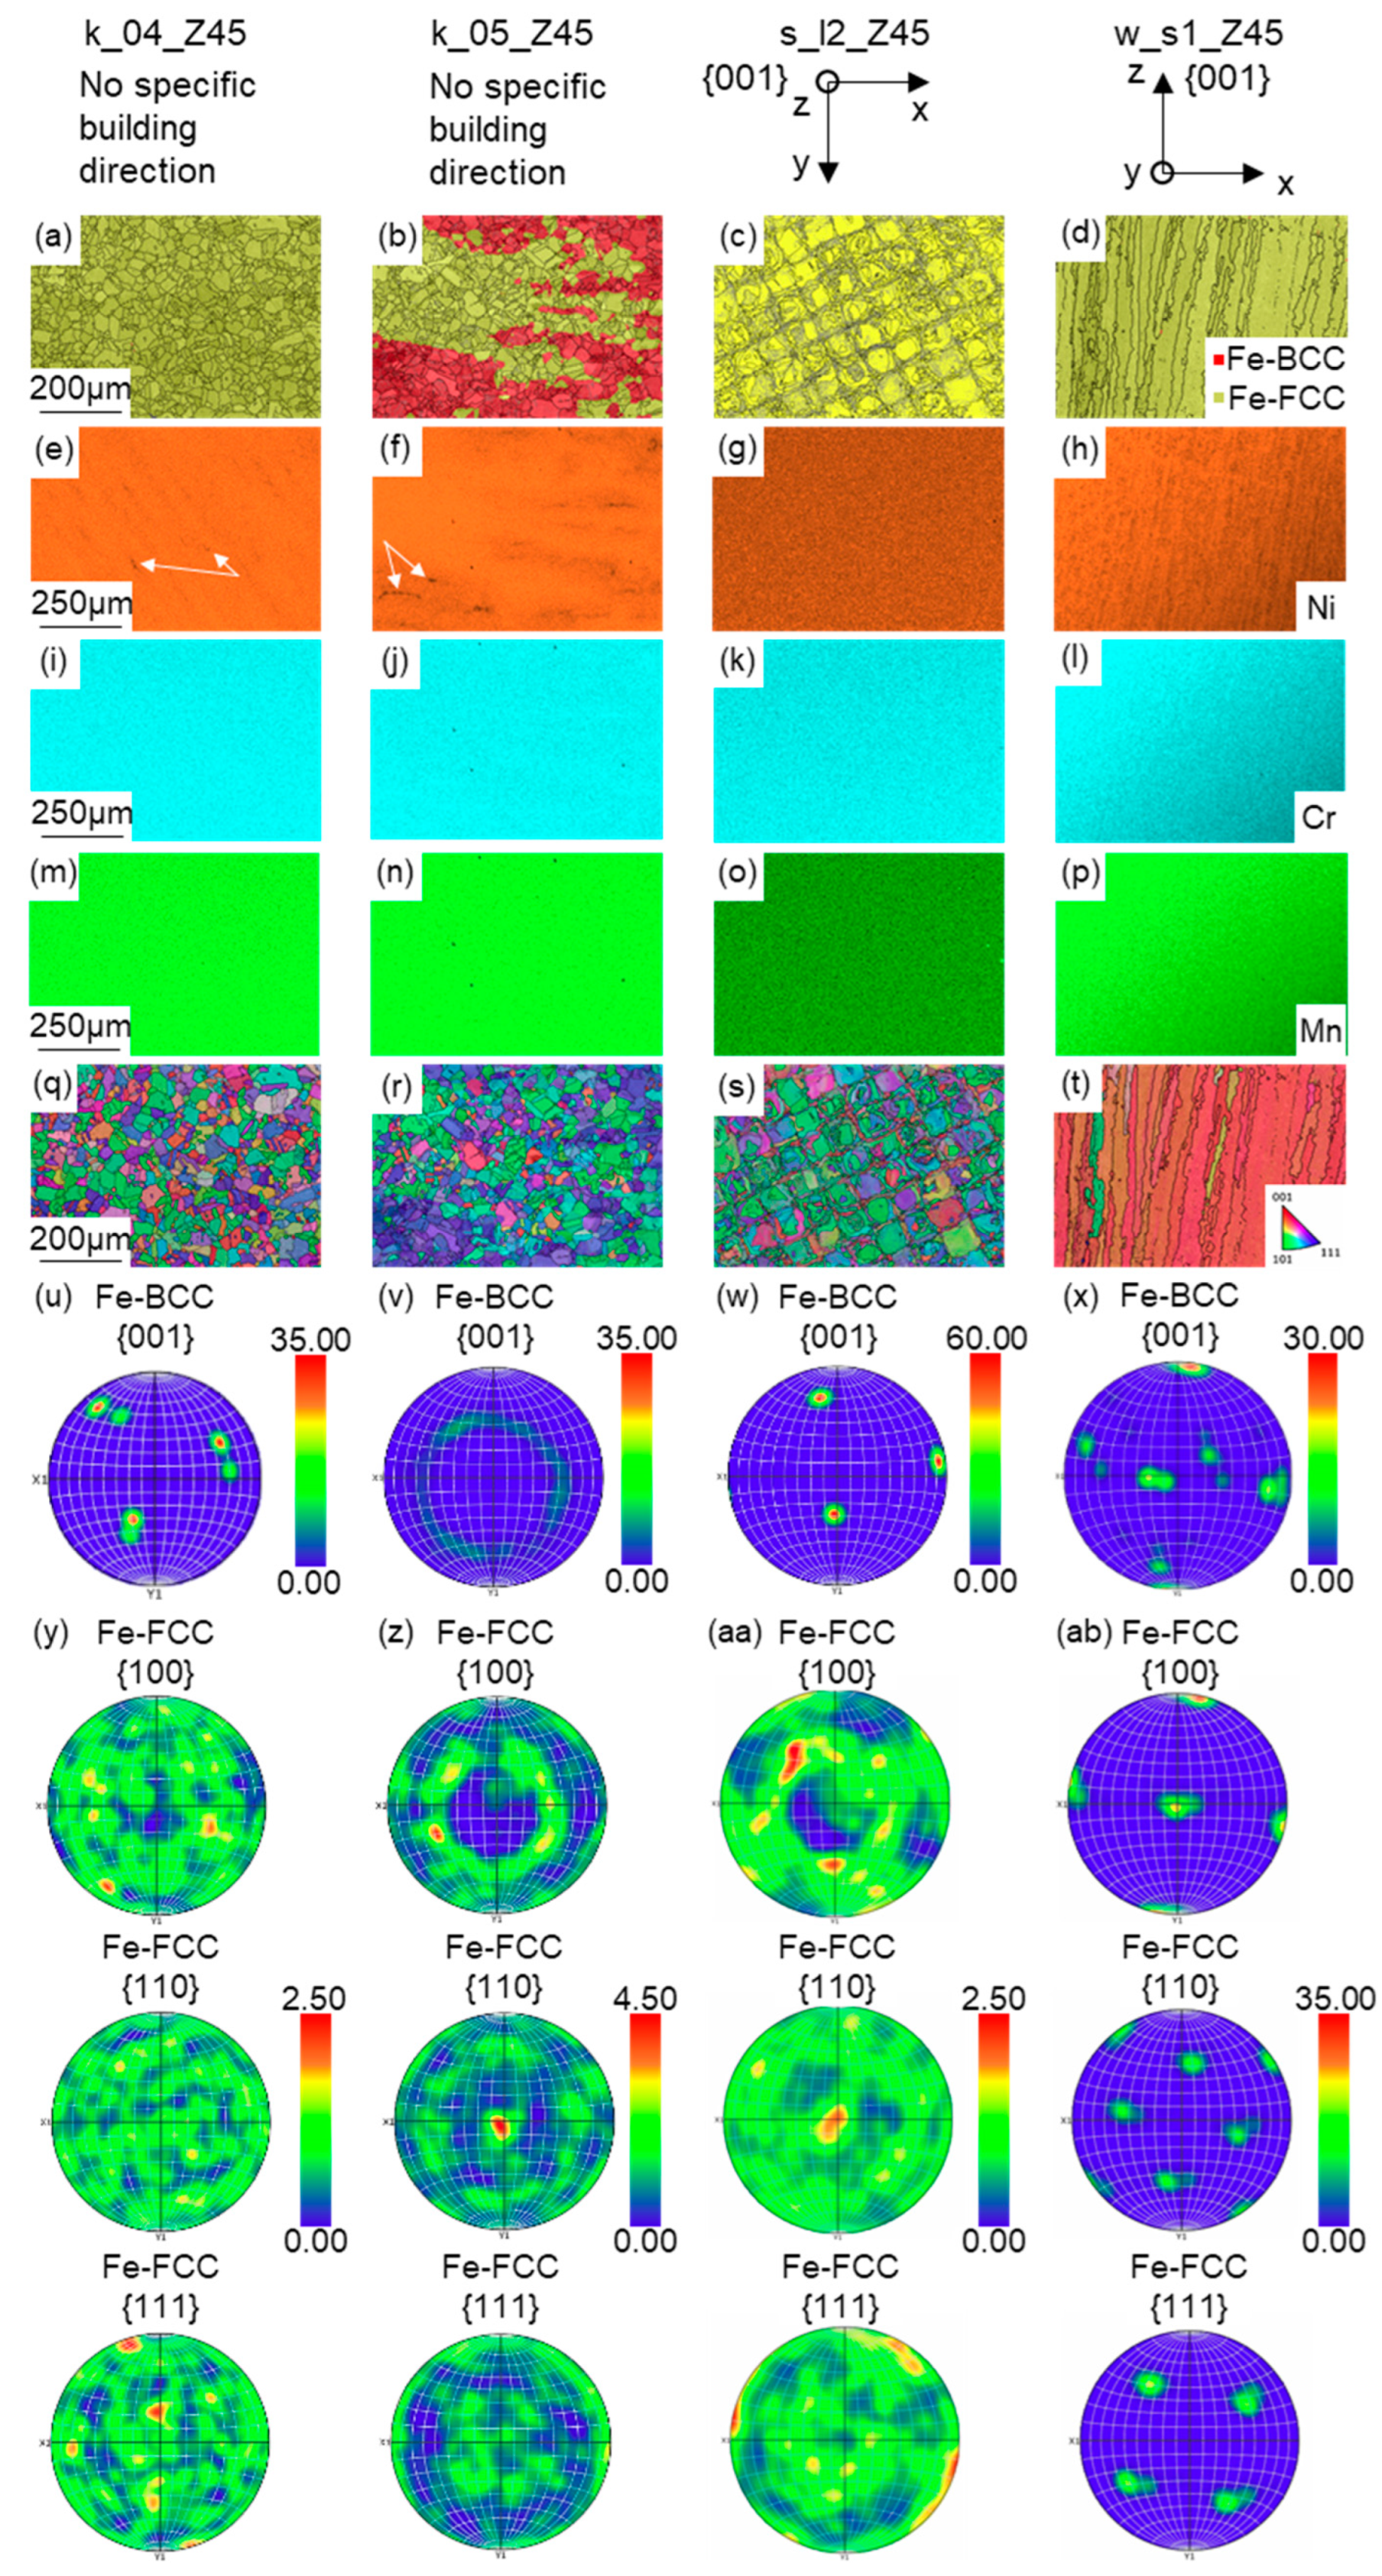
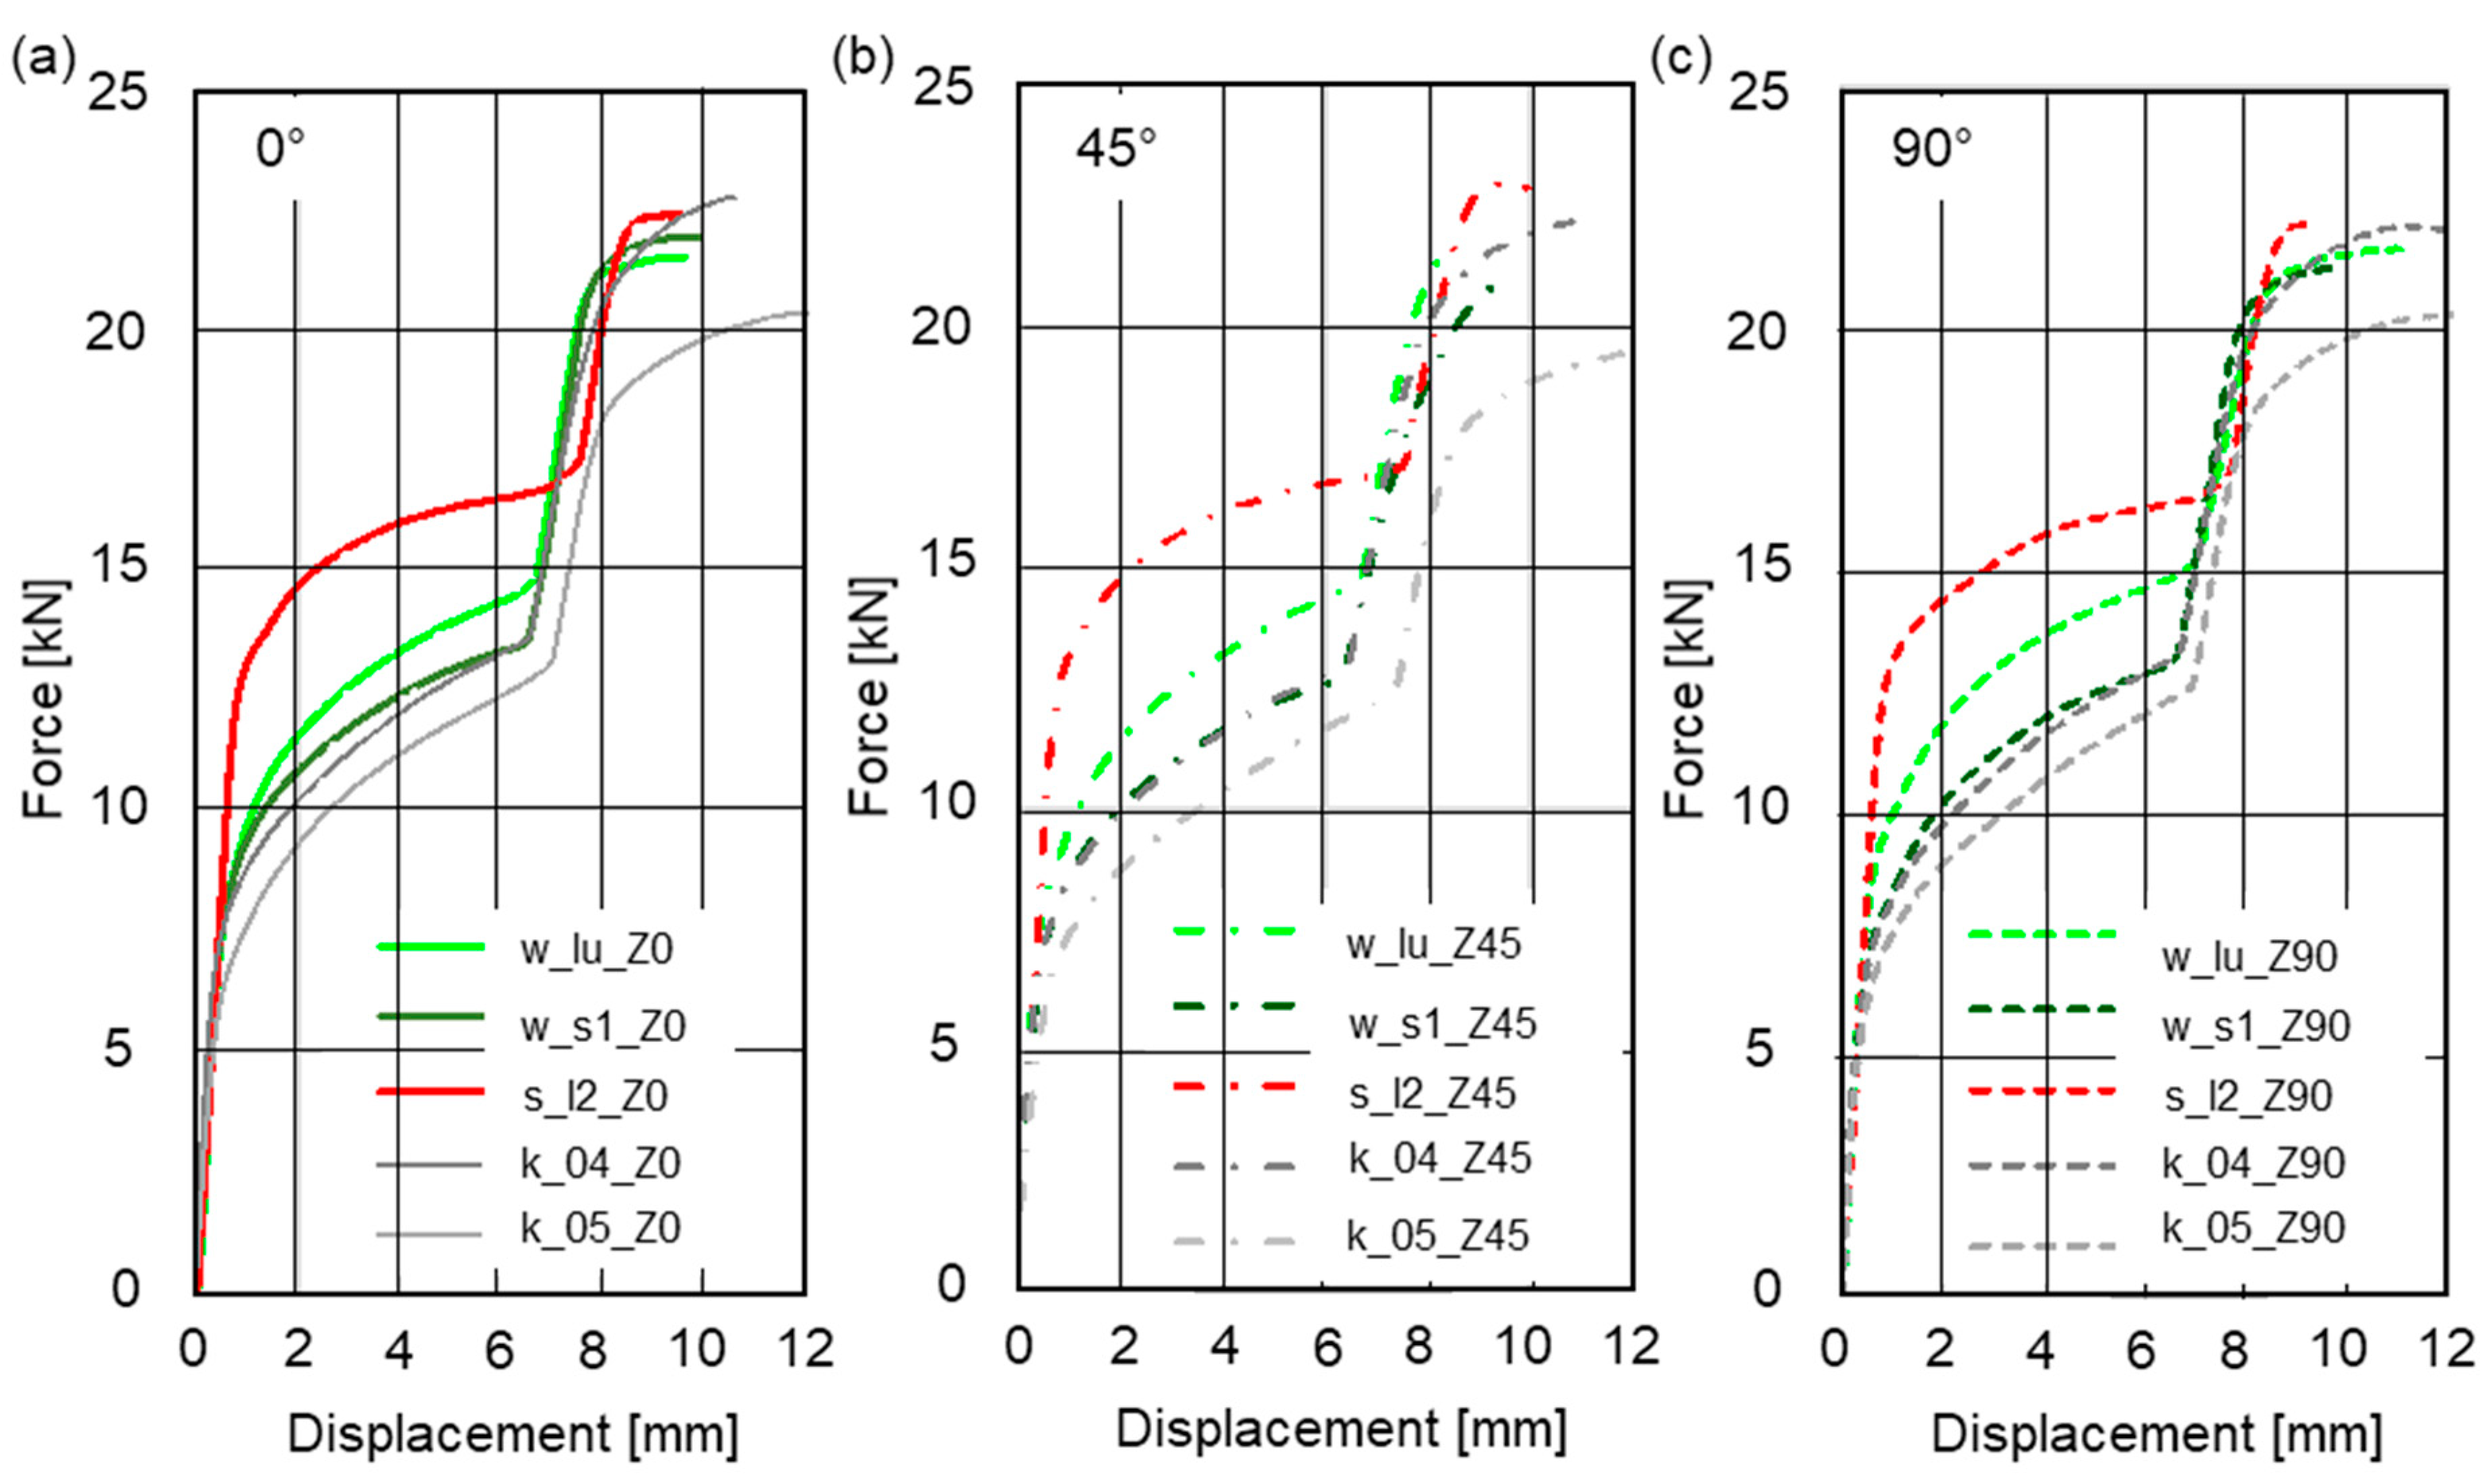
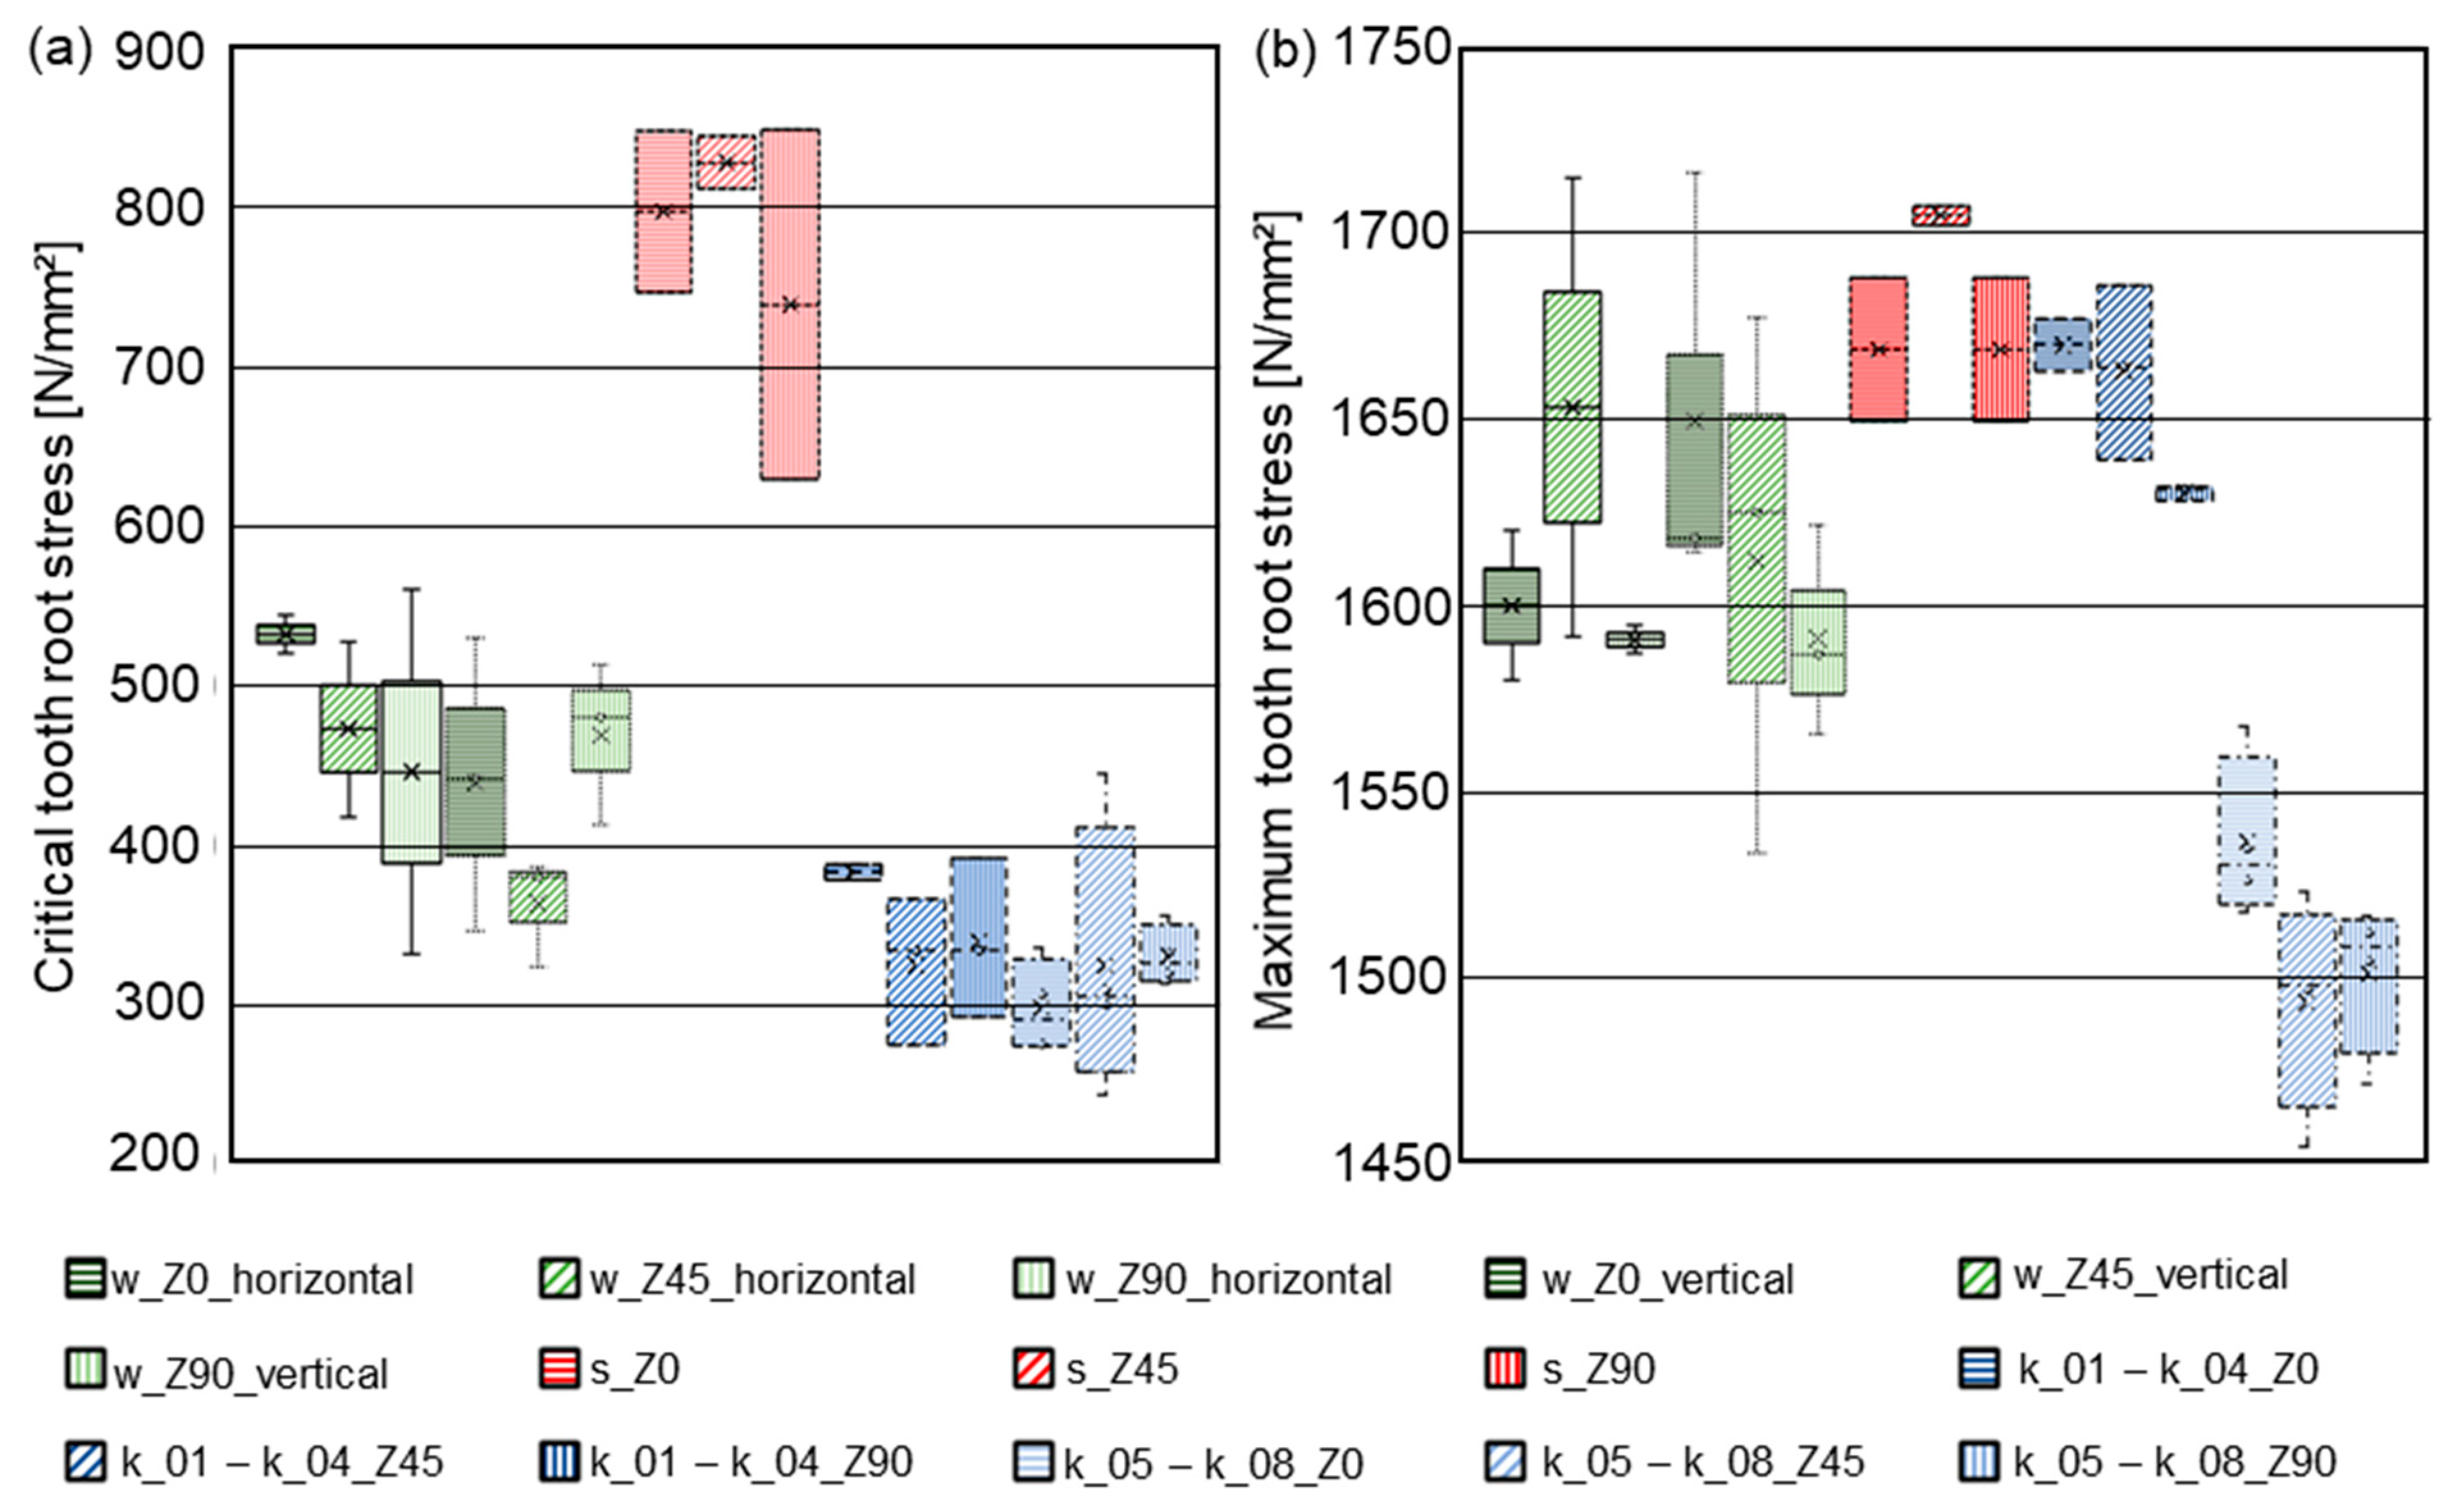
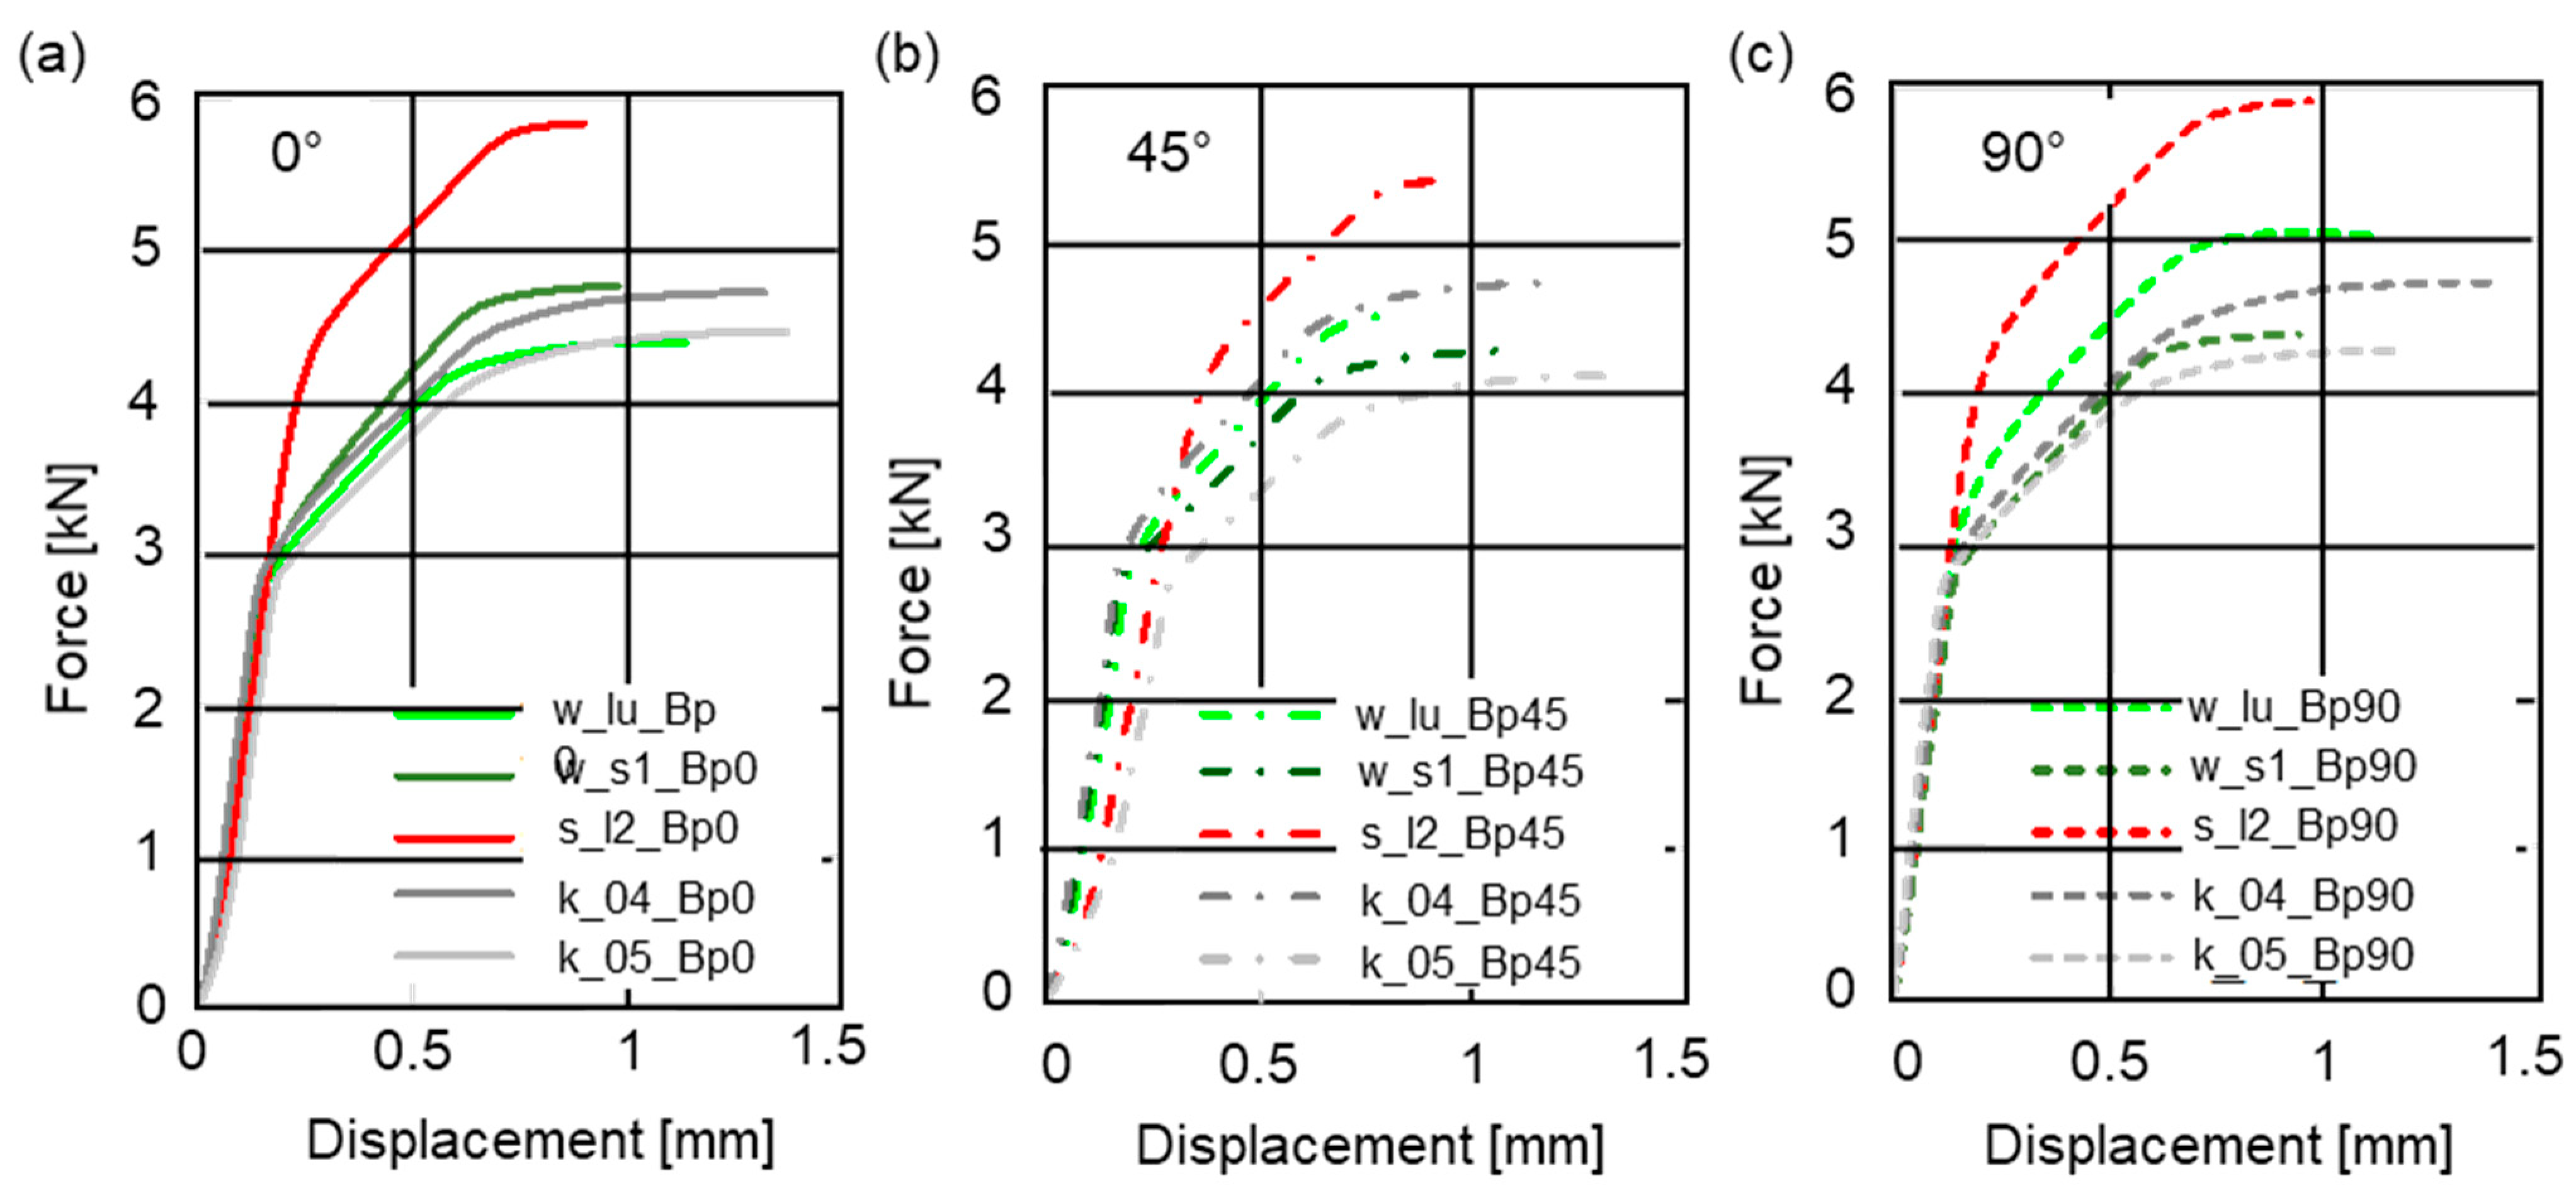

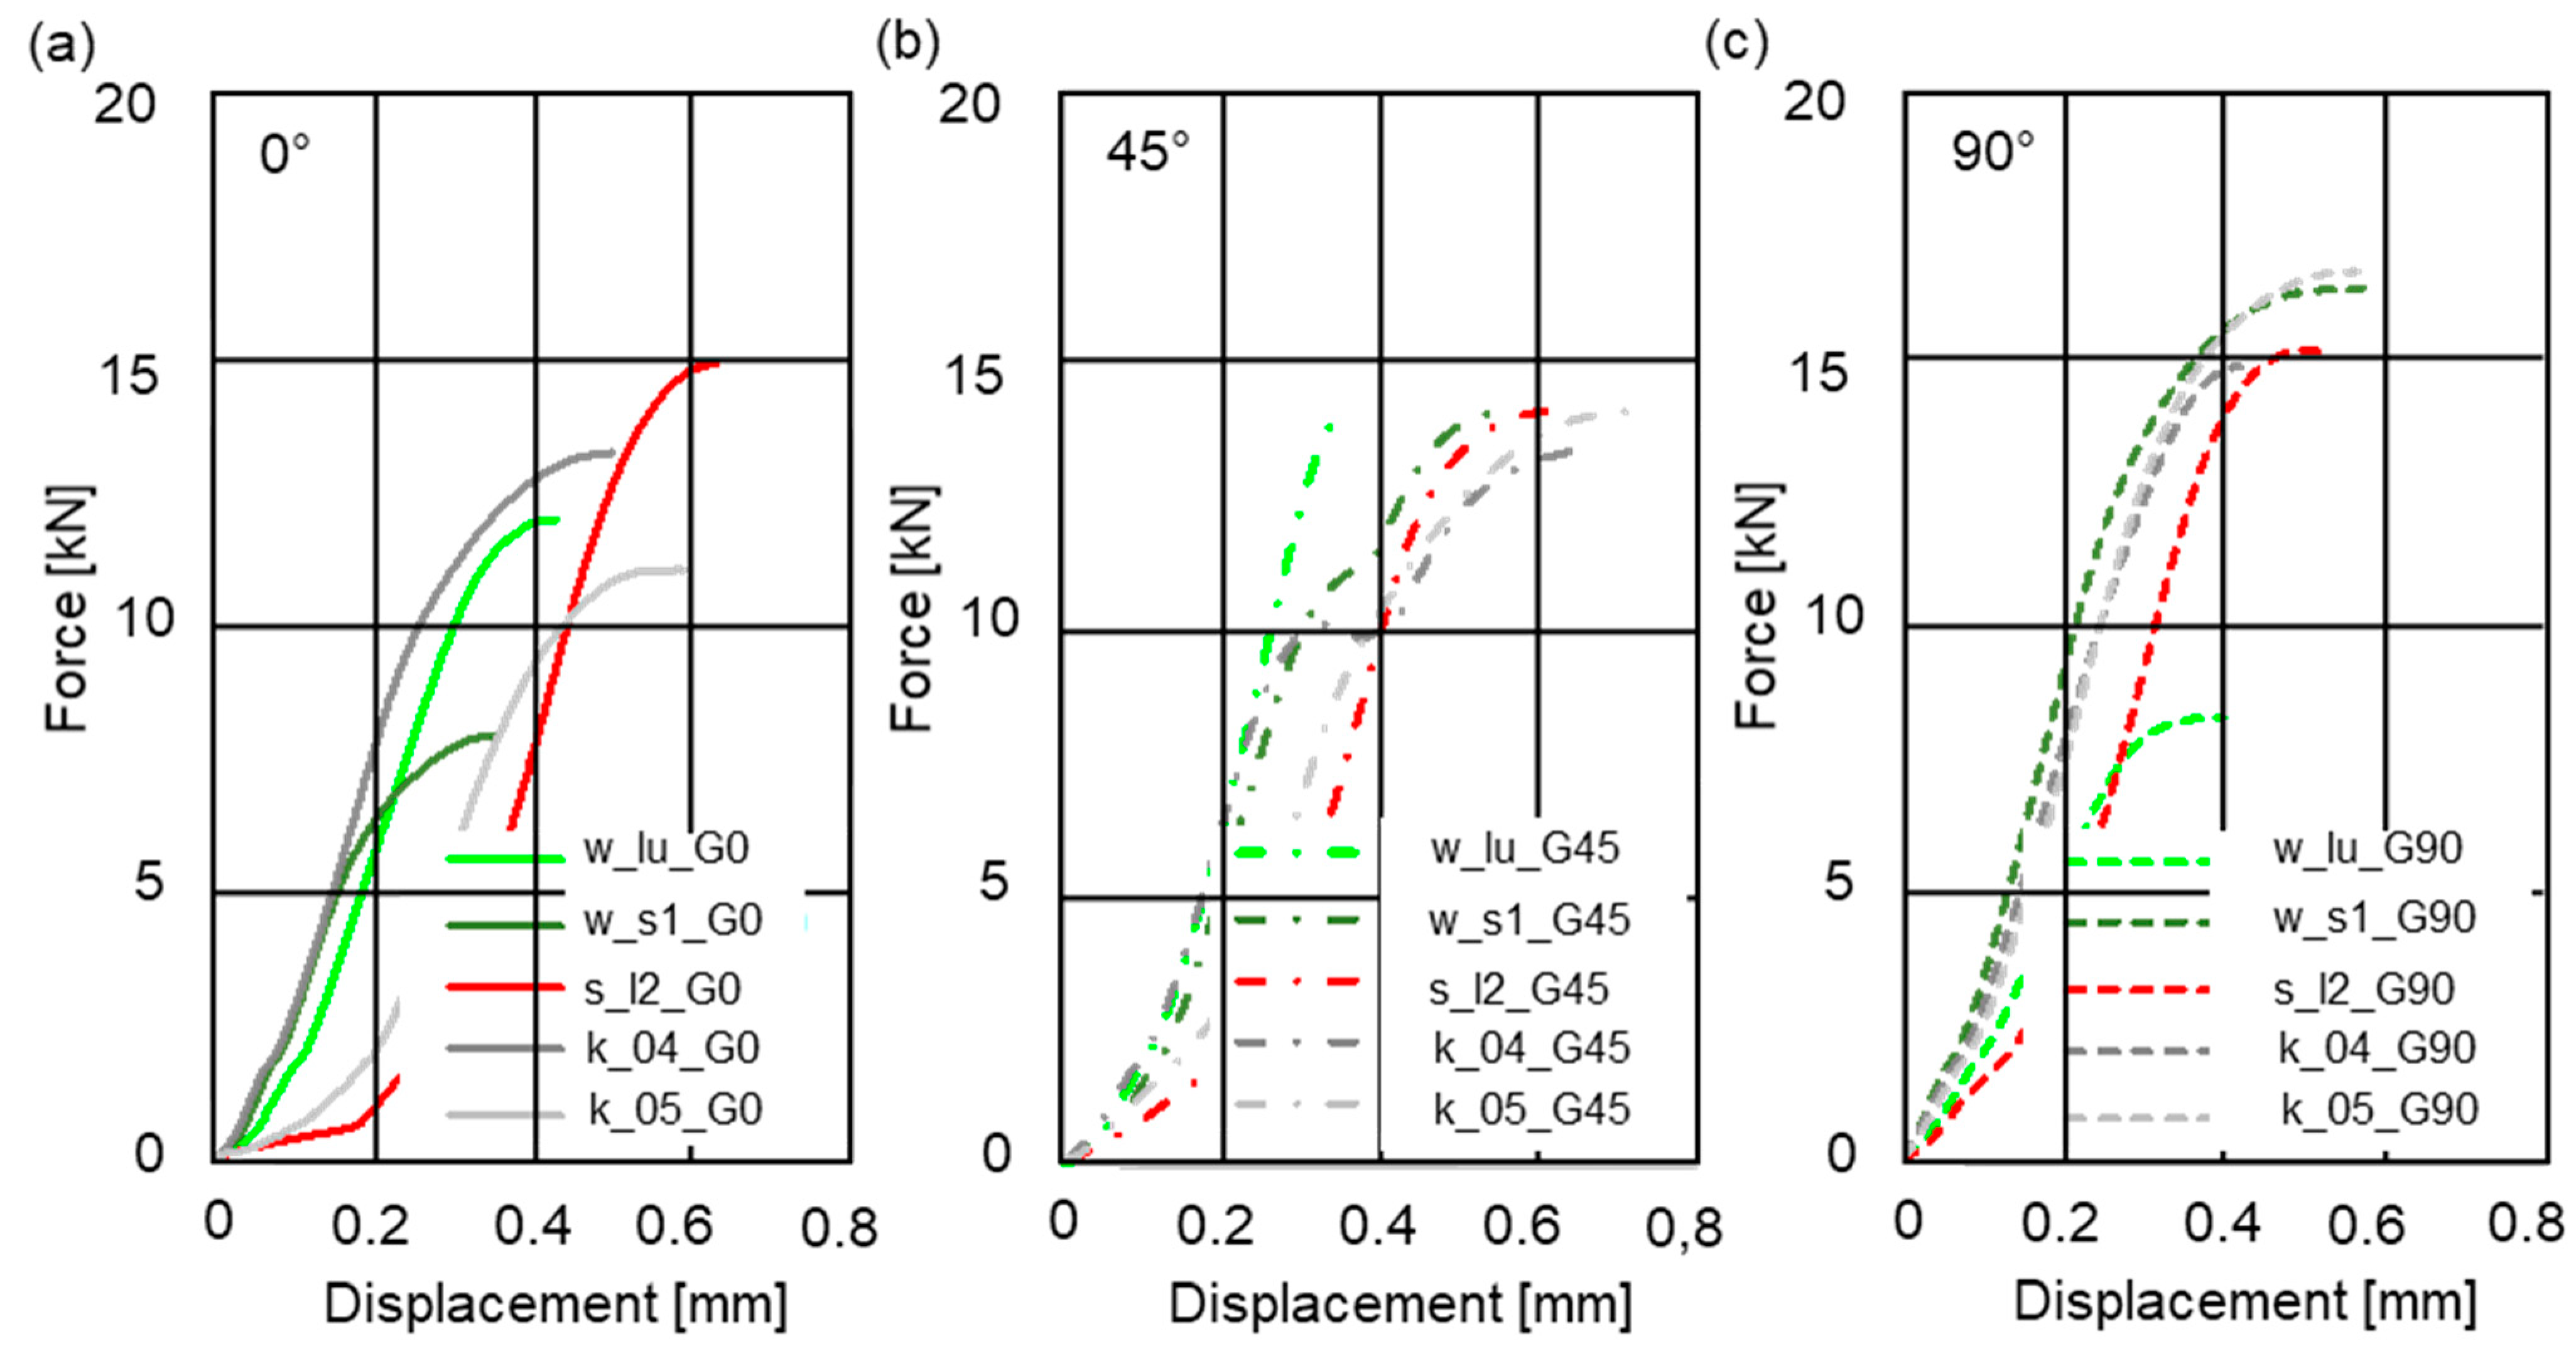


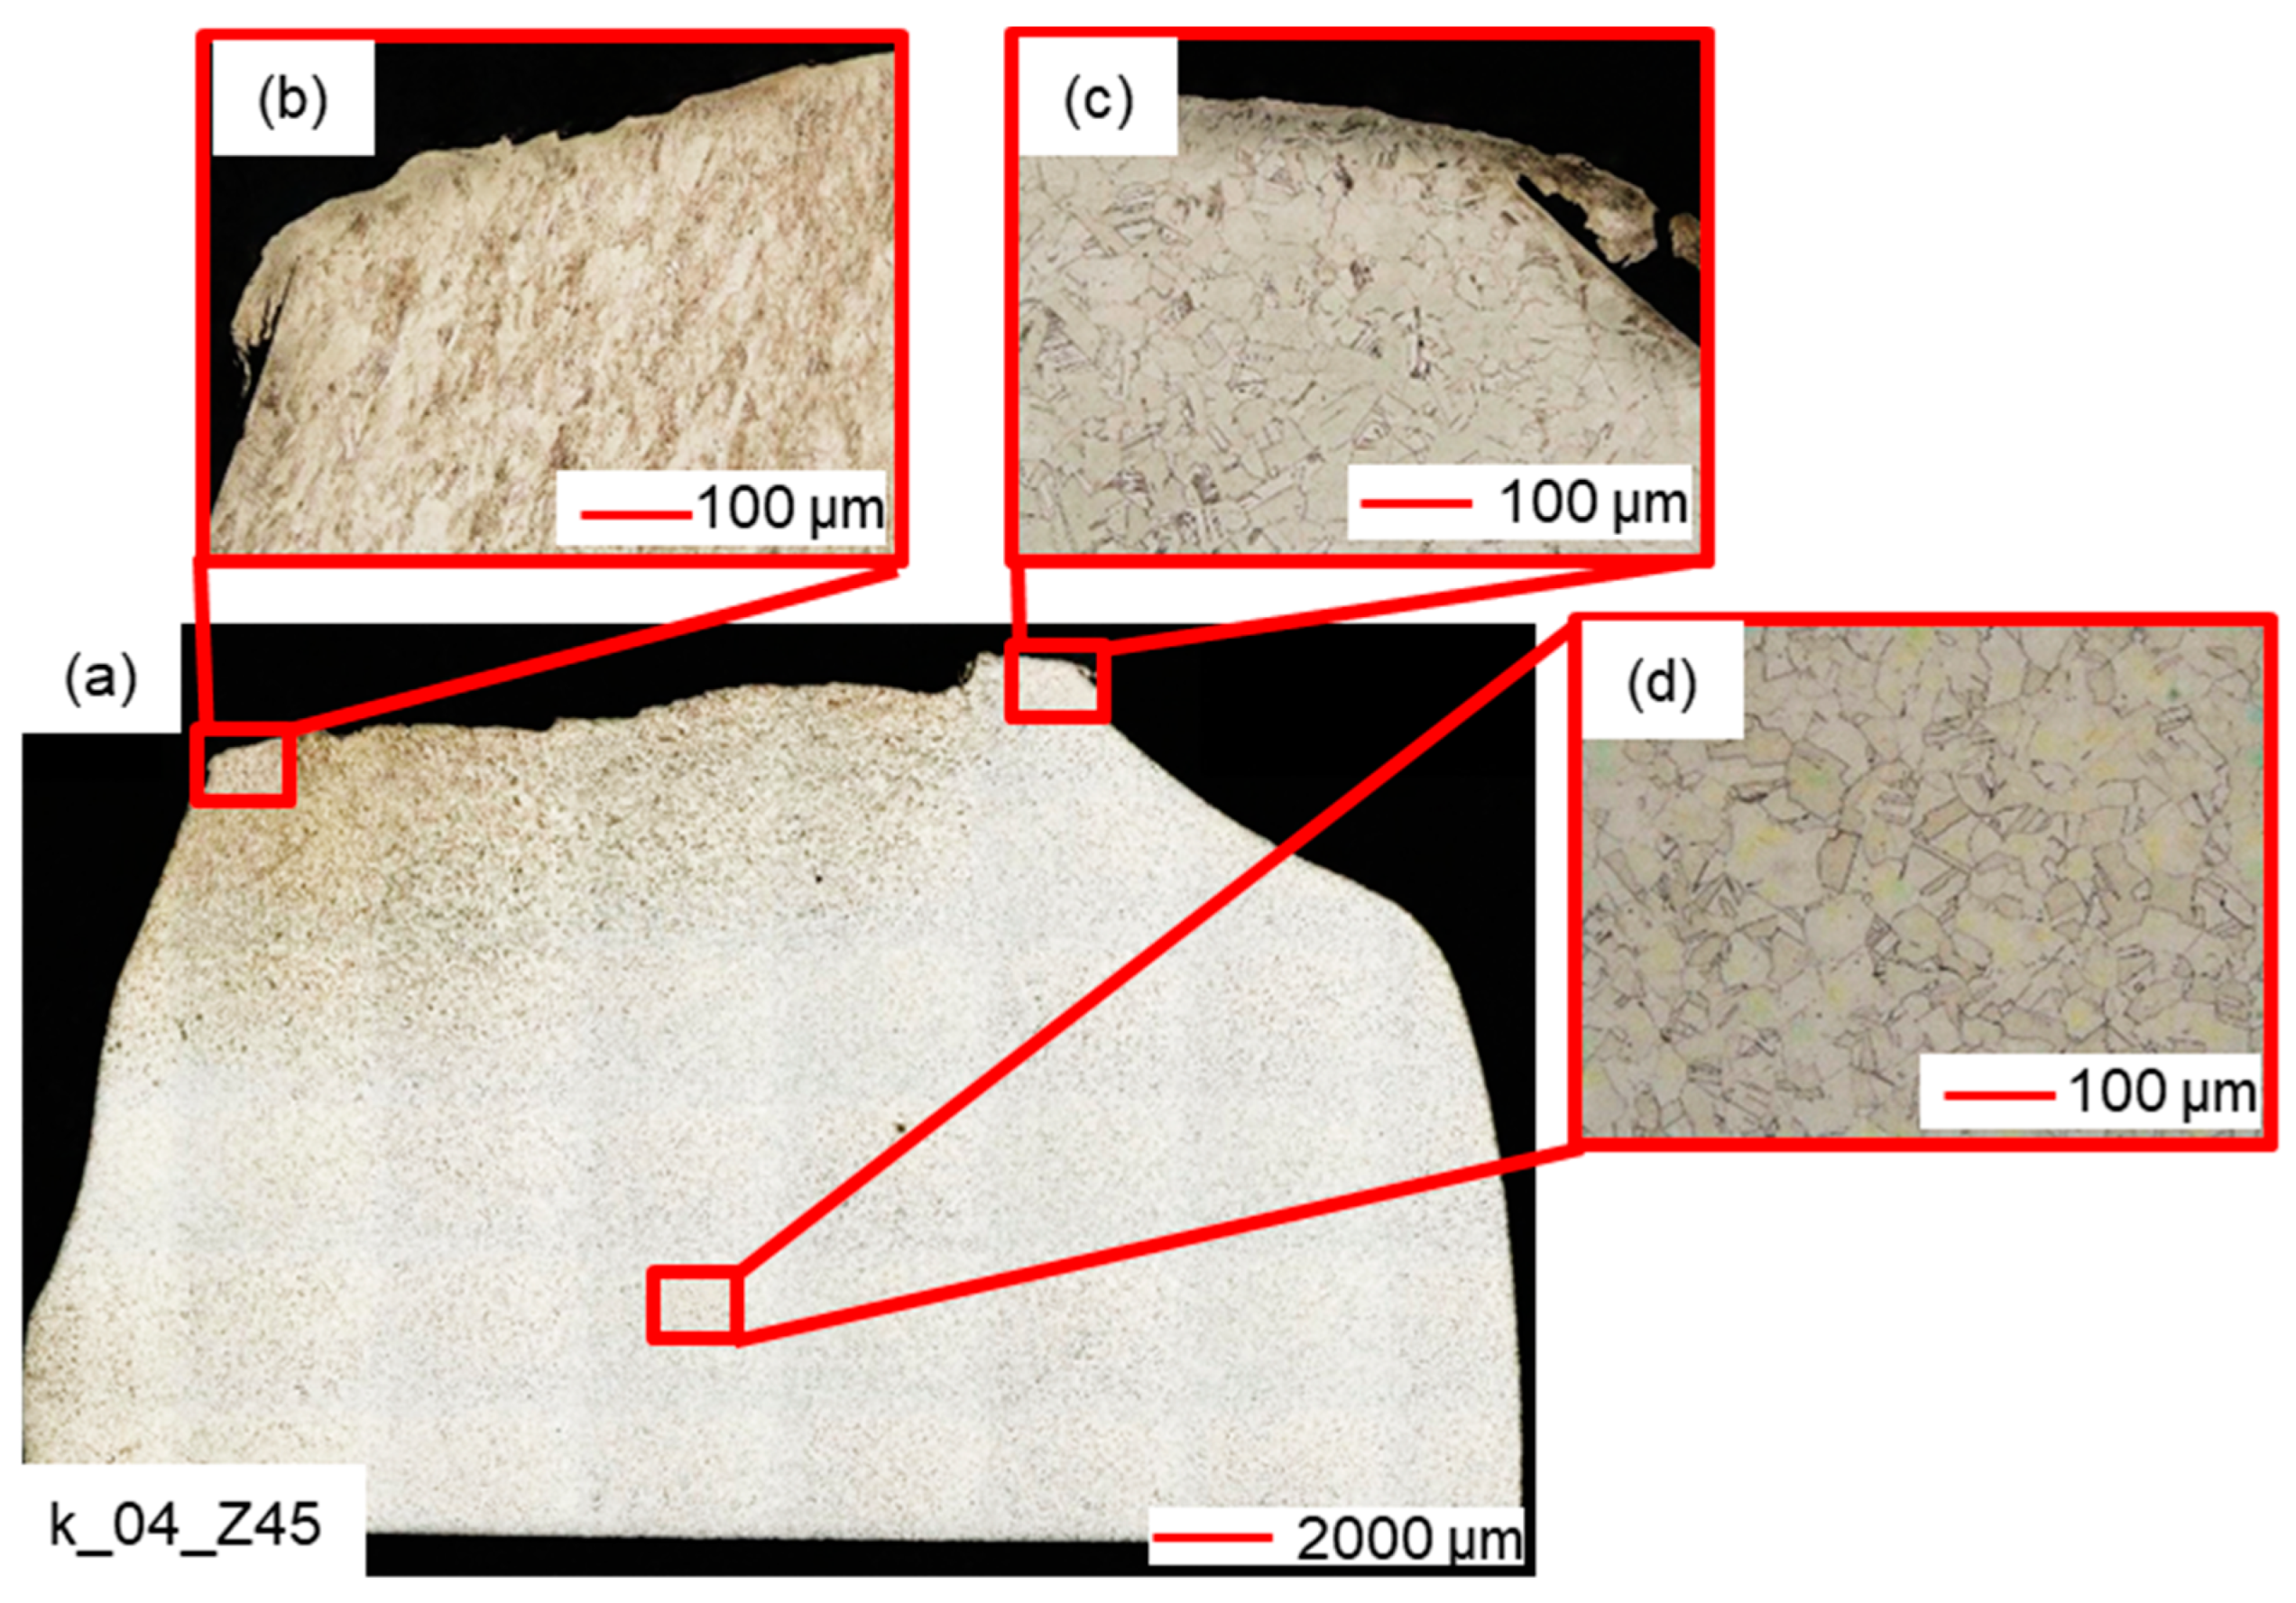

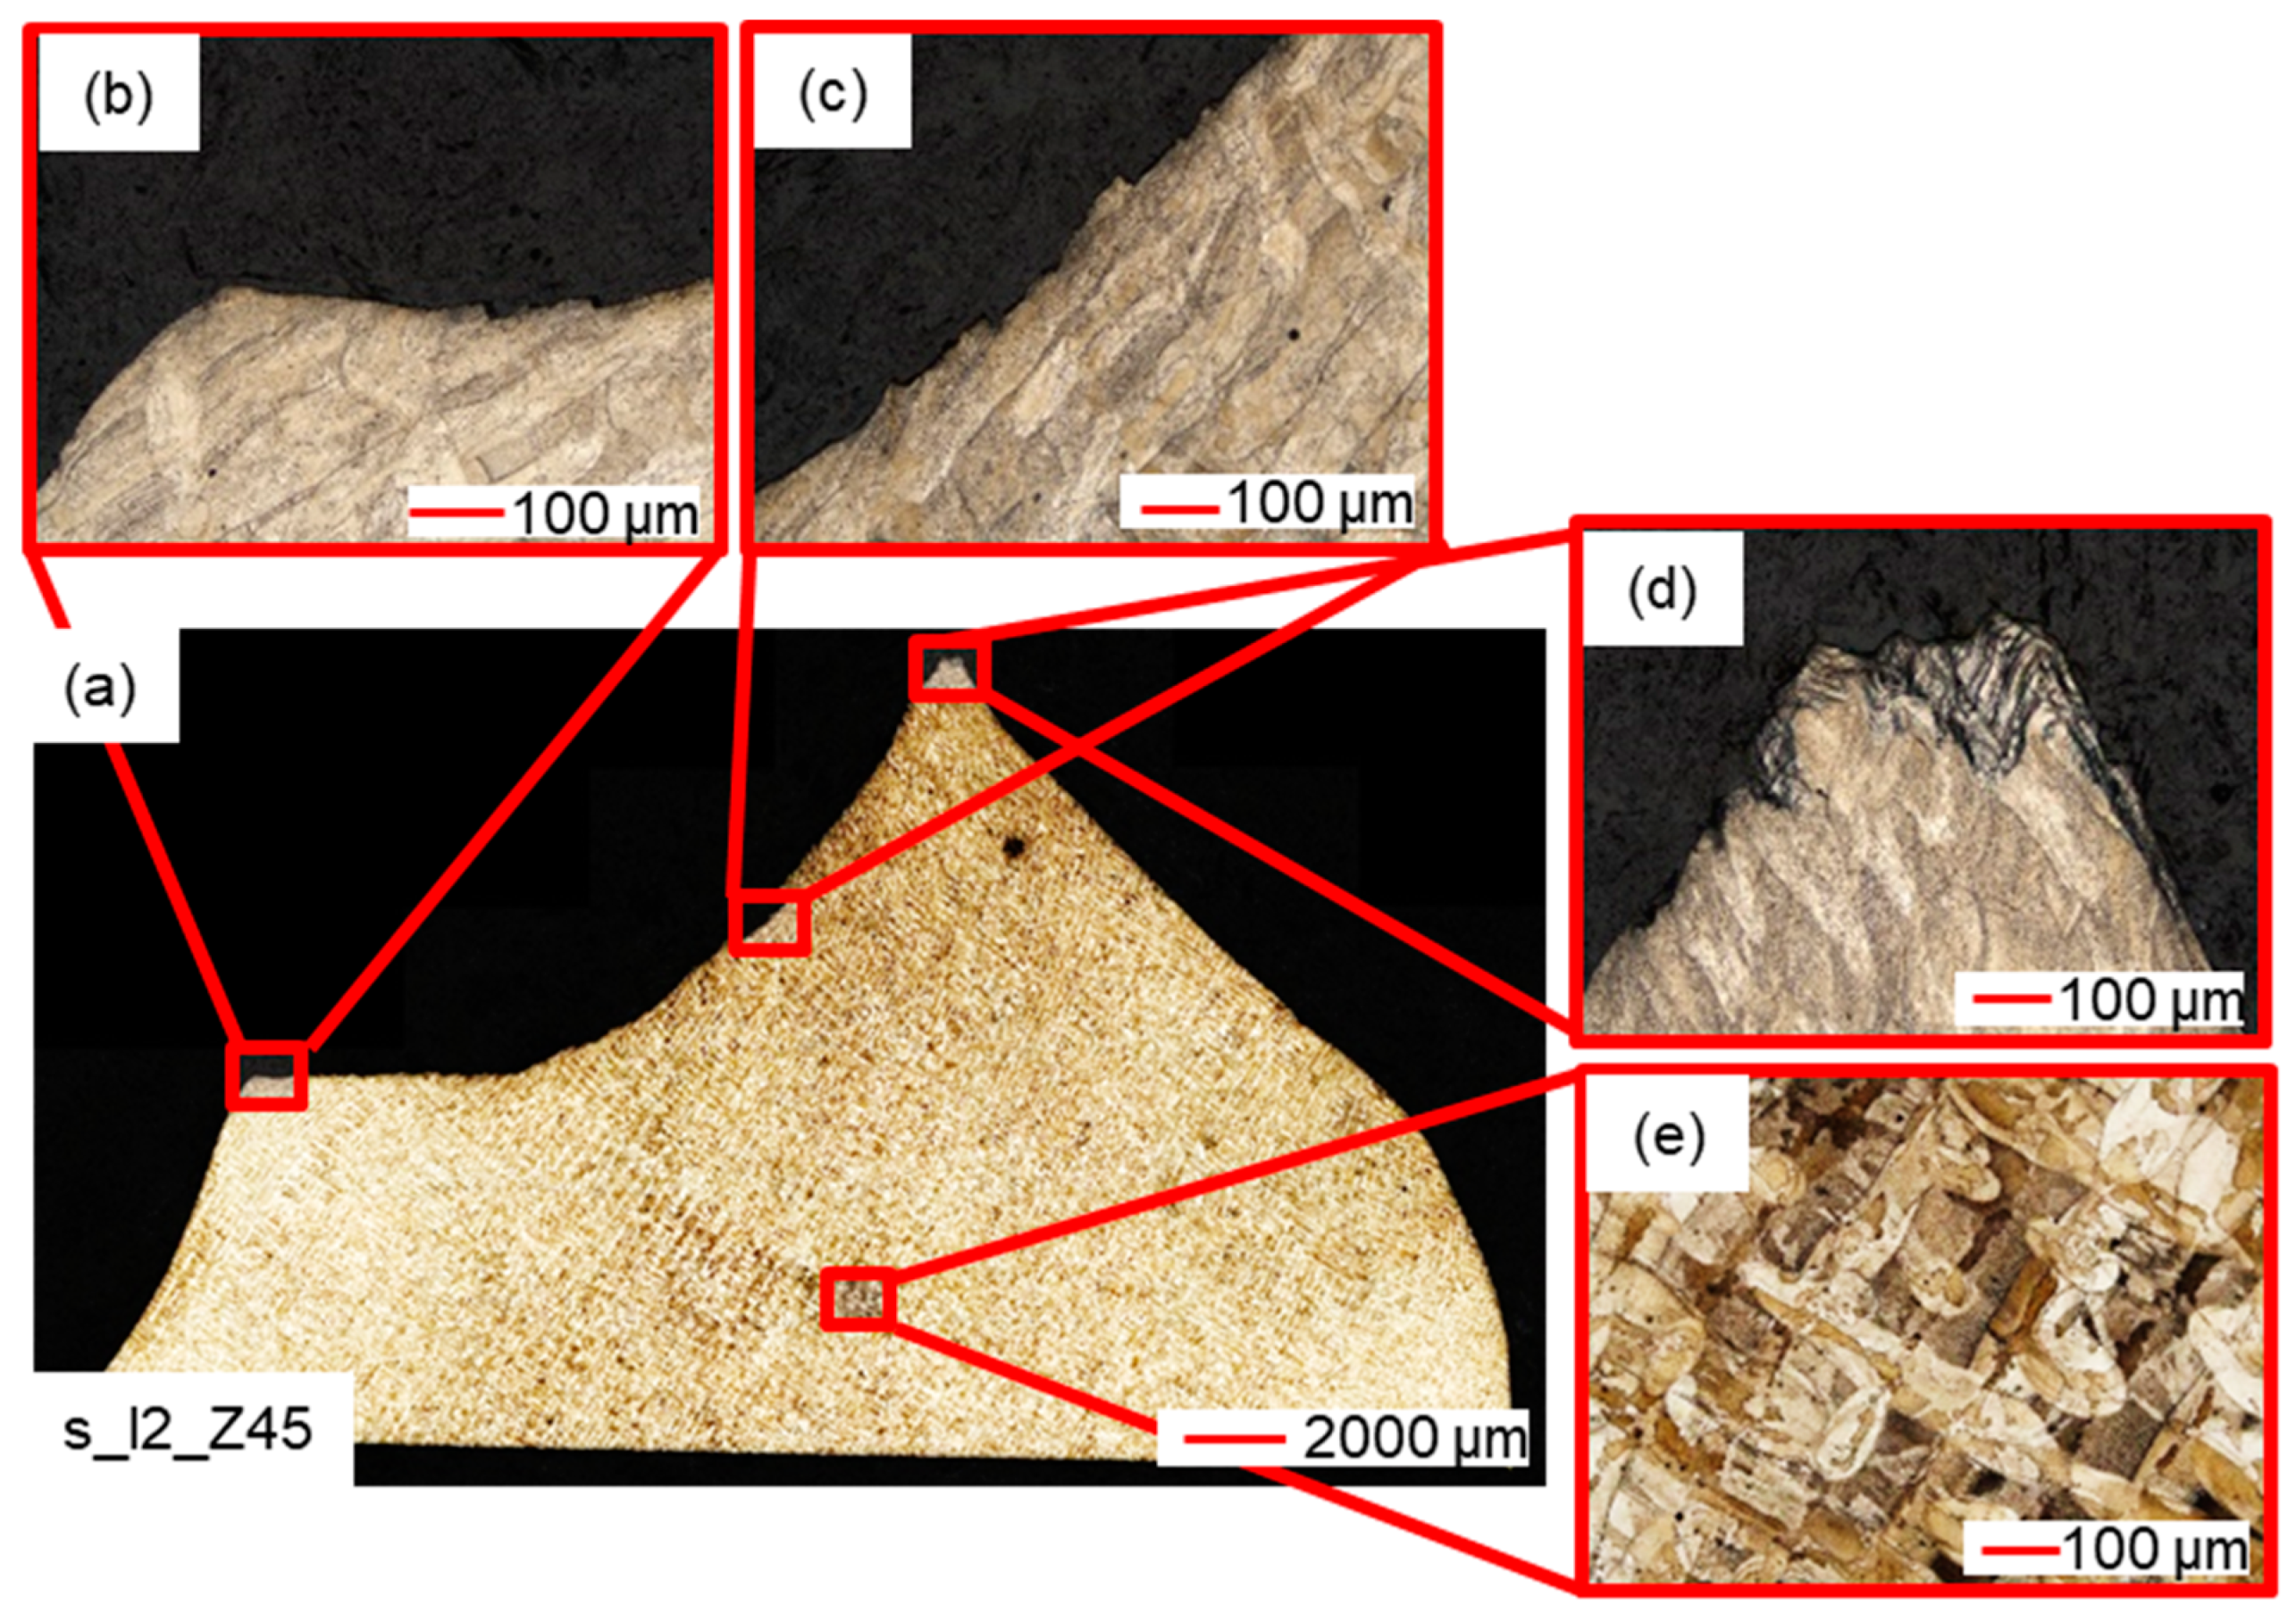

Disclaimer/Publisher’s Note: The statements, opinions and data contained in all publications are solely those of the individual author(s) and contributor(s) and not of MDPI and/or the editor(s). MDPI and/or the editor(s) disclaim responsibility for any injury to people or property resulting from any ideas, methods, instructions or products referred to in the content. |
© 2023 by the authors. Licensee MDPI, Basel, Switzerland. This article is an open access article distributed under the terms and conditions of the Creative Commons Attribution (CC BY) license (https://creativecommons.org/licenses/by/4.0/).