Article

Residual Stress and Dimensional Deviation in a Commercially Pure Titanium Thin Bipolar Plate for a Fuel Cell Using Laser Power Bed Fusion

1
Advanced Cutting Tool and Machining Center, Daegu Mechatronics & Materials Institute, Daegu 42715, Republic of Korea
2
3D Printing Manufacturing Process Center, Korea Institute of Industrial Technology, Ulsan 44776, Republic of Korea
3
Department Mechanical and Aerospace Engineering, Ulsan National Institute of Science and Technology (UNIST), Ulsan 44919, Republic of Korea
4
Department Intelligent Systems and Cybersecurity, Astana IT University, Astana 010000, Kazakhstan
*
Author to whom correspondence should be addressed.
These authors contributed equally to this work.
Metals 2023, 13(11), 1840; https://doi.org/10.3390/met13111840
Submission received: 15 October 2023 / Revised: 29 October 2023 / Accepted: 30 October 2023 / Published: 2 November 2023
(This article belongs to the Section Additive Manufacturing)

Abstract

:
In this study, the feasibility of commercially pure (CP)-Ti bipolar plates for fuel cells were assessed by designing, manufacturing, and evaluating thin plates fabricated through the laser powder bed fusion (L-PBF) technique. The width, height, and thickness of thin CP-Ti plates were carefully considered in its design to ensure comprehensive evaluation. The maximum displacement was measured through blue light scanning in accordance with the building direction. The finite element model and experimental results showed that the building layer per volume has a linear relationship with the maximum displacement and maximum residual tensile stress along the building direction. Thin plates with a high aspect ratio (198 × 53 × 1.5 mm) had the lowest maximum displacement (0.205 mm) when building in the height direction and had a high correlation coefficient with the finite element model (0.936). Proper aspect ratio design and building strategy enable highly accurate manufacturing of CP-Ti thin plates for fuel cell systems.

1. Introduction

The fuel cell system is an energy conversion device that is attracting attention to overcome problems related to greenhouse gas [1], climate change [2,3], and energy shortage [4] due to its eco-friendliness and high efficiency [5]. When designing a fuel cell stack, it is essential to consider space and cost, while simultaneously aiming to enhance cell performance and lifespan [6]. Among fuel cell components, the bipolar plate accounts for 30–40% of the total manufacturing cost, therefore the design of the bipolar plate is an important factor in fuel cell design [7]. Furthermore, metal-based bipolar plates have been an active area of research in recent years since mechanical properties are important for fuel cell stack structural integrity.
Among the metals used for bipolar plate production, Titanium (Ti) is a favorable choice due to its low density and high strength-to-weight ratio, which provides a reduction in weight without compromising performance and durability [8]. This has made Ti a focal point for weight reduction in fuel cell systems [9,10]. Ti-based bipolar plates offer substantial weight reduction potential for fuel cell systems, enhancing efficiency, and portability. Consequently, they become increasingly appealing for a wide range of applications, particularly within the transportation sector [7,11]. However, the high melting point of Ti, approximately 1668 °C, imposes difficulties in the casting and forging processes when forming complex designs [12]. Additive manufacturing provides a significant advantage in producing intricate geometries with exceptional mechanical properties, thereby enhancing the performance and efficiency of fuel cell systems [11]. However, thin structures produced using L-PBF are highly susceptible to various types of failures such as collapse, super-elevation, porosity, and poor structural quality due to their high thermal gradient [13,14,15,16]. In this regard, Vastola et al. presented that the main distortion factors of L-PBF build parts according to the shape of the thin structure (fillet radius, tube shape, part width) via design maps [17]. Grodon et al. reported that the residual stress from the temperature gradient generated by building the thin structure is released through displacement and distortion [18]. In addition, by comparing simulation and 3D scan results, quantitatively similar values were observed for distortion. Lu et al. showed that as the wall thickness of thin structure increases, the structural rigidity increases, resulting in suppressed warpage [19]. Moreover, open structures (such as semi-cylinders and L-shapes) are more susceptible to warping compared to closed structures due to their reduced structural stiffness.
Furthermore, the thin structure is a key component of the fuel cell stack for weight reduction, and distortion should be minimized to prevent mixing of the reactant gas such as hydrogen and oxygen, or air. As such, the fabrication of geometrically accurate and structurally integral thin plates requires an approach involving experimental modeling and numerical analysis tailored to the specific structure [20,21,22]. Hence, the feasibility of CP-Ti bipolar plates was evaluated by designing, manufacturing, and evaluating bipolar thin plates fabricated through L-PBF in this study.

2. Experimental and Computational Set-Up

2.1. Experimental Detail

The commercially pure Ti powder (CP-Ti, ASTM Grade 2 supplied by SLM Solutions, Lübeck, Germany [23]). The powder size distribution (PSD) was evaluated using a laser scattering particle size distribution analyzer (LA-960, HORIBA, Kyoto, Japan). The morphologies and particle size distribution (PSD) values of the CP-Ti powders were shown in Figure 1. The CP-Ti powders used in this study showed the near-spherical particles with 43.75 ± 1.7 μm of average particle sizes. The D50, D10, and D90 values of powders were 45.14, 29.09, and 66.37 μm respectively as listed in Table 1.
Thin plates were manufactured by the SLM 280 HL machine, and process parameters were optimized by preliminary experiments. Laser power, scanning speed, layer thickness, and hatching distance were set to 284 W, 651 mm/s, 0.03 mm, and 0.18 mm, respectively. Layers were scanned through stripe and layer-wise rotation angle set to be 15° (starting angle = 45°).
To examine the fundamental mechanical properties of samples, tensile bars were also fabricated with xz-orientations during AM process, as shown in Figure 2. According to the ASTM E8/E8M-08 [24] standard for tensile tests of metallic materials, the samples were prepared with an overall length (L) of 100 mm, gauge length (G) of 40 mm, width (W) of 6 mm, and thickness (T) of 3 mm. The grip section was 30 mm in length (B), 10 mm in width (C), and had a 6 mm radius of fillet (R). Tensile tests were carried out three times with crosshead speed of 0.2 mm/s using high temperature universal testing machine (Instron 5985, Norwood, MA, USA).
The density of each component was measured by applying the Archimedes’ principle (ASTM B962-13 [25]). The mass of each part in air (ma) and water (mw) was measured three times each using an electronic scale (MDS-300, Osaka, Japan). The density of part (ρp) was obtained by inserting an average mass into Equation (1) below.
ρ p = m a m a m w × ρ w
where ρw is the density of water. Part density was converted into relative density (γρ) through Equation (2) below.
γ ρ = ρ p ρ f
where ρf is the density value for a fully dense part.
The primary design of our plates is illustrated in Figure 3. The dimension is 146 × 69 × 1.8 (or 2.2) mm, and empty regions exist at four corners due to its functional requirement. However, the empty region acted as a stress condenser around it during PBF process. To address the empty corners, solid dummy plates were used to fill the space and connected to the plate body with a lattice structure of 0.3 Φ × 1 mm in height direction, as shown in Figure 3.
A 3D laser scan was applied for quantitative analysis of the distortion after fabricating the thin plates. They were then scanned on the base plate using an optical 3D scanner (GOM ATOS 5, Braunschweig, Germany) with a 360° rotation at an angle of 45° per piece. After adjustments and coordinate alignment, the STL file was extracted from the scanned point data using ATOS Professional 2019. The object’s contour was then extracted using Geomagic Design X (V16). To conduct a 3D comparison measurement, the dimensional deviation for the width, height, and thickness of the part was assessed with a 100% sampling ratio after specifying the x, y, and z directions using Geometric Control X software (V18.1).

2.2. Simulation Approach

This chapter provides the FE approach towards simulating displacement of bipolar plates via a commercial software—ANSYS Additive Print (AAP, V1.9.1) known as hands-on and user-friendly software that simulates the L-PBF printing job by incorporating mechanical properties of materials [26]. The L-PBF-build job is designed to be simulated in a layer-wise manner of voxel elements instead of meshes which accesses faster exploration of results within AAP. As per the algorithm of AAP, the voxelization of uploaded stl part is firstly activated. Upon completion, thermal and mechanics solvers that address mechanical response of a part during the build job is conducted depending on the strain modes (e.g., assumed strain, scan pattern and thermal strain). Since our study targets thin wall structures which are prone to plastic deformation [27,28,29], it is necessary to simulate the build job by using J2 plasticity model [30] to ensure precise prediction of residual stress and deformations. This study utilized the thermal strain mode as the objective was to investigate the relationship between the maximum displacement and building volume per layer (BVPL), not to make comparisons between different strain modes which were already reported in elsewhere [31]. In order to enhance the accuracy of the FE model simulation, a calibration thin plate of 50 × 20 × 1 mm (W × H × T) was utilized. Distortion in thin plates is primarily induced by the accumulated residual stress on each layer, which leads to a significant alteration of their original shape [32].
To ensure anisotropic effects of scan directions on the orientation of thin plates, scan patterns of longitudinal (0,0) and traverse (90,0) directions are used as suggested by ANSYS. A thin calibration sample was simulated with the voxel sizes of 0.15 mm and 0.25 mm to adjust and compensate accuracy and numerical expense. The results from Table 2 indicate that there is no substantial variation in the maximum displacement and residual stress values. However, the simulation time for a 0.15 mm voxel size is almost four times longer in comparison to the simulation time for a 0.25 mm case. Therefore, the voxel size of 0.25 mm was chosen for the calibration process. However, for the actual simulation of BPs to compensate the numerical expenses even more, a slightly larger 0.3 mm of voxel size was chosen.
Thin plates were used to calibrate strain scaling factor ( S S F ), anisotropic strain coefficients ( A S C i = I I , , z   ) and the displacements of experimental (scanned) and simulated thin plates were measured at a height of z = 4   m m   while keeping A S C z = 1 as recommended by ANSYS. Both the isotropic and anisotropic factors were iteratively calculated until the difference between the actual and adjusted displacements was less than 30 μ m , which is the thickness of a single layer. As a result, the calibrated factors are provided in Table 3 and Table 4 along with material and process parameters used for actual BP, respectively. The A S C s are closer to 1, indicating a minor anisotropic effect. Moreover, it should be noted that fine tuning was not conducted as the difference between experimental and simulated distortions is already less than a single layer (30 μ m ), thus final isotropic and anisotropic factors for actual BPs are shown in Table 3 using SLM solution’s scan patterns.

3. Results and Discussions

Using the L-PBF technique, a typical microstructure, due to local laser melting and layer by layer process, causes higher strength and lower ductility in final products. The basic properties of the CP-Ti samples were investigated first to ensure that traditional techniques such as sheet forming could be substituted with the L-PBF process without the need for any heat treatment. The batches of tensile bars and mechanical behavior of an as-built CP-Ti sample are shown in Figure 2a,b, respectively. The as-built CP-Ti part showed high relative density (99.58   ±   0.06%) with a higher ultimate tensile strength and elongation-to-failure values than those manufactured by conventional techniques [22], such as sheet forming as listed in Table 5. There is no significant difference in ductility between sheet-formed and AMed samples. Thus, an additional annealing process after AM is not introduced in this work.
Since PBF and DED-type AM methods are typically conducted in a build chamber with limited volume, there can be difficulties in printing large-sized products. In our AM system, some bipolar plates are bigger than the bottom base plate (280 × 280 mm), thus allowing for construction along the height direction. The effect of build direction (width or height) on building behavior and the resultant dimension variation were addressed in this study. Building along the width or height direction is subsequently denoted as WDB or HDB, respectively.
Figure 4 shows the bipolar plates with two different thicknesses (herein t refers to thickness of 1.8 mm or 2.2 mm, respectively): 1.8 and 2.2 t, manufactured along both height and width directions. In the case of WDB or HDB, the long side (x-axis) or short side (y-axis) of bipolar plates adjoin a bottom base plate, respectively. WDB was apparently successful at both 1.8 t and 2.2 t thicknesses as shown in Figure 4a. In contrast, distortion similar to buckling was observed during HDB of the 1.8 t parts in Figure 4b. It is thought that initiation stress of buckling (σb) decreases at thin plate thickness, and residual stress (σR) could therefore be larger than σb [17].
The actual dimension deviation from the original design was checked with the plates prepared by the PBF process, as presented in Table 6. The maximum deviation in WDB manifested at x length (long side) as minus values (−0.386 mm:1.8 t, −0.460 mm:2.2 t), whereas the that in HDB was observed at y length (short side) as minus values (−0.258 mm:1.8 t, −0.281 mm:2.2 t). The minus maximum values were always found parallel with a direction of the side edge attached on the bottom base plate. Considering the percentage ratio of the deviation per the side length, the highest relative difference (−0.38%:1.8 t, −0.41%:2.2 t) occurred at the condition of HDB and y length. On the other hand, because the deviation was comparatively negligible and at z (or thickness) direction, there was no tendency of deviation by the plate thickness and the building directions.
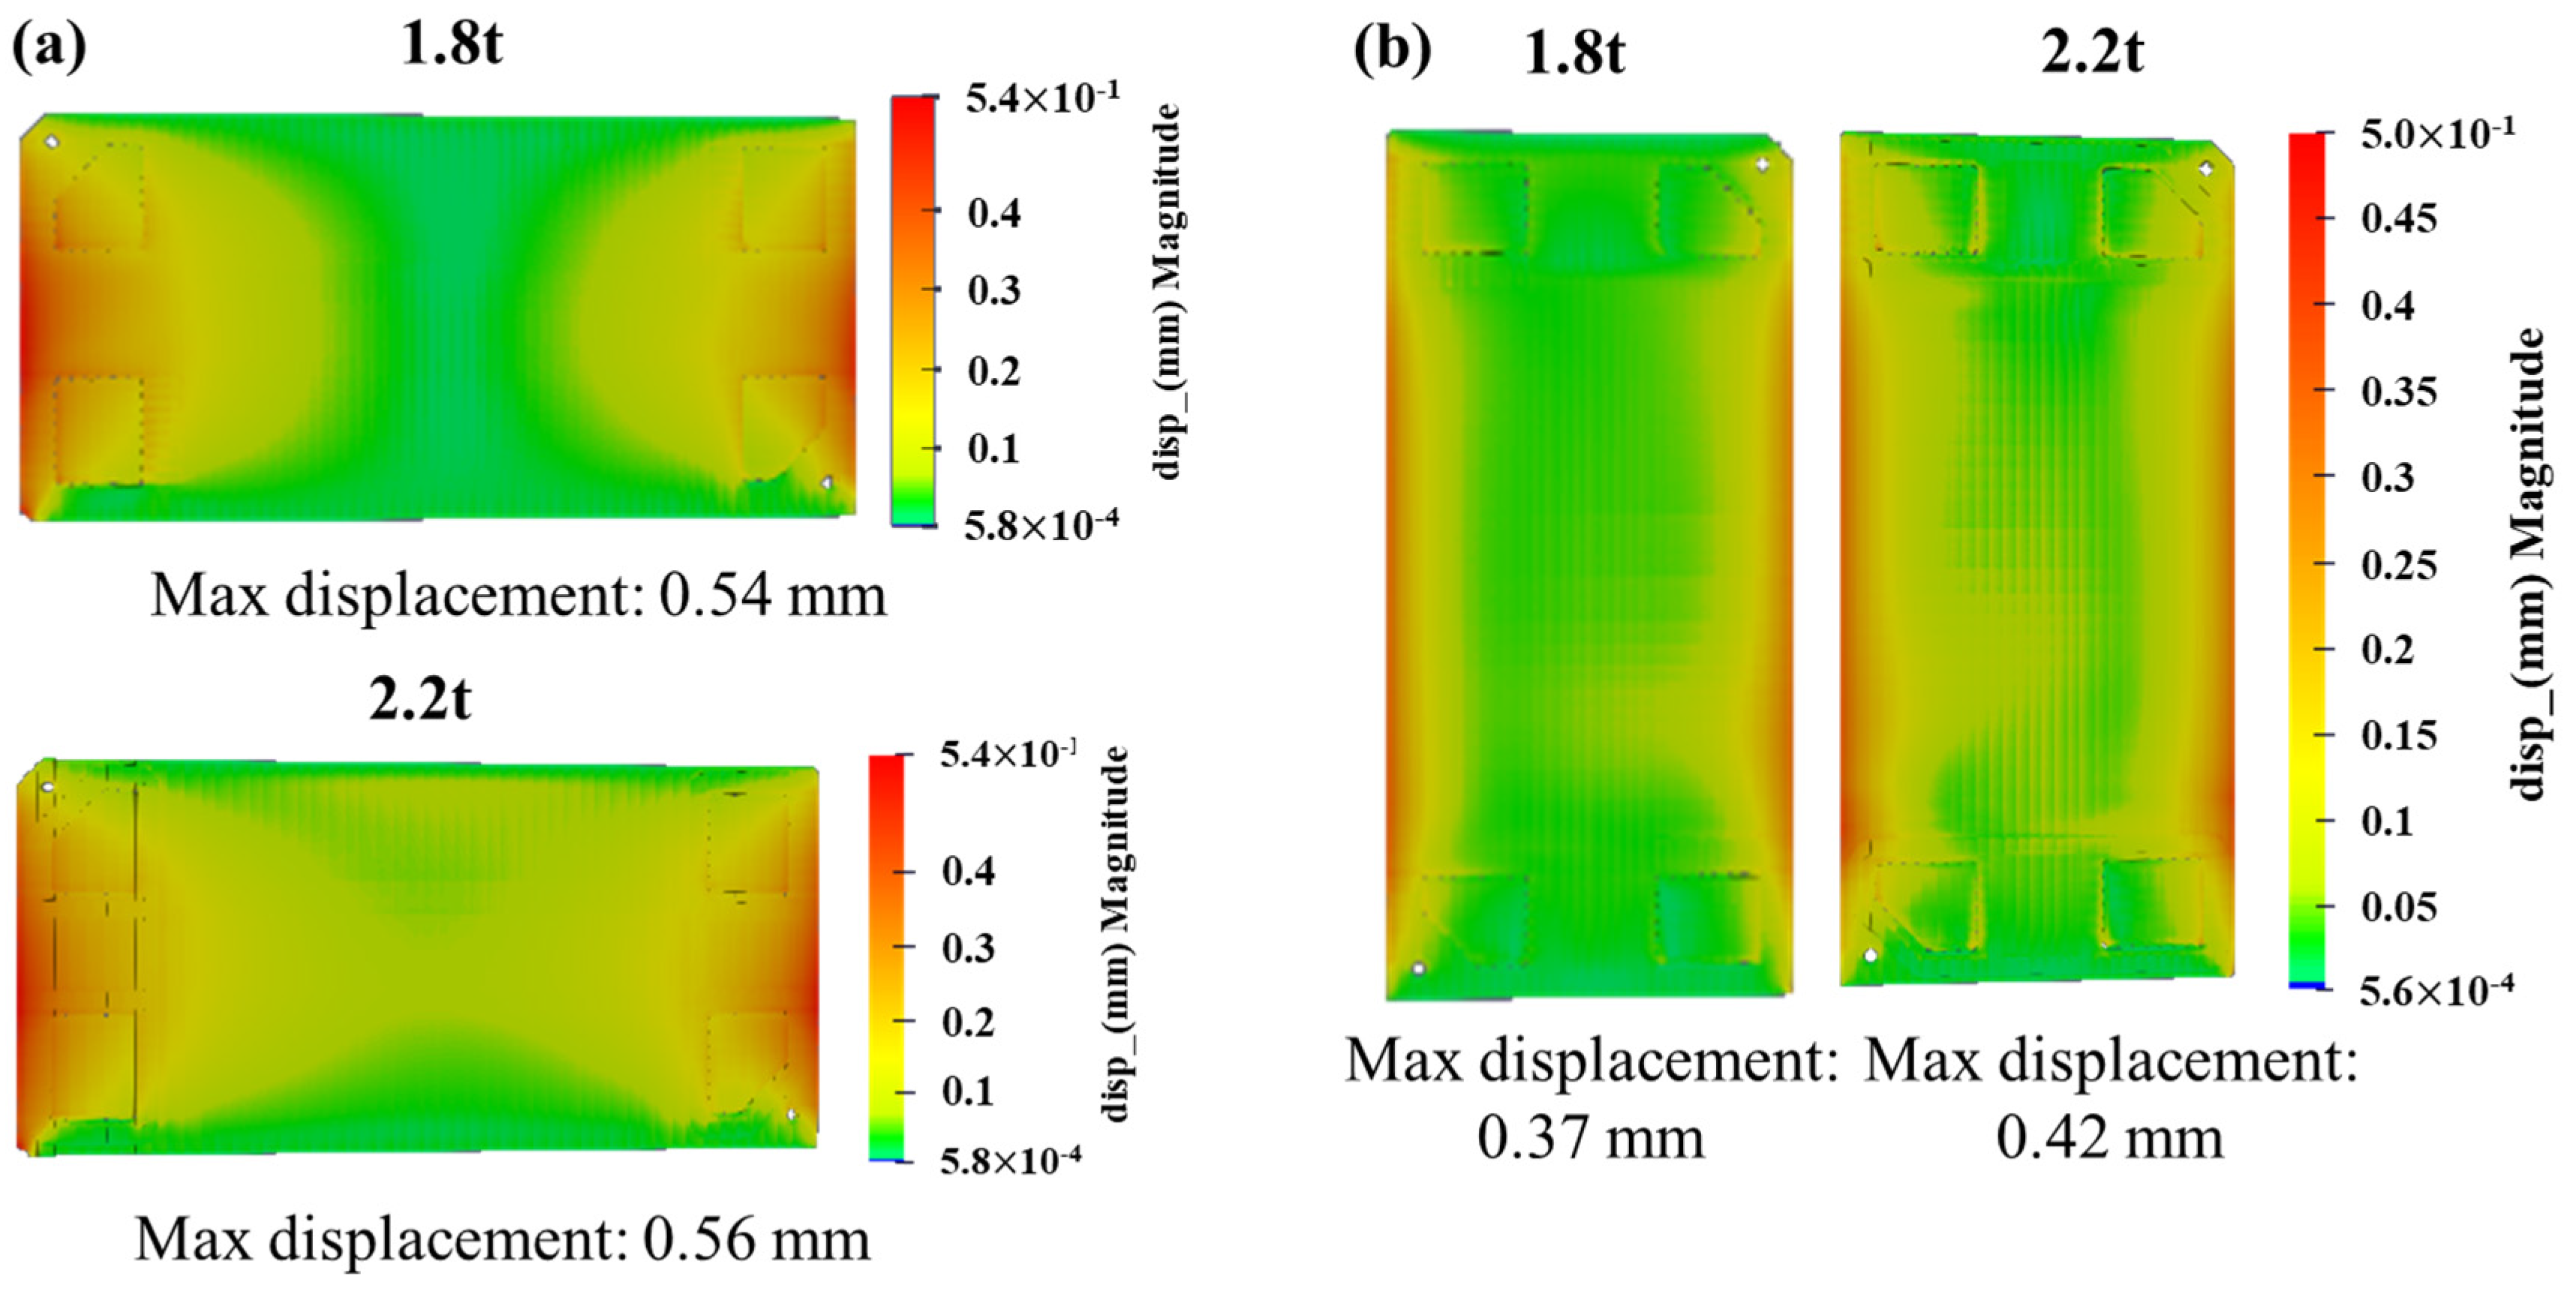
To examine the deviation distribution in detail, 2D displacement distribution of the bipolar plates obtained using a 3D scanner is shown in Figure 5 according to the thickness and the build direction. WDB exhibits most distortion at the edge of the middle region of both 1.8 t and 2.2 t parts in Figure 5a. As the thickness of the parts increased from 1.8 t to 2.2 t, an overall distorted region increased (see a yellow area). The maximum displacement, however, increased a little (3.6%) from 0.54 mm to 0.56 mm. In the case of HDB (Figure 5b), the most distortion occurred at the edge of middle region, similarly with WDB. It expands the distorted region to increase the plate thickness, and the maximum displacement also increased from 0.37 mm to 0.42 mm (13.5%), larger than in WDB, in Figure 4b.
It has been reported that as the thickness increases, the material mass and heat capacity also increase, as does the strain [33]. In this study, since not only the thickness but also the building direction changes, such a thickness effect necessitates incorporation into the consideration of a building volume per layer (BVPL, s c a n   l e n g t h × p a r t   t h i c k n e s s × l a y e r   t h i c k n e s s ,   m m 3 ), which encapsulate both the thickness and build direction.. To examine the relation between dimension deviation and BVPL, the displacement which happened under some BVPL values was predicted using FE model simulation. Figure 6 shows the 2D displacement distribution and maximum displacement at different BVPL values. The simulated displacement distribution is generally coincidental with the previous experiment results at various BVPL values. The maximum displacement was marked at the upper edge for BVPL values of 3.105, 4.14, and 5.175 mm3 (Figure 6a), whereas, for BVPL values of 6.57, 8.76, 10.95, and 19.32 mm3, the maximum displacement occurred at the middle edge (Figure 6b).
The finite element (FE) model and experimental results were compiled and summarized in Table 7, taking into account the BVPL. Figure 7 indicates the relation of the FE model and experimental results as a plot. As a result of the fitting, both the FE model and the experimental value have a linear relationship between maximum displacement and BVPL. The correlation coefficients between BVPL and maximum displacement for FE model and experimental results are 0.9989 and 0.9981. The predicted results of the maximum displacement of the FE model were larger than the experimental results, most probably because the heated powder bed factor during building was ignored in the FE model. To analyze the relationship between BVPL and maximum displacement in more detail, design factors of part thickness, width, and height were considered, as summarized in Table 8. A thermal deformation simulation was conducted, with the axis of displacement being normal to the surface of each component. The results demonstrated that an increase in BVPL corresponded to an increase in the maximum displacement, as illustrated in Figure 7.
Chen et al. [34] suggests that during the building of thin plates, the direction of stress is a critical factor in determining structural stability. As the thickness of these plates decreases, it is predominantly longitudinal stress that becomes increasingly influential [35]. Hence, it was undertaken to compare and analyze longitudinal stress in relation to building direction (z-direction). As a result of the residual stress distribution (Figure 8), the largest tensile stress was observed in the z-direction (building direction) from the edge of the bottom (the connection area between the parts and the substrate) in all parts. As the BVPL increased from 3.105 mm3 to 4.14 mm3, a maximum residual tensile stress in z-direction was observed to be 600 MPa, but as the BVPL increased by 5.175 mm3 or more, the maximum residual tensile stress in the z-direction increased to 710 MPa. The stress distribution according to the height of the part, based on the point where the maximum residual tensile stress occurs at the end of the part, was analyzed according to the BVPL, and the results are shown in Figure 8c. During the initial building, the melt pool shrinks during solidification due to a rapid cooling rate, but this shrinkage is suppressed by the base plate, resulting in the highest tensile residual stress [36]. As the BVPL increased from 3.105 mm3 to 10.95 mm3, the maximum residual tensile stress increased from 600 MPa to 680 MPa. Subsequently, as the building continues, a constant tensile residual stress along the building direction is maintained and then converted to compressive residual stress, completing the building process. In other words, as the BVPL increases, a high initial tensile residual stress occurs in the building direction, followed by observed similar residual stress behavior. These results suggest that, in the small BVPL range, the maximum displacement and BVPL have a linear relationship, likely attributed to higher residual stress. It can be supported by the works of Parry et al. [37], in which they state that the magnitude of residual stress during the manufacturing process of rectangular forms is determined by the scan vector length.
Meanwhile, Chen et al. [34] reported that the maximum displacement of a Ti-6Al-4V thin-walled part decreased as the thickness increased during the building process, due to a reduction in the thermal accumulation effect and an increase in constraint strength in the building area. However, in this study, a significant increase in maximum displacement was observed in thick CP-Ti plates with increasing BVPL. This can be attributed to the reduction in thermal accumulation due to the higher thermal conductivity of CP-Ti (16.4 W/m·K) compared to the Ti-6Al-4V alloy (6.7 W/m·K). The result implies that the temperature gradient between the bottom baseplate and the top layer during the building process does not play a significant role to the distortion of CP-Ti thin plate. However, as the BVPL increases, the heat conduction and distribution to the base plate increase, suggesting an increase in maximum displacement. In addition, it can explain why low residual stress and small deviation take place at HDB, having small BVPL value (or heat transfer area) and a long heat transfer length.
For validation of the above assumption, more specific design cases of the bipolar plates are presented with a series of analysis sequences in Figure 9. It includes (i) the drawing of the designed plates (Figure 9a), (ii) the 3D scan results (Figure 9b), (iii) the finite element analysis of the previously designed thin plate (taking into account the BVPL), and (iv) the building results of the newly redesigned thin plate (Figure 9c). A comparative analysis was performed by designing plates with a high aspect ratio (ranging from 1:2.12 to 1:3.74) and low thickness (1.5 t) to investigate the impact of reducing the BVPL when compared to the previous parts. As a result of a 3D scan after building (Figure 9b), a large dimensional deviation of height versus width is observed, and this also shows the lowest maximum displacement (0.205 mm). According to Figure 9c, the correlation coefficient, fitting with the previous FE model, was 0.93554, which indicates that the maximum displacement value decreases as the building volume decreases. As the aspect ratio increases, the heat dispersion cross-sectional area decreases compared to the previously scanned area, resulting in a higher possibility of thermal deformation [37]. However, due to the low BVPL in the height direction, it is anticipated to have the lowest maximum displacement value (0.205 mm).

4. Conclusions

In this work, CP-Ti thin plates were manufactured using L-PBF, and their dimensional accuracy was assessed using the bipolar plate’s design. The main conclusions of the investigation, which involved FE analysis and 3D-laser scanning, are listed below:
  • The employment of the L-PBF technique, in synergy with 3D scanning and an FE model, provides substantial evidence that the production of CP-Ti bipolar plates, characterized by minimal deformation, is indeed feasible.
  • Maximum deformation primarily occurs at both edges of the parts. The deformation behavior varies based on the building direction, and the maximum distortion occurs at a higher position in HDB as compared to WDB. In the small BVPL range, the maximum tensile residual stress and displacement in the building direction exhibit a linear relationship.
  • As a result of designing and building a bipolar plate with high aspect ratio (198 × 53 × 1.5 mm) introduced in consideration of the BVPL values, the lowest one (0.205 mm) among maximum displacements was observed compared to the previous design (Figure 5). There is also a high correlation coefficient between the experiment and FE results (0.936).

Author Contributions

Conceptualization, N.-H.K. and D.-H.K.; Methodology, T.L., U.A., N.-H.K. and D.-H.K.; Software, T.L. and U.A.; Validation, T.L.; Investigation, U.A.; Writing—original draft, T.L. and U.A.; Writing—review and editing, N.-H.K. and D.-H.K.; Funding acquisition, D.-H.K. All authors have read and agreed to the published version of the manuscript.

Funding

Ministry of SMEs and Startups; MOTIE (Ministry of Trade, Industry and Energy), project # SE230035; project # KM230332.

Data Availability Statement

Not applicable.

Conflicts of Interest

The authors declare no conflict of interest.

References

  1. Liu, F.; Zhao, F.; Liu, Z.; Hao, H. The Impact of Fuel Cell Vehicle Deployment on Road Transport Greenhouse Gas Emissions: The China Case. Int. J. Hydrogen Energy 2018, 43, 22604–22621. [Google Scholar] [CrossRef]
  2. Singla, M.K.; Nijhawan, P.; Oberoi, A.S. Hydrogen Fuel and Fuel Cell Technology for Cleaner Future: A Review. Environ. Sci. Pollut. Res. 2021, 28, 15607–15626. [Google Scholar] [CrossRef]
  3. Azni, M.A.; Md Khalid, R.; Hasran, U.A.; Kamarudin, S.K. Review of the Effects of Fossil Fuels and the Need for a Hydrogen Fuel Cell Policy in Malaysia. Sustainability 2023, 15, 4033. [Google Scholar] [CrossRef]
  4. Staffell, I.; Scamman, D.; Velazquez Abad, A.; Balcombe, P.; Dodds, P.E.; Ekins, P.; Shah, N.; Ward, K.R. The Role of Hydrogen and Fuel Cells in the Global Energy System. Energy Environ. Sci. 2019, 12, 463–491. [Google Scholar] [CrossRef]
  5. Wang, Y.; Chen, K.S. PEM Fuel Cells: Thermal and Water Management Fundamentals; Momentum Press: Highland Park, IL, USA, 2013; ISBN 1606502476. [Google Scholar]
  6. Roth, B.; Frank, R.; Kleffel, T.; Schneider, K.; Drummer, D. High-Precision Thin Wall Bipolar Plates for Fuel Cell Applications via Injection Compression Molding with Dynamic Mold Temperature Control. Polymers 2022, 14, 2799. [Google Scholar] [CrossRef]
  7. Pollet, B.G.; Kocha, S.S.; Staffell, I. Current Status of Automotive Fuel Cells for Sustainable Transport. Curr. Opin. Electrochem. 2019, 16, 90–95. [Google Scholar] [CrossRef]
  8. Welsch, G.; Boyer, R.; Collings, E.W. Materials Properties Handbook: Titanium Alloys; ASM International: Almere, The Netherlands, 1993; ISBN 0871704811. [Google Scholar]
  9. Karimi, S.; Fraser, N.; Roberts, B.; Foulkes, F.R. A Review of Metallic Bipolar Plates for Proton Exchange Membrane Fuel Cells: Materials and Fabrication Methods. Adv. Mater. Sci. Eng. 2012, 2012, 828070. [Google Scholar] [CrossRef]
  10. Yumiya, H.; Kizaki, M.; Asai, H. Toyota Fuel Cell System (TFCS). World Electr. Veh. J. 2015, 7, 85–92. [Google Scholar] [CrossRef]
  11. Celik, S.; Timurkutluk, B.; Aydin, U.; Yagiz, M. Development of Titanium Bipolar Plates Fabricated by Additive Manufacturing for PEM Fuel Cells in Electric Vehicles. Int. J. Hydrogen Energy 2022, 47, 37956–37966. [Google Scholar] [CrossRef]
  12. Mitchell, A. Melting, Casting and Forging Problems in Titanium Alloys. Mater. Sci. Eng. A 1998, 243, 257–262. [Google Scholar] [CrossRef]
  13. Grasso, M.; Colosimo, B.M. Process Defects and in Situ Monitoring Methods in Metal Powder Bed Fusion: A Review. Meas. Sci. Technol. 2017, 28, 44005. [Google Scholar] [CrossRef]
  14. Spears, T.G.; Gold, S.A. In-Process Sensing in Selective Laser Melting (SLM) Additive Manufacturing. Integr. Mater. Manuf. Innov. 2016, 5, 16–40. [Google Scholar]
  15. Depboylu, F.N.; Yasa, E.; Poyraz, O.; Korkusuz, F. Thin-Walled Commercially Pure Titanium Structures: Laser Powder Bed Fusion Process Parameter Optimization. Machines 2023, 11, 272. [Google Scholar] [CrossRef]
  16. Li, C.; Gouge, M.F.; Denlinger, E.R.; Irwin, J.E.; Michaleris, P. Estimation of Part-to-Powder Heat Losses as Surface Convection in Laser Powder Bed Fusion. Addit. Manuf. 2019, 26, 258–269. [Google Scholar] [CrossRef]
  17. Vastola, G.; Sin, W.J.; Sun, C.N.; Sridhar, N. Design Guidelines for Suppressing Distortion and Buckling in Metallic Thin-Wall Structures Built by Powder-Bed Fusion Additive Manufacturing. Mater. Des. 2022, 215, 110489. [Google Scholar] [CrossRef]
  18. Gordon, J.V.; Pauza, J.; Choi, A.; Farfel, M.; Bennett, M.; Deering, R.; Griffith, B.; Johnson, K.; Zhang, Y.J.; Deal, A.; et al. Method for Rapid Modeling of Distortion in Laser Powder Bed Fusion Metal Additive Manufacturing Parts. J. Mater. Eng. Perform. 2021, 30, 8735–8745. [Google Scholar] [CrossRef]
  19. Lu, X.; Chiumenti, M.; Cervera, M.; Tan, H.; Lin, X.; Wang, S. Warpage Analysis and Control of Thin-Walled Structures Manufactured by Laser Powder Bed Fusion. Metals 2021, 11, 686. [Google Scholar] [CrossRef]
  20. Yang, Q.; Zhang, P.; Cheng, L.; Min, Z.; Chyu, M.; To, A.C. Finite Element Modeling and Validation of Thermomechanical Behavior of Ti-6Al-4V in Directed Energy Deposition Additive Manufacturing. Addit. Manuf. 2016, 12, 169–177. [Google Scholar] [CrossRef]
  21. Cao, J.; Gharghouri, M.A.; Nash, P. Finite-Element Analysis and Experimental Validation of Thermal Residual Stress and Distortion in Electron Beam Additive Manufactured Ti-6Al-4V Build Plates. J. Mater. Process. Technol. 2016, 237, 409–419. [Google Scholar] [CrossRef]
  22. Lu, X.; Lin, X.; Chiumenti, M.; Cervera, M.; Hu, Y.; Ji, X.; Ma, L.; Yang, H.; Huang, W. Residual Stress and Distortion of Rectangular and S-Shaped Ti-6Al-4V Parts by Directed Energy Deposition: Modelling and Experimental Calibration. Addit. Manuf. 2019, 26, 166–179. [Google Scholar] [CrossRef]
  23. Available online: https://www.slm-solutions.com/fileadmin/Content/Powder/MDS/MDS_Ti-Alloy_Ti_Grade_2_0519_EN.pdf (accessed on 30 October 2023).
  24. ASTM E8/E8M-08; Standard Test Methods for Tension Testing of Metallic Materials. ASTM International: West Conshohocken, PA, USA, 2016; Volume 3. [CrossRef]
  25. ASTM B962-13; Standard Test Methods for Density of Compacted or Sintered Powder Metallurgy (PM) Products Using Archimedes’ Principle. ASTM International: West Conshohocken, PA, USA, 2013.
  26. Auyeskhan, U.; Lee, T.; Park, Y.; Kim, D.; Kim, N. Design Study for Performance Improvement of a Hybrid Pico Pelton Turbine and Its Additive Manufacturing Using a Laser Bed Powder Fusion Method. Int. J. Interact. Des. Manuf. 2023, 1–11. [Google Scholar] [CrossRef]
  27. Ding, J.; Qu, S.; Zhang, L.; Wang, M.Y.; Song, X. Geometric Deviation and Compensation for Thin-Walled Shell Lattice Structures Fabricated by High Precision Laser Powder Bed Fusion. Addit. Manuf. 2022, 58, 103061. [Google Scholar] [CrossRef]
  28. Poncelet, O.; Marteleur, M.; van der Rest, C.; Rigo, O.; Adrien, J.; Dancette, S.; Jacques, P.J.; Simar, A. Critical Assessment of the Impact of Process Parameters on Vertical Roughness and Hardness of Thin Walls of AlSi10Mg Processed by Laser Powder Bed Fusion. Addit. Manuf. 2021, 38, 101801. [Google Scholar] [CrossRef]
  29. Mukherjee, T.; Zhang, W.; DebRoy, T. An Improved Prediction of Residual Stresses and Distortion in Additive Manufacturing. Comput. Mater. Sci. 2017, 126, 360–372. [Google Scholar] [CrossRef]
  30. Jagatheeshkumar, S.; Raguraman, M.; AVS, S.P.; Nagesha, B.K.; Chandrasekhar, U. Study of Residual Stresses and Distortions from the Ti6Al4V Based Thin-Walled Geometries Built Using LPBF Process. Def. Technol. 2023, 28, 33–41. [Google Scholar] [CrossRef]
  31. Mayer, T.; Brändle, G.; Schönenberger, A.; Eberlein, R. Simulation and Validation of Residual Deformations in Additive Manufacturing of Metal Parts. Heliyon 2020, 6, e03987. [Google Scholar] [CrossRef]
  32. Wu, Z.; Narra, S.P.; Rollett, A. Exploring the Fabrication Limits of Thin-Wall Structures in a Laser Powder Bed Fusion Process. Int. J. Adv. Manuf. Technol. 2020, 110, 191–207. [Google Scholar] [CrossRef]
  33. Xing, W.; Ouyang, D.; Li, N.; Liu, L. Estimation of Residual Stress in Selective Laser Melting of a Zr-Based Amorphous Alloy. Materials 2018, 11, 1480. [Google Scholar] [CrossRef]
  34. Chen, C.; Xiao, Z.; Zhu, H.; Zeng, X. Deformation and Control Method of Thin-Walled Part during Laser Powder Bed Fusion of Ti–6Al–4V Alloy. Int. J. Adv. Manuf. Technol. 2020, 110, 3467–3478. [Google Scholar] [CrossRef]
  35. Brown, D.W.; Bernardin, J.D.; Carpenter, J.S.; Clausen, B.; Spernjak, D.; Thompson, J.M. Neutron Diffraction Measurements of Residual Stress in Additively Manufactured Stainless Steel. Mater. Sci. Eng. A 2016, 678, 291–298. [Google Scholar] [CrossRef]
  36. Xie, D.; Lv, F.; Yang, Y.; Shen, L.; Tian, Z.; Shuai, C.; Chen, B.; Zhao, J. A Review on Distortion and Residual Stress in Additive Manufacturing. Chin. J. Mech. Eng. Addit. Manuf. Front. 2022, 1, 100039. [Google Scholar] [CrossRef]
  37. Parry, L.A.; Ashcroft, I.A.; Wildman, R.D. Geometrical Effects on Residual Stress in Selective Laser Melting. Addit. Manuf. 2019, 25, 166–175. [Google Scholar] [CrossRef]
Figure 1. (a) Morphologies and (b) size distributions of CP-Ti Grade 2 powder particles.
Metals 13 01840 g001
Figure 2. (a) The batches of tensile bar and (b) the engineering stress–strain curve for as-built CP-Ti sample.
Metals 13 01840 g002
Figure 3. Thin plate with associated dimensions for calibration of Cp-Ti within AAP. t: thickness, mm.
Metals 13 01840 g003
Figure 4. Bipolar plates in (a) Width (WDB) and (b) Height (HDB) directions. t: thickness, mm.
Metals 13 01840 g004
Figure 5. Model and support design of bipolar plates. Thermal deformation results with variation of building direction; (a) width direction (WD) and (b) height direction (HD).
Metals 13 01840 g005
Figure 6. Thermal deformation results with variation of building volume per layer; (a) height direction (HD) and (b) width direction (WD) (maximum displacements along the building direction are indicated in the square).
Metals 13 01840 g006
Figure 7. Correlation between the finite element (FE) model and the experimental results of maximum displacements as a function of building volume per layer.
Metals 13 01840 g007
Figure 8. Building direction residual stress (σzz, MPa) according to BVPL; (a) height direction (HD), (b) width direction (WD), and (c) residual stress distribution along the building direction (maximum residual tensile stress along the building direction is indicated in the square, red box: WD, grey box: HD).
Metals 13 01840 g008aMetals 13 01840 g008b
Figure 9. (a) Model, support design of bipolar plates, (b) residual stress and displacement distribution along the building direction, (c) 3D scan results of as-built bipolar plates, and (d) comparison between the finite element (FE) model and new designed bipolar plate’s experimental results of maximum displacements, according to building volume per layer.
Metals 13 01840 g009
Table 1. Particle sizes of CP-Ti powders (μm).
D50D10D90
Powders45.1429.0966.37
Table 2. Voxel size adjustment for calibration of thin plates properties used for AAP simulation.
Scan PatternVoxel Size (mm)Max Displacement (mm)Max Von-Mises Stress (MPa)Time
(0,0)0.150.20227637.953 h:59 min
0.250.215766141 h:10 min
(90,0)0.150.08329655045 min
0.250.086375540.9611 min
Table 3. Mechanical properties of CP-Ti and calibrated factors for AAP simulation.
Stress ModeYield Strength (MPa)Elastic Modulus (GPa)SSFASCIIASCASCz
J2 plasticity505.89107.21.6980.8581.1421
Table 4. Optimized process parameters with scan patterns suggested for CP-Ti. Note that scan patterns were suggested by the SLM solutions.
ParameterValue
Baseplate Temperature (°C)200
Laser power (W)284
Scan speed (mm/s)651
Laser beam diameter (μm)80
Layer thickness (μm)30
Starting layer angle (°)5
Layer rotation angle (°)15
Hatching distance (μm)180
Slicing stripe width (mm)10
Table 5. Mechanical properties of as-built CP-Ti sample.
ProcessingRelative Density (%)Tensile Strength (MPa)Elongation at Failure (%)
L-PBF in this study99.58   ±   0.06582.73   ±   1.980.22   ±   0.01
Sheet forming-3450.20
Table 6. Dimensional deviation between designed and as-built plates.
Plate ThicknessBuild DirectionLength
XYZ
MeasuredDeviationMeasuredDeviationMeasuredDeviation
mm%mm%mm%
1.8 tWidth145.614−0.386−0.2769.085−0.085−0.121.797−0.003−0.17
Height146.1880.1880.1368.742−0.258−0.381.8880.0884.66
2.2 tWidth145.540−0.460−0.3269.1410.1410.202.2120.0120.54
Height146.1890.1890.1368.719−0.281−0.412.169−0.032−1.48
Table 7. Experimental results and the FE model of maximum displacement based on building volume per layer.
PartBuilding Volume Per Layer (mm3) M a x . D i s p l a c e m e n t (mm)
ExperimentsFE Model
1.8 t_WDB7.8840.4240.54
2.2 t_WDB9.6360.4600.56
1.8 t_HDB3.7260.2680.37
2.2 t_HDB4.5540.3370.42
Table 8. Bipolar plate design for the FE Model and experiments.
Dimension InformationFE ModelExperiments
Thickness (mm)1.5–2.51.8, 2.2
Part width (mm)146, 322146
Part height (mm)69, 13669
Building volume per layer (scan length × part thickness × layer thickness, mm3)3.11–19.323.73–9.64
Disclaimer/Publisher’s Note: The statements, opinions and data contained in all publications are solely those of the individual author(s) and contributor(s) and not of MDPI and/or the editor(s). MDPI and/or the editor(s) disclaim responsibility for any injury to people or property resulting from any ideas, methods, instructions or products referred to in the content.

