Abstract
Electrical machines play a major role in achieving a more sustainable economy by driving the further electrification of industry and transportation. To enhance the electric motor productivity during production and the efficiency during operation, it is essential to maximize the material yield rate during the production of stator and rotor sheet stacks and reduce iron losses during operation. Screen-printing technology can help to achieve these goals by producing thin magnetic sheet laminations in near-net-shape geometry, resulting in minimum material waste during production. Moreover, reducing the sheet thickness decreases the eddy current losses and avoids mechanical stress during manufacturing, leading to improved motor efficiency. Additionally, screen printing facilitates the production of multi-material components and variable alloy compositions. This study aims to identify the relevant factors and printing parameters so that screen-printed magnetic sheets can achieve product specifications. A method involving the statistical design of experiments is performed in several iterations to investigate the target parameters of the print cycle time, green part weight, shape integrity and layer thickness, and to analyze the main interdependencies. The results of this study provide valuable insights into optimizing the screen-printing process for soft magnetic sheets, enabling the production of efficient electric motors while reducing material scrap.
1. Introduction
The electrification strategy takes place at various levels and sectors. Several recent publications focus on the demand-driven control of energy supply via smart grids [1], as well as on temporary or buffer storage via high-performance battery systems and capacitors [2,3], and the conversion of electrical into mechanical energy via electric motors. Strengthening the use of electric machines in industry and mobility is a significant lever to reduce greenhouse gas emissions and address climate change on a global scale. As industry continuously moves towards a more sustainable future, the efficient and environmentally friendly production and energy-efficient use of electric machines have become increasingly important [4,5]. This transformation to sustainable value creation is necessary for both society and the economy because electrification leads to lower greenhouse gas emissions in diverse areas. The use of electrical generators in wind turbines can replace power generation from gas or coal. Battery electric vehicles (BEV) powered by electric motors can replace internal combustion engines (ICE) and electrical machines are increasing the efficiency of industrial applications and buildings. The already high efficiency of electric motors should be further improved in order to limit the amount of primary energy consumption [6].
For two reasons, many research and development projects start at this point. On the one hand, stator and rotor sheet packages, which account for around 50% of the weight of an electric motor, are the most relevant components for material savings [7]. Since electrical sheets are stamped out of a rolled coil in conventional motor production, a large amount of waste, approx. 50%, accrues in the manufacturing process [8]. On the other hand, the hysteresis and eddy current losses occurring in stator cores cause the highest proportion of losses in electric machines at middle and high frequencies [9]. The development of innovative material combinations, new motor designs or optimized magnetic sheets can significantly improve the efficiency of electric motors. These potentials can be achieved by using additive manufacturing (AM) technologies.
Currently, 3D-printed stator and rotor laminations are being investigated using various AM processes and materials for different application fields. Stornelli et al. investigate the properties of additively manufactured iron cores with an increased silicon content of 6.5% in combination with design optimization by segmentation using laser powder bed fusion (L-PBF) [10]. Tiismus, H. et al. investigate the effect of selectively introduced air gaps via selective laser melting (SLM) on AC core losses at 50 Hz frequency [11]. Cramer, C. et al. and Pham, T. et al. explore the Fe6Si potentials for binder jetting (BJ)-fabricated iron cores with high permeability, low coercivity and high electrical resistivity [12,13]. Co–Fe alloys as well as Ni–Fe alloys are also currently being investigated by Nartu, M. et al. [14] and Chaudhary, V. et al. [15], since they are characterized by the excellent combination of soft magnetic and mechanical properties. However, these materials are difficult to process.
The screen-printing process, using metallic pastes and a combined printing and sintering process, is already being used on a large scale for mechatronic products such as electronic circuit carriers [16]. Thick-film flatbed screen printing is also state-of-the-art in the development and production of solar cells. Over 95% of c-Si solar cells produced worldwide are manufactured using flatbed screen printing [17]. Tepner et al. demonstrate in Ref. [18] the development of a knotless screen with an angle of 0° to maximize paste transfer and thus product efficiency. Initial research approaches for the screen-printing of electric motor components, and particularly for the soft magnetic core, investigate the applicability of materials and processes. Ref. [19] conceptually demonstrates the holistic process chain of additively manufactured magnetic sheets from the powder to the component using screen-printing. Ref. [20] highlights the advantage of maximum material utilization through the production of near-net-shape magnetic sheets via screen printing and investigates the competitiveness of three iron–silicon powders for use in electrical machines in comparison with conventional reference electrical sheets based on losses at various frequencies. Mix et al. investigate Fe-6.5Si powders for the screen printing of rotor laminations to increase the efficiency of electrical machines [21].
Screen printing differs significantly from other additive manufacturing processes. The magnetic sheets are printed to near net shape via a planar high-throughput screen printing process using single-layer printing. This means that single sheets or even stator-/rotor layouts with particularly favorable magnetic properties are produced. These properties can be achieved because the screen printing process offers a high degree of freedom with respect to iron-based alloy composition, layer thickness and topology. The entire process chain is described in Section 2.1. Near-net-shape screen printing aims to maximize resource efficiency in production by eliminating punching waste as well as minimizing iron losses during machine operation by reducing sheet thickness to around 100 µm. The screen printing process offers very high productivity, especially within the context of additive manufacturing processes [22]. It enables flexible, cost-effective and short-term adaptation for the design of the final stator laminations according to the product requirements, since no complex tools are required.
This research addresses the key and conflicting challenges of achieving cycle time for serial production while maintaining high print quality and various interactions between the process steps. Therefore, several statistical Design of Experiments (DoEs) are systematically carried out and analyzed using the Minitab software package.
2. Materials and Methods
This section describes the screen printing process and the methods used to investigate how to improve it. Firstly, the printing process is described within the context of the overall process chain to produce magnetic sheets from powder to component. Then, the relevant technological characteristics of screen printing are explained. The methodology section starts with the identification of relevant process and system parameters, followed by the statistical design of experiments.
2.1. Manufacturing Process for Printed Magnetic Sheets
Flatbed screen printing is used to produce magnetic sheets. This production process is divided into 4 main process steps: powder and paste production, screen printing and drying, thermal processing and, finally, processing into sheet lamination stacks. These main processes are divided into sub-processes, which are explained in the following sub-chapters.
2.1.1. Powder Processing and Paste Production
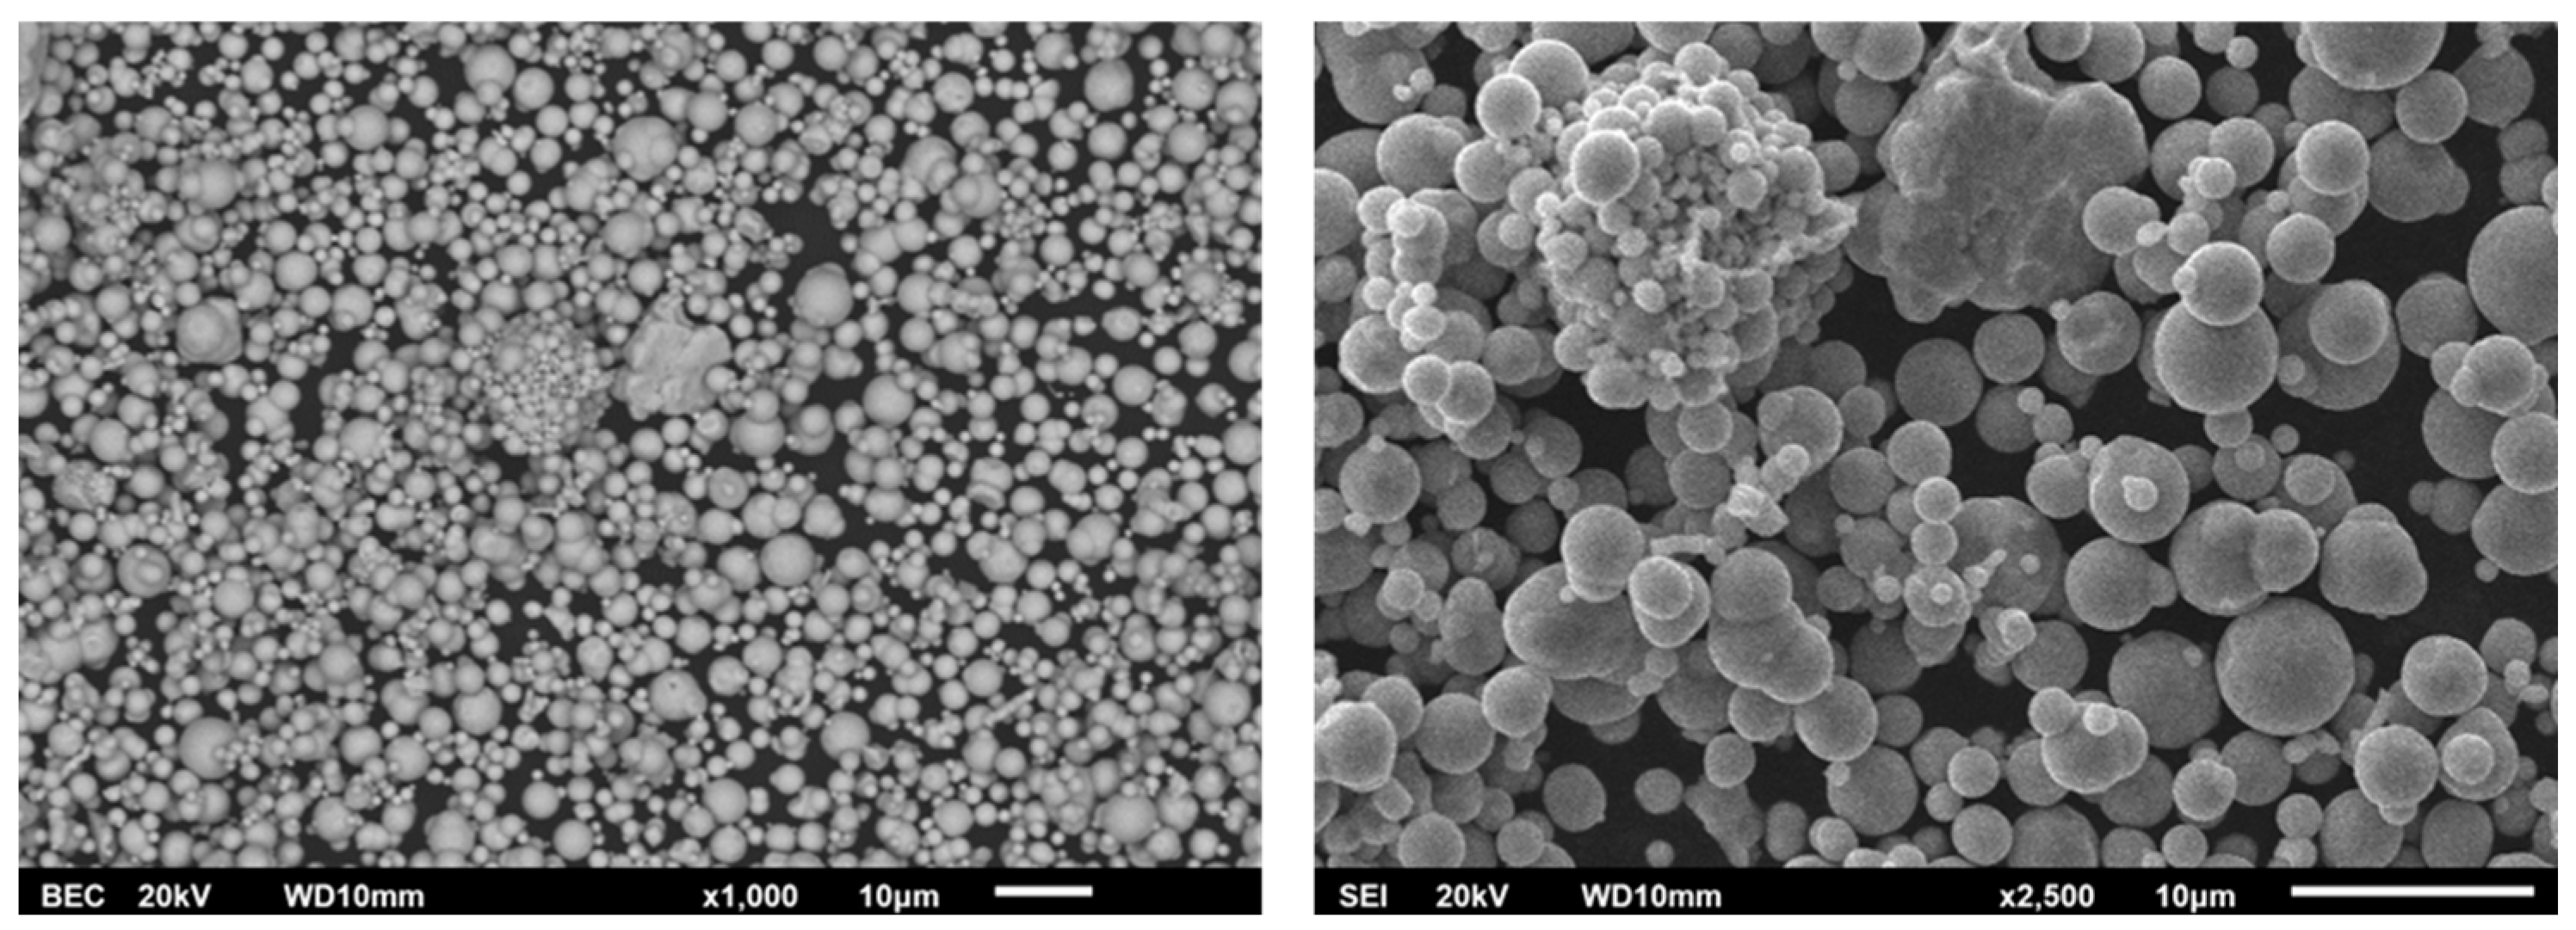
The development process of printed magnetic sheets starts with powder processing and paste development. The paste consists of iron powder, a sintering aid, the solvent water, binder and a dispersant to increase the long-term stability of the system. The iron powder should be of high purity, small particle sizes and a spherical particle shape. This study focuses on the investigation of pastes using high purity carbonyl iron powder in the printing process, which offers the potential to achieve the most favorable soft magnetic properties for the final component. The addition of a sintering aid enables the formation of a liquid phase during sintering. The sintering process can thus be accelerated, and the density of the sintered part strongly increased. Figure 1 illustrates the distribution of particle size as well as the particle shape of the carbonyl iron powder used in this study based on images taken in a raster electron microscope at 1000× (left) and 2500× (right) magnification [23].

Figure 1.
Carbonyl iron powder distribution in raster electron microscope.
The solvent content is used to adjust the solid content and viscosity of the paste, and to dissolve the binder and dispersant. The dispersant prevents the agglomeration of the powder particles while the binder enables the homogeneous distribution of the suspension during the printing process. This influences the rheological properties of the paste. The reduced agglomeration lowers the viscosity of the paste, so that a uniform surface of the printed green part can be achieved. An excessive amount of dispersant leads to increased surface roughness due to the formation of an elastic network which prevents the compensation of unevenness. The minimum viscosity of the paste determines the optimum concentration of the dispersant. The binder serves as a carrier for the iron particles [24].
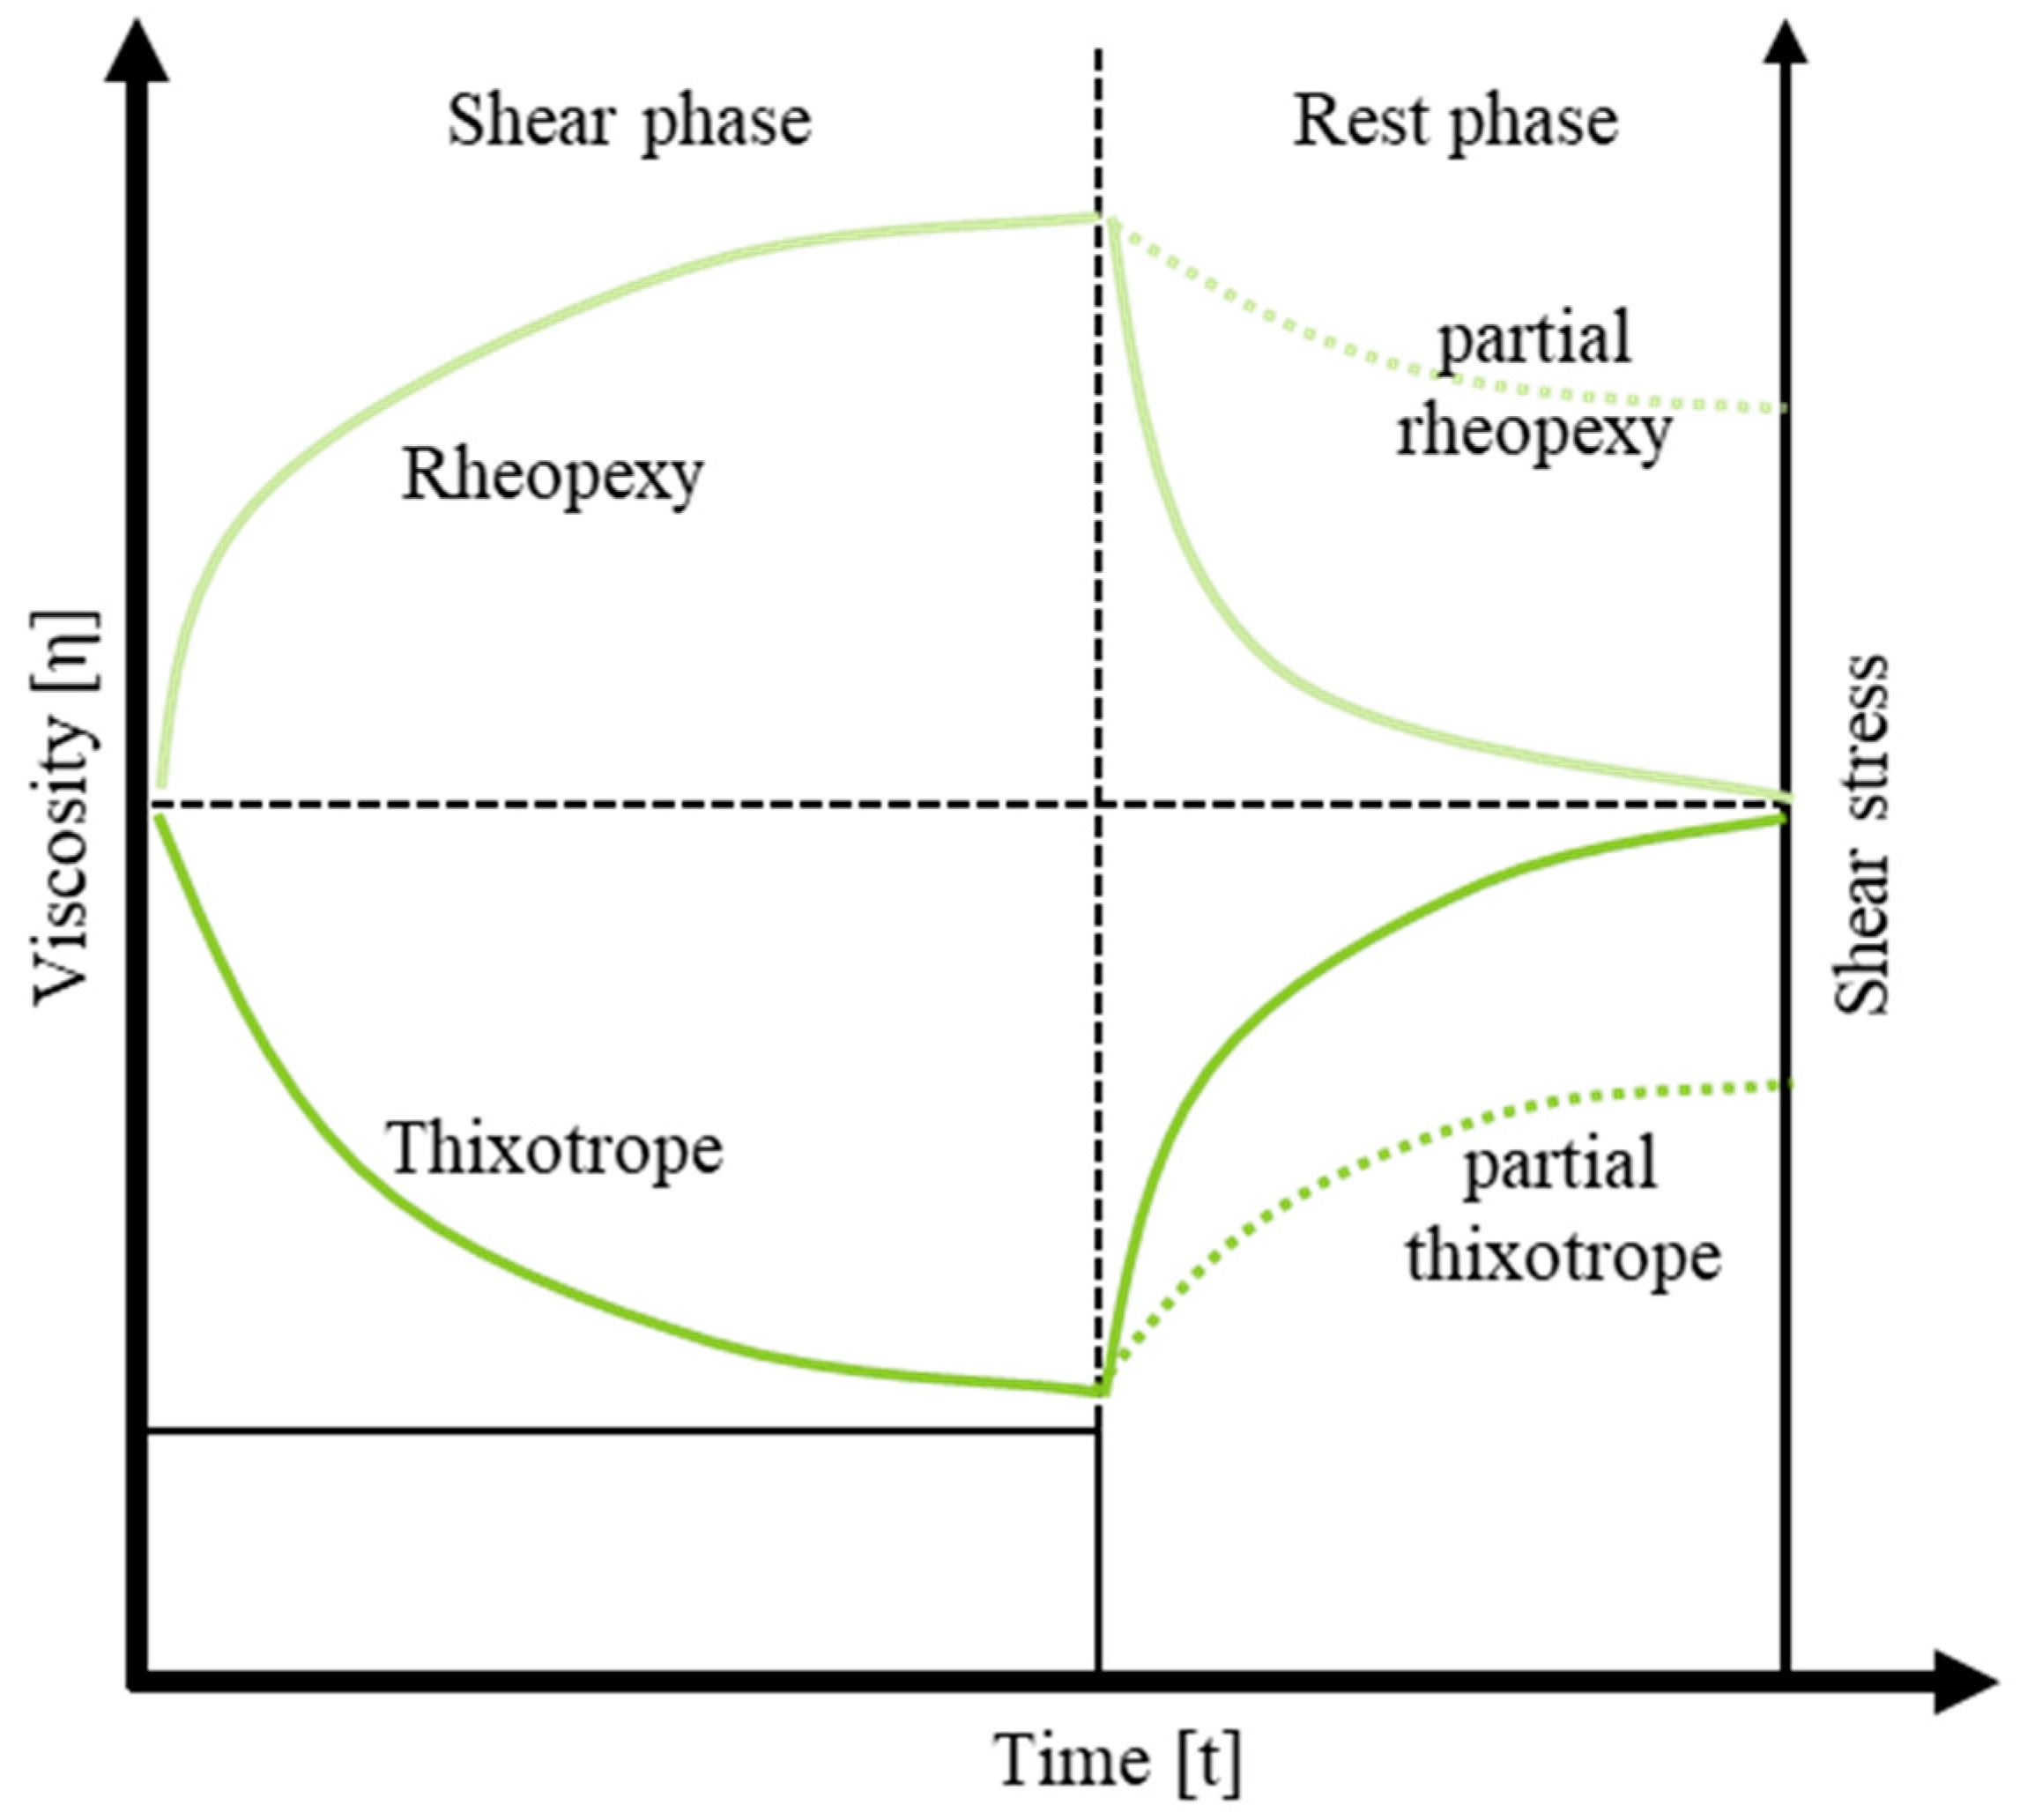
The binder also affects the viscosity of the paste. The higher the binder content in the paste, the higher the viscosity, which leads to worse behavior during printing. The mechanical stability of the paste increases and this limits how the paste dissolves during the printing process. This property is relevant because the paste is subjected to shear during the printing process and should exhibit shear thinning behavior. In addition to viscosity, thixotropy is another relevant property of the paste in relation to the screen printing process. Thixotropy is the time-dependent behavior of a substance before and after shear stress. This means that it describes both the structural degradation when a shear stress is applied and the rebuilding of the structure in the subsequent rest phase. The thixotropic behavior can be well explained by Figure 2 [24].

Figure 2.
Thixotropic behavior.
The step test compares the viscosity change in a thixotropic and a non-thixotropic substance under changing shear stress over time. While the non-thixotropic substance changes its viscosity level abruptly when the shear stress changes, thixotropic substances require a recovery time to reach their final viscosity. The higher the thixotropy of a fluid, the more time is needed to reach the final properties. This behavior is relevant to the detachment process of the screen from the substrate. Due to the shear stress induced during the printing process, the viscosity is at its minimum. After transfer to the substrate, the paste should close the gaps created by the screen meshes during the printing process. The paste then returns to its original viscosity to ensure dimensional stability [25].
The paste components are processed by dispersion and homogenization into the defined paste state, which is necessary for screen printing. Here, there is a significant difference to L-PBF or SLM. The maximum particle size of the metal powder should be approximately three times smaller than the mesh openings of the screen to ensure a printing process without complications.
2.1.2. Screen Printing and Drying
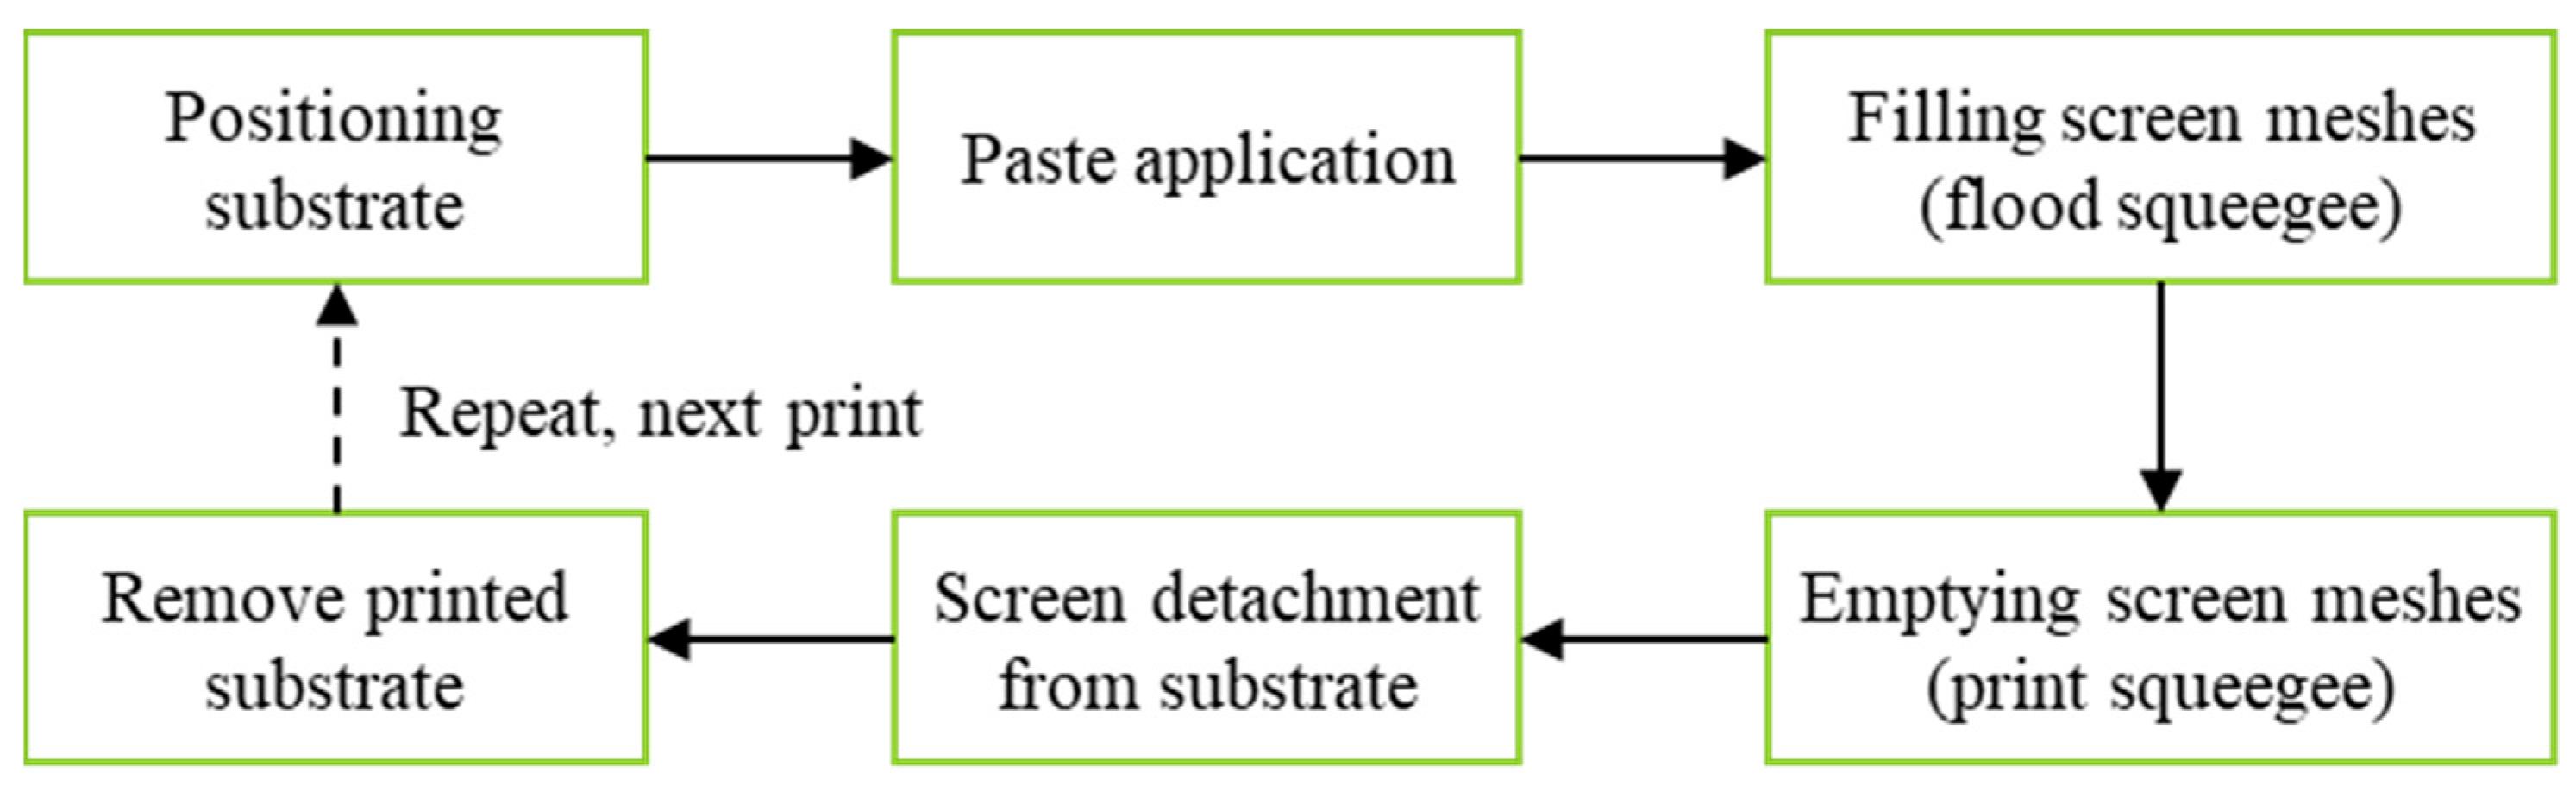
The screen printing process is classified as off-contact printing, due to the distance between the substrate and the screen, which is also referred to as take-off. The openings of the screens allow almost any two-dimensional geometry to be printed. Clamped in a metal frame, the screen can be precisely fixed in the printing space. The entire screen printing process is shown schematically in Figure 3.
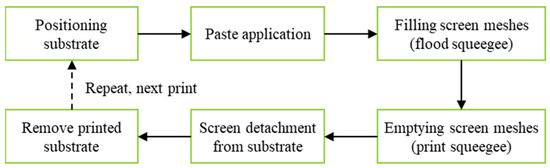
Figure 3.
Screen printing process.
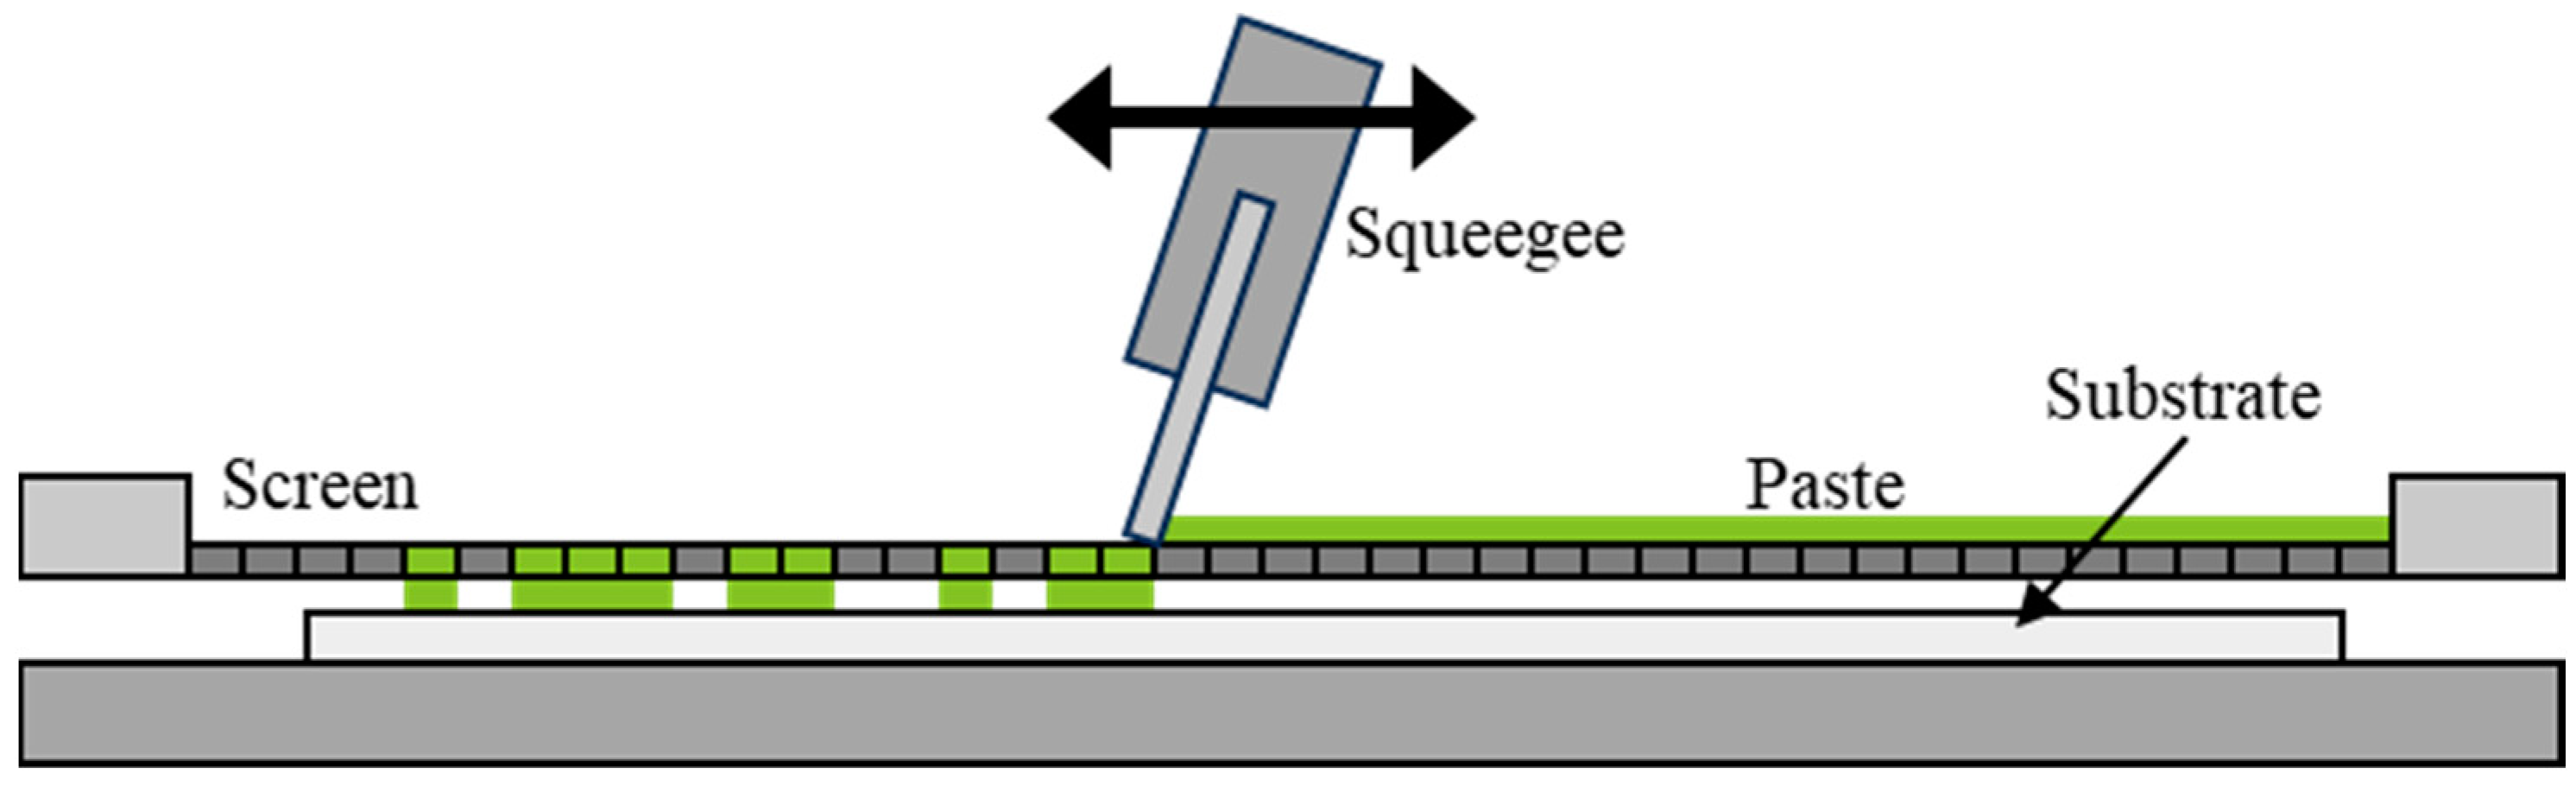
The substrate is positioned in the printing chamber of the screen-printing machine. Depending on the layer thickness and dimensions of the green part, the required amount of paste is applied to the screen. Excess paste that accumulates on the screen during the process must be avoided. The flood squeegee is used to fill the open screen meshes. During the process step, the flood squeegee operates at low pressure in order to not transmit paste to the substrate. Subsequently, the screen meshes are emptied by the print squeegee. Due to the increased squeegee pressure during the printing process, the screen is temporarily deflected towards the substrate so that the paste adheres to the substrate. The screen then springs back into its original position. This phase of the printing process is shown in Figure 4.

Figure 4.
Screen printing process according to reference [26].
The influence of the screen can be described using the theoretically transferable ink volume during the screen printing process. The theoretical ink volume depends on the mesh size, thread diameter and fabric thickness and is determined by Equation (1).
Vth = (w/(w + d²))² × D
- Vth = theoretical ink volume;
- w = mesh size;
- d = filament diameter;
- D = fabric thickness.
Due to paste residues in the screen, the real ink volume is between 10 and 20 percent less than the theoretical one. By changing the mesh size, filament diameter and fabric thickness, the theoretical ink volume, and, hence, the layer thickness of the green part, can be controlled. In addition, the theoretical color volume of the screen can also be reduced with the aid of calendaring [27].
Another important parameter for ensuring print quality is the clothing angle. The geometry of the green part does not run parallel to the screen meshes, so that parts of the screen are completely obscured by the parallel running of the screen meshes and emulsion strips. This can cause entire sections of the geometry to be closed off, resulting in gaps in the printed image. Such gaps can be avoided by adapting the covering angle to the specific geometry of the green part. Common covering angles for use in screen printing are, for example, 22.5°, 30° or 45° [27].
A distinction is made between two types of squeegees. The flood squeegee is used to fill the screen meshes, while the print squeegee carries out the paste transfer from screen to substrate carrier and thus directly influences the layer thickness and quality of the printed material. The squeegee influences the printing process and the service life of the screen by means of the material, hardness, angle, phase, as well as the force and speed during the process. The interaction of the squeegee angle and squeegee phase influences the pressure of the squeegee on the paste and the screen. A small squeegee angle reduces the pressure and thus increases the amount of paste that is pressed through the screen. This makes it possible to achieve higher layer thicknesses and green part weights. This effect is further enhanced by an additional phase at the frontend of the squeegee.
The printing process can be run in two modes. The conventional mode is the already described print–flood mode, where the paste is distributed on the screen and then pushed through. Alternatively, printing can be carried out in both directions (print–print mode), applying force to the screen on both squeegee paths and generating contact with the substrate carrier. In this way, the additional influence of the flood squeegee can be eliminated, but the cycle time is extended.
The environmental influences of temperature and humidity in the machine room have a significant effect on the viscosity of the paste and thus also on the stability and reproducibility of the printing process. These are monitored throughout the process and regulated using air conditioning. Particularly when using a water-based paste system, humidity plays a major role, as it dries quickly and can thus clog the screen meshes, causing defects.
2.1.3. Debinding and Sintering
After the printing process, the magnetic sheets are debinded and sintered. In the debinding phase, the organic substances are first extracted from the green part. This first phase of the process takes place at temperatures up to approx. 500 °C. The organic structures are burned off, leaving only the solid particles in the component. In the second phase, sintering, the particles of magnetic sheets are fused and compacted below the melting temperature of the material under an occurring liquid phase. In the final cooling phase, the green parts solidify into their final shape. This geometry of the magnetic sheets shrinks by 15–20% compared to the green part geometry. This is due to the compression of the material during the sintering process and must already be considered in the design of the screen and the printing process.
2.1.4. Handling, Coating and Stacking to Sheet Packages
Stator sheet packages are produced from the sintered single-sheet laminations. Therefore, the individual laminations are first electrically insulated to limit the eddy current losses during the operation of the electric machine. Various organic insulators are used as electrical insulation coatings. Baking varnish is particularly suitable for the further processing of individual laminations. This serves simultaneously as an electrical insulator between the magnetic sheets and as an adhesive to ensure the mechanical stability of the electrical sheet package.
2.2. Methodology
The study is conducted following the Six Sigma methodology for quality improvement. The core process Define-Measure-Analyze-Improve-Control (DMAIC) describes the phases define, measure, analyze, improve and control shown in Figure 5.
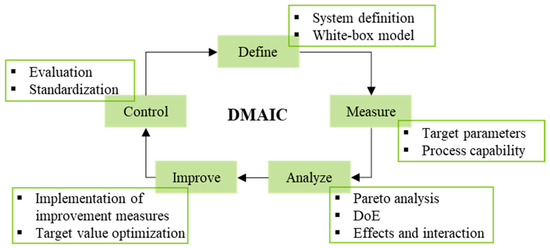
Figure 5.
Phases of Six Sigma methodology DMAIC.
In the first phase, Define, the project is described in terms of scope, goal and boundaries. In the second phase, the relevant influencing variables are defined based on the state of the art and the results of the preliminary investigations, and their interactions with input factors and target variables are presented. The analysis determines the relevant parameters with the main influence on the target variables using the Pareto principle and is performed with DoE. The relationships between the parameters are identified and the main effects and interactions are quantified. In the improvement phase, the results are translated into improvement measures and implemented. Finally, the initial defined targets are compared with the achieved results and a validation of the study is performed.
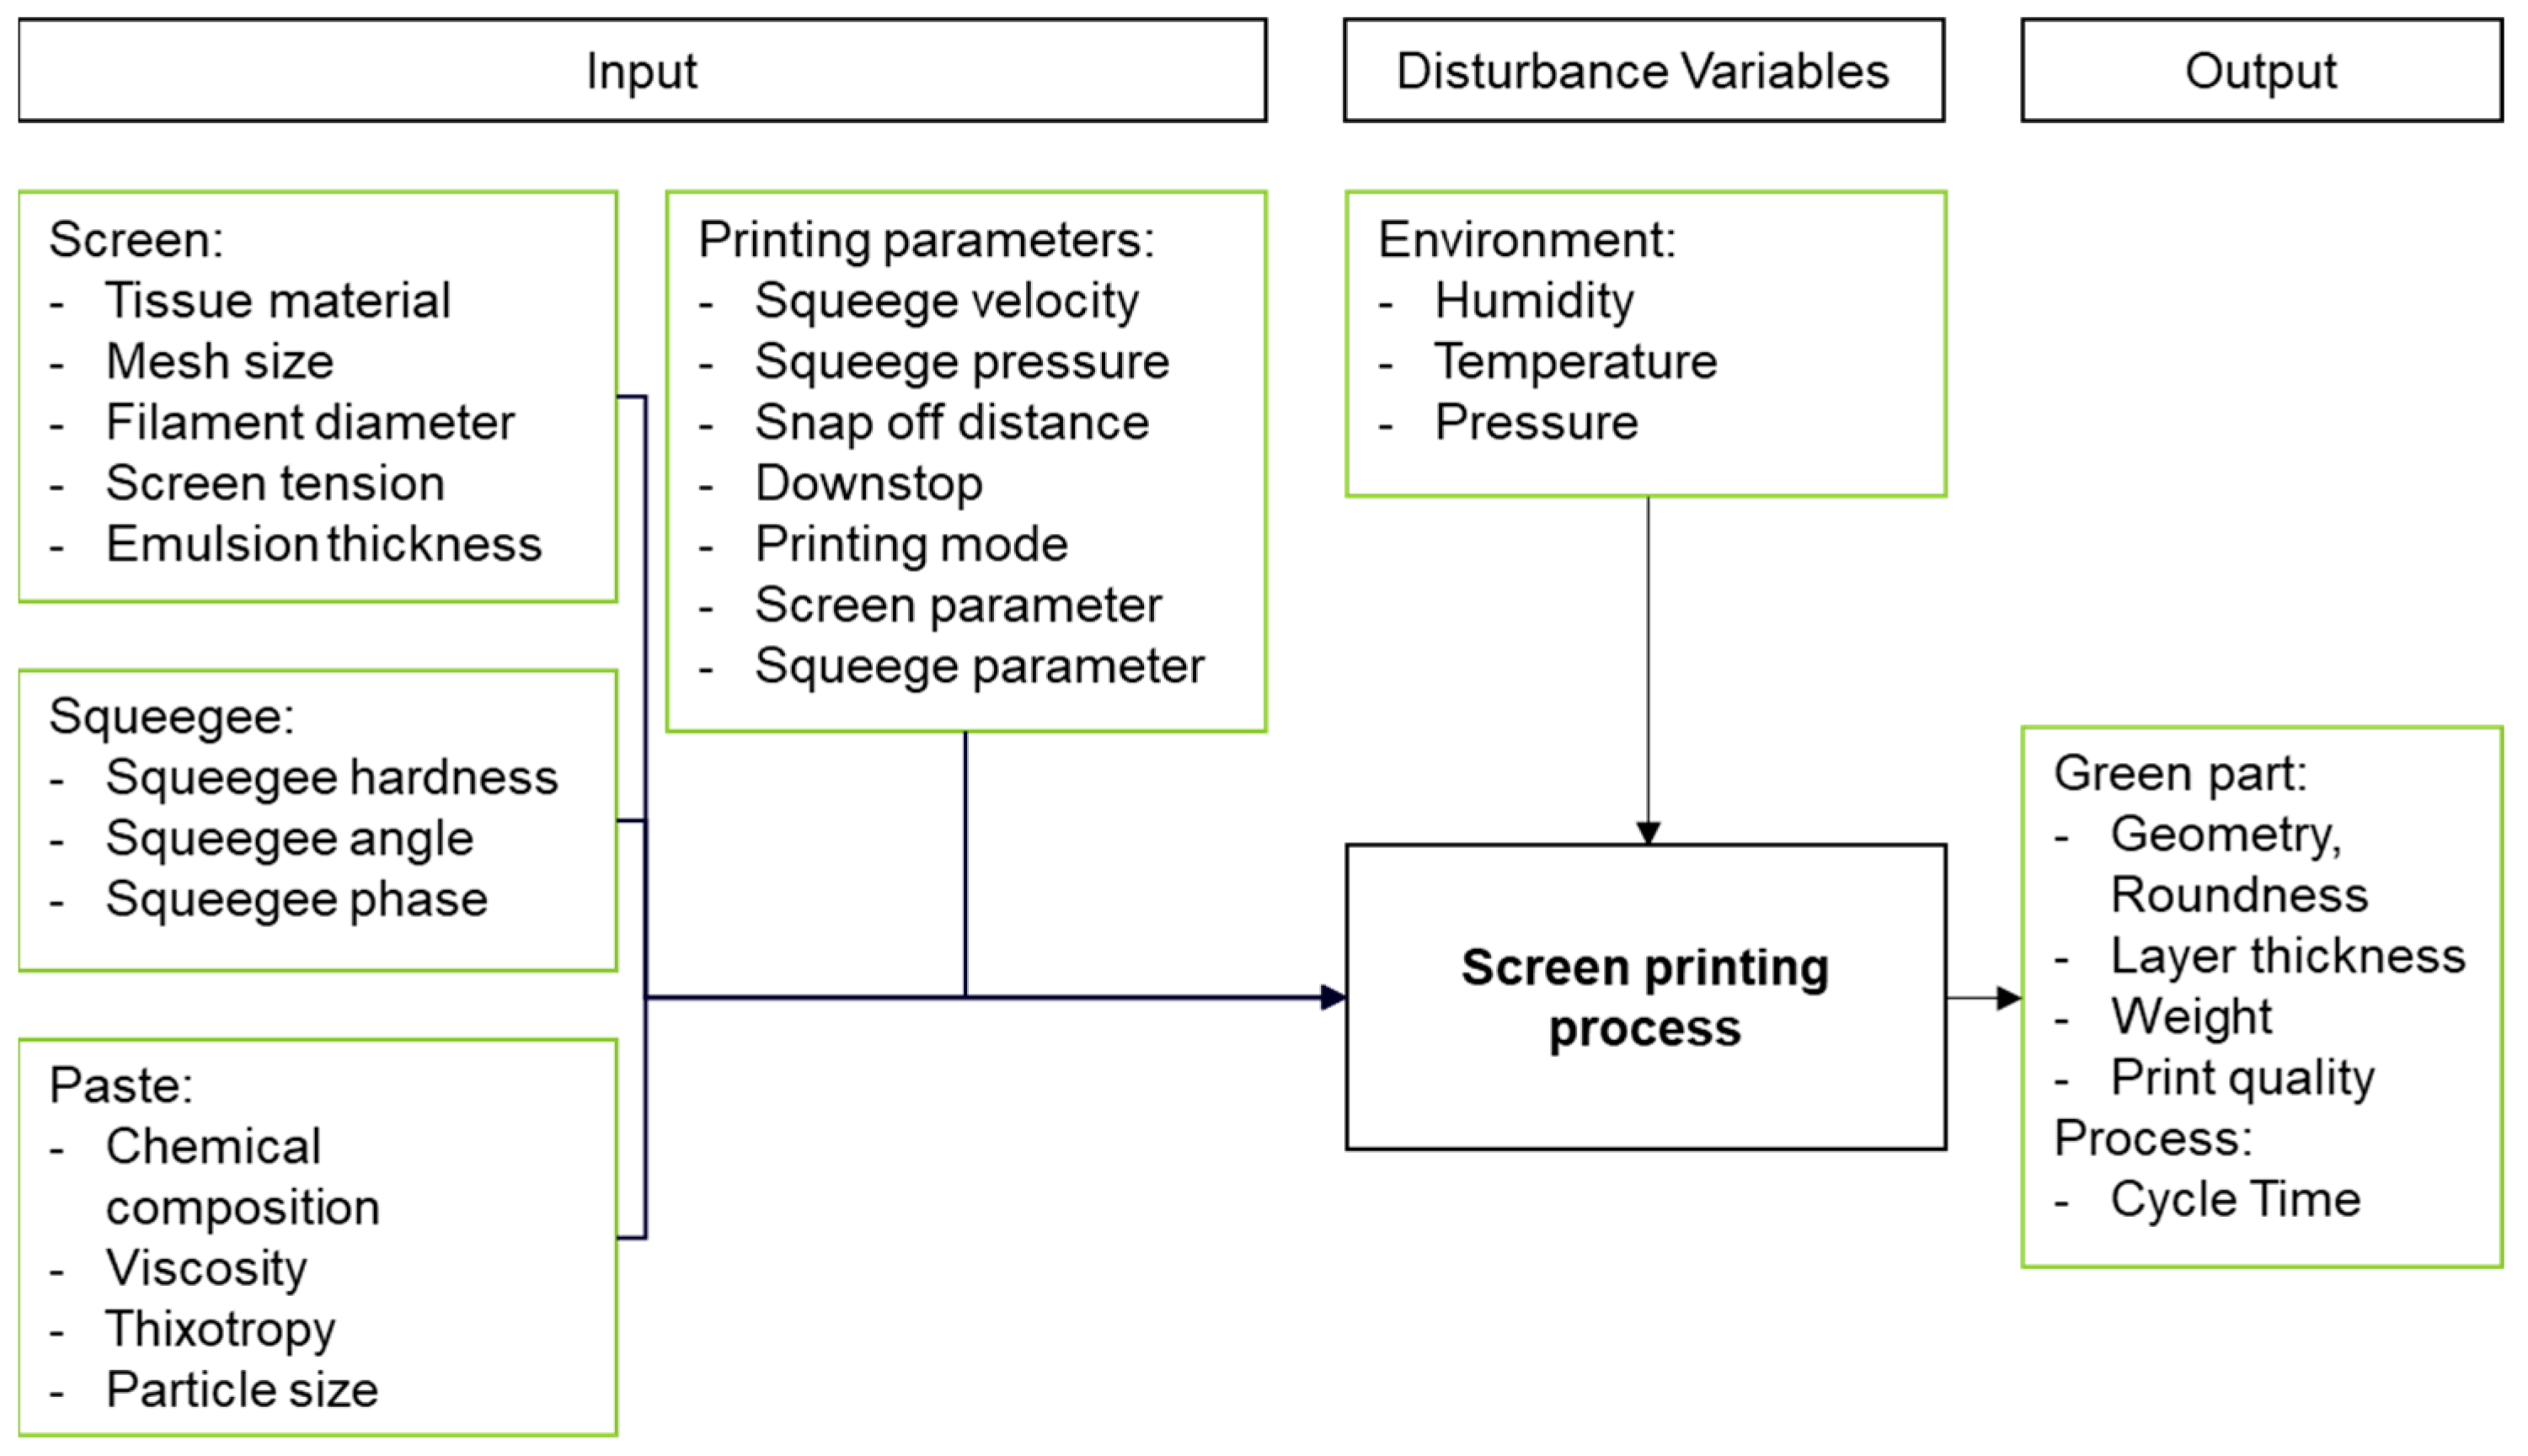
First, the system boundaries are defined. Then, process parameters are identified, classified, and assigned according to the system boundaries. The white-box model is used as the system, in which the process parameters are classified into changeable input variables, into non-changeable or unknown disturbance variables and output or measured variables. Four groups of input variables are distinguished: on the one hand, the variable screen printing parameters and, on the other hand, the properties of the screen, the squeegee and the paste used. The environmental influences and the drying process are considered as disturbance variables that affect the quality but cannot be controlled during the printing process. The output variables are roundness, layer thickness, weight, print quality and cycle time. Figure 6 shows an overview of the identified influencing parameters and target variables on the screen printing process.
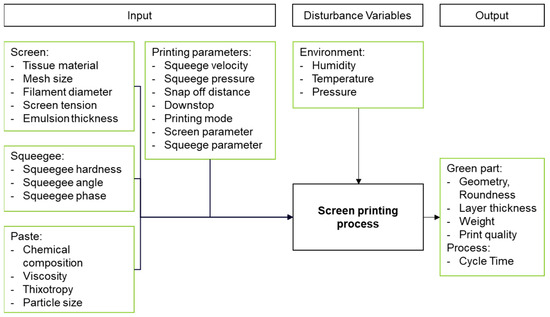
Figure 6.
White-box model screen-printing process.
In the measurement phase, the target variables are defined. The parameters that influence the target variables are linked to them. Therefore, findings from the state of the art, as well as from preliminary tests, are used. Table 1 shows the target parameters for the green parts.

Table 1.
Target values for green parts investigated in DoE.
For the economic profitability of the overall process and to maximize the productivity of the printing line, the cycle time must be minimized. The target value of the current development status is 6 s per print, which allows the production of stator sheet packages on a prototype scale. Relevant for the cycle time are the squeegee velocity and the print mode. To achieve the cycle time of 6 s, a squeegee velocity of 200 mm/s is required. A distinction is made between flood–print and print–print (Section 2.1). The first print mode is to be preferred regarding cycle time.
The target value of 100 µm is defined as the optimum sheet thickness. This thickness results from the technological target conflict for stator laminations. The lower the sheet thickness, the lower the eddy current losses during operation. In the opposite direction, the iron fill factor in the laminations decreases with the sheet thickness due to the required electrical insulation coating. The ideal sheet thickness depends on the use case scenario during machine operation. It is therefore individual and is set at 100 µm for this application. The layer thickness is influenced by each group of input variables. Preliminary investigations and the literature data show that the screen and the paste, as well as the parameter take-off, have particularly large effects. For the coating thickness, not only does the thickness of 100 µm have to be considered, but also a homogeneous thickness distribution across the sample.
Roundness is affected by screen distortion, and this is related to the take-off. The image quality is evaluated qualitatively. Various factors are relevant for the final component. These include pinholes, whereby a distinction is made between the number and size of the pinholes. Print defects, surface roughness and edge sharpness are also relevant to quality. This study focuses on the pinholes, as these are particularly critical.
2.3. Measurement Systems
Different measurement systems and methods are used to measure the target variables. The cycle time is determined by the ratio of squeegee speed and squeegee displacement. Non-productive process times, such as the transfer of the substrate carriers from the printing line to the drying line, are neglected. The green part thickness is measured using the TT80 tactile measuring device from Tesa Technology (Hexagon AB, Stockholm, Sweden) according to DIN 32876-1 [28,29]. Preliminary investigations have shown an operator influence that can be reduced by using a stencil. The green parts are thus measured in 30° steps along the circumference. The measuring point is set in the center of the stator yoke. Each measurement is repeated three times and the results averaged to reduce random scatter. In Section 3, the averaged value of the 30° steps over the entire stator sheets is examined. Roundness is calculated as the ratio of the smallest to the largest inner and outer diameters. The optical qualification of the green part quality is qualitative. Pinholes, defects and surface effects, which occur, for example, as a result of agglomeration, are taken into account.
2.4. Experimental Setup
Four DoEs are conducted to identify the main influencing variables, interactions and correlations. The aim is to reduce the number of variable parameters after the execution. To keep the experimental cost and complexity as low as possible, the DoE starts with the parameters that can be varied most easily. A total of 10 replications are performed for each parameter combination to compensate for random variations in the screen-printing process that are statistically significant. Table 2 summarizes the default settings before starting the investigation. The other influencing variables listed in Figure 6 are kept constant during the procedure.
Table 2.
DoE default parameters.
The procedure for generating, classifying and validating the results, including process capability and Pareto diagrams, is carried out identically for each experimental plan. A detailed description is only given in Section 3.1 for DoE 1, since it is exclusively to ensure the measurement and process quality. The analysis of the results is focused on the further investigation.
3. Results and Discussion
This chapter systematically examines the series of experiments. First, the investigated variables are shown with levels and values, then the normal distribution of the values is verified, the effects and interactions are demonstrated and, finally, analyzed.
3.1. DoE 1: Variable Screen Printing Parameters
For the cycle time, the aim is to achieve the highest possible printing speed. The influence of the variable screen printing parameters on the target parameter’s green part weight, layer thickness and print quality are investigated as well as the influence of the different levels of the variables on the respective quality characteristic. Due to the selected levels shown in Table 3 and the specified 10 replications, the first DoE comprises 160 samples. To further improve measurement accuracy, each measurement is performed three times and the mean value is used for analysis.
Table 3.
DoE 1: Variable screen printing parameters.
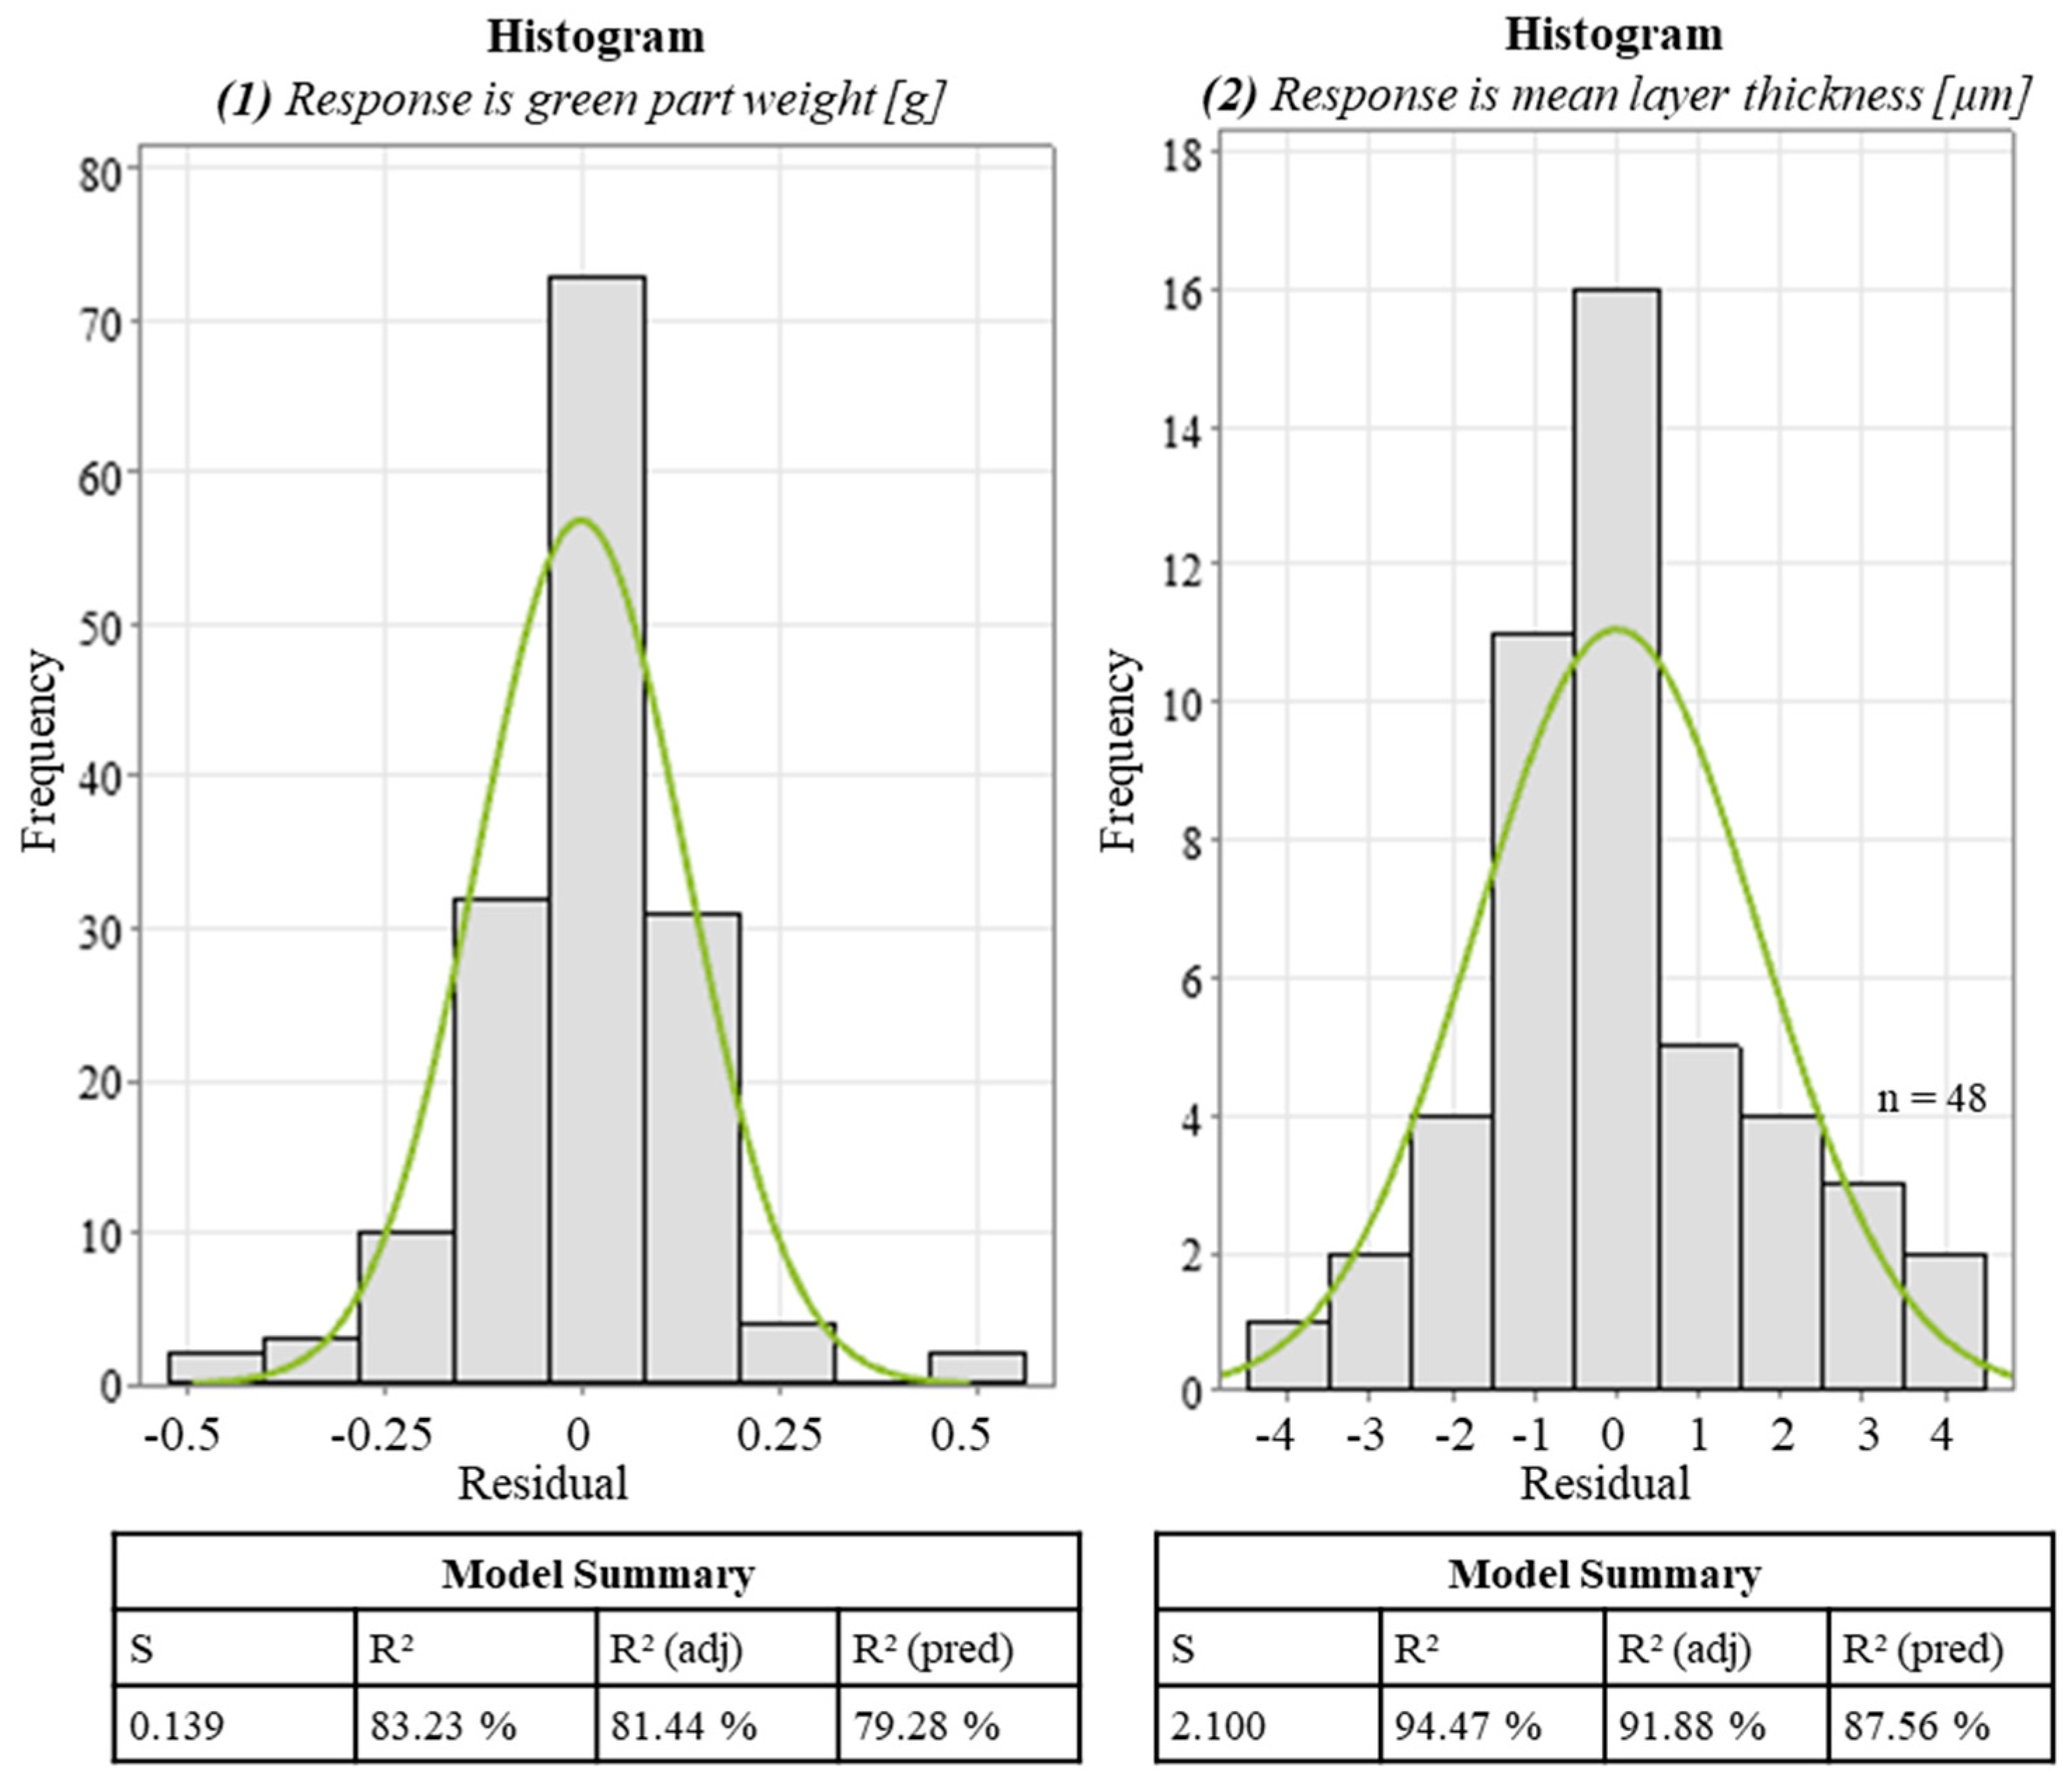
First, a verification of the validity of the measurement data of the established process model must be carried out by means of process capability analysis. Figure 7 summarizes the evaluation.
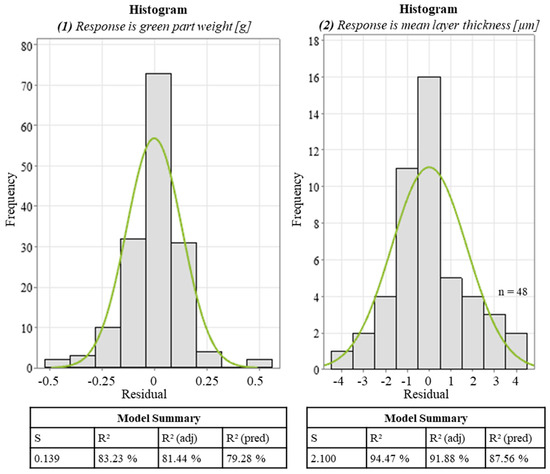
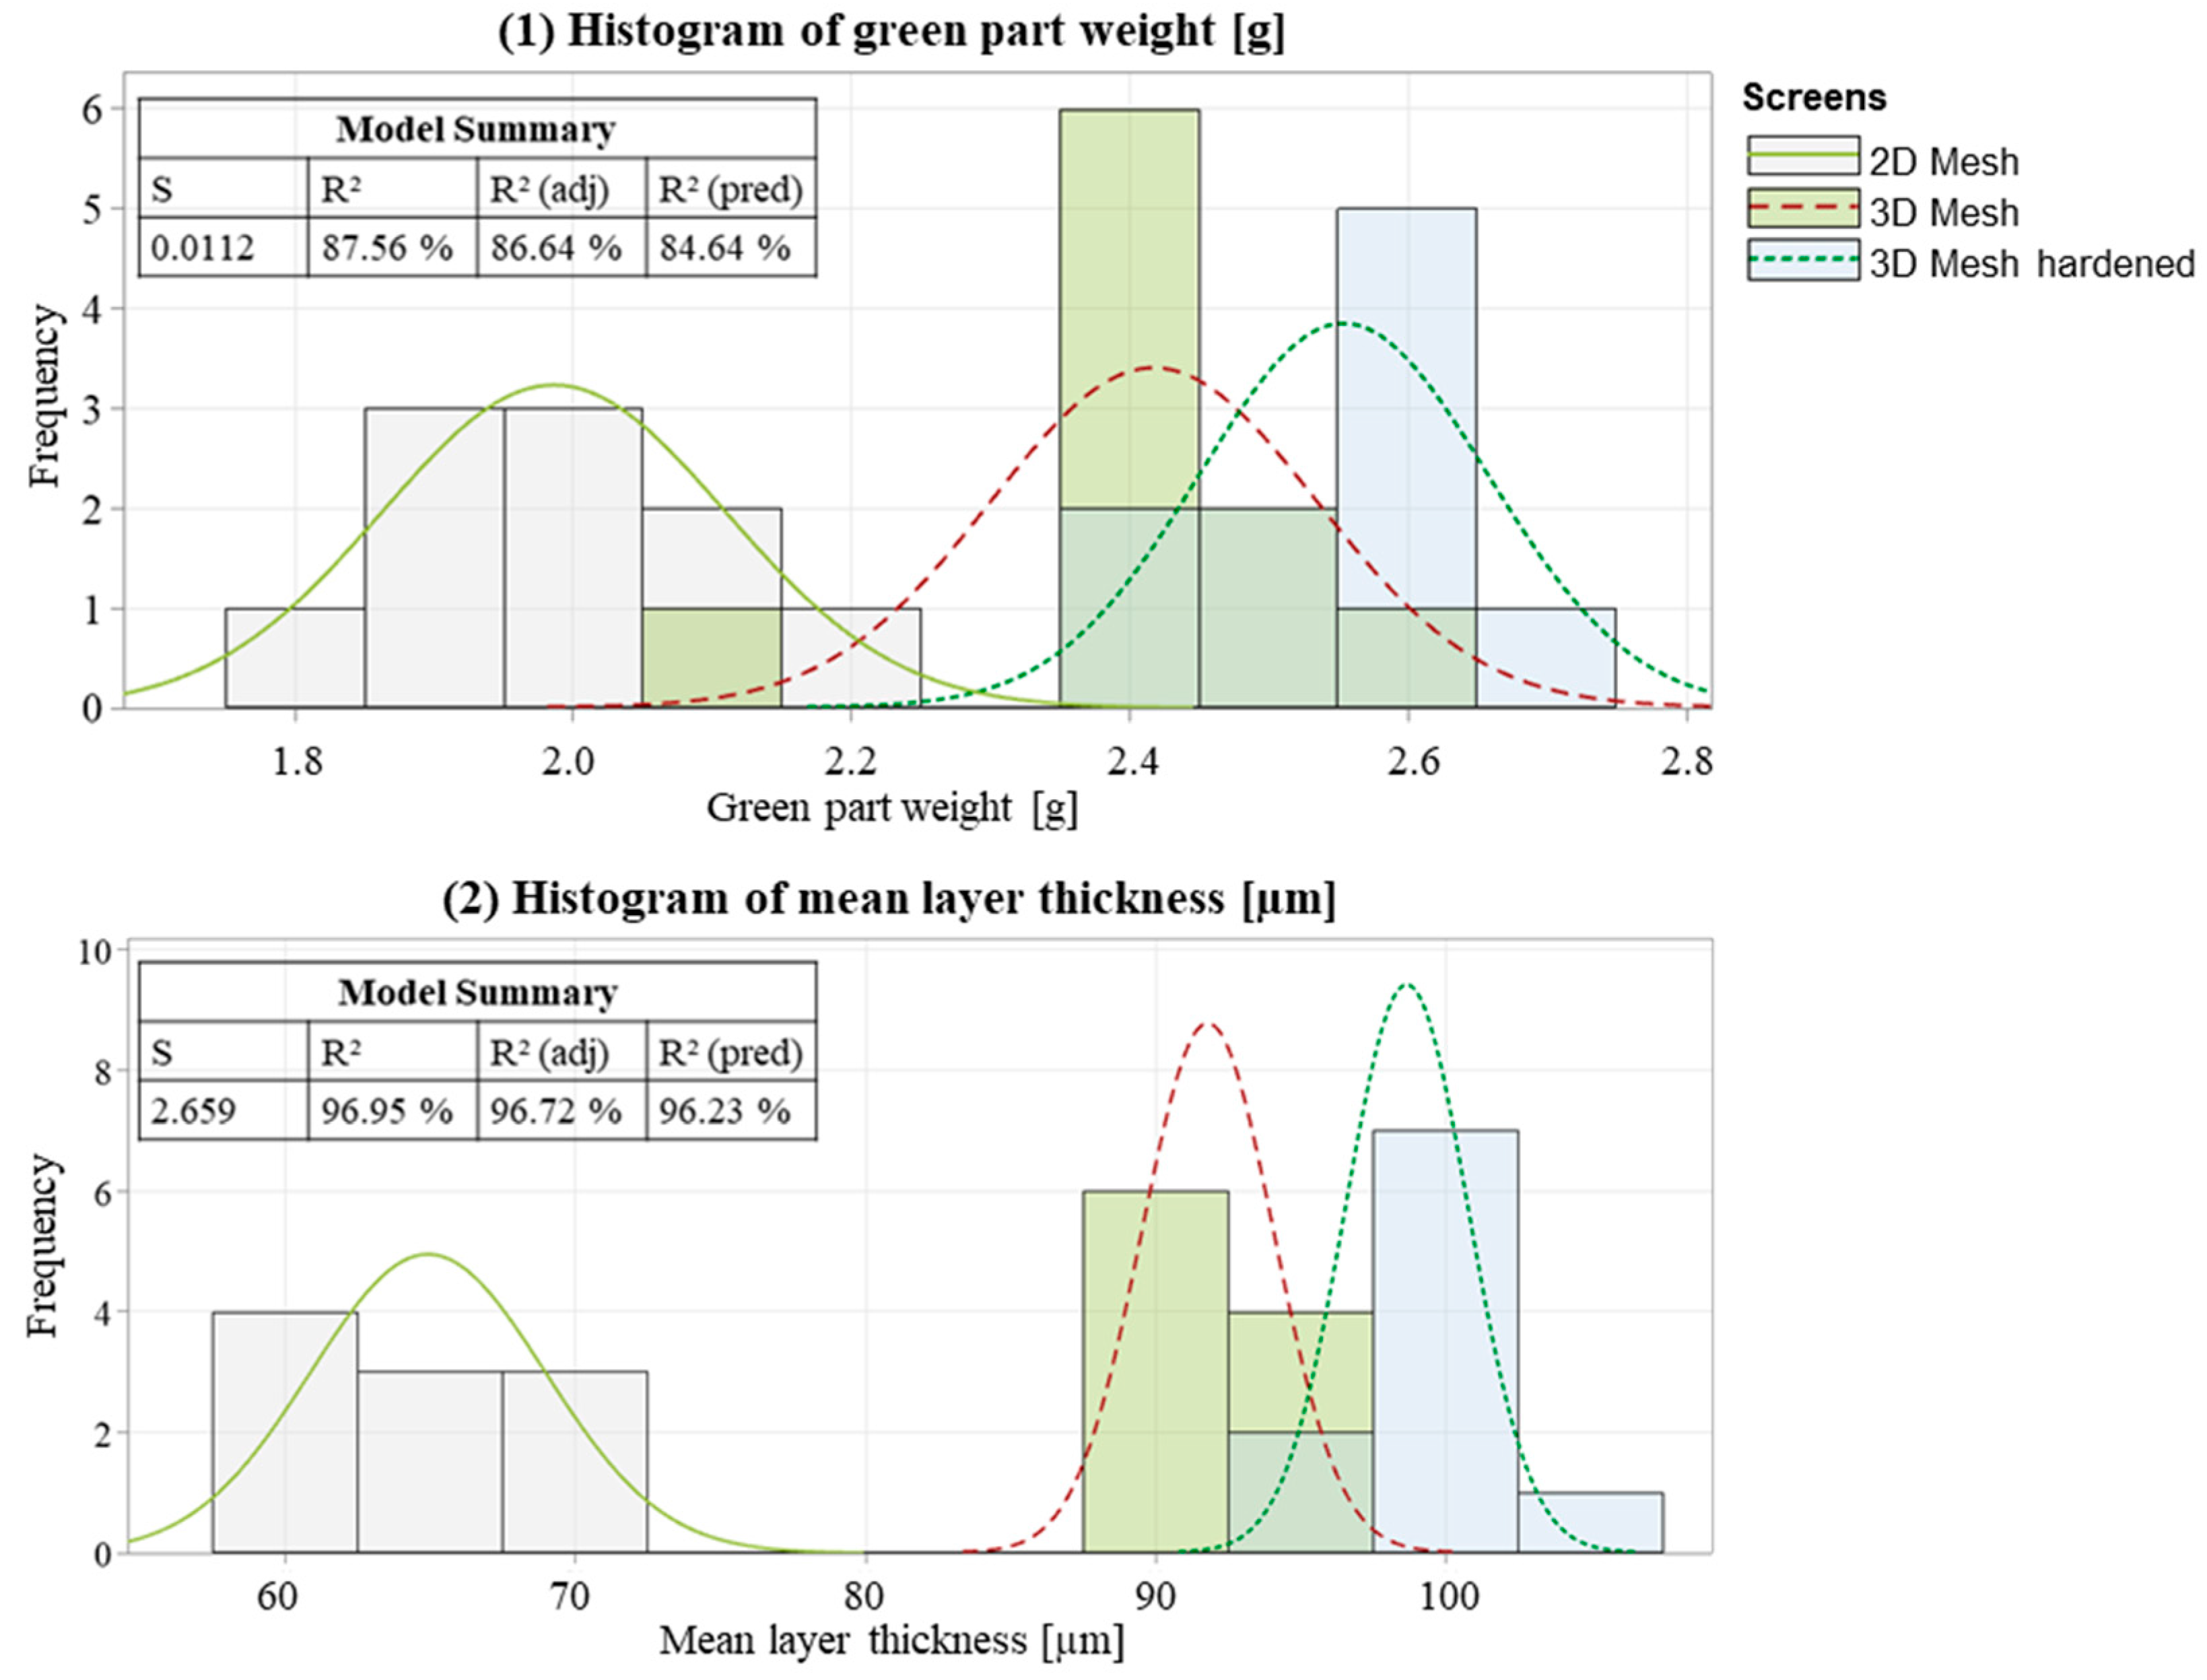
Figure 7.
Histogram of (1) green part weight and (2) mean layer thickness.
The R² values of the models are 83.2% for the green part weight and 94.5% for the sheet thickness, which means that 83.2% and 94.5% of the measured values can be explained by the variation of the selected input parameters. It can also be seen that the measurement results are normally distributed. The model set-up is thus suitable for the parameter analysis of the screen printing process and it is ensured that no relevant influencing parameters are missed.
The Pareto diagram in Figure 8 shows the effect of the considered input parameters on the investigated quality characteristics. The significance level is α = 0.05, which defines which standardized effects are statistically significant.
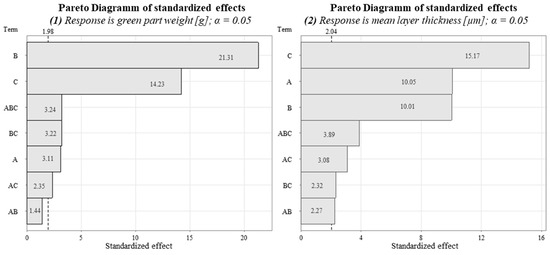
Figure 8.
Pareto diagram of green part weight (1) and mean layer thickness (2) vs. squeegee velocity (A), take-off (B), roller mill (C).
The three variables investigated exceed the significance level and are thus relevant for further investigation. The interactions of the variables are also weakly significant, except the interaction of the squeegee speed and take-off for the green part weight. To analyze the correlations between the process parameters and the quality characteristics of the layer thickness and green part weight, the influences of the main effects, A, B and C, are considered in more detail in Figure 9.
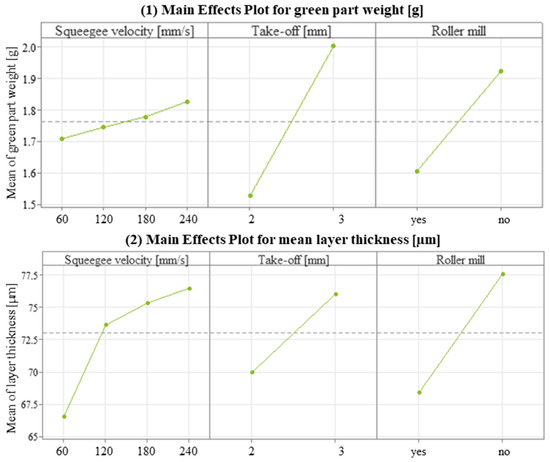
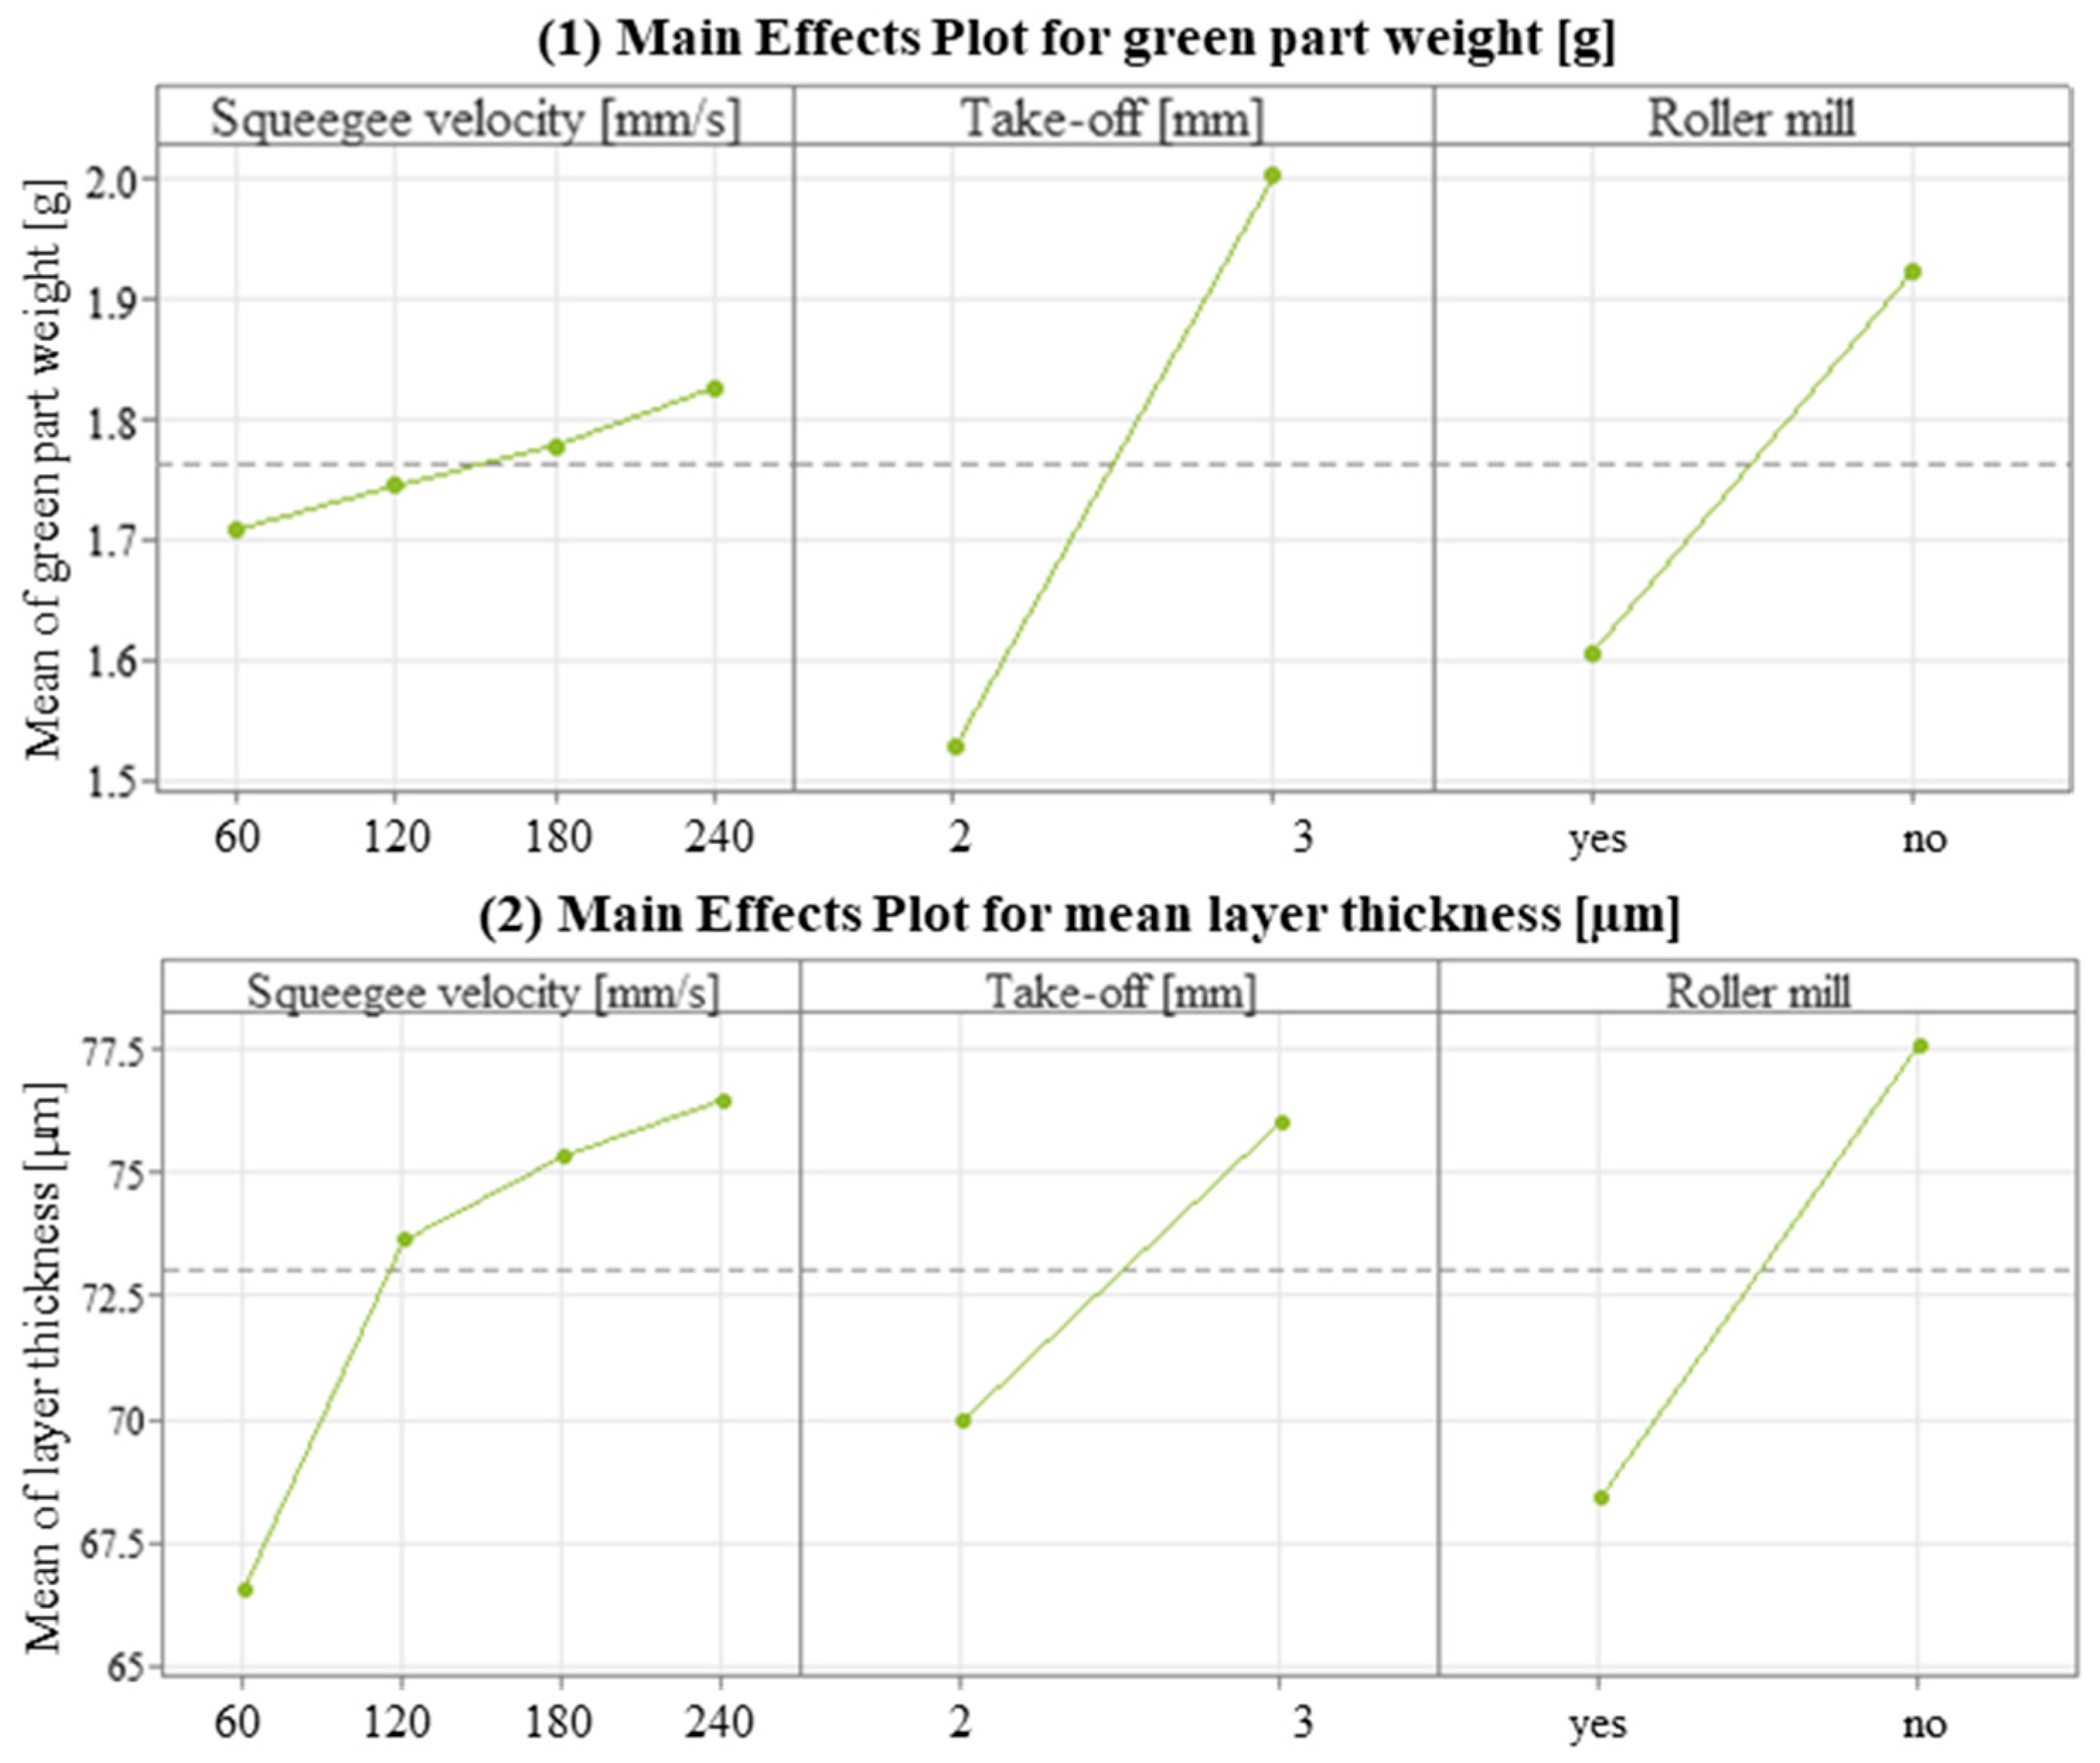
Figure 9.
Green part weight (1) and layer thickness (2) vs. squeegee velocity, take-off, roller mill.
The green part weight increases approximately linearly with the squeegee velocity. The effect is rather small. Increasing the take-off from 2 mm to 3 mm has a significant effect on the weight, which increases by about 25%. The use of the roller chair also has a significant effect on the weight; it increases by about 15% by its omittance. The effects are similar for the layer thickness. The weight increases correlate strongly with the increase in layer thickness. One difference is the doubling of the squeegee speed from 60 mm/s to 120 mm/s, where the layer thickness increases significantly more than the green part weight.
By varying the investigated variables, the target layer thickness of 100 µm cannot be achieved. The settings high speed and high take-off increase the layer thickness. This result corresponds to the state of the art. By increasing the printing speed, the paste, whose behavior is structurally viscous, becomes more fluid and larger paste transfer can occur. The increase in layer thickness is higher than the increase in weight. This leads to the assumption that the change in squeegee speed influences the green part density. This could result, for example, from the unintentional introduction of air bubbles or inclusions into the green part and should be investigated. Due to the higher take-off, the screen tension increases, which also leads to an increase in the layer thickness. The effect of the roller mill cannot be explained based on the state of the art. Its use should lead to a lower viscosity of the paste and thus to a higher layer thickness. It can be assumed that the sedimentation effects, as well as the lower homogeneity of the paste, cause the increase in the weight as well as the thickness. This is also reflected in the optical image quality inspection. By omitting the roller mill, visible agglomerates as well as inclusions appear on the green part.
For the subsequent DoEs, the following standard settings are defined for the variables investigated:
- Squeegee velocity: 240 mm/s;
- Take-off: 3 mm;
- Roller mill: Yes.
3.2. DoE 2: Print Mode
The influence of the print mode on the layer thickness is investigated. The green part weight is also recorded to clarify unexpected fluctuations. For the target parameter cycle time, the flood–print setting is to be preferred since the non-productive times of the screen-printing process are reduced. The strong coefficient of the determination of an R² of 88%, as shown in Figure 10, ensures that the model is suitable for analyzing the process parameter print mode.
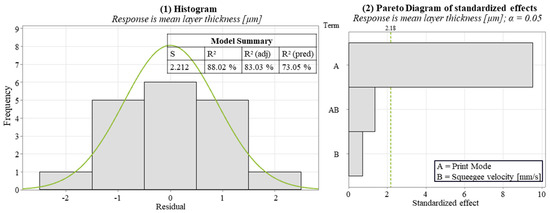
Figure 10.
Histogram (1) and Pareto diagram (2) of print mode (A) and squeegee velocity (B) vs. layer thickness.
The data follow the normal distribution. Statistically significant effects are exclusively due to the Factor A printing mode on the coating thickness of the green part. The influence of the squeegee speed and the interactions can therefore be neglected for analysis. The average layer thickness of the green part can be increased from 70 µm to 80 µm by applying the flood printing mode. However, the image quality is strongly negatively influenced by this mode. Figure 11 compares the defects and pinholes of the green part between the modes.
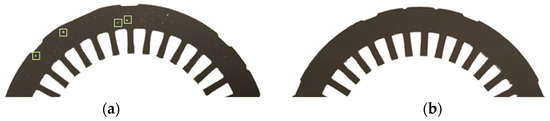
Figure 11.
Image quality of the green part flood–print (a) vs. print–print (b).
The increase in layer thickness when using the flood–print mode cannot be explained by the state of the art. In the print–print mode, the squeegee passes over the screen twice with contact pressure. As a result, a higher coating thickness can be expected. A possible explanation for the result is the associated different shear force applied to the paste during the process. The higher sheet thickness may result from air inclusions or bubble formation during the screen printing due to the different behavior of the paste. For the following investigations, the standard print–print setting is defined.
3.3. DoE 3: Screen Type
The properties of the screen influence the maximum amount of paste that can be transferred per print and thus layer thickness and weight. The material, mesh and diameter of the filaments also influence the quality, and pinholes can occur especially on the surface of the green part on the side towards the screen. In this DoE, the influence of three screen variations on layer thickness, print weight and quality are investigated regarding Table 4.
Table 4.
DoE 3 screen type.
Before the analysis between the screen and the quality characteristics of the weight and layer thickness of the green part, the suitability of the set-up model is ensured. According to Figure 12, the influence of the screen used is significant regarding both the weight of the green part (p-value = 0.00 < α = 0.05) and the layer thickness (p-value = 0.00 < α = 0.05).
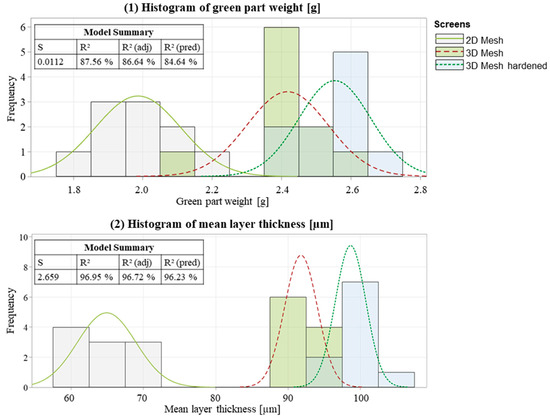
Figure 12.
Histogram of green part weight (1) and mean layer thickness (2) vs. screens.
The histograms of the measured values show a normal distribution for each screen and the target parameters of the green part weight and thickness. This ensures that the measurement results are not influenced by interferences or other process parameters. Also, the coefficient of determination of an R2 of 83.11% for the quality characteristics weight of the green part and 97.60% for the average layer thickness indicates that the measurement results can be explained by the screen variation. Since the theoretical volume of the screen is increased by 45% by switching to a 3D screen, an adequate change in the layer thickness and weight of the green parts can be expected.
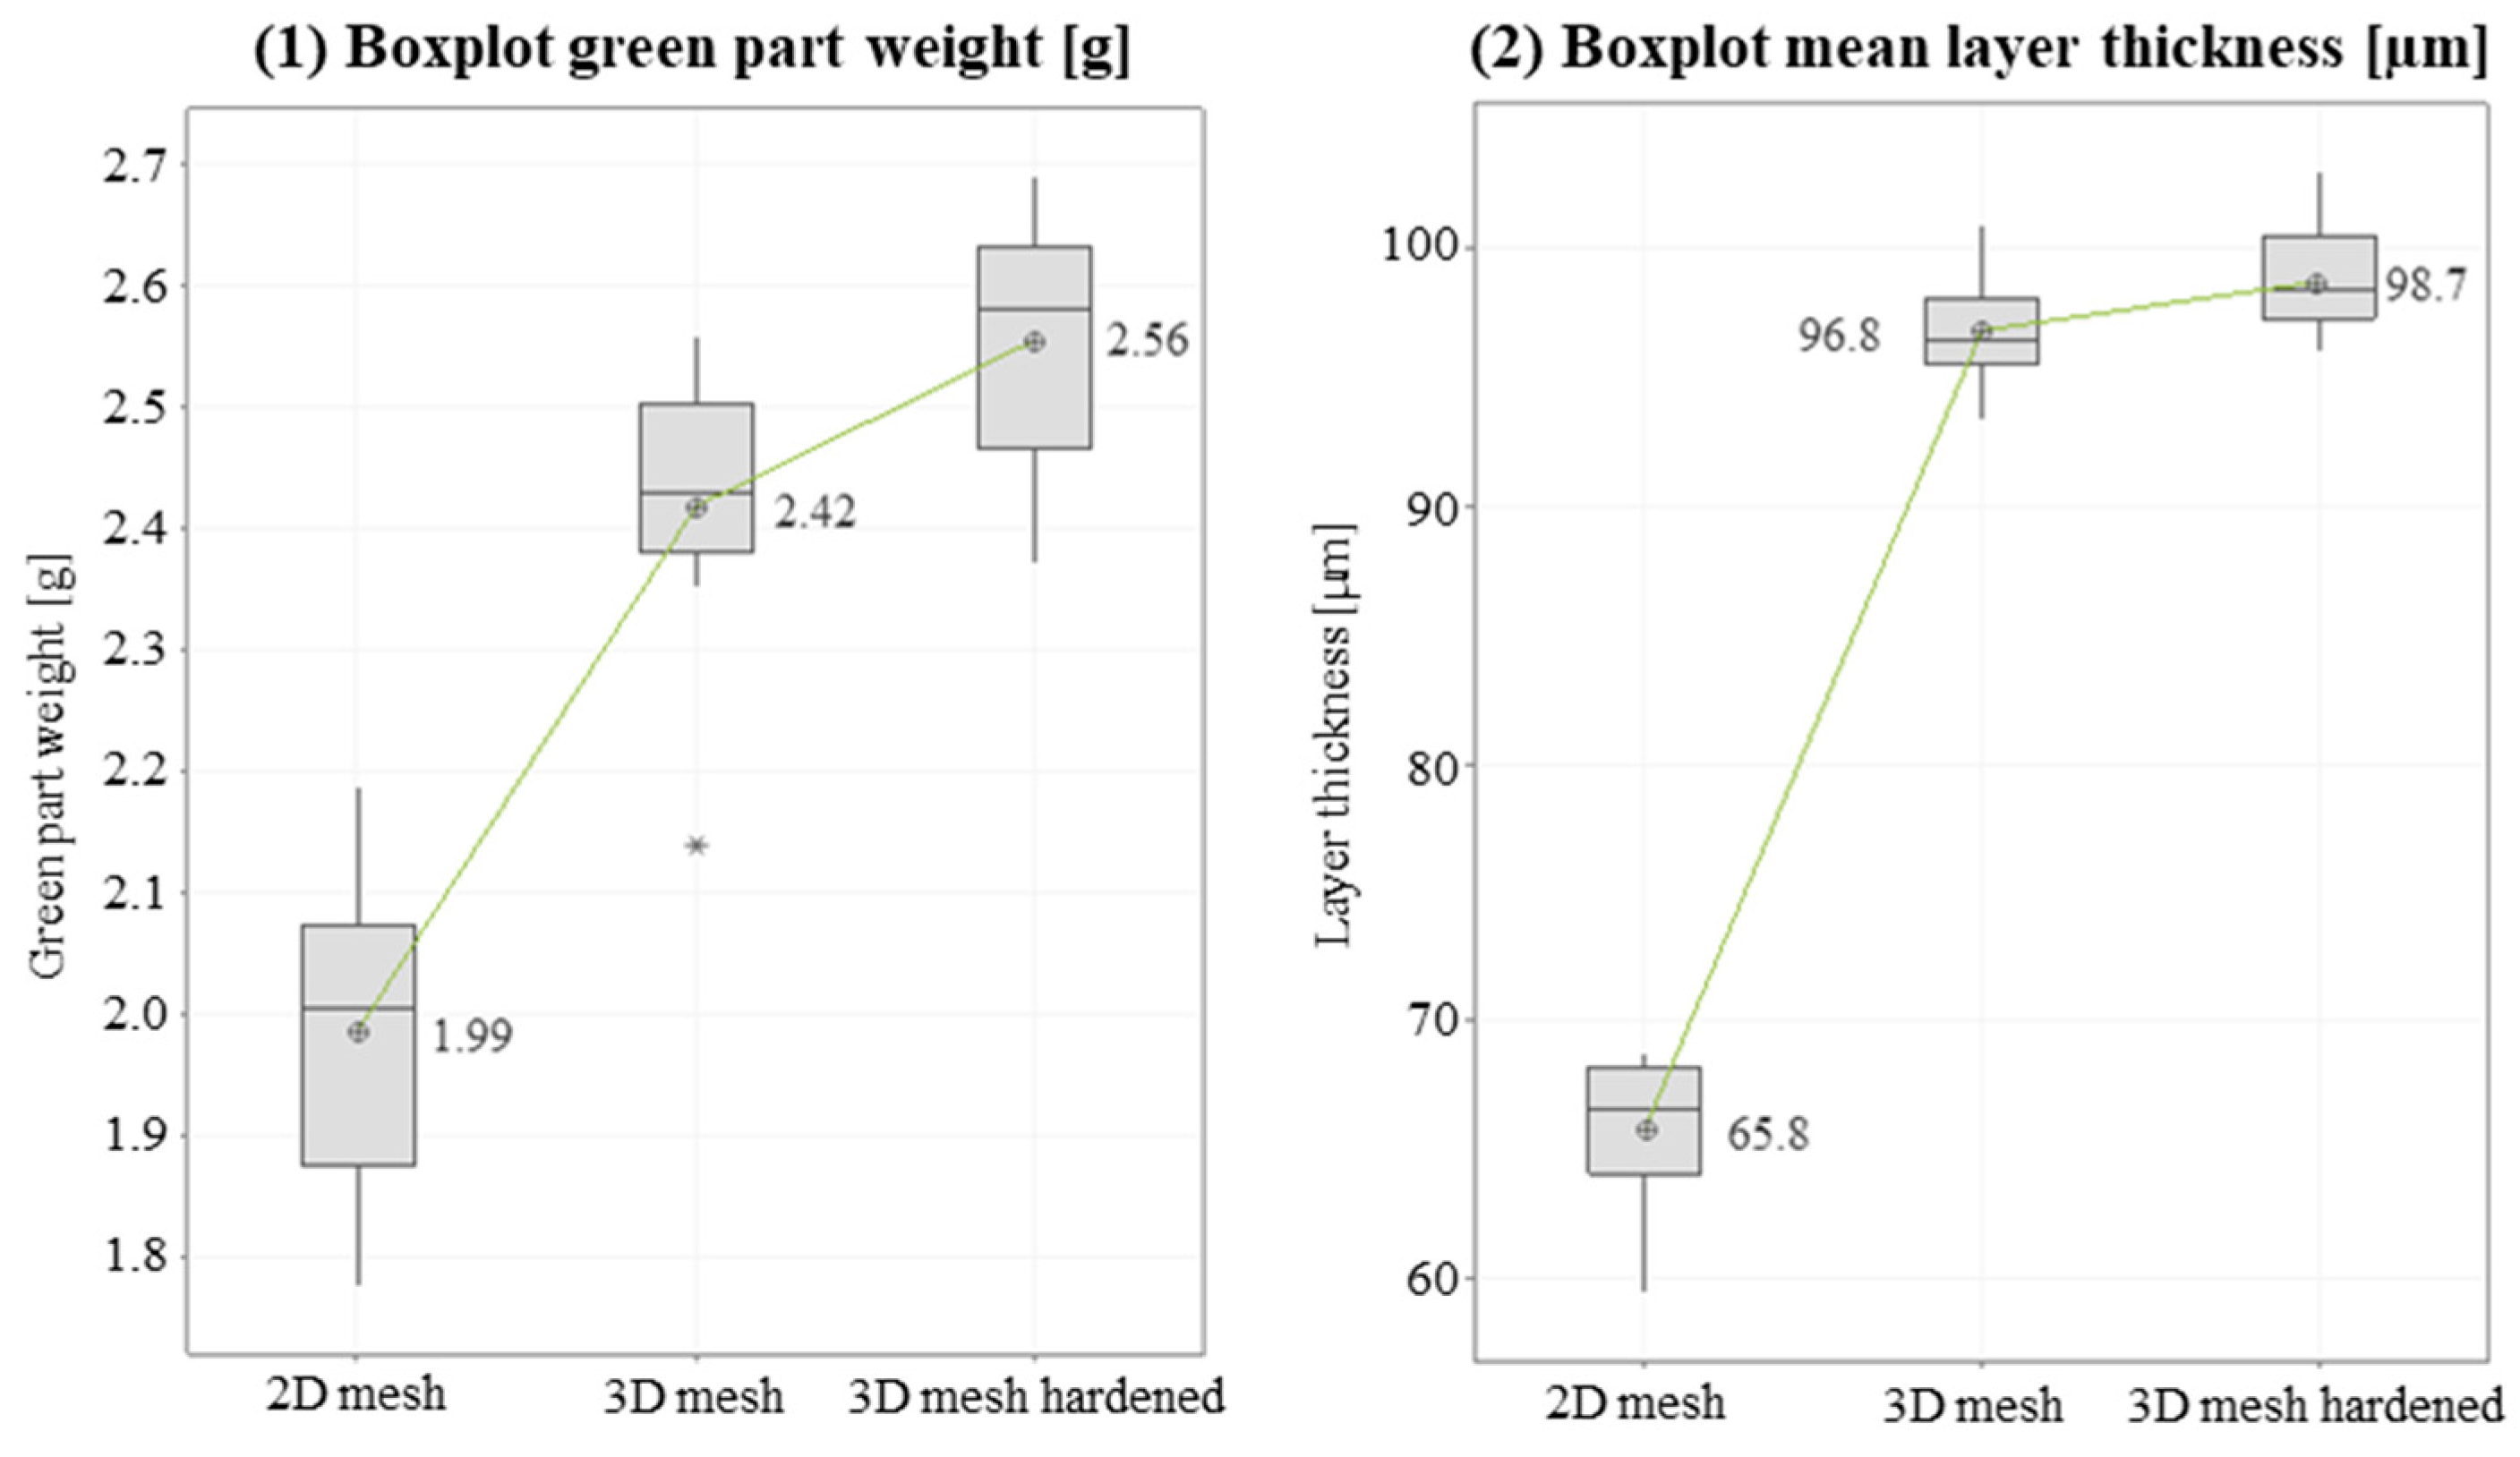
Figure 13 shows that the weight, as well as the average layer thickness of the green parts, are increased by switching to a 3D mesh. At 47% (3D mesh) and 50% (3D hardened mesh), the percentage increase in layer thickness corresponds approximately to the percentage increase in theoretical ink volume. The mean weight of 2.56 g of the 3D mesh hardened is higher than the mean weight of 2.42 g of the 3D mesh, which is reflected in the mean layer thickness. It is assumed that this marginal difference is production-related due to the slightly higher emulsion thickness and does not directly depend on the emulsion material used.
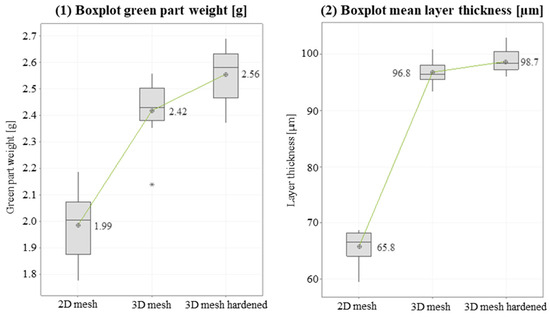
Figure 13.
Boxplot green part and layer thickness vs. screen type. (Outliers marked as *).
The targeted layer thickness of 100 µm can be achieved with both 3D screens. In addition, the image quality is to be analyzed, with Figure 14 showing the statistical distribution of the model.
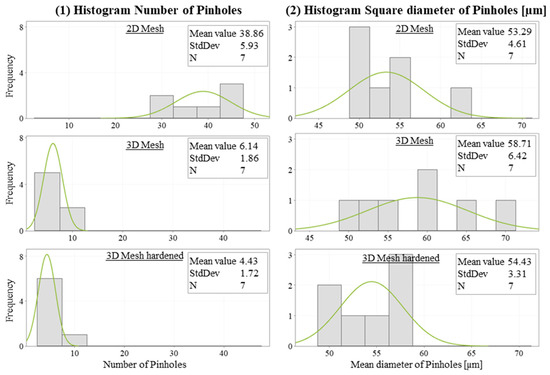
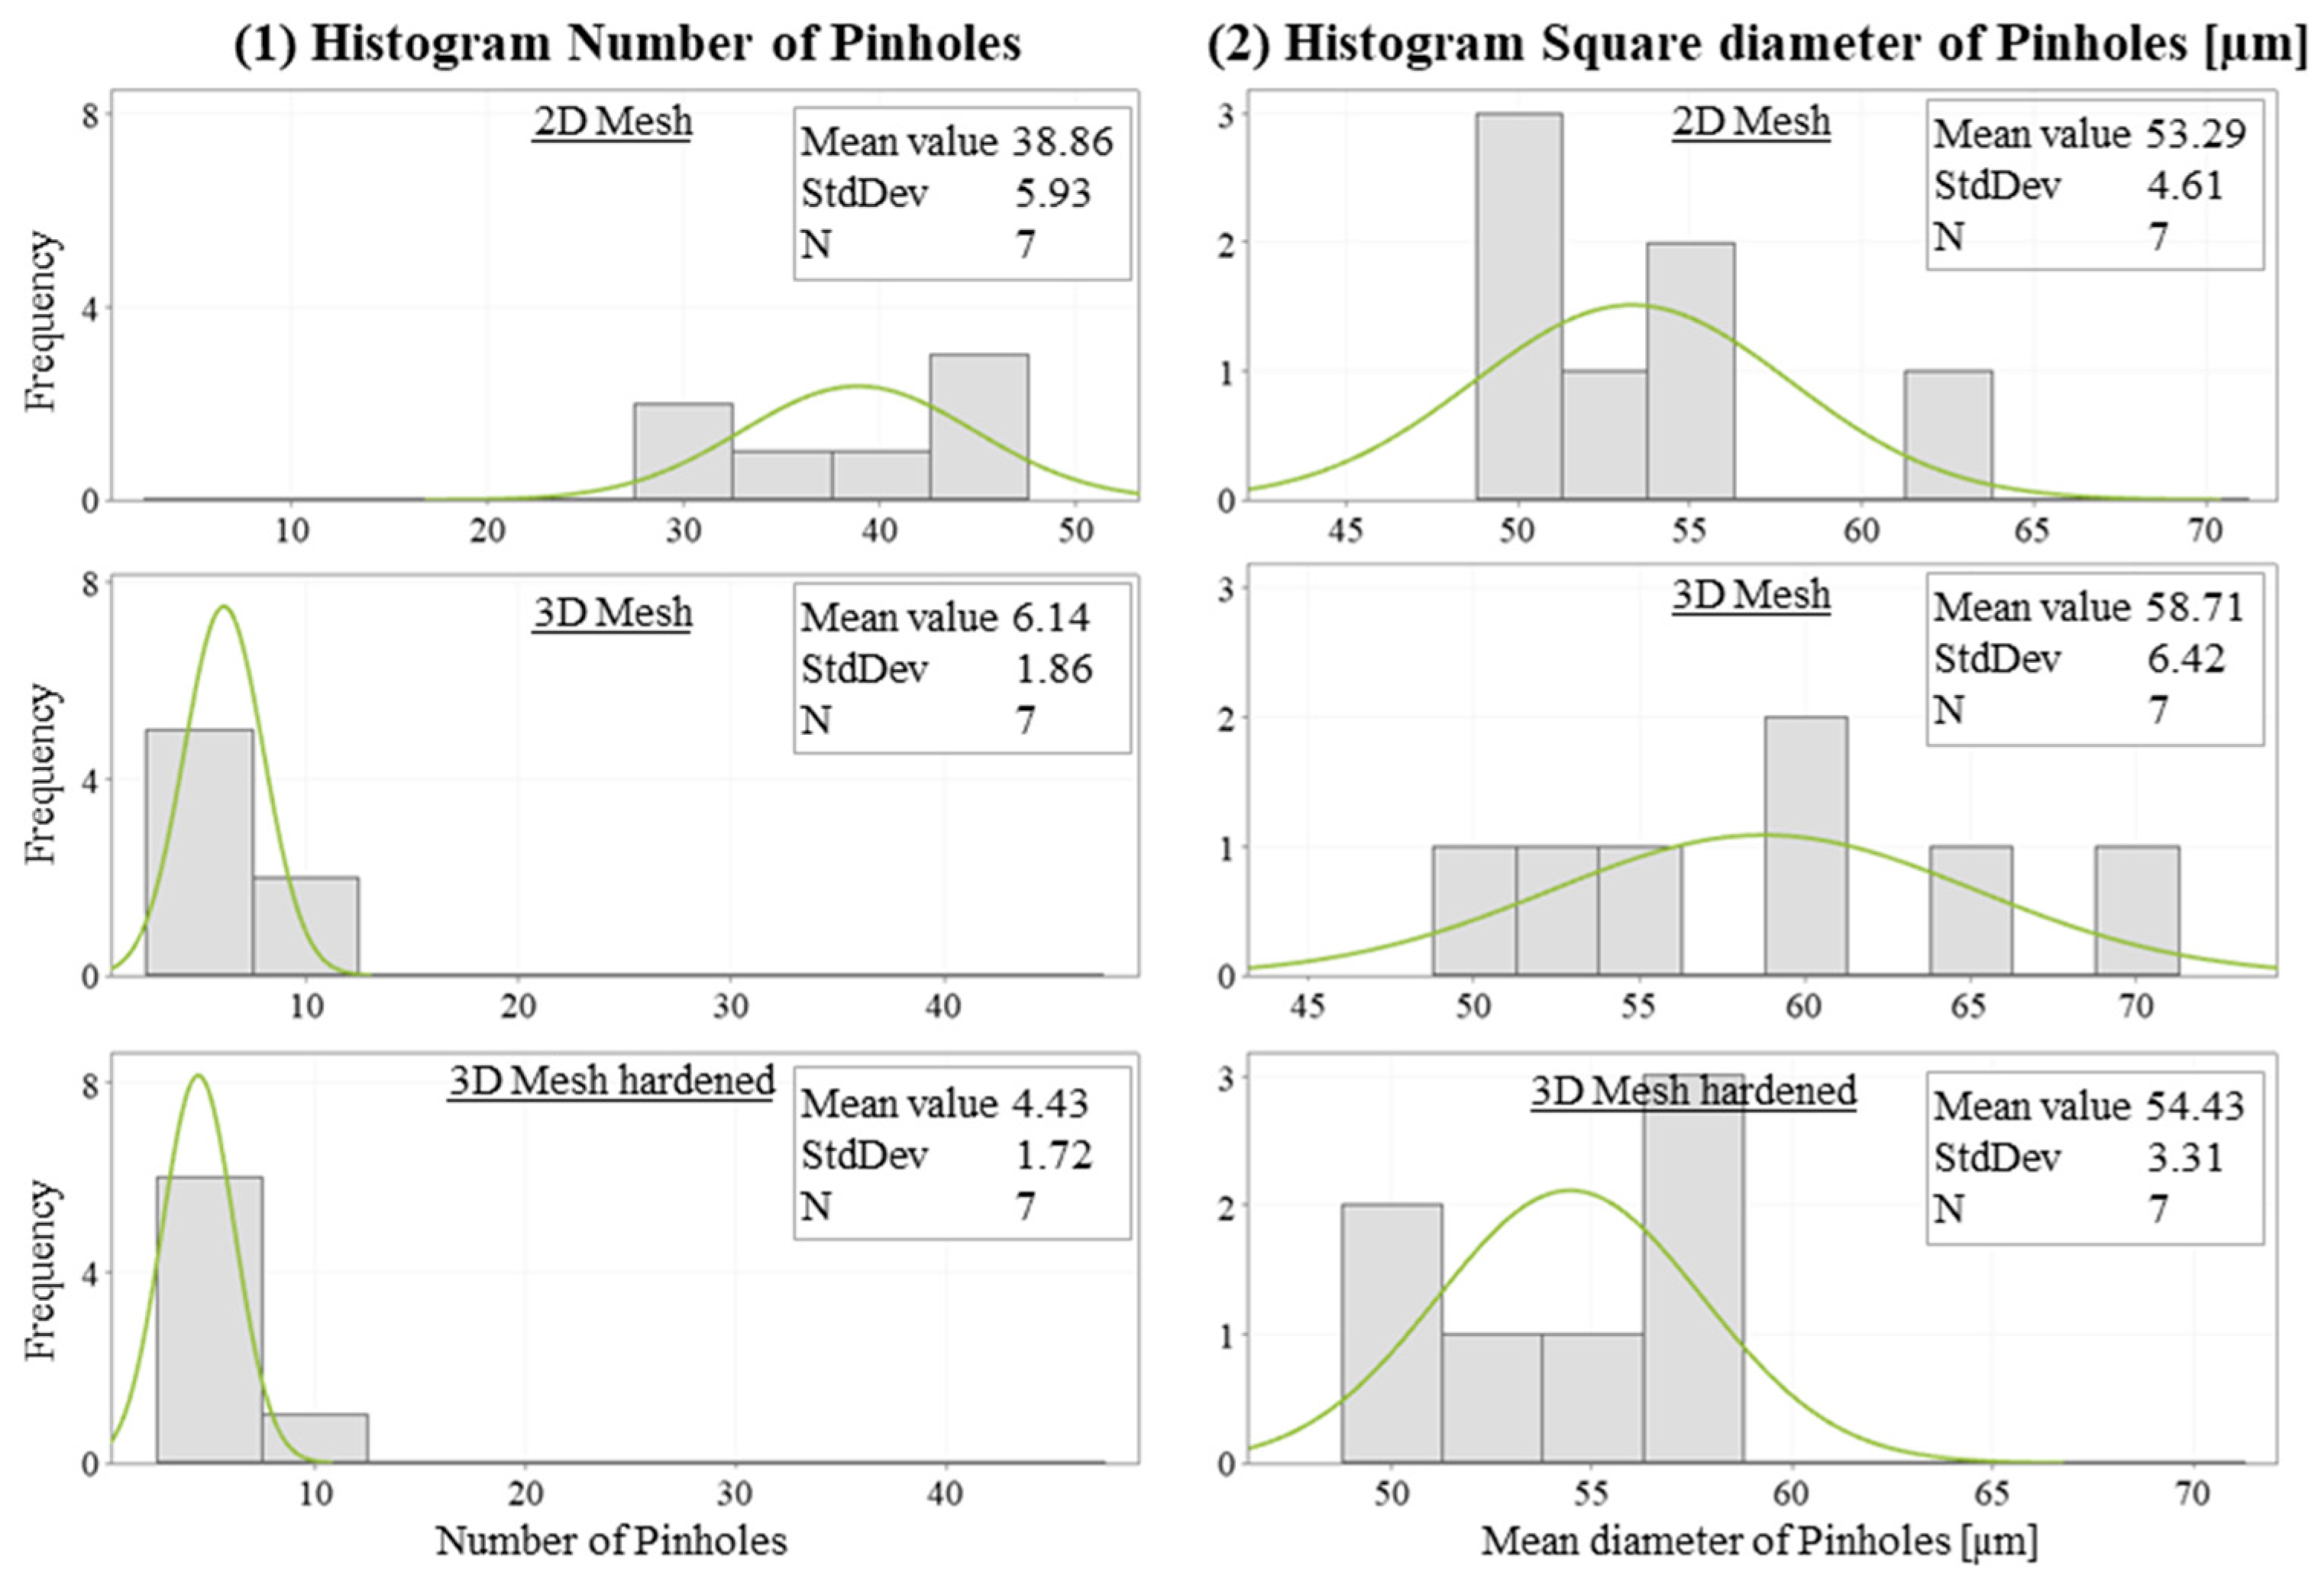
Figure 14.
Histogram of (1) number and (2) mean diameter of pinholes vs. screen type.
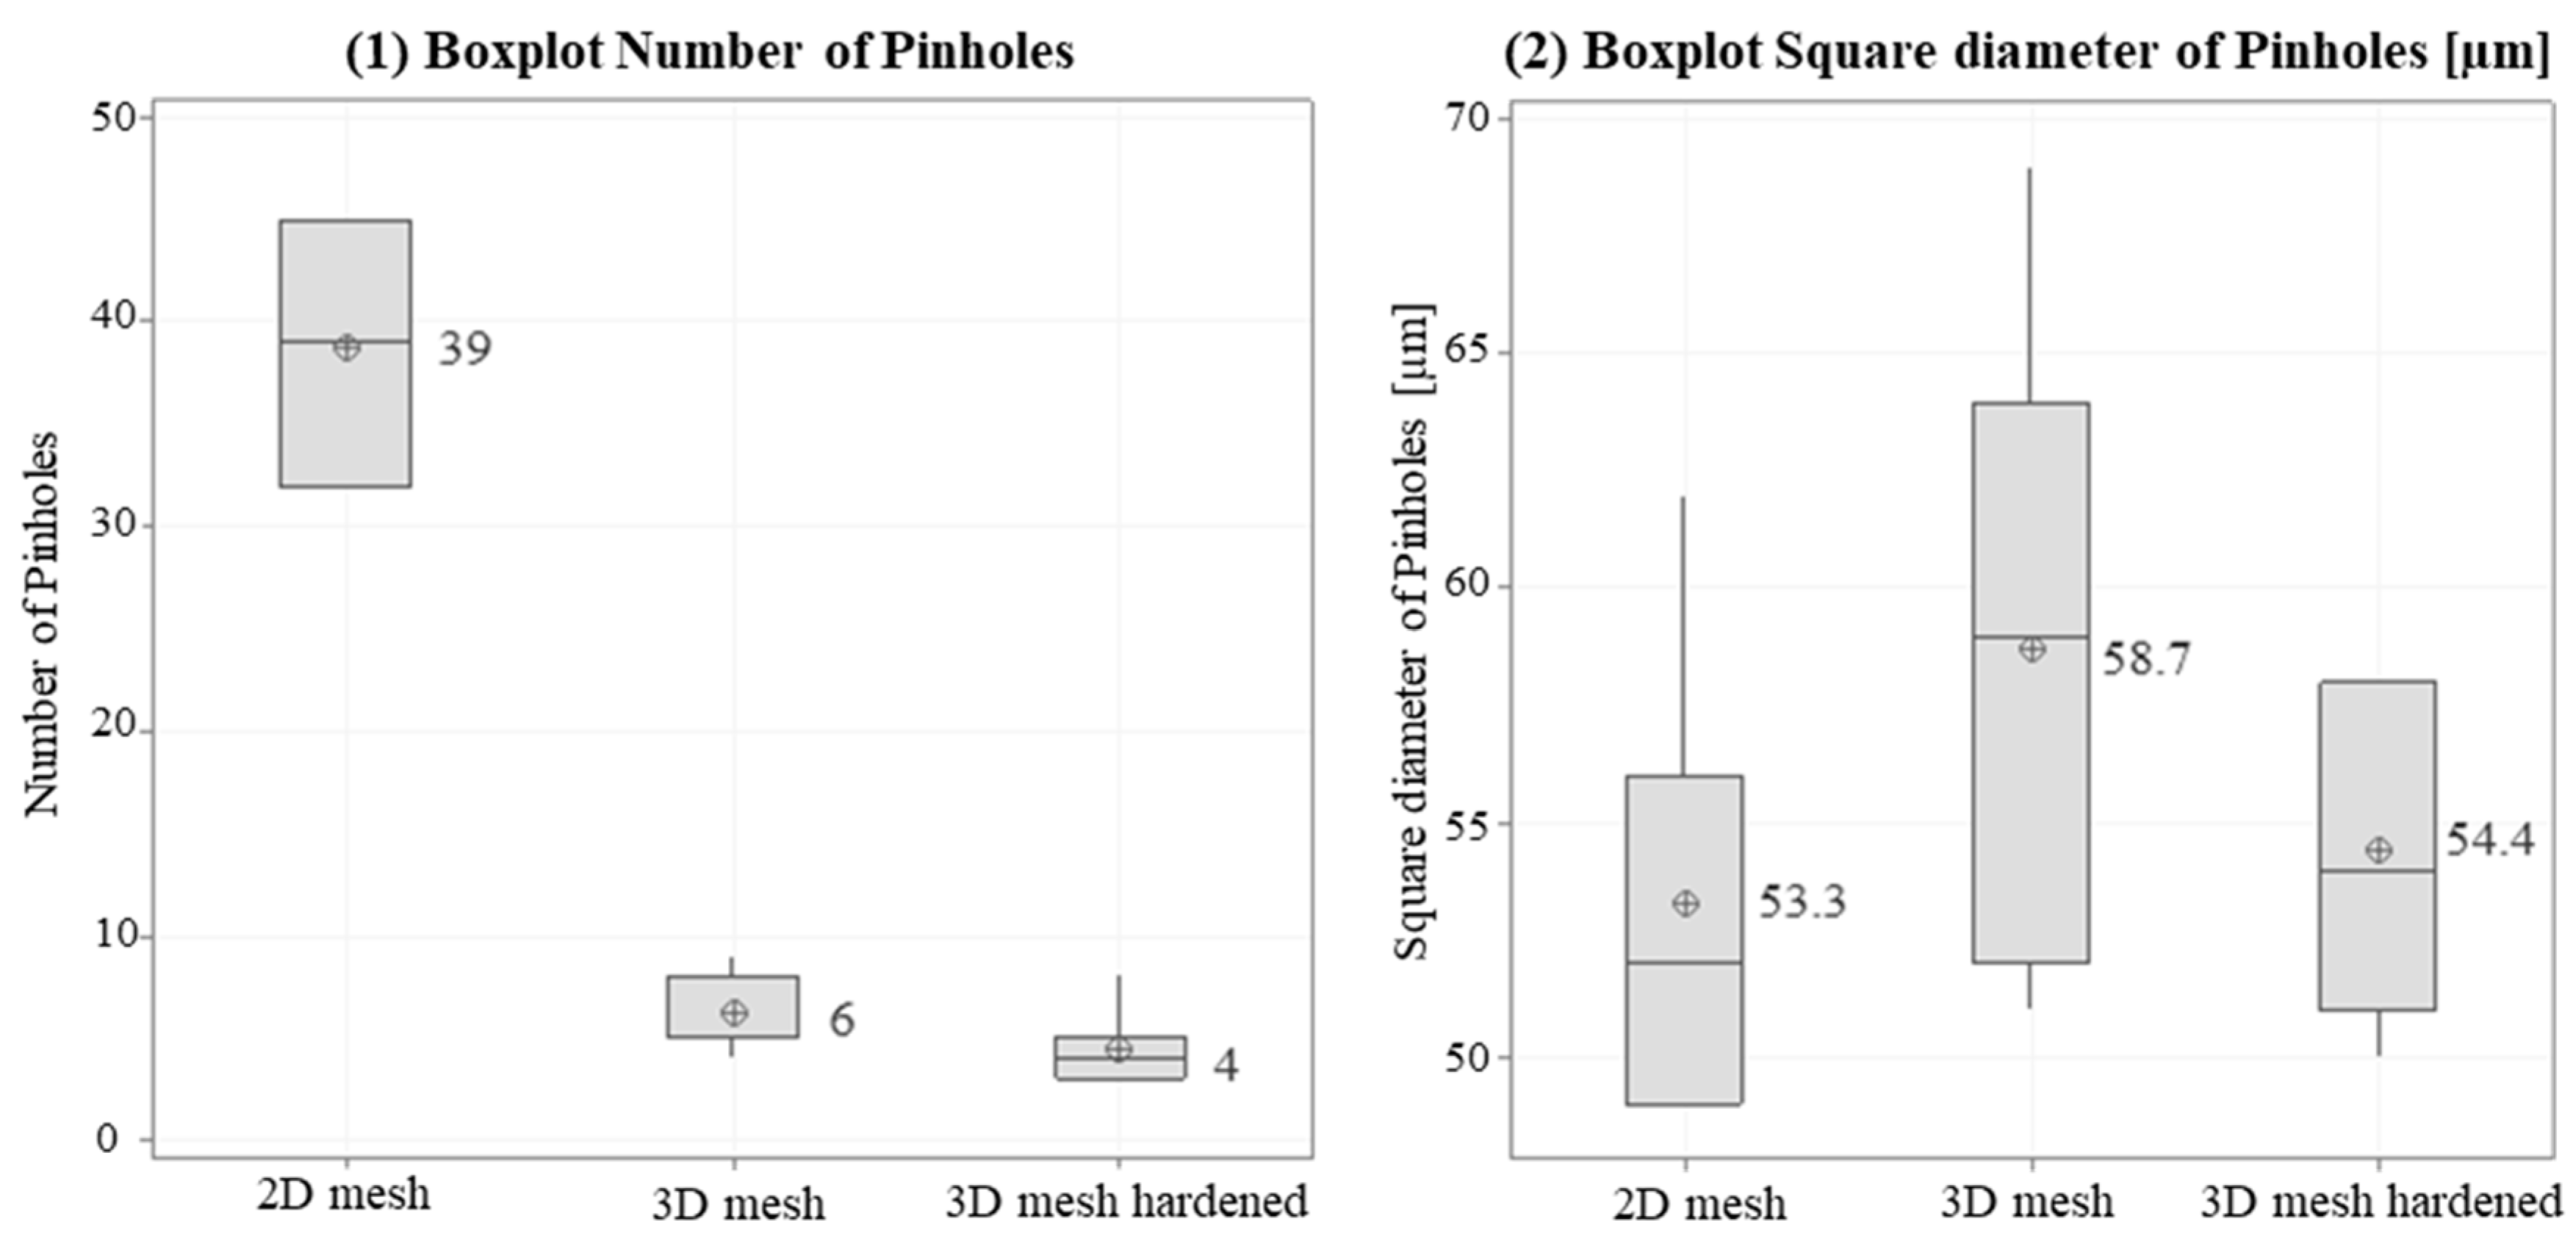
The influence of the screen on the number of pinholes is significant with a p-value of 0.00 < α = 0.05. The coefficient of the determination of R2 shows that 96.5% of the variation in the study can be explained by the variation of the screens. The mean diameter is not related to the variables, as the p-value = 0.125 exceeds the α significance level of 0.05. Also, the coefficient of the determination of R2 = 20.65% indicates that the diameter of the pinholes is not significantly related to the screen type. Figure 15 illustrates the influence of the screen on the number and diameter of the pinholes.
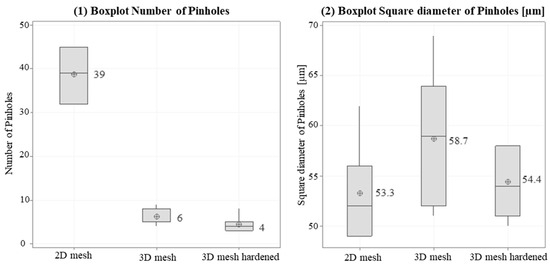
Figure 15.
Boxplot of (1) number and (2) square diameter of pinholes vs. screen type.
In addition to the increase in weight and layer thickness of the green parts, there is also an improvement in the print quality observed. By increasing the theoretical ink volume (Boxplot A), the number of pinholes can be reduced from 39 (2D Mesh) to 6 (3D Mesh), respectively 4 (3D Mesh hardened.The average diameter is independent of the screen. The scatter of the measured values is particularly high with the 3D screen. There is a slight tendency for the size of the pinholes and their distribution to be reduced with the hardened 3D screen.
Based on the results obtained, the hardened 3D mesh is selected for further investigations, as it fulfills the requirements for layer thickness and image quality and has a longer service life due to the curing emulsion. The target parameters of roundness and cycle time are not influenced by the screen type.
3.4. DoE 4: Squeegee Angle
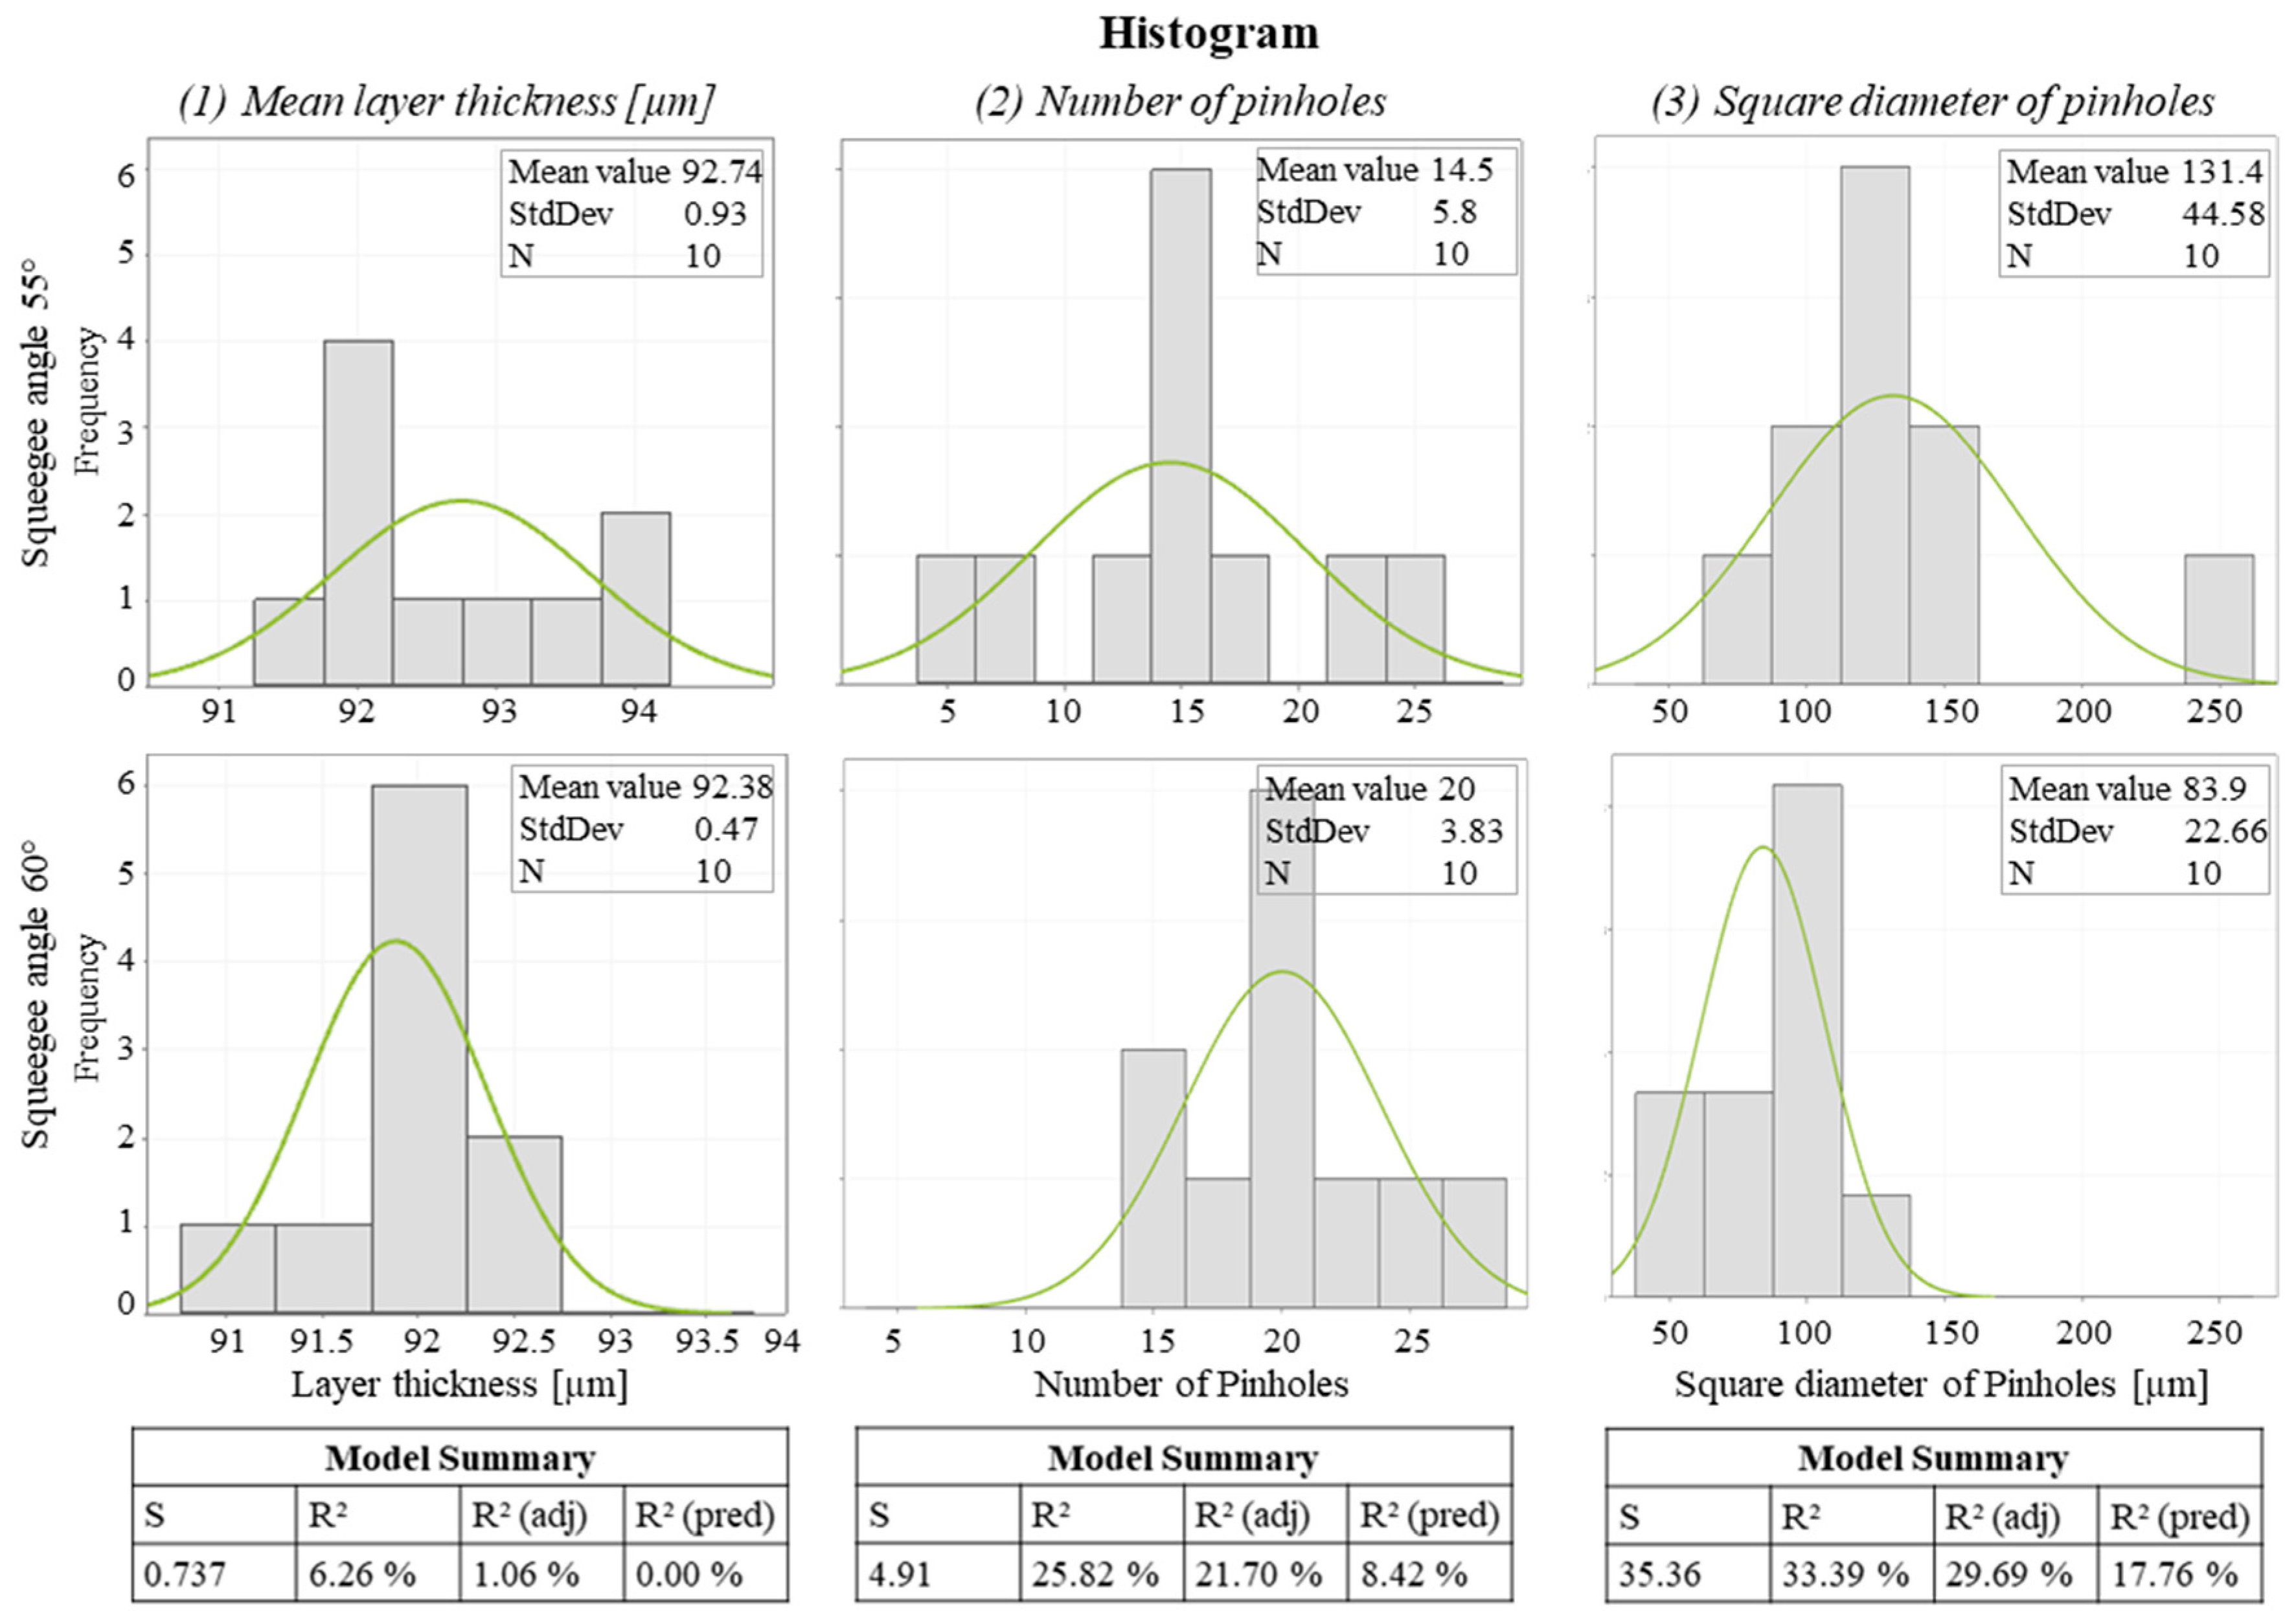
The squeegee angle influences the contact area between the screen and the substrate as well as the tension affecting the screen. Thus, changes in layer thickness due to varying paste transfer, as well as effects on image quality, are to be expected. DoE 4 compares the standard setting squeegee angle 60° with a squeegee angle of 55°. The correlation of the squeegee angle to the layer thickness and print quality is summarized in Figure 16.
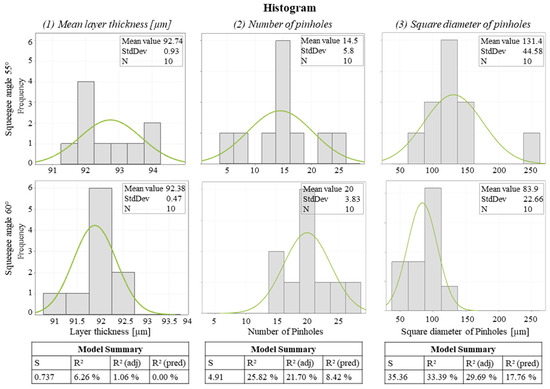
Figure 16.
Histogram.
The influence of the squeegee angle on the layer thickness measurement values is not significant (p-value = 0.287 > α = 0.05) and the coefficient of the determination of R2 = 6.26% does not allow any conclusions regarding correlations between the parameters. This is due to the large variance of the measured values from the layer thickness measurement for squeegee angle 55° (refer to standard deviation). The weak results of the model analysis with respect to the layer thickness measurement can be attributed to the low number of replications. The effect of the squeegee angle change of 5% on the weight and layer thickness of the printed magnetic sheets is small, since the measurement results of both series of experiments are close to each other, which makes it difficult to detect a trend. Based on the results, no main effects and interactions between the squeegee angle and layer thickness can be analyzed.
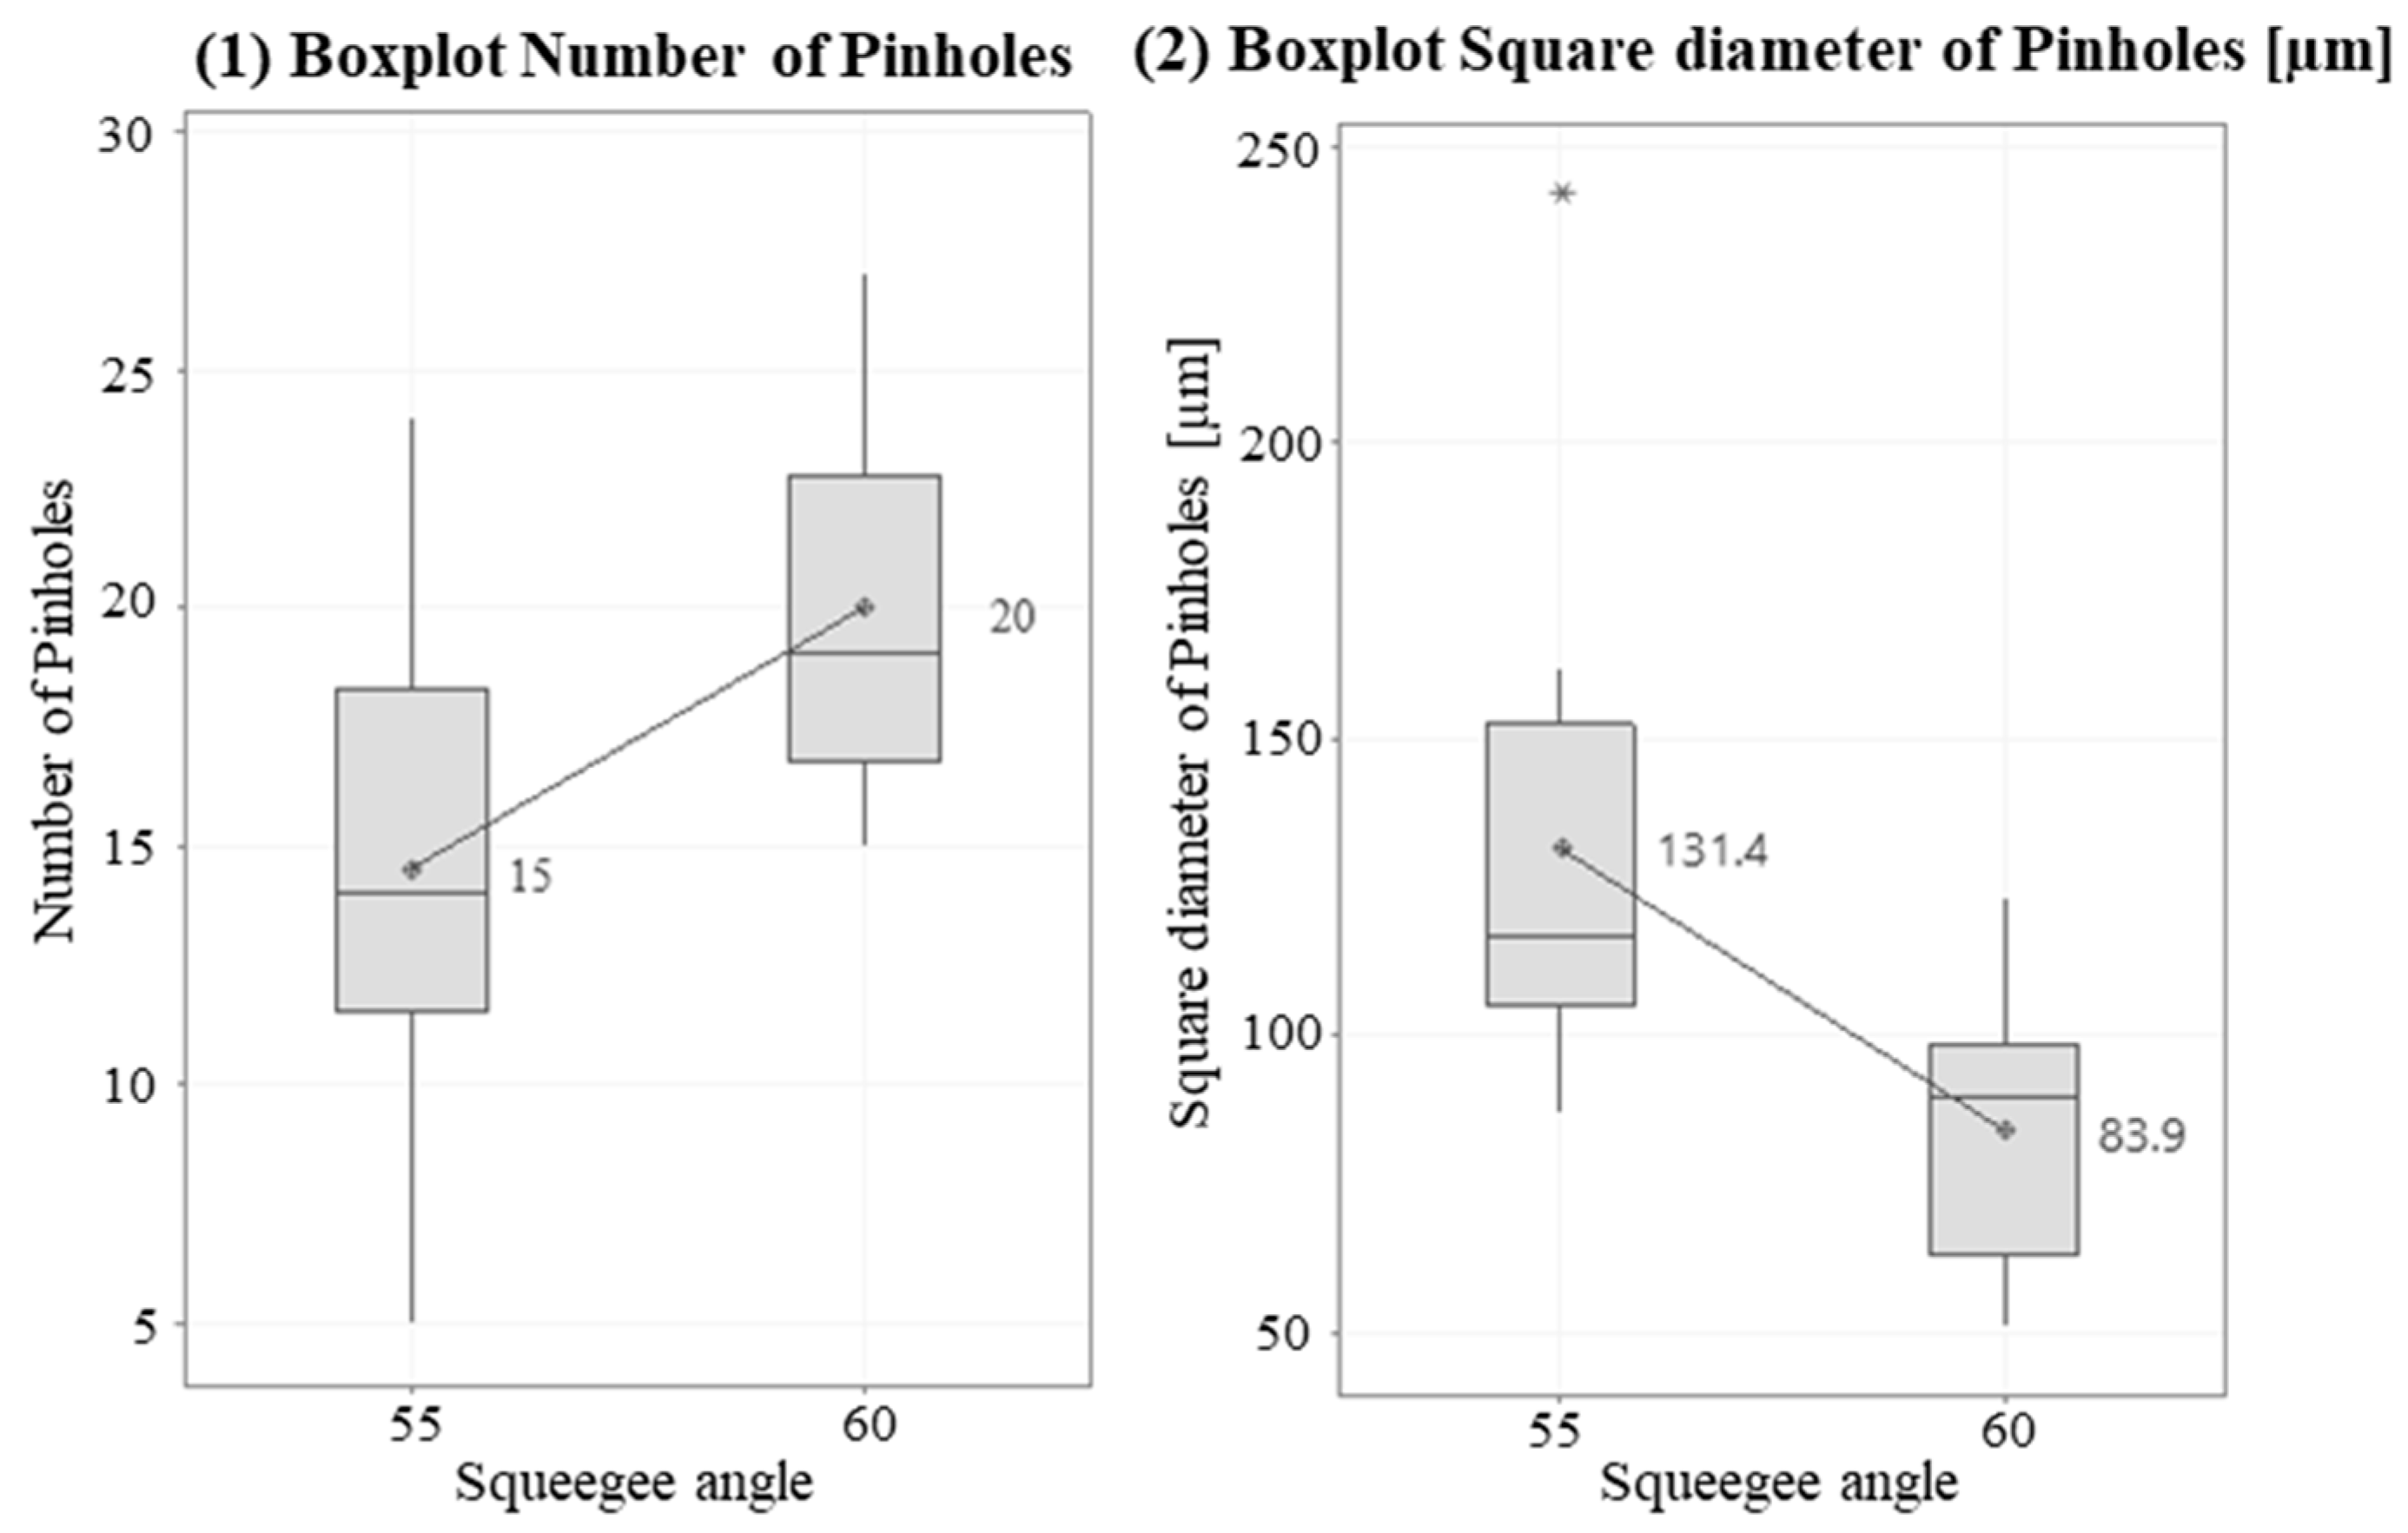
The effect of squeegee angle on the number (p-value = 0.022) and diameter of pinholes (p-value = 0.008) is significant. However, only 26% and 33% of the variance can be attributed to the variation of the squeegee angle. Therefore, the analysis is subjected to increased uncertainty. Figure 17 shows the effect of the changed squeegee angle on the print quality.
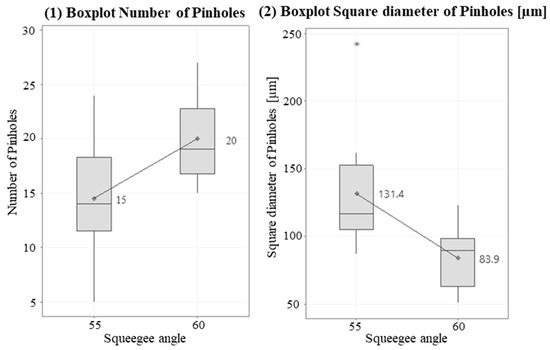
Figure 17.
Boxplot of (1) number and (2) square diameter of pinholes vs. squeegee angle. (Outliers marked as *).
At a squeegee angle of 55°, 15 pinholes with an average diameter of 131 µm are identified. A squeegee angle of 60° shows a higher number of pinholes (20) with a smaller diameter (84 µm). The variance is high, with quartiles of similar sizes between the two settings. The whisker is significantly increased at a squeegee angle of 55° for the number of pinholes, while there is a significant shift between the median and mean value for the mean diameter of the pinholes. No decision can be made for setting the squeegee angle based on this evaluation. The angle should be changed in a further investigation with a larger delta and investigated again. To ensure the comparability of the data, the 60° setting should be preferred for subsequent investigations of other parameters.
4. Conclusions
The flatbed screen-printing process represents an outstanding opportunity to produce near-net-shape green parts for stator laminations with high productivity and high flexibility. Within the entire process chain from powder to the sheet package, several target variables are to be classified as particularly relevant for screen printing. The layer thickness and its distribution over the geometry, as well as the total number and size of defects caused by printing errors, such as clogged screen meshes, are particularly important. Therefore, they represent the core points of this work and are summarized again below with the findings from the tests carried out.
The results illustrate that there are multidimensional interactions between the factors and the target variables. In addition, some of the target variables turn out to be directed in opposite directions. Based on the results of this preliminary investigation, it can be stated that, to achieve the quality targets instantaneously, an additional and extensive full factorial experimental design must be carried out, in which both new factors and factors from this investigation are systematically analyzed.
In DoE 1, squeegee velocity, take-off and roller mill are investigated. The squeegee speed can be selected as even higher than in this investigation and should be oriented to the maximum that is technically possible. An increase in squeegee velocity from the current maximum of 240 mm/s to up to 600 mm/s is conceivable and should be examined on a factor basis. This will reduce the cycle time and, at the same time, the coating thickness can be further increased. Due to the challenges mentioned, the take-off and roller mill should not be changed and defined as fixed influencing parameters in the future.
DoE 2 examines the printing mode. Here, the quality disadvantages become apparent with the print mode print–flood. In contrast, the cycle time can be reduced by print–flood. This factor should, therefore, be tested again in subsequent trials.
The most valuable effect in this study was achieved in DoE 3 using the 3D screens investigated. Increased theoretical ink volume, fabric hardening and calendaring improve several target parameters at the same time. The quality of the green parts increases because the number of defects decreases and, simultaneously, the variation in defects is reduced. In addition, the target layer thickness of 100 µm is achieved more accurately. For subsequent investigations, the screen design 3D mesh hardened is to be fixed. DoE 4 investigates different squeegee angles. The two squeegee angles investigated do not allow a statement to be made as to whether a smaller or larger squeegee angle is to be preferred. This factor should be deferred to future investigations, since no significant changes are to be expected compared to other parameters. If the squeegee angle becomes part of further investigations, then a larger difference between the factors should be selected.
In this study, the iron powder particle-containing paste is not varied. During the execution of the study, it was shown that paste batches with the same alloying constituents already have a significant influence on the target values. It can therefore be assumed that a specific change in viscosity significantly influences the process. Process changes can thus be brought about by systematically varying the paste and the particle shape and size of the iron powder. In this case, there is a risk of significantly affecting the process stability.
Author Contributions
Literature research, A.S., N.W., J.S., S.D., J.F. and A.K.; conceptualization, A.S. and A.K.; methodology, A.S.; software, Minitab (V19).; validation, A.S.; investigation, A.S. and S.D.; data curation, A.S.; writing—original draft preparation, A.S. and N.W.; writing—review and editing, A.S., J.S. and J.F.; visualization, A.S.; scientific supervision, A.K.; supervision, J.F. All authors have read and agreed to the published version of the manuscript.
Funding
This work is supported by the German Federal Ministry of Economic Affairs and Climate Action (BMWK) within the funding program Application-oriented non-nuclear R&D in the 7th Energy Research Program under the contract number 03EN4013 (EffiBlech).
Data Availability Statement
Data are available on request due to restrictions, e.g., the privacy and intellectual property rights held by Siemens AG. The data presented in this study are available on request from the corresponding author.
Acknowledgments
The authors would like to thank all participating colleagues at Siemens Technology, namely R. Männer, G. Rieger, C. Schuh, T. Soller and J. Thamm, and the project partners from the public funded project EffiBlech.
Conflicts of Interest
The authors declare no conflict of interest. The funders had no role in the design of the study; in the collection, analyses, or interpretation of data; in the writing of the manuscript; or in the decision to publish the results.
References
- Ouramdane, O.; Elbouchikhi, E.; Amirat, Y.; Sedgh Gooya, E. Optimal Sizing and Energy Management of Microgrids with Vehicle-to-Grid Technology: A Critical Review and Future Trends. Energies 2021, 14, 4166. [Google Scholar] [CrossRef]
- Martyushev, N.V.; Malozyomov, B.V.; Khalikov, I.H.; Kukartsev, V.A.; Kukartsev, V.V.; Tynchenko, V.S.; Tynchenko, Y.A.; Qi, M. Review of Methods for Improving the Energy Efficiency of Electrified Ground Transport by Optimizing Battery Consumption. Energies 2023, 16, 729. [Google Scholar] [CrossRef]
- Kapetanović, M.; Vajihi, M.; Goverde, R.M.P. Analysis of Hybrid and Plug-In Hybrid Alternative Propulsion Systems for Regional Diesel-Electric Multiple Unit Trains. Energies 2021, 14, 5920. [Google Scholar] [CrossRef]
- Europa.eu. European Commission. Available online: https://op.europa.eu/en/publication-detail/-/publication/158e48ba-a1c7-11e8-99ee-01aa75ed71a1/language-sl (accessed on 7 July 2023).
- European Environment Agency (EEA). Verkehr. Available online: https://www.eea.europa.eu/de/themes/transport/intro (accessed on 21 July 2023).
- Waide, P.; Brunner, C. Energy-Efficiency Policy Opportunities for Electric Motor-Driven Systems International; Working Paper; International Energy Agency (IEA): Paris, France, 2011. [Google Scholar]
- Chapman, S.J. Electric Machinery Fundamentals, 5th ed.; McGraw-Hill: New York, NY, USA, 2005; Volume 1999, p. 1991. ISBN 978-0-07-352954-7. [Google Scholar]
- Libert, F.; Soulard, J. Manufacturing Methods of Stator Cores with Concentrated Windings. In Proceedings of the 3rd IET International Conference on Power Electronics, Machines and Drives—PEMD, Dublin, Ireland, 4–6 April 2006. [Google Scholar]
- Lamprecht, E.; Hömme, M.; Albrecht, T. Investigations of eddy current losses in laminated cores due to the impact of various stacking processes. In Proceedings of the 2nd International Electric Drives Production Conference (EDPC), Nuremberg, Germany, 15–18 October 2012; pp. 1–8. [Google Scholar] [CrossRef]
- Stornelli, G.; Faba, A.; di Schino, A.; Folgarait, P.; Ridolfi, M.R.; Cardelli, E.; Montanari, R. Properties of Additively Manufactured Electric Steel Powder Cores with Increased Si Content. Materials 2021, 14, 1489. [Google Scholar] [CrossRef] [PubMed]
- Tiismus, H.; Kallaste, A.; Belahcen, A.; Tarraste, M.; Vaimann, T.; Rassõlkin, A.; Asad, B.; Shams Ghahfarokhi, P. AC Magnetic Loss Reduction of SLM Processed Fe-Si for Additive Manufacturing of Electrical Machines. Energies 2021, 14, 1241. [Google Scholar] [CrossRef]
- Cramer, C.; Yan, P.; Evans, S.F.; Elliott, A.M.; Chinnasamy, C.; Paranthaman, M.P. Binder jet additive manufacturing method to fabricate near net shape crack-free highly dense Fe-6.5 wt.% Si soft magnets. Heliyon 2019, 5, e02804. [Google Scholar] [CrossRef] [PubMed]
- Pham, T.; Suen, H.; Kwon, P.; Foster, S. Characterization of Magnetic Anisotropy for Binder Jet Printed Fe 93.25 Si 6.75. In Proceedings of the IEEE Energy Conversion Congress and Exposition (ECCE), Baltimore, MD, USA, 29 September–3 October 2019. [Google Scholar] [CrossRef]
- Nartu, M.S.K.K.Y.; Jagetia, A.; Chadhary, V.; Mantri, S.A.; Ivanov, E.; Dahotre, N.B.; Ramanujan, R.V.; Banerjee, R. Magnetic and mechanical properties of an additively manufactured equiatomic CoFeNi complex concentrated alloy. Scr. Mater. 2020, 187, 30–36. [Google Scholar] [CrossRef]
- Chadhary, V.; Nartu, M.S.K.K.Y.; Mantri, S.A.; Dasari, S.; Jagetia, A.; Ramanujan, R.V.; Banerjee, R. Additive manufacturing of functionally graded Co–Fe and Ni–Fe magnetic materials. J. Alloys Compd. 2020, 823, 153817. [Google Scholar] [CrossRef]
- Wasąg, J.; Grabarczyk, M. Copper Film Modified Glassy Carbon Electrode and Copper Film with Carbon Nanotubes Modified Screen-Printed Electrode for the Cd(II) Determination. Materials 2021, 14, 5148. [Google Scholar] [CrossRef] [PubMed]
- ITRPV, International Technology Roadmap for Photovoltaic (ITRPV): 2017 Results, 9th ed.; VDMA Photovoltaic Equipment: Frankfurt, Germany, 2018.
- Tepner, S.; Ney, L.; Linse, M.; Lorenz, A.; Pospischil, M.; Clement, F. Studying Knotless Screen Patterns for Fine-line Screen Printing of Si-Solar Cells. IEEE J. Photovolt. 2020, 10, 319–325. [Google Scholar] [CrossRef]
- Schmidt, A.; Ziegler, M.; Franke, J.; Kuehl, A. Development of Magnetic Sheets for CO2 Efficient Electric Drives Using an Additive Manufacturing Approach. In Manufacturing Driving Circular Economy. GCSM 2022; Lecture Notes in Mechanical Engineering; Kohl, H., Seliger, G., Dietrich, F., Eds.; Springer: Cham, Switzerland, 2023. [Google Scholar] [CrossRef]
- Bräuer, P. 3D Screen Printing Technology–Opportunities to use Revolutionary Materials and Machine Designs. In Proceedings of the 2nd International Electric Drives Production Conference, Nuernberg, Germany, 15–68 October 2012. [Google Scholar]
- Mix, T.; Gröninger, M.; Zhengyi, J.; Reuter, K.; Studnitzky, T.; Lindemann-Geipel, I.; Weissgaerber, T. Additive manufacturing of low loss electrical steel sheets for high efficiency electrical devices. IEEE Trans. Transp. Electrif. 2023. [Google Scholar] [CrossRef]
- Singh, M.; Patkar, M.; Vinchurkar, M.; Baghini, M.S. Cost Effective Soil pH Sensor Using Carbon-Based Screen-Printed Electrodes. IEEE Sens. J. 2020, 20, 47–54. [Google Scholar] [CrossRef]
- Weglinski, B.; Kaczmar, J. Effect of Fe3P addition on magnetic properties and structure of sintered iron. J. Powder Metall. 1980, 23, 210–216. [Google Scholar] [CrossRef]
- Phair, J.W.; Kaiser, A.F.J. Determination and assessment of the rheological properties of pastes for screen printing ceramics. In Proceedings of the Annual Transactions of the Nordic Rheology Society, Reykjavik, Iceland, 18–20 August 2009. [Google Scholar]
- Reinhardt, K.; Hofmann, N.; Eberstein, M. The importance of shear thinning, thixotropic and viscoelastic properties of thick film pastes to predict effects on printing performance. In Proceedings of the IEEE 21st European Microelectronics and Packaging Conference & Exhibition (EMPC), Warsaw, Poland, 10–13 September 2017; pp. 1–7. [Google Scholar]
- Schmidt, A.; Wieprecht, N.; Thamm, J.; Franke, J.; Kuehl, A. Continuous Improvement of the Screen printing Process of Magnetic Sheets for Electrical Machines by Statistical DoE. In Proceedings of the 32nd International Conference on Flexible Automation and Intelligent Manufacturing (FAIM), Porto, Portugal, 18–22 June 2023. [Google Scholar] [CrossRef]
- Asada Mesh Co., Ltd. Asada Mesh Guideline for A-Type Screen Printing. Available online: https://asadamesh-global.com/en/product-introduction/screen_printing_basics (accessed on 7 July 2023).
- DIN 32876-1:1999-06; Verification of Geometrical Parameters—Electrical Linear Measurement—Part 1: Analogue Reception of the Measured Quantity. Concepts, Requirements, Testing; Beuth Verlag: Berlin, Germany, 1999. [CrossRef]
- Tesa. Available online: https://tesatechnology.com/en-gb/products/afficheurs-et-interfaces-electroniques/afficheurs/tt80--tt90-digital-display-units_p47307.htm (accessed on 22 August 2023).


Disclaimer/Publisher’s Note: The statements, opinions and data contained in all publications are solely those of the individual author(s) and contributor(s) and not of MDPI and/or the editor(s). MDPI and/or the editor(s) disclaim responsibility for any injury to people or property resulting from any ideas, methods, instructions or products referred to in the content. |
© 2023 by the authors. Licensee MDPI, Basel, Switzerland. This article is an open access article distributed under the terms and conditions of the Creative Commons Attribution (CC BY) license (https://creativecommons.org/licenses/by/4.0/).