Article

Small Punch Test on Jominy Bars for High-Throughput Characterization of Quenched and Tempered Steel

by
Ibon Miguel
1,2,*,
Itziar Berriozabalgoitia
1,
Garikoitz Artola
1,
Luis María Macareno
2 and
Carlos Angulo
2
1
Azterlan, Basque Research and Technology Alliance (BRTA), 48200 Durango, Spain
2
Department of Mechanical Engineering, University of the Basque Country (UPV/EHU), 48013 Bilbao, Spain
*
Author to whom correspondence should be addressed.
Metals 2023, 13(11), 1797; https://doi.org/10.3390/met13111797
Submission received: 22 September 2023 / Revised: 18 October 2023 / Accepted: 21 October 2023 / Published: 25 October 2023

Abstract

:
Studying the effect of quench and tempering heat treatments on steel, more specifically screening the effect of the austenitizing, quenching, and tempering conditions on mechanical properties, can be extremely material- and time-consuming when standard tensile testing specimens are employed. Jominy bar end quench testing has been used as a standard method to reduce the resources that are required for this type of screening. Jominy bar testing by itself shows, though, the limitation of yielding only hardness and microstructure as a result. In the last few years, the small punch test (SPT) standard has been developed. This technique can obtain an estimation of tensile mechanical properties with miniaturized specimens, which can be dissected from Jominy bars. The paper proposes a new testing methodology for screening the outcome of heat treatment conditions by combining the Jominy bar testing and SPT. Quench and tempering of API 5L X65Q pipe steel is used as a case study to describe the proposed methodology. The ability of the Jominy with SPT to detect variations in the mechanical properties produced by heat treatments is shown. This methodology can be directly applied as a high-throughput testing approach in the optimization of heat treatments.

1. Introduction

High-throughput testing is employed in materials research for screening a high number of experimental conditions, which involves minimal sample preparation, reduced sample volumes, high automatization, parallelization of measurements, and miniature specimens [1]. Regarding miniaturized techniques, several have been reported for mechanical property characterization [2,3], though not all of them are standardized. This lack of standardization causes difficulties when comparing and interpreting the results in the literature. The small punch test (SPT) is a good example of the variations that can be found in testing conditions prior to standardization [4]. The SPT shows the advantages of being standardized both by the American Society for Testing Materials (ASTM E3205 test method) and the European Committee for Standardization (EN 10371 test method), in 2020 and 2021, respectively. Both standards fully describe the testing methodology, involved tooling, load carrying and transfer mechanism, and specimen features.
The SPT is a very versatile technique as it allows for the characterization of a broad spectrum of materials, testing conditions, and mechanical properties. The estimation of tensile properties such as yield strength, tensile strength, elongation, and the ductile-to-brittle transition temperature is standardized in both ASTM E3205 and EN 10371. Many other properties have been explored in terms of the coverage of both standards, such as the elastic modulus, fracture toughness, creep response, and fatigue behavior [4,5]. In terms of testing conditions, the SPT has been used for characterizing the mechanical response of materials submitted to magnetic fields [6], at cryogenic temperatures [6,7,8], at elevated temperatures [9,10,11,12], and immersed in embrittling media [13].
Regarding material conditioning and processing, the SPT has been reportedly used for studying the effects of neutron-ion irradiation [14], exposure to hydrogen embrittlement [15], thermal ageing [16,17], annealing [18], hot isostatic pressing [19], and thermal cutting [20]. These thermal ageing, annealing, hot isostatic pressing, and thermal cutting studies are related to the field of heat treatment. In this field, a high-throughput test known as the Jominy test is standardized in ASTM A255 and ISO 642 and allows the generation of materials that have been quenched at different cooling rates from a minimum material amount whose dimensions are Ø25 × 100 mm. The ability of screening quenching rates has proved to be valid for the traditional application of high-throughput tests, such as for alloy design [21]. The material characteristics that the Jominy test allows one to assess are hardness and microstructure for a broad range of cooling rates at a given temperature [22,23,24], which explain why this technique has been used not only for steels but also for non-ferrous alloys [23,24].
In this scenario, a combination of the Jominy test with SPT offers the possibility to increase the throughput of the testing even further, as the standard diameter of Jominy bars allows one to obtain at least three SPT specimens from any desired quenching rate present in the bar. Following the quenching rate, sampling positions of ASTM A255 and ISO 642, SPT specimens could be used to explore the mechanical properties generated by three tempering conditions for at least 22 quenching rates with a single Jominy bar. Despite some works that studied the effect of the cooling rate on mechanical properties by employing the SPT, including research on the heat affected zones (HAZs) on thermal cutting and welds [20,25] and on pressure tubes combining dilatometry and the SPT [26], we have not found any instances in the literature regarding the combination of the Jominy test and SPT for the same purposes.
This study proposes a new methodology that combines the Jominy test with the SPT to overcome the drawbacks of the approaches mentioned above: the lack of control on the cooling rate and tempering in previous HAZ studies and the high resource demand for performing a dilatometric test for each thermal condition of interest on SPT specimens. With the new methodology proposed here, a Jominy bar easily yields over 60 heat treatment conditions with a continuous distribution of controlled cooling rates from which to choose. This means extremely reduced material needs and lower specimen manufacturing effort. Furthermore, the new testing methodology presented here can be used to screen across a continuous range of cooling rates with a high spatial resolution along the Jominy bar (0.5 mm). In order to show the feasibility of employing the methodology, a case study is presented where the influence on the mechanical properties of a pipe steel grade of the austenitizing temperature, quenching rate, and three tempering conditions is characterized. Beyond the case study selected for this manuscript, this new experimental approach can also be applied to study other phenomena of interest for heat-treating technology, such as solution annealing and ageing behaviors or temper embrittlement.

2. Materials and Methods

The work in this study has been carried out using API 5L X65Q pipe steel. Its chemical composition was analyzed using an automatic combustion analyzer (Leco CS744, Leco Corporation, St. Joseph, MI, USA) and spark emission spectrometry (Spectrolab M10, Spectro, Kleve, Germany) to determine any elements therein in addition to carbon and sulfur. The results of the analyses are shown in Table 1 together with the API 5L X65Q specifications.

2.1. Jominy Test

The Jominy test consists of heating the specimen above the austenitizing temperature and quenching with a controlled flow of water applied on one of the ends of the sample. This cools the specimen from one end and allows one to obtain the hardenability of the steel sample under a set of given conditions. For this work, two Jominy test specimens were machined following the Jominy testing standard UNE EN ISO 642. The specimens were 25 mm in diameter and 100 mm in length. In this work, the Jominy test temperatures for each specimen were 890 and 920 °C. The two specimens were heated and maintained at the corresponding temperatures for 30 min to ensure heating of the core. The tests were performed in a Jominy testing machine (Remet S.A.S., Bologna, Italy). During the test, a water jet at 20 °C was applied to one of the ends of the specimen and maintained for 10 min, and after that time the specimen was submerged completely in cold water. After quenching both Jominy samples and before extracting the SPT samples, hardness tests at different positions were performed with a semi-automatic Rockwell durometer (Emco-test DJ10G5, Emco-test, Kuchl, Austria) following the distances given in the Jominy testing standard UNE EN ISO 642. The obtained results are summarized in Figure 1, with 26 trials in total.
The quenching at 890 °C is slightly harder in the millimeters closest to the quenched face. For 9 mm and greater, the hardness of both quenching temperatures is the same and below the regular Rockwell C scale. The first 10 mm is where the drop in mechanical properties is most clearly observed.

2.2. SPT Specimen Extraction

The SPT samples were extracted from the tested Jominy specimens with the following methodology (Figure 2). The quenched end of the Jominy sample was marked for traceability. From each Jominy sample, three cylinders with a small “shoulder” along all the length were extracted with electrical discharge machining (EDM). The cylinders were 8 mm in diameter, with a shoulder of 1 × 3 mm and length of 100 mm. The shoulder was used to stop the SPT specimens from detaching from the cylinder during machining, thus allowing for their traceability. From each set of three cylinders, one was processed in quenched conditions, one was tempered at 620 °C, and the last one was tempered at 420 °C. The heat treatments for the total of six cylinders are summarized in Table 2. They have been coded in the table for reference in the results section.
After the corresponding heat treatments, the SPT specimens were pre-machined from each cylinder using EDM to a thickness of 0.6 mm, leaving 1 mm of shoulder uncut. Thus, 10 SPT samples per cylinder were obtained, yielding 60 in total. As the first 10 mm is where the strongest hardness drop is observed, ten SPT samples were extracted from this area close to the quenched face. Specimens in each cylinder were extracted with approximately 1 mm distance of separation from each other.

2.3. SPT Specimen Conditioning

The samples were identified for traceability according to their corresponding position on the Jominy bar. They were ground and polished to a final thickness of 0.5 mm. First, one of the faces was ground with abrasive paper, starting with P240, followed by P600, and finishing with P1200. Second, the sample was turned over, and the process was repeated until a thickness of 0.500 ± 0.005 mm was obtained. Before the test, the diameter, thickness, and roughness (Ra) of samples were measured. For the diameter, two measurements were taken at 90° from each other, and the thickness was measured at four positions around the perimeter at 90° intervals from each other and in the middle.
In total, 60 samples were tested with a universal testing machine (Zwick All Round Z100, Zwick, Ulm, Germany), coupling a load cell of 5 kN and a SPT tool with the dimensions in accordance with the standard ASTM E3205-20. The characteristic geometrical dimensions of the SPT tool are described as follows; the diameter of the receiving die is 32 mm, the diameter of the receiving die bore is 4 mm, the punch diameter is 2.5 mm, the corner radius of the receiving die is 0.2 mm, and a ball of 2.5 mm with a hardness of 55 HRC is employed to force the central portion of the specimen through the hole in the receiving die.
All specimens processed with this conditioning methodology comply with the requirements of the SPT testing standard ASTM E3205-20.

3. Results

All the samples analyzed in this study were extracted from a known distance to the quenched end of the Jominy bar, so with this distance and the data shown in Figure 3, obtained from UNE EN ISO 642, the cooling rates corresponding to each sample were obtained; see Table 3.
After performing the SPT, a force–displacement curve for each specimen was obtained. The data processing was performed with a Microsoft Excel, macro-enabled spreadsheet as employed by National Institute of Standards and Technology (NIST) in [27], which provides the characteristic points of the curve (Fe, Fm, um, uf, ESP, Em, and EPL). The Fe value used in this study is based on the calculation of the vertical projection of the point of intersection of the two tangents on the curve test, Fm is the maximum force of the curve, and um is the displacement corresponding to the maximum force Fm. These three values obtained from the SPT curve are used for estimating the mechanical properties.
Even though there are approximations for the mechanical property estimation of the yield strength (RP0.2) and ultimate tensile strength (Rm) prior to the ASTM E3205-20 [28], the ASTM E3205-20 proposed expressions for RP0.2 Rm, are, respectively:
R P 0.2 = β R p 0.2 · F e h 0 2 ,
R m = β R m · F m h 0 · u m ,
where β R p 0.2 and β R m are material-dependent empirical constants. The empirical constant β R p 0.2 used to estimate the yield strength is obtained from the recommended value given by EN 10371, which for steels with RP0.2 values in the range of 200 MPa to 1000 MPa is β R p 0.2 = 0.479, as is the case in this study. For the empirical constant β R m , the values of the Vickers hardness number (HV) were obtained in each specimen with a Vickers micro-durometer (FM-700, Future Tech Corp., Tokyo, Japan), and with the ASTM E140 hardness conversion table, the tensile strength was obtained (see Table 4). The values of the tensile strength and Fm/(h0·um) are correlated, allowing us to obtain an equation to estimate the tensile strength from the SPT.
In Figure 4, the correlation for the tensile strength is presented. The data have been fitted with a straight line that passes through the origin, following the recommendations of ASTM E3205-20. This correlation, where β R m represents the slope, is:
y = 0.39 x   R 2 = 0.99 .
In addition, we also fit the data with a linear function where the y-intercept was allowed to vary freely during the fit; see Figure 5. In this case, Equation (4) is obtained:
y = 122.36 + 0.44   x   R 2 = 0.81 .
Comparing the two fittings for mechanical resistance, a better correlation is obtained by making the linear fit pass through the origin. Consequently, the tensile strength estimation in this study was carried out using β R m = 0.39. The tensile and yield strengths for all the samples were estimated, and the obtained values are presented in Table 5 and Table 6.
With the mechanical properties obtained by means of the SPT, along the length of the Jominy bar and for different heat treatments, the mechanical properties as a function of the cooling speed were plotted, as shown in Figure 6. The results of the tensile and yield strength estimation, compared between different tempering temperatures for each quenching temperature, can be seen in Figure 6.
For the specimens quenched from 890 °C and their different tempering conditions (Figure 6a,b), differences in the mechanical properties, both Rm and RP0.2, can be observed for each cooling rate. This difference becomes greater as the cooling rate increases and decreases to almost equal the mechanical properties at slow cooling rates. The specimens quenched from 920 °C and their corresponding tempering conditions (Figure 6c,d) show a similar behavior to the specimens quenched from 890 °C. The mechanical properties of the samples subjected to the different cooling rates from 920 °C and those quenched and tempered at 420 °C are similar, and only small differences can be observed at high cooling rates. Also, the results compared between the different quenching temperatures for the same tempering conditions are shown in Figure 7.
Figure 7a,c,e show that there is only a small difference in Rm between the different quenching temperatures studied, provided that tempering is subsequently applied at 420 °C or 620 °C. On the other hand, for RP0.2 (Figure 7b,d,f), greater differences can be observed between the quenching temperatures applied, which remain constant for the different cooling rates. From Figure 1 and Figure 7, it can be observed that in both cases, i.e., the SPT and the hardness test, the quenching at 890 °C yields higher mechanical properties. In summary, the SPT technique shows its capability for studying the mechanical properties of steels with different heat treatment conditions by employing only a very small amount of material.
For each heat treatment condition, the microstructure of SPT specimens was studied at two different cooling rates, which are representative of the boundaries of study, see Figure 8 and Figure 9 (magnification bar dimension corresponds to the length of the white rectangle). The selected cooling temperatures correspond to the quenched end face of the Jominy (370 °C/s), where the greatest difference in mechanical properties for each heat treatment temperature is found, and to specimens far from the quench zone (37 °C/s), an area where mechanical properties between heat treatments temperatures are more similar.
Figure 8 shows the microstructures of the quenching at 920 °C and their respective temperings at 420 °C and 620 °C for two different cooling rates, 37 °C/s on the right side and 370 °C/s on the left side.
The quenched and tempered microstructures for the specimens with high cooling rate (370 °C/s) show sharper differences in the evolution of the microstructure from the as-quenched condition to the tempered conditions, when compared to the specimens with low cooling rate (37 °C/s). The quenched sample for high cooling rate (Figure 8a) is composed entirely of martensite and traces of bainite. When the sample is tempered at 420 °C (Figure 8b), tempered martensite and tempered bainite are observed in the microstructure. On the other hand, when tempered at 620 °C (Figure 8c), the grains recrystallize into ferrite.
For the slower cooling rate (37 °C/s), the quenched sample (Figure 8d) shows mostly bainite. The samples tempered at 420 °C and 620 °C (Figure 8e,f) show a similar structure, composed of tempered martensite and bainite.
Figure 9 shows the microstructures of the quenching from 890 °C and the respective temperings at 420 °C and 620 °C for the two selected cooling rates, 37 °C/s on the right side and 370 °C/s on the left side. The observed behavior shows the same pattern as the one in Figure 8, but in this case the recrystallization is less appreciable.

4. Discussion

The SPT results show that this miniaturized technique can be used to estimate and distinguish the mechanical properties of X65Q steel under different heat treatment conditions. Also, the mechanical properties were compared with the microstructures, and good correlation was obtained. The specimens with high cooling rates (370 °C/s) show a clear evolution in the microstructure, where martensite was obtained for the specimens with higher mechanical properties. With the tempering at 420 °C, the mechanical properties decrease, and this can also be observed with the appearance of tempered martensite and tempered bainite. When tempering at 620 °C, the mechanical properties are the lowest, and the microstructure shows ferrite, which has low hardness.
For the specimens with lower cooling rates of 37 °C/s, the mechanical properties of the different heat treatment temperatures show similar behavior, and there are no major differences in the microstructures either.
The main advantage of the small sample size is the low volume of material needed to carry out studies where a wide variety of conditions are analyzed. A study like the one presented here, using traditional methods such as tensile tests, would require larger volumes of material, tests, and time. To achieve these results, 60 tensile specimens would be required, which, with a pre-machining dimension of Ø17 × 20 mm, would result in a total of 12.7 kg of steel. While using the methodology presented in this paper, the materials used were two Jominy specimens, with a total of 800 g of steel. This methodology, in addition to reducing the volume of material used by 94%, simplifies the heat treatments to be carried out. Each tensile specimen would need an independent heat treatment, and obtaining the cooling rates obtained with the Jominy specimen is not easy. For this, different media are needed, such as water, oil, or air at different temperatures. With the presented methodology, the number of HTs is also reduced, from 20 quenchings and two temperings to two quenchings and two temperings.
These results also provide relevant information about the mechanical properties of thick-walled tubes, showing how the properties of the tube can change as a function of thickness due to cooling rate gradients. With this methodology, the heat treatment conditions of tubes, flanges, and components of high thickness can be optimized according to the required mechanical properties for each application.
An example of a practical application where this methodology can be applied is in the manufacturing process of very thick pipes. During the manufacturing process, the tubes are heat-treated in furnaces, where they are heated to high temperatures and then introduced into water to quench them to improve their mechanical properties. The problem of these heat treatments is controlling the cooling of the tube inward from the outer surface since the outer surface of the tube is permanently surrounded by water and quenches faster than the inner surface. When water is introduced inside the tube, steam is generated and is not readily evacuated from the tube cavity, leading to a steam cushion in some areas that impedes contact of the inner surface with the quenching water. All these factors generate inhomogeneous mechanical properties in the tube.
Using the method of the present study combined with heat treatment simulations, the manufacturing process can be optimized to generate tubes with more homogeneous mechanical properties. By means of finite elements, is possible to calculate the temperature of any point in the tube’s thickness after leaving the furnace. Knowing these temperatures and armed with graphs such as those shown in Figure 7, it is possible to predict the cooling rates necessary for each zone of the tube, thus allowing one to perform the quenching in optimal conditions to homogenize the tube.

5. Conclusions

With the obtained results, it can be concluded that:
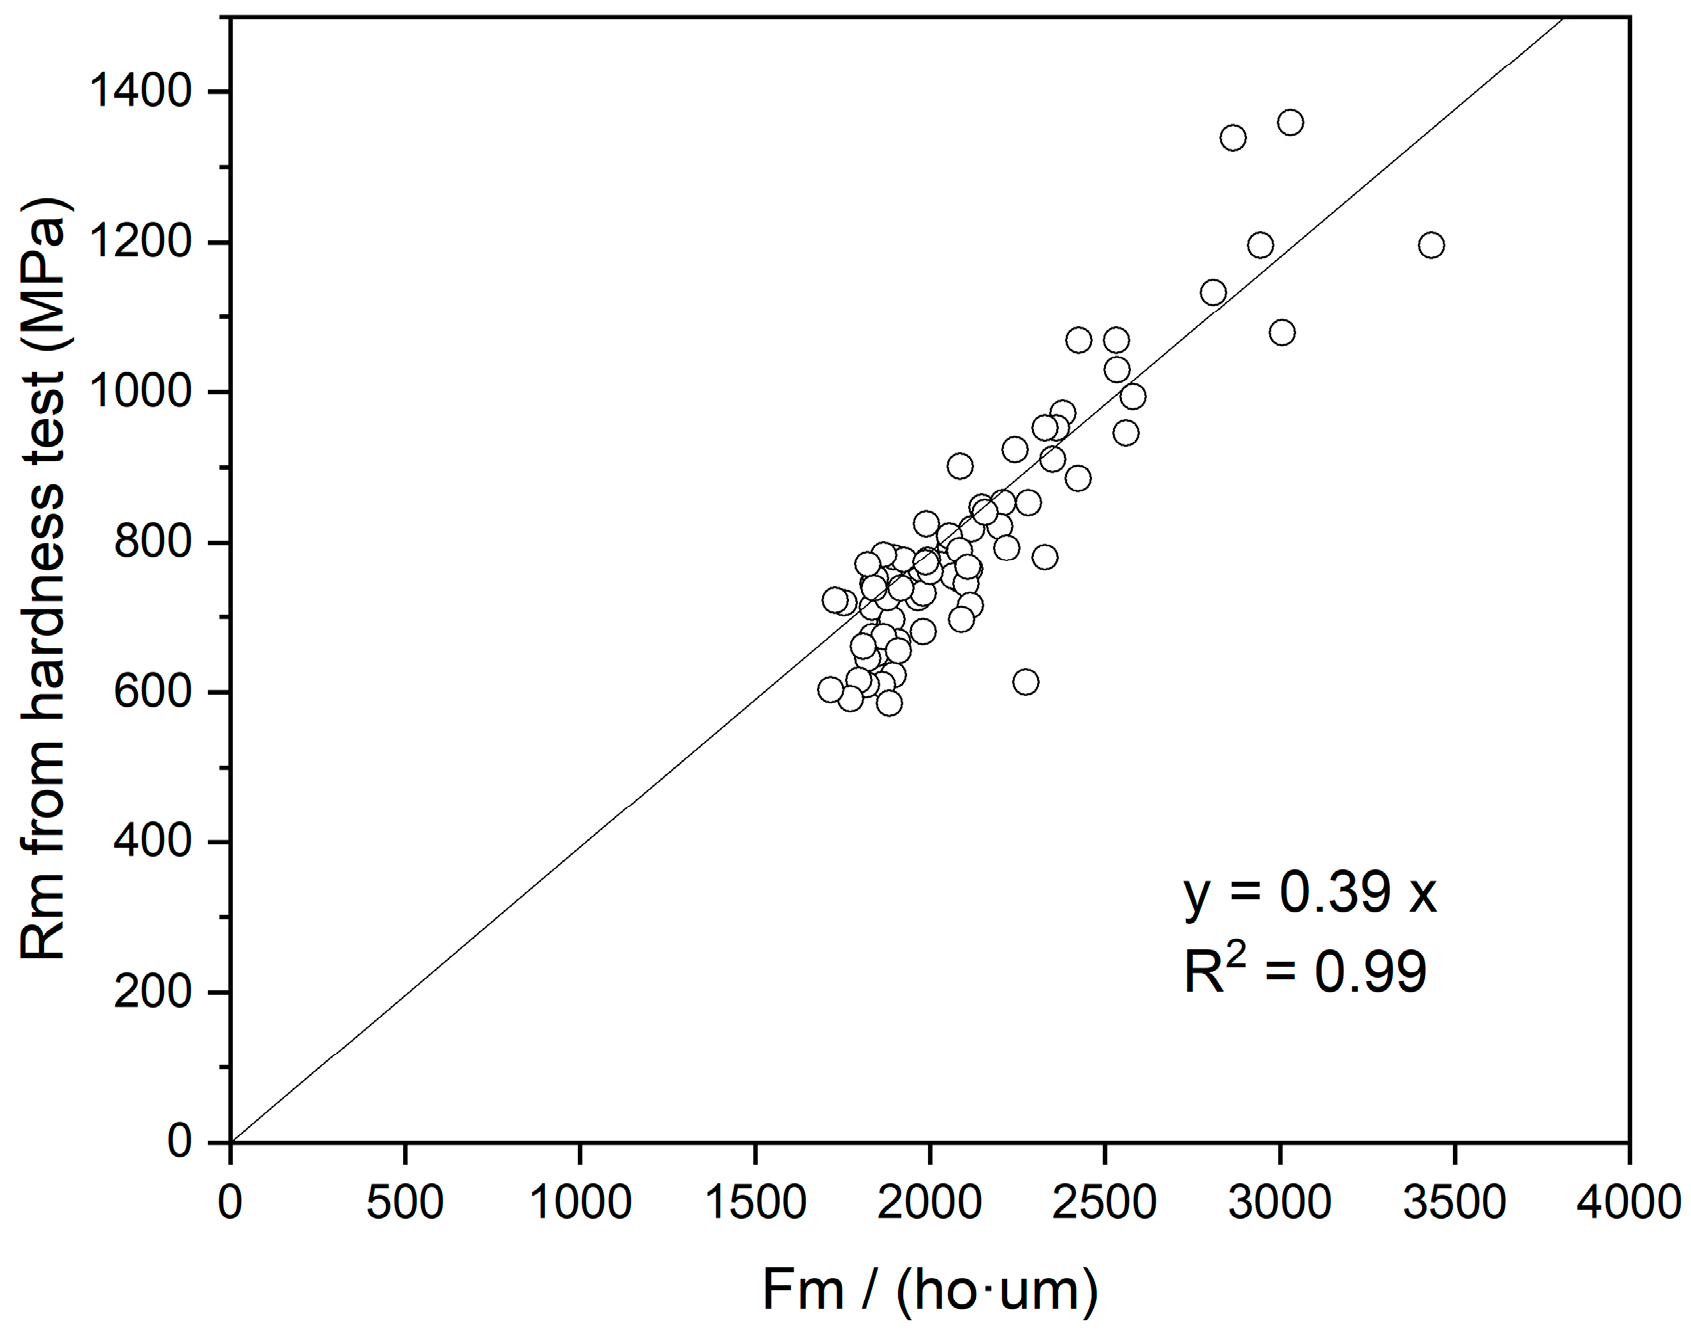
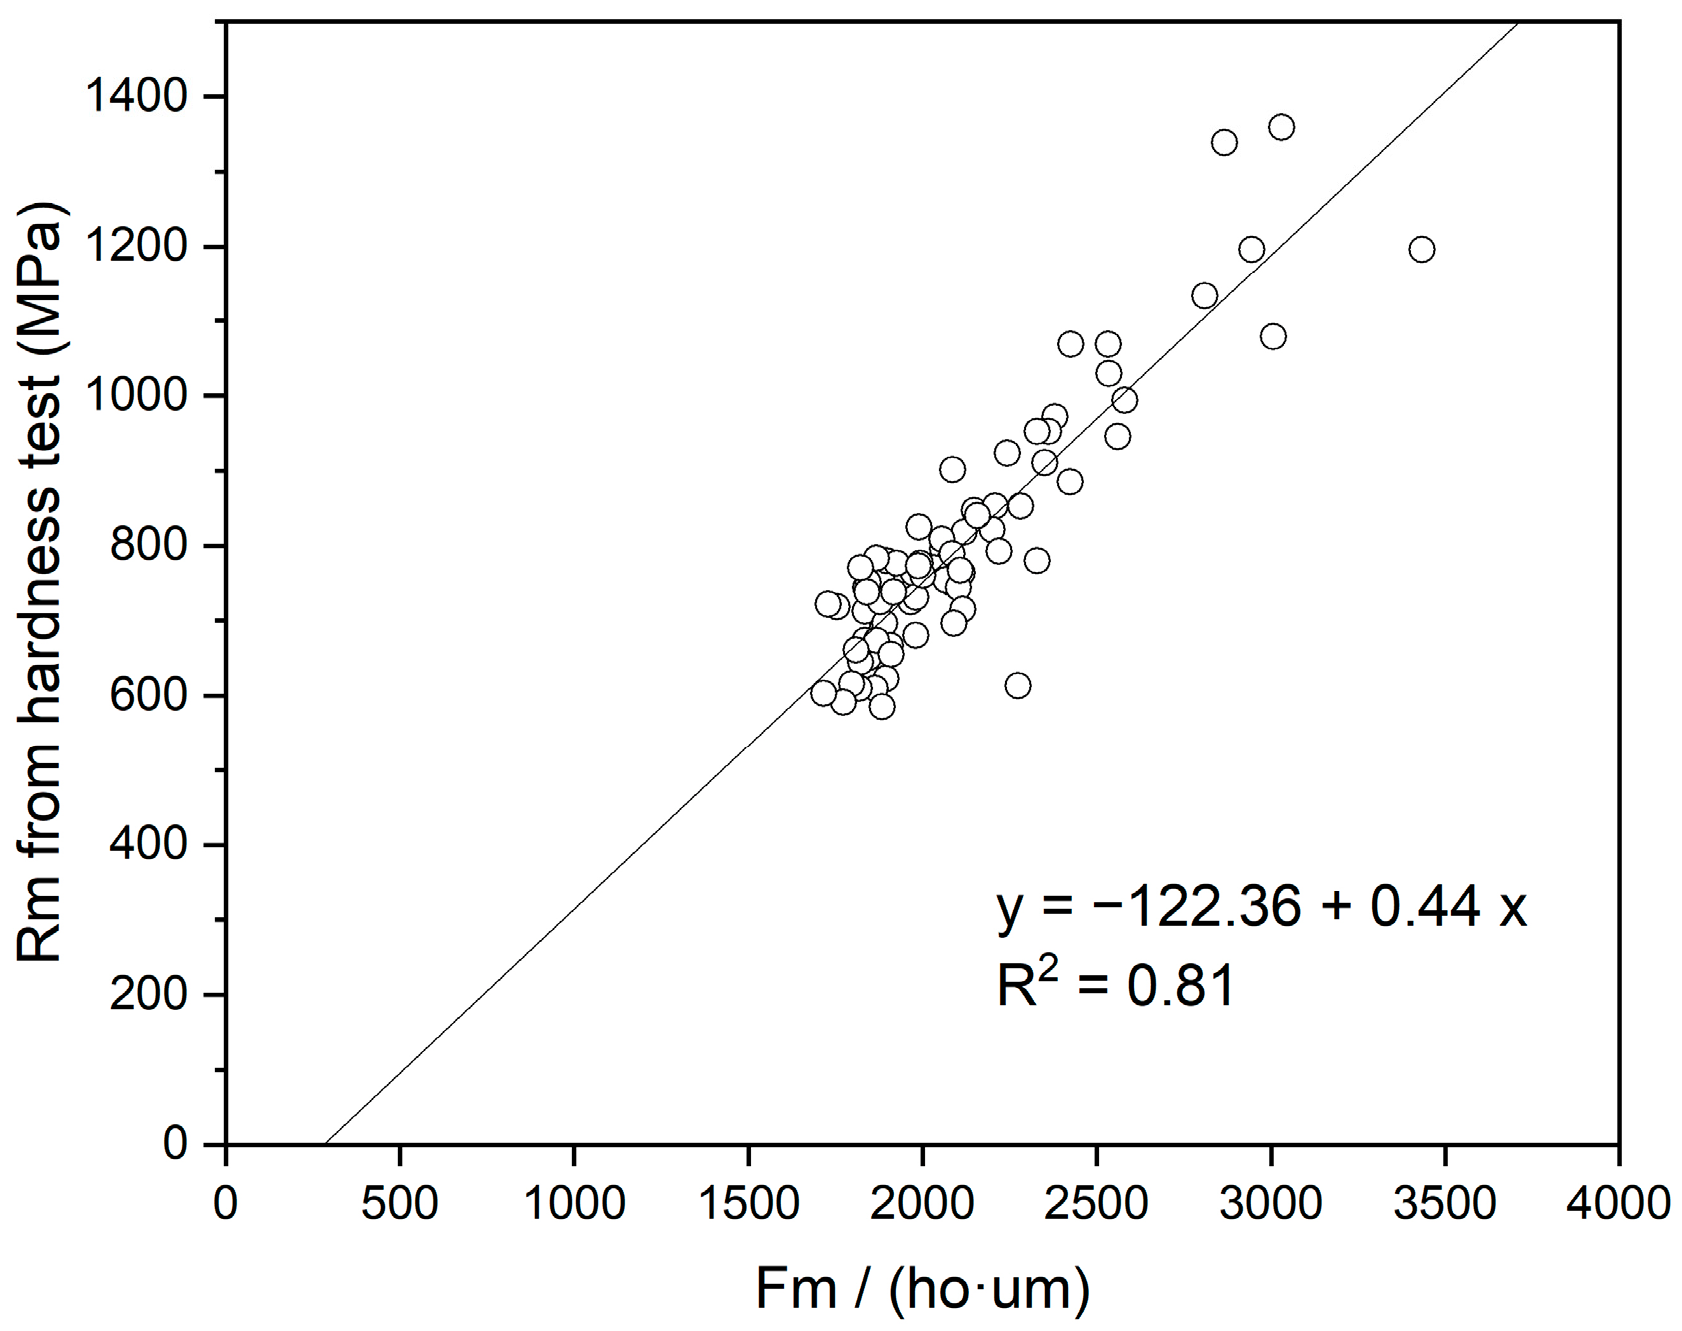
  • A very good correlation was obtained for the tensile strength in the SPT versus tensile data obtained from the conversion of the HV test (R2 = 0.99).
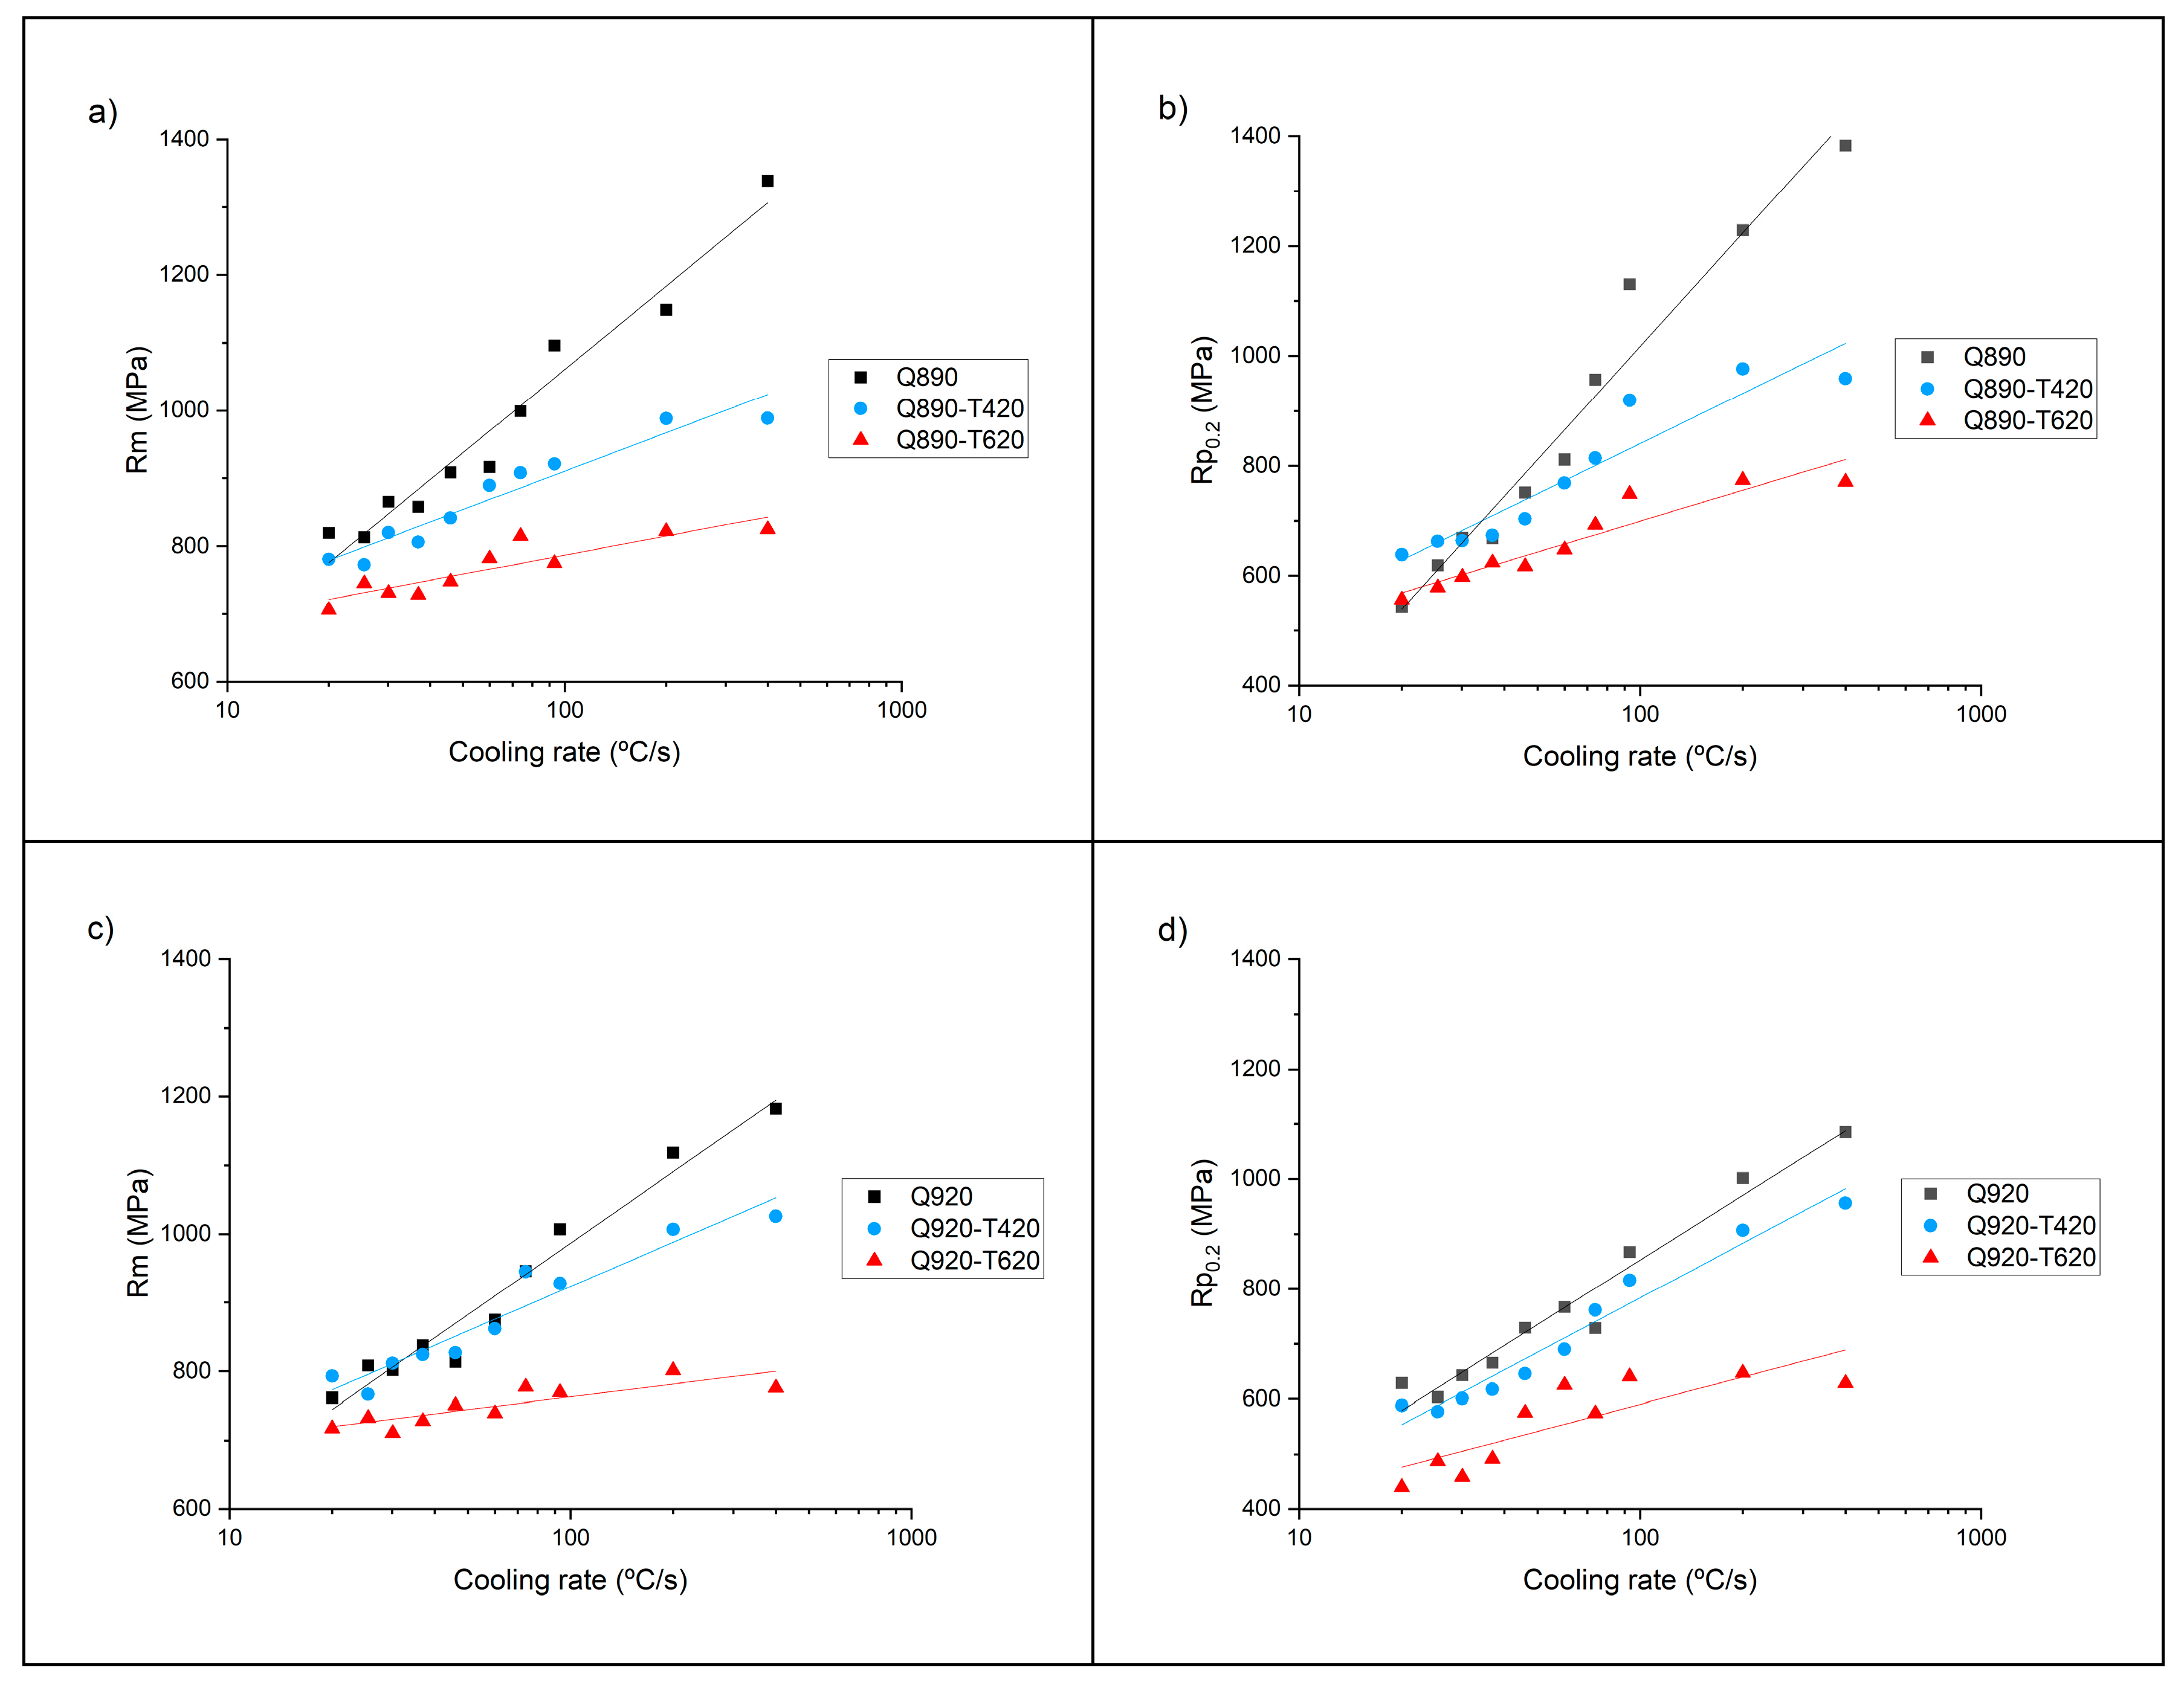
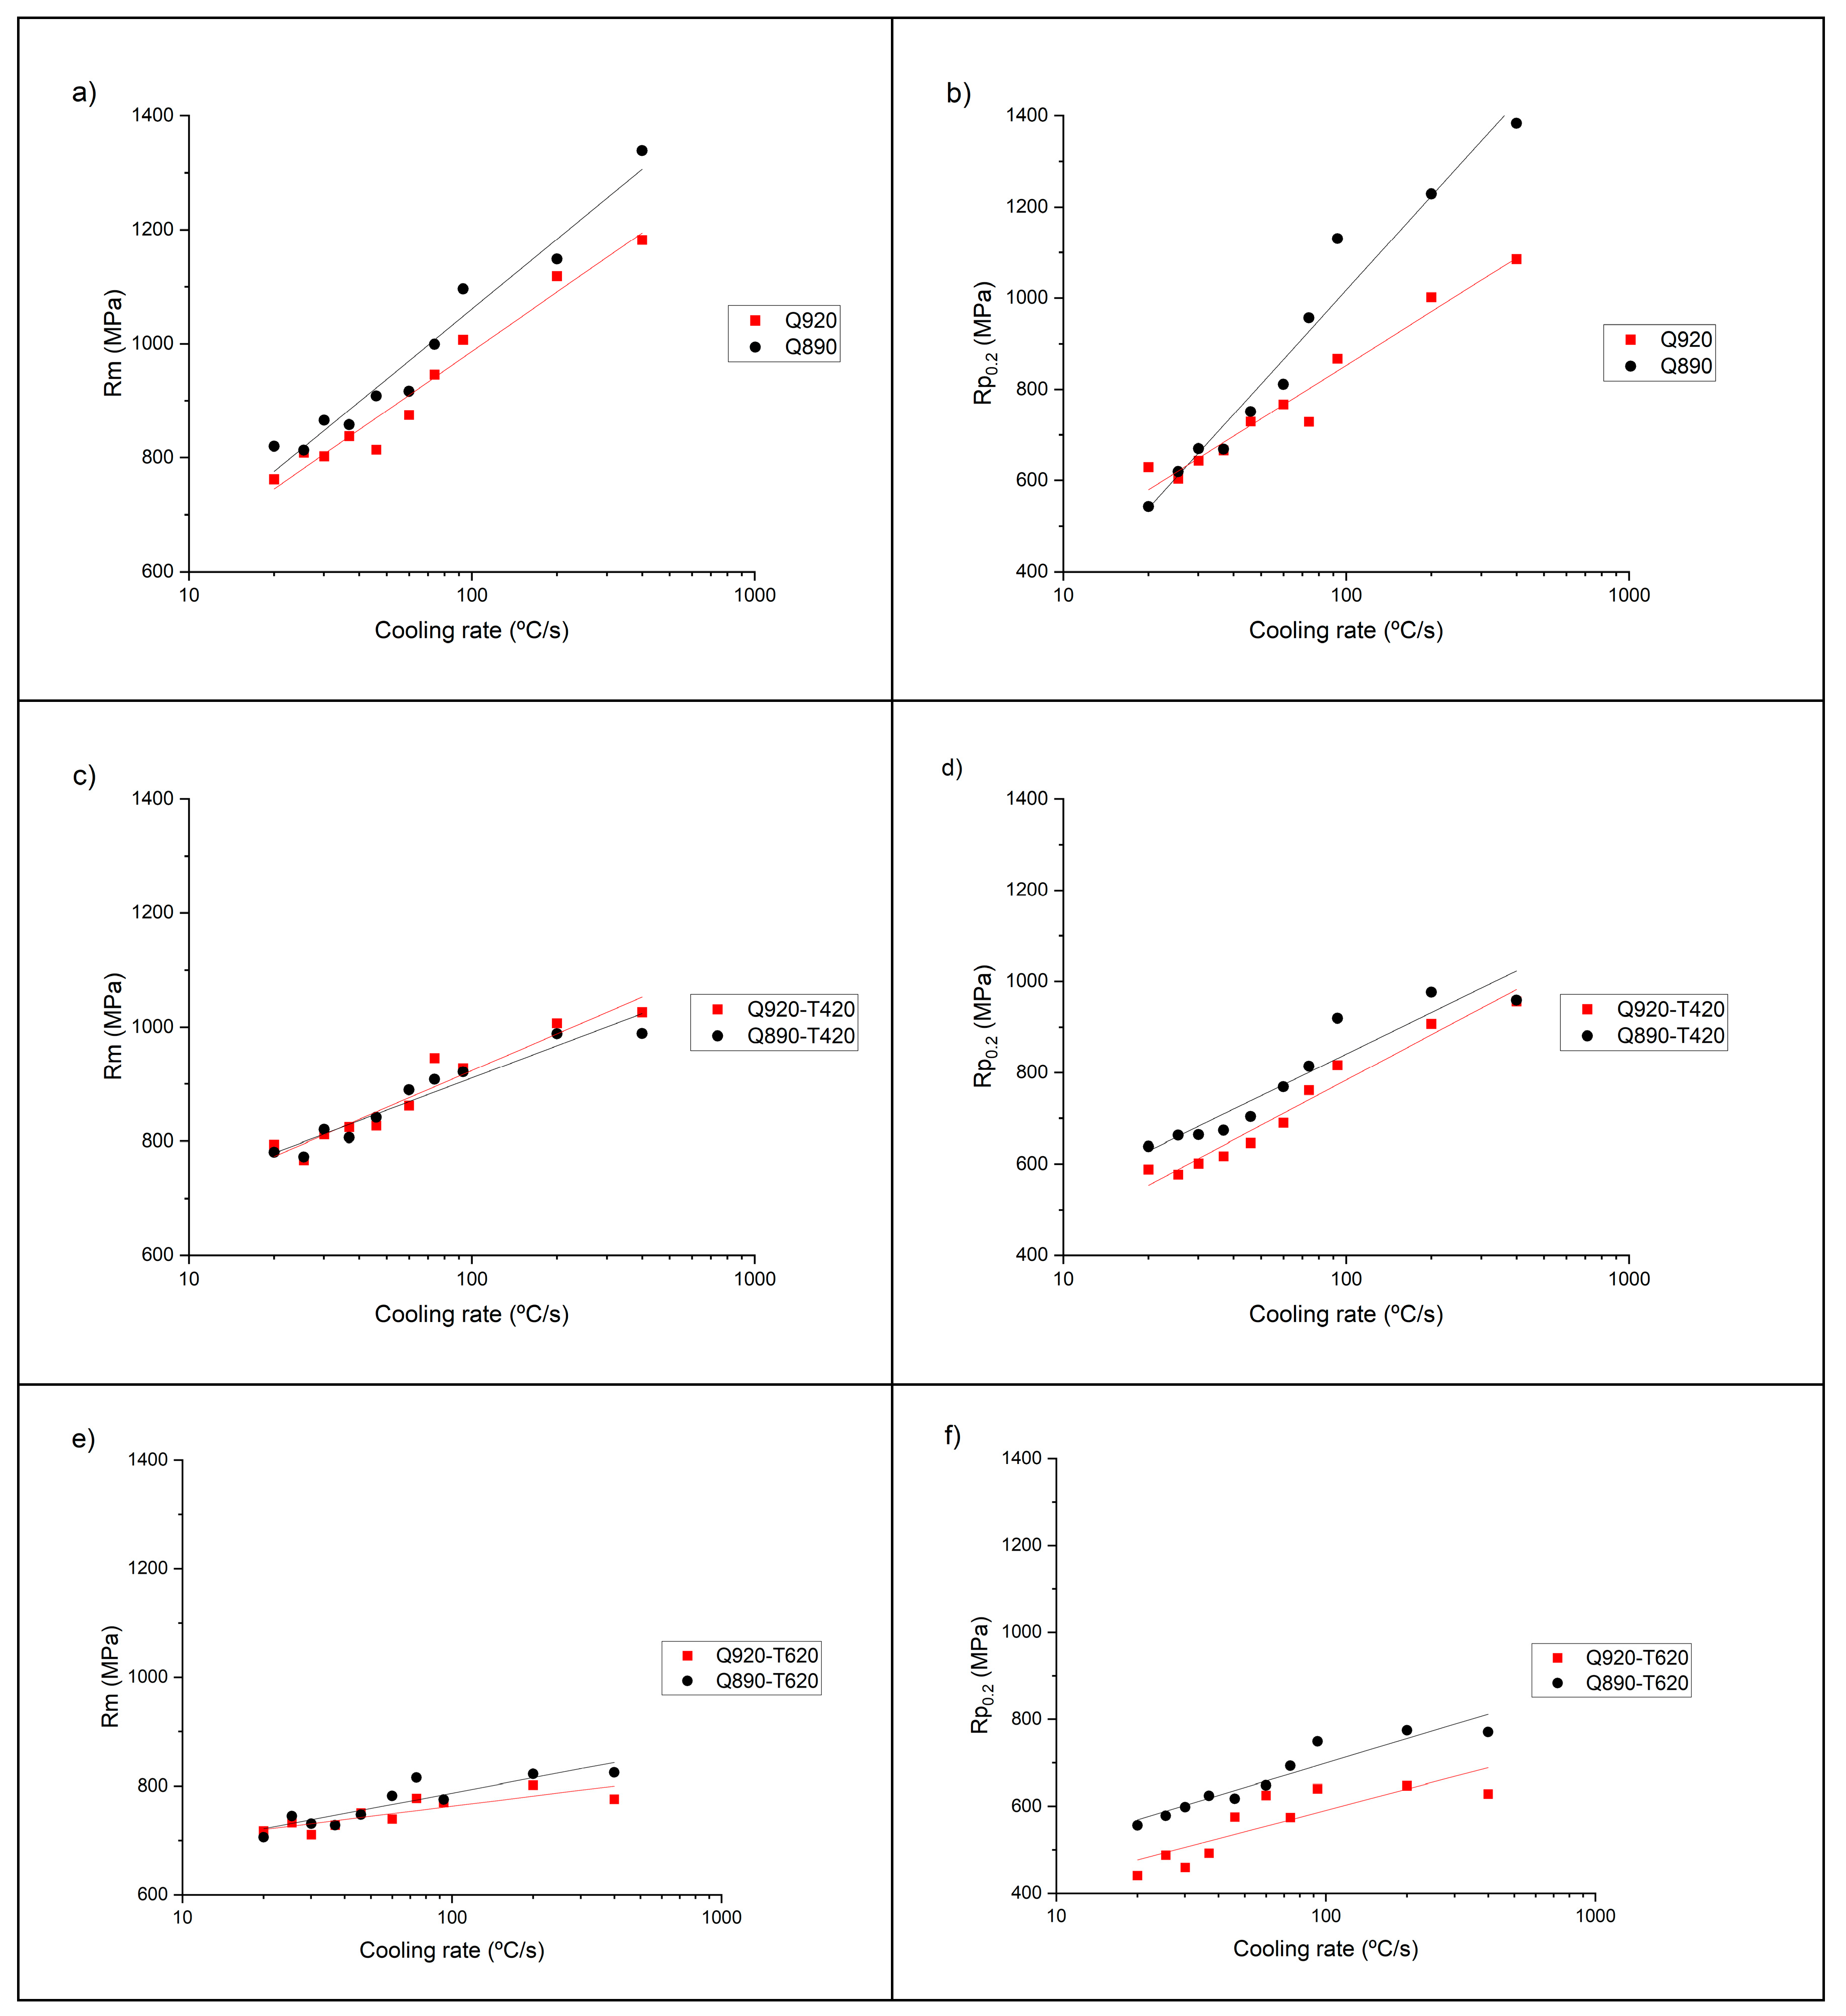
  • Estimation of mechanical properties with the SPT technique allows one to distinguish between changes in different steel heat treatment conditions.
  • This methodology allows one to obtain a lot of information about the material with very little quantity of material being used in the test.
  • Optimization of heat treatment processes can be carried out with the results obtained from this methodology.
  • This methodology achieves a 94% reduction in the volume of material used compared to traditional methods, such as tensile test.
  • The number of HTs employed is also reduced and simplified compared to the tensile test at a ratio of over 10 to 1.

Author Contributions

Conceptualization, G.A. and C.A.; methodology, I.M. and I.B.; formal analysis, I.M.; investigation, I.M., I.B. and G.A.; resources, C.A. and L.M.M.; data curation, I.M. and I.B.; writing—original draft preparation, I.M. and G.A.; writing—review and editing, I.M., I.B., G.A., L.M.M. and C.A.; supervision, G.A. and C.A.; project administration, I.B.; funding acquisition, I.M. and C.A. All authors have read and agreed to the published version of the manuscript.

Funding

This work was partially funded by the Basque Government under grant number 004-B2/2021, corresponding to the BIKAINTEK Program for PhD students. This work was also partially funded by the Department of Research and Universities of the Basque Government under grant number IT1542-22.

Data Availability Statement

The data presented in this study are available on request from the corresponding author.

Acknowledgments

We would like to highlight the invaluable contribution of Marcelo López-Belver from Tubos Reunidos Group, who has invested his time and expertise to enhance the quality of the article.

Conflicts of Interest

The authors declare no conflict of interest.

References

  1. Miracle, D.B.; Li, M.; Zhang, Z.; Mishra, R.; Flores, K.M. Emerging capabilities for the high-throughput characterization of structural materials. Annu. Rev. Mater. Res. 2021, 51, 131–164. [Google Scholar] [CrossRef]
  2. Wang, X.; Zhu, T.; Zhang, J.; Ding, H.; Xiao, S.; Lu, L.; Yang, B.; Yang, G.; Liu, Y. A review of selected small specimen test techniques for identifying deformation and failure properties of metallic materials. J. Mater. Sci. 2023, 58, 63–100. [Google Scholar] [CrossRef]
  3. Zhang, J.; Guo, Z.; Liu, K. Mechanical properties study of miniature steel specimens based on the small punch test and simulation methods. Materials 2022, 15, 6542. [Google Scholar] [CrossRef] [PubMed]
  4. Arunkumar, S. Overview of small punch test. Met. Mater. Int. 2020, 26, 719–738. [Google Scholar] [CrossRef]
  5. Torres, J.; Gordon, A.P. Mechanics of the small punch test: A review and qualification of additive manufacturing materials. J. Mater. Sci. 2021, 56, 10707–10744. [Google Scholar] [CrossRef]
  6. Shindo, Y.; Yamaguchi, Y.; Horiguchi, K. Small punch testing for determining the cryogenic fracture properties of 304 and 316 austenitic stainless steel in a high magnetic field. Cryogenics 2004, 44, 789–792. [Google Scholar] [CrossRef]
  7. Bruchhausen, M.; Lapetite, J.M.; Ripplinger, S.; Austin, T. Small punch tensile/fracture test data and 3D specimen surface data on Grade 91 ferritic/martensitic steel from cryogenic to room temperature. Data Brief 2016, 9, 245–251. [Google Scholar] [CrossRef]
  8. Saucedo-Muñoz, M.L.; Liu, S.C.; Komazaki, S.I.; Kwon, I.H.; Hashida, T.; Takahashi, H.; Nakajima, H. Evaluation of thermal aging embrittlement of austenitic stainless steels JN1, JJ1 and JK2 by cryogenic small-punch testing. J. Mater. Res. 2002, 17, 852–860. [Google Scholar] [CrossRef]
  9. Rezaei, A.; Rezaeian, A.; Kermanpur, A.; Badrossamay, M.; Foroozmehr, E.; Marashi, M.; Foroozmehr, A.; Han, J. Microstructural and mechanical anisotropy of selective laser melted IN718 superalloy at room and high temperatures using small punch test. Mater. Charact. 2020, 162, 110200. [Google Scholar] [CrossRef]
  10. Chen, H.; Yang, R.; Al-Abedy, H.K.; Li, H.; Sun, W.; Jones, I.A. Characterization of deformation process and fracture mechanisms of P91 steel at 600 °C in small punch tensile testing. Mater. Charact. 2020, 168, 110514. [Google Scholar] [CrossRef]
  11. Jeffs, S.; Douglas, R.; Beard, W.; Coleman, M.; Adams, J.; Jones, T.; Poole, D.; Lancaster, R. Characterizing the high temperature tensile behaviour of laser powder bed fused duplex stainless steel 2205 using the small punch test. Mater. Charact. 2022, 189, 111953. [Google Scholar] [CrossRef]
  12. Arunkumar, S. Small punch creep test: An overview. Met. Mater. Int. 2021, 27, 1897–1914. [Google Scholar] [CrossRef]
  13. Shin, H.S.; Yeo, J.; Baek, U.B. Influence of specimen surface roughness on hydrogen embrittlement induced in austenitic stainless steels during in-situ small punch testing in high-pressure hydrogen environments. Metals 2021, 11, 1579. [Google Scholar] [CrossRef]
  14. Song, S.H.; Faulkner, R.G.; Flewitt, P.E.J.; Marmy, P.; Weng, L.Q. Small punch test evaluation of neutron-irradiation-induced embrittlement of a Cr-Mo low-alloy steel. Mater. Charact. 2004, 53, 35–41. [Google Scholar] [CrossRef]
  15. Álvarez, G.; Zafra, A.; Belzunce, F.J.; Rodríguez, C. Hydrogen embrittlement testing procedure for the analysis of structural steels with small punch tests using notched specimens. Eng. Frac. Mech. 2021, 253, 107906. [Google Scholar] [CrossRef]
  16. Li, Z.; Hu, Y.; Chen, T.; Wang, X.; Liu, P.; Lu, Y. Microstructural evolution and mechanical behavior of thermally aged cast duplex stainless steel. Materials 2020, 13, 5636. [Google Scholar] [CrossRef]
  17. Pan, Y.; Han, H.G.; Bao, J.Y.; Wang, X.Y.; Hong, C.; Liu, T.G.; Lu, H.Y.; Shoji, T. Effects of long-term aging on elevated temperature deformation behaviors of wrought 316LN stainless steel by small punch test. Mater. Charact. 2021, 182, 111580. [Google Scholar] [CrossRef]
  18. Yang, C.; Wei, T.; Muránsky, O.; Carr, D.; Huang, H.; Zhou, X. The effect of ball-milling time and annealing temperature on fracture toughness of Ni-3 wt.%. SiC using small punch testing. Mater. Charact. 2018, 138, 289–295. [Google Scholar] [CrossRef]
  19. Lucon, E.; Benzing, J.T.; Derimov, N.; Hrabe, N. Small punch testing to estimate the tensile and fracture properties of additively manufactured Ti-6Al-4V. J. Mater. Eng. Perform. 2021, 30, 5039–5049. [Google Scholar] [CrossRef]
  20. Andrés, D.; García, T.; Cicero, S.; Lacalle, R.; Álvarez, J.A.; Martín-Meizoso, A.; Aldazabal, J.; Bannister, A.; Klimpel, A. Characterization of heat affected zones produces by thermal cutting processes by means of small punch tests. Mater. Charact. 2016, 119, 55–64. [Google Scholar] [CrossRef]
  21. Dobrzánski, L.A.; Sitek, W. Designing of the chemical composition of constructional alloy steels. J. Mat. Proc. Tec. 1999, 89–90, 467–472. [Google Scholar] [CrossRef]
  22. Nunura, C.R.N.; Dos Santos, C.A.; Spim, J.A. Numerical—Experimental correlation of microstructures, cooling rates and mechanical properties of AISI 1045 steel during the Jominy end-quench test. Mater. Des. 2015, 76, 230–243. [Google Scholar] [CrossRef]
  23. Ben Ammar, Y.; Aoufi, A.; Darrieulat, M. Influence of the cooling rate on the texture and the microstructure of Zircaloy-4 studied by means of a Jominy end-quench test. Mat. Sci. Eng. A 2012, 556, 184–193. [Google Scholar] [CrossRef]
  24. Li, P.; Xiong, B.; Zhang, Y.; Li, Z.; Zhu, B.; Wang, F.; Liu, H. Quench sensitivity and microstructure character of high strength AA7050. Trans. Nonferrous Met. Soc. China 2012, 22, 268–274. [Google Scholar] [CrossRef]
  25. Geng, X.; Peng, J.; Jiang, L.; Liu, X.; Tu, Y.; Xue, Z. Experimental study of mechanical properties and fracture modes in different regions of the nickel-based welding joint based on small punch test. World Weld. 2023, 67, 637–650. [Google Scholar] [CrossRef]
  26. Kulkarni, R.V.; Mani Krishna, K.V.; Neogy, S.; Srivastava, D.; Ramadasan, E.; Shriwastaw, R.S.; Rath, B.N.; Saibaba, N.; Jha, S.K.; Dey, G.K. Mechanical properties of Zr-2.5%Nb pressure tube material subjected to heat treatments in α+β phase field. J. Nucl. Mater. 2014, 451, 300–312. [Google Scholar] [CrossRef]
  27. Lucon, E.; Benzing, J.; Hrabe, N. Development and validation of small punch testing at NIST, National Institute of Standards and Technology NISTIR 8303. Natl. Inst. Stand. Technol. Interag. Intern. 2020, 8303, 55. [Google Scholar] [CrossRef]
  28. Calaf Chica, J.; Bravo Díez, P.M.; Preciado Calzada, M. A new prediction method for the ultimate tensile strength of steel alloys with small punch test. Materials 2018, 11, 1491. [Google Scholar] [CrossRef]
Figure 1. Hardness test for the Jominy samples at different distances from the quenched face.
Metals 13 01797 g001
Figure 2. Sketch of the SPT samples extracted from the Jominy samples.
Metals 13 01797 g002
Figure 3. Correlation between distance to the quenched end and the cooling rate adapted from UNE EN ISO 642.
Metals 13 01797 g003
Figure 4. Relationship between Rm and Fm/h0 ·um, which passes through the origin.
Metals 13 01797 g004
Figure 5. Relationship between Rm and Fm/h0 ·um where the y-intercept is allowed to vary during the fit.
Metals 13 01797 g005
Figure 6. SPT estimated strength vs. the cooling rate grouped by the austenitizing temperature. (a) Rm for quenching at 890 °C and all tempering conditions. (b) RP0.2 for quenching at 890 °C and all tempering conditions. (c) Rm for quenching at 920 °C and all tempering conditions. (d) RP0.2 for quenching at 920 °C and all tempering conditions.
Metals 13 01797 g006
Figure 7. Quenching temperature comparison. (a) Rm for Q920 vs. Q890. (b) RP0.2 for Q920 vs. Q890. (c) Rm for Q920—T420 vs. Q890—T420. (d) RP0.2 for Q920—T420 vs. Q890—T420. (e) Rm for Q920—T620 vs. Q890—T620. (f) RP0.2 for Q920—T620 vs. Q890—T620.
Metals 13 01797 g007
Figure 8. Microstructures of SPT samples quenched at 920 °C. (a) Q920—370 °C/s. (b) Q920—T420—370 °C/s. (c) Q920—T620—370 °C/s. (d) Q920—37 °C/s. (e) Q920—T420—37 °C/s. (f) Q920—T620—37 °C/s.
Metals 13 01797 g008
Figure 9. Microstructures of SPT samples quenched at 890 °C. (a) Q890—370 °C/s. (b) Q890—T420—370 °C/s. (c) Q890—T620—370 °C/s. (d) Q890—37 °C/s. (e) Q890—T420—37 °C/s. (f) Q890—T620—37 °C/s.
Metals 13 01797 g009
Table 1. Chemical composition of the steel sample employed for the experimental tests.
API 5L X65QCMnSiPSCrNiMoFe
Standard specification<0.18<1.70<0.45<0.025<0.015<0.50<0.50<0.50Bal.
Sample0.171.220.170.0140.0010.070.090.02Bal.
Uncertainty (K = 2)±0.01±0.02±0.01±0.001±0.001±0.01±0.01±0.01-
Table 2. Heat treatments applied to each cylinder.
Heat Treatment CodeDescription
Q890Jominy quenching from 890 °C
Q890-T420Jominy quenching from 890 °C + tempering at 420 °C for 5 h
Q890-T620Jominy quenching from 890 °C + tempering at 620 °C for 5 h
Q920Jominy quenching from 920 °C
Q920-T420Jominy quenching from 920 °C + tempering at 420 °C for 5 h
Q920-T620Jominy quenching from 920 °C + tempering at 620 °C for 5 h
Table 3. Corresponding cooling rates for each distance to the quenched face.
Distance to Quenched Face (mm)1.12.02.93.84.75.66.57.48.39.2
Cooling Rate (°C/s)3701959374604637302620
Table 4. Obtained results from the ASTM E140 conversion table to convert HV to Rm.
Cooling Rate (°C/s)Q920Q920-T620Q920-T420Q890Q890-T620Q890-T420
HVRm
(MPa)
HVRm
(MPa)
HVRm
(MPa)
HVRm
(MPa)
HVRm
(MPa)
HVRm
(MPa)
3704211359257824336107837211962237163211030
195415133925280831099437211962397673331069
9336511732387643039723531133241773297952
743331069242776276885295946217696297952
60288923243780266853284910237760266853
46281901242776255818243780230738262840
37264847244783238764256821210674235754
30248796235770234751247792212680232744
26242776226725226725246789204655228732
20237760230738235770238764206661237760
Table 5. Rm estimation.
Rm (MPa)
Cooling Rate (°C/s)Q920Q920-T420Q920-T620Q890Q890-T420Q890-T620
370118210267761339989825
195111810078021149988822
9310079287701096921775
74946945777999908815
60875862740917890782
46814827751909842748
37838824728858806728
30802812711865820731
26808767733813773745
20762793718820781706
Table 6. RP0.2 estimation.
Rp0.2 (MPa)
Cooling Rate (°C/s)Q920Q920-T420Q920-T620Q890Q890-T420Q890-T620
37010859566281383959771
19510029076471229976774
938678166401130919749
74728761574957814693
60767690625811769648
46729646576751704617
37666617492669674624
30643601459670664598
26604577488619663579
20629588441543639557
Disclaimer/Publisher’s Note: The statements, opinions and data contained in all publications are solely those of the individual author(s) and contributor(s) and not of MDPI and/or the editor(s). MDPI and/or the editor(s) disclaim responsibility for any injury to people or property resulting from any ideas, methods, instructions or products referred to in the content.

